68
| Date post: | 12-Aug-2015 |
| Category: |
Healthcare |
| Upload: | mario-sanchez |
| View: | 48 times |
| Download: | 2 times |


Adjunctive Supportive Care
ProactivePrimaryTherapy
Early and Adequate Nutrition is therapy that modulates the underlying disease process and impacts patient outcomes

Increasing Calorie Debt Associated with worse Outcomes
Caloric debt associated with: Longer ICU stay
Days on mechanical ventilation Complications
Mortality
Adequacy of EN
Rubinson CCM 2004; Villet Clin Nutr 2005; Dvir Clin Nutr 2006; Petros Clin Nutr 2006
0200
400600
8001000
12001400
16001800
2000
1 3 5 7 9 11 13 15 17 19 21
Days
kcal
Prescribed Engergy
Energy Received From Enteral Feed
Caloric Debt

Early vs. Delayed EN: Effect on Infectious
Complications
Updated 2009www.criticalcarenutrition.com

Early vs. Delayed EN: Effect on Mortality
Updated 2009www.criticalcarenutrition.com

Feeding the Hypotensive Patient?
DiGiovine et al. AJCC 2010
The beneficial effect of early feeding is more evident in the sickest patients, i.e, those on
multiple vasopressor agents.
Prospectively collected multi-institutional ICU database of 1,174 patients who required mechanical ventilation for more than two days and were on
vasopressor agents to support blood pressure.
Optimal Amount of Protein and Calories for Critically Ill
Patients?
Early EN (within 24-48 hrs of admission) is recommended!

• Point prevalence survey of nutrition practices in ICU’s around the world conducted Jan. 27, 2007
• Enrolled 2772 patients from 158 ICU’s over 5 continents
• Included ventilated adult patients who remained in ICU >72 hours

Hypothesis
• There is a relationship between amount of energy and protein received and clinical outcomes (mortality and # of days on ventilator)
• The relationship is influenced by nutritional risk
• BMI is used to define chronic nutritional risk

What Study Patients Actually Rec’d
• Average Calories in all groups: – 1034 kcals and 47 gm of protein
Result:
• Average caloric deficit in Lean Pts:– 7500kcal/10days
• Average caloric deficit in Severely Obese:– 12000kcal/10days

Relationship Between Increased Calories and 60 day Mortality
BMI Group Odds Ratio
95% Confidence
Limits
P-value
Overall 0.76 0.61 0.95 0.014
<20 0.52 0.29 0.95 0.033
20-<25 0.62 0.44 0.88 0.007
25-<30 1.05 0.75 1.49 0.768
30-<35 1.04 0.64 1.68 0.889
35-<40 0.36 0.16 0.80 0.012
>=40 0.63 0.32 1.24 0.180
Legend: Odds of 60-day Mortality per 1000 kcals received per day adjusting for nutrition days, BMI, age, admission category, admission diagnosis and APACHE II score.


BMI Group
Adjusted
Estimate
95% CI P-value
LCL UCL
Overall 3.5 1.2 5.9 0.003
<20 2.8 -2.9 8.5 0.337
20-<25 4.7 1.5 7.8 0.004
25-<30 0.1 -3.0 3.2 0.958
30-<35 -1.5 -5.8 2.9 0.508
35-<40 8.7 2.0 15.3 0.011
>=40 6.4 -0.1 12.8 0.053
Relationship Between Increased Energy and Ventilator-Free days
Legend: # of VFD per 1000 kcals received per day adjusting for nutrition days, BMI, age, admission category, admission diagnosis and APACHE II score.

Faisy BJN 2009;101:1079
Mechancially Vent’d patients >7days (average ICU LOS 28 days)
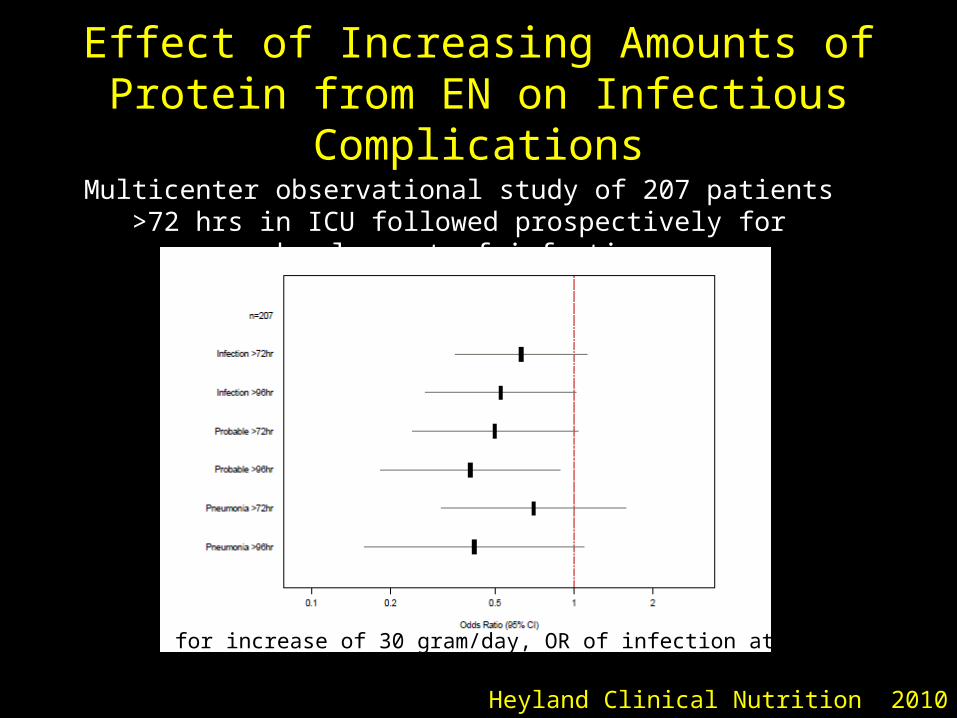
Effect of Increasing Amounts of Protein from EN on Infectious Complications
Multicenter observational study of 207 patients >72 hrs in ICU followed prospectively for development of infection
for increase of 30 gram/day, OR of infection at 28 days
Heyland Clinical Nutrition 2010

Multicenter RCT of glutamine and antioxidants (REDOXS Study)First 364 patients with SF 36 at 3 months and/or 6 months
for increase of 30 gram/day, OR of infection at 28 days
Heyland Unpublished Data
Model *
Estimate (CI)P values
(B) Increased protein intake
PHYSICAL FUNCTIONING (PF) at 3 months 2.9 (-0.7, 6.6) P=0.11
ROLE PHYSICAL (RP) at 3 months 4.4 (0.7, 8.1) P=0.02
STANDARDIZED PHYSICAL COMPONENT SCALE (PCS) at 3 months
1.9 (0.5, 3.2) P=0.007
PHYSICAL FUNCTIONING (PF) at 6 months 0.2 (-3.9, 4.3) P=0.92
ROLE PHYSICAL (RP) at 6 months 1.7 (-2.5, 5.9) P=0.43
STANDARDIZED PHYSICAL COMPONENT SCALE (PCS) at 6 months
0.7 (-0.9, 2.2) P=0.39
Relationship between increased nutrition intake and physical function (as defined by SF-36 scores)
following critical illness

More (and Earlier) is Better!
If you feed them (better!)They will leave (sooner!)
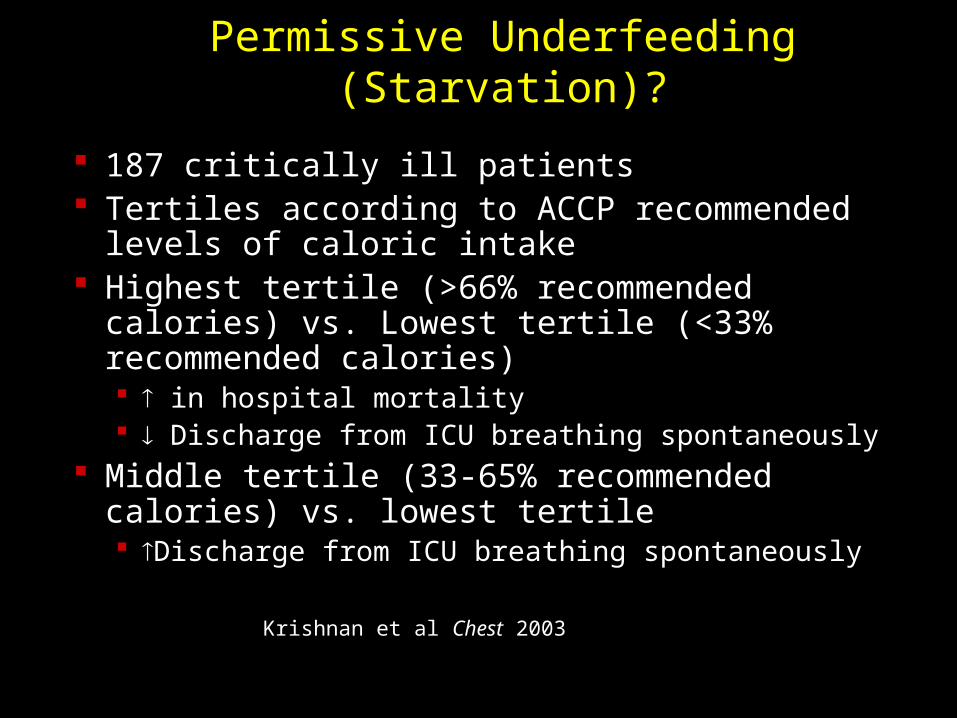
Permissive Underfeeding(Starvation)?
187 critically ill patients Tertiles according to ACCP recommended levels of
caloric intake Highest tertile (>66% recommended calories) vs.
Lowest tertile (<33% recommended calories) in hospital mortality Discharge from ICU breathing spontaneously
Middle tertile (33-65% recommended calories) vs. lowest tertile Discharge from ICU breathing spontaneously
Krishnan et al Chest 2003

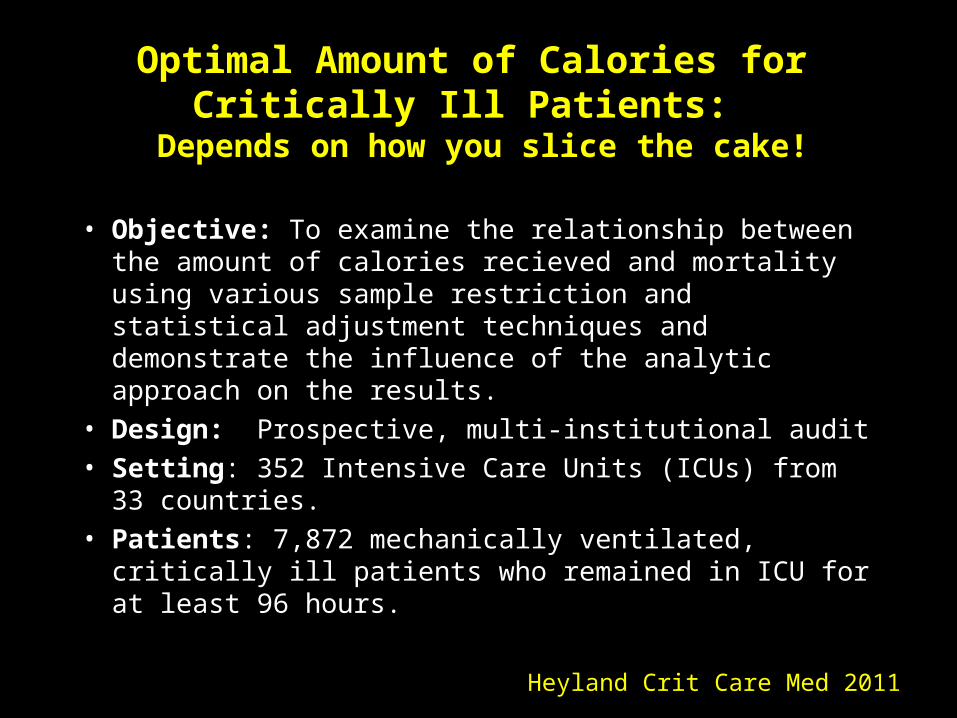
Optimal Amount of Calories for Critically Ill Patients:
Depends on how you slice the cake!
• Objective: To examine the relationship between the amount of calories recieved and mortality using various sample restriction and statistical adjustment techniques and demonstrate the influence of the analytic approach on the results.
• Design: Prospective, multi-institutional audit
• Setting: 352 Intensive Care Units (ICUs) from 33 countries.
• Patients: 7,872 mechanically ventilated, critically ill patients who remained in ICU for at least 96 hours.
Heyland Crit Care Med 2011

Optimal Amount of Calories for Critically Ill Patients:
Depends on how you slice the cake!
• Sample restriction approaches have included limiting analyzed patients to those:
1. In the ICU for at least 96 hours,
2. In the ICU at least 96 hours prior to progression to exclusive oral feeding and
3. Eliminating days after progression to exclusive oral feeding from the calculation of nutrition intake.
• Statistical adjustment approaches have included using regression techniques to adjust for:
1. ICU length of stay (LOS),
2. Evaluable nutrition days and
3. Relevant baseline patient characteristics or some combination thereof.
Heyland Crit Care Med 2011

Association between 12 day average caloric adequacy and
60 day hospital mortality(Comparing patients rec’d >2/3 to those who rec’d
<1/3)A. In ICU for at least 96 hours. Days after permanent progression to exclusive oral feeding are included as zero calories*
B. In ICU for at least 96 hours. Days after permanent progression to exclusive oral feeding are excluded from average adequacy calculation.*
C. In ICU for at least 4 days before permanent progression to exclusive oral feeding. Days after permanent progression to exclusive oral feeding are excluded from average adequacy calculation.*
D. In ICU at least 12 days prior to permanent progression to exclusive oral feeding*
*Adjusted for evaluable days and covariates,covariates include region (Canada, Australia and New Zealand, USA, Europe and South Africa, Latin America, Asia), admission category (medical, surgical), APACHE II score, age, gender and BMI.
0.4 0.6 0.8 1.0 1.2 1.4 1.6
UnadjustedAdjusted
Odds ratios with 95% confidence intervals

Association Between 12-day Caloric Adequacy and 60-Day Hospital
Mortality
Heyland CCM 2011
Optimal amount= 80-85%

Trophic vs. Full enteral feeding in critically ill patients with acute respiratory failure
• Single center study of 200 mechanically ventilated patients
• Trophic feeds: 10 ml/hr x 5 days
Rice CCM 2011;39:967

Trophic vs. Full enteral feeding in critically ill patients with acute respiratory failure
Rice CCM 2011;39:967
Did not measure infection nor physical function!

Trophic vs. Full enteral feeding in critically ill patients with acute respiratory failure
“survivors who received initial full-energy enteral nutrition were more likely to be discharged home with or without help as compared to a rehabilitation facility (68.3% for the full-energy group vs. 51.3% for the trophic group; p = .04).”
Rice CCM 2011;39:967

Trophic vs. Full enteral feeding in critically ill patients with acute respiratory failure
• Average age 51
• Few comorbidities
• Average BMI 29
• All fed within 24 hrs (benefits of early EN)
• Average duration of study intervention 5 days
No effect in young, healthy, overweight patients who
have short stays!
Large multicenter trial of this concept (EDEN study) by ARDSNET just finished
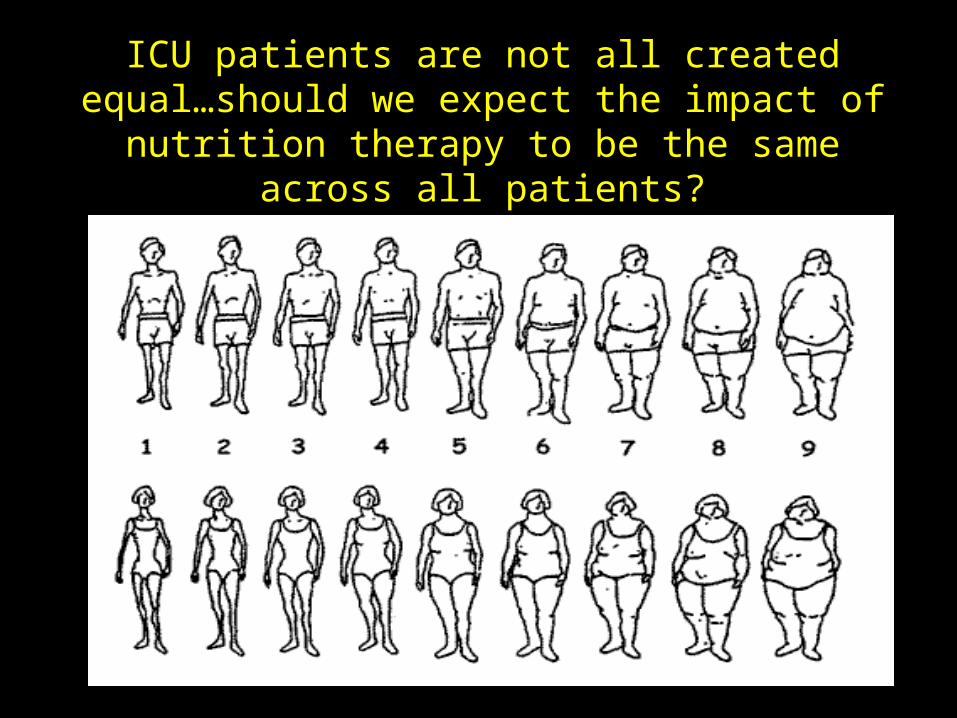
ICU patients are not all created equal…should we expect the impact of nutrition
therapy to be the same across all patients?
How do we figure out who will benefit the most from Nutrition
Therapy?

Nutrition Statusmicronutrient levels - immune markers - muscle mass
Starvation
Acute-Reduced po intake
-pre ICU hospital stay
Chronic-Recent weight loss
-BMI?
InflammationAcute
-IL-6-CRP-PCT
Chronic-Comorbid illness
A Conceptual Model for Nutrition Risk Assessment in the Critically Ill
The Development of the NUTrition Risk in the Critically ill Score (NUTRIC
Score).
• When adjusting for age, APACHE II, and SOFA, what effect of nutritional risk factors on clinical outcomes?
• Multi institutional data base of 598 patients
• Historical po intake and weight loss only available in 171 patients
• Outcome: 28 day vent-free days and mortality
Heyland Critical Care 2011, 15:R28

What are the nutritional risk factors associated with clinical outcomes?
(validation of our candidate variables)Non-survivors by day 28
(n=138) Survivors by day 28
(n=460) p values
Age 71.7 [60.8 to 77.2] 61.7 [49.7 to 71.5] <.001
Baseline APACHE II score 26.0 [21.0 to 31.0] 20.0 [15.0 to 25.0] <.001
Baseline SOFA 9.0 [6.0 to 11.0] 6.0 [4.0 to 8.5] <.001
# of days in hospital prior to ICU admission 0.9 [0.1 to 4.5] 0.3 [0.0 to 2.2] <.001
Baseline Body Mass Index 26.0 [22.6 to 29.9] 26.8 [23.4 to 31.5] 0.13
Body Mass Index 0.66
<20 6 ( 4.3%) 25 ( 5.4%)≥20 122 ( 88.4%) 414 ( 90.0%)
# of co-morbidities at baseline 3.0 [2.0 to 4.0] 3.0 [1.0 to 4.0] <0.001
Co-morbidity <0.001
Patients with 0-1 co-morbidity 20 (14.5%) 140 (30.5%)Patients with 2 or more co-morbidities 118 (85.5%) 319 (69.5%)
C-reactive protein¶ 135.0 [73.0 to 214.0] 108.0 [59.0 to 192.0] 0.07
Procalcitionin¶ 4.1 [1.2 to 21.3] 1.0 [0.3 to 5.1] <.001
Interleukin-6¶ 158.4 [39.2 to 1034.4] 72.0 [30.2 to 189.9] <.001
171 patients had data of recent oral intake and weight loss Non-survivors by day 28
(n=32) Survivors by day 28
(n=139) p values
% Oral intake (food) in the week prior to enrolment 4.0[ 1.0 to 70.0] 50.0[ 1.0 to 100.0] 0.10
% of weight loss in the last 3 month 0.0[ 0.0 to 2.5] 0.0[ 0.0 to 0.0] 0.06

Variable
Spearman correlation with VFD within 28
days
p valuesNumber of
observations
Age -0.1891 <.0001 598
Baseline APACHE II score -0.3914 <.0001 598
Baseline SOFA -0.3857 <.0001 594
% Oral intake (food) in the week prior to enrollment 0.1676 0.0234 183
number of days in hospital prior to ICU admission -0.1387 0.0007 598
% of weight loss in the last 3 month -0.1828 0.0130 184
Baseline BMI 0.0581 0.1671 567
# of co-morbidities at baseline -0.0832 0.0420 598
Baseline CRP -0.1539 0.0002 589
Baseline Procalcitionin -0.3189 <.0001 582
Baseline IL-6 -0.2908 <.0001 581
What are the nutritional risk factors associated with clinical outcomes?
(validation of our candidate variables)

The Development of the NUTrition Risk in the Critically ill Score (NUTRIC
Score).
For example, exact quintiles and logistic parameters for age
Exact Quintile Parameter Points
19.3-48.8 referent 0
48.9-59.7 0.780 1
59.7-67.4 0.949 1
67.5-75.3 1.272 1
75.4-89.4 1.907 2

The Development of the NUTrition Risk in the Critically ill Score (NUTRIC
Score). Variable Range PointsAge <50 0
50-<75 1>=75 2
APACHE II <15 015-<20 120-28 2>=28 3
SOFA <6 06-<10 1>=10 2
# Comorbidities 0-1 02+ 1
Days from hospital to ICU admit 0-<1 01+ 1
IL6 0-<400 0400+ 1
AUC 0.783Gen R-Squared 0.169Gen Max-rescaled R-Squared 0.256
BMI, CRP, PCT, weight loss, and oral intake were excluded because they were not significantly associated with mortality or their inclusion did not improve the fit of the final model.

The Validation of the NUTrition Risk in the Critically ill Score (NUTRIC Score).
0 1 2 3 4 5 6 7 8 9 10
Nutrition Risk Score
Mo
rta
lity
Ra
te (
%)
02
04
06
08
0
ObservedModel-based
n=12 n=33 n=55 n=75 n=90 n=114 n=82 n=72 n=46 n=17 n=2

The Validation of the NUTrition Risk in the Critically ill Score (NUTRIC Score).
0 1 2 3 4 5 6 7 8 9 10
Nutrition Risk Score
Da
ys o
n M
ech
an
ica
l Ve
ntil
ato
r
02
46
81
01
21
4 ObservedModel-based
n=12 n=33 n=55 n=75 n=90 n=114 n=82 n=72 n=46 n=17 n=2

The Validation of the NUTrition Risk in the Critically ill Score (NUTRIC Score).
0 50 100 150
0.0
0.2
0.4
0.6
0.8
1.0
Nutrition Adequacy Levles (%)
28
Da
y M
ort
alit
y
11 111
1
111
22
2
22 2
22
2
33
333
33
3
3
333
3
3
33
33
444444
4444
4
444
44 4444
44
4
44
4 444 4 44
44
4
55 5555 5 55 5 5 5 5 5
5 55555 5
5
55
555 55 55555
55
5 555 555
66 66 6666666
6 66
6
666 666 66 6
6
66
66
6 6
666
6 66
66
77
7
77
7
7
7
7
7
7
7
7
7
77
7
7
77
7
7
7 7
7
88
8
8
8
8
8
8
88
88
8
88
8
8
88
8
8
8
99
9
9
9
9
9
9
9
1010
Interaction between NUTRIC Score and nutritional adequacy (n=211)*
P value for the interaction=0.01
Heyland Critical Care 2011, 15:R28
Who might benefit the most from nutrition therapy?
• High NUTRIC Score?
• Clinical– BMI– Projected long length of stay
• Others?

Can we do better?
The same thinking that got you into this mess won’t get you out of it!

Aggressive Gastric Feeding may be a BAD
THING!
Observational study of 153 medical/surgical ICU patients receiving EN in stomach
Intolerance= residual volume>500ml, vomiting, or residual volume 150-500x2.
Patients followed for development of VAP (diagnosed invasively)
Mentec CCM 2001;29:1955
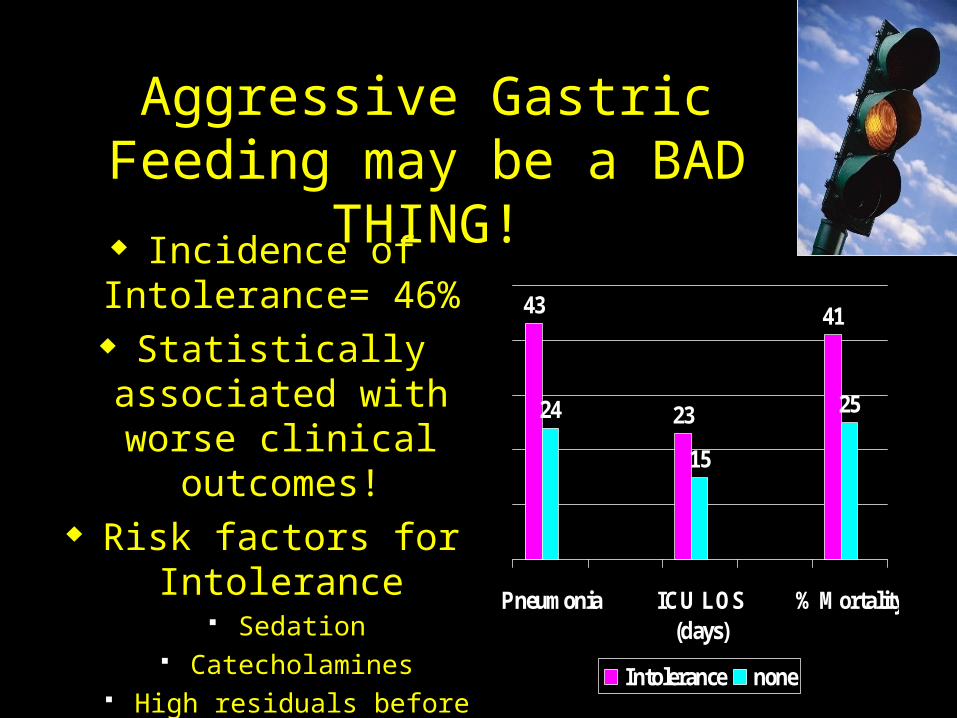
Incidence of Intolerance= 46%
Statistically associated with worse clinical
outcomes! Risk factors for
Intolerance Sedation
Catecholamines High residuals before and
during EN
43
23
41
24
15
25
Pneumonia ICU LOS(days)
%Mortality
Intolerance none
Aggressive Gastric Feeding may be a BAD
THING!

Strategies to Maximize the Benefits and Minimize the Risks
of EN
• feeding protocols
• motility agents
• elevation of HOB
• small bowel feeds
weak evidence
stronger evidence
Canadian CPGs www.criticalcarenutrition.com
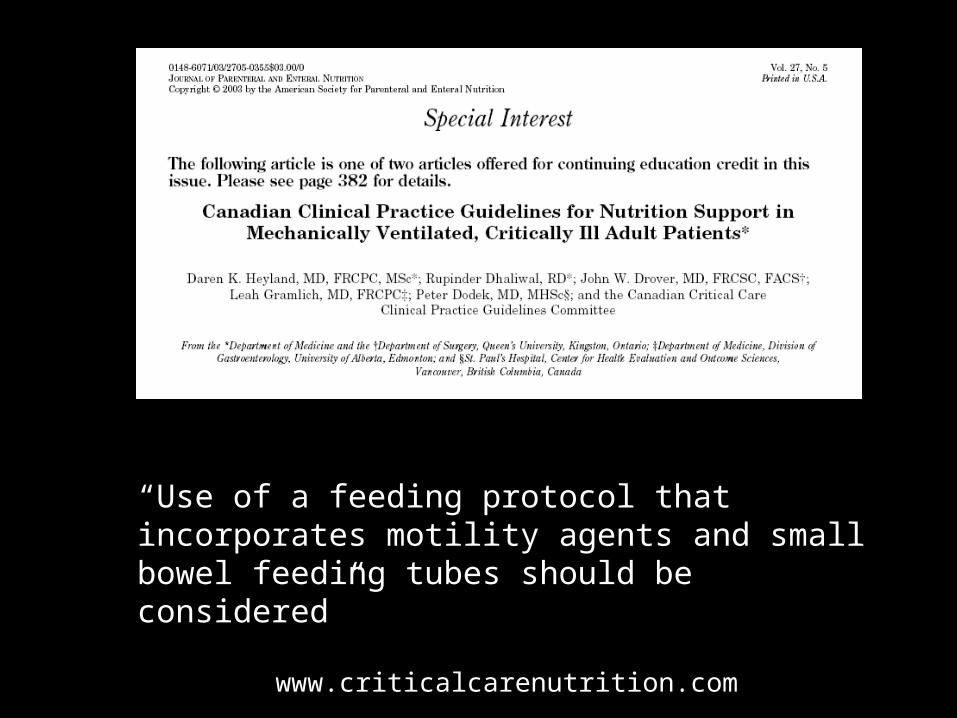
www.criticalcarenutrition.com
“Use of a feeding protocol that incorporates motility agents and small bowel feeding tubes should be considered”

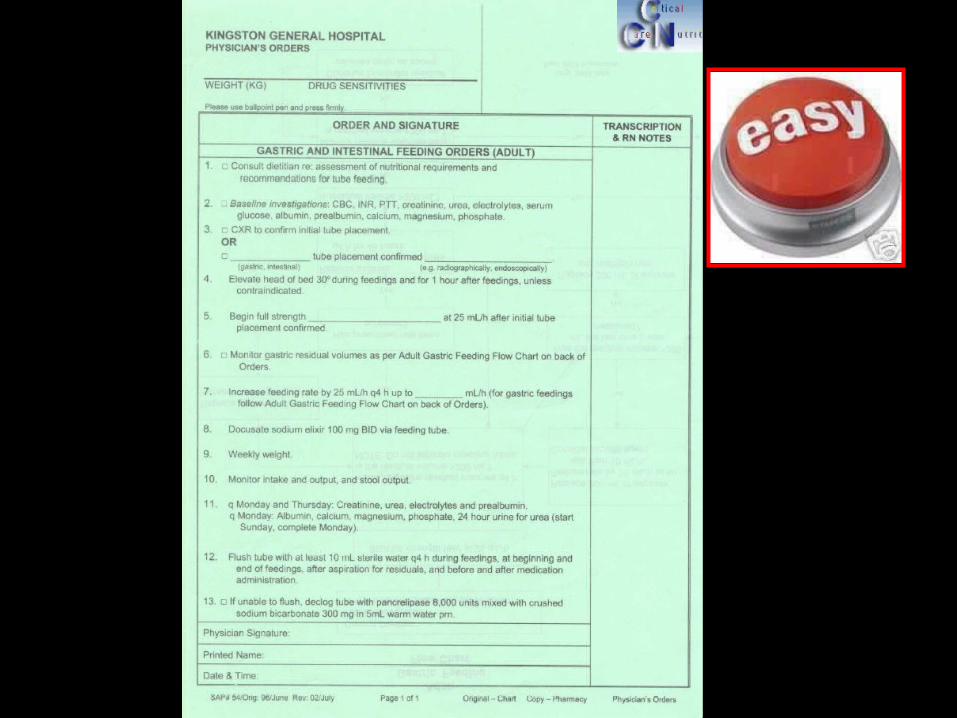
Use of Nurse-directed Feeding Protocols
Start feeds at 25 ml/hr
Check Residuals
q4h
> 250 ml
•hold feeds
•add motility agent
•reassess q 4h
< 250 ml
•advance rate by 25 ml
•reassess q 4h
2009 Canadian CPGs www.criticalcarenutrition.com
“Should be considered as a strategy to optimize delivery of enteral nutrition in critically ill adult patients.”

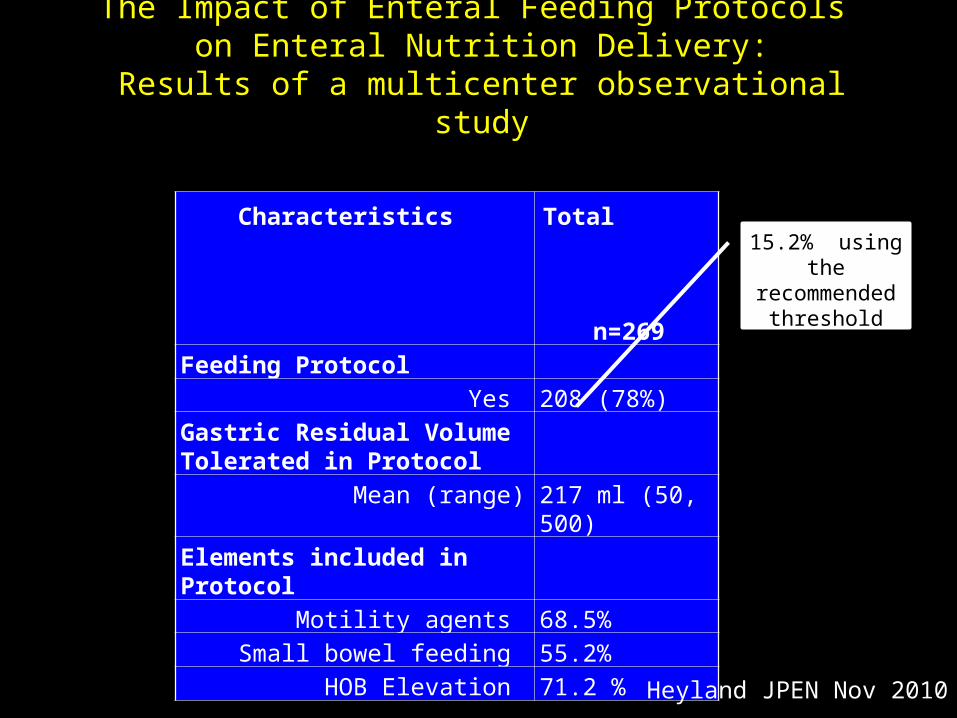
Characteristics Total
n=269
Feeding Protocol
Yes 208 (78%)
Gastric Residual Volume Tolerated in Protocol
Mean (range) 217 ml (50, 500)
Elements included in Protocol
Motility agents 68.5%
Small bowel feeding 55.2%
HOB Elevation 71.2 %
The Impact of Enteral Feeding Protocols on Enteral Nutrition Delivery:
Results of a multicenter observational study
Heyland JPEN Nov 2010
15.2% using the recommended
threshold volume of 250 ml

The Impact of Enteral Feeding Protocols on Enteral Nutrition Delivery:
Results of a multicenter observational study
• Time to start EN from ICU admission:– 41.2 in protocolized sites vs 57.1 hours in those without a
protocol
• Patients rec’ing motility agents:– 61.3% in protocolized sites vs 49.0% in those without
Heyland JPEN 2010
0
20
40
60
80
Calories from EN Total Calories
Protocol
No Protocol
P<0.05
P<0.05

Impaired motility Medications Metabolic, electrolyte abnormalities Underlying disease
Reasons for Inadequate Intake
Prophylactic use of motility agents
Slow starts and slow ramp ups Interruptions
Mostly related to procedures Not related to GI dysfunction
Can be overcome by better feeding
protocols

Initial Efficacy and Tolerability of Early Enteral Nutrition with Immediate or
Gradual Introduction in Intubated Patients
Desachy ICM 2008;34:1054
• This study randomized 100 mechanically ventilated patients (not in shock) to Immediate goal rate vs gradual ramp up (our usual standard).
• The immediate goal group rec’d more calories with no increase in complications

Initial Efficacy and Tolerability of Early Enteral Nutrition with Immediate or
Gradual Introduction in Intubated Patients
Desachy ICM 2008;34:1054

• 329 patients randomized to GRV 200 vs. 500
• >80% Medical• Average APACHE II 18
• Similar nutritional adequacy:• 85 vs 88% goal
calories
What Gastric Residual Volume Threshold Should I use?

Protocol to Manage Interruptions to EN due to non-
GI Reasons
Can be downloaded from www.criticalcarenutrition.com

• In select patients, we start the EN immediately at goal rate, not at 25 ml/hr.
• We target a 24 hour volume of EN rather than an hourly rate and provide the nurse with the latitude to increase the hourly rate to make up the 24 hour volume.
• Start with a semi elemental solution, progress to polymeric
• Tolerate higher GRV threshold (300 ml or more)• Motility agents and protein supplements are started
immediately, rather than started when there is a problem.
The Efficacy of Enhanced Protein-Energy Provision via the Enteral Route in Critically Ill Patients:
The PEP uP Protocol!
A Major Paradigm Shift in How we Feed EnterallyHeyland Crit Care 2010
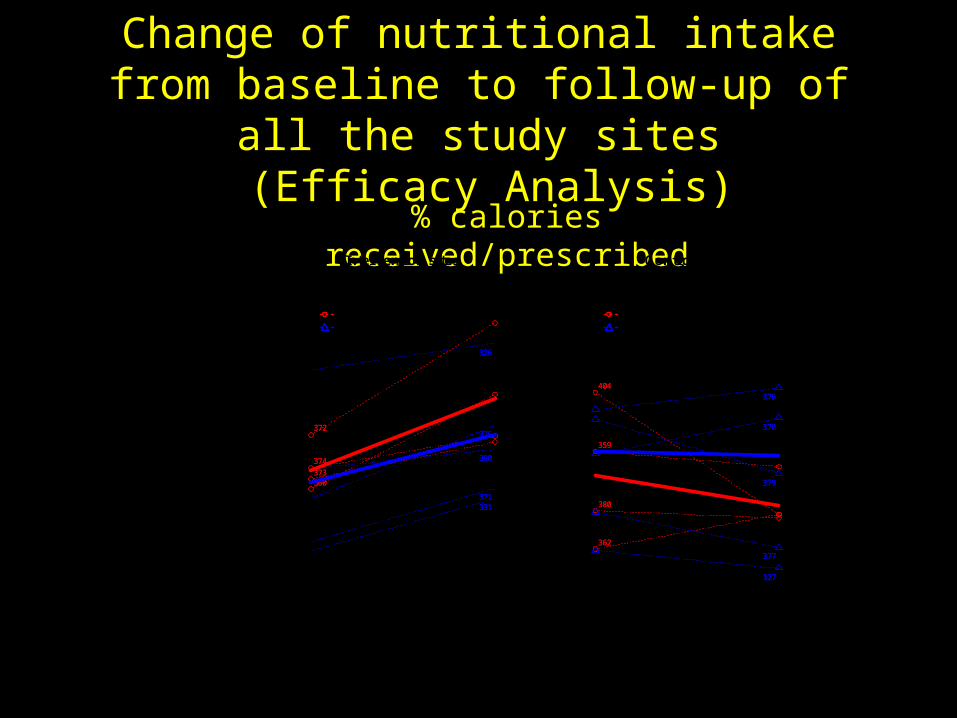
Change of nutritional intake from baseline to follow-up of all the study sites
(Efficacy Analysis)% calories received/prescribed
% c
alo
rie
s re
ceiv
ed
/pre
scri
be
d
326326
331331
360360
371371
372372
373373
374374
375375
390390
Baseline Follow-up
20
30
40
50
60
70
80
p value for Community sites=0.07p value for Academic sites=0.001
AcademicCommunity
Intervention sites
% c
alo
rie
s re
ceiv
ed
/pre
scri
be
d
p value for Community sites=0.78p value for Academic sites=0.20
327327
p value for Community sites=0.78p value for Academic sites=0.20p value for Community sites=0.78p value for Academic sites=0.20
359359
p value for Community sites=0.78p value for Academic sites=0.20p value for Community sites=0.78p value for Academic sites=0.20
362362
p value for Community sites=0.78p value for Academic sites=0.20p value for Community sites=0.78p value for Academic sites=0.20p value for Community sites=0.78p value for Academic sites=0.20p value for Community sites=0.78p value for Academic sites=0.20p value for Community sites=0.78p value for Academic sites=0.20p value for Community sites=0.78p value for Academic sites=0.20
376376
p value for Community sites=0.78p value for Academic sites=0.20
377377
p value for Community sites=0.78p value for Academic sites=0.20
378378
p value for Community sites=0.78p value for Academic sites=0.20
379379
p value for Community sites=0.78p value for Academic sites=0.20
380380
p value for Community sites=0.78p value for Academic sites=0.20p value for Community sites=0.78p value for Academic sites=0.20
404404
p value for Community sites=0.78p value for Academic sites=0.20p value for Community sites=0.78p value for Academic sites=0.20
Baseline Follow-up
20
30
40
50
60
70
80
AcademicCommunity
Control sites

% protein received/prescribed
Change of nutritional intake from baseline to follow-up of all the study sites
(Efficacy Analysis)%
pro
tein
re
ceiv
ed
/pre
scri
be
d
326326
331331
360360
371371
372372
373373374374
375375
390390
Baseline Follow-up
20
30
40
50
60
70
80
p value for Community sites=0.009p value for Academic sites=0.002
AcademicCommunity
Intervention sites
% p
rote
in r
ece
ive
d/p
resc
rib
ed
p value for Community sites=0828p value for Academic sites=0.15
327327
p value for Community sites=0828p value for Academic sites=0.15
p value for Community sites=0828p value for Academic sites=0.15
359359
p value for Community sites=0828p value for Academic sites=0.15
p value for Community sites=0828p value for Academic sites=0.15
362362
p value for Community sites=0828p value for Academic sites=0.15
p value for Community sites=0828p value for Academic sites=0.15
p value for Community sites=0828p value for Academic sites=0.15
p value for Community sites=0828p value for Academic sites=0.15
p value for Community sites=0828p value for Academic sites=0.15
p value for Community sites=0828p value for Academic sites=0.15
376376
p value for Community sites=0828p value for Academic sites=0.15
377377
p value for Community sites=0828p value for Academic sites=0.15
378378
p value for Community sites=0828p value for Academic sites=0.15
379379
p value for Community sites=0828p value for Academic sites=0.15
380380
p value for Community sites=0828p value for Academic sites=0.15
p value for Community sites=0828p value for Academic sites=0.15
404404
p value for Community sites=0828p value for Academic sites=0.15
p value for Community sites=0828p value for Academic sites=0.15
Baseline Follow-up
20
30
40
50
60
70
80
AcademicCommunity
Control sites
Effect on VAP
Updated 2011,www.criticalcarenutrition.com
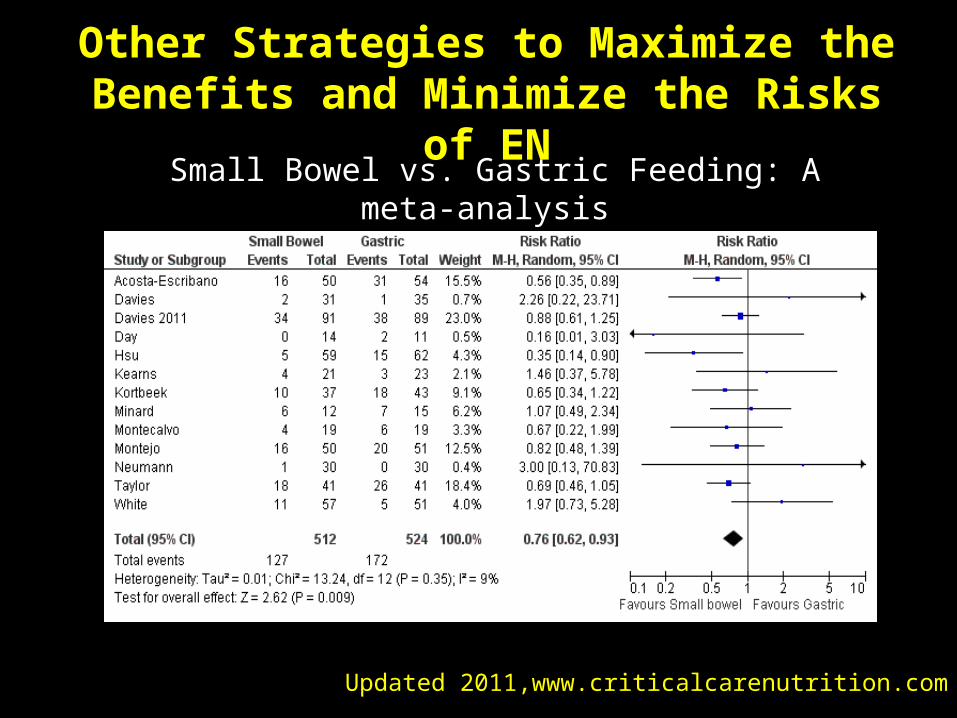
Small Bowel vs. Gastric Feeding: A meta-analysis
Other Strategies to Maximize the Benefits and Minimize the Risks of
EN

Does Postpyloric Feeding Reduce Risk of GER and Aspiration?
Tube Position
# of patients
% positive for GER
% positive for
Aspiration
Stomach 21 32 5.8
D1 8 27 4.1
D2 3 11 1.8
D4 1 5 0
Total 33 75 11.7
P=0.004 P=0.09
Heyland CCM 2001;29:1495-1501

What if you can’t provide adequate nutrition enterally?
… to add PN or not to add PN,
that is the question!
Health Care Associated Malnutrition

Critical Care Nutrition CPGs
• If unable to meet energy requirements after 7-10 days by the enteral route, consider initiating PN.
• Initiating PN prior to this 7-10 day period does not improve outcome and may be detrimental to the patient.
Americans
• Maximize EN (motility agents, small bowel feeds, etc.) prior to starting PN.
Canadians
• All patient who are not expected to be on normal nutrition within 3 days should receive PN within 24-48 hours if EN is contraindicated or if they can not tolerate adequate amounts of EN.
Europeans
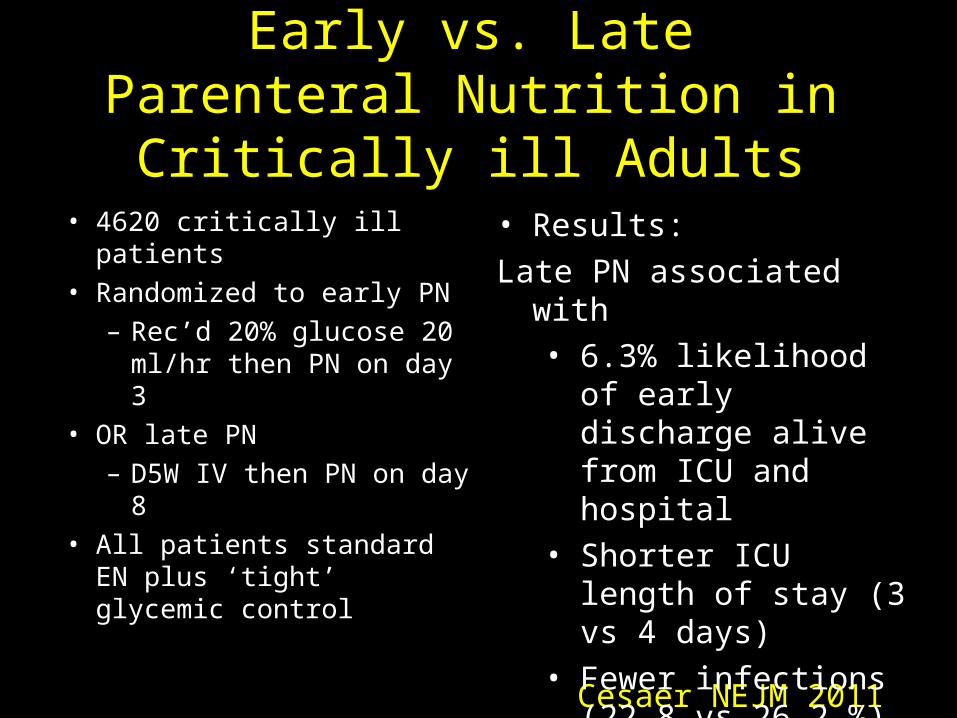
Early vs. Late Parenteral Nutrition in Critically ill Adults
• 4620 critically ill patients
• Randomized to early PN
– Rec’d 20% glucose 20 ml/hr then PN on day 3
• OR late PN
– D5W IV then PN on day 8
• All patients standard EN plus ‘tight’ glycemic control
Cesaer NEJM 2011
• Results:
Late PN associated with
• 6.3% likelihood of early discharge alive from ICU and hospital
• Shorter ICU length of stay (3 vs 4 days)
• Fewer infections (22.8 vs 26.2 %)
• No mortality difference

Early vs. Late Parenteral Nutrition in Critically ill Adults
• ? Applicability of data– No one give so much IV glucose in first few days– No one practice tight glycemic control
• Right patient population?– Majority (90%) surgical patients (mostly cardiac-60%)– Short stay in ICU (3-4 days)– Low mortality (8% ICU, 11% hospital)– >70% normal to slightly overweight
• Not an indictment of PN– Early group only rec’d PN for 1-2 days on average– Late group –only ¼ rec’d any PN
Cesaer NEJM 2011
What if you can’t provide adequate nutrition enterally?
… to TPN or not to TPN,
that is the question!
Case by Case DecisionMaximize EN delivery prior
to initiating PN

ICU patientsBMI <25 R
PN for 7 days
Control
The TOP UP Trial
Fed enterally
Primary Outcome
60-day mortality
BMI >35
Stratified by:SiteBMI
Med vs Surg

In Conclusion• Health Care Associate Malnutrition is rampant• Not all ICU patients are the same in terms of ‘risk’• Iatrogenic underfeeding is harmful in some ICU patients or
some will benefit more from aggressive feeding (avoiding protein/calorie debt)
• BMI and/or NUTRIC Score is one way to quantify that risk• Need to do something to reduce iatrogenic malnutrition in
your ICU!– Audit your practice first!– Consider updating your feeding protocol!

www.criticalcarenutrition.com

Questions?
www.criticalcarenutrition.com


![Optimal drug dosing control for intensive care unit ...haddad.gatech.edu/journal/Optimal_Control_OCAM.pdf · [6, 7], the corresponding sedation level of the ICU patient is related](https://static.documents.pub/doc/80x56/5f09f3b97e708231d4294b54/optimal-drug-dosing-control-for-intensive-care-unit-6-7-the-corresponding.jpg)


