27
Honghai Qi, PhD, PE. Lawrenceville, New Jersey Optimal Sluice Gate Operations for Flood Mitigation Study - City of Rye, New York

Honghai Qi, PhD, PE.Lawrenceville, New Jersey
Optimal Sluice Gate Operations for Flood Mitigation Study - City of Rye, New York
Outline
Project Background
Introduction to Blind Brook Watershed
Analysis of Recent Storm Event (April 30 to May 1, 2014)
Improvement to Sluice Gate Operations
Conclusions and Recommendations

Project Background
The City of Rye, NY has experienced significant property damage due to flooding along Blind Brook.
Several studies have been conducted to analyze the flooding.
Studies recommended steps to reduce/ mitigate flooding caused by Blind Brook.

Blind Brook Watershed Blind Brook, a tributary to the
Long Island Sound, has a drainage area of 10.9 mi2.
Drainage area includes City of Rye, Village of Rye Brook, Town/Village of Harrison, Village of Port Chester, and City of White Plains.
The length of the Blind Brook watershed is approximately 9 miles; width varies from 0.5 miles to 2 miles.
96.7% of total drainage area is in New York, and 3.3% of total area in Fairfield County, Connecticut .

Land Use and Soil Data

FEMA Study Effective FEMA
Study dated September 27, 2007
Community-Panel Numbers 36119C0356F and 36119C0352F
No Preliminary FEMA Maps issued since Hurricane Sandy (2012)

Rainfall Map
Average Annual Rainfall Depth 47 inches
24-Hour Duration, Type III Rainfall
Normal Soil Antecedent Moisture Content
ReturnPeriod
Rainfall Depth
(inches)
2-Year 3.5
5-Year 4.3
10-Year 5.0
25-Year 5.7
50-Year 6.4
100-Year 7.2

Previous Studies
November 2001, City of Rye – Flood Mitigation Plan identified Bowman Avenue Dam site for possible flood control
March 2008, SELLS issued Flood Mitigation Study that identified feasible alternatives including:
Orifice optimization (Sluice Gate Project)
Maximizing storage potential at Upper Pond
Refine costs and determine downstream benefit / upstream impacts
April 2012, SELLS was tasked with Upper Pond Study
Soiltesting Inc. (rock probes and borings)
WSP Energy and Environmental (contamination study)
RIZZO Associates (Hydrology and Hydraulics)

Location of Upper Pond / Dam
The Upper Pond / Bowman Avenue Dam is located within the Village of Rye Brook immediately upstream of I-287.
Originally constructed in the 1900's, the dam and the Upper Pond were used for ice production. In 1941, the dam collapsed and was rebuilt.
Current capacity of the Upper Pond is 145 ac-ft.

Bowman Avenue Dam
Reinforced-concrete gravity dam, 119 ft long and 13 ft high.
Based on aerial photos from 1925 and 2013, the dam site has changed considerably.
Only 25% of Upper Pond is available for flood storage.
Source: USGS. Image date: April, 2013
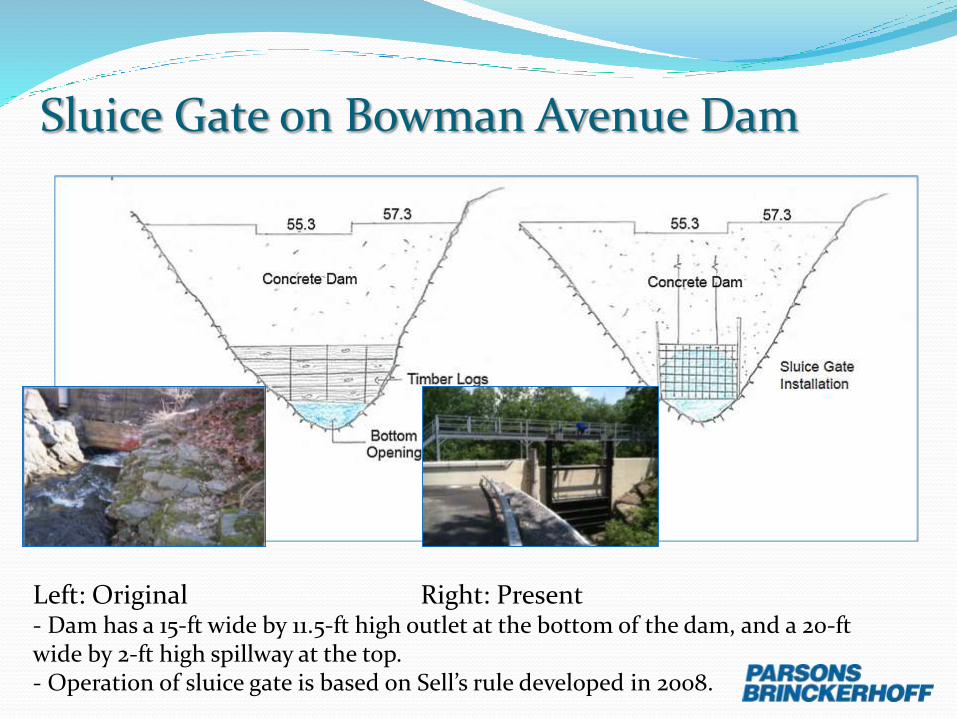
Sluice Gate on Bowman Avenue Dam
Left: Original Right: Present - Dam has a 15-ft wide by 11.5-ft high outlet at the bottom of the dam, and a 20-ft wide by 2-ft high spillway at the top. - Operation of sluice gate is based on Sell’s rule developed in 2008.

Recent Storm Event (04/30-05/01, 2014)
Advanced Hydrologic Prediction Service (AHPS) via National Weather Service (NWS) has gridded daily rainfall data for the Blind Brook Watershed.
The rainfall depth was approximately equivalent to a 2-year event.
RainfallGage
RainfallApril 30(inches)
RainfallMay 1
(inches)
TotalRainfall(inches)
No. 1 0.399 3.30 3.70
No. 2 0.40 3.70 4.10

Runoff from Recent EventPeak Discharges from Subwatershed
HEC-RAS Flow Change Input

Locations for Comparing Downstream Flooding
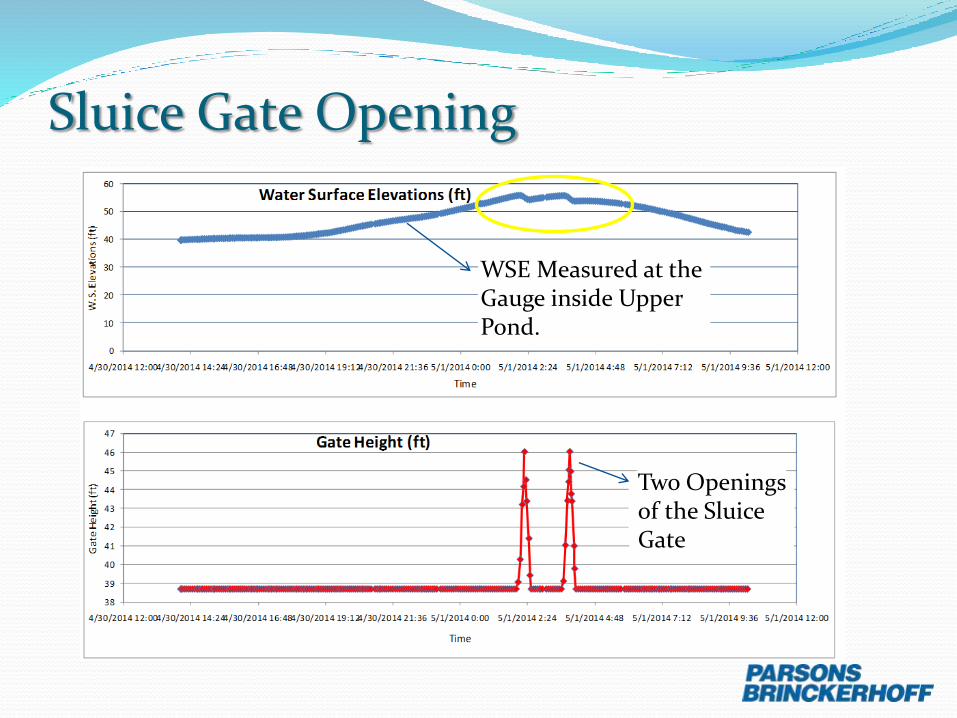
Sluice Gate Opening
WSE Measured at the Gauge inside Upper Pond.
Two Openings of the Sluice Gate

Flow During Sluice Gate Opening
Two Man-Made Peak Discharges

W.S. Elev. for “No Operations” vs Sluice Gate Opening
Locations HEC-RAS
Cross Section
No Gate Operations
Results
(ft)
Sluice Gate
Open Results
(ft)
Difference
(ft)
D/S I-287 XS 2230.179 33.09 34.38 +1.29
Purchase
Street XS 1508.033 27.38 28.46 +1.08
Mendota
Avenue XS 733.8118 24.08 24.83 +0.75
Highland
Road XS 677.1604 23.51 24.33 +0.82
U/S I-95 XS 504.3617 22.69 23.27 +0.58
* Predicted results represent water surface elevation resulting from sluice gate operating with current programming.
*

Current Gate Operation Based on Sells’ Study
For each storm event, the sluice gate should be opened to the corresponding optimal height for that event, in order to achieve the maximum water surface elevations at various downstream locations.
Since this event was equivalent to a 2-year event, the gate should remain close during the event based on rule above.
However, the current programming of the gate resulted in fully opening of the gate to its maximum possible height of 7.3 ft.

Gate Operation Based on Gauge at Indian Village
Q2 = 848 cfs Q5 = 1,844 cfs
Q10 = 2,622 cfsQ25 = 3,140 cfs
Q50 = 3,672 cfsQ100 = 4,354 cfs
E = 0.0000003551Q2 + 0.0001460990Q + 23.0709263024R² = 0.9704077109
0.00
5.00
10.00
15.00
20.00
25.00
30.00
35.00
0 500 1,000 1,500 2,000 2,500 3,000 3,500 4,000 4,500 5,000
Wate
r S
urf
ace E
levati
on
s a
t X
S 8
90.5
97
to C
lose G
ate
#2
(E -
ft)
Peak Discharges at XS 890.597 (Q - cfs)

Gate Operation Based on Gauge at Downstream I-287
Q2 = 777cfsQ5 = 1,813 cfs
Q10 = 2,636 cfs Q25 = 3,255 cfs Q50 = 3,931 cfs Q100 = 4,790 cfs
E = -0.0000002041Q2 + 0.0022258388Q + 30.0516609098R² = 0.9961578546
0.00
5.00
10.00
15.00
20.00
25.00
30.00
35.00
40.00
0 500 1,000 1,500 2,000 2,500 3,000 3,500 4,000 4,500 5,000
Wate
r S
urf
ace E
levati
on
s a
t X
S 2
230.1
79
to C
lose S
luic
e G
ate
(E -
ft)
Peak Discharges at XS 2230.179 (Q - cfs)
Compared with the previous scenario, this scenario has the gauge located 170 ft downstream of I-287, and 5,800 ft upstream of I-95.
The advantage of this gauge location is to protect a larger flood-prone residential areas, and provide greater water surface elevation reductions downstream of dam.

Comparison of W.S. Elevation Reduction
0 0 0 0 0 0 0 0 0 0 0 0 0 0 0
0.1 0.1 0.1 0.1 0.1
0.2
0.4 0.4
0.5 0.5
0.2 0.2
0.4
0.5 0.5
0.01 0.01 0.01 0 00.04 0.05 0.05 0.06 0.05
0.21
0.340.31 0.31
0.43
0.29
0.51
0.6 0.61
0.77
0.47
0.86
1.48 1.48
1.57
0.18
0.53
0.73 0.730.78
0 0 0 0 0
0.14
0.310.25 0.27
0.23
0.44
0.85
0.61 0.62
0.83
0.46
0.87
0.8 0.8
1.03
0.52
0.97
1.37 1.37
1.45
0.22
0.43
0.66 0.670.7
0
0.2
0.4
0.6
0.8
1
1.2
1.4
1.6
1.8
D/S
I-2
87
Purc
hase S
t
Mendota
Avenue
Hig
hla
nd R
oad
U/S
I-9
5
D/S
I-2
87
Purc
hase S
t
Mendota
Avenue
Hig
hla
nd R
oad
U/S
I-9
5
D/S
I-2
87
Purc
hase S
t
Mendota
Avenue
Hig
hla
nd R
oad
U/S
I-9
5
D/S
I-2
87
Purc
hase S
t
Mendota
Avenue
Hig
hla
nd R
oad
U/S
I-9
5
D/S
I-2
87
Purc
hase S
t
Mendota
Avenue
Hig
hla
nd R
oad
U/S
I-9
5
D/S
I-2
87
Purc
hase S
t
Mendota
Avenue
Hig
hla
nd R
oad
U/S
I-9
5
2-year 5-year 10-year 25-year 50-year 100-year
Wate
r S
urf
ace E
levation R
eductions
at D
ow
nstr
eam
Locations (
ft)
Sluice Gate Operation (RIZZO)
Sluice Gate Operation Based on W.S. Elevation at Indian Village
Sluice Gate Operation Based on W.S. Elevation at D/S I-287
Gate control based on I-287 gauge provides better results than Indian Village gauge.
Wat
er S
urf
ace
Elev
atio
n R
edu
ctio
ns
at
Do
wn
stre
am L
oca
tio
ns
(ft)

Resize Upper Pond
Proposed Upper Pond will a storage volume of 210 ac-ft.
Contour Map of Resizing Upper Pond
Area Volume
(acre) (acre-ft)
41 5.89 0.00
42 8.00 6.91
43 9.81 15.80
44 10.76 26.09
45 11.18 37.05
46 11.50 48.40
47 11.88 60.08
48 12.28 72.16
49 12.62 84.61
50 12.89 97.37
51 13.13 110.38
52 13.42 123.66
53 13.68 137.21
54 13.97 151.03
55 14.26 165.15
56 14.58 179.57
57 14.94 194.33
58 15.50 209.54
Elevation

Cumulative Effect 1: Resize Upper Pond and Gate Operations at Downstream of I-287
0.14 0.14 0.13 0.13 0.1
0.61
1.05
0.8 0.82
1.07
0.68
1.17
1.7 1.711.81
0.55
0.96
1.36 1.361.45
0
0.2
0.4
0.6
0.8
1
1.2
1.4
1.6
1.8
2
D/S
I-2
87
Pu
rch
ase
St
Men
do
ta A
ven
ue
Hig
hla
nd
Ro
ad
U/S
I-9
5
D/S
I-2
87
Pu
rch
ase
St
Men
do
ta A
ven
ue
Hig
hla
nd
Ro
ad
U/S
I-9
5
D/S
I-2
87
Pu
rch
ase
St
Men
do
ta A
ven
ue
Hig
hla
nd
Ro
ad
U/S
I-9
5
D/S
I-2
87
Pu
rch
ase
St
Men
do
ta A
ven
ue
Hig
hla
nd
Ro
ad
U/S
I-9
5
2-year 10-year 50-year 100-year
Wat
er S
urf
ace
Ele
vati
on
Red
uct
ion
s(f
t)
Downstream water surface elevation reduction ranges from 0.1 ft ~ 1.81 ft.

Additional Detention Areas
Westchester County Airport: 2 detention ponds by expanding existing stormwater management ponds
SUNY-Purchase: 2 detention areas
PepsiCo: 1 detention area
Hutchinson River Parkway: 3 detention areas
Subwatershed SW2: 2 detention ponds by expanding existing stormwater management ponds.
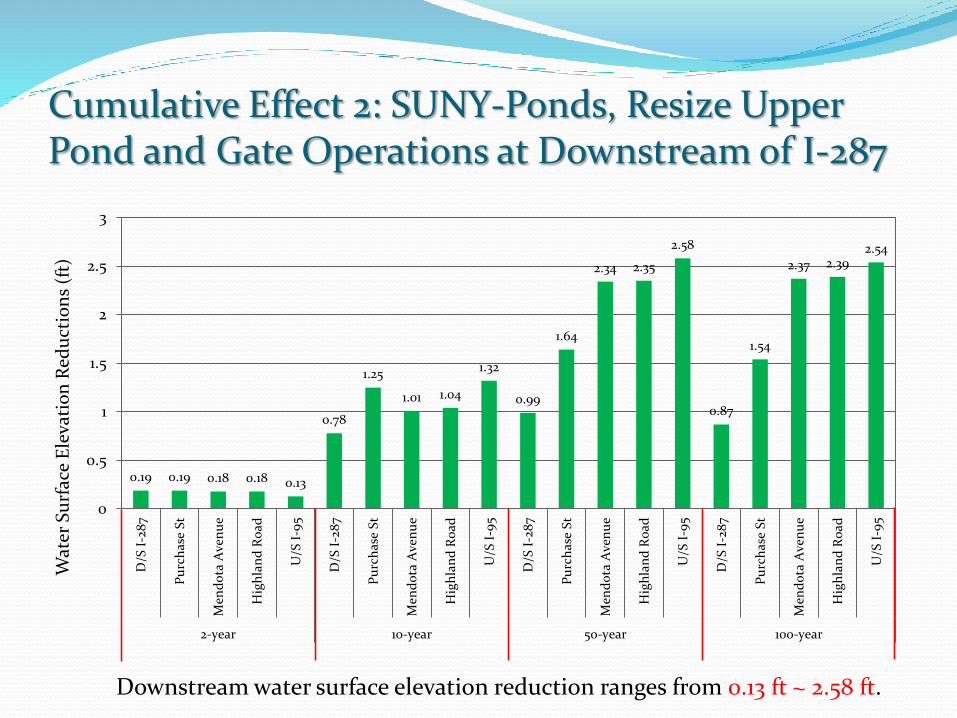
Cumulative Effect 2: SUNY-Ponds, Resize Upper Pond and Gate Operations at Downstream of I-287
0.19 0.19 0.18 0.18 0.13
0.78
1.25
1.01 1.04
1.32
0.99
1.64
2.34 2.35
2.58
0.87
1.54
2.37 2.392.54
0
0.5
1
1.5
2
2.5
3
D/S
I-2
87
Pu
rch
ase
St
Men
do
ta A
ven
ue
Hig
hla
nd
Ro
ad
U/S
I-9
5
D/S
I-2
87
Pu
rch
ase
St
Men
do
ta A
ven
ue
Hig
hla
nd
Ro
ad
U/S
I-9
5
D/S
I-2
87
Pu
rch
ase
St
Men
do
ta A
ven
ue
Hig
hla
nd
Ro
ad
U/S
I-9
5
D/S
I-2
87
Pu
rch
ase
St
Men
do
ta A
ven
ue
Hig
hla
nd
Ro
ad
U/S
I-9
5
2-year 10-year 50-year 100-year
Wat
er S
urf
ace
Ele
vati
on
Red
uct
ion
s (f
t)
Downstream water surface elevation reduction ranges from 0.13 ft ~ 2.58 ft.

Conclusions
Recent storm event and the actual gate movement were modeled, and the effect on downstream flooding was evaluated.
Two new locations were investigated for the gauge to control the sluice gate. The location of the gauge would be moved to a point downstream of the dam, and upstream of the flood-prone areas of Indian Village and downstream of I-287.
Future work includes install more gauges along the stream, so that the model can be calibrated more precisely with measured water surface elevations to better represent Blind Brook.
Thank you!
Questions and Comments?
City of Rye, New York1051 Boston Post RoadRye, New York 10580Phone: (914) 967-5400
2000 Lenox Drive, 3rd FloorLawrenceville, New Jersey 08648Phone: (609) 512-3500Fax: (609) 512-3600


