Page 1
https://lib.uliege.be https://matheo.uliege.be
Optimisation of offshore wind floater from dynamic cable and mooring perspective
Auteur : Aninthaneni, Avinash
Promoteur(s) : 14996
Faculté : Faculté des Sciences appliquées
Diplôme : Master : ingénieur civil mécanicien, à finalité spécialisée en "Advanced Ship Design"
Année académique : 2020-2021
URI/URL : http://hdl.handle.net/2268.2/13300
Avertissement à l'attention des usagers :
Tous les documents placés en accès ouvert sur le site le site MatheO sont protégés par le droit d'auteur. Conformément
aux principes énoncés par la "Budapest Open Access Initiative"(BOAI, 2002), l'utilisateur du site peut lire, télécharger,
copier, transmettre, imprimer, chercher ou faire un lien vers le texte intégral de ces documents, les disséquer pour les
indexer, s'en servir de données pour un logiciel, ou s'en servir à toute autre fin légale (ou prévue par la réglementation
relative au droit d'auteur). Toute utilisation du document à des fins commerciales est strictement interdite.
Par ailleurs, l'utilisateur s'engage à respecter les droits moraux de l'auteur, principalement le droit à l'intégrité de l'oeuvre
et le droit de paternité et ce dans toute utilisation que l'utilisateur entreprend. Ainsi, à titre d'exemple, lorsqu'il reproduira
un document par extrait ou dans son intégralité, l'utilisateur citera de manière complète les sources telles que
mentionnées ci-dessus. Toute utilisation non explicitement autorisée ci-avant (telle que par exemple, la modification du
document ou son résumé) nécessite l'autorisation préalable et expresse des auteurs ou de leurs ayants droit.
Page 2
Optimisation Of Offshore Wind Floater
From Dynamic Cable And Mooring
Prospective
Submitted on 27th August 2021
by
ANINTHANENI Avinash | 17th Street Poompuhar Nagar | Chennai 600099 India
[email protected]
Student ID No.: S194070
Supervisor: Reviewer:
Massimo CAPORASO Professor Philippe RIGO
Engineer/Advisor UNIVERSITY of LIEGE, ANAST
IMDC, Quartier Polytech 1, Bat. B52/3,
Van Immerseelstraat 66. Allée de la Découverte 9,
B-2018 Antwerp. 4000 Liege, Belgium.
Page 3
II
ABSTRACT Wind energy is one of the most promising energy sources, but it is currently limited to land
and sea locations with a maximum depth of 50m. This leaves large areas of uninterrupted high
seas unused, which can provide greater capacity than land-based and fixed offshore wind farms.
Floating offshore wind farms (FOWF) can be deployed in deeper water depths away from the
coast. Therefore, benefit from a greater volume and more consistent wind, resulting in a higher
capacity factor, greater flexibility in the installation location, and no restrictions on the size of
the wind turbine.
One of the main challenges faced by FOWF is that dynamic power cables are exposed to severe
load conditions during their design life. While traditional submarine cables are installed on the
seabed, FOWF's cables remain in free span, having floating components that enable them to
move with floating objects. Cables continue to be subjected to extreme dynamic loads during
their whole design life; therefore, they may suffer mechanical damage in various parts.
This thesis covers the preliminary study of the dynamic cables and their mechanical behaviour
for the floating offshore platforms. The cable configuration has been designed considering
extreme environmental conditions and then checked with normal sea state. In addition, the
mooring system has been taken into account during the dynamic analysis: a preliminary design
of the mooring line was considered and optimized for the project specific environmental
condition. It also provides information about the challenges faced in developing and modelling
designs, and finally, it defines future research for comprehensive design development.
Page 4
III
Table of Contents
ABSTRACT .............................................................................................................................. II
DECLARATION OF AUTHORSHIP ..................................................................................... VI
List of Figures ....................................................................................................................... VIII
List of Tables ............................................................................................................................ X
1 INTRODUCTION .................................................................................................................. 1
2 OFFSHORE WIND TURBINE .............................................................................................. 3
2.1 Fixed Foundation.............................................................................................................. 3
2.2 Floating offshore wind turbine ......................................................................................... 4
2.2.1 Types of floating platform ......................................................................................... 4
2.2.1.1 Spar- Buoy ......................................................................................................... 5
2.2.1.2 Semi-submersible ............................................................................................... 5
2.2.1.3 Tension leg platform .......................................................................................... 6
2.2.2 Leading technology types for floating offshore wind power .................................... 7
2.2.2.1 Hywind ............................................................................................................... 7
2.2.2.2 Gicon .................................................................................................................. 8
2.2.2.3 BW Ideol (Floatgen: Damping pool floating foundation) ................................. 8
2.2.2.4 WindFloat .......................................................................................................... 9
2.2.2.5 Fukushima forward .......................................................................................... 10
3 SUBMARINE POWER CABLE .......................................................................................... 11
3.1 Generic static cable type ................................................................................................ 11
3.1.1 Array Cables ............................................................................................................ 11
3.1.2 High voltage AC and DC export cables .................................................................. 12
3.1.3 Difference between Ac cable and DC cable ............................................................ 13
3.2 Dynamic power cable ..................................................................................................... 13
3.2.1 Design elements of dynamic power cables .............................................................. 13
3.2.2 Typical cable cross section ...................................................................................... 14
3.2.2.1 Metallic screen and metallic sheath ................................................................. 14
3.2.2.2 Core sheath....................................................................................................... 15
3.2.2.3 Bedding layer ................................................................................................... 15
3.2.2.4 Armour ............................................................................................................. 15
3.2.2.5 Outer serving .................................................................................................... 16
3.2.3 Catenary Cable Configuration ................................................................................. 16
3.2.3.1 Free-hanging .................................................................................................... 17
Page 5
IV
3.2.3.2 Lazy wave ........................................................................................................ 17
3.2.3.3 Steep wave ....................................................................................................... 18
3.2.3.4 Pliant wave (Tethered wave) ........................................................................... 18
3.2.4 RELATED COMPONENTS ................................................................................... 19
3.2.4.1 TRANSITION JOINT ..................................................................................... 19
3.2.4.2 Bend restrictors ................................................................................................ 19
3.2.4.3 Bend stiffener ................................................................................................... 20
3.2.4.4 Buoyancy modules ........................................................................................... 20
4 ORCAFLEX ......................................................................................................................... 22
4.1 Description ..................................................................................................................... 22
4.2 Line Theory .................................................................................................................... 23
4.3 Static analysis ................................................................................................................. 24
4.4 Dynamic Analysis .......................................................................................................... 25
4.4.1 Time domain ............................................................................................................ 25
4.4.2 Frequency domain ................................................................................................... 26
5 MODEL SETUP ................................................................................................................... 27
5.1 Floating Platform and dynamic cable properties............................................................ 27
5.2 Initial catenary cable modelling ..................................................................................... 28
5.3 Result: Initial modelling ................................................................................................. 29
6 OPTIMIZATION OF THE CATENARY CABLE CONFIGURATION ............................ 32
6.1 Buoyancy Module .......................................................................................................... 32
6.1.1 Result: Buoyancy module ........................................................................................ 34
6.2 Dynamic cable length ..................................................................................................... 35
6.3 Excursion analysis .......................................................................................................... 38
6.4 Bend Stiffener ................................................................................................................ 40
6.5 Conclusion ...................................................................................................................... 41
7 . DYNAMIC ANALYSIS ..................................................................................................... 42
7.1 Environment Load .......................................................................................................... 42
7.2 MOORING ANALYSIS ................................................................................................ 42
7.2.1 Optimal mooring chain size ..................................................................................... 43
7.2.2 Optimal mooring chain length ................................................................................. 49
7.3 Coupled analysis of dynamic cable and mooring........................................................... 53
7.3.1 Extreme sea state ..................................................................................................... 53
7.3.2 Normal sea state condition ...................................................................................... 58
8 CONCLUSION ..................................................................................................................... 65
Page 6
V
9 FUTURE WORK .................................................................................................................. 66
REFERENCES ........................................................................................................................ 67
APPENDIX A .......................................................................................................................... 69
APPENDIX B .......................................................................................................................... 72
APPENDIX C .......................................................................................................................... 75
Page 7
VI
DECLARATION OF AUTHORSHIP
I declare that this thesis and the work presented in it are my own and have been generated by
me as the result of my own original research.
Where I have consulted the published work of others, this is always clearly attributed.
Where I have quoted from the work of others, the source is always given. With the exception
of such quotations, this thesis is entirely my own work.
I have acknowledged all main sources of help.
Where the thesis is based on work done by myself jointly with others, I have made clear exactly
what was done by others and what I have contributed myself.
This thesis contains no material that has been submitted previously, in whole or in part, for the
award of any other academic degree or diploma.
I cede copyright of the thesis in favour of the Universidad Politécnica de Madrid.
Date: 27th August 2021 Signature:
Page 8
VII
ACKNOLGEMENT
My heartfelt gratitude and appreciation to my supervisor Massimo Caporaso, Engineer/Advisor
at IMDC. For his priceless support, encouragement and sharing of knowledge throughout the
thesis work. During the course of work his critical comments have been very enlightening.
Special thanks to Zafar Samadov, Project Manager of Blue Energy Team at IMDC, for giving
me this wonderful opportunity to carry out my thesis work with any hindrance. I would like to
extend my thanks to Michaël Schelfhout, IT Coordinator at IMDC for his timely assistance
with the technical support.
I sincerely thanks Professor Philippe RIGO, University Liege, for helping me in keeping track
with the timelines from the initiation of the EMship+ master program and being a constant
support throughout the time. I would like to extend my thanks to Professor Antonio
Crucelaegui, Universidad Politécnica de Madrid, for supporting and guiding me with the course
work.
Page 9
VIII
List of Figures
Figure 2.1 Fixed Foundation ...................................................................................................... 3
Figure 2.2 Offshore wind floating foundation concept .............................................................. 4
Figure 2.3 Hywind Scotland Pilot Project (2017) ...................................................................... 7
Figure 2.4 GICON – SOF technology ....................................................................................... 8
Figure 2.5 BW Ideol – Floatgen ................................................................................................ 9
Figure 2.6 WindFloat ............................................................................................................... 10
Figure 2.7 Fukushima Mirai 2MW FOWT .............................................................................. 10
Figure 3.1 Three core Array Cable .......................................................................................... 12
Figure 3.2 High voltage AC three core export cable ............................................................... 12
Figure 3.3 High voltage DC single core export cable .............................................................. 13
Figure 3.4 Typical Dynamic cable cross-section ..................................................................... 14
Figure 3.5 Catenary cable configuration: From top left a) Free-hanging; a) Lazy wave; c)
Steep wave; d) Tethered wave ................................................................................................. 16
Figure 3.6 Dynamic cable related components ........................................................................ 19
Figure 3.7 Bend Stiffener ......................................................................................................... 20
Figure 3.8 Buoyancy modules ................................................................................................. 21
Figure 4.1 OrcaFlex line model ............................................................................................... 23
Figure 4.2 Detailed representation of OrcaFlex line model ..................................................... 24
Figure 5.1 Semi-Submersible platform: OrcaFlex model ........................................................ 27
Figure 5.2 Catenary configuration OrcaFlex model ................................................................ 28
Figure 5.3 Bending Moment for four Catenary cable configuration ....................................... 29
Figure 5.4 Effective Tension at End A for four Catenary cable configuration ........................ 30
Figure 6.1 Float pitch ............................................................................................................... 32
Figure 6.2 Floater diameter 1 [m] with float pitch of 3[m] and 4[m] layout ........................... 34
Figure 6.3 Floater diameter 1.2 [m] with float pitch of 3[m] and 4[m] layout ........................ 35
Figure 6.4 Layout of Dynamic cable with floater diameter 1 [m] ........................................... 36
Figure 6.5 Layout of Dynamic cable with floater diameter 1.2 [m] ........................................ 37
Figure 6.6 Bending Moment of dynamic cable with floater diameter 1.2 [m] ........................ 38
Figure 6.7 Excursion analysis +/- 25 [m]................................................................................. 38
Figure 6.8 Excursion analysis +/- 5 [m]: Bending Moment .................................................... 39
Figure 6.9 Excursion analysis +/- 5 [m]: Effective Tension .................................................... 40
Figure 6.10 Bend Stiffener analysis: Bend moment ................................................................ 41
Figure 7.1 Mooring system layout ........................................................................................... 43
Figure 7.2 Mooring chain diameter analysis: Maximum effective tension in mooring line.... 44
Figure 7.3 Mooring diameter analysis: Maximum bending moment for dynamic cable........ 46
Figure 7.4 Mooring diameter analysis: Maximum effective tension at End A for dynamic
cable ......................................................................................................................................... 46
Figure 7.5 Mooring diameter analysis: Maximum effective tension at touch down point
(TDP) for dynamic cable ......................................................................................................... 47
Figure 7.6 Mooring diameter analysis: Maximum surge movement of the floater ................. 47
Figure 7.7 Mooring diameter analysis: Maximum heave movement of the floater................. 48
Figure 7.8 Mooring line length analysis: Maximum effective tension in mooring line .......... 49
Figure 7.9 Mooring line length analysis: Maximum bending moment for dynamic cable ..... 50
Page 10
IX
Figure 7.10 Mooring line length analysis: Maximum effective tension at End A for dynamic
cable ......................................................................................................................................... 50
Figure 7.11 Mooring line length analysis: Maximum effective tension at touch down point
(TDP) for dynamic cable ......................................................................................................... 51
Figure 7.12 Mooring line length analysis: Maximum surge movement of the floater ........... 51
Figure 7.13 Mooring line length analysis: Maximum heave movement of the floater ........... 52
Figure 7.14 Extreme sea state: Bending Moment in 0° wave direction for dynamic cable ..... 54
Figure 7.15 Extreme sea state: Effective tension at End A in 180° wave direction on the
dynamic cable. ......................................................................................................................... 54
Figure 7.16 Extreme sea state: Effective tension at TDP in 180° wave direction on the
dynamic cable. ......................................................................................................................... 55
Figure 7.17 Extreme sea state: Tension in mooring line 3 at End A for 90° wave heading .... 56
Figure 7.18 Normal sea state: Maximum Bending moment in dynamic cable ........................ 58
Figure 7.19 Normal sea state: Maximum effective tension at End A in dynamic cable.......... 59
Figure 7.20 Normal sea state: Maximum effective tension at Touch down point (TDP) in
dynamic cable .......................................................................................................................... 59
Figure 7.21 Normal sea state: Maximum effective tension at End A in mooring line ............ 60
Figure 7.22 Normal sea state: Maximum surge motion in the floater ..................................... 60
Figure 7.23 Normal sea state: Maximum heave motion in the floater..................................... 61
Figure 7.24 Normal Sea state: Load case 1 Bending Moment in 0° wave direction ............... 61
Figure 7.25 Normal Sea state: Load case 1 Effective Tension at End A in 180° wave
direction ................................................................................................................................... 62
Figure 7.26 Normal Sea state: Load case 1 Effective Tension at TDP in 180° wave direction
.................................................................................................................................................. 63
Figure 7.27 Normal sea state: Maximum tension in mooring line 5 in 0° wave direction for
load case 1 ................................................................................................................................ 64
Figure 0.1 Extreme sea state: Effective tension of mooring line 5 in 0° wave direction......... 69
Figure 0.2 Extreme sea state: Effective tension of mooring line 6 in 0° wave direction......... 69
Figure 0.3 Extreme sea state: Effective tension of mooring line 4 in 90° wave direction....... 70
Figure 0.4 Extreme sea state: Effective tension of mooring line 7 in 180° wave direction..... 70
Figure 0.5 Extreme sea state: Effective tension of mooring line 8 in 180° wave direction..... 71
Figure 0.1 Normal sea state: Maximum tension in mooring line 6 in 0° wave direction for
load case 1 ................................................................................................................................ 75
Figure 0.2 Normal sea state: Maximum tension in mooring line 3 in 90 degrees wave
direction for load case 1 ........................................................................................................... 75
Figure 0.3 Normal sea state: Maximum tension in mooring line 4 in 90° wave direction for
load case 1 ................................................................................................................................ 76
Figure 0.4 Normal sea state: Maximum tension in mooring line 7 in 180° wave direction for
load case 1 ................................................................................................................................ 76
Figure 0.5 Normal sea state: Maximum tension in mooring line 8 in 180° wave direction for
load case 1 ................................................................................................................................ 77
Page 11
X
List of Tables
Table 2.1 Strengths and weaknesses of Spar-Buoy ................................................................... 5
Table 2.2 Strengths and weaknesses of Semi-submersible ........................................................ 6
Table 2.3 Strengths and weaknesses of tension leg platform .................................................... 6
Table 3.1 Advantages and Disadvantages of free hanging ...................................................... 17
Table 3.2 Advantages and Disadvantages of lazy wave .......................................................... 17
Table 3.3 Advantages and Disadvantages of steep wave ........................................................ 18
Table 3.4 Advantages and Disadvantages of tethered wave .................................................... 18
Table 5.1 Dynamic power cable properties ............................................................................. 27
Table 5.2 Dynamic cable section length .................................................................................. 28
Table 5.3 Buoyancy module properties ................................................................................... 29
Table 5.4 Maximum Bending moment and Tension for four catenary configurations ........... 30
Table 6.1 Floater properties ..................................................................................................... 33
Table 6.2 Dynamic cable with floater properties ..................................................................... 33
Table 6.3 Dynamic cable section for floater diameter 1[m] with pitch 3 [m] ......................... 35
Table 6.4 Dynamic cable section for floater diameter 1.2[m] with pitch 4 [m] ...................... 36
Table 6.5 Maximum bending moment ..................................................................................... 37
Table 6.6 Excursion analysis: Maximum Bending Moment and Effective Tension ............... 39
Table 7.1 Environmental Load condition ................................................................................ 42
Table 7.2 Mooring line position............................................................................................... 43
Table 7.3 Mooring chain mechanical properties ...................................................................... 44
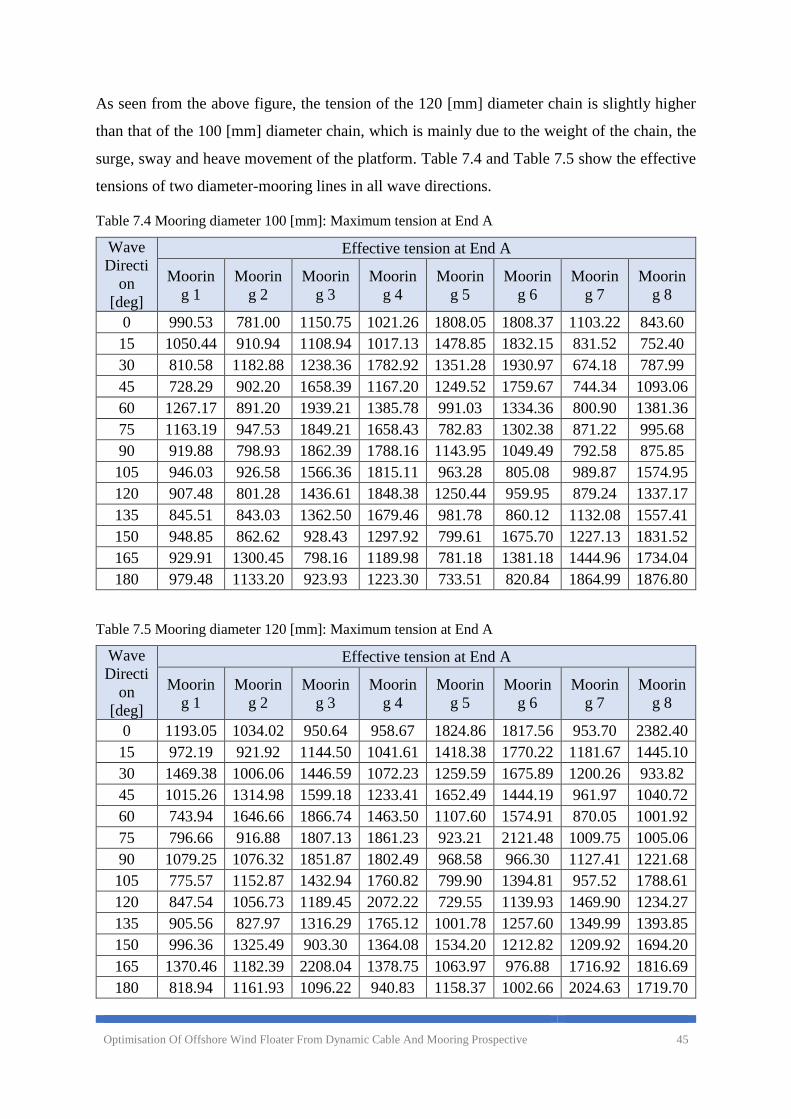
Table 7.4 Mooring diameter 100 [mm]: Maximum tension at End A ..................................... 45
Table 7.5 Mooring diameter 120 [mm]: Maximum tension at End A ..................................... 45
Table 7.6 Extreme Analysis: maximum bending moment and tension in dynamic cable ....... 53
Table 7.7 Extreme Sea State: maximum tension in mooring system ...................................... 55
Table 7.8 Extreme sea state: Floater motion ............................................................................ 56
Table 7.9 Normal sea state: Load case 1 maximum tension of mooring lines ........................ 63
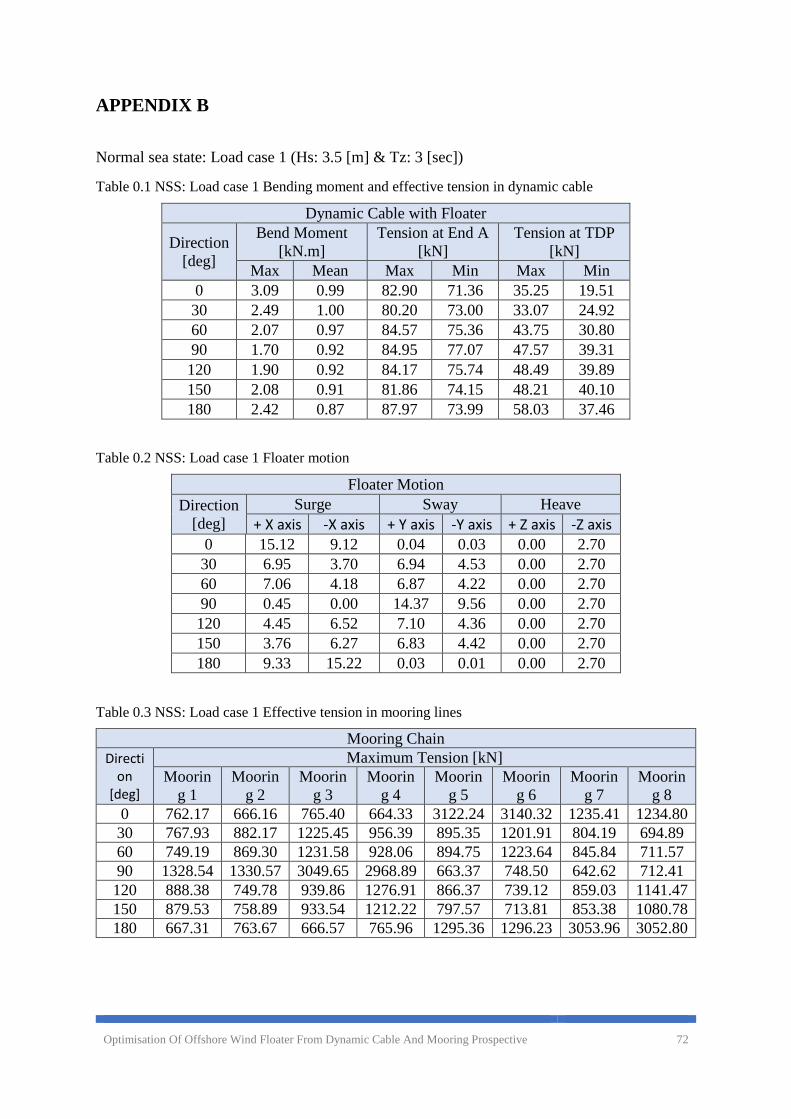
Table 0.1 NSS: Load case 1 Bending moment and effective tension in dynamic cable .......... 72
Table 0.2 NSS: Load case 1 Floater motion ............................................................................ 72
Table 0.3 NSS: Load case 1 Effective tension in mooring lines ............................................. 72
Table 0.4 NSS: Load case 2 Bending moment and effective tension in dynamic cable .......... 73
Table 0.5 NSS: Load case 2 Floater motion ............................................................................ 73
Table 0.6 NSS: Load case 2 Effective tension in mooring lines ............................................. 73
Table 0.7 NSS: Load case 3 Bending moment and effective tension in dynamic cable .......... 74
Table 0.8 NSS: Load case 3 Floater motion ............................................................................ 74
Table 0.9 NSS: Load case 3 Effective tension in mooring lines ............................................. 74
Page 12
Optimisation Of Offshore Wind Floater From Dynamic Cable And Mooring Prospective 1
1 INTRODUCTION
In the several decades climate change has been an important economic and political issue, and
the depletion of fossil fuels has led the focus on more clean energy sources like renewable
energy resources.
Wind Energy is a major renewable resource that is unlimited and non-polluting. Offshore wind
energy is obtained by harnessing the wind energy at its maximum with no barriers which
maintains it constantly. To harness this mega structure are installed in the seabed with
innovative technologies. There are fixed platforms and floating platforms for shallow waters
and deep waters respectively.
According to (WindEurope, 2021) statistics data, there are 116 offshore wind farms in
European countries, with 5,402 turbines connected to the grid, totalling a capacity of 25,014
MW as of 2020.The United Kingdom with the largest installed offshore wind power capacity
in Europe, accounting for 42% of all installed capacity. Germany ranks second with 31%,
followed by Denmark (10%), Belgium (9%) and the Netherlands (7%). In this most wind farms
are fixed at the bottom, their average distance from the shore is 52 [km], and the water depth
is 44 [m].
By the end of 2020, the total capacity of floating wind power in Europe was 62 MW, which
now accounts for 83% of the global installed capacity of floating wind power. In three years,
28 floating wind turbines, totalling a capacity of 250 MW, will be commissioned.
These seem to be a promising source and is expected to become a significant player in
providing this clean energy. Although floating offshore wind farms (FOWFs) are immature
and rapidly developing, it requires a thorough study on the different aspects ranging from the
cost, environment, dynamics of the market, integration between the technologies and the
substructures.
Page 13
Optimisation Of Offshore Wind Floater From Dynamic Cable And Mooring Prospective 2
This thesis work propose a preliminary study about the mechanical behaviour of the dynamic
cable and mooring system for the offshore wind-floating platform at 100 [m] water depth for
extreme environmental condition. Both the system are modelled in OrcaFlex, which is a FEM
based commercial software specific for offshore numerical simulations. The structure of the
report is as follows:
Chapter 2: This chapter discusses the available floating platform technologies and the
platform, which are currently used in industries.
Chapter 3: This chapter discusses the generic cable types and dynamic power cables,
including the cable configuration for FOWT’s.
Chapter 4: This chapter describes the commercial software that was used and the
theories involved in it.
Chapter 5: This chapter discusses the initial model setup for different dynamic cable
configurations.
Chapter 6: This chapter discusses the sensitive static analyses for dynamic cable and
their results.
Chapter 7: This chapter discusses the dynamic analysis, including the environmental
condition, sensitive analysis of mooring, coupled analysis of dynamic
cable and mooring and their result.
Chapter 8: This chapter gives a conclusion for the thesis.
Chapter 9: This chapter suggests the different areas in which future research has to be
done.
Page 14
Optimisation Of Offshore Wind Floater From Dynamic Cable And Mooring Prospective 3
2 OFFSHORE WIND TURBINE
In this chapter, the first section describe the fixed foundation in general and the next section
discuss the floating offshore wind turbine technology, that includs available floating platform
technology and the platform, which are currently used in the industries are also discussed.
2.1 Fixed Foundation
Offshore wind turbines have permanent underwater foundations. The turbines are located at
average distance from the shore upto 50 [km], at water depth upto 40 [m].The fixed foundation
can be divided into three categories: Monopile foundation, Gravity based foundation, and
Jacketed foundations as shown in Figure 2.1.
Figure 2.1 Fixed Foundation
Available from: https://www.iberdrola.com/sustainability/offshore-wind-turbines-foundations
[Accessed 23rd August 2021]
The monopile foundation is a simple construction. The foundation consists of a steel pile with
a diameter of between 3.5 and 4.5 [m]. The pile is driven some 10 to 20 [m] into the seabed
depending on the type of underground. It is mostly installed at the maximum of 15 [m] water
depth. For monopile foundation, seabed preparation is not necessary and is not suitable for the
location with many large boulders (Iberdrola, n.d.).
The Gravity based foundation is a huge structure, relying on its own weight or dead load to
achieve sufficient stability to prevent overturning and sliding. They are usually made of
concrete and can be reinforced with steel to avoid tensile loads. It can be installed in hard
seabed conditions and medium to deep water 30 [m] - 60 [m]. Piling is unnecessary, so damage
Page 15
Optimisation Of Offshore Wind Floater From Dynamic Cable And Mooring Prospective 4
to marine life is minimized. At this depth, GBF is an excellent alternative to traditional
foundation solutions (Iberdrola, n.d.).
Depths below 30 to 35 meters require more complex supporting and anchoring structures. In
most cases, the jacket foundation has a grid frame with three or four seabed anchor points,
improving the safety level when anchoring the tower. The top of the jacket has a transition
piece connected to the turbine shaft, and the legs (three or four) are fixed on the seabed with
piles (Iberdrola, n.d.).
2.2 Floating Offshore Wind Turbine
Most offshore wind turbines are fixed to the seabed at a maximum water depth of 60[m]. Nearly
80% of offshore wind resources are available beyond 60[m] of water depth. The floating wind
turbine is developed based on the concepts from the oil and gas industries. The floating turbines
offer access to large areas with substantial wind resources. For some countries with a narrow
continental shelf, floating foundations offer the only opportunity for large-scale offshore wind
deployment.
2.2.1 Types of Floating Platform
The floating platforms can be divided into three categories are shown in the Figure 2.2 from
right side tension leg platform (TLP), semi-submersible and spar-buoy.
Figure 2.2 Offshore wind floating foundation concept
Available from https://www.irena.org/-
/media/Files/IRENA/Agency/Publication/2016/IRENA_Offshore_Wind_Floating_Foundations_2016.
pdf [Accessed 23rd August 2021]
Page 16
Optimisation Of Offshore Wind Floater From Dynamic Cable And Mooring Prospective 5
2.2.1.1 Spar- Buoy
A spar-buoy is a cylindrical ballast-stabilised structure that stabilises itself by having the centre
of gravity lower in the water than the centre of buoyancy. The spar buoy is a large structure
that can be used to provide buoyancy in the sea. The lower part of the structure is heavier, while
the upper part is lighter, increasing the centre of buoyancy. It is usually easy to manufacture
and provides good stability, but the long submersed structure of the spar-buoy makes it
challenging for assembly, transportation and installation. It needs to be installed at water depths
larger than 75-100 m depending on the size of the wind turbine. The spar-buoy is kept in
position by attaching the catenary or taut spread mooring lines and anchored through drag or
suction anchors. Both strengths and weakness are shown in Table 2.1(Rhodri, 2015; IRENA,
2016).
Table 2.1 Strengths and weaknesses of Spar-Buoy
Strengths:
Simple design
Few moving parts (no active ballast required)
Lower mooring installation cost
Tendency for lower critical wave-induced motions
Excellent stability
Weaknesses:
Constrained to deep water locations larger than 100 [m]
Offshore turbine assembly requires dynamic positioning vessels and heavy-lift
cranes
Large draft limits ability to tow the structure back to port for major repairs
2.2.1.2 Semi-submersible
Buoyancy stabilised platform that floats semi-submerged on the ocean's surface whilst
anchored to the seabed with catenary mooring lines. The platform consists mostly of 3 to 5
cylindrical platforms interconnected by tubes. The mooring line of the semi-submersible
platform is anchored through drag anchors to the seabed to ensure the platform stays in the
targeted position. It requires a large and heavy structure to maintains the platform stability.
However, due to low draft, it provides a more flexible application and easy installation. The
semi-submersible can be deployed in water depth from 40 [m]. Both strengths and weakness
are shown in Table 2.2 (Rhodri, 2015; IRENA, 2016).
Page 17
Optimisation Of Offshore Wind Floater From Dynamic Cable And Mooring Prospective 6
Table 2.2 Strengths and weaknesses of Semi-submersible
Strengths:
Flexible application due to the ability to operate in shallow water depths up to 40m
Low vessel requirement (only basic tug boats required)
Onshore turbine assembly
Amenable to port-side major repairs
Lower installed mooring cost
Weaknesses:
High structural mass to provide sufficient buoyancy and stability
Complex steel structures with many welded joints can be difficult to fabricate
Potentially costly active ballast systems
Tendency for higher critical wave-induced motions
2.2.1.3 Tension Leg Platform
The Tension Leg Platform (TLP) is a semi-submersible buoyancy structure with a tensioned
mooring line and by using suction or pile anchors the tensioned mooring line are anchored to
the seabed. The shallow draft and tensile stability allow smaller and lighter structures to design
but will result in increased stress on the mooring line and anchors. TLP can operate at depths
of 50 to 250 [m], which is advantageous because TLP can be deployed in shallow water. Both
strengths and weakness are shown in Table 2.3 (Rhodri, 2015; IRENA, 2016).
Table 2.3 Strengths and weaknesses of tension leg platform
Strengths:
Low structural mass
Onshore turbine assembly
Few moving parts
Can be used in depths from 50m
Excellent stability due to tendency for lower critical wave-induced motions
Weaknesses:
High loads on the mooring and anchoring system
Higher cost for installation of mooring lines
Uncertainty about impact of possible high-frequency dynamic effects on turbine
Challenging installation process
Special purpose installation barge may be required
Page 18
Optimisation Of Offshore Wind Floater From Dynamic Cable And Mooring Prospective 7
2.2.2 Leading Technology Types For Floating Offshore Wind Power
In this section, the operational and planned floating wind projects will be discussed.
2.2.2.1 Hywind
Hywind is based on the spar buoy design, and gravity provides great stability. The first full-
scale turbine was installed in 2009, named Hywind Demo. The demonstration unit has a 2.3
MW turbine with a blade diameter of 85 meters, which has generated more than 40 GWh of
electricity since its start-up. It has experienced a maximum wind speed of 40 [m/s] and 19 [m]
wave height. In 2019, it was sold to Unitech to test high-voltage cables that power offshore
installations. In 2017, the Hywind Scotland pilot project was installed, which is the successor
to the Hywind demo and shown in Figure 2.3. The farm consists of 5 floating turbines; each
produces 6 MW and 33 kV transmission voltage (Equinor, n.d.).
Currently, Hywind Tampen is under development. It is scheduled to start in the third quarter
of 2022. The wind farm is planned to consist of 11 units with a total capacity of 88 MW, and
it will be located about 140 kilometres from the coast of Norway. The water depth of the wind
farm site is between 260 m and 300 m (Equinor, n.d.).
Figure 2.3 Hywind Scotland Pilot Project (2017)
Available from https://techxplore.com/news/2017-10-turbines-coast-scotland-renewable-energy.html
[Accessed on 22nd August 2021]
Page 19
Optimisation Of Offshore Wind Floater From Dynamic Cable And Mooring Prospective 8
2.2.2.2 Gicon -SOF
GICON®-SOF has significant advantages over other floating sub-structure types (such as
semi-submersible buoys or spar buoys). In order to support turbines of 6 to 10 MW, the semi-
submarine will have huge external dimensions. This greatly reduces the number of possible
manufacturing locations. The spar float is very slender, but it requires a very large draft
(~100m) to stabilize the 6 MW turbine. This makes manufacturing and transportation, and
installation (T&I) particularly difficult. Unlike semi-submarine or spar, TLP is connected to
the seabed with a tensioned mooring rope. The buoyancy of the structure is much greater than
its weight, resulting in a strong upward force. The entire structure becomes firmly supported
by tightening the mooring equipment, thus forming a very strong system that can withstand
even the harshest weather conditions. The operation depth of the GICON-SOF's is expected to
be between 40 [m] and 250 [m] . The GICON SOF is still in research and development phase
and the Figure 2.4 show’s evolution of the technology since 2009 (left-hand side) until today
(right-hand side). (Gicon-sof, n.d.).
Figure 2.4 GICON – SOF technology
Available from http://www.gicon-sof.de/en/development-history.html
[Accessed on 22nd August 2021]
2.2.2.3 BW Ideol (Floatgen: Damping Pool Floating Foundation)
Floatgen is France's first offshore wind turbine led by BW Ideol, shown in the Figure 2.5.
Floatgen has a damping pool floating foundation (36 square meters, draught of 7.5 meters), and
it’s the world's first floating barge designed for offshore wind. It is equipped with a 2 megawatt
wind turbine and installed off the coast of Le Croisic at water depth 33 [m]. It was
commissioned in mid of 2018, and it has sets a new record in 2020 by producing 6.8 GWh, for
a total of 12.8 Gigawatt hour (GWh) in two years (BW Ideol, n.d.). BW IDEOL's second
project is HIBIKI. It is a Japanese demonstration project with a capacity of 3 MW. It was
Page 20
Optimisation Of Offshore Wind Floater From Dynamic Cable And Mooring Prospective 9
installed in 2018 at a water depth of 55 m in Kitakyushu, Japan (BW Ideol, n.d.). The third
project led by BW IDEOL is the Eolmed project, which is expected to commission in 2023.
The project has planned to generate 30 MW of power at 55 m water depth in Occitanie, France
(BW Ideol, n.d.).
Figure 2.5 BW Ideol – Floatgen
Available from https://www.bw-ideol.com/en/floatgen-demonstrator
[Accessed on 22nd August 2021]
2.2.2.4 WindFloat
Principle Power Inc. implemented the WindFloat project. In October 2011, the first full-scale
2 MW WindFloat prototype was deployed 5 kilometers off the coast of Agusadura, Portugal,
with a water depth of 40-50 meters is shown in Figure 2.6. The structure is fully assembled and
commissioned on shore, and then towed along the Portuguese coast for about 400 kilometers
(from the assembly plant near Setúbal, Portugal). So far, the system has generated more than
16 GWh of electricity, which is transmitted to the local grid via submarine cables. In July 2016,
FOWT was decommissioned and towed back to shore, becoming the first decommissioned
floating offshore wind turbine (Principle Power , n.d.). Due to the success of the WindFloat
prototype, it is planned to expand the project in the United States (Oregon, 30 MW; Hawaii, 2
x 408 MW), Scotland (Kincardine, 48-50 MW) and Portugal (Agu in the next 5-10 years.
Sadura, 25 MW) (Rhodri, 2015).
Page 21
Optimisation Of Offshore Wind Floater From Dynamic Cable And Mooring Prospective 10
Figure 2.6 WindFloat
Available from https://www.offshore-mag.com/renewable-energy/article/14188688/windfloat-
atlantic-represents-major-offshore-wind-milestone [Accessed on 26th August 2021]
2.2.2.5 Fukushima Forward
Fukushima FORWARD project is a floating offshore wind farm demonstration project funded
by the Ministry of Economy, Trade and Industry. In this project, three floating wind turbines
and one floating power sub-station have been installed off the coast of Fukushima. The first
phase of the project completed, consisting of the 2MW floating wind turbine (Fukushima
Mairai) as shown in Figure 2.7, the world first 25MVA floating substation(Fukushima Kizuna),
and submarine cable was completed in 2013. In the second phase, installing the 7MW floating
wind turbine, (Fukushima Shimpuu), was completed in June of 2015. The 5MW floating wind
turbine (Fukushima Hamakaze) has been installed in the summer of 2016 (Fukushima
FORWARD, 2014).
Figure 2.7 Fukushima Mirai 2MW FOWT
Available from https://www.mhi.com/news/131111_2en.html [Accessed on 22nd August 2021]
Page 22
Optimisation Of Offshore Wind Floater From Dynamic Cable And Mooring Prospective 11
3 SUBMARINE POWER CABLE
In recent years, the amount and size of installed offshore wind farms have increased rapidly,
and bigger farms are planned. Submarine cables are essential part of this development where
they are used as array cables between the generators, as export cables to attach the offshore
generation farms with the onshore transmission grid and whilst a part of interconnections
between different synchronous systems, countries. In this chapter the first section covers the
generic static cable types, which are widely used for offshore wind power generation in fixed
foundation, and the next section covers the design of dynamic power cable and it current
configuration with related components.
3.1 Generic Static Cable Type
In this section, the generic cable types, which are widely used for offshore wind power
generation in fixed foundation are discussed based on the Technical Broacher: CIGRE TB 610
- Offshore generation cable connections (JENSEN, 2015).
3.1.1 Array Cables
Individual turbines are connected using these cables. The array cable from the turbine is
connected to the offshore substation (if present). Inter-array cables, field cables, and collector
cables are all terms used to describe array cables. The array cable is a three-core AC cable as
shown in Figure 3.1 and it has a rated voltage up to 36 kV under all known conditions. It is
generally considered that medium-voltage submarine cables with a rated voltage less than or
equal to 36 kV do not require a metallic waterproof layer. Steel wire armour is used to array
cables to increase tension and provide mechanical protection. It is important to consider the
array layout for conductor and cable size, as it depends on the number of turbines in the offshore
wind farm. The array cable are usually pulled into the turbine towers within the elbow steel J-
tubes.
Page 23
Optimisation Of Offshore Wind Floater From Dynamic Cable And Mooring Prospective 12
Figure 3.1 Three core Array Cable
Available from https://www.researchgate.net/publication/338388640_CIGRE_TB_610_-
_Offshore_generation_cable_connections (Page: 69) [Accessed on 26th August 2021]
3.1.2 High Voltage AC And DC Export Cables
The medium voltage array cable function as an export cable if there is no offshore sub-station.
In that case, the carry cables collect the power from a group of turbines and transport it to the
onshore substation. If there is an offshore substation, the high voltage AC export cable
transports the collected power from the offshore substation to the onshore substation or to an
offshore HVDC converter station. Export cables are usually three-core AC cables, as shown in
Figure 3.2. The export cables operate at around 145 kV AC, with some systems having up to
245 kV system voltage.
Figure 3.2 High voltage AC three core export cable
Available from https://www.researchgate.net/publication/338388640_CIGRE_TB_610_-
_Offshore_generation_cable_connections (Page: 69) [Accessed on 26th August 2021]
Because they transport electricity to shore, high-voltage DC cables are also called output
cables. However, they form their group because they are fundamentally different from high-
voltage AC output cables. The offshore AC/DC converter station is connected to the onshore
Page 24
Optimisation Of Offshore Wind Floater From Dynamic Cable And Mooring Prospective 13
AC/DC converter station through a high-voltage DC output cable. As shown in Figure 3.3, they
are usually single-core cables with an extruded insulation layer and a metal radial waterproof
layer. The circuit consists of two cables, usually installed in bundles. HVDC cables with a large
amount of impregnated paper or PPL insulation are also suitable for HVDC output.
Figure 3.3 High voltage DC single core export cable
Available from https://www.researchgate.net/publication/338388640_CIGRE_TB_610_-
_Offshore_generation_cable_connections (Page: 69) [Accessed on 26th August 2021]
3.1.3 Difference Between AC Cable And DC Cable
The key difference between cable types is whether they carry alternating current (AC) or direct
current (DC). DC cables are sometimes laid as a pair of separate cables with just one conductor
each. Although AC cables have three conductors, each of which transports current at a different
phase. Since power generated in AC, AC cables are the most common cable used in offshore
wind energy production. DC cables transmit electricity with fewer delays, but they are only
used where vast quantities of energy must be transmitted over long distances to justify the cost
of power transfer devices. The number of DC power solutions is projected to increase as
potential windfarms expand in capability and move further offshore.
3.2 Dynamic power cable
In this section, the design of dynamic power cable and it current configuration and related
components discussed.
3.2.1 Design Elements of Dynamic Power Cables
The design elements of the medium-voltage and high-voltage dynamic power cables are not
significantly different from those of the submarine power cables. Currently, all dynamic power
cord designs are three-core cable.
Page 25
Optimisation Of Offshore Wind Floater From Dynamic Cable And Mooring Prospective 14
The medium voltage dynamic power cable has a wet design and are smaller in size, and it must
face more and more minor design challenges than the high voltage dynamic cable. The first
significant difference between the design elements of medium-voltage submarine cables and
power cables is that the medium voltage power cables have double armour. Due to dynamic
applications, an additional layer of armour wire is added to increase torsional stiffness. The
second difference is the cross-sectional area of the conductor, which is more significant than
submarine power cables due to thermal limitations at the bend stiffener. By increasing the
cross-sectional area of the conductors, the induced heat is reduced, solving the thermal problem
of the cable.
3.2.2 Typical Cable Cross Section
The typical cross section is shown in Figure 3.4 and the cable elements are discussed majorly
based on the Technical Broacher: CIGRE TB 610 - Offshore generation cable connections
(JENSEN, 2015).
Figure 3.4 Typical Dynamic cable cross-section
Available from https://www.researchgate.net/figure/3-TYPICAL-CROSS-SECTION-FOR-A-
DYNAMIC-CABLE_fig22_338388640 [Accessed on 27th August 2021]
3.2.2.1 Metallic Screen And Metallic Sheath
This metallic layer is applied over the insulation screen (over proper semi-conductive bedding)
as shown in the Figure 3.4. It acts in normal operating conditions as a return path for both
capacitive charging currents and induced currents. In the event of an electrical failure, this
Page 26
Optimisation Of Offshore Wind Floater From Dynamic Cable And Mooring Prospective 15
metallic screen can also carry zero-sequence short circuit currents. A lead sheath is not
recommended for dynamic cables since it is highly prone to fatigue issues.
3.2.2.2 Core Sheath
Depending on the insulation material, a layer of thermoplastic material can be extruded over
the metallic screen for extra protection as shown in Figure 3.4. This sheath can be made of
medium density polyethylene (MDPE) coloured black. The electric phases should be identified
by marking each core's specific ID (colour or number).
3.2.2.3 Bedding Layer
To achieve a circular cable cross-section, the three cores and any extra parts (e.g. fiber optic
cables) are built up together, and the interstices are filled with suitable fillers. Over this core, a
constantly extruded thermoplastic material might be used. If the free span between the hang-
off connector and the entrance into the wind turbine is not shielded from direct sun radiation,
the thermoplastic material should have UV protection. The material should also be able to
withstand exposure to seawater. The thickness of this sheath should be adequate to allow proper
radial compression distribution by the armour wire layers placed over it. The coefficient of
friction between the sheath and the sheaths of the electric cores and other components (optical
fibre cable, fillers, etc.) should be reduced to release axial tensions during bending.
3.2.2.4 Armour
Typically, the installation water depth and other installation issues drive the armour design for
static submarine cables specific for each project. For dynamic submarine cables, this concept
changes radically. The armour design must address the same installation issues as for the static
cables, and at the same time, satisfy all of the post-installation dynamic loads experienced by
the free span between the floating generator/platform and the touch-down point (TDP).
Static submarine cables designed for shallow waters usually require single layer armour. The
twisting action induced by the single layer of stranded wires prompts a significant load transfer
to the inner core for higher axial loads. Two or more contra-helically wound layers of stranded
armour wires need to be applied to counteract the
Dynamic cables hanging off a floating generator/platform should have at least a double layer
armour. The cable design should be torque balanced, and such behaviour verified during the
Page 27
Optimisation Of Offshore Wind Floater From Dynamic Cable And Mooring Prospective 16
type test. For a less demanding tensile performance, thermoplastic filler rods can replace a few
metallic wires.
3.2.2.5 Outer Serving
A layer of thermoplastic material may be continuously extruded over the armour. This layer
may provide additional corrosion protection, especially in the splash zone. The outer serving
should have a high-visibility colour to assist the underwater operations during the cable
installation.
3.2.3 Catenary Cable Configuration
In this section, the four catenary cable configuration for dynamic power cable is discussed and
are shown in Figure 3.5. The final configuration for the cable section between the seabed and
the floating platform is defined by the magnitude of the movements of the later and restrictions
settled by the position of the mooring lines.
Figure 3.5 Catenary cable configuration: From top left a) Free-hanging; a) Lazy wave; c) Steep wave;
d) Tethered wave
Available from https://corewind.eu/wp-content/uploads/files/publications/COREWIND-D3.1-
Review-of-the-state-of-the-art-of-dynamic-cable-system-design.pdf [Accessed on 27th August 2021]
Page 28
Optimisation Of Offshore Wind Floater From Dynamic Cable And Mooring Prospective 17
3.2.3.1 Free-hanging
The free-hanging configuration is the trouble-free configuration, and this configuration needs
minimal subsea infrastructure and is the easiest one to be installed. The line is spread in a
catenary shape from the floating structure to the seabed as shown in Figure 3.5 (a). This
configuration is the lowest cost cable solution and suitable for minimal dynamic motion. There
some disadvantages in this system, they require some bend controller at the entrance of the
floating structure, floater motion can not be decoupled and there will be no lateral motion
restriction. Both advantages and disadvantages can be in Table 3.1.
Table 3.1 Advantages and Disadvantages of free hanging
Strengths Weaknesses
Simplest configuration Vessel motion are not decoupled
No restriction of lateral motion
Likely to require a bend control at the
floating structure entrance
3.2.3.2 Lazy Wave
The lazy Wave configuration is used commonly in moderately harsh environmental conditions.
In this configuration, to provide a lift to the cable at a midwater section a distributed buoyancy
modules are attached as shown in Figure 3.5 (b). It is a low-cost cable solution suitable for
applications that require reasonable dynamic motion. If the distance between the floating
structure and the touchdown point is very limited, and strong currents cause touchdown
migration, it may not be appropriate. Both advantages and disadvantages can be in Table 3.2.
Table 3.2 Advantages and Disadvantages of lazy wave
Advantages:
Simple configuration
Buoyant section which decouples reasonable dynamic FOWT motions from fixed
subsea end
Accommodates reasonable levels of marine growth relative to depth. For shallow
waters it may be possible to accommodation higher levels of marine growth by
adding buoyancy modules during the lifetime of the system.
Proven use for deep water application.
Disadvantages:
No restraint on lateral motion
Change in configuration shape with marine growth
Requirement for a bend control at the floating structure entrance
Requirement for Buoyancy modules
Page 29
Optimisation Of Offshore Wind Floater From Dynamic Cable And Mooring Prospective 18
3.2.3.3 Steep Wave
A steep wave is like a lazy wave configuration, but a subsea base and bend stiffener are added
to connect the cable vertically to the top face of a seabed junction as shown in Figure 3.5 (c).
Near the seabed end of the cable, it also has buoyancy modules attached. . Both advantages and
disadvantages can be in Table 3.3.
Table 3.3 Advantages and Disadvantages of steep wave
Advantages:
Buoyant section which decouples FOWT motions from fixed subsea end but subsea
base and bend stiffener limiting vessel motions
Limited changes in configuration shape with reasonable levels of marine growth
Subsea base reducing excursions under cross current
Reduced distance between floating structure and seabed termination point required.
Disadvantages:
Requirement for a bend control at the floating structure entrance and subsea base
connection point.
Requirement for Buoyancy modules
3.2.3.4 Pliant Wave (Tethered Wave)
The tethered wave configuration is similar to a lazy wave. A buoyancy module section is
attached to the cable at midwater and has a tether restraining at the touchdown point Figure 3.5
(d). Both advantages and disadvantages can be in Table 3.4.
Table 3.4 Advantages and Disadvantages of tethered wave
Advantages:
Buoyant section which decouples FOWT motions from fixed subsea end
Tether reducing touchdown point migration under cross current
Accommodates reasonable levels of marine growth relative to depth.
For shallow waters you can accommodate higher levels of marine growth without the
need for adding extra buoyancy modules during the lifetime of the system.
Disadvantages:
Requirement for hold-down tether and clamp which will increase complexity and
time of installation.
Requirement for a bend control at the floating structure entrance
Requirement for Buoyancy modules
Page 30
Optimisation Of Offshore Wind Floater From Dynamic Cable And Mooring Prospective 19
3.2.4 Related Components
The components that are involved in the dynamic power cable configuration can be found in
Figure 3.6. Below the most important components along with their characteristics are
discussed.
Figure 3.6 Dynamic cable related components
Available from https://www.nrel.gov/wind/newsletter-202102.html [Accessed on 22th August 2021]
3.2.4.1 Transition Joint
The transition joint is attached to the seabed and provides a smooth connection between the
static submarine power cable and dynamic power cable. The joint is made flexible to deal with
the dynamic motions of the dynamic cable. The transition joints it consists of (Erik Eriksson,
2011):
• Three flexible molded core joints to provide the connection for each phase. These core joints
are covered by a lead sheath and soldered to the metallic sheath of both the static and dynamic
power cable
• One fiber-optical cable joint
• Armoring
3.2.4.2 Bend Restrictors
The bend restrictors are attached at bottom part near to the transition joint on the seabed. Two
bend restrictors are attached one on the dynamic cable and other one the static cable as shown
Page 31
Optimisation Of Offshore Wind Floater From Dynamic Cable And Mooring Prospective 20
in Figure 3.6. The main function of the bend restrictors is to protect the cable from over bending,
whereas fatigue is less of a concern compared to dynamic stiffeners.
3.2.4.3 Bend Stiffener
At the top part, a dynamic bending stiffener is mounted to cope with heavy axial loads and
curvatures to avoid over bending and fatigue failure. In Figure 3.7, a drawing of a dynamic
bend stiffener is shown. A bend stiffener has a conical body with an axial opening for the cable
inlet. An internal steel work is mounted to the stiffener to transfer the induced loads to the
floating structure.
Figure 3.7 Bend Stiffener
Available from https://www.researchgate.net/publication/338388640_CIGRE_TB_610_-
_Offshore_generation_cable_connections (Page: 69) [Accessed on 26th August 2021]
On top of the stiffener a flange is added in order to connect the stiffener to the floating structure.
The stiffener provides a smooth transition between the floating installation and the dynamic
cable with low stiffness. The bend stiffener is made to increase the local stiffness gradually and
to keep the stresses and curvatures of the cable between acceptable bounds. Instead of a bent
stiffener, a bell-mouth (trumpet termination of I-tube) could be used. It can be a safer and less
expensive option for narrower array cables.
3.2.4.4 Buoyancy Modules
Buoyancy modules are essential for the dynamic power cable, since they enable motion
decoupling between the floating installation and the touchdown point on the seabed. Buoyancy
module attachments will likely be required to achieve the required shape for the extra-length
of cable several equally spaced buoyancy modules need to be installed on the cable. Buoyancy
Page 32
Optimisation Of Offshore Wind Floater From Dynamic Cable And Mooring Prospective 21
modules are made of syntactic foam and consists of two main components which are the
internal clamp and the external buoyancy modules which are two identical halves attached to
the internal clamp as shown in the Figure 3.8. Internal clamps must be carefully constructed to
prevent slippage, high generated stresses in the armour, and damage to the sheath, which might
result in water intrusion inside the cable. External buoyancy modules' diameter, submerged
weight, and spacing must all be carefully considered. These variables affect the dynamic cable's
buoyancy, which might result in an undesirable configuration at the hang-off, arch bend, and
touchdown point.
Figure 3.8 Buoyancy modules
Available from https://www.balmoraloffshore.com/solutions/buoyancy/distributed-riser-buoyancy
[Accessed on 27th August 2021]
Page 33
Optimisation Of Offshore Wind Floater From Dynamic Cable And Mooring Prospective 22
4 ORCAFLEX
The description of the OrcaFlex software and the related theory implemented in this study is
provided in this section. Main reference used for this Section is Orcaflex manual (OrcaFlex, 2021).
4.1 Description
OrcaFlex is an marine dynamics software package developed by Orcina Ltd. The software can
perform static and dynamic analysis in the time domain and frequency domain for various
offshore systems including mooring. It has an extensive 3D graphical interface and uses graph
to better understand the problem.
It can simulate the movement of a slender element and use the Morison method to calculate the
wave load acting on it. For larger structural motions, hydrodynamic data must be provided as
input based on RAO, QTF, additional mass, damping, stiffness, mass, and inertia of the
software based on radiation diffraction analysis. Compatible with OrcaWave, Ansys Aqwa,
WAMIT, MOSES, Hydrostar, WADAM and other software to import data. According to the
input, the first-order and second-order wave forces can be calculated separately. Although it
adopts the analysis-based methods proposed in the design standards including current and wind
loads.
OrcaFlex provides options to implement user-defined environmental conditions (such as wave,
wind, and ocean current data). Different wave types such as regular waves and irregular waves
can be simulated. Regular waves defined by the following options: Airy, Dean, Stokes' 5th or
cnoidal. These are various wave theories for regular linear (Airy) waves and nonlinear waves.
Irregular waves are defined by the following options: JONSWAP, ISSC (also known as
Bretschneider or modified Pierson-Moskowitz), Ochi-Hubble, Torsethaugen, Gaussian
dilation, or user-defined spectrum, which are various different spectrums of random waves
(OrcaFlex, 2021)
Page 34
Optimisation Of Offshore Wind Floater From Dynamic Cable And Mooring Prospective 23
4.2 Line Theory
OrcaFlex uses a finite element model for a line, as shown in the Figure 4.1. This line is divided
into a series of line segments, which are then modelled by straight-line massless model
segments, with a node at each end.
Figure 4.1 OrcaFlex line model
Available from https://www.orcina.com/webhelp/OrcaFlex/Default.htm [Accessed on 26th August
2021]
The node represents the two half-line segments on both sides of the node and defines the mass,
weight, buoyancy and resistance properties of the line segment. Forces and moments are
applied to the nodes, and the line segment is a massless element, only the axial and torsional
characteristics of the line are modelled. It is conceivable that these are composed of two coaxial
telescopic rods, connected by axial and torsion spring dampers. The rotational spring dampers
at each end of the segment represent the bending properties, shown in Figure 4.2
Page 35
Optimisation Of Offshore Wind Floater From Dynamic Cable And Mooring Prospective 24
Figure 4.2 Detailed representation of OrcaFlex line model
Available from https://www.orcina.com/webhelp/OrcaFlex/Default.htm [Accessed on 26th August
2021]
4.3 Static Analysis
The main aim of the static analysis is to find the equilibrium configuration of the system under
loads applied on it, which will also be the starting point of the dynamic analysis. If the system
is linear, then the equilibrium configuration can be calculated directly with a single matrix
solution; however, in practice, the OrcaFlex model is always nonlinear, so the calculation of
statics requires a multi-dimensional iterative of Newton's method. .The iterative stages in which
OrcaFlex determines the static equilibrium are given below:
1. Fixes the degrees of freedom (DOF) of all objects except lines (such as buoys, vessel,
constraints, etc.)
2. Calculate line statics to determine the equilibrium configuration of all lines (itself is a
two-step iterative process)
3. Release all degrees of freedom and use Newton's method to perform a full system static
analysis of the entire system. The initial guess of the iteration comes from the first two
stages.
Page 36
Optimisation Of Offshore Wind Floater From Dynamic Cable And Mooring Prospective 25
4.4 Dynamic Analysis
The main purpose of dynamic analysis is to obtain the behaviour and response of the system
under time-varying loads. It starts from a static analysis that is constant over time. OrcaFlex
provides two options for solving dynamic analysis: time domain and frequency domain.
4.4.1 Time Domain
Time domain analysis is completely non-linear. Evaluates mass, damping, stiffness, load, etc.
at each time step, while considering instantaneous and time-varying geometry. The equation of
motion that OrcaFlex solves in the time domain is shown in Eq. 1.
𝑀(𝑝, 𝑎) + 𝐶(𝑝, 𝑣) + 𝐾(𝑝) = 𝐹(𝑝, 𝑣, 𝑡) (1)
Where,
𝑀(𝑝, 𝑎) :the system inertia load
𝐶(𝑝, 𝑣) : the system damping load
𝐾(𝑝) : the system stiffness load
𝐹(𝑝, 𝑣, 𝑡) : the external load
𝑝, 𝑣 and 𝑎 are the position, velocity and acceleration vectors respectively
𝑡 : the simulation time.
It implements two integrated schemes for solving time domain analysis: explicit and implicit.
Both schemes recalculate the system geometry at each time step, so the simulation fully
considers all nonlinearities. The semi-implicit Euler with a constant time step is used for the
explicit scheme, and the implicit integration uses the generalized α-integration scheme. For
these two schemes, the initial positions and directions of all nodes are derived from static
analysis, and forces and moments are calculated. In the explicit scheme, the local motion
equation solves for the acceleration vector at the beginning of each time step. Then use semi-
implicit Euler integration to integrate the equation. In the implicit scheme, it is solved at the
end of each time step of the system equation.
Page 37
Optimisation Of Offshore Wind Floater From Dynamic Cable And Mooring Prospective 26
4.4.2 Frequency Domain
Frequency domain analysis is linear. The frequency domain solver approximates any existing
nonlinearity to linearity in a process called linearization. The frequency domain solver is
designed to solve the dynamic response of the system at wave frequency or low frequency,
which is determined by the solution frequency specified by the user.
The response at wave frequency is defined as the response of the system subjected to the first-
order dynamic load associated with the random process of wave elevation. The low-frequency
response is defined as the system's response to the second-order wave drift dynamic load
related to the wave height random process and the wind dynamic load related to the wind speed
random process at the same time.
Page 38
Optimisation Of Offshore Wind Floater From Dynamic Cable And Mooring Prospective 27
5 MODEL SETUP
In this section, four catenary cable configurations are modelled and the initial stage of static
analysis is performed on specific cable properties. According to this analysis, one of the four
configurations is used for further optimization.
5.1 Floating Platform And Dynamic Cable Properties
A semi-submersible platform with a total length and width of 40 [m], a depth of 45 [m], and a
draft of 30 [m] has been considered. The OrcaFlex model is shown in Figure 5.1. The main
parameters for the dynamic cables are the minimum breaking load and maximum bending
moment, this and other mechanical properties of the dynamic cable used in this work are shown
Table 5.1.
Figure 5.1 Semi-Submersible platform: OrcaFlex model
Table 5.1 Dynamic power cable properties
Outer Diameter of cable 0.281 [m]
Weight of cable in air 148 [kg/m]
Weight of cable in water 85 [kg/m]
Minimum breaking load 2720 [kN]
Maximum handling tension 1150 [kN]
Minimum allowable bending radius (MBR) 6 [m]
Axial stiffness 4*105 [kN]
Torsional stiffness 60 [kN.m2/rad]
Bending stiffness 80 [kN.m2]
Maximum bending moment 13.33 [kN.m]
Page 39
Optimisation Of Offshore Wind Floater From Dynamic Cable And Mooring Prospective 28
5.2 Initial Catenary Cable Modelling
The static analysis considers the following scenarios: The dynamic cable is suspended at a
fixed point 30 [m] below sea level. This value corresponds to the draft of the semi-submersible
platform considered in this work.
Figure 5.2 Catenary configuration OrcaFlex model
Four different catenary configurations are setup in OrcaFlex, as shown in Figure 5.2. In
addition to free suspension, the buoyancy module is connected to a dynamic cable
configuration. In the tether wave, a tether is attached before the landing point, with an
unstretched length of 10 [m] and stiffness of 1000.00 [kN]. Since OrcaFlex uses the finite
element method to model dynamic cables, the discretization of the cables is called the target
segment length (TSL), which is used to consider the 1 [m] complete analysis of the TSL. Each
configuration has a different section length, as shown in the buoyancy module properties in
Table 5.2 and Table 5.3.
Table 5.2 Dynamic cable section length
Catenary
Configuration
Section Length [m]
DC 1 DC with Floater DC2 Total Length
Free Hang 320 0 0 320
Lazy wave 90 50 100 240
Steep wave 90 50 25 165
Tethered wave 90 50 100 240
Page 40
Optimisation Of Offshore Wind Floater From Dynamic Cable And Mooring Prospective 29
Table 5.3 Buoyancy module properties
Buoyancy module
Diameter [m] 2
Pitch [m] 10
Mass [te] 1.25
Displacement [kN] 30.95
Weight in water [kN] -18.63
5.3 Result: Initial Modelling
The two main parameters of a dynamic cable are the bending moment and the effective tension.
For the four catenary configurations, the values obtained for these parameters from the initial
analysis of the entire section length are shown in Figure 5.3 and Figure 5.4.
Figure 5.3 Bending Moment for four Catenary cable configuration
Page 41
Optimisation Of Offshore Wind Floater From Dynamic Cable And Mooring Prospective 30
Figure 5.4 Effective Tension at End A for four Catenary cable configuration
Table 5.4 shows the maximum bending moment and effective tension of the entire cross-
sectional length of the cables for the four configurations.
Table 5.4 Maximum Bending moment and Tension for four catenary configurations
Configuration/Parameters Max. Bending
Moment [kNm]
Max. Tension
[kN]
Free Hang 1.1 115.43
Lazy wave 3.3 62.07
Steep wave 3.6 60.29
Tethered wave 3.3 62.07
It can be clearly seen from the Table 5.4 that the free suspension structure has the minimum
bending moment and maximum effective tension at End A (fairlead point). The maximum
bending moment and minimum tension are in the steep wave configuration. In the lazy and
tethered wave configurations, there are the same amount of bending moment and effective
tension. This is because they replicate the same layout configuration, and the additional tether
is connected to the tether wave configuration, which does not affect any of these parameters.
From this preliminary analysis, it is found that the free suspension configuration is not suitable
for long-term service of 25 to 30 years because the maximum tension is observed in the initial
stage of the study. At this time, for the analysis environmental load is not considered but in
real-time due to the dynamics of the float exercise it may cause fatigue failure.
Page 42
Optimisation Of Offshore Wind Floater From Dynamic Cable And Mooring Prospective 31
Therefore, comparing the other three configurations, the lazy wave configuration is selected,
because this is mainly used in harsh environments and has minimal accessories, namely,
bending stiffeners and buoyancy modules. Additionally, in steep waves, it needs a bend
controller at the connection point of the subsea base, and in tethered waves, it needs fixed
tethers and clamps, which will increase the complexity and time of installation.
Page 43
Optimisation Of Offshore Wind Floater From Dynamic Cable And Mooring Prospective 32
6 OPTIMIZATION OF THE CATENARY CABLE CONFIGURATION
In this section, the lazy wave configuration is subjected to sensitivity analysis to obtain the best
cable configuration, which will be used as the primary model for dynamic analysis. This
sensitive static analysis is performed by optimizing the section length of the dynamic cable and
optimizing the buoyancy module. The Excursion analysis is performed to study the behaviour
of the cable when the float drifts and the influence of the length of the bending stiffener.
6.1 Buoyancy Module
The buoyancy module is modeled in OrcaFlex. A new cable type is setup, its properties are
equivalent to the combination of a dynamic cable and a float. This is achieved by evenly
distributing the buoyancy and drag of each buoy on the length of the line from sf/2 before the
center of the buoy to sf/2 after the center of the buoy, where sf is the float pitch i.e., the spacing
between float centers shown in Figure 6.1. The outer diameter and mass per unit length of the
new cable are obtained by evaluating Eq.2 and Eq. 3 (OrcaFlex, 2021)
Figure 6.1 Float pitch
𝑂𝐷 = (𝑂𝐷𝑙2 +
4
𝜋
𝑣𝑓
𝑠𝑓)
12
(2)
𝑚 = 𝑚𝑙 +𝑚𝑓
𝑠𝑓 (3)
Page 44
Optimisation Of Offshore Wind Floater From Dynamic Cable And Mooring Prospective 33
Where,
OD: Outer diameter of cable with floater
ODl: Outer diameter of the original cable
vf: volume of the floater
sf: float pitch
m: weight of cable with floater
ml: weight of cable in air/water
mf: weight of floater in air/water
In this analysis, the outer diameter (df) of the buoyancy module is 1 [m] and 1.2 [m], and the
float pitch (sf) distance is 3 [m] and 4 [m]. The characteristics of the floater are shown in Table
6.1.
Table 6.1 Floater properties
Floater Diameter [m] 1 1.2
Floater Length [m] 1
Volume (vf) [m^3] 0.72 1.06
Mass (mf) [te] 0.31 0.45
Displacement [kN] 7.27 10.74
Weight in water [kN] -4.18 -6.30
A dynamic cable with floating characteristics are obtained by evaluating Eq.2 and Eq.3, as
shown in Table 6.2.
Table 6.2 Dynamic cable with floater properties
Float Diameter
[m]
Float Pitch
[m]
Outer Diameter
[m]
Weight in Air
[kg/m]
Weight in water
[kg/mm]
1 3 0.56 226.59 -22.34
4 0.62 252.78 -57.93
1.2 3 0.73 298.86 -129.93
4 0.65 261.15 -76.34
Page 45
Optimisation Of Offshore Wind Floater From Dynamic Cable And Mooring Prospective 34
6.1.1 Result: Buoyancy Module
For the floater dimeter of 1 [m], several sets of static analyses were performed and it is found
that the floater pitch of 3[m] provides the required buoyant force which helps to form the arc
in mid-water level than the floater pitch 4 [m]. It is observed that the bending moment is less
in the float pitch of 3[m]. The layout comparison between pitch of 3 [m] and 4 [m] for floater
diameter 1[m] is shown in the Figure 6.2.
Figure 6.2 Floater diameter 1 [m] with float pitch of 3[m] and 4[m] layout
From the above Figure 6.2 the blue line represents a dynamic cable with a floating pitch of 4
[m]. In this case, the sagging part is only a few meters above the seabed. When the platform
drifts along the positive X direction, the sagging part of the cable will totally come in contact
with the seabed, which may cause the cable to twist and increase the bending moment due to
the compression of the dynamic cable.
Similarly, for a floater diameter of 1.2 [m], several sets of static analysis have been carried out,
and it is found that a float pitch of 4 [m] provides the required buoyancy and helps to form an
arc in the middle of the water level, similarly lift is observed in float pitch of 3 [m].
Nevertheless, the arc height is still close to the draft level in pitch 3[m]. The layout comparison
of the floater diameter of 1[m] with a float pitch of 3[m] and 4[m] is shown in Figure 6.3
Page 46
Optimisation Of Offshore Wind Floater From Dynamic Cable And Mooring Prospective 35
Figure 6.3 Floater diameter 1.2 [m] with float pitch of 3[m] and 4[m] layout
From the above Figure 6.3the blue line represents a dynamic cable with a floating pitch of 3
[m]. The suspension part is the place where the buoyancy module is connected. It almost
reaches the draft level of the floating object, which is 30 [m] below sea level. In this case, it
observes the maximum bending moment of the middle arch section (buoyancy module). From
the analysis, it can be concluded that for a float diameter of 1 [m], a float pitch of 3 [m] is
appropriate, and for a float diameter of 1.2 [m], a float pitch of 4 [m] is appropriate. Further
analysis are carried out on this basis.
6.2 Dynamic Cable Length
This analysis aim at determining the optimal dynamic cable length with the least bending
moment in the system. Therefore, using the results obtained from the analysis of the buoyancy
module, different cable length combinations are considered for each float diameter and
analyzed individually.
Table 6.3 Dynamic cable section for floater diameter 1[m] with pitch 3 [m]
Floater Diameter 1 [m] with float pitch 3 [m]
Section Case 1 Case 2 Case 3 Case 4 Case 5
DC [m] 70 80 100 105 110
DC + Floater [m] 80 80 100 100 100
DC [m] 190 190 150 140 130
Total length [m] 340 350 350 345 340
Page 47
Optimisation Of Offshore Wind Floater From Dynamic Cable And Mooring Prospective 36
Table 6.3, the power cable combinations with buoyancy modules of different lengths have a
float diameter of 1 [m] and a float pitch of 3 [m]. The layout is shown in the Figure 6.4.
Figure 6.4 Layout of Dynamic cable with floater diameter 1 [m]
Table 6.4 Dynamic cable section for floater diameter 1.2[m] with pitch 4 [m]
Floater Diameter 1.2 [m] with float pitch 4 [m]
Section Case 1 Case 2 Case 3 Case 4 Case 5
DC [m] 100 100 100 115 115
DC + Floater [m] 50 60 70 85 85
DC [m] 200 190 170 150 140
Total length [m] 350 350 340 350 340
In Table 6.4, the combination and arrangement of different lengths of power cables with
buoyancy modules with a float diameter of 1.2 [m] and a float pitch of 4 [m] are shown in
Figure 6.5.
Page 48
Optimisation Of Offshore Wind Floater From Dynamic Cable And Mooring Prospective 37
Figure 6.5 Layout of Dynamic cable with floater diameter 1.2 [m]
Table 6.5 Maximum bending moment
Floater Diameter [m] Float Pitch [m] Maximum Bending Moment [kNm]
Case 1 Case 2 Case 3 Case 4 Case 5
1 3 3.91 4.47 2.98 2.48 2.06
1.2 4 3.64 3.44 2.48 2.45 1.93
It is seen from Table 6.5 that the minimum bending moment for a float diameter of 1.2 [m] and
a float pitch of 4 [m] is 1.93 [kNm], which is obtained as the maximum value of the entire cable
length of 340 [m] in case 5. When comparing the cross-sectional length of power cables with
floats, a float diameter of 1 [m] requires more sectional length than a float diameter of 1.2 [m],
which is seen from Table 6.3 and Table 6.4. The bending moments obtained by dynamic cables
with a float diameter of 1.2 [m] with a float pitch of 4 [m] in all the five cases mentioned in
Table 6.4 are shown in Figure 6.6. The purple line represents Case 5, which is determined as
the optimal length of the dynamic cable system, therefore it will be used for further dynamic
analysis.
Page 49
Optimisation Of Offshore Wind Floater From Dynamic Cable And Mooring Prospective 38
Figure 6.6 Bending Moment of dynamic cable with floater diameter 1.2 [m]
6.3 Excursion Analysis
The excursion analysis is performed to study the behavior of the dynamic cable when the
floating platform deviates from the target position due to environmental loads to achieve the
best inert wave configuration. In this case, the target position is 0 [m] i.e., the center of the
float, which moves +/- 25 [m] in the X direction with an interval of +/- 5 [m], as shown in
Figure 6.7.
Figure 6.7 Excursion analysis +/- 25 [m]
Page 50
Optimisation Of Offshore Wind Floater From Dynamic Cable And Mooring Prospective 39
The maximum bending moment and effective tension of the moving cable when the float
position is +/-25[m] and the interval is +/-5[m] are shown in Table 6.6.
Table 6.6 Excursion analysis: Maximum Bending Moment and Effective Tension
Cable Parameter/X Axis[m]
-25 -20 -15 -10 -5 0 5 10 15 20 25
Max. Bend Moment [kN.m]
0.65 0.94 1.19
1.44
1.68
1.93
2.18
2.44
2.72
3.02
3.35
Max. Tension at End A [kN]
132.69
105.41
93.2
86.19
81.63
78.4
75.99
74.12
72.63
71.42
70.41
It can be seen from the above Table 6.6, that when the float drifts near the touch down point
i.e., along the positive X direction, the bending moment of the sagging part of the cable
increases, because in this area, the cable is subjected to lower tension, But as the catenary angle
is minimized, the effective tension at the end A is decreasing. Conversely, when the float drifts
away from the touch down point i.e., in the negative X direction, the bending moment decreases
with the elongation of the cable, due to the elongation and increase of the catenary angle, the
effective tension increases. Figure 6.8 and Figure 6.9 show’s the comparison between the
bending moment and the effective tension of the entire section length of the float position at -
5 [m] and +5[m].
Figure 6.8 Excursion analysis +/- 5 [m]: Bending Moment
Page 51
Optimisation Of Offshore Wind Floater From Dynamic Cable And Mooring Prospective 40
Figure 6.9 Excursion analysis +/- 5 [m]: Effective Tension
6.4 Bend Stiffener
The optimal lazy wave configuration is analyzed to study the influence of different bending
stiffener lengths. For this analysis, the modeling lengths of the curved stiffeners are 3 [m], 5
[m], and 7 [m], the outer diameter is reduced from 0.7 [m] (at end A) to 0.38 [m], a 1200 [kg
/m^3] material density and 45 [Mpa] Young’s modulus. (Reference: Study on the parameters
of the cable system between dynamic arrays of floating offshore wind turbines).
From the analysis, it is found that the maximum effective tension at end A is 78.4 [kN] for all
three bending stiffener lengths, and the maximum bending moment is 1.93 [kNm] for all three
bending stiffener lengths. These maximum values are obtained for the entire cable length, and
the bending of the stiffener will not affect the tension of the dynamic cable.
Page 52
Optimisation Of Offshore Wind Floater From Dynamic Cable And Mooring Prospective 41
Figure 6.10 Bend Stiffener analysis: Bend moment
It can be seen from above Figure 6.10, when the length of the bending stiffener increases, the
bending moment gradually increases. The bending moment for the length of 3 [m] is 0.58
[kNm], the length of 5 [m] is 0.65 [kNm], and the length of 7 [m] is 0.68 [kNm]. Bending
stiffeners will not affect the dynamic cable in the static analysis because the float is the target
location. Nevertheless, it may be different when the floating object undergoes dynamic
movement, so an intermediate length of 5 [m] is connected to the dynamic cable for further
analysis.
6.5 Conclusion
Static analyses has been performed to find the optimal configuration. From this analysis, the
optimal configuration of dynamic cable is to found be: total section length of 340 [m] dynamic
cable including 80 [m] of buoyancy module whose floater diameter is 1.2 [m] with a float pitch
of 4 [m]. In addition, the bending stiffener length of 5 [m] was selected.
Page 53
Optimisation Of Offshore Wind Floater From Dynamic Cable And Mooring Prospective 42
7 DYNAMIC ANALYSIS
In this chapter, a dynamic analysis is conducted for the optimal lazy wave configuration under
specific environmental conditions, and the mooring chain is connected to the buoy. Before
performing a complete dynamic analysis, a preliminary mooring analysis is performed.
7.1 Environment Load
The environmental load conditions of the dynamic analysis are carried out for different wave
directions to obtain the extreme response of the power cable and the mooring system under the
environmental load conditions shown in Table 7.1.
Table 7.1 Environmental Load condition
Load
condition
Load
Case
Wave
Height
Hs [m]
Wave
Period
Tz [sec]
Wave
Type
Current
[m/s]
Normal Sea
State
1
3.5
3
Jonswap
Spectrum 1
2 5.5
3 7
Extreme
Sea state 1 12.1 10.92
Initially, extreme load conditions analysis was performed for 1000 seconds to determine the
optimum mooring system configuration, and then all load conditions were analyzed for 3 hours
to capture all possible extreme sea conditions. Statistically three hours is sufficient to achieve
this goal; in terms of cable mechanical properties, using more will not add any important
insight.
7.2 Mooring Analysis
FOWT's mooring system is one of the main systems that need to be studied in depth, because
it constitutes the main part of the float's drifting motion. The choice of mooring system layout
depends on many criteria, such as the type of floating objects, redundancy, cost and installation
of the mooring system, standards mentioned in the mooring requirements.
In this study, catenary mooring system with 8 mooring line are considered to be the first attempt
at analysis. The scope of this study is to conduct multiple sensitivity analyses to find the best
mooring configuration, using a trial-and-error method. Since it is calculated based on many
assumptions and concepts, it is best to start with the method of determining the optimal
Page 54
Optimisation Of Offshore Wind Floater From Dynamic Cable And Mooring Prospective 43
mooring chain size and mooring length. The 8 mooring lines are connected to the float at 30
[m], the value of which corresponds to the draft of the float. The fixed connection points and
anchor points of each mooring line are shown in Table 7.2, and the mooring arrangement is
shown in Figure 7.1.
Figure 7.1 Mooring system layout
Table 7.2 Mooring line position
Mooring
Line
No:
Platform (Fairlead Point)
[m] Anchored [m]
X Y Z X Y Z
1 -18 17.5 -30 -75 300 0.16
2 18 17.5 -30 75 300 0.16
3 -18 -17.5 -30 -75 -300 0.16
4 18 -17.5 -30 75 -300 0.16
5 -18 17.5 -30 -300 75 0.16
6 -18 -17.5 -30 -300 -75 0.16
7 18 17.5 -30 300 75 0.16
8 18 -17.5 -30 300 -75 0.16
7.2.1 Optimal Mooring Chain Size
The preliminary analysis considers the use of steel grade R4 mooring lines without stud chains.
In order to determine the optimal chain diameter, two diameters need to be considered, namely
100 [mm] and 120 [mm] diameter and their mechanical properties are shown in Table 7.3. This
analysis takes into account a mooring chain length of 320 [m].
Page 55
Optimisation Of Offshore Wind Floater From Dynamic Cable And Mooring Prospective 44
Table 7.3 Mooring chain mechanical properties
Chain Diameter 100 [mm] 120 [mm]
Material Grade R4 Stud-less
Breaking Point 9864.00 [kN] 13570.00 [KN]
Weight in air 1.95 [kN/m] 2.81 [kN/m]
Displacement 0.26 [kN/m] 0.37 [kN/m]
Weight in water 1.70 [kN/m] 2.44 [kN/m]
Diam/Wt ratio 0.11 [m/kN/m)] 0.09 [m/(kN/m)]
The initial analysis was conducted on the extreme sea conditions mentioned in Table 7.1. For
the wave direction from 0° to 180°, the interval is 15°. The dynamic analysis of the mooring
line is carried out for two diameters, and the maximum tension of the mooring line always
appears at the End A (fairlead point) connected to the platform. Therefore, for each considered
chain diameter under extreme sea conditions, the mooring line with the highest tension among
all the other mooring lines is shown in Figure 7.2 for each environmental load directions (i.e.
0° to 180°, interval 15°) considered in the analysis.
Figure 7.2 Mooring chain diameter analysis: Maximum effective tension in mooring line
Page 56
Optimisation Of Offshore Wind Floater From Dynamic Cable And Mooring Prospective 45
As seen from the above figure, the tension of the 120 [mm] diameter chain is slightly higher
than that of the 100 [mm] diameter chain, which is mainly due to the weight of the chain, the
surge, sway and heave movement of the platform. Table 7.4 and Table 7.5 show the effective
tensions of two diameter-mooring lines in all wave directions.
Table 7.4 Mooring diameter 100 [mm]: Maximum tension at End A
Wave
Directi
on
[deg]
Effective tension at End A
Moorin
g 1
Moorin
g 2
Moorin
g 3
Moorin
g 4
Moorin
g 5
Moorin
g 6
Moorin
g 7
Moorin
g 8
0 990.53 781.00 1150.75 1021.26 1808.05 1808.37 1103.22 843.60
15 1050.44 910.94 1108.94 1017.13 1478.85 1832.15 831.52 752.40
30 810.58 1182.88 1238.36 1782.92 1351.28 1930.97 674.18 787.99
45 728.29 902.20 1658.39 1167.20 1249.52 1759.67 744.34 1093.06
60 1267.17 891.20 1939.21 1385.78 991.03 1334.36 800.90 1381.36
75 1163.19 947.53 1849.21 1658.43 782.83 1302.38 871.22 995.68
90 919.88 798.93 1862.39 1788.16 1143.95 1049.49 792.58 875.85
105 946.03 926.58 1566.36 1815.11 963.28 805.08 989.87 1574.95
120 907.48 801.28 1436.61 1848.38 1250.44 959.95 879.24 1337.17
135 845.51 843.03 1362.50 1679.46 981.78 860.12 1132.08 1557.41
150 948.85 862.62 928.43 1297.92 799.61 1675.70 1227.13 1831.52
165 929.91 1300.45 798.16 1189.98 781.18 1381.18 1444.96 1734.04
180 979.48 1133.20 923.93 1223.30 733.51 820.84 1864.99 1876.80
Table 7.5 Mooring diameter 120 [mm]: Maximum tension at End A
Wave
Directi
on
[deg]
Effective tension at End A
Moorin
g 1
Moorin
g 2
Moorin
g 3
Moorin
g 4
Moorin
g 5
Moorin
g 6
Moorin
g 7
Moorin
g 8
0 1193.05 1034.02 950.64 958.67 1824.86 1817.56 953.70 2382.40
15 972.19 921.92 1144.50 1041.61 1418.38 1770.22 1181.67 1445.10
30 1469.38 1006.06 1446.59 1072.23 1259.59 1675.89 1200.26 933.82
45 1015.26 1314.98 1599.18 1233.41 1652.49 1444.19 961.97 1040.72
60 743.94 1646.66 1866.74 1463.50 1107.60 1574.91 870.05 1001.92
75 796.66 916.88 1807.13 1861.23 923.21 2121.48 1009.75 1005.06
90 1079.25 1076.32 1851.87 1802.49 968.58 966.30 1127.41 1221.68
105 775.57 1152.87 1432.94 1760.82 799.90 1394.81 957.52 1788.61
120 847.54 1056.73 1189.45 2072.22 729.55 1139.93 1469.90 1234.27
135 905.56 827.97 1316.29 1765.12 1001.78 1257.60 1349.99 1393.85
150 996.36 1325.49 903.30 1364.08 1534.20 1212.82 1209.92 1694.20
165 1370.46 1182.39 2208.04 1378.75 1063.97 976.88 1716.92 1816.69
180 818.94 1161.93 1096.22 940.83 1158.37 1002.66 2024.63 1719.70
Page 57
Optimisation Of Offshore Wind Floater From Dynamic Cable And Mooring Prospective 46
It can be seen from the above tables that the maximum tension generated by the two mooring
chain diameters under extreme sea conditions is always lower than the allowable breaking limit
in Table 7.3.
Since the tension of the mooring line of the two diameters is within the allowable range, to
determine the optimal chain size, it is necessary to consider the impact of the environmental
load on the floater and the power cable and to conduct further analysis. The maximum bending
moment and effective tension of the power cable and the movement of the platform,
considering the two different mooring diameters are shown in Figure 7.3, Figure 7.4, Figure
7.5, Figure 7.6 and Figure 7.7.
Figure 7.3 Mooring diameter analysis: Maximum bending moment for dynamic cable
Figure 7.4 Mooring diameter analysis: Maximum effective tension at End A for dynamic cable
Page 58
Optimisation Of Offshore Wind Floater From Dynamic Cable And Mooring Prospective 47
Figure 7.5 Mooring diameter analysis: Maximum effective tension at touch down point (TDP) for
dynamic cable
Figure 7.6 Mooring diameter analysis: Maximum surge movement of the floater
Page 59
Optimisation Of Offshore Wind Floater From Dynamic Cable And Mooring Prospective 48
Figure 7.7 Mooring diameter analysis: Maximum heave movement of the floater
The above Figure 7.6 clearly shows that a mooring chain with a diameter of 100 [mm] cannot
control the surge movement of the platform. A maximum surge of 20.28 [m] was noticed at a
wave direction of 0° (that is, the wave heading in positive X direction) and 19.17 [m] in wave
direction 180° (that is, the wave heading in negative X direction). This movement has a
significant impact on the dynamic cable system, in terms of the bending moment and effective
tension of the cable. It can be seen from Figure 7.3 that when the wave direction is 0°, the
maximum bending moment on the power cable is 8.95 [kNm]. From Figure 7.4, the maximum
tension at end A at 180° in the wave direction is 184 [kN].
In a mooring chain with a diameter of 120 [mm], the platform surge and heave motion control
is better than the mooring chain with a diameter of 100 [mm]. The maximum surge in wave
direction of 0° it is 16.78 [m], and in wave direction of 180° it is 15.68 [m], which is 3.5 [m]
smaller on average than the mooring chain diameter of 100 [mm]. In mooring diameter 120
[mm] the average bending moment is 2.13 [kNm], which is less than 100 [mm] mooring
diameter, and the effective tension is less than 100 [mm], for an average of 20 [kN].
It can be concluded that a mooring chain diameter of 120 [mm] is considered the optimal chain
size under this environmental load condition, and the maximum value obtained under this load
condition is much lower than the allowable dynamic cable and mooring chain properties as
indicated in the Table 5.1 and Table 7.3.
Page 60
Optimisation Of Offshore Wind Floater From Dynamic Cable And Mooring Prospective 49
7.2.2 Optimal Mooring Chain Length
In this section, the initial mooring line length is modified to obtain an optimized mooring
length, and to more effectively restrain the movement of floating objects without changing the
anchor point, which is established at a distance of 300 [m] from the center of the floater. In this
case, the optimized mooring line with a chain diameter of 120 [mm] (investigated in the
previous section) is considered, and the same environmental load conditions were applied. The
analysis was performed considering mooring lines length of 320[m] and 310[m], for the wave
direction from 0° to 180°, with an interval of 30°.
Figure 7.8 shows the summary effective tension of two lengths of mooring lines in all
environmental load directions.
Figure 7.8 Mooring line length analysis: Maximum effective tension in mooring line
Since the tension of the mooring line of the two length is within the allowable range, in order
to determine the optimal chain length, it is necessary to consider the impact of the
environmental load on the floater and the power cable to conduct further analysis. The
maximum bending moment, effective tension of the power cable and the movement of the
floater under the two mooring length are shown in Figure 7.9, Figure 7.10, Figure 7.11, Figure
7.12 and, Figure 7.13.
Page 61
Optimisation Of Offshore Wind Floater From Dynamic Cable And Mooring Prospective 50
Figure 7.9 Mooring line length analysis: Maximum bending moment for dynamic cable
Figure 7.10 Mooring line length analysis: Maximum effective tension at End A for dynamic cable
Page 62
Optimisation Of Offshore Wind Floater From Dynamic Cable And Mooring Prospective 51
Figure 7.11 Mooring line length analysis: Maximum effective tension at touch down point (TDP) for
dynamic cable
Figure 7.12 Mooring line length analysis: Maximum surge movement of the floater
Page 63
Optimisation Of Offshore Wind Floater From Dynamic Cable And Mooring Prospective 52
Figure 7.13 Mooring line length analysis: Maximum heave movement of the floater
In the above Figure 7.12, it can be noticed that for the 310 [m] long mooring line, the surge
and heave movement of the floater are controlled better than the 320 [m] long mooring line.
The maximum surge in the 0° wave direction is 12 [m], and the maximum surge in the 180°
wave direction is 11.6 [m], which is 4 [m] smaller on average than the 320 [m] long mooring
line. In the mooring length 310 [m] the bending moment of the dynamic cable’s average is 3.73
[kNm] and the average effective tension is 25 [kN] which is less than 320 [m] mooring length.
It can be concluded that mooring line with a length of 310 [m] and a diameter of 120 [mm] are
considered to be the optimal mooring system under such environmental load conditions. The
maximum value obtained under this load is much lower than the allowable limits for the
mechanical properties of dynamic cables and mooring chains mentioned in Table 5.1 and Table
7.3.
Page 64
Optimisation Of Offshore Wind Floater From Dynamic Cable And Mooring Prospective 53
7.3 Coupled Analysis of Dynamic Cable And Mooring
In this section, the optimized dynamic cable configuration with optimized mooring system will
be analyzed under the different load combinations mentioned in section 7.1. The direction of
the waves is from 0° to 180° with 30° interval. These load combinations are divided into two
sea state conditions: extreme sea state and normal sea state conditions, that is simulated for 3
hours to capture all possible sea state limits.
7.3.1 Extreme Sea State Condition
The analysis is carried out for the extreme sea conditions mentioned in Table 7.1. The wave
course ranges from 0° to 180°, with an interval of 30°, and the operation time is a 3-hour storm
period. For these wave directions, the maximum bending moment and effective tension
absorbed on the dynamic cable are shown in Table 7.6.
Table 7.6 Extreme Analysis: maximum bending moment and tension in dynamic cable
Environment Dynamic Cable
Wave
Height
Hs [m]
Wave
Period
Tz[s]
Wave
Directio
n [deg]
Bend Moment
[kN.m]
Tension at End A
[kN]
Tension at TDP
[kN]
Max Mean Max Min Max Min
12.1 10.92 0 9.60 0.99 128.60 24.99 55.98 -0.37
12.1 10.92 30 7.93 1.01 127.93 28.22 46.26 9.75
12.1 10.92 60 7.65 0.96 141.89 37.77 61.60 25.56
12.1 10.92 90 7.18 0.88 148.78 50.57 98.44 25.85
12.1 10.92 120 6.42 0.90 151.62 44.94 103.51 30.91
12.1 10.92 150 4.93 0.90 171.68 30.63 112.09 30.85
12.1 10.92 180 5.90 0.86 198.92 25.77 158.96 29.57
The above Table 7.6 clearly shows that the 0° and 180° wave directions have a greater influence
on the bending moment and effective tension of the dynamic cable. This is because of the
surge motion of the float; in the 0° wave direction, the float drifts toward the touch down point
(TDP) (that is, the positive X direction), which will cause the bending moment to increase as
the dynamic cable is compressed. The maximum bending moment absorbed in this direction is
9.60 [kNm], while the effective tension near the End A (fairlead point) is 128.60 [kN], with a
touch down point (TDP) of 55.98 [kN]. Conversely, in the 180° wave direction, the platform
drifts far away from the touchdown point, which leads to elongation of dynamic cable and it
causes tension in the system that increases to 198.92 [kN] at the fairlead point and 158.96 [kN]
at the touch down point (TDP).
Page 65
Optimisation Of Offshore Wind Floater From Dynamic Cable And Mooring Prospective 54
Figure 7.14 Extreme sea state: Bending Moment in 0° wave direction for dynamic cable
It can be seen from the above Figure 7.14, that the maximum bending moment of 9.6 [kNm]
occurs in the last section of the power cable. In addition to the bending stiffener area, another
peak of the maximum bending moment of 8.2 [kN] also appeared, due to large wave height the
heave motion of the platform increased. In this case, the length of 5 [m] bend curved stiffener
is considered as the reference section (analysis of the curved stiffener). In the arc length
between 110 [m] and 200 [m], the buoyancy module is connected to the power cable, and the
maximum bending moment in this area is 4.9 [kN].
Figure 7.15 Extreme sea state: Effective tension at End A in 180° wave direction on the dynamic
cable.
Page 66
Optimisation Of Offshore Wind Floater From Dynamic Cable And Mooring Prospective 55
Figure 7.16 Extreme sea state: Effective tension at TDP in 180° wave direction on the dynamic cable.
From Figure 7.15 and Figure 7.16, it can be seen that the maximum tension on the dynamic
cable occurs around 9000 seconds, where the A end is 199 [kN] and the touch down point
(TDP) is 159 [kN]. At the End A (fairlead point) and the touch down point (TDP), the overall
average tension of the rope is 120 [kN] and 65 [kN] respectively. The maximum effective
tension absorbed by the mooring line at the End A (fairlead point) in the 0° to 180° wave
direction is shown in Table 7.7.
Table 7.7 Extreme Sea State: maximum tension in mooring system
Wave
Directi
on
[deg]
Maximum Tension [kN]
Moorin
g 1
Moorin
g 2
Moorin
g 3
Moorin
g 4
Moorin
g 5
Moorin
g 6
Moorin
g 7
Moorin
g 8
0 1947.29 1320.62 1970.52 1330.01 10183.1 10121.1
5 1513.16 1522.31
30 1324.47 1872.31 3244.96 2022.16 3503.81 8397.84 1617.21 1626.39
60 4475.02 2244.47 8839.3 3679.88 2060.14 3232.61 1319.44 1283.48
90 1594.51 1785.67 10347.8
4
10005.7
8 1445.12 1902.64 1434.55 1851.95
120 2464.48 1409.21 3782.67 8515.96 2018.68 1335.71 2085.29 3086.06
150 2008.86 1312.9 2062.69 3215.84 2259.79 1700.39 3261.76 7789.72
180 1295.88 1903.57 1303.03 1887.13 1709.17 1509.91 9501.45 9539.98
Page 67
Optimisation Of Offshore Wind Floater From Dynamic Cable And Mooring Prospective 56
From the above Table 7.7, the mooring line laid opposite to the wave direction absorbs the
greatest amount of tension. The arrangement of the mooring line is shown in Figure 7.1.
Mooring analysis. When the wave is heading at 0°, the maximum tension on the mooring lines
5 and 6 is 10183 [kN] and 10121 [kN], respectively. When the wave is heading at 90°, the
maximum tension on the mooring lines 3 and 4 is 10347 [kN] and 10005 [kN], respectively,
and when the wave is heading at 90°, the maximum tension on the mooring lines 7 and 8 is
9501 [kN] and 9539.98 [kN]when the wave is heading in 180°.
The maximum tension was noticed in the mooring line 3 in the 90° wave direction, and its time
series of effective tension at End A (fairlead point) is shown in Figure 7.17. The time series for
mooring lines 5 and 6 in 0°, mooring 4 in 90° and mooring lines 7 and 8 in 180° are shown in
APPENDIX A.
Figure 7.17 Extreme sea state: Tension in mooring line 3 at End A for 90° wave heading
Table 7.8 Extreme sea state: Floater motion
Wave Direction [deg]
Floater Motion
Max. Surge [m] Max. Sway [m] Max. Heave [m]
+ X axis -X axis + Y axis -Y axis + Z axis -Z axis
0 16.56 11.15 0.05 0.02 11.07 13.76
30 13.48 6.64 7.62 3.91 10.70 13.49
60 8.09 3.79 13.32 6.74 10.65 13.48
90 0.43 0.00 16.68 11.55 11.04 13.65
120 4.26 7.79 13.34 6.66 10.67 13.51
150 7.13 13.19 7.58 3.92 10.71 13.49
180 9.98 16.25 0.02 0.03 11.00 13.78
Page 68
Optimisation Of Offshore Wind Floater From Dynamic Cable And Mooring Prospective 57
It can be seen from Table 7.8 that at 0° wave direction, when the float drifts to the vicinity of
the touch down point (TDP), the float absorbs the maximum surge motion of 16.56 [m] in the
positive x-direction. This is the reason for the maximum bending moment on the dynamic
cable. At 90°, the float absorbs the maximum rocking motion of 16.68 [m] in the positive y-
direction because the float drifts later and will not affect the dynamic cable system. However,
due to the elongation of the mooring line, the mooring lines 3 and 4 absorb the maximum
tension. At 180°, when the float is away from the landing site, the float absorbs a maximum
rocking motion of 16.25 [m] in the negative x-direction. This is the reason for the maximum
tension on the dynamic cable. The average maximum heave motion is 11 [m] in the positive Z
direction and 13.5 [m] in the negative Z-direction for all wave directions. This vertical
movement of the float is deemed acceptable for the dynamic cable system.
As the conclusion of extreme sea conditions analysis, power cables and mooring systems can
withstand such environmental conditions. In a dynamic cable system, the maximum bending
moment and maximum tension are much lower than the allowable limit of the dynamic cable.
The maximum allowable bending moment is 13.33 [kNm] and the minimum allowable
breaking load is 2720 [kN] (see Table 5.1). In the mooring system, the maximum tension is
also within the allowable range of the mooring chain under consideration, and the minimum
allowable breaking load is 13570.00 [kN] (see Table 7.3).
Page 69
Optimisation Of Offshore Wind Floater From Dynamic Cable And Mooring Prospective 58
7.3.2 Normal Sea State Condition
This section summarizes the dynamic analysis results of the optimized lazy wave configuration
and optimized mooring system under normal sea conditions mentioned in Table 7.1.
For wave headings from 0° to 180°, the interval is 30°, and the running time is a 3-hour storm
period. The maximum bending moment and effective tension of the dynamic cable system at
End A (fairlead point) and touch down point (TDP) under the three load conditions, the
maximum tension of the mooring system fairlead point and the maximum surge and heave of
the floater are shown in Figure 7.18, Figure 7.19, Figure 7.20, Figure 7.21, Figure 7.22 and,
Figure 7.23. As well as the detailed table for three load conditions, see APPENDIX B.
Figure 7.18 Normal sea state: Maximum Bending moment in dynamic cable
Page 70
Optimisation Of Offshore Wind Floater From Dynamic Cable And Mooring Prospective 59
Figure 7.19 Normal sea state: Maximum effective tension at End A in dynamic cable
Figure 7.20 Normal sea state: Maximum effective tension at Touch down point (TDP) in dynamic
cable
Page 71
Optimisation Of Offshore Wind Floater From Dynamic Cable And Mooring Prospective 60
Figure 7.21 Normal sea state: Maximum effective tension at End A in mooring line
Figure 7.22 Normal sea state: Maximum surge motion in the floater
Page 72
Optimisation Of Offshore Wind Floater From Dynamic Cable And Mooring Prospective 61
Figure 7.23 Normal sea state: Maximum heave motion in the floater
As can be seen from the above figures, load case 1 has a greater impact on the two systems.
This is because the load case 1 has a shorter wave period of 3 seconds (i.e. the zero-crossing
period (Tz)), so the translational movement of the floater has a greater impact on the dynamic
cable and mooring system.
Compared with other load cases, in load case 1, the maximum bending moment of the dynamic
cable occurs in the wave direction 0°, as shown in Figure 7.24.
Figure 7.24 Normal Sea state: Load case 1 Bending Moment in 0° wave direction
Page 73
Optimisation Of Offshore Wind Floater From Dynamic Cable And Mooring Prospective 62
From the above Figure 7.24, the maximum bending moment is 3.12 [kN.m] appears at the last
arc length of the moving cable at 231 [m]; in addition to the buoyancy module area, there is
also a peak bending moment of 2.5 [kN]. This is because the wave period is short, and the
waves are continuously generated and sollecitate the floating section. It increases the impact
movement of the float in the positive X direction, resulting in increase in bending moment due
to reduction of tension in the cable.
In load case 1, the maximum effective tension on the dynamic cable occurs in the 180° wave
direction. The effective tension time series of end A and the grounding point are shown in
Figure 7.25 and Figure 7.26.
Figure 7.25 Normal Sea state: Load case 1 Effective Tension at End A in 180° wave direction
Page 74
Optimisation Of Offshore Wind Floater From Dynamic Cable And Mooring Prospective 63
Figure 7.26 Normal Sea state: Load case 1 Effective Tension at TDP in 180° wave direction
From Figure 7.25 and Figure 7.26, it can be seen that the maximum tension at end A is 88 [kN],
and the maximum tension at the touch down is 62 [kN], which occurs in a period of 621
seconds. The average maximum tension at the fairlead is 83 [kN], and the average maximum
tension at the touch down point (TDP) is 48 [kN]. The reason for the increased tension is that
the floats drift away from the touch down point (TDP).
It is also interesting from the Figure 7.21, that compared with other load cases, load case 1 has
a greater impact. The mooring line laid opposite to the wave direction absorbs most of the load.
Refer to Figure 7.1 for the layout of the mooring line.
For load case 1, the maximum tension on the mooring line with a wave direction of 0° to 180°
is shown in Table 7.9.
Table 7.9 Normal sea state: Load case 1 maximum tension of mooring lines
Direction
[deg]
Maximum Tension [kN]
Mooring 1
Mooring 2
Mooring 3
Mooring 4
Mooring 5
Mooring 6
Mooring 7
Mooring 8
0 762.17 666.16 765.40 664.33 3122.24 3140.32 1235.41 1234.80
30 767.93 882.17 1225.45 956.39 895.35 1201.91 804.19 694.89
60 749.19 869.30 1231.58 928.06 894.75 1223.64 845.84 711.57
90 1328.54 1330.57 3049.65 2968.89 663.37 748.50 642.62 712.41
120 888.38 749.78 939.86 1276.91 866.37 739.12 859.03 1141.47
150 879.53 758.89 933.54 1212.22 797.57 713.81 853.38 1080.78
180 667.31 763.67 666.57 765.96 1295.36 1296.23 3053.96 3052.80
Page 75
Optimisation Of Offshore Wind Floater From Dynamic Cable And Mooring Prospective 64
It can be seen from Table 7.9, that when the wave is heading at 0°, the maximum tension on
the mooring lines 5 and 6 is 3122 [kN] and 3140 [kN], respectively. When the wave is heading
at 90°, the maximum tension on the mooring lines 3 and 4 is 3049 [kN] and 2968 [kN],
respectively, and when the wave is heading at 90°, the maximum tension on the mooring lines
7 and 8 is 3054 [kN] and 3053 [kN] when the wave is heading in 180°.
The maximum tension appears at the mooring line 5 in the 0° wave direction, and its effective
tension time sequence at end A is shown in Figure 7.27. Other time series of mooring line 6
for wave direction 0°, mooring lines 3 and 4 for wave direction 90°, and mooring lines 7 and 8
for wave direction 180° are shown in the APPENDIX C.
Figure 7.27 Normal sea state: Maximum tension in mooring line 5 in 0° wave direction for load case 1
It can be concluded from this analysis that the optimized dynamic cable and mooring system
is completely stable for a significant wave height of 3.5 [m] for three different zero-crossing
wave periods [Tz] of 3, 5.5 and 7 seconds. Since the platform experienced the greatest surge
motion, the greatest impact was noticed in the lower wave period of 3 seconds. In general, the
heave motion is controlled, and the maximum value is far below the allowable limit of the
mechanical properties of the dynamic cable and mooring line.
Page 76
Optimisation Of Offshore Wind Floater From Dynamic Cable And Mooring Prospective 65
8 CONCLUSION
According to this thesis, a dynamic power cable configuration and mooring system for a
floating offshore wind power platform under extreme and normal environmental conditions are
proposed. It provides a good starting point for further study of the detailed optimization of the
two systems.
Initially, a dynamic cable configuration was set up, investigating four possible options for
catenary configurations in OrcaFlex, and, based on the performed static analysis, the lazy wave
configuration was selected. Then a sensitive analysis of the lazy wave configuration was
carried out. The optimized catenary configuration of the dynamic cable has been found by
performing several sensitivity on the optimal buoyancy module and the cable section length.
A preliminary mooring analysis was carried out on the catenary mooring system. An optimized
mooring system under extreme environmental conditions was obtained by optimizing the chain
diameter and the length of the mooring rope.
Finally, a coupled analysis of the dynamic power cable and mooring system was carried out,
and it was found that both systems sustained the extreme environmental conditions (design
condition). Moreover, in order to verify the behaviour of both systems during its normal life ,
the analysis was repeated for normal environmental conditions. It was noticed that the shorter
wave period has a higher impact on the system than other load cases in normal conditions.
Page 77
Optimisation Of Offshore Wind Floater From Dynamic Cable And Mooring Prospective 66
9 FUTURE WORK
This thesis is the starting point to model the dynamic cable and mooring system for offshore
floating platforms. Further, for this research work to be successful, a long period of research
work is required. An in-depth study and analysis will help with further development of both
system. The topic’s that are to be explored in future:
• Fatigue analysis for dynamic power cable.
• Marine growth analysis for dynamic cable and mooring chain
• Vortex induced vibration (VIV)
• Optimization of mooring lines and fatigue analysis
• Model Testing
• Full-Scale Testing
Page 78
Optimisation Of Offshore Wind Floater From Dynamic Cable And Mooring Prospective 67
REFERENCES
BW Ideol. (n.d.). Eolmed-project. Retrieved August 22, 2021, from https://www.bw-
ideol.com/en/eolmed-project
BW Ideol. (n.d.). Flaotgen. Retrieved August 22, 2021, from https://www.bw-
ideol.com/en/floatgen-demonstrator
BW Ideol. (n.d.). HIBIKI. Retrieved August 22, 2021, from https://www.bw-
ideol.com/en/japanese-demonstrator
Equinor. (n.d.). Floating Wind. Retrieved August 22, 2021, from
https://www.equinor.com/en/what-we-do/floating-wind.html
Equinor. (n.d.). Hywind tampen. Retrieved August 22, 2021, from
https://www.equinor.com/en/what-we-do/hywind-tampen.html
Erik Eriksson, M. J.-H. (2011). Submarine link - Submarine HVAC cable to the floating oil
and gas platform at Gjøa. Retrieved August 23, 2021, from
https://library.e.abb.com/public/bbcc7542b39ba68bc125796e00527f76/48-
53%204m156_ENG_72dpi.pdf
Fukushima FORWARD. (2014). Fukushima Floating Offshore Wind Farm Demonstration
Project. Japan: Fukushima OffshoreWind Consortium.
Gicon-sof. (n.d.). Tichnical solution. Retrieved August 22, 2021, from http://www.gicon-
sof.de/en/technical-solution.html
Iberdrola. (n.d.). Offshore wind turbines foundations. Retrieved August 23, 2021, from
https://www.iberdrola.com/sustainability/offshore-wind-turbines-foundations
INNOSEA. (2020). D3.1 Review of the state of the art of dynamic cable system design.
IRENA. (2016, December). Retrieved August 26, 2021, from IRENA:
https://www.irena.org/publications/2016/Dec/Floating-foundations-A-game-changer-
for-offshore-wind
JENSEN, C. &.-R. (2015, Feb). OFFSHORE GENERATION CABLE CONNECTIONS.
Retrieved August 26, 2021, from
https://www.researchgate.net/publication/338388640_CIGRE_TB_610_-
_Offshore_generation_cable_connections
OrcaFlex. (2021). OrcaFlex Help. Retrieved August 26, 2021, from OrcaFlex:
https://www.orcina.com/webhelp/OrcaFlex/Default.htm
Principle Power . (n.d.). WindFloat. Retrieved August 22, 2021, from
https://www.principlepowerinc.com/en/windfloat
Rhodri, J. &. (2015). Floating offshore wind: Market and technology review. Carbon Trust.
WindEurope. (2021). Offshore Wind in Europe Key trends and statistics 2020.
WindEurope.org. Retrieved August 22, 2021, from
Page 79
Optimisation Of Offshore Wind Floater From Dynamic Cable And Mooring Prospective 68
https://windeurope.org/intelligence-platform/product/offshore-wind-in-europe-key-
trends-and-statistics-2020/
Page 80
Optimisation Of Offshore Wind Floater From Dynamic Cable And Mooring Prospective 69
APPENDIX A
Extreme sea state: Time series for mooring lines 5 and 6 in 0° wave direction, mooring lines 4
in 90° wave direction and mooring lines 7 and 8 in 180° wave direction.
Figure 0.1 Extreme sea state: Effective tension of mooring line 5 in 0° wave direction
Figure 0.2 Extreme sea state: Effective tension of mooring line 6 in 0° wave direction
Page 81
Optimisation Of Offshore Wind Floater From Dynamic Cable And Mooring Prospective 70
Figure 0.3 Extreme sea state: Effective tension of mooring line 4 in 90° wave direction
Figure 0.4 Extreme sea state: Effective tension of mooring line 7 in 180° wave direction
Page 82
Optimisation Of Offshore Wind Floater From Dynamic Cable And Mooring Prospective 71
Figure 0.5 Extreme sea state: Effective tension of mooring line 8 in 180° wave direction
Page 83
Optimisation Of Offshore Wind Floater From Dynamic Cable And Mooring Prospective 72
APPENDIX B
Normal sea state: Load case 1 (Hs: 3.5 [m] & Tz: 3 [sec])
Table 0.1 NSS: Load case 1 Bending moment and effective tension in dynamic cable
Dynamic Cable with Floater
Direction
[deg]
Bend Moment
[kN.m]
Tension at End A
[kN]
Tension at TDP
[kN]
Max Mean Max Min Max Min
0 3.09 0.99 82.90 71.36 35.25 19.51
30 2.49 1.00 80.20 73.00 33.07 24.92
60 2.07 0.97 84.57 75.36 43.75 30.80
90 1.70 0.92 84.95 77.07 47.57 39.31
120 1.90 0.92 84.17 75.74 48.49 39.89
150 2.08 0.91 81.86 74.15 48.21 40.10
180 2.42 0.87 87.97 73.99 58.03 37.46
Table 0.2 NSS: Load case 1 Floater motion
Floater Motion
Direction
[deg]
Surge Sway Heave
+ X axis -X axis + Y axis -Y axis + Z axis -Z axis
0 15.12 9.12 0.04 0.03 0.00 2.70
30 6.95 3.70 6.94 4.53 0.00 2.70
60 7.06 4.18 6.87 4.22 0.00 2.70
90 0.45 0.00 14.37 9.56 0.00 2.70
120 4.45 6.52 7.10 4.36 0.00 2.70
150 3.76 6.27 6.83 4.42 0.00 2.70
180 9.33 15.22 0.03 0.01 0.00 2.70
Table 0.3 NSS: Load case 1 Effective tension in mooring lines
Mooring Chain
Direction
[deg]
Maximum Tension [kN]
Moorin
g 1
Moorin
g 2
Moorin
g 3
Moorin
g 4
Moorin
g 5
Moorin
g 6
Moorin
g 7
Moorin
g 8
0 762.17 666.16 765.40 664.33 3122.24 3140.32 1235.41 1234.80
30 767.93 882.17 1225.45 956.39 895.35 1201.91 804.19 694.89
60 749.19 869.30 1231.58 928.06 894.75 1223.64 845.84 711.57
90 1328.54 1330.57 3049.65 2968.89 663.37 748.50 642.62 712.41
120 888.38 749.78 939.86 1276.91 866.37 739.12 859.03 1141.47
150 879.53 758.89 933.54 1212.22 797.57 713.81 853.38 1080.78
180 667.31 763.67 666.57 765.96 1295.36 1296.23 3053.96 3052.80
Page 84
Optimisation Of Offshore Wind Floater From Dynamic Cable And Mooring Prospective 73
Normal sea state: Load case 2 (Hs: 3.5 [m] & Tz: 5 [sec])
Table 0.4 NSS: Load case 2 Bending moment and effective tension in dynamic cable
Dynamic Cable with Floater
Direction
[deg]
Bend Moment
[kN.m]
Tension at End A
[kN]
Tension at TDP
[kN]
Max Mean Max Min Max Min
0 2.88 0.97 80.75 71.94 31.72 21.25
30 2.59 1.00 81.95 73.01 34.68 23.93
60 1.97 0.96 83.93 75.38 41.88 32.46
90 1.69 0.92 83.95 77.10 45.16 39.58
120 1.85 0.92 82.48 75.73 46.05 40.38
150 2.20 0.91 83.71 74.16 49.76 38.81
180 2.26 0.89 84.77 73.97 51.84 38.90
Table 0.5 NSS: Load case 2 Floater motion
Floater Motion
Direction
[deg]
Surge Sway Heave
+ X axis -X axis + Y axis -Y axis + Z axis -Z axis
0 9.99 6.15 0.02 0.01 0.00 2.70
30 9.18 6.03 4.74 3.18 0.00 2.70
60 5.15 3.10 8.55 5.80 0.00 2.70
90 0.45 0.00 9.53 5.97 0.00 2.70
120 3.45 4.72 8.64 5.83 0.00 2.70
150 6.34 8.79 4.84 3.27 0.00 2.70
180 6.61 9.81 0.01 0.01 0.00 2.70
Table 0.6 NSS: Load case 2 Effective tension in mooring lines
Mooring Chain
Direction
[deg]
Maximum Tension [kN]
Moorin
g 1
Moorin
g 2
Moorin
g 3
Moorin
g 4
Moorin
g 5
Moorin
g 6
Moorin
g 7
Moorin
g 8
0 683.85 636.80 685.66 634.27 1329.96 1329.45 891.68 894.89
30 660.18 788.91 971.56 704.59 1058.24 1326.68 900.19 812.31
60 841.31 922.23 1303.18 1044.56 707.03 965.46 760.75 633.72
90 917.01 912.30 1420.01 1394.76 625.24 673.83 606.36 647.74
120 933.22 824.28 1057.83 1292.38 777.13 658.99 689.75 924.17
150 810.93 665.83 708.18 971.13 923.58 851.38 1008.42 1269.96
180 639.73 682.45 640.22 680.57 940.43 939.43 1253.26 1256.10
Page 85
Optimisation Of Offshore Wind Floater From Dynamic Cable And Mooring Prospective 74
Normal sea state: Load case 3 (Hs: 3.5 [m] & Tz: 7 [sec])
Table 0.7 NSS: Load case 3 Bending moment and effective tension in dynamic cable
Dynamic Cable with Floater
Direction
[deg]
Bend Moment
[kN.m]
Tension at End A
[kN]
Tension at TDP
[kN]
Max Mean Max Min Max Min
0 2.78 0.97 80.01 71.71 30.96 22.43
30 2.43 0.99 81.14 72.79 32.43 25.81
60 1.88 0.96 83.65 75.27 39.39 34.15
90 1.67 0.92 83.80 77.13 43.95 39.75
120 1.80 0.93 82.33 75.74 44.19 41.24
150 2.06 0.92 82.38 74.16 46.04 40.23
180 2.17 0.89 83.80 73.97 47.94 40.00
Table 0.8 NSS: Load case 3 Floater motion
Floater Motion
Direction
[deg]
Surge Sway Heave
+ X axis -X axis + Y axis -Y axis + Z axis -Z axis
0 5.75 -3.37 0.01 -0.01 0.00 -2.69
30 4.20 -2.43 1.94 -1.37 0.00 -2.69
60 2.30 -1.38 3.74 -2.33 0.00 -2.70
90 0.44 0.00 5.15 -3.05 0.00 -2.70
120 1.70 -1.86 3.78 -2.33 0.00 -2.70
150 2.82 -3.77 1.95 -1.40 0.00 -2.70
180 3.82 -5.40 0.01 0.00 0.00 -2.70
Table 0.9 NSS: Load case 3 Effective tension in mooring lines
Mooring Chain
Direction
[deg]
Maximum Tension [kN]
Moorin
g 1
Moorin
g 2
Moorin
g 3
Moorin
g 4
Moorin
g 5
Moorin
g 6
Moorin
g 7
Moorin
g 8
0 635.00 606.63 636.28 605.21 836.49 836.11 696.36 698.34
30 615.88 644.90 699.06 635.12 721.20 772.84 665.30 651.27
60 667.52 679.26 775.91 709.16 629.99 696.58 623.08 596.45
90 710.57 707.52 823.34 814.56 598.27 621.60 584.37 604.78
120 681.43 666.23 713.46 768.29 645.57 617.95 613.69 666.51
150 650.31 618.09 641.28 696.76 688.94 674.02 700.19 750.60
180 609.28 632.24 609.41 631.67 724.79 723.90 807.59 808.83
Page 86
Optimisation Of Offshore Wind Floater From Dynamic Cable And Mooring Prospective 75
APPENDIX C
Normal sea state: Load case 1 Time series for mooring lines 6 in 0° wave direction, mooring
lines 3 and 4 in 90° wave direction and mooring lines 7 and 8 in 180° wave direction.
Figure 0.1 Normal sea state: Maximum tension in mooring line 6 in 0° wave direction for load case 1
Figure 0.2 Normal sea state: Maximum tension in mooring line 3 in 90 degrees wave direction for
load case 1
Page 87
Optimisation Of Offshore Wind Floater From Dynamic Cable And Mooring Prospective 76
Figure 0.3 Normal sea state: Maximum tension in mooring line 4 in 90° wave direction for load case 1
Figure 0.4 Normal sea state: Maximum tension in mooring line 7 in 180° wave direction for load case
1
Page 88
Optimisation Of Offshore Wind Floater From Dynamic Cable And Mooring Prospective 77
Figure 0.5 Normal sea state: Maximum tension in mooring line 8 in 180° wave direction for load case
1