Oracle with 20:20 Foresight: Anticipate - Collaborate – Integrate Database Administration AUSOUG conference 2003 OPTIMISING ORACLE9I INSTANCE MEMORY Ramesh Ramaswamy, Quest Software INTRODUCTION With the release of Oracle 9i, Oracle Corporation has provided database administrators powerful and efficient techniques to control instance memory. Database Administrators (DBAs) can now dynamically resize System Global Area (SGA) memory components on the fly without shutting down the database. DBAs can control the Program Global Area (PGA) memory utilization at the instance level using new SQL memory management techniques. For the first time DBAs can use these novel SQL memory management techniques to prevent the PGA memory size from growing abnormally. The “optimal” settings previously used to set PGA configuration parameters are no longer flexible enough to accurately predict behaviour such as application workload over extended periods. Oracle has introduced a single configuration parameter PGA_AGGREGATE_TARGET that provides a comprehensive, adaptive and robust solution that allows DBA to control and automate SQL memory management. Oracle with the 9i release introduced a set of server-based advisories that help DBAs resize memory components optimally and dynamically. This paper takes a closer look at these features, explains exactly how they work, and recommends the best practices to optimise total instance memory. OVERVIEW OF ORACLE9I INSTANCE MEMORY Oracle instance memory is mainly divided into two categories, the System Global Area (SGA) and the Program Global Area (PGA). The SGA is shared among Oracle processes while the PGA is private to individual Oracle server process. Oracle uses these memory components for caching objects like library objects, database blocks etc., that are needed from time to time by the Oracle background processes. It is important to allocate the correct sizes for these memory components to reduce physical IO overhead by caching the required objects in the memory readily available. In the past, resizing the instance memory components could not be done dynamically as Oracle allocated fixed sizes using initialisation parameters. From Release 9i onwards; Oracle allows the resizing of memory components during instance lifetime. DYNAMIC SGA CONCEPTS Before 9i releases, the static memory allocation for the SGA would be determined by initialization parameters SHARED_POOL_SIZE, DB_BUFFERS etc., but once allocated, the SGA size cannot be changed during the instance lifetime. If you would like to resize any of the memory components you need to shutdown and startup the instance. Thus tuning SGA memory for performance is arduous for a DBA especially for critical mission 24/7 application databases. This tuning is further complicated where the free or unused memory from one component is taken up by another. Oracle made the DBAs life easier by introducing dynamic SGA tuning that allows DBAs to resize the SGA memory components without shutting down the database. In 9i Release2, DBAs can change the memory components; shared pool, large pool and buffer cache dynamically using the ALTER SYSTEM command. There are still some memory components like java pool and redo buffers which cannot be changed dynamically. These features may be available in future releases. You can shift memory from one component to another or shrink and grow the memory component sizes dynamically. UNIT OF MEMORY ALLOCATION Before Oracle9i, for any memory component in the SGA, Oracle would determine the size of the minimum unit Quest Software Page 1 Optimising Oracle9i Instance Memory
INTRODUCTION With the release of Oracle 9i, Oracle Corporation has provided database administrators powerful and efficient techniques to control instance memory. Database Administrators (DBAs) can now dynamically resize System Global Area (SGA) memory components on the fly without shutting down the database. DBAs can control the Program Global Area (PGA) memory utilization at the instance level using new SQL memory management techniques. For the first time DBAs can use these novel SQL memory management techniques to prevent the PGA memory size from growing abnormally. The “optimal” settings previously used to set PGA configuration parameters are no longer flexible enough to accurately predict behaviour such as application workload over extended periods. Oracle has introduced a single configuration parameter PGA_AGGREGATE_TARGET that provides a comprehensive, adaptive and robust solution that allows DBA to control and automate SQL memory management. Oracle with the 9i release introduced a set of server-based advisories that help DBAs resize memory components optimally and dynamically.
This paper takes a closer look at these features, explains exactly how they work, and recommends the best practices to optimise total instance memory.
OVERVIEW OF ORACLE9I INSTANCE MEMORY Oracle instance memory is mainly divided into two categories, the System Global Area (SGA) and the Program Global Area (PGA). The SGA is shared among Oracle processes while the PGA is private to individual Oracle server process. Oracle uses these memory components for caching objects like library objects, database blocks etc., that are needed from time to time by the Oracle background processes. It is important to allocate the correct sizes for these memory components to reduce physical IO overhead by caching the required objects in the memory readily available. In the past, resizing the instance memory components could not be done dynamically as Oracle allocated fixed sizes using initialisation parameters. From Release 9i onwards; Oracle allows the resizing of memory components during instance lifetime.
DYNAMIC SGA
CONCEPTS
Before 9i releases, the static memory allocation for the SGA would be determined by initialization parameters SHARED_POOL_SIZE, DB_BUFFERS etc., but once allocated, the SGA size cannot be changed during the instance lifetime. If you would like to resize any of the memory components you need to shutdown and startup the instance. Thus tuning SGA memory for performance is arduous for a DBA especially for critical mission 24/7 application databases. This tuning is further complicated where the free or unused memory from one component is taken up by another.
Oracle made the DBAs life easier by introducing dynamic SGA tuning that allows DBAs to resize the SGA memory components without shutting down the database. In 9i Release2, DBAs can change the memory components; shared pool, large pool and buffer cache dynamically using the ALTER SYSTEM command. There are still some memory components like java pool and redo buffers which cannot be changed dynamically. These features may be available in future releases.
You can shift memory from one component to another or shrink and grow the memory component sizes dynamically.
UNIT OF MEMORY ALLOCATION
Before Oracle9i, for any memory component in the SGA, Oracle would determine the size of the minimum unit
of memory depending upon the server operating system as well as other attributes of the shared memory. From 9i onwards, Oracle uses generic code to specify the unit of memory allocation in the SGA. This new unit of allocation is called a granule whose size is platform and maximum SGA size dependent. On most UNIX platforms, including Solaris, if the total SGA size is less than 128 MB, the granules are of 4 MB, otherwise, they are 16 MB. On NT, the granule size is 4 MB if the value of the SGA_MAX_SIZE parameter is less than 128 MB and 8 MB otherwise. Oracle allocates memory in whole numbers of granules in all memory components except the fixed and redo buffers components. No two components can share memory within one granule. To find out the granule size of your server, use the following SQL: SELECT x.ksppstvl / (1024 * 1024) granule_size FROM SYS.x$ksppsv x, SYS.x$ksppi y WHERE x.indx = y.indx AND y.ksppinm = '_ksmg_granule_size';
OR SELECT DISTINCT granule_size FROM v$sga_dynamic_components;
SERVER PARAMETER FILE
The server parameter file is a binary file, which is stored on the server where the Oracle instance exists. Changes applied to the instance parameters in this file persist across all startup/shutdown procedures. This server parameter file can be located on the server as follows: On Unix $ORACLE_HOME/dbs On Windows $ORACLE_HOME/database The file can be named either spfile.ora or spfile<SID>.ora. When you startup an instance, Oracle searches the directories for this file and if finds one then Oracle will startup the instance with that file, otherwise Oracle will use the normal initialization file init<SID>.ora. By default, Oracle uses server parameter files from 9i onwards. By using a spfile the changes made to instance parameters are persistent across all startup and shutdown procedures. The new syntax in the ALTER SYSTEM command allows the DBA to specify the change in the spfile or memory or both.
ALTER SYSTEM <PARAMETER_NAME> [SCOPE = {MEMORY | SPFILE | BOTH}];
Oracle adjusts its instance parameter values during startup allowing the DBA to change these parameters dynamically. For example, if you specify the SHARED_POOL_SIZE in less than a multiple of a granule size, Oracle rounds it to a multiple of granule size. These adjustments are also done using a normal initialization parameter file, however your dynamic changes during the life of the instance will not be persistent across startup/shutdown procedures. Oracle provides two new DDL statements, CREATE SPFILE and CREATE PFILE to create an spfile from a pfile and vice versa. To view the parameters and their values in dynamic views, a new view V$SPPARAMTER exists; this shows spfile parameters and changes only applied to the spfile. The old view V$PARAMETER shows the pfile parameters and changes applied to memory only.
NEW PARAMETERS
Oracle has introduced a set of new initialization parameters for dynamic resizing of the memory components in the SGA and deprecated some of the old parameters to make parameter modification more intuitive and user friendly. These are in detail:
SGA_MAX_SIZE This specifies the maximum size of the SGA for the lifetime of the instance. This is the maximum size of the SGA allowed when resizing any memory component. Any resize operation succeeds only if it does not increase the total SGA size beyond this value. Assume you have started an instance with a maximum SGA size of X MB and
the sum of all SGA memory components is Y MB. If Y is less than X, then Oracle will have available X – Y MB free memory for dynamic resizing. If Y is greater than X, Oracle will increase the maximum SGA size to Y and have no free memory for resizing. Of course all these memory sizes, X, Y and the differences are multiples of granule size.
DB_CACHE_SIZE This specifies the size of the default buffer cache in memory. The old parameter DB_BLOCK_BUFFERS, specified in numbers of blocks is deprecated, Oracle now encourages the DBA to use this new parameter. This parameter uses memory size rather than numbers of blocks. Sizes can be given in KB, MB or GB.
DB_NK_CACHE_SIZE (N = 2, 4, 8, 16, 32) These are the set of parameters introduced to support the “multiple block size” feature. You can activate a 2k cache by specifying a size in db_2k_cache_size and creating a tablespace with a “non-standard” 2K-block size. These parameters can only be used for non-standard block sizes. Therefore, it is illegal to set a DB_8K_CACHE_SIZE parameter, if the standard block, as specified by DB_BLOCK_SIZE parameter is 8K.
DB_KEEP_SIZE & DB_RECYCLE_SIZE These parameters are used to specify the memory sizes for the keep and recycle caches. Earlier parameters BUFFER_POOL_KEEP and BUFFER_POOL_RECYCLE are deprecated. The earlier parameters are expressed in combinations of buffers and LRU latches whereas the new parameters are expressed in the amount of memory in units of KB, MB or GB.
RESIZING A SGA MEMORY COMPONENT
One of the important performance goals for a DBA is the reduction of the physical IO overhead. This is achieved by caching more data in memory or by making the process of retrieving the required data more efficient. Either way has its’ own constraints, since caching is limited by memory availability and retrieving data is dependent on various disk storage technologies. DBAs are aware that physical IO takes a significant amount of time compared with memory access and increases application response time. Ideally we would make the frequently accessed objects remain in memory rather than frequently retrieving them from disk. Thus, memory management focuses mainly on how efficiently the cache is managed. Let’s see how we can manage cache efficiently. Oracle has the following key memory caches that affect performance
• Shared pool
• Large Pool
• Java Pool
• Buffer Pool
• Log buffer
• Process private memory (PGA) From 9i Release 2 onwards, Oracle allows the dynamic resizing of the shared pool, large pool, buffer pool and process private memory. Before we discuss how to resize these caches, we will look at when to resize these caches. Throughout this discussion, we will assume your application is tuned properly for database interaction. Apart from application tuning, we are going to consider the cache resizing to get optimal performance. We will consider cache-resizing management in two scenarios, typical application load and ad hoc application load. In typical application load, DBAs will have a rough estimate of the load of IO, memory requirement etc., but in ad hoc application load, it would be hard to predict the load style. For example, your typical application load may be day-to-day financials applications and ad hoc load would be an IO intensive batch job. Let us consider how to resize the memory components in these two cases. To monitor a typical application load, DBAs have to startup the database with estimated initial memory component sizes. Alternatively, in a running production database, DBAs can reset statistics levels using the STATISTICS_LEVEL parameter from ALL/TYPICAL to BASIC and then BASIC to ALL/TYPICAL. If your typical application loads timings are from, say, 9 am. To 5 pm., then run the applications for that period and
collect the statistics. At the end of this period is the best time to resize the memory components so that on the following day your instance will work with optimal memory component sizes. Oracle provided a set of dynamic views to advise you on the optimal memory sizes for the components, called advisories. You can repeat these resizing steps for a couple of days or weeks in order to optimize memory usage. For ad hoc application loads, reset your statistics collection just before the load, monitor the load and advisories to determine optimal sizes. Set the optimal size and repeat the steps again. Once your ad hoc application is complete, reset the memory sizes back to the original settings so your normal applications will run as usual. To resize memory components use the ALTER SYSTEM command. Memory components can be resized dynamically without shutting down the database for the memory components shared pool, large pool and database buffers. Upon execution of the ALTER SYSTEM command Oracle rounds up the given target size to the nearest multiple of granule size and then adds or subtracts granules to the current memory size. For example, if you current memory size of shared pool is 48MB and granule size is 8MB, then using ALTER SYSTEM command, if you change shared pool size to 50 MB, then Oracle rounds ups the memory size to 56MB, adding one more granule to existing memory size. You must have enough free memory (in multiples of the granule size) when adding memory for the operation to succeed. Oracle will not reduce the memory size of any other memory component to meet your requirement. If Oracle cannot find any free granules, it returns an error (ORA-04033). Consider setting SGA_MAX_SIZE to a larger value than the actual SGA size when creating database. In this way it wouldn’t be harder to add memory to any required memory component, minimizing the work needed to shift memory from one component to another. When you are shrinking a memory component, Oracle will only free granules that are not in use. Oracle must wait until all references have been removed to free up granules. In the case of a buffer cache, Oracle has to wait until all dirty blocks are written back to disk. However for the shared pool, Oracle waits for all sessions or operations using the granules to be removed. Be cautious when shrinking the shared pool since after you have started a resize operation if new connections are still available, Oracle will allow the current shared pool to be used. This makes it very hard to free up the required granules. A shrinking operation that reduces the shared pool to an extremely small size (less than two granules for example) would never complete resulting in a “hung” session. When this occurs, you will need to kill the session. On some platforms like Windows NT or Windows 2000 shrinking can result in a core dump however this is unlikely to be consistent. My advice would be to never trying shrinking the shared pool, rather try to shrink other memory components, for example the buffer cache. Do any shrinking operations in a separate session rather than in an application session so you can kill the session. Oracle allows only one resize operation for a given SGA memory component at a time, however Oracle does allow multiple resize operations for different components simultaneously.
TRACKING A SGA RESIZE OPERATION
In order to track a resize operation, Oracle provides two new views; V$SGA_CURRENT_RESIZE_OPS and V$SGA_RESIZE_OPS. In addition to these views, every resize operation is recorded in the alert log.
V$SGA_CURRENT_RESIZE_OPS This view displays information about SGA resize operations that are currently in progress. When you do any shrinking operation that takes a very long time to finish that operation you should list this view to see which operation is taking a long time. The “START_TIME” column in this view is helpful in finding out how long your resize operation is waiting to get free or free up granules. This view displays the current resize operations, once over, the resize record will disappear.
V$SGA_RESIZE_OPS This view contains historical information about the last 100 completed SGA resize operations. This is useful to find out how your resize operations performed.
ALERT LOG FILE Every resize operation is recorded in the alert log. The alert log contains ALTER SYSTEM commands, start and end times, current and target sizes as well as the outcome of the resize operation. A sample of alert log file:
Wed Jul 09 16:06:03 2003 CKPT: Begin resize of buffer pool 3 (DEFAULT for block size 8192) CKPT: Current size = 48 MB, Target size = 32 MB CKPT: Resize completed for buffer pool DEFAULT for blocksize 8192 Wed Jul 09 16:06:04 2003 ALTER SYSTEM SET db_cache_size='32M' SCOPE=BOTH;
QUERIES REGARDING SGA STATISTICS AND MEMORY COMPONENT SIZES
The following query displays information about the SGA and its’ main memory components: SELECT * FROM v$sga;
This query gives you four components in the SGA; fixed, variable, database and redo buffers. This query uses the v$sga view to display the individual components. SELECT NAME memory_component, ROUND (VALUE / 1048576, 2) memory_size FROM v$sga WHERE NAME IN ('Fixed Size', 'Variable Size') UNION ALL SELECT '-->' || INITCAP (REPLACE (NAME, '_', ' ')) memory_component, ROUND (VALUE / 1048576, 2) memory_size FROM v$parameter WHERE NAME IN ('shared_pool_size', 'large_pool_size', 'java_pool_size') UNION ALL SELECT '-->' || 'Variable: Others' memory_component, (c.VALUE - d.current_size - e.VALUE) / 1048576 memory_size FROM (SELECT NAME, VALUE FROM v$sga WHERE NAME = 'Variable Size') c, (SELECT current_size FROM v$sga_dynamic_free_memory) d, (SELECT SUM (VALUE) VALUE FROM v$parameter WHERE NAME IN ('shared_pool_size', 'large_pool_size', 'java_pool_size')) e UNION ALL SELECT '-->' || 'Unused Memory' memory_component, TO_NUMBER (current_size) / 1048576 memory_size FROM v$sga_dynamic_free_memory UNION ALL SELECT NAME memory_component, ROUND (VALUE / 1048576, 2) memory_size FROM v$sga WHERE NAME = 'Database Buffers' UNION ALL SELECT '-->' || INITCAP (REPLACE (NAME, '_', ' ')) memory_component, ROUND (VALUE / 1048576, 2) memory_size FROM v$parameter WHERE NAME IN ('db_2k_cache_size', 'db_4k_cache_size', 'db_8k_cache_size', 'db_16k_cache_size', 'db_32k_cache_size', 'db_cache_size', 'db_keep_cache_size', 'db_recycle_cache_size' ) UNION ALL SELECT NAME memory_component, ROUND (VALUE / 1048576, 2) memory_size
The following query displays information about how many granules are allocated in the SGA for various memory components and how many are free or invalid. SELECT granstate granule_status, COUNT (*) granules, SUM (gransize) / 1048576 total_size FROM x$ksmge GROUP BY granstate;
A sample output would be GRANULE_STATUS GRANULES TOTAL_SIZE -------------------- ---------- ---------- ALLOCATED 22 176 INVALID 7 56
You can see that there are 7 granules of 8MB each that you are free to allocate to any memory component.
AUTOMATIC SQL EXECUTION MANAGEMENT
CONCEPTS
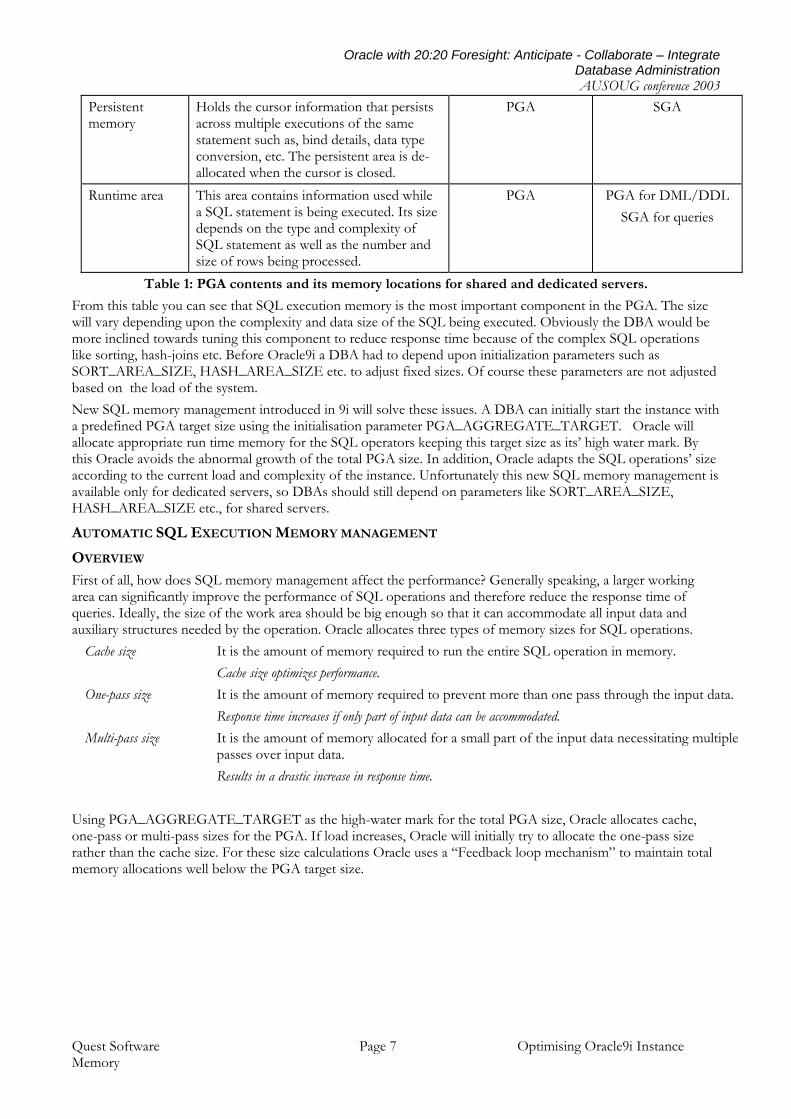
Oracle allocates a private process memory area for each server process called the “Program Global Area” or PGA. This memory will be allocated whether the type of connection is dedicated or shared. The contents and location of the memory will vary depending upon the type of connection. Table 1 lists the two main components and their corresponding memory locations for dedicated and shared servers.
PGA Contents Description Memory location for dedicated servers
Memory location for shared servers
Session memory Holds session’s logon information and other details regarding session.
PGA SGA
SQL Execution memory
Holds data such as bind information and runtime memory structures
Holds the cursor information that persists across multiple executions of the same statement such as, bind details, data type conversion, etc. The persistent area is de-allocated when the cursor is closed.
PGA SGA
Runtime area This area contains information used while a SQL statement is being executed. Its size depends on the type and complexity of SQL statement as well as the number and size of rows being processed.
PGA PGA for DML/DDL SGA for queries
Table 1: PGA contents and its memory locations for shared and dedicated servers.
From this table you can see that SQL execution memory is the most important component in the PGA. The size will vary depending upon the complexity and data size of the SQL being executed. Obviously the DBA would be more inclined towards tuning this component to reduce response time because of the complex SQL operations like sorting, hash-joins etc. Before Oracle9i a DBA had to depend upon initialization parameters such as SORT_AREA_SIZE, HASH_AREA_SIZE etc. to adjust fixed sizes. Of course these parameters are not adjusted based on the load of the system. New SQL memory management introduced in 9i will solve these issues. A DBA can initially start the instance with a predefined PGA target size using the initialisation parameter PGA_AGGREGATE_TARGET. Oracle will allocate appropriate run time memory for the SQL operators keeping this target size as its’ high water mark. By this Oracle avoids the abnormal growth of the total PGA size. In addition, Oracle adapts the SQL operations’ size according to the current load and complexity of the instance. Unfortunately this new SQL memory management is available only for dedicated servers, so DBAs should still depend on parameters like SORT_AREA_SIZE, HASH_AREA_SIZE etc., for shared servers.
AUTOMATIC SQL EXECUTION MEMORY MANAGEMENT
OVERVIEW
First of all, how does SQL memory management affect the performance? Generally speaking, a larger working area can significantly improve the performance of SQL operations and therefore reduce the response time of queries. Ideally, the size of the work area should be big enough so that it can accommodate all input data and auxiliary structures needed by the operation. Oracle allocates three types of memory sizes for SQL operations.
Cache size It is the amount of memory required to run the entire SQL operation in memory. Cache size optimizes performance.
One-pass size It is the amount of memory required to prevent more than one pass through the input data. Response time increases if only part of input data can be accommodated.
Multi-pass size It is the amount of memory allocated for a small part of the input data necessitating multiple passes over input data. Results in a drastic increase in response time.
Using PGA_AGGREGATE_TARGET as the high-water mark for the total PGA size, Oracle allocates cache, one-pass or multi-pass sizes for the PGA. If load increases, Oracle will initially try to allocate the one-pass size rather than the cache size. For these size calculations Oracle uses a “Feedback loop mechanism” to maintain total memory allocations well below the PGA target size.
SQL memory management is primarily based on the feedback loop mechanism depicted in Figure 1. The mechanism starts with the active SQL statements. When a SQL operation starts its’ work area profile is registered in the SGA using the “local memory manager” services. A work area profile is the only interface between a SQL operation and the memory manager. It is metadata which describes all the characteristics of a work area: The dynamic view V$SQL_ WORKAREA_ACTIVE best describes its contents. This set is always mutating through two operations.
1. New work area profiles are added when memory intensive SQL operations start processing their input rows. These profiles are removed when corresponding operations complete their execution.
2. To reflect a SQL operation’s current memory needs and consumption, Oracle frequently updates the content of each work area profile.
At any point of time, the set of all active work area profiles closely reflects the PGA memory needs and consumption. The global memory manager is a background daemon which indirectly determines the size of each active work area by publishing a “memory bound” at regular intervals, generally every three seconds. The memory bound is automatically derived from the number and the characteristics of all active work area profiles. It is used to constrain the size of each work area. Hence, the memory bound is high when the overall memory requirement of all active work areas is low and vice-versa. Finally, the local memory manager closes the feedback loop. It uses the current value of the memory bound and the current profile of a work area to determine the correct amount of PGA memory, called expected size, which can be allotted to this work area. The expected size is checked periodically by SQL operators, which are then responsible to adapt their work area size to the specified value. Based on the work area profile and the bound value, Oracle internally determines the size of the work area using the following simple rules:
1. The expected size can never be less than the minimum memory requirement. 2. The expected size can never be more than the cache requirement.
3. If the bound is between the minimum and the cache requirement of the work area, the expected size will be equal to the memory bound, except if the operation is a sort. A sort does not benefit from more memory than the size of one-pass memory unless it can utilize its’ whole cache requirement. So if the operation is a sort and the bound is between one-pass and cache, the sort will only get allocated one-pass memory.
4. If the work area is running in parallel, the expected memory derived by the above three rules will be multiplied by the degree of parallelism (DOP). This is because a parallel operation gets IO, CPU and memory resources in proportion to its DOP.
5. The expected memory can never exceed 5% of the overall memory target if the operation is running serially. This amount is increased to 30% for operations running in parallel. This limit guarantees that a reasonable number of operations are active in the system before we get to a point where most of the PGA memory is allocated. At that point, a sharp increase in the workload is less likely since a large number of operations are running. This smooths the variation in memory consumption and leaves more time for the memory manager to react to any variation in the memory demand.
Figure 2 shows how the global memory manager computes the expected work area size given six work area profiles. For example, a sort operator that needs 7MB to run one-pass and 27MB to run cache uses the first work area profile, WP1. WP3 is used by a parallel hash-join running with degree 2. It requires 67MB to run cache and 11MB to run one-pass. Assuming that the SQL memory target is 133MB, the global memory manager sets the bound to 20MB. This value of the bound would limit the memory consumption of WP1 to its one-pass memory (i.e. 7MB) since WP1 corresponds to a sort and 20MB is not enough to run cache. With a bound set to 20MB, WP3 would get up to 40MB, two times the bound since this work area runs in parallel with degree 2.
Setting the PGA_AGGREGATE_TARGET to a non-zero value will enable automatic SQL execution memory management. When the Automatic SQL Execution Memory Management feature is enabled, any *_AREA_SIZE settings are ignored. However, it is still possible to temporarily revert to the manual mode, either at system or session level, by setting the parameter WORKAREA_SIZE_POLICY to MANUAL. In V$PGASTAT, you can see Oracle splits the total PGA target into two components namely auto and manual target. In manual mode the manual target can become so large it may exceed PGA target size. DBAs should take care when setting automatic SQL execution management to manual.
FOR A NEW DATABASE The initial value of the PGA_AGGREGATE_TARGET initialization parameter should be based on the total amount of memory available to an instance, both SGA as well as PGA. The following rules-of-thumb divide memory between SGA and PGA depending on the nature of workload.
Application Type SGA Size PGA Size OLTP 80% 20% DSS or Data warehousing
70% 30%
Mixed workload 60% 40% Table 2: Memory allocations for various application types
FOR AN EXISTING DATABASE If the total amount of memory available to an instance cannot be precisely determined, the other option is to use the PGA usage statistics collected by the Oracle9i Database. The V$PGASTAT view contains a number of statistics related to the PGA consumption of an instance and is populated in both automatic as well as manual mode. Once the instance has operated in the manual mode for a while, the value of the statistic “Maximum PGA allocated” can provide a very good starting value for the PGA_AGGREGATE_TARGET. This method should be used for setting up the right PGA target for databases migrated from Oracle8i or older releases. MONITORING SGA & PGA MEMORY USAGE
The following dynamic tables are useful to display SGA & PGA memory usage:
V$SGA Summary information about major SGA memory components
V$SGA_DYNAMIC_FREE_MEMORY Information about the amount of SGA memory available for future dynamic SGA resize operations.
V$SGA_DYNAMIC_COMPONENTS Information about the dynamic SGA components.
V$SGASTAT Detailed information on the SGA. V$PGSSTAT Provides PGA memory usage statistics as well as
statistics about the automatic PGA memory manager. Cumulative values in V$PGASTAT are accumulated since instance startup.
V$PARAMETER Advisory tables for shared pool, buffer pool and PGA Target size
ISSUES IN DEALING AUTOMATIC SQL EXECUTION MANAGEMENT
DBAs should be aware of the following issues before they attempt to start up automatic SQL execution management:
1. Automatic memory management will work for dedicated servers only. Those DBAs who would like to use shared servers, should still depend upon the old parameters SORT_AREA_SIZE, HASH_AREA_SIZE etc.,
2. A stale global memory bound can cause severe memory over-allocation. A lot of memory could be allocated before the memory bound is finally refreshed to reflect this sharp variation of the workload.
3. Over-allocation of PGA target is inevitable when many complex queries are submitted simultaneously after the system has been idle.
4. DBAs who would like to use automatic as well as manual SQL execution memory management, should keep shared connections to a minimum so Oracle will use the PGA target size.
5. Keep monitoring PGA target advisory for the right size for the PGA otherwise, as a rule-of-thumb, change the PGA target size to the “Maximum PGA allocated” statistic in V$PGASTAT.
ORACLE ADVISORIES AND ITS USAGE IN RESIZING Oracle advisories are work load estimates of various memory component sizes based on how the component’s performance would be affected by changes in its’ memory size. This is in turn based on the current behaviour of that memory component. For example, in the shared pool, advisories will give you how much parsing would have been done for various memory sizes so that a change from current memory size will give you an estimate of how much parse time savings you can achieve based on the current parse time. Advisories are helpful in finding the best memory sizes for a given memory component. Oracle provides the following advisory views in 9i Release 2.
SHARED POOL ADVISORY The shared pool advisory populates the advisory data in terms of relative parse timesavings to various changes in shared pool size based on the current parse time. The following query will display advisory details: SELECT shared_pool_size_for_estimate, estd_lc_size, estd_lc_memory_objects, estd_lc_time_saved, estd_lc_time_saved_factor, estd_lc_memory_object_hits FROM v$shared_pool_advice
BUFFER CACHE ADVISORY From 9i onwards Oracle supports multiple block size buffer pools. Buffer pool sizes can be specified in bytes or mega bytes instead of number of buffers. Oracle has five type of buffer pools namely 2K, 4K, 8K, 16K and 32K buffer caches. Additionally Oracle has keep and recycle buffer caches. Oracle generates advisories for each of these buffer caches in the dynamic view V$DB_CACHE_ADVICE. You can filter the individual advisory for each type of buffer pool by querying columns NAME (List of values: DEFAULT, KEEP, RECYCLE) and BLOCK_SIZE. The buffer cache advisory populates the advisory data in terms of relative physical reads or changes in various buffer cache sizes based on the current physical reads rate. Oracle presents this advisory in physical miss rates. By resizing buffer cache, memory can be utilized optimally and achieve high IO throughput. The following query will display advisory details for default buffer cache: SELECT size_for_estimate, buffers_for_estimate, estd_physical_read_factor, estd_physical_reads FROM v$db_cache_advice WHERE NAME = ’default’ AND block_size = (SELECT VALUE FROM v$parameter WHERE NAME = ’db_block_size’);
To get an optimal size for buffer cache adopt the diminishing value of return method illustrated in the chart above. After 24MB memory, there wouldn’t be any benefit until you reach 120MB. After 120MB, traversing through the chart, we can find out 144MB is the best size for optimal performance, since after 144MB, there would not be any benefit. There are some issues, for example limited memory bound and other memory components’ performance to be considered, before you do any resizing of any individual memory component.
PGA ADVISORY Referring back to the section on “Automatic SQL Execution Memory Management”, Oracle attempts to allocate three types of memory sizes for SQL operations, namely cache, one-pass and multiple-pass. Unlike cache size, one-pass and multiple pass will consume a considerable amount of IO for SQL operations. So, Oracle introduced a new metric called PGA cache hit ratio for monitoring PGA IO. The PGA cache hit percentage is defined as the percentage of the total amount of data processed by memory intensive SQL operations that were accommodated in the available PGA memory. For example, assuming that four sort operations have been performed in an instance, three with 1 MB input data and a fourth with 100 MB of input data. The total input size is 103 MB. Now if one of the smaller sort operations is run in the one-pass mode, an extra pass over 1 MB of data is performed. Therefore, 1 MB of extra data had to be processed due to the PGA not being large enough. The PGA cache hit percentage in this case, therefore would be (103/(103+1))*100 i.e. 99.03%. The PGA advisory populates the advisory data in terms of relative PGA cache hit ratio changes for various PGA sizes based on the current cache hit ratio. It also predicts the estimated extra bytes read/written for each predicted PGA size. The following query displays the advisory data: SELECT ROUND (pga_target_for_estimate / 1024 / 1024) target_mb, estd_pga_cache_hit_percentage cache_hit_perc, estd_overalloc_count FROM v$pga_target_advice;
Oracle advisories are useful in finding out the right sizes for the memory components based upon its individual performance measure. For example, in the shared pool, Oracle let you know a predicted size to estimate how much parse-time savings you can make by increasing your current size to a predicted size. If you are going to attempt to resize memory component individually, consider the following issues:
• It is hard to estimate, which component can be used to shift memory and which component would be suitable to use that memory
• All memory growth or shrink operations are limited by the maximum SGA size. No memory component can grow more than maximum SGA size.
• Maximum SGA memory is always limited by physical available memory in the system. If the physical memory is not available, Oracle tries to allocate that much memory from virtual memory, which would be bad situation in performance throughput.
• It is hard to compare performance measures between memory components given by the advisories since each performance measure is given in different unit of measurement. For example, we cannot compare parse time savings in the shared pool to relative physical reads changes in the buffer pool.
• No growth operation can succeed without any free memory or granules to grow. Either some free granules should be available or granules have to be provided from some less used or high-performing memory component.
• In most performance tuning cases, overall instance performance is relevant rather than individual memory component performance. This is a classical example when considering the typical load in day-to-day OLTP applications.
In production environments we can conclude the issues of tuning memory are more empirical than heuristic. Our ultimate goal should be overall instance performance rather than satisfying individual memory components given the maximum memory available for an instance.
A holistic approach to resizing memory components will solve the issues mentioned above. This can be explained in the following simple steps.
• Each memory component advisory is converted into their corresponding response timings and all response timings will be added together to get total instance response time.
• Given maximum instance memory, try to find out minimum total response time, using different combination sizes for each memory component.
• Using the order of precedence (importance) of each memory component, a unique combination is obtained and will be presented as recommended values for the individual memory components.
Table 5 explains how to calculate response time for each memory component: advisory.
Memory Component Response time calculation
Shared Pool For each estimated shared pool size, the corresponding parse time savings are subtracted from the current parse timesavings multiplied by the current parse time elapsed.
Buffer Cache For each estimated buffer cache size, the number of physical reads are multiplied by time per IO which is derived from V$SYSTEM_EVENT.
PGA For each estimated PGA target size, the total extra bytes read is converted into the number of temporary segment IOs multiplied by average temporary segment time per IO from V$TEMPSTAT.
Table 5: Memory component and response time calculations
Shared Pool Response time Query: SELECT 'Shared Pool' component, shared_pool_size_for_estimate estd_sp_size, estd_lc_time_saved_factor parse_time_factor, CASE WHEN current_parse_time_elapsed_s + adjustment_s < 0 THEN 0 ELSE current_parse_time_elapsed_s + adjustment_s END response_time FROM (SELECT shared_pool_size_for_estimate, shared_pool_size_factor, estd_lc_time_saved_factor, a.estd_lc_time_saved, e.VALUE / 100 current_parse_time_elapsed_s, c.estd_lc_time_saved - a.estd_lc_time_saved adjustment_s FROM v$shared_pool_advice a, (SELECT * FROM v$sysstat WHERE NAME = 'parse time elapsed') e, (SELECT estd_lc_time_saved FROM v$shared_pool_advice WHERE shared_pool_size_factor = 1) c); A sample output: COMPONENT ESTD_SP_SIZE PARSE_TIME_FACTOR RESPONSE_TIME -------------------- ------------ ----------------- ------------- Shared Pool 24 .9936 1154.2 Shared Pool 32 .9983 1120.2 Shared Pool 40 1 1108.2 Shared Pool 48 1.0012 1099.2 Shared Pool 56 1.0037 1081.2 Shared Pool 64 1.0043 1077.2 Shared Pool 72 1.0047 1074.2 Shared Pool 80 1.0051 1071.2
DB Cache Response time query: SELECT 'DB ' || TO_CHAR (block_size / 1024) || 'K CACHE' component, size_for_estimate cache_size,
estd_physical_read_factor phy_reads_factor, ROUND (estd_physical_reads * timeperio / 100) response_time FROM v$db_cache_advice, (SELECT SUM (time_waited) / DECODE (SUM (total_waits), 0, 1, SUM (total_waits)) timeperio FROM v$system_event WHERE event LIKE 'db file%read'), (SELECT VALUE BLOCKSIZE FROM v$parameter WHERE NAME = 'db_block_size');
A sample output: COMPONENT CACHE_SIZE PHY_READS_FACTOR RESPONSE_TIME -------------------- ---------- ---------------- ------------- DB 8K CACHE 8 1.1474 2871 DB 8K CACHE 16 1.0374 2596 DB 8K CACHE 24 1.0057 2516 DB 8K CACHE 32 1.002 2507 DB 8K CACHE 40 1 2502 DB 8K CACHE 48 .9991 2500 DB 8K CACHE 56 .9979 2497 DB 8K CACHE 64 .9973 2495 DB 8K CACHE 72 .9964 2493 DB 8K CACHE 80 .9958 2492 DB 8K CACHE 88 .995 2490 DB 8K CACHE 96 .9947 2489 DB 8K CACHE 104 .9938 2487 DB 8K CACHE 112 .9932 2485 DB 8K CACHE 120 .9923 2483 DB 8K CACHE 128 .9913 2480 DB 8K CACHE 136 .3678 920 DB 8K CACHE 144 .2235 559 DB 8K CACHE 152 .2152 538 DB 8K CACHE 160 .2006 502 PGA aggregate target response time query: SELECT 'PGA Aggregate Target' component, ROUND (pga_target_for_estimate / 1048576) target_size, estd_pga_cache_hit_percentage cache_hit_ratio, ROUND ( ( ( estd_extra_bytes_rw / DECODE ((b.BLOCKSIZE * i.avg_blocks_per_io), 0, 1, (b.BLOCKSIZE * i.avg_blocks_per_io) ) ) * i.iotime ) / 100 ) response_time FROM v$pga_target_advice, (SELECT /*+AVG TIME TO DO AN IO TO TEMP TABLESPACE*/ AVG ( (readtim + writetim) / DECODE ((phyrds + phywrts), 0, 1, (phyrds + phywrts)) ) iotime, AVG ( (phyblkrd + phyblkwrt) / DECODE ((phyrds + phywrts), 0, 1, (phyrds + phywrts)) ) avg_blocks_per_io FROM v$tempstat) i, (SELECT /* temp ts block size */ VALUE BLOCKSIZE FROM v$parameter WHERE NAME = 'db_block_size') b; A sample output: COMPONENT TARGET_SIZE CACHE_HIT_RATIO RESPONSE_TIME -------------------- ----------- --------------- ------------- PGA Aggregate Target 13 92 383 PGA Aggregate Target 19 100 20
Drawing all these advisories on a single chart as memory required against response time, if you add up the response times for the current size of each memory component you can get the total response time for shared, DB buffer and PGA memory components. Assuming you have 32MB of unused memory in the SGA, how would you allocate this unused memory to these components? In the shared pool you need to increase the current size to 88MB to get minimal improvement in response time. Allocating 32MB (4 granules each of 8Mb) to the shared pool would not create much benefit. In the DB buffer cache if you allocate 2 more granules (40MB to 56MB) you would see some benefit. In the PGA target there won’t be any benefit by increasing its size, in fact we need to shrink the PGA aggregate target size to 24MB. So, out of 4 free granules, allocating two granules improves total response time to less than 3600 seconds. Analyzing in another way, assuming you have 25 free granules (200MB), you can allocate 144MB to the shared pool, 56MB to the DB buffer cache and keep the PGA target size as it is. In this case, total response time is reduced to approximately 1600 seconds. Earlier, we found the same suggestions using diminishing value of return method. However, we cannot apply these sizes, since we have only 32MB unused memory. Thus, by converting all relative factors of each memory component into a common response time unit, it is not hard to analyze whatever unused memory is available. If there are no free granules, it is helpful to see where you may
shrink components to recover memory to reallocate where required. The following query gives you different combinations of memory components sorted with minimum response time as first: WITH sp AS (<Shared pool response time query>), bc AS (<DB cache response time query>), pga AS (<PGA Aggregate Target response time query>) SELECT sp.response_time + bc.response_time + pga.response_time total_response_time, sp.estd_sp_size + bc.cache_size + pga.target_size total_size, sp.estd_sp_size, bc.cache_size, pga.target_size FROM sp, bc, pga WHERE sp.estd_sp_size + bc.cache_size + pga.target_size < 300 ORDER BY 1, 2, 3, 4, 5 Using this approach, it is easy to manage the resizing of memory components.
ADVANTAGES OF THE HOLISTIC APPROACH
Even though response time calculations are slightly skewed our predictions would give us the best values. The degree of skewed response timings is directly proportional to the relative factors in the corresponding advisory. So you never go wrong in predicting the sizes. The main advantages in this approach are:
• It is easy to predict which memory component to recover granules from and which memory component should be increased.
• No growth or shrink operation will be done without any free granules.
• Limited physical memory constraint is well considered by calculations are always constrained by maximum SGA size.
• Overall impact of the instance is considered, rather than the performance of any individual memory component.
• No need to apply the “Diminishing value of return method” to obtain optimal sizes since calculations are based on maximum memory available and the benefit on performance.
CONCLUSION DBAs are always aware that memory is the most critical system resource. Effective utilization of memory is a must for optimal system performance because memory access is faster than accessing data directly from disk. Resizing SGA and PGA memory components benefit the administration of memory resources for optimal performance. Oracle provides advice on how much and how to resize the memory component but leaves the decision to the DBA when to resize. An holistic approach to resizing memory components enables the DBA to resize various memory components to maximize overall system performance to an instance.
4. Resolving Oracle latch contention Guy Harrison, Quest Software
5. Spotlight® on Oracle: 9i Memory Management Drilldown Quest Software www.quest.comQuest Software provide tools for managing all aspects of Oracle Instance tuning but specifically Quest has provided a unique tool for memory management taking into consideration the approach mentioned in this paper.
Figure 7: Quest interface for instance memory management