OPTIMIZATION OF A MORPHING WING GEOMETRY USING A GENETIC ALGORITHM WITH WIND TUNNEL HARDWARE-IN-THE-LOOP By FRANK JOSEPH BORIA A THESIS PRESENTED TO THE GRADUATE SCHOOL OF THE UNIVERSITY OF FLORIDA IN PARTIAL FULFILLMENT OF THE REQUIREMENTS FOR THE DEGREE OF MASTER OF SCIENCE UNIVERSITY OF FLORIDA 2007 1
Transcript
OPTIMIZATION OF A MORPHING WING GEOMETRY USING A GENETIC ALGORITHM WITH WIND TUNNEL HARDWARE-IN-THE-LOOP
By
FRANK JOSEPH BORIA
A THESIS PRESENTED TO THE GRADUATE SCHOOL OF THE UNIVERSITY OF FLORIDA IN PARTIAL FULFILLMENT
OF THE REQUIREMENTS FOR THE DEGREE OF MASTER OF SCIENCE
2 LITERATURE REVIEW ..................................................................................................16
Emulating Desirable Wing Shapes ....................................................................................16 Actuation of a Morphing Wing Structure ..........................................................................17 Optimization Techniques for Acquiring Desired Wing Shapes ........................................18 Hardware for Data Collection............................................................................................19
4 ONE DESIGN VARIABLE MODEL ...............................................................................27
Model Description and Purpose.........................................................................................27 A Study of Aerodynamic Hysteresis..................................................................................28 Initial Alpha Sweep for Predicting Convergence ..............................................................29 Validation of Optimization Procedure ...............................................................................30
5 OPTIMIZATION OF A HIGH-FIDELITY MORPHING WING ....................................40
Model Description .............................................................................................................40 Comparative Lift and Efficiency Curves ...........................................................................41
5
Maximizing Coefficient of Lift Curve...............................................................................41 Maximizing Efficiency Curve............................................................................................43
6 CONCLUSION AND RECOMMENDATIONS FOR FUTURE WORK........................52
Conclusion .........................................................................................................................52 Recommendations for Future Work...................................................................................53
LIST OF REFERENCES...............................................................................................................55
Table Page 4-1 Small coefficient of variation between the ten base data sets and the random data sets
ensures minimal effect of aerodynamic hysteresis on the coefficient of lift. ....................33
4-2 Drag data show acceptably low variation between the ten base data sets and the random data sets.................................................................................................................33
4-3 Efficiency is found to have a variance of the same magnitude as drag, which is sufficient for the procedure to correctly converge upon the optimum servo position. ......33
7
LIST OF FIGURES
Figure Page 3-1 Closed-loop wind tunnel at the University of Florida is pictured with a 24-inch test
3-2 Digital protractor is used to measure the angle of the sting balance that mounts to the U-shape model arm. ...........................................................................................................24
3-3 The servo controller (background) is used to set and hold servo positions, while the serial port adapter (foreground) converts signals from RS232 to TTL. ............................24
3-4 Data exchange between software applications. .................................................................25
3-5 The VIC system hardware setup about a wind tunnel test section.. ..................................26
4-1 The one design variable, rectangular planform model used to validate the optimization process has a single point of actuation that alters camber. ...........................34
4-2 The full field, three-dimensional image, developed by the VIC system, is overlaid on an image of the morphed wing illustrating deformation in the Z-direction.......................34
4-3 Wing shape attained by servo position 1 with velocity at 0 and 16 m/s at 10° AOA. The top left image shows the wind off Z-coordinates of the wing in millimeters. The top right image shows the wind on wing deformation.......................................................35
4-4 Wing shape attained by servo position 250 with velocity at 0 and 16 m/s at 10° AOA....35
4-5 Plot of a series of airfoil shapes attained as a function of servo position. .........................36
4-6 Results of an aerodynamic hysteresis study depict the servo scatter and data coefficient of variance for multiple servo positions. .........................................................37
4-7 Lift coefficient, drag coefficient, and efficiency versus angle of attack are plotted for several servo positions of the one design variable model..................................................38
4-8 Resulting data illustrate the effectiveness of the optimization procedure. A) Initial population. B) Final population. C) Coefficient of lift servo scatter. D) Morphing wing performance comparison for lift coefficient. E) Efficiency servo scatter. F) Morphing wing performance comparison for efficiency. .............................................39
5-1 The two design-variable model morphs the wing geometry through change of camber and reflex. ..........................................................................................................................45
5-2 The full field, three-dimensional image, developed by the VIC system, is overlaid on an image of the morphed wing illustrating deformation in the Z-direction.......................45
8
5-3 Morphed wing surface (Servo Positions: 250,230) with airfoil slices from the 20% and 80% span yields a negative camber and negative reflex.............................................46
5-4 Morphed wing surface (Servo Positions: 1,1) with airfoil slices from the 20% and 80% span yields a positive camber and positive reflex. ....................................................46
5-5 An illustration of the intermediate wing shapes from the 20% span shows the morphing capability of the two design-variable model. ....................................................47
5-6 The lift coefficient and efficiency is plotted using set flat plate and reflex wing geometries. .........................................................................................................................47
5-7 These sample plots illustrate the convergence of the genetic algorithm upon the optimal servo position for maximum lift at 10° angle of attack. .......................................48
5-8 Morphing wing data for optimized lift coefficient. A) The morphing wing performance as compared to the fixed reflex wing and flat plate. B) The optimal servo positions as a function of angle of attack with the corresponding wing shape. .......49
5-9 These sample plots illustrate the convergence of the genetic algorithm upon the optimal servo position for maximum efficiency at 10° angle of attack.............................50
5-10 Morphing wing data for optimized efficiency. A) The morphing wing performance as compared to the fixed reflex wing and flat plate. B) The optimal servo positions as a function of angle of attack with the corresponding wing shape. ................................51
9
Abstract of Thesis Presented to the Graduate School of the University of Florida in Partial Fulfillment of the
Requirements for the Degree of Master of Science
OPTIMIZATION OF A MORPHING WING GEOMETRY USING A GENETIC ALGORITHM WITH WIND TUNNEL HARDWARE-IN-THE-LOOP
By
Frank Joseph Boria
August 2007
Chair: Peter Ifju Major: Aerospace Engineering
Advancements in compliant actuator technologies and flexible composite structures have
enabled true wing morphing capabilities. The resultant effect of these new capabilities is optimal
wing shapes for all flight regimes. With the ever-increasing complexity of these morphing wing
structures comes the challenge of proper shape management for achieving desirable, real-time
flight performance.
Using a wind tunnel with sting balance as a hardware-in-the-loop objective function, a
genetic algorithm is used for optimizing multiple design variable morphing wing structures. This
evolutionary approach to optimization provides a more efficient means of convergence over that
of other conventional optimization techniques.
There are four primary subsystems utilized in the experimental setup. These include the
optimization software, the servo controller, the wind tunnel, and the data acquisition software.
Through the use of a simple text-format software package, data is passed between each of these
subsystems, thereby automating the procedure. A visual image correlation system is used
independently during testing to determine the three-dimensional wing shapes of noteworthy
servo positions.
10
To demonstrate the procedure, a two design-variable morphing wing is fabricated with the
capability of altering camber and trailing edge reflex. Two experiments are conducted for
maximizing the lift coefficient and maximizing efficiency. These experiments result in optimal
servo position versus angle of attack shape functions. Setting the wing shape as a flat plate and
again as a medium camber wing with reflex provides comparative data. These experiments
resulted in a comparatively benign stall characteristic, a 63.4% increase in lift coefficient, and up
to 62.1% increase in maximum efficiency over that of the fixed wing with reflex. Plotting the
performance of the morphing wing, with that of the two arbitrary fixed wing shapes, illustrates
the dramatic improvement achievable by morphing wing structures. Utilizing these procedures
allows for real-time adaptive wing morphing to adjust to the instantaneous changes of flight
attitude and wind conditions.
11
CHAPTER 1 INTRODUCTION
No longer are aircraft confined to fixed wing geometries suiting a single flight regime.
The advancements of actuation and material technologies have enabled true morphing
capabilities. The resultant effect of these new capabilities is optimal wing shapes for all flight
regimes. With the ever-increasing complexity of these morphing wing structures comes the
challenge of proper shape management for achieving desirable, real-time flight characteristics.
The work presented in this thesis is one approach to such a challenge.
Emulating Biological Structures
The study of ornithology shows that each species of bird has evolved to become uniquely
specialized within their habitat. From the perspective of the aerodynamicist, designing an
aircraft to emulate the performance of the falcon for high speed dives, the eagle for highly
efficient soaring, the hovering capability of the humming bird, or the agility of the swift would
be of great value. Ultimately, however, melding each of these desirable flight characteristics on
a single aircraft is the true objective. Such a versatile vehicle could achieve remarkably high lift,
for maximum payload capacity, high speed, to quickly move from waypoint to waypoint, and
high efficiency. Utilizing a morphing wing structure for asymmetric deformations would yield
the ability to maneuver with high agility through complicated urban environments. Such a
vehicle could also maintain stability during the most volatile of flight conditions, such as erratic
and gusting winds among buildings and structures.
Utilizing thin plate composite materials with multiple actuation points, it is possible to
create a morphing wing capable of complex deformation. A noteworthy study on similar
materials with regard to creep is presented by Richard Thomas Haenel [1], which details the
12
evaluation of creep with respect to material deformation. Careful design of such a wing will
yield configurations that significantly outperform conventional fixed wing geometries.
Optimization of Morphing Wing Structures
When a given structure is created to emulate the complexities of what exists in nature, a
method must also be developed to command the structure to take a desired shape. A high fidelity
morphing wing with several actuation points will require a complex control system. The once
rigorous determination of aerodynamic performance for conventional fixed wing geometries has
become an even greater undertaking in multi-variable shape optimization.
While the field of computational fluid dynamics continues to improve, modeling complex
structures of composite makeup remains expensive. It is also difficult to accurately model the
aeroelastic effects on such a structure when it is under load. This becomes increasingly the case
when utilizing thin plate wings. While the use of a wind tunnel may also be expensive, it
provides a source for aerodynamic force data, which take full account of wing deformations due
to aeroelastic effects.
Regardless of the method used for determining aerodynamic forces, a procedure for
optimization must be properly matched to the capability of the wing structure. While a response
surface approach may be well suited for morphing wings with minimal design variables, high-
fidelity morphing wing structures may be more efficiently optimized through the use of a genetic
algorithm. The genetic algorithm is better capable of finding a global optimum more efficiently
than many strategies.
Motivation
The use of a genetic algorithm for optimizing high-fidelity, multiple design variable
morphing wing structures provides a more efficient means of convergence over that of other
conventional optimization techniques.
13
For example, collecting data for a one design variable wing of 10 position increments over
an alpha sweep of 10 angles of attack requires 100 data points. To ensure data validity, these
same data points are typically collected multiple times to ensure precision, which increases the
number of required data points to a minimum of 200. Increasing the models capability through
the use of two design variables increases the number of required data points to 2,000.
Ultimately, the required number of data points increases by an order of magnitude with each
additional design variable. Of course this analysis assumes only 10 position increments are
possible, while the actuators used for this study have 250 position increments.
The use of response surface techniques is a reasonable approach for wings with up to three
and even four design variables. But as the number of design variables grows, it becomes
inefficient. Finding the optimal position of the determined response surface becomes more
difficult to solve. The complexity of the response surface also raises concerns for convergence
upon false, local optimums. The use of this and similar techniques for finding maximum
performance shapes for high-design variable morphing wing structures is ineffective.
Overview
To establish an effective procedure for determining optimal wing shape of a multi-variable
morphing wing, the use of a genetic algorithm with wind tunnel hardware-in-the-loop is
implemented. This procedure is used to determine a specific desired flight characteristic, such as
maximum lift or maximum efficiency. By conducting these optimization tests at several angles
of attack, it becomes possible to obtain optimal wing shapes throughout the range of angles of
attack. Utilizing these data in a control system make it possible to automate real-time wing
morphing for optimal performance during flight. It is the intent of this thesis to present and
implement such a procedure with its proficiencies and detriments.
14
This thesis consists of six chapters. The first chapter outlines the intent and scope of the
investigation. The second chapter details a literature review of prior work related to morphing
wing structures, optimization procedures, and wind tunnel operation and data collection. The
third chapter describes the experimental setup with detail on the wind tunnel and the visual
image correlation system hardware. Also described in this chapter are the optimization software,
the interaction among the programs, and the experimental procedure for error minimization. The
fourth chapter describes the preliminary one design variable model used to validate the
optimization procedure. The fifth chapter describes the multi design variable model used to
illustrate the improved performance the morphing wing has over that of conventional fixed
wings. The sixth chapter closes with a conclusion of the investigation and suggests
recommendations for future work.
15
CHAPTER 2 LITERATURE REVIEW
Through the use of unmanned aerial vehicles it becomes possible to conduct dangerous
missions without endangering the life of a pilot. These vehicles are becoming smaller with
missions that require significant agility for navigating complex urban environments. To see a
bird navigate through such an environment will inspire the concept of its emulation. Through the
ever-maturing field of material science, the morphing capabilities of an aircraft wing are more
capable of simulating a bird in flight.
Emulating Desirable Wing Shapes
The complex system of structural members and joint articulation of a bird’s wing [2] is
difficult to duplicate mechanically with regard to function as well as low weight and high
durability. Studies associating wing shape to function are conducted to differentiate
requirements for static aerodynamics, physiology, and flapping control [3].
Understanding this differentiation leads to morphing wing structures of less complexity
than that of the birds wing. For example, while birds have many layers of feathers that are
moved around to adjust to the specific maneuver they need to perform [4], morphing wing
structures can be fabricated of thin sheet materials, which are manipulated to yield the desired
wing shape.
Currently, many unmanned aerial vehicle designs are based on a flexible wing design
developed at the University of Florida [5],[6]. These thin, flexible wings are beneficial for
dampening the effects of wind gusts and increasing stability during adverse flight conditions.
With regard to wing morphing, they are also easily manipulated for desired control and overall
flight performance using minimal actuation points. An example of this is morphing in the form
of asymmetric wing twist making it is possible to surpass the roll rates of conventional aileron
16
configurations [7]. Another example is the exercise in design optimization conducted by Gano et
al. [8],[9] for a single, high endurance wing that separates into a second wing for greater agility.
Much work has been done to assess the flight characteristics of these flexible wings.
NASA has performed a control assessment and simulation of a micro air vehicle with aeroelastic
wings which adapt to the disturbances during flight [10]. Morphing wing weight equations and
an approach to size morphing aircraft [11] are developed to replace current methods of general
heuristics based on fixed wing aircraft. Also, extensive wind tunnel tests on a variety of flexible
wing configurations showed a decrease in wing incidence, an increase in dihedral and a shift in
maximum camber position that results in a favorable change in pitching moment and lift.
Ultimately, smoother flight characteristics are achieved over that of conventional fixed wings
[12]. A variety of experimental flow tests are conducted on these wings using surface oil flow
visualization, laser based flow visualization, and particle image velocimetry with results that
validate previously determined CFD results [13].
Actuation of a Morphing Wing Structure
Advancements in actuator technologies for these compliant wing structures, such as Macro
Fiber Composites (MFC), Electroactive Polymers (EAP), and Smart Memory Alloys (SMA), are
yielding lightweight, capable devices. The thin, compliant MFC is a type of piezoceramic
composite actuator that is constructed of orthogonal layers of unidirectional piezoceramic fibers
and copper electrodes encased in layers of acrylic and Kapton [14]. These actuators have been
reported to produce high strain levels on the order of 2000 µε [15]. Alternatively, the EAP
actuator is similar to muscle tissue with regard to stress and force capability. This actuator is
capable of large-scale linear motion [16]. Another source of actuation is through the use of an
SMA mechanism. These mechanisms consist of a metallic alloy that act as linear actuators by
contracting when heated and returning to their original shape when cooled [17]. This actuator is
17
lightweight and very effective although precaution must be taken to prevent variations in
temperature, which will affect its performance.
These, and many other, compliant forms of actuation have been developed and utilized for
morphing wing structures. Extensive work on adaptive shape change problems, which determine
methods for morphing a given curve or shape into a target curve or shape, is providing solutions
with a minimal number of actuators [18]. This work leads to the challenge of morphing a wing
not to a single target shape, but rather to adaptively morph the wing real-time during flight to
adjust to the instantaneous changes of flight attitude and wind conditions.
Optimization Techniques for Acquiring Desired Wing Shapes
The use of evolution strategies for optimization of complex design problems began back in
the early sixties [19] and has been gaining momentum over the past fifteen years. Such
strategies emphasize selection, recombination and mutation of a given population to determine
the makeup of the next population set [20]. Each of the members of this new generation is then
evaluated for fitness. Poor performing members are rejected from the next generation while high
performing members are retained. This results in convergence upon an optimal solution after
multiple generations.
The use of a genetic algorithm (GA) has advantages over other techniques when searching
within a complex domain. Due to its evolutionary tactics, the GA is resistant to convergence on
local optimums making it better suited for finding true global optimums. It is also capable of
working with many design variables, which can be discrete, continuous, or mixed [21], [22],
[23].
As morphing wing structures become more complex, the GA solver becomes better
preferred. Studies have already shown the effective use of the GA to optimize fixed airfoil and
wing shape [24] and to better develop composite wings for desired structural characteristics [23].
18
Another study used a sequential surrogate optimization approach with hardware-in-the-loop as
its objective function [25]. While the study was specific to determining the maximum walking
speed of a humanoid robot [26], this use of hardware-in-the-loop is well suited for determining
optimal wing shape for a morphing wing.
Hardware for Data Collection
Wind Tunnel Uncertainty Analysis
By testing the morphing wing in a wind tunnel with a six degree-of-freedom sting balance
to measure forces and moments, an array of performance data is collected. Using the sting
balance as a hardware-in-the-loop objective function, the GA morphs the wing shape for each
member of a given generation. A fitness value for each member is calculated from data received
from the sting balance. Critical to the use of any hardware-in-the-loop optimization procedure is
a determination of the measurement uncertainty for evaluation of data quality. Such an
evaluation of wind tunnel and sting balance performance is documented in [27] and [28].
Visual Image Correlation System
Using the digital image correlation (a.k.a. visual image correlation or VIC) system, a three-
dimensional non-contact full-field measurement of strain and displacements can be attained for a
given structure of composite material [29]. It has successfully been used to determine strains in
specimens of fiber reinforced polymer composites [30]. This system is well suited to determine
wing shapes for differing morphed positions while under flight loads. The supporting principles,
specifications, calibration procedures, and applications are well documented in [31].
19
CHAPTER 3 EXPERIMENTAL SETUP AND DATA ANALYSIS
There are four primary subsystems utilized in the experimental setup. These include the
optimization software, the servo controller, the wind tunnel, and the data acquisition system.
Through the use of simple text-format software, data is passed between each of these
subsystems. This cooperative scheme of utilizing previously independent software programs
provides a means for automating the optimization procedure. The visual image correlation
system is used independently during testing to determine the three-dimensional wing shapes of
noteworthy servo positions.
Wind Tunnel
The primary piece of hardware used for this optimization procedure is the closed-loop
wind tunnel model 407B (Figure 3-1), which is manufactured by Engineering Laboratory
Design. This low-speed, low-turbulence tunnel has been reported to have less than 0.2%
turbulence [13] along the centerline of its 33-inch test section. The tunnel is capable of
producing airspeeds of 2 m/s to 45 m/s with its 250HP motor and 2-stage axial fan.
Extending from the sidewall of the test section is a U-shape model arm (Figure 3-2) that
supports the 6 degree-of-freedom sting balance and rotates the balance/model assembly to the
commanded angle of attack. It is the sting balance that provides all force and moment data to the
software through a National Instruments SCXI 1000 frame. The sting balance, produced by
Aerolab model 01-15, is capable of measuring loads on the order of 0.01 N [13].
Several LabVIEW virtual instruments (VI) are used to control the wind tunnel speed,
temperature, model angle of attack, and sting balance voltage data acquisition. As detailed later
in this chapter, automation of the optimization procedure is achieved by calling these subroutine
VIs from within a primary VI which exchanges loads data with the genetic algorithm software.
20
Servo Controller
Each morphing wing developed for these experiments utilizes Futaba S3102 servo
actuators to attain the surface deformation. These servos supply 4.6 kg·cm of torque and a rate
of 60° in 0.2 seconds. Using Matlab, servo number and position are commanded through the
serial port in a 1200-baud rate, 8-bit, 1-stop, and no-parity form. A sub-module converts the
RS232 signal to transistor-to-transistor logic. Receiving the signal on the morphing wing
structure is a custom servo controller (Figure 3-3) designed and fabricated by Scott Bowman.
This controller features 8 kilobytes of flash memory, a 16-bit high-resolution servo timer, and an
8 MHz ATMEL microprocessor. This servo controller is designed to set and hold commanded
servo positions while the wing undergoes aerodynamic loading.
Software Description
The two primary software packages used for this study are LabVIEW for wind tunnel
control and data acquisition and Matlab for wing morphing control and optimization. A flow
chart of how the information is passed between the programs is shown in Figure 3-4. To initiate
the optimization procedure, an initial population is prescribed to the genetic algorithm. When
the algorithm is started, the first member of the initial population is sent to the subroutine that
commands the servo controller. The servo controller then sets and holds each servo position
thereby morphing the wing. Simultaneously, the servo positions are sent to a text file. At this
point, the genetic algorithm waits for the force and moment data that is associated with the servo
positions to be added to the text file. It determines when this happens by monitoring the text file
size.
While the optimization software is on hold for data, the wind tunnel is brought up to the
required velocity. After the angle of attack is set, the force and moment data are determined
from the sting balance. The text file previously created by the optimization software is accessed
21
and the data is appended to the same line. The resulting line will consist of servo positions
followed by the lift coefficient, drag coefficient, coefficient of side force, coefficient of pitching
moment, and coefficient of yawing moment. The rolling moment is omitted because the system
yields invalid data. This is of no detriment to these sets of experiments since rolling moment has
no contribution in force and is not utilized as a constraint. At this point, the data acquisition
software waits for the next set of servo positions to be added to the text file. As with the
optimization software, it does this by monitoring the file size. When the new servo positions are
added to the text file, the file size will increase thereby triggering the data acquisition software
for the next set of data.
After the force and moment data have been added to the text file, the optimization software
identifies the increase in file size and retrieves the data. The next servo positions are
commanded, and thereby begin the next cycle.
As with any sting balance, there does exist the concern for signal drift. This sting balance
contains a network of strain gauges that is used to measure the elastic strain of the balance.
These strain gauges are susceptible to signal drift due to temperature variations caused by both
environment and self-heating. To manage the signal drift, the wind tunnel software counts the
number of data sets collected. After the fifteenth data set, the tunnel velocity is set to zero and
the model arm is rotated to the original angle of attack. At this point, the data acquisition
software performs an offset nullification of the strain gauge voltages. The tunnel is then brought
back up to the velocity and angle of attack required by the experiment. This simple procedure
ensures data quality and is set to coincide with the genetic algorithm population size of fifteen.
Visual Image Correlation System
Determining the shape of the morphed wing is essential to quantitatively validate the
obtained solutions. Through the use of the visual image correlation (VIC) system, a non-contact
22
full-field shape and deformation tool, the wing shape can be captured and evaluated for any
given morphed configuration. A typical experimental setup with the VIC system is illustrated in
Figure 3-5. This process was developed in the mid 1990s by Helm with a reported resolution on
the order of ± 0.05 mm [32].
The specimen is first uniformly painted with a low-luster color, and then painted with a
highly contrasting, random speckle pattern. Two digital cameras carefully focused on the
specimen. The cameras are triggered such that an image from each is acquired instantaneously.
A plate with high contrast dots of known diameter and spacing is used to calibrate the camera
system. Photos of the plate in different locations of the image frame and at varying angles and
rotations are taken and processed for calibration. After the calibration procedure is complete, the
precise orientation of one camera to the other is known. At this point, the system is now ready to
photograph the specimen. From these images, the software is capable of developing the full-
field three-dimensional shape of the specimen using stereo triangulation.
The system is also used to determine deformation of a specimen under load. By first
taking a no-load reference image of the specimen, then taking another image of the loaded
specimen, the software is capable of calculating the displacement field. This is useful for
determining how much deformation a wing undergoes when in flight.
23
Figure 3-1. The closed-loop wind tunnel at the University of Florida is pictured with a 24-inch test section (image provided by Michael Sytsma).
Figure 3-2. A digital protractor is used to measure the angle of the sting balance that mounts to the U-shape model arm.
Figure 3-3. The servo controller (background) is used to set and hold servo positions, while the serial port adapter (foreground) converts signals from RS232 to TTL.
24
Loop 1
Loop 2
Figure 3-4. These flowcharts illustrate how data is appended to the shared text file.
25
Figure 3-5. This illustration depicts the VIC system hardware setup about a wind tunnel test section.
26
CHAPTER 4 ONE DESIGN VARIABLE MODEL
Model Description and Purpose
To validate the procedures for data collection, a simple one-design-variable model is
utilized. This model is a thin plate wing of rectangular planform with a single point of actuation
that changes the wings camber. The wing consists of a single layer, plain weave carbon fiber
skin and horizontally aligned unidirectional spars that run from wingtip to wingtip every one
inch from the leading edge (illustrated in Figure 4-1). These spars transfer loads such that when
the wing shape is changed at the root, the same shape will be attained at the tips effectively
resulting in an extruded airfoil along the span of wing.
An attachment point at the leading edge permits rotation only. An attachment point at the
70% chord permits both rotation and longitudinal motion. The unconstrained trailing edge allows
for significant deformation when under load. This deformation is an aeroelastic effect caused by
the interaction among inertial, elastic, and aerodynamic forces on the wing. Typical CFD is
expensive when attempting to model this aeroelastic effect, let alone optimize a morphing wing,
and is why this tunnel-in-the-loop procedure is of particular value. Using the VIC system, the
wing shape is determined. It is shown as a topographical overlay on an image of the wing itself
in Figure 4-2. The wind-on deformations, and the airfoils associated with each, are plotted in
Figure 4-3 for servo position 1 (a negatively cambered wing) and Figure 4-4 for servo position
250 (a highly cambered wing).
The model is capable of altering the maximum camber between –7% through 19%.
Utilizing the VIC system, 9 servo positions are selected and photographed to determine the range
of attainable wind-off wing shapes. The normalized airfoils are plotted in Figure 4-5, which help
to illustrate the magnitude of camber change.
27
By collecting data for set servo positions over an array of angle of attacks, the performance
trends of the model become clear. The now predictable performance of this wing is used to
determine whether proper convergence of the genetic algorithm occurs. When it is confirmed
that convergence is achieved repeatedly, the process can then be used to optimize performance
for complex, high fidelity wings capable of sophisticated wing morphing.
A Study of Aerodynamic Hysteresis
Aerodynamic hysteresis occurs when the detached, low Reynolds number flow
inconsistently reattaches thereby resulting in varied performance. Repeatability of wing
performance is essential when conducting optimization tests since the genetic algorithm will
semi-randomly alter servo position while conducting its search. In an effort to determine if
aerodynamic hysteresis exists, a series of tests are conducted.
Five servo positions are used to represent the extremes and intermediate positions within
the range of servo motion. While holding the angle of attack and airspeed constant, ten
consecutive data sets are collected for each of the five servo positions. The standard deviation is
calculated for each of these data sets. This standard deviation is a measure of instrument
precision and is independent of aerodynamic hysteresis.
Data is then collected as the servo positions are varied between the extremes and
intermediate servo positions to measure any effect caused by aerodynamic hysteresis. The data
is sorted into common servo positions and the standard deviation is calculated. If the standard
deviation of the original data sets and the varied data sets coincides within a common range,
aerodynamic hysteresis will have been proven not to exist.
Tests are conducted at 0°, 10°, and 22.5° angles of attack, which represent low drag, high
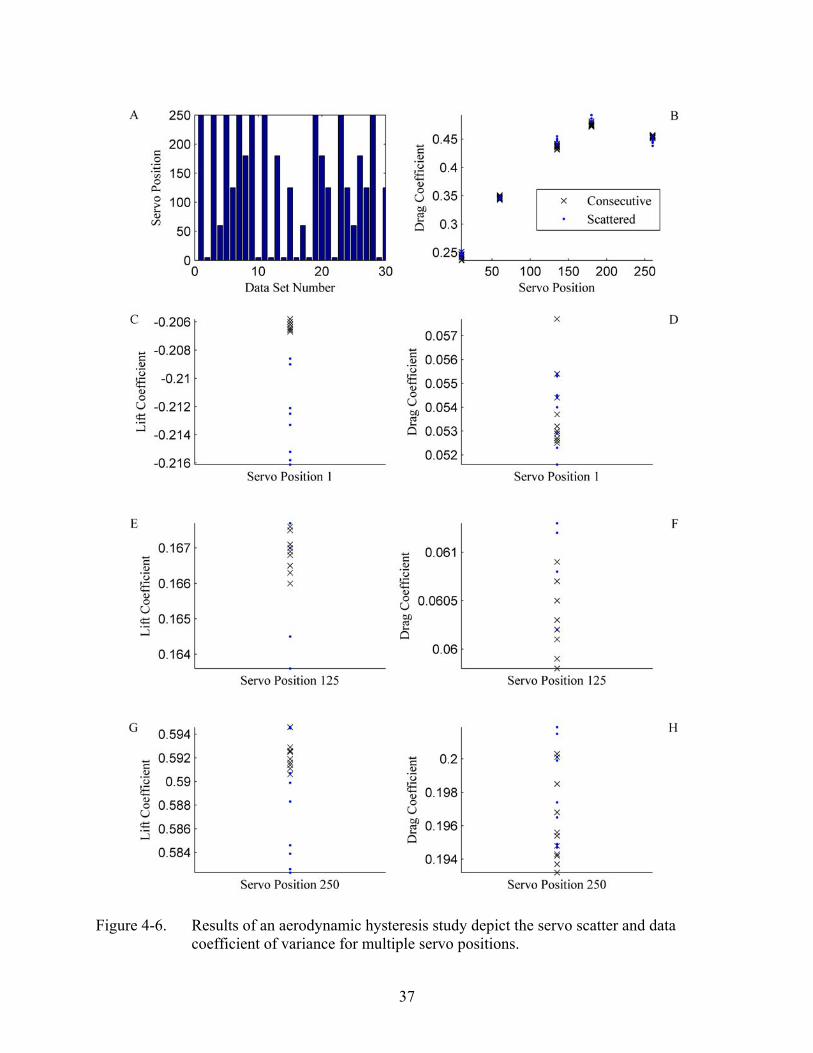
lift, and near-stall flight regimes. Within Figure 4-6, eight plots are provided to illustrate the
results of the study. In Fig. 4-6 (A), the servo position variation used to induce aerodynamic
28
hysteresis is shown. Several sweeps from maximum to minimum and intermediate servo
positions are performed to measure the effect of the hysteresis on the lift and drag coefficients.
The drag coefficient versus servo position, shown in Fig. 4-6 (B), is provided to show the
precision of the data. It is selected since it is the least precise of all data provided by the
instrumentation; this is typically an order of magnitude less than that of the lift coefficient. The
subplots shown in Fig.4-6 (C-H) are magnified data sets for lift and drag coefficients at servo
positions 1, 125, and 250. While the plots clearly show aerodynamic hysteresis does exist, the
standard deviation within a given data set is acceptable with a coefficient of variance of no more
than 2.3% for coefficient of lift (Table 4-1), 2.9% for coefficient of drag (Table 4-2), and 3.4%
for efficiency (Table 4-3).
This study shows the effect of the aerodynamic hysteresis is minimal and has little
influence on the data collected. It is in the author’s opinion, as supported by this study, that the
effects due to aerodynamic hysteresis can be assumed negligible.
Initial Alpha Sweep for Predicting Convergence
To validate the procedure for determining the optimum wing shape, a preliminary set of
data was collected. The servo used in the model is capable of 120° rotation, which is
commanded by the servo controller using position points 1 through 250. This range of servo
position is divided into 9 positions that are used to populate lift, drag, and efficiency plots. For
each servo position, data is collected for angle of attacks ranging from -5° through 30° in 2.5°
increments (Figure 4-7).
In doing this it can be seen that the lift curves systematically increase as camber increases.
The drag plots show an interesting inversion in trend shape as the camber increases, which is
likely due to the aeroelastic effects of the unconstrained trailing edge. Finally, the efficiency plot
29
shows a complex trend, which would have been difficult to predict. By plotting the convergence
data against these plots it becomes clear if the genetic algorithm is finding the true optimum.
Validation of Optimization Procedure
Using the genetic algorithm with the wind tunnel hardware in the loop, tests for
determining servo positions associated with optimal lift and efficiency are conducted. The
optimization procedure is first tested multiple times at set angles of attack to ensure repeatable
convergence on the optimum position. This demonstrates the data collected to be both
sufficiently accurate and precise for this procedure. The optimization procedure is then tested at
several other angles of attack and is compared to the previously acquired alpha sweeps presented
in Figure 4-7. Showing that the converged upon optimal values coincide or exceed predicted
values validates the optimization procedure.
Since the lift forces yield a lower standard deviation than that of the drag forces, it is used
for the initial convergence tests. When calculating efficiency, the lift is divided by the drag
resulting in a much greater coefficient of variance than that of the two individual components.
These tests are conducted after convergence for maximum lift is achieved.
The initial population is user defined and is equally distributed throughout the servo
position range. Setting the initial population in this manner, shown in Figure 4- 8 (A),
significantly reduces the required number of generations to convergence. This occurs because
the lift and efficiency curves as a function of servo position are simple polynomial curves
without complex local minimums. A sample of the final generation is plotted in Figure 4- 8 (B),
which shows convergence on an optimum with subtle deviations from that optimum.
The genetic algorithm selected servo positions, or servo scatter, are plotted in Figure 4- 8
(C) and (E). Note the cluster of data points near the optimum servo positions where the
algorithm narrowed its search. This plot is useful to visually ensure the algorithm searched
30
sufficiently throughout the range of servo positions. A large gap in the scatter will raise
concerns that the true global optimum may have been missed.
By setting the angle of attack to 10°, high lift and drag forces are ensured. Three
optimization experiments are conducted to determine which servo position maximizes lift. As
shown in Figure 4- 8 (D), each experiment converged on a value that exceeded or matched the
predicted value. All three experiments converged to servo position 250, which is associated with
the greatest camber. Due to the variance in lift data, the lift coefficient associated with the
optimal servo position will never converge closer than 2.3% of one another. This does not,
however, prevent the genetic algorithm from properly converging on that optimal servo position.
Due to the low coefficient of variance and the rapid convergence on the optimum servo
position, it is in the author’s opinion that the procedure will accurately converge to the optimum
value regardless of angle of attack. For this reason, the second sets of convergence experiments
for optimal efficiency are conducted.
Continuing to hold the angle of attack at 10°, three convergence experiments for
determination of maximum efficiency are conducted. Since the coefficient of variance for
efficiency is much higher than that of lift, other angles of attack are tested. As shown in Figure
4- 8 (F), each of the three experiments converges on servo position 134 with a maximum
efficiency of 5.56. While this value is below that of the predicted value, it does exist within the
previously calculated variance and did converge on the predicted servo position.
Because the coefficient of drag is very low at 0° and lift will become negative at -5° angle
of attack, the efficiency may vary considerably. For this reason they are tested to ensure proper
convergence. These results are plotted in Figure 4- 8 (F). As illustrated, the optimization
31
procedure did accurately converge upon the correct servo positions. This is because although the
drag forces may be very low, they are consistently low; i.e. precise though not accurate.
These results support high confidence in the optimization procedure. The genetic
algorithm is capable of proper convergence despite the variance in collected wind tunnel data. It
is in the author’s opinion that the procedure will effectively determine optimal wing shapes for
wings with multiple design variables and of higher morphing capability.
32
Table 4-1. Small coefficient of variation between the ten base data sets and the random data sets ensures minimal effect of aerodynamic hysteresis on the coefficient of lift.
0 Deg 10 Deg 22.5 Deg
Lift coefficient of variations % % %
Base 0.14 0.32 1.79 Random 1.36 2.20 2.28 SP 1 Overall 1.83 1.48 2.27
Base 0.34 0.21 0.25 Random 1.17 0.98 1.45 SP 125 Overall 0.72 0.63 1.05
Base 0.19 0.38 0.30 Random 0.83 0.25 1.36 SP 250 Overall 0.66 0.40 0.96
Table 4-2. Drag data show acceptably low variation between the ten base data sets and the
random data sets. 0 Deg 10 Deg 22.5 Deg
Drag coefficient of variations % % %
Base 3.07 3.40 1.90 Random 2.63 2.29 1.67 SP 1 Overall 2.80 2.88 2.04
Base 0.56 1.85 0.81 Random 0.87 1.22 1.26 SP 125 Overall 0.77 1.60 1.47
Base 1.29 1.05 0.39 Random 1.47 0.69 1.24 SP 250 Overall 1.42 1.01 1.11
Table 4-3. Efficiency is found to have a variance of the same magnitude as drag, which is
sufficient for the procedure to correctly converge upon the optimum servo position. 0 Deg 10 Deg 22.5 Deg
Efficiency coefficient of variations % % %
Base 3.05 3.49 2.23 Random 3.13 3.03 1.88 SP 1 Overall 3.39 3.22 2.98
Base 0.54 1.64 0.92 Random 0.46 1.40 0.97 SP 125 Overall 0.94 1.51 1.04
Base 1.22 1.31 0.47 Random 1.00 0.53 1.11 SP 250 Overall 1.39 1.00 0.94
33
Figure 4-1. The one-design-variable, rectangular planform model used to validate the optimization process has a single point of actuation that alters camber.
Figure 4-2. The full field, three-dimensional image, developed by the VIC system, is overlaid
on an image of the morphed wing illustrating deformation in the Z-direction (left image has 19% camber, right image has –7% camber).
34
Figure 4-3. Wing shape attained by servo position 1 with velocity at 0 and 16 m/s at 10°
AOA. The top left image shows the wind off Z-coordinates of the wing in millimeters. The top right image shows the wind on wing deformation.
Figure 4-4. Wing shape attained by servo position 250 with velocity at 0 and 16 m/s at 10°
AOA. The top left image shows the wind off form of the wing in millimeters. The top right image shows the wind on wing deformation, also in millimeters.
35
Figure 4-5. Plot of a series of airfoil shapes attained as a function of servo position.
36
Figure 4-6. Results of an aerodynamic hysteresis study depict the servo scatter and data coefficient of variance for multiple servo positions.
37
Figure 4-7. Lift coefficient, drag coefficient, and efficiency versus angle of attack are plotted for several servo positions of the one design variable model.
38
Figure 4- 8. Resulting data illustrate the effectiveness of the optimization procedure. A) Initial population. B) Final population. C) Coefficient of lift servo scatter. D) Morphing wing performance comparison for lift coefficient. E) Efficiency servo scatter. F) Morphing wing performance comparison for efficiency.
39
CHAPTER 5 OPTIMIZATION OF A HIGH-FIDELITY MORPHING WING
A high-fidelity morphing wing model is fabricated to demonstrate the advantage of the
morphing wing geometry over that of conventional fixed wing geometries. Initial coefficient of
lift and efficiency curves are developed for flat plate and reflex wings. This data is used as a
comparative tool to measure the performance of the morphing wing shapes. The optimization
procedure is conducted for maximum lift and maximum efficiency through a range of angle of
attacks. All experiments are conducted with an unconstrained genetic algorithm.
Model Description
This model is an elliptical planform, thin plate wing (Figure 5-1) consisting of a single
layer, plain weave carbon fiber skin and arced unidirectional carbon fiber spars, which follow the
outer curvature of the planform. As with the one-design-variable model, these spars transfer
loads such that when the wing shape is altered at the root, a similar shape will transfer
throughout the span of the wing. While the model is not capable of transferring the exact airfoil
from the root to the tip it does significantly change the wing shape, which is desired for this
experiment.
The model has two points of actuation, which are positioned at the quarter chord and the
trailing edge. There are two attachment points fixing the wing to the fuselage structure, which
are located at the leading edge and trailing edge. The attachment point at the leading edge
permits rotation only. The attachment point at the trailing edge permits both rotation as well as
longitudinal, linear motion. The quarter chord actuation point significantly modifies the wing
camber on the order of ± 11%, while the trailing edge point of actuation allows for ± 4% wing
reflex.
40
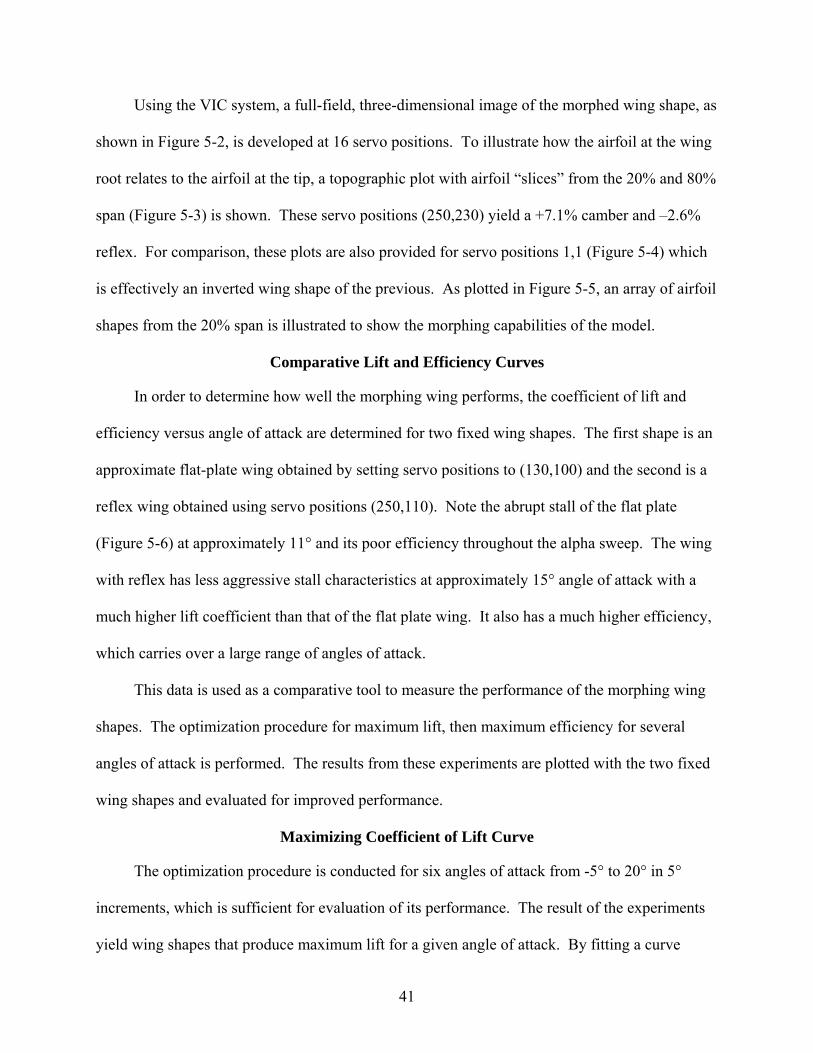
Using the VIC system, a full-field, three-dimensional image of the morphed wing shape, as
shown in Figure 5-2, is developed at 16 servo positions. To illustrate how the airfoil at the wing
root relates to the airfoil at the tip, a topographic plot with airfoil “slices” from the 20% and 80%
span (Figure 5-3) is shown. These servo positions (250,230) yield a +7.1% camber and –2.6%
reflex. For comparison, these plots are also provided for servo positions 1,1 (Figure 5-4) which
is effectively an inverted wing shape of the previous. As plotted in Figure 5-5, an array of airfoil
shapes from the 20% span is illustrated to show the morphing capabilities of the model.
Comparative Lift and Efficiency Curves
In order to determine how well the morphing wing performs, the coefficient of lift and
efficiency versus angle of attack are determined for two fixed wing shapes. The first shape is an
approximate flat-plate wing obtained by setting servo positions to (130,100) and the second is a
reflex wing obtained using servo positions (250,110). Note the abrupt stall of the flat plate
(Figure 5-6) at approximately 11° and its poor efficiency throughout the alpha sweep. The wing
with reflex has less aggressive stall characteristics at approximately 15° angle of attack with a
much higher lift coefficient than that of the flat plate wing. It also has a much higher efficiency,
which carries over a large range of angles of attack.
This data is used as a comparative tool to measure the performance of the morphing wing
shapes. The optimization procedure for maximum lift, then maximum efficiency for several
angles of attack is performed. The results from these experiments are plotted with the two fixed
wing shapes and evaluated for improved performance.
Maximizing Coefficient of Lift Curve
The optimization procedure is conducted for six angles of attack from -5° to 20° in 5°
increments, which is sufficient for evaluation of its performance. The result of the experiments
yield wing shapes that produce maximum lift for a given angle of attack. By fitting a curve
41
through these datum points a simple polynomial equation is calculated. It is this equation that
correlates maximum lift to angle of attack.
The genetic algorithm is capable of converging within just six generations when using a
well distributed initial population as illustrated in Figure 5-7 (bottom left). The topmost plot in
the same figure shows the rapid convergence of the mean performance with the best
performance. The rate of convergence can also be seen from the lack of diversity of the servo
scatter. The pattern of the initial population is still easily defined because the algorithm
immediately hones in on the region of the optimal position. Note that in this case, a second
optimization procedure is conducted, this time with an initial population narrowed around the
optimal region. Once again the algorithm hones almost immediately on the optimum servo
positions, which is well illustrated in the bottom right plot in Figure 5-7. This is a special case
due to the simplicity of the objective function and the small coefficient of variance in the data.
In the following maximum efficiency tests it is shown that convergence will not occur so rapidly.
The performance of the morphing wing as compared to the two fixed wing geometries is
plotted in Figure 5-8 (A). By morphing the wing throughout the alpha sweep, a much greater lift
coefficient is obtained. Note the benign stall characteristics of the morphing wing, which has
little decrease in lift from 15-20°. No tests are conducted beyond the 20° angle of attack due to
the vibrations encountered within this stall region.
Having completed the tests for maximization of lift coefficient, the plot of optimal servo
positions versus angle of attack is acquired and plotted in Figure 5-8 (B). As is expected, the
maximum lift at any given angle of attack will have no reflex and is why the second servo
always converges to position 1. These servo position curves can now be used in a control
system, with angle of attack as input, to yield maximum lift performance.
42
Maximizing Efficiency Curve
Efficiency is calculated by dividing the lift coefficient by the drag coefficient. As
determined in Chapter 4, the coefficient of variance with such a calculation is significantly
greater than that associated with the lift coefficient alone. For this reason, it may take as many as
three times the number of generations for the genetic algorithm to converge on the optimal servo
positions as compared to the prior set of experiments. The optimization procedure is conducted
at seven angles of attack, which are sufficient to populate an efficiency curve. This efficiency
curve is then compared to the efficiencies of the flat plate and reflex wings.
It is seen in Figure 5-9 (top) the algorithm requires approximately 20 generations before
convergence. Note how the mean performance varies throughout the experiment while the best
performance will improve incrementally. This is due to the increased complexity of the
objective function and the increase in the variance in data. As a result, the genetic algorithm
selects much broader and more diverse servo positions to find the optimal region. The scatter
plot in Figure 5-9 (center) best illustrates the diversity in selected servo positions. The final
graphs of the same figure show the varied, well distributed initial population (bottom left) and
the final, converged upon optimum servo positions (bottom right).
The performance of the morphing wing with the two fixed wing geometries are plotted in
Figure 5-10 (A). Morphing the wing to the determined optimal shapes through the alpha sweep
provides a significant improvement in efficiency up to the region of stall. Notably, at 2.5° angle
of attack, the morphing wing has twice the efficiency value as that of the other wings. Having
completed the tests for maximization of efficiency, the plot of optimal servo positions versus
angle of attack is acquired and plotted in
Figure 5-10 (B).
43
Above the servo positions are the optimized wing shapes rotated to the corresponding
angle of attack. Using the equations of these curves in a control system, maximum efficiency as
a function of angle of attack can be achieved. These unpredictable curves illustrate the need for
optimization procedures for highly complex morphing wing structures.
44
Figure 5-1. The two-design-variable model morphs the wing geometry through change of camber and reflex.
Figure 5-2. The full field, three-dimensional image, developed by the VIC system, is overlaid on an image of the morphed wing illustrating deformation in the Z-direction.
45
Figure 5-3. Morphed wing surface (Servo Positions: 250,230) with airfoil slices from the 20% and 80% span yields a negative camber and negative reflex.
Figure 5-4. Morphed wing surface (Servo Positions: 1,1) with airfoil slices from the 20% and 80% span yields a positive camber and positive reflex.
46
Figure 5-5. An illustration of the intermediate wing shapes from the 20% span shows the morphing capability of the two-design-variable model.
Figure 5-6. The lift coefficient and efficiency is plotted using set flat plate and reflex wing geometries.
47
Figure 5-7. These sample plots illustrate the convergence of the genetic algorithm upon the optimal servo position for maximum lift at 10° angle of attack.
48
Figure 5-8. Morphing wing data for optimized lift coefficient. A) The morphing wing performance as compared to the fixed reflex wing and flat plate. B) The optimal servo positions as a function of angle of attack with the corresponding wing shape.
49
Figure 5-9. Sample plots showing the convergence of the genetic algorithm on the optimal servo position for maximum efficiency at 10° angle of attack.
50
Figure 5-10. Morphing wing data for optimized efficiency. A) The morphing wing performance as compared to the fixed reflex wing and flat plate. B) The optimal servo positions as a function of angle of attack with the corresponding wing shape.
51
CHAPTER 6 CONCLUSION AND RECOMMENDATIONS FOR FUTURE WORK
Conclusion
A procedure has been established to achieve proper shape management of morphing wing
structures. It has been demonstrated that utilizing a genetic algorithm with wind tunnel
hardware-in-the-loop is an effective means of determining optimal wing shape functions. The
use of these shape functions enables a morphing aircraft to achieve optimal flight performance in
all flight regimes.
To demonstrate the procedure, a two design-variable morphing wing is fabricated with the
capability of altering maximum camber and trailing edge reflex. Two experiments are conducted
for maximizing the lift coefficient and maximizing efficiency, which resulted in optimal servo
position versus angle of attack shape functions. For a performance comparison, the wing shape
is set as a flat plate and again as a medium camber wing with reflex. These fixed wing shapes
are tested for lift and efficiency performance from -5° to 25° angle of attacks.
Plotting the performance of the morphing wing with that of the two fixed wings illustrates
the dramatic improvement achieved by morphing wing structures. In particular, while the slope
of the lift coefficient curve remains the same for each data set, the morphing wing shows a
63.4% improvement over the fixed reflex wing. Another remarkable attribute of the morphing
wing is its benign stall characteristics. While more data must be collected to determine the
wings performance at angles of attack greater than 20°, it is clear that such a wing can be used to
control and mitigate wing stall.
The experiments for determining maximum efficiency show an equally impressive increase
in performance. Considering the range of -5° to 5° angle of attacks, typical for straight and level
flight and subtle altitude changes, efficiency increases as much as 62.1%.
52
These results support high confidence in the optimization procedure. The genetic
algorithm is capable of proper convergence despite the variance in collected wind tunnel data. It
is in the author’s opinion that the procedure will effectively determine optimal wing shapes for
morphing wings of many design variables and higher morphing capability.
Recommendations for Future Work
There are many valuable wing shape functions that can be attained using this procedure
which have yet to be explored. By simply applying constraints to the genetic algorithm many
new ideas for flight optimization arise.
One such experiment could be to vary the wing shape as a function of velocity to attain a
desired lift. For a given angle of attack, a high velocity would yield minimal camber while a low
velocity would yield a comparatively high camber. Such a shape function would minimize drag
thereby increasing efficiency.
Another interesting study would be to apply the constraint of a desired pitching moment
for each angle of attack to ensure longitudinal stability. Using this constraint while maximizing
lift at very high angles of attack could result in the mitigation of wing stall. Such a wing shape
function would yield a controlled, rate of descent flight mode useful in an auto-land feature.
Of course these shape functions are of no value unless they are utilized in an on-board
control system for real-time wing morphing. Such a control system will receive data such as
angle of attack or velocity and in response, command the position of the actuators. The servo
controller produced by Scott Bowman, which is utilized exclusively for this research, is capable
of such a task.
In a given mission profile for an aerial vehicle, several flight modes may be commanded.
For example, at takeoff the vehicle may require a wing shape that maximizes rate of climb.
When required altitude is met, another wing shape may be commanded to maximize speed to a
53
specified waypoint. At this point the vehicle may be required to conduct surveillance, which
would require a wing shape that would yield maximum efficiency for extended flight time. After
completion of surveillance the vehicle may be commanded to return to another waypoint where it
is required to perform a steep descent angle for landing in a small, confined field. The ability to
switch between these distinct optimal wing shape functions is necessary to maximize the overall
performance of a morphing winged aircraft as it transitions between flight modes.
54
LIST OF REFERENCES
[1] Haenel, R. T., “Creep Deformation of Pin-Jointed Structures,” MS Thesis, The Pennsylvania State University, Pennsylvania, 1955. [2] Gooders, J., and Pledger, M., “Birds of North America,” Edison, New Jersey: Chartwell Books Inc., 1987. [3] Davidson, J., Chwalowski, P., and Lazos, P., “Flight Dynamic Simulation Assessment of a Morphable Hyper-Eliptic Cambered Span Winged Configuration,” 2003 AIAA Atmospheric Flight Mechanics Conference and Exhibit, Austin, TX, AIAA Paper 2003-5301, 2003. [4] Shyy, W., Berg, M., and Ljungqvist, D., “Flapping and Flexible Wings For Biological and Micro Air Vehicles,” Progress in Aerospace Sciences, Vol. 35, No. 5, 1999, pp. 455-506. [5] Ifju, P., Jenkins, D., Ettinger, S., Lian, Y., and Shyy, W., “Flexible-Wing Based Micro Air Vehicles,” AIAA Publication, AIAA Paper 2002-0705, 2002. [6] Albertani, R., Hubner, J., Ifju, P., Lind, R., and Jackowski, J., “Experimental Aerodynamics of Micro Air Vehicles,” SAE World Aviation Congress and Exhibition, Reno, NV, 2004. [7] Stanford, B., Abdulrahim, M., Lind, R., Ifju, P, “Investigation of Membrane Actuation for Roll Control of a Micro Air Vehicle,” Journal of Aircraft, Vol. 44, No. 3, 2007, pp. 741-749. [8] Gano, S., Renaud, J., Batill, S., and Tovar, A., “Shape Optimization for Conforming Airfoils,” 44th AIAA/ASME/ASCE/AHS Structures, Structural Dynamics, and Materials Conference, Norfolk, Virginia, AIAA Paper 2003-1579, 2003. [9] Gano, S., and Renaud, J., “Optimized Unmanned Aerial Vehicle with Wing Morphing for Extended Range and Endurance,” 9th AIAA/ISSMO Symposium and Exhibit on Multidisciplinary Analysis and Optimization, Atlanta, GA, AIAA Paper 2002-5668, 2002. [10] Waszak, M., Davidson, J., and Ifju, P., “Simulation and Flight Control of an Aeroelastic Fixed Wing Micro Aerial Vehicle,” 2002 AIAA Atmospheric Flight Mechanics Conference and Exhibit, Monterey, CA, AIAA Paper 2002-4875, 2002. [11] Skillen, M., and Crossley, W., “Modeling and Optimization for Morphing Wing Concept Generation,” NASA Publication CR-2007-214860, March 2007. [12] Albertani, R., “Experimental Aerodynamic and Static Elastic Deformation Characterization of Low Aspect Ratio Flexible Fixed Wings Applied to Micro Aerial Vehicles,” Ph.D. Dissertation, University of Florida, Gainesville, FL, 2005. [13] Sytsma, M., “Aerodynamic Flow Characterization of Micro Air Vehicles Utilizing Flow Visualization Methods,” MS Thesis, University of Florida, Gainesville, FL, 2006.
55
[14] Bilgen, O., Kochersberger, K., Diggs, E., Kurdila, A., and Inman, D., “Morphing Wing Aerodynamic Control via Macro-Fiber-Composite Actuators in an Unmanned Aircraft,” 2007 AIAA Conference and Exhibit, Rohnert Park, CA, AIAA Paper 2007-2741, 2007. [15] Williams, R., Inman, D., and Keats-Wilkie, W., “Nonliniear Mechanical Behavior of Macro Fiber Composite Actuators,” Center for Intelligent Material Systems and Structures, Department of Mechanical Engineering, Virginia Polytechnic Institute and State University, Undated material. [16] Claverie-Bohn, C., “Dynamic Antifouling Structures and Actuators Using EAP Composites,” Ph.D. Dissertation, University of Florida, Gainesville, FL, 2004. [17] Strelec, J., Lagoudas, D., Khan, M., and Yen, J., “Design and Implementation of a Shape Memory Alloy Actuated Reconfigurable Airfoil,” Journal of Intelligent Material Systems and Structures, Vol. 14, No. 4-5, 2003, pp. 257-273. [18] Lu, K., and Kota, S., “Design of Compliant Mechanisms for Morphing Structural Shapes,” Journal of Intelligent Material Systems and Structures, Vol. 14, No. 6, 2003, pp. 379-391. [19] Rechenberg, I., “Evolutionsstrategie: Optimierung technischer Systeme nach Prinzipien der biologischen Evolution,” Frommann–Holzboog, Stuttgart, 1973. [20] Whitley, D., “An Overview of Evolutionary Algorithms,” Journal of Information and Software Technology, Vol. 43, 2001, pp. 817-831. [21] Rasheed, K., and Hirsh, H., “Learning to be Selective in Genetic-Algorithm-Based Design Optimization,” Artificial Intelligence for Engineering Design, Analysis and Manufacturing, Vol. 13, 1999, pp. 157-169. [22] Herrera, F., Lozano, M., and Molina, D., “Continuous Scatter Search: An Analysis of the Integration of Some Combination Methods and Improvement Strategies,” European Journal of Operational Research, Vol. 169, No. 2, 2006, pp. 450-476. [23] Herrera, F., Lozano, M., and Sánchez, A., “Hybrid Crossover Operators for Real-Coded Genetic Algorithms: An Experimental Study,” Soft Comput, Vol. 9, 2005, pp. 280–298. [24] Naujoks, B., Willmes, L., Haase, W., Bäck, T., and Schütz, M., “Multi-point Airfoil Optimization Using Evolution Strategies,” European Congress on Computational Methods in Applied Sciences and Engineering, Barcelona, 2000. [25] Liu, B., “Two-Level Optimization of Composite Wing Structures Based on Panel Genetic Optimization,” Ph.D. Dissertation, University of Florida, Gainesville, FL, 2001. [26] Hemker, T., “Hardware-in-the-Loop Optimization of the Walking Speed of a Humanoid Robot,” CLAWAR 2006, Brussels, Belgium, 2006.
56
[27] Kammeyer, M., Wind Tunnel Facility Calibrations and Experimental Uncertainty, The Boeing Company, American Institute of Aeronautics and Astronautics, 1998. [28] Springer, A., “Uncertainty Analysis of the NASA MSFC 14-Inch Trisonic Wind Tunnel,” 1999 37th AIAA Aerospace Sciences Meeting and Exhibit, Reno, NV, AIAA-99-0684, 1999. [29] Lopez-Anido, R., El-Chiti, F., Muszyñski, L., Dagher, H., Thompson, L., and Hess, P., “Composite Material Testing Using a 3-D Digital Image Correlation System,” American Composites Manufacturers Association, Tampa, Florida, 2004. [30] Muszyñski, L., Lopez-Anido, R., and Shaler, S., “Image Correlation Analysis Applied to Measurement of Shear Strains in Laminated Composites,” SEM IX International Congress on Experimental Mechanics, Orlando, Florida, 2000. [31] Schmidt, T., Tyson, J., and Galanulis, K., “Full-Field Dynamic Displacement and Strain Measurement Using Advanced 3-D Image Correlation Photogrammetry,” Part I. Experimental Techniques, Vol. 27, No. 3, 2002, pp. 47-50. [32] Helm, J., McNeill, S., and Sutton, M., “Improved 3-D Image Correlation for Surface Displacement Measurement”, Optical Engineering, Vol. 35, No. 7, 1996, pp. 1911-1920.
57
BIOGRAPHICAL SKETCH
Frank Boria was born in Portsmouth, New Hampshire and spent most of his childhood in
York, Maine. When he was 13 years old, he and his family moved to Fernandina Beach, Florida.
During his junior year of high school, Frank won a scholarship to train for his private pilot
license. Having trained in a Citabria 7ECA, a tandem two-seat tail-dragger, Frank received his
pilot license and developed a passion for aviation.
After high school he moved to Tallahassee, Florida where he attended Lively Technical
Center and received his Airframe and Powerplant certifications. With these certifications he
moved to Lake City, Florida where he spent 7 years working at TIMCO, a third-party aircraft
repair station. His experience was primarily focused on aircraft structures for DC9, Boeing 727,
and C130 aircraft. With the understanding of how to fly and maintain an aircraft, his interests
leaned toward understanding the physics of flight and the process of design.
During the final 2 years of work at TIMCO, Frank attended evening classes at Santa Fe
Community College where he received his Associate of Arts degree. He transferred to the
University of Florida where, in 2004, he received his Bachelor of Science degree in aerospace
engineering. He continued his education at the University of Florida, and in 2007, he received
his Master of Science degree in aerospace engineering with a focus on solid mechanics, design,
and manufacturing. Frank now resides in Gainesville, Florida with his beautiful bride, Rikki,
and three wonderful children, Addie, Olivia, and Christian.