26
OPTIMIZATION OF AN HEALTH MONITORING SYSTEM WITH PIEZOELECTRIC SENSOR Team: Fellowship of the Ring Daniel Slavin, Steve Hwang
| Date post: | 01-May-2018 |
| Category: |
Documents |
| Upload: | nguyenhanh |
| View: | 216 times |
| Download: | 3 times |

OPTIMIZATION OF AN
HEALTH MONITORING
SYSTEM WITH PIEZOELECTRIC
SENSOR
Team: Fellowship of the Ring
Daniel Slavin, Steve Hwang

1
ContentsIntroduction .................................................................................................................................................. 2
Background & Motivation ......................................................................................................................... 2
Device Overview ....................................................................................................................................... 2
Project Goal and Critical Subsystems ........................................................................................................ 3
Subsystem 1: Sensor Optimization .............................................................................................................. 4
Subsystem 1 Modeling .............................................................................................................................. 4
Physics Based model: ............................................................................................................................ 4
Data‐based Model ................................................................................................................................. 6
Subsystem 1 Optimization ........................................................................................................................ 7
Subsystem 1 Optimization Problem ...................................................................................................... 7
Optimization Methodology ................................................................................................................... 8
Results ................................................................................................................................................... 9
Sensitivity analysis ................................................................................................................................ 9
Parametric study ................................................................................................................................. 10
Sensitivity analysis .............................................................................................................................. 11
Conclusion ............................................................................................................................................... 11
Subsystem 2: The sensors optimization from mechanical structure .......................................................... 12
Modeling ................................................................................................................................................. 12
Optimization ........................................................................................................................................... 15
Optimization Problem ......................................................................................................................... 15
Optimization Methodology ................................................................................................................. 15
Results ................................................................................................................................................. 15
Sensitivity analysis .............................................................................................................................. 16
Conclusion ............................................................................................................................................... 16
System Level Optimization .......................................................................................................................... 16
Optimization ........................................................................................................................................... 16
Optimization Methodology ................................................................................................................. 16
Results ................................................................................................................................................. 16
Sensitivity Analysis .................................................................................................................................. 17
Conclusion ............................................................................................................................................... 17
Appendix ..................................................................................................................................................... 19

2
Appendix A. Comments from Comfort Testing ....................................................................................... 20
Appendix B. Data Sets Collected for Data‐based Modeling .................................................................... 23
IntroductionBackground&MotivationThe medical industry has been focusing their research in developing non‐invasive constant monitoring
devices for in‐patient’s and out‐patient’s vital signs. Such a device could be an early warning system to
identify problems with infections or medications, reduce cost and complications of invasive procedures,
reduce in‐patient length of stay and help doctors understand rare and complicated diseases by
monitoring out‐patient progress and emergency events.
The MEMs lab in the Mechanical Engineering department with the Michigan Center for integrative
Research for Critical Care is currently developing an atrial pulse sensor made from a piezoelectric
polymer and data collection module to meet this goal. The sensor is placed over an artery that is easy to
access, like those in the wrist, finger, ankle, foot, temple and etc., with a ring or wrist band structure
that can adjust the pressure applied to the sensor. The pulse wave propagated in the artery deforms the
material creating a very detailed vital sign but it is very susceptible to noise and motion artifacts. This
signal is collected, by a portable device, along with measurements from a pressure and temperature
sensor and an accelerometer/ gyroscope, which will be used to develop methods to refine signal clarity
and robustness. This device records the signals, powers the sensors, and send the information over Wi‐
Fi for monitoring and recording.
DeviceOverviewThe portable device for this project will be one that is attached to the finger and contains the piezo
electric sensor the capture the arterial pulse, send the electric output to a module in the wrist, which
convert the pulse into heart rate, Blood pressure, breathing rate, arterial stiffness, and other figures that
help identify critical health signals. It then send the information over wifi to local hospital where the
information is recorded and monitored. The sensor itself is made up of a piezoelectric polymer PVdF
that is laminated, attached to a plastic substrate and is held firmly against the finger with a strap

3
Figure 1 Prototype of continual health monitor device with ring containing piezoelectric sensor and module for data analysis and wireline communication
Figure 2 Close up side view at the ring, with critical components that affect signal output and user comfort, including the piezoelectric sensor, substrate backing, and finger strap.
ProjectGoalandCriticalSubsystemsThe goal of this project is to create a portable monitoring system that is robust and wearable. The device
needs to process signal as well as larger devices currently used in intensive care units, and the signal
quality needs to be balanced with an adequate level of comfort for the users. This helps our team focus
in on two critical subsystems, sensor mechanical design and product comfort, for optimization. Obvious
trade‐off between comfort and signal quality were observed in earlier prototypes of the devices, where
large ring devices that were able to accommodate large sensors output clear and high voltage signal, but
were uncomfortable and inadequate as a portable device.
SUBSTRATE
LEATHER STRAP
SENSOR
4
Subsystem1:SensorOptimizationThe objective goal of this subsystem is to optimize the ring device by maximizing the sensor’s voltage
output while satisfying a number of geometrical constraints and engineering performance constraints.
Subsystem1ModelingTwo different modeling approaches were considered. The first was a physics based model of the sensor
that captures the dynamics of the artery and that of the piezoelectric solid mechanics circuitry and the
electrical structure of the sensor and the circuit. The second approach was data‐based model created
using experimental data from actual prototypes.
PhysicsBasedmodel:The sensor itself is made up of a piezoelectric polymer PVdF that is laminated, attached to a plastic
substrate and is held firmly against the finger with a strap. This sensors is then connected to a circuit on
the wrist module where the signal is processed and recorded.
This model breaks down into three different parts, first the dynamics portion that describes when the
blood pressure pulse causes stresses in the ring that translate to the sensor, secondly a model for the
piezo sensor converts these stresses into a voltage output and finally an electric circuit transforms the
sensors’ voltage output to what is actually read and recorded.
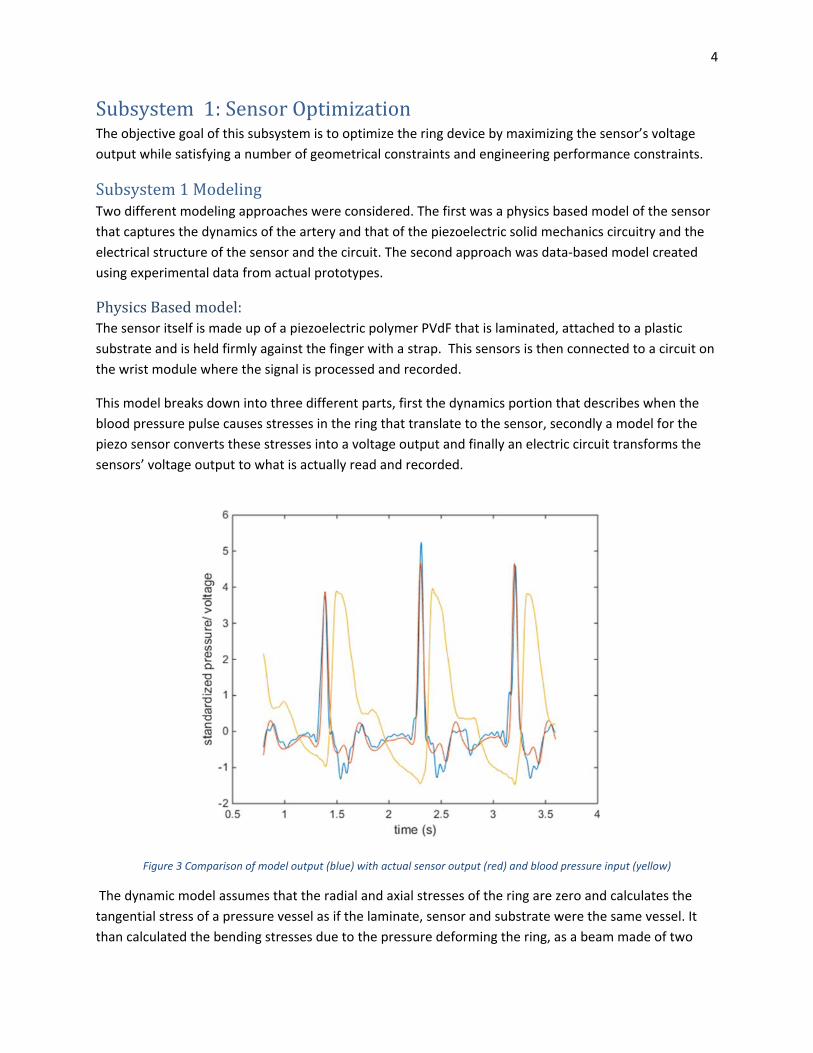
Figure 3 Comparison of model output (blue) with actual sensor output (red) and blood pressure input (yellow)
The dynamic model assumes that the radial and axial stresses of the ring are zero and calculates the
tangential stress of a pressure vessel as if the laminate, sensor and substrate were the same vessel. It
than calculated the bending stresses due to the pressure deforming the ring, as a beam made of two

5
materials the substrate and a material with the combined properties of the sensors and laminate. The
Bending stress for this second material is found and added to the tangential stresses. This stress then
separated from the laminate to determine what the sensor is experiencing. These dynamic use all of the
parameters described in Table 1.
Table 1 Parameters for sensor model
Variable Symbol units
Pressure P Pa
Radius of the Finger r mm
Thickness of the Sensor microns
Thickness of the laminate microns
Thinkness of the substrate mm
Area of sensor (Length x Width) A mm2
Youngs Modulus of Sensor Gpa
Youngs Modulus of Laminate Gpa
Youngs Modulus of Substrate Gpa
These stresses are then used to find the voltage output of the piezo electric model, using the properties
of the PVdF and electric constants found on Table 2. These properties along with the sensors geometry
are also used to model the sensors maximum ability to pick up random noise. The maximum noise is
then added to the output using MATLAB randomizer to try and capture the actual random noise and
levels the sensor would pick up.
Table 2 Properties of PVdF
Property/constant Symbol Value Units Material
Boltzmann’s Constant KB 1.3806e‐23 m2*Kg/s2/K ‐‐ Electric Constant ε0 8.854e‐12 s4A2/m3/Kg ‐‐ Young’s Modulus E_p 8.3 GPa PVdF
Piezo Strain Constant D31 22 pC/N PVdF Relative Dielectic
Constant εr 10e‐12 ‐‐ PVdF
This new output is then processed by the simplest circuit used with the portable device, shown in Figure
4, it is also a good representation the more complex circuits the output signal gets processed through.
Where sensor is represented as a current source and capacitor, this is an important because it
interactions with the circuit causes a differentiation in the signal before it can be recorded.

6
Figure 4 Circuit diagram of ring device
This model takes in actual time series data recorded in the lab, where the blood pressure input is from a
pressure cuff on the arm and corresponding pulse is from a large PZT sensors recorded with Biopac
machine. This allows for the direct comparison of the modeled data to the actual recorded pulse data.
Data‐basedModelIn order to find a data‐based model, Table 3 relevant to the data‐based model were varied to create 9
prototypes and collect 30 datasets from randomized experiments. The details of the design
combinations and experiments are shown in the appendix B. The input data set include variables of
sensor thickness, length, width, substrate thickness, and one parameter of material choice. The material
choice, between cloth and leather, was treated as two Boolean variables for modeling purpose. The
output data set include signal and device characteristics that were analyzed from the output signal data
collected, including peak signal magnitude, noise levels, signal error, and current.
A neural network surrogate model, with one hidden layer and 10 nodes, was created from experimental
data using MATLAB’s neural network toolbox. A 60% ‐ 20 % ‐ 20% ratio was used for training, validation,
and test data sets respectively. The result is shown below in Figure 5.

7
Figure 5 Result from neural network model for the sensor
Subsystem1OptimizationSubsystem1OptimizationProblemThe objective function are the same for both the physics based and data based models and take the
form of the equation below. They are not shown here because of their complexity.
The constraints of the optimization problem include inequality geometric constraints and engineering
performance constraints. The variables and simple geometric constraints of upper and lower bounds are
shown in Table 3 below.
Sensor thickness bounds are based on market availability of materials and manufacturing constraints.
Sensor length and width upper bounds are determined with average human index finger circumference
and segment length; the length wraps around the circumference and width covers up to the length of
the finger segment. The lower bounds for the two variables are determined by manufacturing
constraints. The bounds of substrate thickness, laminate thickness, laminate Young’s Modulus were

8
determined by available material. Those are in practice discrete variables but are treated as continuous
variables for optimization simplicity.
Table 3 Variables used for subsystem 1 optimization
Variables LB UB Model used
Sensor thickness (µm) 28 110 Physics and Data based
Sensor Length (mm) 8 50 Physics and Data based
Sensor Width (mm) 3 10 Physics and Data based
Substrate Thickness (mm) 0 3 Physics and Data based
Laminate Thickness (µm) 1000 50 Physics based
Laminate Young’s Modulus (GPa) 10 0.01 Physics based
Material(cloth/leather) Discrete variable
0 1 Data based
Engineering performance constraints are shown below in Table 4.
Table 4 Engineering performance constraints
Constraint
G1: Signal error ∑ / 0.1 G2: Signal magnitude 60 G3: Signal to noise ratio (SNR) 15G4: Current level 2
Constraints were created for each of these models to increase the level of signal clarity and to be used
with the circuity of the portable device. The most significate constrain was the error from the model to
actual signal. Both the Physics and Data based model used the squared sum of error for each point to
achieve maximum clarity. ∑ , /n. The data based model used the FFT results to
set a signal to ration of 15 dB and a larger signal to 60 Hz noise. Both models used current constraint of
2 nA or larger. This came from experimental data. The Physics bases model also use an equation found
from the linear fit of measured current to the sensors size.
OptimizationMethodologyOptimization was performed with fmincon in MATLab. Two algorithms, Sequential Quadratic
Programming (SQP) and Internal Point (IP), were used, and two solvers, Multi‐Start (MS) (100 initial

9
points) and Global Search (GS), were implemented for finding global minima. The different methods
were tried to ensure robustness of results. Convergence rates and run time were further compared.
Table 5 below shows that while there is no significant difference between the performance of the two
algorithms, GS solver performed better for the cloth model. All objective function results converged to
51 mV for cloth and 46 mV for leather, showing that the results are robust.
Table 5 Results and performances of optimization methods
Solver Algorithm Material Obj [mV] Convergence Time [s]
MS IP cloth 51.2 0.2 132.288
MS SQP cloth 51.2 0.18 131.512
MS IP leather 45.7 0.89 54.793
MS SQP leather 45.7 0.89 48.250s
GS IP cloth 51.2 0.660377358 43.464
GS SQP cloth 51.2 0.32 110.816
GS IP leather 45.7 0.93220339 23.803
GS SQP leather 45.7 0.828571429 18.227
ResultsPhysicsmodelThe optimization results for the physics based model are shown in Table 6, it is evident that the sensor
with the 110 µm thickness had the better optimal point. There are several treads that can be seen from
the table, most interesting is that the optimal length the increases as the as the thickness decreases
becoming 3 times large for the thinnest sensor. The laminate Thickness stays relatively the same for the
110 µm and 52 µm but increases over three time for the 28 µm sensor. These results are even more
surprising, since the optimal results for each sensor without constrains were the same, hitting the lower
bound of all the variables except the substrate thickness hit the upper bound.
Table 6 Optimization of results of subsystem1, physics based model
SensitivityanalysisA sensitivity analysis was performed more the two engineering performance constrains given physics
based model. Each of these inequality constraints were remove one at a time to determine if they were
Max Voltage (mV)
Sensor thickness (µm)
Sensor Length (mm)
Sensor Width (mm)
Substrate Thickness (mm)
Laminate Thickness (µm)
Laminate Young’s Modulus (Gpa)
10.0 110 14.1 4.33 2.86 50 0.54
3.30 52 22.6 5.7 2.7 50 0.55
0.22 28 38.1 6.52 1.81 188 0.48

10
active or inactive. The ones determined to be active were relaxed to find their sensitivity, the results are
shown in Table 7. G1, the error constraint was reality the same for each sensor thickness but the
current constraint was only active for the thinnest sensor. Multi‐Start with 50 initial conditions were
used for these analysis.
Table 7 Sensitivity of the objective function of the physics mode; with respect to engineering performance constraints
Model g1: Error g2: Current
110 0.23 inactive
52 0.25 inactive
28 .28 .011
ParametricstudyIn the parametric study the physics based model was analyzed to determine if any of the constant
parameters would affect the optimization. Six parameters were given small perturbations around the
optimal point found above, the results are shown in Table 8
Table 8 Results of the parametrization study on the physics model
Radius of finger
Young’s Modulus Substrate
Density Substrate
Relative Dielectic PVdF
Young’s Modulus PVdF
Dielectric constant of PVdF
.5 ‐.00002 ‐.025 ‐.6 7.2 500
From the study it clear the properties of the piezoelectric polymer have the largest effect on the output
voltage. The most dramatic is the Dielectric constant, this directly correlates the stress to on the sensor
to it’s voltage out, as it increases so does the output. The Young’s Modulus of the polymer also increases
the output, like due to the fact the stiffer it is the more stress it experiences. The Relative Dielectic
constant decreases the output, this is due the fact that it is used to determine the sensors capacitance
which is inversely related to the output. The radius of the finger has a middle change on the voltage
output, this probably due to the why ring was modeled as a pressure vessel. Both the density and
Young’s Modulus of the substrate decrease the output by very little. This likely means that the material
type change slightly without a significate change in output.
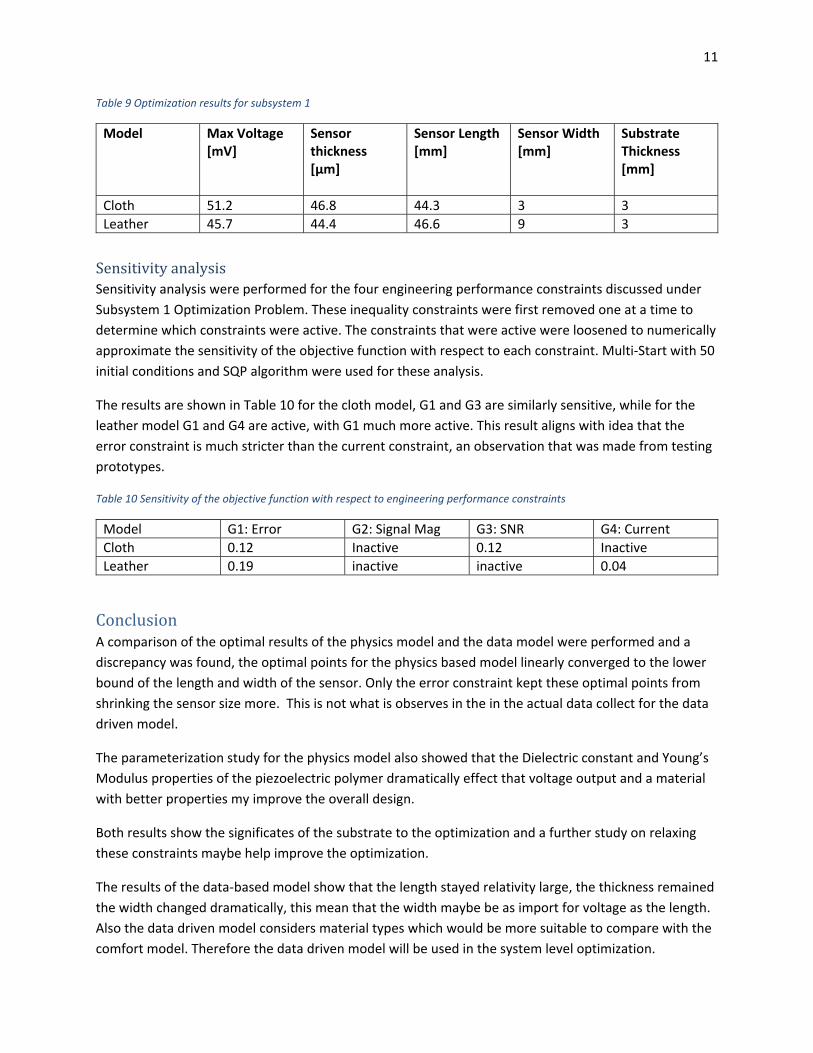
DatabasedmodelThe optimization results for subsystem 1 are shown in Table 9 below. It is clear that a device with cloth
strap could perform better optimally compared to that with leather strap. It is interesting to note that
the optimal sensor width are three times different between the two models, and that both of them
require maximum substrate thickness for optimal performance.
11
Table 9 Optimization results for subsystem 1
Model Max Voltage [mV]
Sensor thickness [µm]
Sensor Length [mm]
Sensor Width [mm]
Substrate Thickness [mm]
Cloth 51.2 46.8 44.3 3 3
Leather 45.7 44.4 46.6 9 3
SensitivityanalysisSensitivity analysis were performed for the four engineering performance constraints discussed under
Subsystem 1 Optimization Problem. These inequality constraints were first removed one at a time to
determine which constraints were active. The constraints that were active were loosened to numerically
approximate the sensitivity of the objective function with respect to each constraint. Multi‐Start with 50
initial conditions and SQP algorithm were used for these analysis.
The results are shown in Table 10 for the cloth model, G1 and G3 are similarly sensitive, while for the
leather model G1 and G4 are active, with G1 much more active. This result aligns with idea that the
error constraint is much stricter than the current constraint, an observation that was made from testing
prototypes.
Table 10 Sensitivity of the objective function with respect to engineering performance constraints
Model G1: Error G2: Signal Mag G3: SNR G4: Current
Cloth 0.12 Inactive 0.12 Inactive
Leather 0.19 inactive inactive 0.04
ConclusionA comparison of the optimal results of the physics model and the data model were performed and a
discrepancy was found, the optimal points for the physics based model linearly converged to the lower
bound of the length and width of the sensor. Only the error constraint kept these optimal points from
shrinking the sensor size more. This is not what is observes in the in the actual data collect for the data
driven model.
The parameterization study for the physics model also showed that the Dielectric constant and Young’s
Modulus properties of the piezoelectric polymer dramatically effect that voltage output and a material
with better properties my improve the overall design.
Both results show the significates of the substrate to the optimization and a further study on relaxing
these constraints maybe help improve the optimization.
The results of the data‐based model show that the length stayed relativity large, the thickness remained
the width changed dramatically, this mean that the width maybe be as import for voltage as the length.
Also the data driven model considers material types which would be more suitable to compare with the
comfort model. Therefore the data driven model will be used in the system level optimization.

12
Subsystem2:ThesensorsoptimizationfrommechanicalstructureModelingConjoint analysis was used to create a comfort model because there is no existing model for ring device
comfort. It is unreliable to determine comfort level from data collected based on methods such as
surveying using questionnaires or images to represent the designs, thus prototypes were created to
collect data from human subjects. The attributes and levels of the attributes for the prototypes were
decided based observation of critical attributes that affect comfort and on the time constraint for our
project.
The larger number of variables for subsystem 1, shown in the section Subsystem 1 Modeling, were
considered and a few prototypes made and tested with subjects to determine that the comfort level of
the ring is most sensitive to the width of the strap, thickness of the substrate backing on the
piezoelectric, and the strap material.
From additionally considering the amount of time required for manufacturing and working with
subjects, twelve prototypes were made based on two levels of strap with, three levels of substrate
thickness, and two different strap materials (cloth vs. leather). Boolean choice data were collected from
pairwise comparisons of designs, where the team conducted randomized experiments that included 10
subjects and collected 50 data points of different pair‐wise comparisons, spanning 76% of the 66
possible pairs for comparison.
Figure 6 Components, sensor assemblies and ring straps, made for comfort data collection. Leather straps are darker in color. 3 levels of sensor assembly thickness and 2 levels of strap width shown.
A linear model for comfort, or utility U, was assumed and shown below in Equation 1.

13
Equation 1
Table 11
Variable Symbol
Width of Strap w
Thickness of Substrate t
Material (discrete boolean var.) m1 and m2
The coefficients of the model were found by maximizing the objective function shown below in Equation
2.
Equation 2
max log
∗
∑ , ,
, , , , , , , , ,
1, 1,
, & , : . 10 01
Fmincon with interior point algorithm in MATLAB was used to find the minimum of the optimization
problem. Table 12 below show the results of the optimization.
Table 12 Optimization results for finding linear comfort model coefficients
f* ∗ ∗ ∗ ∗
83.89 ‐7.51 ‐3.24 1.69 0.3
Surface and contour plots were created to quickly check the validity of the minima. Examples where the
minima is checked with respect to and are shown below.

14
Figure 7 Example surface plot that was used to check validity of minima as a function of B_1 and B_2
Figure 8 Example surface plot that was used to check validity of minima as a function of B_1 and B_2

15
Optimization
OptimizationProblemThe objective function for optimizing comfort is shown in Equation 3 below.
Equation 3
7.51 3.24 1.69 0.3
, , ,
The constraints for the subsystem are independent upper and lower bounds of the variables explained
in Subsystem 1 Optimization Problem and under Equation 2 . The values are stated again below in Table
13 below.
Table 13 Constraints for subsystem 2 variables
Variables LB UB
Strap/Sensor Width (mm) 3 10
Substrate Thickness (mm) 0 3
m1 & m2 (discrete variables) 0 1
OptimizationMethodologyFor optimizing the device made of leather, , 1, 0 and for a device made of cloth , ,0, 1 .
Since the problem objective function is linear and the variables are limited only by their respective
independent upper and lower bounds, solving this optimization problem is trivial and can be done by
simply plugging in maximum values for variables corresponding to a positive coefficient and minimum
values for a variable corresponding to a negative coefficient.
ResultsThe results from optimization shown in Table 14 Optimization results for comfort subsystem below
shows that a ring device created with cloth material has a better optimal than a ring device with leather
material. In fact, since the only difference between the models are constant offsets from coefficients for
the material choice, it could be concluded that in general devices would be more comfortable with cloth
material.
Table 14 Optimization results for comfort subsystem
Model U* (max) w [mm] T [mm] m1 m2
Cloth ‐20.84 3 0 1 0
Leather ‐22.23 3 0 0 1
16
SensitivityanalysisSince model is linear, the sensitivity of the objective with respective to each variable could be easily
determined by inspecting their respective coefficients. The ‐7.51 coefficient for the strap width and the ‐
3.24 coefficient for the substrate thickness show that the model predicts larger comfort with smaller
width and thickness values, and that the comfort is twice as sensitive to strap width as it is to substrate
thickness.
ConclusionA ring device created with cloth material in general is more comfortable than a ring device with leather
material, width and thickness are to be minimized for comfort, and width is twice as strong as thickness
in influencing comfort. Note that these are results derived from a linear model, where all the variables
are assumed to be independent. Observations from comments recorded during experiments with
subjects, shown in Appendix A. Comments from Comfort Testing, reveal that while the linear model
captures the general trend for comfort, there is some level of interaction of the variables that affects
comfort.
SystemLevelOptimization
OptimizationIn order to optimize the whole system that include the sensor subsystem and the comfort subsystem,
the option of having a linear cost function that link the two subsystem was first considered. However,
the team decided against that option because since manufacturing and overall product design for the
device is not mature yet, there is no accurate way to determine cost as a function of geometry, material,
performance, and utility. A new system level optimization problem was ultimately formulated by
including an acceptable, assumed 90%, of maximum utility from the comfort model, as an additional
inequality constraint to the sensor model. The new constraint is shown in Equation 4 below, where
is the utility function shown in Equation 3.
Equation 4
0.9 ∗
Table 15 90% of the maximum utility value in the utility range of the two models
Model U max U min 90% Max U
Cloth ‐20.84 ‐71.6 ‐28
Leather ‐22.23 ‐67.7 ‐29
OptimizationMethodologyFor the objective function and constraints, refer to Subsystem 1 Optimization Problem, Table 3, Table 4,
and Equation 4.
ResultsThe results of system level optimization is shown in Table 16 below. Overall a device with cloth strap can
achieve more optimal voltage performance even with the additional utility constraint. It can also be

17
observed that the objective value of the leather model is much more sensitive to the additional
constraint by its drastic loss of 75% voltage value.
Table 16 System level optimization results and % change from sub system optimal values
Model Max Voltage [mV]
% Change from Sub System 1 optimal
Max Utility % Change from Sub System 2 optimal
Cloth 41.0 ‐38 % ‐28 ‐10 %
Leather 18.0 ‐75 % ‐29 ‐10 %
Comparison of the results of optimization before and after adding the utility constraint, however, a
significant shift in the sensor size could be seen from the change in optimal sensor length and substrate
thickness. The sensitivity of the optimal attribute values indicates that it is important to determine what
is an acceptable value of utility constraint is, otherwise these physical values may not be near a real
optimal for design purpose. The comparison is shown below in Table 17.
Table 17 Comparison of optimization results of cloth model with and without 90% max utility constraint
Model Max Voltage [mV]
Sensor Thickness [µm]
Sensor Length [mm]
Sensor Width [mm]
Substrate Thickness [mm]
Cloth w/o utility constraint
51.2 46.8 44.3 3.0 3.0
Cloth w/ utility constraint
41.0 34.6 8.0 3.0 1.3
SensitivityAnalysisSensitivity analysis revealed that for the cloth model G2 and G4 are inactive, with sensitivity levels
doubled of what was seen prior in Table 10. For the leather model, the sensitivity level for all the
engineering performance constraints are consistently around 0.55 across the board. The optimal of the
leather model is much more sensitive to shifts in constraints.
Table 18 Sensitivity of the objective function with respect to engineering performance constraints
Model G1: Error G2: Signal Mag G3: SNR G4: Current G5: Comfort
Cloth 0.22 Inactive 0.13 Inactive 0.18
Leather 0.56 0.55 0.55 0.55 0.55
ConclusionCurrently a 90% level from maximum utility previously determined is used as an inequality constraint.
Knowing that the optimal variable values are sensitive to the utility constraint, the correct level of utility
is required to achieve a practical design. Further work with subjects could be done to set a realistic value

18
for utility. A nonlinear model, for instance from neural network modeling, that not only captures the
general trend while assuming the variables for utility model are independent could perhaps also serve to
get better results for system level optimization.

19
References[1] “Guide to using Poled PVdF” [Online]. Available: http://acoustics.co.uk/wp‐content/uploads/2013/12/Properties‐of‐poled‐PVDF.pdf
[2] “Material Property Database” [Online]. Available: http://www.mit.edu/~6.777/matprops/polyimide.htm
[3] N. E. Dowling, Mechanical Behavior of Materials, 3nd ed. Upper Saddle River, NJ: Pearson, 2007
[4] Nechibvute, A., Akande, A.R. and Luhanga, P.V.C.,(2011) Modelling of a PZT Beam for Voltage Generation. Universiti Putra Malaysia Press, p. 259 – 271 ISSN: 0128‐7680
[5] Michalek J., Demand Modeling Using Discrete Choice Analysis – Part 1, ME499/599: Analytical Product Design, Aug. 2004

20
AppendixAppendixA.CommentsfromComfortTesting

21
Age Occupation Test Pair Comments
Subject 1
24 Student 1 28 It's kind of hard to feel pulse. The leather is tight but can't feel pulse. Feel the plastic piece in the cloth one is smaller, more comfortable.
2 48 The survey is very thoughtful. Can't move finger as much with wider strap, less comfortable.
3 1 if I am a patiient, might be hard to wrap strap around. Eslatic rubber band that is slip on might be better. Leather is more comfortable than cloth
4 20 My finger is numb. Middle finger works well with wider strap.
5 10 Thin one can move finger more easily, but wide strap give you less pressure so more comfortable that sense. But if I have to wear for an hour, I'd prefer one which I can do more things with.
Subject 2
24 Student 6 7 My fingers turn red really quickly. I'm not sure if I can wear this ring for an extended period of time. The thin cloth pinches my finger even when I'm not moving.
7 13 For obvious reasons the one having no backing is more comfortable, but it seems that the one with backing can feel pulse faster.
8 23 Opposed from expectation, I liked the thicker sensor with leather rather than thinner sensor with cloth.
Subject 3
26 Working 11 28 Could feel with the latter leather prototype, but not the cloth one. Like wider leather one bc. Don't have to tighten as much.
12 16 Don't have the thin leather, bc it constraints finger. Like the more distributed force. Might have personal bias against felt material.
13 14 The sensor thick is very uncomfortable. Feels like c‐clamp on finger.
14 58 The wide geather is favorite so far. User not as pleased with thicker sensor.
15 2 User is visuallybiased. Feel repulsive upon seeing thicker sensor. Says its not too bad though
Subject 4
26 Working 16 45 Like the leather , its pretty soft.
17 28 Like the latter one because it feels less obstrusive. The thin strap cuts into the skin, which also was cloth
18 37 Don't like the thicker sesnro
19 10 1st one softer
Subject 5
24 Working 21 53 The latter feel better. The former felt pinching.The strap cut less into skin bc. Sensor stiffner

22
23 21 The former felt more breathable. Felt like the cool side of pillow. Latter very constricting
24 46 Like the leather, but the sensor thinner felt so much better.
25 58 Almost felt no difference
Subject 6
29 PhD 27 6 Prefer softer leather material
29 12 Like thinner because easier to move
30 58 Like thicker sensor because force more evenly distributed.
Subject 7
25 PhD 31 8 The latter is ichy
32 28 Like the leather
33 64 Thicker sensor too sick.

23
AppendixB.DataSetsCollectedforData‐basedModeling
Test Sensor Thickness (micron)
Sensor Length (mm)
Sensor Width (mm)
Substrate Thickness (mm)
Peak to Peak Voltage (mV)
Maximum Signal frequency (dB)
1 28 25 5 1 0.013266 0.001185
2 28 25 5 0 0.017261 0.000926
3 28 25 5 2 0.012839 0.000588
4 28 25 9 1 0.020452 0.000779
5 28 25 9 2 0.015653 0.000658
6 28 50 9 1 0.017688 0.001556
7 28 50 9 2 0.015251 0.001425
8 52 25 9 0 0.059497 0.008179
9 52 25 9 1 0.048593 0.007673
10 52 25 9 2 0.042563 0.004323
11 52 50 5 1 0.045779 0.004376
12 52 50 9 1 0.033543 0.005555
13 52 50 9 2 0.04299 0.005254
14 110 25 5 1 0.029347 0.00268
15 110 25 5 2 0.027688 0.001883
16 110 50 5 0 0.05505 0.006116
17 110 50 5 1 0.037337 0.002642
18 110 50 5 2 0.02892 0.002183
19 110 50 9 1 0.04299 0.004907
20 110 50 9 2 0.058241 0.004967
21 28 25 9 0 0.012045 0.000777
22 28 25 9 0 0.008427 0.000541
23 28 50 9 0 0.012286 0.001524
24 52 50 5 0 0.029121 0.005009
25 52 50 9 0 0.054623 0.007223
26 52 50 9 0 0.029523 0.004905
27 110 25 5 0 0.01892 0.00113
28 110 25 5 0 0.01892 0.00113
29 110 50 9 0 0.051809 0.004983
24
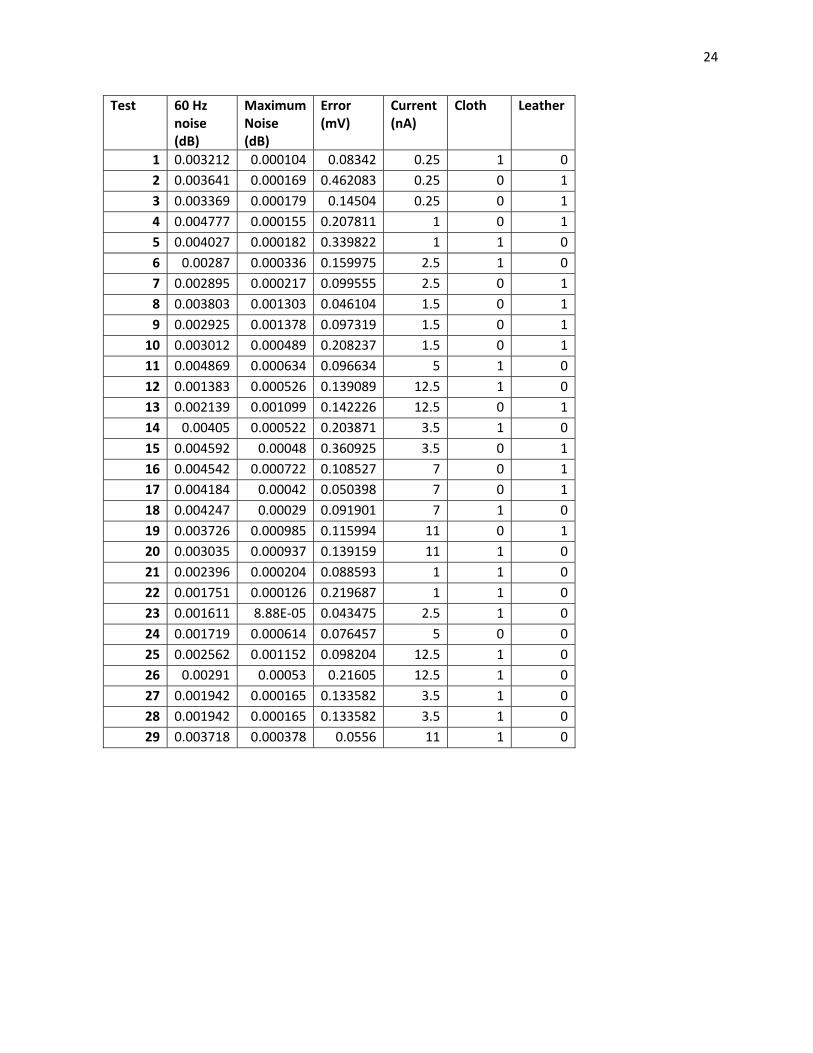
Test 60 Hz noise (dB)
Maximum Noise (dB)
Error (mV)
Current (nA)
Cloth Leather
1 0.003212 0.000104 0.08342 0.25 1 0
2 0.003641 0.000169 0.462083 0.25 0 1
3 0.003369 0.000179 0.14504 0.25 0 1
4 0.004777 0.000155 0.207811 1 0 1
5 0.004027 0.000182 0.339822 1 1 0
6 0.00287 0.000336 0.159975 2.5 1 0
7 0.002895 0.000217 0.099555 2.5 0 1
8 0.003803 0.001303 0.046104 1.5 0 1
9 0.002925 0.001378 0.097319 1.5 0 1
10 0.003012 0.000489 0.208237 1.5 0 1
11 0.004869 0.000634 0.096634 5 1 0
12 0.001383 0.000526 0.139089 12.5 1 0
13 0.002139 0.001099 0.142226 12.5 0 1
14 0.00405 0.000522 0.203871 3.5 1 0
15 0.004592 0.00048 0.360925 3.5 0 1
16 0.004542 0.000722 0.108527 7 0 1
17 0.004184 0.00042 0.050398 7 0 1
18 0.004247 0.00029 0.091901 7 1 0
19 0.003726 0.000985 0.115994 11 0 1
20 0.003035 0.000937 0.139159 11 1 0
21 0.002396 0.000204 0.088593 1 1 0
22 0.001751 0.000126 0.219687 1 1 0
23 0.001611 8.88E‐05 0.043475 2.5 1 0
24 0.001719 0.000614 0.076457 5 0 0
25 0.002562 0.001152 0.098204 12.5 1 0
26 0.00291 0.00053 0.21605 12.5 1 0
27 0.001942 0.000165 0.133582 3.5 1 0
28 0.001942 0.000165 0.133582 3.5 1 0
29 0.003718 0.000378 0.0556 11 1 0

25


