Optimization of beam quality for photon-counting spectral computed tomography in head imaging: simulation study Han Chen Cheng Xu Mats Persson Mats Danielsson Downloaded From: http://medicalimaging.spiedigitallibrary.org/ on 01/14/2016 Terms of Use: http://spiedigitallibrary.org/ss/TermsOfUse.aspx
Transcript
Optimization of beam quality forphoton-counting spectral computedtomography in head imaging:simulation study
Han ChenCheng XuMats PerssonMats Danielsson
Downloaded From: http://medicalimaging.spiedigitallibrary.org/ on 01/14/2016 Terms of Use: http://spiedigitallibrary.org/ss/TermsOfUse.aspx
Optimization of beam quality for photon-countingspectral computed tomography in head imaging:simulation study
Han Chen,* Cheng Xu, Mats Persson, and Mats DanielssonRoyal Institute of Technology (KTH), Department of Physics, Stockholm 106 91, Sweden
Keywords: photon counting; spectral computed tomography; material decomposition; K-edge imaging.
Paper 15107RR received May 20, 2015; accepted for publication Oct. 9, 2015; published online Nov. 6, 2015.
1 IntroductionStroke is caused by the interruption of the blood supply to thebrain due to the blocking of vessels by a thrombus (ischemicstroke) or vessel bursting (hemorrhagic stroke).1 According tothe World Stroke Organization, 15 million people worldwideare affected by stroke each year; of these, 5 million die andanother 5 million are permanently disabled.2 Of all strokes,ischemic stroke accounts for ∼87% of cases and is an importantcause of mortality.3 The major treatment for acute ischemicstroke is the use of intravenous thrombolytic therapy, whichhas been demonstrated as an effective intervention within 3 hof the onset of symptoms.4 Another treatment for acute ischemicstroke is the mechanical removal of thrombuses, namely, throm-bectomy, which has been drawing more and more attention inrecent years.5–7 Prior to both treatments, a rapid head imaging isnecessarily performed to obtain useful information for confirm-ing the diagnosis and aiding the planning of the treatments.
Head imaging has two major modalities, x-ray computedtomography (CT) and magnetic resonance imaging (MRI).Compared to MRI, head CT has the advantages of wide avail-ability, low cost, and, most importantly, short acquisition time.
Typically, a comprehensive CT protocol for acute stroke con-sists of an unenhanced CT, CT angiography (CTA), and some-times CT perfusion (CTP).8,9 Unenhanced head CT scanning isthe first-line diagnostic test that is performed on all patients withstroke symptoms in order to exclude hemorrhage and extensiveinfarction, for which the thrombolytic treatment is not benefi-cial. However, unenhanced CT is limited by the sensitivity(40% to 70%) to ischemic changes.10 Therefore, CTP andCTA should be performed after unenhanced CT.11,12 By trackinga contrast agent (which is typically iodine) injected into blood,CTP can be used to obtain physiological information about thecerebral blood flow, cerebral blood volume, and mean transittime. The information can be interpreted to evaluate the sizeof the infarcted area and distinguish the salvageable tissue
(penumbra) that is at risk of infarction.13 CTA is usually com-bined with CTP to determine the vascular anatomy and throm-bus positions.12
Although the head CT plays an important role in guidingacute stroke management, a major concern is the resulting radi-ation dose to patients. It has been reported that the dose deliv-ered by a comprehensive CT acute stroke protocol is six timeslarger than that of a single unenhanced head CT.8 According tothe linear-no-threshold model, such an amount of radiationimplies six times the potential risk of cancer. The deterministicskin effect caused by overexposure is rare in acute stroke imag-ing,8 but there is one report of hair loss for patients undergoingmultiple CTA and CTP.14 Many researchers have made exten-sive efforts to reduce the radiation exposure in head CT imaging.Smith et al.15 implemented a dose modulation technique inwhich the tube current is automatically adjusted during theCT scan to keep an acceptable noise level. Kalender et al.16 com-pared the performance of CTP between 80 and 120 kVp settingsand showed that 80 kVp reduced the dose by a factor of 2.8without decreasing the contrast. Heavy beam filtration is usuallyrecommended to prevent skin injuries, and its effects on imagequality have been studied previously.17,18
The radiation dose can also be reduced by improving theimage quality with new detector technologies. Photon-countingdetectors are attracting attention for use in the next generation ofx-ray CT. Compared to the conventional energy-integrating CTin which each photon is weighted proportional to the depositedenergy, the photon-counting spectral detector is capable ofdetecting individual photons and sorting them into differentenergy bins. Because the contrast information is generallygreater at low energies, more weight can be assigned to low-energy x-rays.19,20 Some recent studies have demonstratedthat photon-counting spectral detectors with optimal energyweighting improve the signal-difference-to-noise ratio(SDNR) by 10% to 45% compared to energy-integrating detec-tors at the same patient dose.21,22 However, the beam-hardeningartifacts resulting from energy weighting become more severe,23
which would to some extent degrade the diagnosis accuracy. Analternative method of utilizing the spectral information obtainedby photon-counting detectors is to decompose the original set ofenergy-selective images into several basis function images usinga method called material decomposition,24,25 where the energy-dependent attenuation coefficient in each pixel is decomposedinto a linear combination of several energy-dependent basisfunctions. Since the basis function images are naturally energyindependent, the beam-hardening artifacts can be completelyremoved in theory, giving a potential advantage in improvingthe diagnostic accuracy. Moreover, this method opens up newpossibilities for quantitative imaging of contrast agents by mak-ing use of the K-edge discontinuity of their attenuation curves26
(i.e., K-edge imaging). The quantitative information of the con-trast agents allows for more accurate evaluation in CTP and bet-ter identification of thrombuses in CTA. Additionally, indiagnostic procedures requiring pre- and/or postcontrast images,multiple exposures can be avoided, offering a lower dose andless misregistration caused by patient movement between expo-sures. We are developing an energy-resolving photon-countingsilicon-strip detector for CT applications. The previously pub-lished measurements on a single detector module have shownhigh count rate linearity with only 1% count loss at an incidentphoton flux of 300 M photons s−1 mm−1,27 an RMS energy res-olution varying from 1.5 keV for 40 keV photons to 1.9 keV for
100 keV photons,28 and a temperature stability of 0.1 keVthreshold variation per kelvin at 30 keV.29 The simulationstudy by Bornefalk and Danielsson30 shows that by applyingthe energy-weighting scheme, our silicon detector can performon par with ideal energy-integrating detectors for routine imag-ing tasks. The feasibility of using our detector for K-edge im-aging has been performed with a single detector module in atable-top laboratory setup, and the results show that the detectorhas the potential for quantitative measurement of substanceconcentrations.31
Now, we are assembling a full CT detector in a gantry. One ofthe most concerning issues is to optimize the systematic param-eters, especially the beam quality. The purpose of this work is todetermine the optimal beam quality for material decompositionin two head imaging cases: nonenhanced imaging and K-edgeimaging. A simulation study was performed to compare theimage quality relative to the dose received by the head phantomwith a wide range of kVp settings, filter materials, and filterthicknesses. The structure of this paper is as follows. InSec. 2, an analytical framework and figures of merit (FOMs)used for the evaluation of image quality in material decompo-sition are presented. We describe the detector module and sim-ulation setup in Sec. 3.1. In Sec. 3.2, Monte Carlo simulationsare described to calculate the relevant FOMs. The results areshown in Sec. 4 and discussed in Sec. 5.
2 Theory
2.1 Physical Model for Material Decomposition
Material decomposition for CT imaging can be performed bytwo different methods: projection-space decomposition andimage-space decomposition. In the former method, the originalset of energy-selective images for each CT projection is decom-posed into different basis function images before CTreconstruction,32 while the latter one involves material decom-position based on the reconstructed images acquired by differentenergy bins.33 Both of them have been applied to photon-count-ing CT.25,34 In this work, we used projection-space basismaterial decomposition since it allows for a complete elimina-tion of beam-hardening artifacts.
Assuming that a photon-counting spectral detector has Nenergy bins and x-rays detected by the detector are allocatedinto different bins according to their deposited energies, theexpected number of detected events in bin i for one image pro-jection is given by
EQ-TARGET;temp:intralink-;e001;326;254λi ¼Z
keVmax
0
dxdy FFΦðEÞDðEÞSiðEÞe−Rsμðx;y;EÞds
dEþ εi;
(1)
where FF is the fill factor of detector pixels with the size ofdx × dy, ΦðEÞ is the energy distribution of the unattenuatedspectrum in the detector plane in units of ph∕mm2, keVmax isthe maximum energy of incident x-rays, DðEÞ is the detectionefficiency of the detector, and μðx; y;EÞ is the energy-dependentlinear attenuation coefficient in an irradiated object. The sensi-tivity function SiðEÞ describes the probability of an interactingx-ray with the original energy E being detected by bin i; thesensitivity function is determined by
EQ-TARGET;temp:intralink-;e002;326;98Si ¼Z
Tiþ1
Ti
RðE 0; EÞdE 0; (2)
Journal of Medical Imaging 043504-2 Oct–Dec 2015 • Vol. 2(4)
Chen et al.: Optimization of beam quality for photon-counting spectral computed tomography. . .
Downloaded From: http://medicalimaging.spiedigitallibrary.org/ on 01/14/2016 Terms of Use: http://spiedigitallibrary.org/ss/TermsOfUse.aspx
where Ti and Tiþ1 are the lower and upper thresholds of bin i,respectively, and RðE 0; EÞ is the response function giving theprobability that an x-ray with original energy E produces anevent with deposited energy E 0. The last term εi in Eq. (1)accounts for the fraction of detected events in bin i from objectscattering.
The first step of projection-space material decompositioninvolves the decomposition of the attenuation coefficientμðx; y;EÞ into a linear combination of m known energy-depen-dent basis functions fα for each x-ray path through the object:
where aαðx; yÞ refers to the composition of basis material α atposition ðx; yÞ on the x-ray path. Equation (1) can then be rewrit-ten as a function of the line integrals of aα along the x-ray path s,Aα ¼ ∫ saαðx; yÞds:
Let niði ¼ 1; : : : ; NÞ be the outcome observed in the energybin i for one image projection. The second step involves the useof the observed outcome ni in each energy bin to determine theline integral Aα. We apply the maximum likelihood approach forthe estimation of Aα, as discussed by Roessl and Proksa.26
Assuming that N energy bins are independent of each otherand the output from each energy bin follows a Poisson distribu-tion with mean value λi, line integrals Aα are estimated by maxi-mizing likelihood function P, given one measurementfn1; : : : ; nNg:
where Ϝ is the Fisher information matrix with its elements givenby
EQ-TARGET;temp:intralink-;e009;326;752Ϝαβ ¼XNi¼1
1
λi
∂λi∂Aα
∂λi∂Aβ
: (9)
After solving Eq. (7) for Aα for all x-ray paths in each pro-jection,m basis function images representing the distributions oftheir respective compositions over the object are generated sep-arately using reconstruction algorithms. According to the theo-retical work by Hanson,36 a single-pixel variance σ2r in areconstructed image is equal to the variance σ2p of a projectionmeasurement at that pixel multiplied by a constant:
EQ-TARGET;temp:intralink-;e010;326;635σ2r ¼σ2p
p2Mθk2; (10)
where p is the spacing between two neighboring projectionmeasurements,Mθ is the total projection number, and k is a unit-less factor related to a filter kernel used in the imagereconstruction and determined to be k ¼ 0.62 for MATLAB’siradon function with the cropped Ram–Lak ramp filter.37 Bysubstituting Eqs. (8) into (10), the lowest covariance betweenaα and aβ for each reconstructed voxel is obtained:
Statistical decision theory, which is based on hypothesis testing,is extensively used to optimize the image quality in medicalimaging.38–40 A comprehensive description of this theory canbe found in the publication by Barrett and Myers 41 To applythe theory to our photon-counting spectral imaging system,we assume two hypotheses, H0 and H1, representing theabsence and presence of an imaging target, respectively. Thetask is then defined as deciding whether the imaging target ispresent or not. In the following, we consider two imagingcases: nonenhanced imaging and K-edge imaging.
In the absence of a contrast agent, the attenuation of an objectcan be accurately described by a linear combination of eithercontributions from Compton scattering and the photoelectriceffect or the attenuation coefficients of two basis materialswith a distinct difference in the average atomic number.42 Inthis work, we use the latter decomposition manner, takingthe attenuation coefficients of bone μbo and soft tissue μst asbasis functions:
Let a be a 1 × 2 vector a ¼ ðabo; astÞ, with entries being theestimated values of aα for α ∈ fbo; stg. In order to decidewhether the estimated values a belongs to H0 or H1, a discrimi-nant function is formed by properly weighting the bone basisimage and soft tissue basis image together, based on theideal linear observer model:
where w ¼ ðw1; w2Þ is a vector of weighting factors. The out-come of Eq. (13) is then compared to a certain threshold tc suchthat the estimated value a will belong to H0 if t < tc and to H1
otherwise. To minimize the risk of making incorrect decisions,
Journal of Medical Imaging 043504-3 Oct–Dec 2015 • Vol. 2(4)
Chen et al.: Optimization of beam quality for photon-counting spectral computed tomography. . .
Downloaded From: http://medicalimaging.spiedigitallibrary.org/ on 01/14/2016 Terms of Use: http://spiedigitallibrary.org/ss/TermsOfUse.aspx
the weight vector w in the discriminant function TðaÞ is opti-mized in terms of the squared SDNR:
where K0 and K1 are 2 × 2 symmetric covariance matrices fortwo hypotheses, respectively, with the entries beingKαβ ¼ Covðaα; aβÞ; vector Δa ¼ ðΔabo;ΔastÞ describes thedifferences in the expected values of aα between two hypothe-ses. Assuming that the attenuation is uniform in the imagingtarget as well as in its corresponding background, the entriesin Δa can then be calculated as the difference in Aα betweentwo hypotheses divided by the thickness dt of the imaging tar-get:
which can be further written as a function of Aα by substitutingEq. (11) and Eq. (15) into Eq. (17):
EQ-TARGET;temp:intralink-;e018;63;401SDNR2 ¼ p2Mθ
k2d2tΔAðϜ0 þ Ϝ1ÞΔAT: (18)
In order to correctly describe the energy dependence ofthe attenuation in the presence of a contrast agent, the
decomposition of the linear attenuation in Eq. (12) is extendedby adding the attenuation coefficient of the contrast agent as thethird basis function:43,44
In practice, it is more interesting to see the concentration distri-bution of the contrast agent since its presence and amount can beused to characterize the imaging regions of interest. Therefore,for K-edge imaging, we calculated the squared SDNR in thecontrast agent basis image instead of in the combined image:
with ak determined by the line integral Ak divided by the targetthickness dt, that is, Ak∕dt. Substituting Eq. (11) into Eq. (20),the squared SDNR in the reconstruction domain becomes
For both nonenhanced imaging and K-edge imaging, theSDNR2 obtained by varying incident x-ray beams ΦðEÞ is nor-malized by the corresponding dose delivered to the head, anFOM independent of radiation exposure. In this work, twokinds of doses to the head are considered: BD and SD. The for-mer one shows the potential risk of cancer, while the SD is anindicator for skin injuries.
3 Materials and Method
3.1 Description of Detector and Head Phantom
A photograph of a single detector module is shown in Fig. 1(a).The detector module is fabricated on a high-resistivity n-typesilicon substrate with a thickness of 0.5 mm and consists of
Fig. 1 (a) Photograph of a single detector module. X-rays are incident from the top of the detector mod-ule, and the application-specific integrated circuits (ASICs) are located on the right side protected by athick tungsten slab. (b) Illustration of a full computed tomography (CT) detector with a two-layer design.The detector modules are stacked in two different layers, with the lower detector layer offset by onemodule thickness along the x -axis relative to the upper layer.
Journal of Medical Imaging 043504-4 Oct–Dec 2015 • Vol. 2(4)
Chen et al.: Optimization of beam quality for photon-counting spectral computed tomography. . .
Downloaded From: http://medicalimaging.spiedigitallibrary.org/ on 01/14/2016 Terms of Use: http://spiedigitallibrary.org/ss/TermsOfUse.aspx
100 detector strips, each with a pitch of 0.4 mm. As a result, apixel size of 0.5 mm × 0.4 mm is given for each detector stripby orienting the module with its edge directed toward the x-raybeam (i.e., edge-on). The active absorption path along the x-rayincident direction is la ¼ 3 cm, along with a dead layer of ld ¼0.6 mm at the front edge. According to the Lambert–Beer law,the detection efficiency DðEÞ for x-rays with energy E is calcu-lated as
where usiðEÞ is the silicon attenuation coefficient taken from theXCOM database.45 In order to overcome the problem of highphoton fluxes encountered in CT imaging, the detector stripis subdivided into 16 segments along the x-ray incident direc-tion. The segment length is exponentially increased, providing anearly uniform count rate over all segments. Each segment isconnected to an individual electronic readout channel on appli-cation-specific integrated circuits (ASICs) bonded directly to theright side of the silicon substrate. The charge produced by x-rayinteractions is amplified by the ASICs and subsequently con-verted into current pulses, with the pulse height proportionalto the amount of the corresponding deposited energy. The result-ing pulses are compared with eight energy thresholds (N ¼ 8)and then sorted into one of the energy bins sided by two neigh-boring thresholds. More detailed information about the ASICcan be found in earlier publications.27,46
Figure 1(b) illustrates the geometry of a full CT detectorassembly, which consists of a large number (1500 to 2000)of detector modules. To facilitate the cooling and mountingof electronics, the detector modules are stacked in two differentlayers, with the lower detector layer offset by one module thick-ness along the x-axis relative to the upper layer. The backside ofeach detector module is coated by a 30-μm-thick sheet of tung-sten to reduce the scatter radiation between different detectormodules, yielding an FF of around 0.97. In order to rejectthe scatter radiation from objects, the tungsten sheaths at theupper detector layer are extended by 2.5 cm toward the x-raysource, acting as a one-dimensional grid.
Figure 2 shows the schematic of the entire CT gantry with ahead phantom located at the isocenter. The source-to-detectordistance D1 is 1000 mm, and the detector-to-isocenter distanceD2 is 500 mm, resulting in a geometric magnification of 2.Spectrum ΦðEÞ is produced by a tungsten anode x-ray tubewith varying kVp settings and is subsequently filtered by a filterwith atomic number Z and thickness lz. To ensure that the pri-mary x-rays hit the detector surface orthogonally, the entire CTdetector is pointed toward the x-ray source and rotates around anaxis parallel to the z-axis. The spacing p between two neighbor-ing projection acquisitions is assumed to be equal to the pixelwidth dx along the x-axis, giving Mθ ¼ πD2∕dx projectionsover 180-deg rotation.
As for the head phantom studied in this work, a cylindricalbrain tissue is assumed, with a diameter of 16 cm and a length of14 cm, the same size as specified by the Food and DrugAdministration for the head CT dose index measurement.47
To include the effects induced by the skin and the skull, thecylindrical brain phantom is coated by a 6-mm-thick bonelayer and 2-mm-thick skin layer. A blood vessel of diameterdt ¼ 5 mm embedded in the center of the phantom volumeis assumed as an imaging target. The head phantom is irradiatedby a uniformly distributed fan beam with a width of 2 cm alongthe z-axis at the isocenter. In K-edge imaging, two kinds of
contrast agents, iodine and gadolinium, are considered in theblood. Iodine is widely used in CT imaging, but its K-edgeabsorption energy of 33.2 keV is so low that it becomes difficultto easily observe the K-edge discontinuity in the spectrum aftertransmitting objects. Additionally, photon starvation mightoccur in the case of heavy attenuation, making the K-edge dis-continuity totally unobservable. Gadolinium, frequently usedin MRI, has a higher K-edge absorption energy of 50.2 keV,thus promising an improved image quality. The concentrationsof both contrast agents in the blood are assumed to be 5 mg∕mL.
Fig. 2 Schematic of the simulation setup with a full CT detector. Thehead phantom located at the isocenter is irradiated by an x-ray fanbeam with a width of 2 cm, along the z-axis at the isocenter.
Fig. 3 Total attenuation, ∫ μðx; y ;EÞds, for the x-ray path through thephantom center in iodine imaging and its least square fitting with thefunction
PAαμα, α ∈ fbo; st; Iodineg.
Journal of Medical Imaging 043504-5 Oct–Dec 2015 • Vol. 2(4)
Chen et al.: Optimization of beam quality for photon-counting spectral computed tomography. . .
Downloaded From: http://medicalimaging.spiedigitallibrary.org/ on 01/14/2016 Terms of Use: http://spiedigitallibrary.org/ss/TermsOfUse.aspx
The total attenuation, ∫ μðx; y;EÞds, for the x-ray path throughthe phantom center is calculated using the attenuation coeffi-cients of different materials taken from the XCOM database.45
By applying the nonlinear least squares method, the valuesof Aα are determined by fitting ∫ μðx; y;EÞds with the functionP
Aαμα (α ∈ fbo; stg for nonenhanced imaging andα ∈ fbo; st; kg for K-edge imaging. Figure 3 shows an exampleof the least square fitting in the iodine case. The values of Aα forthe x-ray path through the center of the head phantom are sum-marized in Tables 1 and 2, for nonenhanced and K-edge imagingcases, respectively. The same results can also be obtained byreplacing ni in Eq. (7) with the expected value λi and then solv-ing it for Aα.
3.2 Simulation
3.2.1 Sensitivity function Si(E)
As shown in Eq. (2), the sensitivity function SiðEÞ of each bin iis determined by the energy response function RðE 0; EÞ and thecorresponding energy boundaries ½Ti; Tiþ1Þ. The energyresponse function RðE 0; EÞ on the full CT detector is calculatedby Monte Carlo simulations using Geant4 Application forTomographic Emission.48 The monochromatic incident energiesranging from 10 to 130 keV in steps of 1 keV are applied in thesimulation. For each keV, 106 x-rays uniformly incident on thepixel located at the center of the detector plane are tracked untilthey escape from the full detector volume. The position infor-mation and deposited energies of all the interaction events,including characteristic x-rays produced by the tungsten sheets,are recorded. Figure 4(a) shows an example of the distribution ofinteraction positions over the detector plane for 80 keV incidentx-rays. Because of the tungsten shielding, the reabsorptionevents caused by Compton scattering along the x-axis aremuch less than those along the z-axis. In the simulation, itmight be possible that the scattered x-rays are reabsorbed inthe primary interacting pixel. For such events, we take thesum of their deposited energies. It is well known that if anx-ray interaction occurs near the pixel boundary, the chargecloud produced by its deposited energy will expand to becomelarge enough while drifting across the pixel such that the pro-duced charge will be shared by two or more neighboring pixels,an effect called charge sharing. This effect leads to incompletecharge collection and double counting. For our detector geom-etry, charge sharing does not occur along the x-axis since chargecannot be shared between different detector modules. Theimpact of charge sharing on the energy response functionRðE 0; EÞ is taken into account using the charge collectionmodel presented by Bornefalk and Danielsson.30 In thismodel, the charge cloud is assumed to be spherical Gaussiandistributed with a standard deviation, depending on thedeposited energy and interaction depth in the detector. Thecharge leaking to neighboring pixels is simply determined by
Table 1 Values of Aα (cm) in nonenhanced imaging under hypoth-esis H0: absence of a 5-mm-thick blood vessel, and hypothesis H1:presence of the blood vessel, and the difference in Aα between twohypotheses.
H0 H1 ΔAα
Abo 1.2003 1.2019 1.62 × 10⁻³
Ast 16.1745 16.1794 4.93 × 10⁻³
Table 2 Values of Aα (cm) in K-edge imaging for 5 mg∕mL iodine and5 mg∕mL gadolinium.
Iodine Gadolinium
Abo 1.2019 1.2019
Ast 16.1795 16.1795
Ak 5.07 × 10⁻⁴ 3.16 × 10⁻⁴
x (mm)
(a)
z (m
m)
80 keV
−20 −10 0 10 20
−20
−15
−10
−5
0
5
10
15
20
1
5
10
40
150
500
1000
Countsper μm2
0 10 20 30 40 50 60 70 80 90 1000
0.02
0.04
0.06
0.08
0.1
0.12
0.14
0.16
keV
(b)
frac
tion
(%)
80 keV
Primary interaction
Secondary interaction
R(E’,E) w/o σe
R(E’,E) w/ σe
Fig. 4 (a) Resulting distribution of interaction positions in the detector plane for 80-keV incident x-rays.(b) Energy distributions of primary (blue line) and secondary (green line) events for 80-keV incident x-rays, and the energy response functions with and without the effect of electronic noise σe .
Journal of Medical Imaging 043504-6 Oct–Dec 2015 • Vol. 2(4)
Chen et al.: Optimization of beam quality for photon-counting spectral computed tomography. . .
Downloaded From: http://medicalimaging.spiedigitallibrary.org/ on 01/14/2016 Terms of Use: http://spiedigitallibrary.org/ss/TermsOfUse.aspx
integrating the charge cloud over the neighboring pixel volumes,disregarding the distortion of electric field between the pixels.
The resulting distribution of the initially released energyfrom the primary interactions for 80 keV x-rays (blue line) isshown in Fig. 4(b). A tail is observed at the low-energy regionsince a considerable fraction of the x-rays are Compton scatteredand deposit a small amount of energy in the original interactionpositions. Also shown is the energy distribution of the secondaryevents (green line) produced by x-rays scattered from the pixelwith primary interactions or charge leaking to neighboring pix-els. The peaks at around 59 and 67 keV in the curves are due tothe characteristic x-rays produced by the tungsten sheets.Assuming that all the pixels in the detector plane show a uniformresponse to x-rays, the response function RðE 0; EÞ for 80 keV x-rays is then determined by adding together the energy distribu-tions of the primary and secondary interactions [red dotted lineshown in Fig. 4(b)]. It is inevitable that the detected energy willbe altered by electronic noise. In order to include this effect,RðE 0; EÞ is modified by convolving it with a Gaussian distribu-tion with a standard deviation of electronic noise, σe ¼ 1.1 keV,measured on a single detector module in an earlier work:27
The resulting energy response function R 0ðE 0; EÞ for x-rayswith energy ranging between 10 and 130 keV is depicted inFig. 5(a). The energy distribution as observed by the detectorfor a broad incident spectrum can be obtained by appropriatelyweighting together the energy response function of each keVenergy. An example of 80 kVp is shown in Fig. 5(b), in com-parison with the ideal case, where only photoelectric absorptionon the detector is considered. It indicates that the Compton andphotoelectric events are well separated, with Compton eventsbeing observed <30 keV and photoelectric events >30 keV.The Compton events hence do not destroy the energyinformation contained in the photoelectric part of the energydistribution.
Although the energy thresholds for computational purposesare not fully optimized in this work, they are set in an arrange-ment as described below. The first threshold is set at 5 keV tocompletely remove the false events produced by electronic noiseand the second threshold at a value such that the Compton andphotoelectric events are well separated [e.g., 30 keV for 80 kVpshown in Fig. 5(b)], while the other six thresholds are equidis-tantly placed between the second threshold and the maximumenergy of the incident spectrum. Roessl and Proksa26 showedthat the SDNR in the gadolinium basis image is significantlyincreased if one energy threshold is tuned to its K-edge absorp-tion energy. Therefore, in our K-edge imaging study, we set oneof the six thresholds closest to the K-edges of the contrast agentsat 33 keV for iodine and 50 keV for gadolinium.
After determining the energy response function R 0ðE 0; EÞand the energy threshold arrangement, the sensitivity functionSiðEÞ of each bin i can then be determined.
3.2.2 Dose
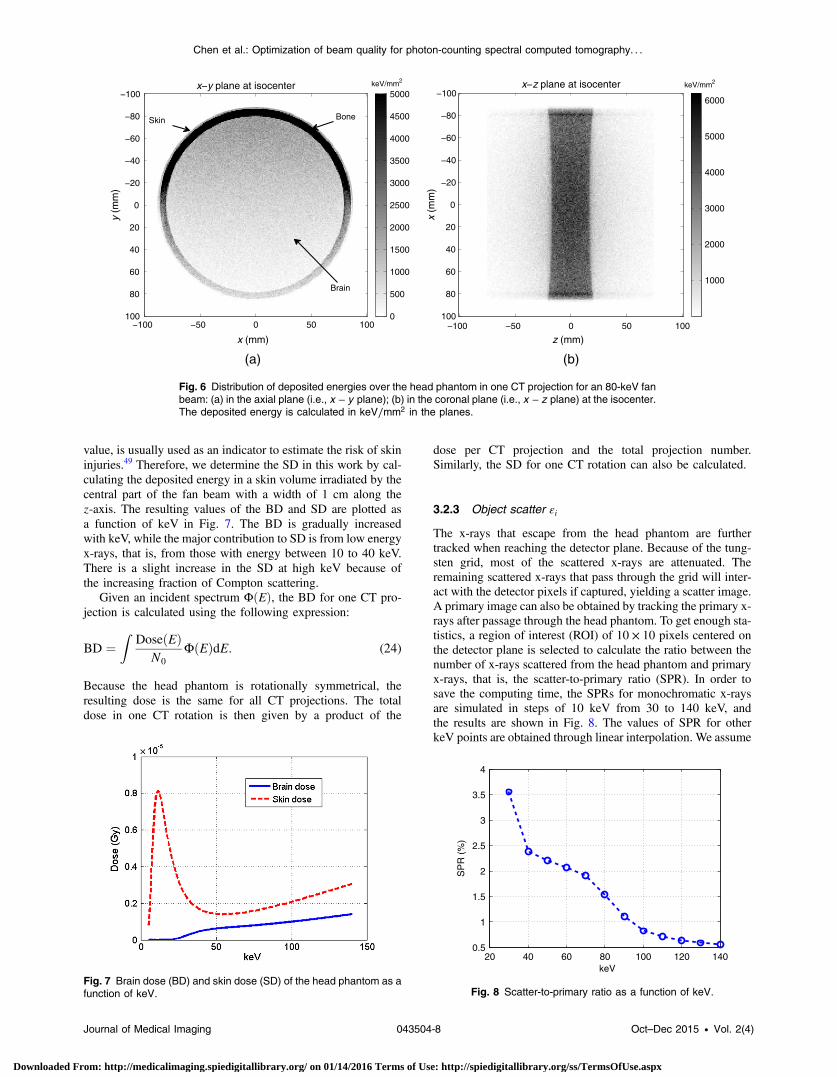
The dose to the head phantom is also determined using MonteCarlo simulations by applying a series of monochromatic x-rays. A fan beam based on the simulation setup is assumed,as described in Sec. 3.1. For one CT projection, N0 (N0 ¼ 108)x-ray photons of each keV impinging on the head phantom aretracked to record the interaction positions and the correspondingdeposited energies inside the head volume. As an example,Fig. 6 shows the deposited energy distribution of the head phan-tom as a result of 80-keV irradiation in one projection. Thedeposited energy in the axial plane [Fig. 6(a)] is graduallydecreased along the x-ray incident direction (i.e., negativey-axis). The bone layer receives more energy than the othertwo materials because of its relatively high density. Alsoshown is the deposited energy distribution in the coronalplane [Fig. 6(b)]. As seen in the figure, a fraction of the x-rays is scattered and deposits its energies outside the primaryradiation area. The average BD for each keV is calculated asthe total deposited energy in the brain tissue divided by itsmass. However, for the SD, the highest radiation dose on thepatient skin (also called peak SD), instead of the average
Fig. 5 (a) Energy response function R 0ðE 0; EÞ for x-rays with energy range between 10 and 130 keV.(b) Energy distribution (red line) on the detector for 80 kVp broad spectrum after the passage through thecentral part of the head phantom. The blue line is for the ideal case where only the photoelectric effect isaccounted for.
Journal of Medical Imaging 043504-7 Oct–Dec 2015 • Vol. 2(4)
Chen et al.: Optimization of beam quality for photon-counting spectral computed tomography. . .
Downloaded From: http://medicalimaging.spiedigitallibrary.org/ on 01/14/2016 Terms of Use: http://spiedigitallibrary.org/ss/TermsOfUse.aspx
value, is usually used as an indicator to estimate the risk of skininjuries.49 Therefore, we determine the SD in this work by cal-culating the deposited energy in a skin volume irradiated by thecentral part of the fan beam with a width of 1 cm along thez-axis. The resulting values of the BD and SD are plotted asa function of keV in Fig. 7. The BD is gradually increasedwith keV, while the major contribution to SD is from low energyx-rays, that is, from those with energy between 10 to 40 keV.There is a slight increase in the SD at high keV because ofthe increasing fraction of Compton scattering.
Given an incident spectrum ΦðEÞ, the BD for one CT pro-jection is calculated using the following expression:
EQ-TARGET;temp:intralink-;e024;63;347BD ¼Z
DoseðEÞN0
ΦðEÞdE: (24)
Because the head phantom is rotationally symmetrical, theresulting dose is the same for all CT projections. The totaldose in one CT rotation is then given by a product of the
dose per CT projection and the total projection number.Similarly, the SD for one CT rotation can also be calculated.
3.2.3 Object scatter εi
The x-rays that escape from the head phantom are furthertracked when reaching the detector plane. Because of the tung-sten grid, most of the scattered x-rays are attenuated. Theremaining scattered x-rays that pass through the grid will inter-act with the detector pixels if captured, yielding a scatter image.A primary image can also be obtained by tracking the primary x-rays after passage through the head phantom. To get enough sta-tistics, a region of interest (ROI) of 10 × 10 pixels centered onthe detector plane is selected to calculate the ratio between thenumber of x-rays scattered from the head phantom and primaryx-rays, that is, the scatter-to-primary ratio (SPR). In order tosave the computing time, the SPRs for monochromatic x-raysare simulated in steps of 10 keV from 30 to 140 keV, andthe results are shown in Fig. 8. The values of SPR for otherkeV points are obtained through linear interpolation. We assume
x (mm)
(a)
y (m
m)
x−y plane at isocenter
−100 −50 0 50 100
−100
−80
−60
−40
−20
0
20
40
60
80
100
z (mm)
(b)
x (m
m)
x−z plane at isocenter
−100 −50 0 50 100
−100
−80
−60
−40
−20
0
20
40
60
80
1000
500
1000
1500
2000
2500
3000
3500
4000
4500
5000
1000
2000
3000
4000
5000
6000
Brain
Skin Bone
keV/mm2keV/mm2
Fig. 6 Distribution of deposited energies over the head phantom in one CT projection for an 80-keV fanbeam: (a) in the axial plane (i.e., x − y plane); (b) in the coronal plane (i.e., x − z plane) at the isocenter.The deposited energy is calculated in keV∕mm2 in the planes.
Fig. 7 Brain dose (BD) and skin dose (SD) of the head phantom as afunction of keV.
20 40 60 80 100 120 1400.5
1
1.5
2
2.5
3
3.5
4
keV
SP
R (
%)
Fig. 8 Scatter-to-primary ratio as a function of keV.
Journal of Medical Imaging 043504-8 Oct–Dec 2015 • Vol. 2(4)
Chen et al.: Optimization of beam quality for photon-counting spectral computed tomography. . .
Downloaded From: http://medicalimaging.spiedigitallibrary.org/ on 01/14/2016 Terms of Use: http://spiedigitallibrary.org/ss/TermsOfUse.aspx
that the object scatter has the same response function R 0ðE 0; EÞas the primary x-rays, disregarding the difference in the incidentdirection. Therefore, given an incident spectrum, the object scat-ter εi detected by bin i at the center of the detector plane is cal-culated as
EQ-TARGET;temp:intralink-;e025;63;476ϵi ¼Z
SPRðEÞΦ 0ðEÞSiðEÞdE; (25)
where Φ 0ðEÞ is the spectrum after passing through the centralpart of the head phantom.
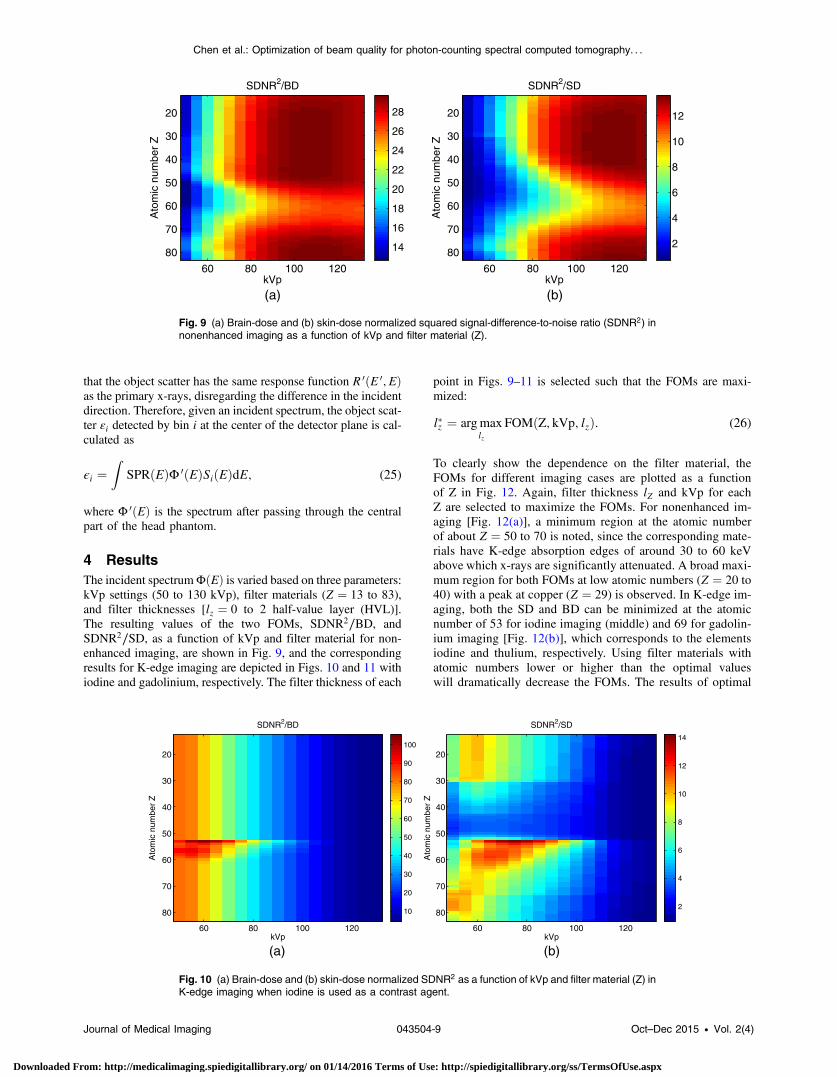
4 ResultsThe incident spectrumΦðEÞ is varied based on three parameters:kVp settings (50 to 130 kVp), filter materials (Z ¼ 13 to 83),and filter thicknesses [lz ¼ 0 to 2 half-value layer (HVL)].The resulting values of the two FOMs, SDNR2∕BD, andSDNR2∕SD, as a function of kVp and filter material for non-enhanced imaging, are shown in Fig. 9, and the correspondingresults for K-edge imaging are depicted in Figs. 10 and 11 withiodine and gadolinium, respectively. The filter thickness of each
point in Figs. 9–11 is selected such that the FOMs are maxi-mized:
To clearly show the dependence on the filter material, theFOMs for different imaging cases are plotted as a functionof Z in Fig. 12. Again, filter thickness lZ and kVp for eachZ are selected to maximize the FOMs. For nonenhanced im-aging [Fig. 12(a)], a minimum region at the atomic numberof about Z ¼ 50 to 70 is noted, since the corresponding mate-rials have K-edge absorption edges of around 30 to 60 keVabove which x-rays are significantly attenuated. A broad maxi-mum region for both FOMs at low atomic numbers (Z ¼ 20 to40) with a peak at copper (Z ¼ 29) is observed. In K-edge im-aging, both the SD and BD can be minimized at the atomicnumber of 53 for iodine imaging (middle) and 69 for gadolin-ium imaging [Fig. 12(b)], which corresponds to the elementsiodine and thulium, respectively. Using filter materials withatomic numbers lower or higher than the optimal valueswill dramatically decrease the FOMs. The results of optimal
kVp
Ato
mic
num
ber
Z
SDNR2/BD
60 80 100 120
20
30
40
50
60
70
80 14
16
18
20
22
24
26
28
kVp
Ato
mic
num
ber
Z
SDNR2/SD
60 80 100 120
20
30
40
50
60
70
802
4
6
8
10
12
(a) (b)
Fig. 9 (a) Brain-dose and (b) skin-dose normalized squared signal-difference-to-noise ratio (SDNR2) innonenhanced imaging as a function of kVp and filter material (Z).
kVp
Ato
mic
num
ber
Z
SDNR2/BD
60 80 100 120
20
30
40
50
60
70
80 10
20
30
40
50
60
70
80
90
100
kVp
Ato
mic
num
ber
Z
SDNR2/SD
60 80 100 120
20
30
40
50
60
70
802
4
6
8
10
12
14
(a) (b)
Fig. 10 (a) Brain-dose and (b) skin-dose normalized SDNR2 as a function of kVp and filter material (Z) inK-edge imaging when iodine is used as a contrast agent.
Journal of Medical Imaging 043504-9 Oct–Dec 2015 • Vol. 2(4)
Chen et al.: Optimization of beam quality for photon-counting spectral computed tomography. . .
Downloaded From: http://medicalimaging.spiedigitallibrary.org/ on 01/14/2016 Terms of Use: http://spiedigitallibrary.org/ss/TermsOfUse.aspx
filters for K-edge imaging can be explained by the fact that theaccuracy in the quantification of contrast agents depends on thedifference in attenuation to be detected above and below thecorresponding K-edges. In iodine imaging, the low K-edgeenergy of iodine, below which x-rays are heavily attenuatedby the head phantom, makes the detection of the K-edge dis-continuity more difficult. It is thus important to ensure theaccuracy when detecting the low-energy part of the incidentspectrum. Using iodine as a filter can not only greatly increasethe proportion of x-rays below the K-edge in the incident spec-trum but can also attenuate more x-rays above the K-edge suchthat the energy bin just below the K-edge is less polluted bymisregistered events (i.e., high-energy x-rays might bedetected by low-energy bins due to charge sharing, electronicnoise, or Compton scattering). Unlike iodine, gadolinium has ahigher K-edge energy of 50.2 keV, which means that in gado-linium imaging, the accuracy in detecting x-rays below theK-edge is no longer the major factor affecting image quality.Thulium with a K-edge of 59.4 keV, a value close to but higher
than that of gadolinium, can highlight the part of the incidentspectrum around the K-edge of gadolinium, making the detec-tion of the K-edge discontinuity much easier.
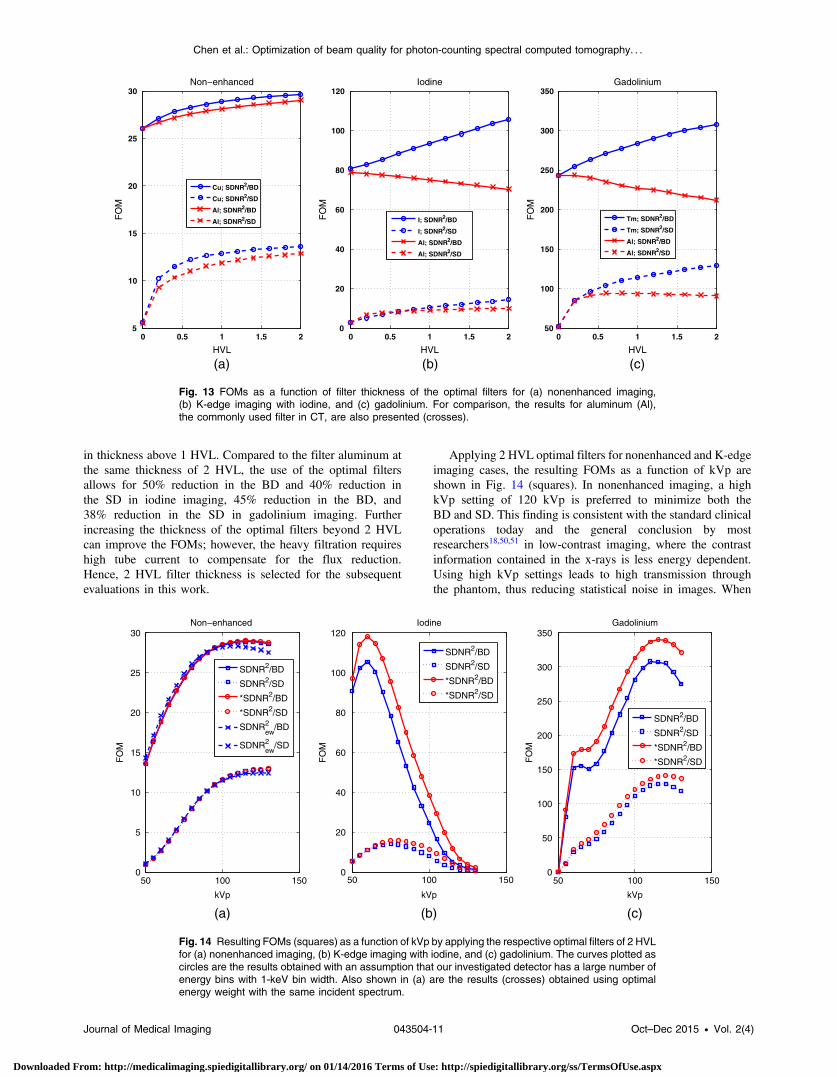
Figure 13 shows the FOMs as a function of thickness lz of theoptimal filters for different imaging cases. For each filter thick-ness, the kVp setting is chosen to maximize the FOMs. Overall,the FOMs improve with increasing thickness of the optimal fil-ters in all imaging cases. This improvement is more pronouncedin SDNR2∕SD in the range of 0 to 1 HVL, because low-energyx-rays, which are the major contribution to SD as illustrated inFig. 7, are sharply suppressed by the filters. For comparison, theresults of the commonly used filter material aluminum are alsoshown. In nonenhanced imaging, the difference in FOMsbetween aluminum and the optimal filter copper is small. Itis noted in K-edge imaging that SDNR2∕BD is graduallydecreased with the increasing thickness of aluminum becauseof the dramatic loss of x-rays at the low-energy part of the inci-dent spectrum, while SDNR2∕SD is improved with aluminumthickness in the range of 0 to 1 HVL but is insensitive to changes
kVp
Ato
mic
num
ber
Z
SDNR /BD
60 80 100 120
20
30
40
50
60
70
80 10
20
30
40
50
60
70
80
90
100
kVp
Ato
mic
num
ber
Z
SDNR /SD
60 80 100 120
20
30
40
50
60
70
802
4
6
8
10
12
14
Ato
mic
num
ber
Z
SDNR2/BD
60 80 100 120
20
30
40
50
60
70
80
Ato
mic
num
ber
Z
SDNR2/SD
60 80 100 120
20
30
40
50
60
70
80
50
100
150
200
250
300
20
40
60
80
100
120
kVp kVp
(a) (b)
Fig. 11 (a) Brain-dose and (b) skin-dose normalized SDNR2 as a function of kVp and filter material (Z) inK-edge imaging when gadolinium is used as a contrast agent.
20 30 40 50 60 70 8010
15
20
25
30
35Non−enhanced
Atomic number
(a) (b) (c)
FO
M
20 30 40 50 60 70 800
20
40
60
80
100
120Iodine
Atomic number
FO
M
20 30 40 50 60 70 8050
100
150
200
250
300
350Gadolinium
Atomic number
FO
M
SDNR2/BD
SDNR2/SDSDNR2/BD
SDNR2/SD
SDNR2/BD
SDNR2/SD
Fig. 12 Figures of merit (FOMs) as a function of atomic number of filter materials for (a) nonenhancedimaging, (b) K-edge imaging with iodine, and (c) gadolinium.
Journal of Medical Imaging 043504-10 Oct–Dec 2015 • Vol. 2(4)
Chen et al.: Optimization of beam quality for photon-counting spectral computed tomography. . .
Downloaded From: http://medicalimaging.spiedigitallibrary.org/ on 01/14/2016 Terms of Use: http://spiedigitallibrary.org/ss/TermsOfUse.aspx
in thickness above 1 HVL. Compared to the filter aluminum atthe same thickness of 2 HVL, the use of the optimal filtersallows for 50% reduction in the BD and 40% reduction inthe SD in iodine imaging, 45% reduction in the BD, and38% reduction in the SD in gadolinium imaging. Furtherincreasing the thickness of the optimal filters beyond 2 HVLcan improve the FOMs; however, the heavy filtration requireshigh tube current to compensate for the flux reduction.Hence, 2 HVL filter thickness is selected for the subsequentevaluations in this work.
Applying 2 HVL optimal filters for nonenhanced and K-edgeimaging cases, the resulting FOMs as a function of kVp areshown in Fig. 14 (squares). In nonenhanced imaging, a highkVp setting of 120 kVp is preferred to minimize both theBD and SD. This finding is consistent with the standard clinicaloperations today and the general conclusion by mostresearchers18,50,51 in low-contrast imaging, where the contrastinformation contained in the x-rays is less energy dependent.Using high kVp settings leads to high transmission throughthe phantom, thus reducing statistical noise in images. When
0 0.5 1 1.5 25
10
15
20
25
30
HVL
FO
M
Non−enhanced
0 0.5 1 1.5 20
20
40
60
80
100
120
HVL
FO
M
Iodine
0 0.5 1 1.5 250
100
150
200
250
300
350Gadolinium
HVL
FO
M
Tm; SDNR2/BD
Tm; SDNR2/SD
Al; SDNR2/BD
Al; SDNR2/SD
I; SDNR2/BD
I; SDNR2/SD
Al; SDNR2/BD
Al; SDNR2/SD
Cu; SDNR2/BD
Cu; SDNR2/SD
Al; SDNR2/BD
Al; SDNR2/SD
(a) (b) (c)
Fig. 13 FOMs as a function of filter thickness of the optimal filters for (a) nonenhanced imaging,(b) K-edge imaging with iodine, and (c) gadolinium. For comparison, the results for aluminum (Al),the commonly used filter in CT, are also presented (crosses).
50 100 1500
5
10
15
20
25
30
kVp
(a)
FO
M
Non−enhanced
SDNR2/BD
SDNR2/SD
*SDNR2/BD
*SDNR2/SD
SDNRew2 /BD
SDNRew2 /SD
50 100 1500
50
100
150
200
250
300
350Gadolinium
kVp
(c)
FO
M
SDNR2/BD
SDNR2/SD
*SDNR2/BD
*SDNR2/SD
50 100 1500
20
40
60
80
100
120Iodine
kVp
(b)
FO
M
SDNR2/BD
SDNR2/SD
*SDNR2/BD
*SDNR2/SD
Fig. 14 Resulting FOMs (squares) as a function of kVp by applying the respective optimal filters of 2 HVLfor (a) nonenhanced imaging, (b) K-edge imaging with iodine, and (c) gadolinium. The curves plotted ascircles are the results obtained with an assumption that our investigated detector has a large number ofenergy bins with 1-keV bin width. Also shown in (a) are the results (crosses) obtained using optimalenergy weight with the same incident spectrum.
Journal of Medical Imaging 043504-11 Oct–Dec 2015 • Vol. 2(4)
Chen et al.: Optimization of beam quality for photon-counting spectral computed tomography. . .
Downloaded From: http://medicalimaging.spiedigitallibrary.org/ on 01/14/2016 Terms of Use: http://spiedigitallibrary.org/ss/TermsOfUse.aspx
iodine is used in K-edge imaging, the maximum SDNR2∕BD isfound at 60 kVp, whereas the peak SDNR2∕SD is obtained at75 kVp. It should be noted that the use of 60 kVp leads to a 25%increase in the SD compared to the use of 75 kVp with the sameSDNR. For some iodinated head imaging where a relativelylong exposure time is required, such as multiple CTA/CTP orinterventional CT, in order to lower the potential risk of skininjuries, a tradeoff between the BD and SD can be made bychoosing 65 kVp. In gadolinium imaging, the optimal kVpfor SDNR2∕BD is 120 kVp, the same as that forSDNR2∕SD. Figure 15 shows the resulting optimized incidentspectrum ΦðEÞ for different imaging cases. The values of meanenergy of the optimal spectrum are 29 and 58 keV for iodineimaging and gadolinium imaging, respectively.
5 Discussion and ConclusionsWe have shown an analytical framework to evaluate the CTimages resulting from material decomposition. Using thisframework, we have optimized the beam quality used forhead CT imaging based on our silicon-strip spectral detector.
The incident beam was adjusted based on three parameters:kVp setting (50 to 130 kVp), atomic number of filtration(Z ¼ 13 to 83), and filter thickness (lZ ¼ 0 to 2 HVL).
For nonenhanced head imaging, we weighted together thetwo decomposed basis function images, bone and soft tissue,to enhance the detectability of imaging targets. The resultsshow that the use of 120-kVp spectrum filtered by 2 HVL cop-per provides the best performance in both SDNR2∕BD andSDNR2∕SD when imaging a 5-mm blood vessel in the headphantom. An advantage of material decomposition is that itis free of beam-hardening artifacts, in contrast to the energy-weighting method. However, it might also be of interest to inves-tigate the difference in image quality between these two meth-ods without considering beam-hardening artifacts. The work byAlvarez52 shows that with an ideal detector that has infinitesimalenergy bin width and perfect energy response, material decom-position provides the same SDNR as optimal energy weighting.To prove that this conclusion also holds for practical detectors,we reanalyzed the simulation data of our silicon-strip detector inthis work and calculated the SDNR with optimal energy weight-ing in a way similar to that described in Sec. 2.2:
where ΔgT is a 1 × 8 column vector with elements Δgi showingthe signal difference in the log-normalized projection image ofbin i between the two hypothesesH0 andH1, which, in the low-contrast case, is approximated to be the relative difference in themean values of detected events in that bin: Δλi∕λi.Qm is a 8 × 8
diagonal matrix for hypothesis Hm, with the diagonal elementQm
i;i referring to the variance in bin i after log-normalization,which is equal to the inverse of λi.
36 Using the same filter of2 HVL copper, we showed that the resulting dose-normalizedSDNR2
ew plotted as crosses in Fig. 14(a) is similar to thoseobtained using material decomposition. Further comparisonof the two image formation methods involving the effect ofbeam-hardening artifacts will be investigated in future work.
For K-edge imaging, iodine and gadolinium were studiedwith the same concentration in the blood vessel, namely,5 mg∕mL. The SDNR in the contrast agent basis image wascalculated and normalized by the corresponding dose for
0 20 40 60 80 100 1200
0.5
1
1.5
2
2.5× 10
8
E (keV)
Φ(E
) ph
oton
s/m
m2
Optimal spectrum
Non−enhancedIodine Gadolinium
Fig. 15 Resulting optimized incident spectrum ΦðEÞ for different im-aging cases.
(a) (b)
Fig. 16 Square roots of the FOMs as a function of agent concentration for both iodine and gadoliniumimaging, with their respective optimal spectrum obtained at the agent concentration of 5 mg∕mL.(a) SDNR∕
ffiffiffiffiffiffiffiBD
pand (b) SDNR∕
ffiffiffiffiffiffiffiSD
p.
Journal of Medical Imaging 043504-12 Oct–Dec 2015 • Vol. 2(4)
Chen et al.: Optimization of beam quality for photon-counting spectral computed tomography. . .
Downloaded From: http://medicalimaging.spiedigitallibrary.org/ on 01/14/2016 Terms of Use: http://spiedigitallibrary.org/ss/TermsOfUse.aspx
20 30 40 50 60 70 800
50
100
150
200
250
300
350
400
Atomic number [Z]
(b)F
OM
Gadolinium
20 30 40 50 60 70 800
20
40
60
80
100
120Iodine
Atomic number [Z]
(a)
FO
M
SDNR2/BD, no Gd
SDNR2/SD, no Gd
SDNR2/BD, 1 mg/ml Gd
SDNR2/SD, 1 mg/ml Gd
SDNR2/BD, 5 mg/ml Gd
SDNR2/SD, 5 mg/ml Gd
SDNR2/BD, no iodine
SDNR2/SD, no iodine
SDNR2/BD, 1 mg/ml iodine
SDNR2/SD, 1 mg/ml iodine
SDNR2/BD, 5 mg/ml iodine
SDNR2/SD, 5 mg/ml iodine
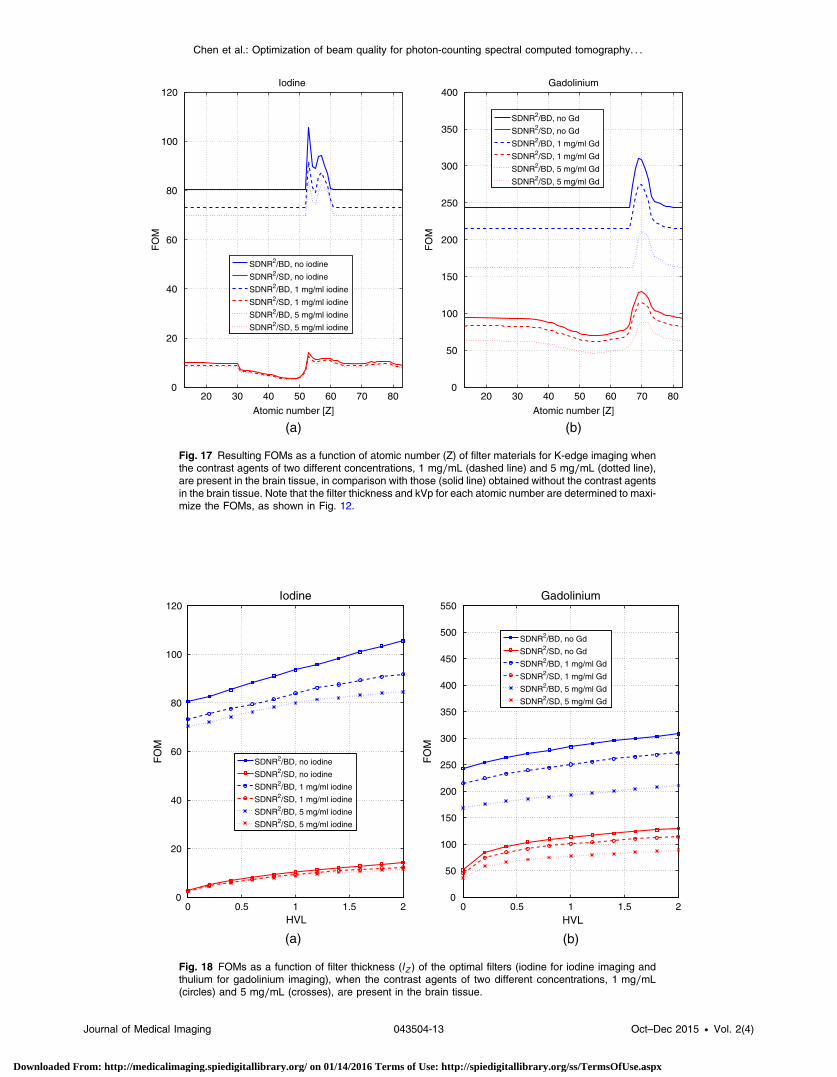
Fig. 17 Resulting FOMs as a function of atomic number (Z) of filter materials for K-edge imaging whenthe contrast agents of two different concentrations, 1 mg∕mL (dashed line) and 5 mg∕mL (dotted line),are present in the brain tissue, in comparison with those (solid line) obtained without the contrast agentsin the brain tissue. Note that the filter thickness and kVp for each atomic number are determined to maxi-mize the FOMs, as shown in Fig. 12.
0 0.5 1 1.5 20
20
40
60
80
100
120
HVL
(a)
FO
M
Iodine
0 0.5 1 1.5 20
50
100
150
200
250
300
350
400
450
500
550Gadolinium
HVL
(b)
FO
M
SDNR2/BD, no Gd
SDNR2/SD, no Gd
SDNR2/BD, 1 mg/ml Gd
SDNR2/SD, 1 mg/ml Gd
SDNR2/BD, 5 mg/ml Gd
SDNR2/SD, 5 mg/ml Gd
SDNR2/BD, no iodine
SDNR2/SD, no iodine
SDNR2/BD, 1 mg/ml iodine
SDNR2/SD, 1 mg/ml iodine
SDNR2/BD, 5 mg/ml iodine
SDNR2/SD, 5 mg/ml iodine
Fig. 18 FOMs as a function of filter thickness (lZ ) of the optimal filters (iodine for iodine imaging andthulium for gadolinium imaging), when the contrast agents of two different concentrations, 1 mg∕mL(circles) and 5 mg∕mL (crosses), are present in the brain tissue.
Journal of Medical Imaging 043504-13 Oct–Dec 2015 • Vol. 2(4)
Chen et al.: Optimization of beam quality for photon-counting spectral computed tomography. . .
Downloaded From: http://medicalimaging.spiedigitallibrary.org/ on 01/14/2016 Terms of Use: http://spiedigitallibrary.org/ss/TermsOfUse.aspx
each incident spectrum. The results indicate that when iodine isused, the optimal filter is 2 HVL iodine and the optimal kVps are60 and 75 kVp in terms of SDNR2∕BD and SDNR2∕SD,respectively, while in the gadolinium case, both the SD andBD can be minimized by using 120 kVp filtered with2 HVL thulium. Using the obtained optimal spectrum, we cal-culated the square roots of the FOMs at the contrast agent con-centrations of 1 to 10 mg∕mL for both iodine and gadolinium,and the results are shown in Fig. 16. It is a good approximationthat the square roots of the FOMs are linearly dependent on theagent concentration. This can be explained by Eq. (21), wherethe term ϝ−1k;k is nearly independent of the agent concentration aslong as the total attenuation is not significantly altered by thecontrast agent itself. Hence, we would expect that the conclu-sions about the optimal spectrum vary little with change inthe contrast agent concentration. The results in Fig. 16 alsoshow that at the same concentration, the values ofSDNR2∕BD and SDNR2∕SD in gadolinium imaging are,respectively, around 3 and 10 times larger than those in iodineimaging. From a physical point of view, gadolinium seems to bea better candidate in head imaging; however, from a physiologi-cal point of view, gadolinium is much more harmful to thehuman body than iodine.53,54 In practice, the typical dose(mg) of gadolinium used for MRI is around 10 times lessthan that of iodine for CT imaging.53,55 If such a differencein agent concentration is present in K-edge imaging, then thevalues of FOMs in the gadolinium imaging case, as illustratedin Fig. 16, are only 3% to 10% of those in the iodine imagingcase. Nevertheless, which contrast agent is more suitable forhead CT imaging is still an open question and remains to beanswered in future researches by taking the toxicity and thedamage to DNA into account.
Since silicon has a relatively low atomic number compared toother detector materials (such as cadmium and tellurium),Compton scattering plays an important role in our detector,as shown in Fig. 5(b). Although the resulting Compton eventscarry little spectral information, they might be beneficial toreduce the statistical noise in the images. To study how muchgain we can get from the Compton events, we compared theFOMs with those obtained without including Compton events.The results show that with the optimal spectrum, the FOMs fornonenhanced imaging can be improved by 12% when Comptonevents are included. For K-edge imaging, the improvement is3% in both iodine and gadolinium cases.
A number of limitations have to be noted. First, the arrange-ment of energy thresholds is not fully optimized, which to someextent underestimates the FOMs presented in this work. To gainsome insight into the impact of this underestimation in our con-clusions about the optimal spectrum for different imaging cases,we recalculated the FOMs by assuming that our detector has alarge number of energy bins with 1-keV width. The results(circles in Fig. 14) show that the FOMs are little improved innonenhanced imaging, while for K-edge imaging, a generalimprovement of 10% in the FOMs can be seen in both the iodineand gadolinium cases. However, little changes in the trend as afunction of kVp are found in each imaging case. Therefore, wedo not expect that the underestimation in FOMs due to the sub-optimal arrangement of energy thresholds would change theconclusions on the optimal beam quality in this work.Second, only one blood vessel was considered in the head phan-tom. In practice, the contrast agents can be present in otherblood vessels, which would greatly increase the radiationdose.56 Recent findings57,58 show that the additional secondaryelectrons produced when x-rays are absorbed by the contrast
50 100 1500
20
40
60
80
100
120Iodine
kVp
(a)
FO
M
SDNR2/BD, no iodine
SDNR2/SD, no iodine
SDNR2/BD, 1 mg/ml iodine
SDNR2/SD, 1 mg/ml iodine
SDNR2/BD, 5 mg/ml iodine
SDNR2/SD, 5 mg/ml iodine
50 100 1500
50
100
150
200
250
300
350
400Gadolinium
kVp
(b)
FO
M
SDNR2/BD, no Gd
SDNR2/SD, no Gd
SDNR2/BD, 1 mg/ml Gd
SDNR2/SD, 1 mg/ml Gd
SDNR2/BD, 5 mg/ml Gd
SDNR2/SD, 5 mg/ml Gd
Fig. 19 Resulting FOMs as a function of kVp when the contrast agents of two different concentrations,1 mg∕mL (circles) and 5 mg∕mL (crosses), are present in the brain tissue, in comparison with those(squares) obtained without the contrast agents in the brain tissue. Note that the optimal filter of2 HVL iodine is applied in (a) iodine imaging and (b) 2 HVL thulium in gadolinium imaging.
Journal of Medical Imaging 043504-14 Oct–Dec 2015 • Vol. 2(4)
Chen et al.: Optimization of beam quality for photon-counting spectral computed tomography. . .
Downloaded From: http://medicalimaging.spiedigitallibrary.org/ on 01/14/2016 Terms of Use: http://spiedigitallibrary.org/ss/TermsOfUse.aspx
agents would lead to DNA damage. To investigate the effect ofthe dose increase on the spectrum optimization, we calculatedthe FOMs based on the assumption that the contrast agents arehomogeneously distributed over the whole brain tissue in thehead phantom. Two different contrast agent concentrations, 1and 5 mg/mL, in the brain tissue were studied. The results(Figs. 17–19) show that although the presence of the contrastagents in the brain tissue decreases the FOMs, the optimalparameters (i.e., Z, lZ, and kVp) remain almost the same forboth iodine and gadolinium imaging. Furthermore, the diameterof the head phantom we studied is fixed. We redid the simula-tions with the head phantoms of diameters 10 cm (a size forpediatric applications) and 30 cm to evaluate whether the opti-mal spectrum is related to the size of the head phantom. Theresults show that the changes in this parameter cause little varia-tion in the optimal spectrum settings for all imaging cases.Finally, although our study focuses on the detection of bloodvessels, which is the common imaging task for acute stroke,the optimization methods described here can also be appliedto other imaging applications, such as the detection of braintumors and bones.
AcknowledgmentsThis study was supported by the Erling-Persson FamilyFoundation.
References1. World Stroke Organization, “Stroke care,” http://www.world-stroke.org/
(26 January 2015).2. J. Mackay et al., The Atlas of Heart Disease and Stroke, World Health
Organization, Geneva (2004).3. American Stroke Association, “Ischemic strokes,” http://www.
strokeassociation.org/ (26 January 2015).4. R. G. González et al., Acute Ischemic Stroke, Springer, Berlin, Germany
(2011).5. W. S. Smith et al., “Mechanical thrombectomy for acute ischemic
stroke: Final results of the multi MERCI trial,” Stroke 39(4), 1205–1212 (2008).
6. R. G. Nogueira et al., “Trevo versus merci retrievers for thrombectomyrevascularisation of large vessel occlusions in acute ischaemic stroke(trevo 2): a randomised trial,” Lancet 380(9849), 1231–1240 (2012).
7. D. S. Liebeskind et al., “Serial Alberta Stroke Program Early CT Scorefrom baseline to 24 hours in solitaire flow restoration with the intentionfor thrombectomy study a novel surrogate end point for revasculariza-tion in acute stroke,” Stroke 45(3), 723–727 (2014).
8. A. Mnyusiwalla, R. I. Aviv, and S. P. Symons, “Radiation dose frommultidetector row CT imaging for acute stroke,” Neuroradiology51(10), 635–640 (2009).
9. M. Cohnen et al., “Radiation exposure of patients in comprehensivecomputed tomography of the head in acute stroke,” Ame. J.Neuroradiol. 27(8), 1741–1745 (2006).
10. M. E. Mullins et al., “CT and conventional and diffusion-weighted MRimaging in acute stroke: Study in 691 patients at presentation to theemergency department,” Radiology 224(2), 353–360 (2002).
11. A. Srinivasan et al., “State-of-the-art imaging of acute stroke 1,”Radiographics 26(suppl 1), S75–S95 (2006).
12. A. M. Allmendinger et al., “Imaging of stroke: part 1, perfusion ctover-view of imaging technique, interpretation pearls, and common pitfalls,”Am. J. Roentgenol. 198(1), 52–62 (2012).
13. K. Miles and M. Griffiths, “Perfusion CT: a worthwhile enhancement?,”Perfusion 76(904), 220–231 (2003).
14. Y. Imanishi et al., “Radiation-induced temporary hair loss as a radiationdamage only occurring in patients who had the combination of MDCTand DSA,” Eur. Radiol. 15(1), 41–46 (2005).
15. A. B. Smith et al., “Radiation dose reduction strategy for CT protocols:Successful implementation in neuroradiology section 1,” Radiology247(2), 499–506 (2008).
16. W. A. Kalender, H. Wolf, and C. Suess, “Dose reduction in CT by ana-tomically adapted tube current modulation. II Phantom measurements,”Med. Phys. 26(11), 2248–2253 (1999).
17. J. M. Boone and J. A. Seibert, “An accurate method for computer-gen-erating tungsten anode x-ray spectra from 30 to 140 kv,” Med. Phys.24(11), 1661–1670 (1997).
18. E. Samei et al., “A framework for optimising the radiographic technique indigital x-ray imaging,” Radiat. Prot. Dosim. 114(1–3), 220–229 (2005).
19. M. J. Tapiovaara and R. Wagner, “SNR and DQE analysis of broadspectrum x-ray imaging,” Phys. Med. Biol. 30(6), 519 (1985).
20. J. Giersch, D. Niederlöhner, and G. Anton, “The influence of energyweighting on x-ray imaging quality,” Nucl. Instrum. Methods Phys.Res. Sec. A 531(1), 68–74 (2004).
21. P. M. Shikhaliev, “Projection x-ray imaging with photon energy weight-ing: experimental evaluation with a prototype detector,” Phys. Med.Biol. 54(16), 4971 (2009).
22. T. G. Schmidt, “CT energy weighting in the presence of scatter and lim-ited energy resolution,” Med. Phys. 37(3), 1056–1067 (2010).
23. P. M. Shikhaliev, “Beam hardening artefacts in computed tomographywith photon counting, charge integrating and energy weighting detec-tors: a simulation study,” Phys. Med. Biol. 50(24), 5813 (2005).
24. R. E. Alvarez and A. Macovski, “Energy-selective reconstructions in x-ray computerised tomography,” Phys. Med. Biol. 21(5), 733 (1976).
25. J. Schlomka et al., “Experimental feasibility of multi-energy photon-counting k-edge imaging in pre-clinical computed tomography,”Phys. Med. Biol. 53(15), 4031 (2008).
26. E. Roessl and R. Proksa, “K-edge imaging in x-ray computed tomog-raphy using multi-bin photon counting detectors,” Phys. Med. Biol.52(15), 4679 (2007).
27. C. Xu et al., “Evaluation of a second-generation ultra-fast energy-resolved asic for photon-counting spectral CT,” IEEE Trans. Nucl.Sci. 60(1), 437–445 (2013).
28. X. Liu et al., “A silicon-strip detector for photon-counting spectral CT:energy resolution from 40 kev to 120 kev,” IEEE Trans. Nucl. Sci. 61(3),1099–1105 (2014).
29. H. Bornefalk et al., “Effect of temperature variation on the energyresponse of a photon counting silicon CT detector,” IEEE Trans.Nucl. Sci. 60(2), 1442–1449 (2013).
30. H. Bornefalk and M. Danielsson, “Photon-counting spectral computedtomography using silicon strip detectors: a feasibility study,” Phys. Med.Biol. 55(7), 1999 (2010).
31. M. Persson et al., “Energy-resolved CT imaging with a photon-countingsilicon-strip detector,” Proc. SPIE 9033, 90333L (2014).
32. A. Macovski et al., “Energy dependent reconstruction in x-ray comput-erized tomography,” Comp. Biol. Med. 6(4), 325–336 (1976).
33. M. Firsching et al., “Quantitative material reconstruction in CT withspectroscopic x-ray pixel detectors–a simulation study,” in NuclearScience Symposium Conference Record, Vol. 4, pp. 2257–2259,IEEE, San Diego, California (2006).
34. J. P. Ronaldson et al., “Toward quantifying the composition of soft tis-sues by spectral CT with medipix3,” Med. Phys. 39(11), 6847–6857(2012).
35. E. Roessl and C. Herrmann, “Cramér-Rao lower bound of basis imagenoise in multiple-energy x-ray imaging,” Phys. Med. Biol. 54(5), 1307(2009).
36. K. M. Hanson, “Detectability in computed tomographic images,” Med.Phys. 6(5), 441–451 (1979).
37. H. Bornefalk and M. Persson, “Theoretical comparison of the iodinequantification accuracy of two spectral CT technologies,” IEEETrans. Med. Imaging 33(2), 556–565 (2014).
38. M. Tapiovaara and R. Wagner, “SNR and noise measurements for medi-cal imaging: I. A practical approach based on statistical decisiontheory,” Phys. Med. Biol. 38(1), 71 (1993).
39. M. Yveborg, M. Persson, and H. Bornefalk, “Optimal frequency-basedweighting for spectral x-ray projection imaging,” IEEE Trans. Med.Imaging 34(3), 779–787 (2015).
40. A. E. Burgess, F. L. Jacobson, and P. F. Judy, “Human observer detec-tion experiments with mammograms and power-law noise,”Med. Phys.28(4), 419–437 (2001).
41. H. H. Barrett and K. J. Myers, “Foundations of image science,”Foundations of Image Science, H. H. Barrett and K. J. Myers,Vol. 1, pp. 1584, Wiley-VCH, New York (2003).
Journal of Medical Imaging 043504-15 Oct–Dec 2015 • Vol. 2(4)
Chen et al.: Optimization of beam quality for photon-counting spectral computed tomography. . .
Downloaded From: http://medicalimaging.spiedigitallibrary.org/ on 01/14/2016 Terms of Use: http://spiedigitallibrary.org/ss/TermsOfUse.aspx
42. L. Lehmann et al., “Generalized image combinations in dual KVP dig-ital radiography,” Med. Phys. 8(5), 659–667 (1981).
43. S. Riederer and C. Mistretta, “Selective iodine imaging using K-edgeenergies in computerized x-ray tomography,”Med. Phys. 4(6), 474–481(1977).
44. L. Lehmann and R. Alvarez, “Energy-selective radiography a review,”in Digital Radiography, pp. 145–188, Springer, New York (1986).
45. M. J. Berger et al., “Xcom: photon cross sections database,” NIST Stand.Ref. Database 8(1), 3587–3597 (1998).
46. C. Xu et al., “Energy resolution of a segmented silicon strip detector forphoton-counting spectral CT,” Nucl. Instrum. Methods Phys. Res. Sec. A715, 11–17 (2013).
47. U. S. Food and Drug Administration (FDA), “Diagnostic x-ray systemsand their major components,” Code Fed. Reg. 21 CFR(1020.33) (1984).
48. G. Santin et al., “GATE: A Geant4-based simulation platform for PETand SPECT integrating movement and time management,” IEEE Trans.Nucl. Sci. 50(5), 1516–1521 (2003).
49. J. A. Bauhs et al., “CT dosimetry: comparison of measurement tech-niques and devices 1,” Radiographics 28(1), 245–253 (2008).
50. J. T. Dobbins et al., “Chest radiography: optimization of x-ray spectrumfor cesium iodide–amorphous silicon flat-panel detector 1,” Radiology226(1), 221–230 (2003).
51. M. Yveborg, M. Danielsson, and H. Bornefalk, “Performance evalu-ation of a sub-millimetre spectrally resolved CT system on high- andlow-frequency imaging tasks: a simulation,” Phys. Med. Biol. 57(8),2373 (2012).
52. R. E. Alvarez, “Near optimal energy selective x-ray imaging systemperformance with simple detectors,”Med. Phys. 37(2), 822–841 (2010).
53. U. Nyman et al., “Are gadolinium-based contrast media really safer thaniodinated media for digital subtraction angiography in patients with azo-temia?,” Radiology 223(2), 311–318 (2002).
54. J. C. Weinreb, “Which study when? Is gadolinium-enhanced MR im-aging safer than iodine-enhanced CT?,” Radiology 249(1), 3–8 (2008).
55. M. R. Prince, C. Arnoldus, and J. K. Frisoli, “Nephrotoxicity of high-dose gadolinium compared with iodinated contrast,” J. Magn. Res.Imaging 6(1), 162–166 (1996).
56. E. Amato et al., “A method to evaluate the dose increase in CT withiodinated contrast medium,” Med. Phys. 37(8), 4249–4256 (2010).
57. E. I. Piechowiak et al., “Intravenous iodinated contrast agents amplifyDNA radiation damage at CT,” Radiology 275(3), 692–697 (2015).
58. A. B. de Gonzalez and R. A. Kleinerman, “CT scanning: is the contrastmaterial enhancing the radiation dose and cancer risk as well as theimage?,” Radiology 275(3), 627–629 (2015).
Han Chen is a PhD student at the University of Royal Institute ofTechnology (KTH) in Sweden.
Cheng Xu works as a postdoc at Royal Institute of Technology (KTH)in Sweden.
Mats Persson is PhD student at Royal Institute of Technology (KTH).
Mats Danielsson is professor of the Department of Physics in RoyalInstitute of Technology (KTH). He is also CEO of Prismatic SensorsAB, a company commercializing a new technology for photon count-ing CT.
Journal of Medical Imaging 043504-16 Oct–Dec 2015 • Vol. 2(4)
Chen et al.: Optimization of beam quality for photon-counting spectral computed tomography. . .
Downloaded From: http://medicalimaging.spiedigitallibrary.org/ on 01/14/2016 Terms of Use: http://spiedigitallibrary.org/ss/TermsOfUse.aspx