Hessam Babaee e-mail: [email protected]Sumanta Acharya Professor e-mail: [email protected]Department of Mechanical Engineering, Louisiana State University, Baton Rouge, LA 70803 Xiaoliang Wan Assistant Professor Department of Mathematics, Louisiana State University, Baton Rouge, LA 70803 e-mail: [email protected]Optimization of Forcing Parameters of Film Cooling Effectiveness An optimization strategy is described that combines high-fidelity simulations with response surface construction, and is applied to pulsed film cooling for turbine blades. The response surface is constructed for the film cooling effectiveness as a function of duty cycle, in the range of DC between 0.05 and 1, and pulsation frequency St in the range of 0.2–2, using a pseudospectral projection method. The jet is fully modulated and the blow- ing ratio, when the jet is on, is 1.5 in all cases. Overall 73 direct numerical simulations (DNS) using spectral element method were performed to sample the film cooling effec- tiveness on a Clenshaw–Curtis grid in the design space. The geometry includes a 35-degree delivery tube and a plenum. It is observed that in the parameter space explored a global optimum exists, and in the present study, the best film cooling effectiveness is found at DC ¼ 0.14 and St ¼ 1.03. In the same range of DC and St, four other local opti- mums were found. The physical mechanisms leading to the forcing parameters of the global optimum are explored and ingestion of the crossflow into the delivery tube is observed to play an important role in this process. The gradient-based optimization algo- rithms are argued to be unsuitable for the current problem due to the nonconvexity of the objective function. [DOI: 10.1115/1.4025732] 1 Introduction To enhance the thermal efficiency of a gas turbine, higher rotor inlet temperatures are desired requiring more effective cooling strategies of the components downstream. Film cooling of the high pressure turbine is commonly employed in modern turbine designs [1]. The coolant flow is extracted from the compressor and is bled through discrete film holes on the surface of the blade. The role of the coolant layer is to protect the components on the hot gas path and therefore increases the life of these components. The interaction between the coolant air and the mainstream causes aerodynamic losses in the turbine stage. In addition, coolant air represents a loss of the process air available for power or thrust. For these reasons one of the main objectives in cooling design is to use coolant as minimally as possible while ensuring a proper coverage of the coolant on the hot gas path components. In order to improve cooling effectiveness, there have been a large number of studies that have explored hole shapes, blowing ratios (the ratio of the jet velocity to the crossflow velocity), cool- ant injection angles and other design parameters [1–3]. The major- ity of the studies that have explored parametric effects are either experimental or simulations that utilize the Reynolds-averaged Navier–Stokes (RANS) equations and a turbulence model. How- ever, turbulence models in RANS have been shown to not capture the dynamics of the flow field accurately, and high-fidelity spa- tially and temporally resolved simulations that do not require models to capture the effects of the entire turbulent spectrum are needed [4]. Such techniques represented by direct numerical sim- ulations (DNS), which resolves the entire spectrum, or large eddy simulations (LES), that captures the energetic parts of the spec- trum, have indeed been recently employed in a number of film cooling studies [5–9]. Such high-fidelity simulations are used in the present work. In recent years, pulsation of the coolant air has been suggested as one of the strategies that can possibly increase the film cooling effectiveness. Several researchers have studied the impact of pulsation on film cooling effectiveness, but the reported results have been mixed with no clear conclusive outcomes. Some key studies are reviewed below in order to motivate the present work. Coulthard et al. [10] carried out an experimental study for an inclined jet with inclination angle of 35 deg. Their results show that the steady jet with BR of 0.5 resulted in the best film cooling effectiveness, and pulsations adversely impacted cooling effec- tiveness. Ekkad et al. [11] performed an experimental study in which they investigated the effect of pulsation on the film cooling effectiveness on a leading edge model for a variety of forcing pa- rameters. At the lowest blowing ratio, BR ¼ 0:75, the effect of pulsation was negligible. However, at higher blowing ratios pulsa- tion had a positive effect on the film cooling effectiveness. They also observed that the pulsed jet outperformed the steady jet with the same time-averaged blowing ratio. El-Gabry and Rivir [12] studied the effect of pulsation on the leading edge film cooling on the same geometry [11], and observed that the film effectiveness of the pulsed cases were lower than that of steady jets with the same time-averaged blowing ratios. Muldoon and Acharya [13] performed direct numerical simula- tions for St in the range of 0.004 to 0.32 and DC of 0.25 and 0.5. The baseline simulation was a steady jet at BR ¼ 1:5. Pulsed cases at DC ¼ 0:5 improved the film cooling effectiveness com- pared to the baseline case. The pulsed jet also showed improved film cooling effectiveness than a steady jet with the same effective mass flow rate, i.e., BR ¼ 0:75. Recently Bidan et al. [14] carried out an experimental/numeri- cal study of a 35-deg jet in a crossflow. They observed that pulsa- tion resulted in decrease of film cooling performance when compared against steady jets at the same mass flow rate. However, pulsated jets showed improvement of film cooling effectiveness when compared with steady cases with the same high blowing ratio. It is clear from the studies above [10–14] that the reported results are not consistent with both positive and negative effects of coolant pulsations on film cooling. Further, in the experimental studies reported in the literature, there is a significant amount of deviation between the desired instantaneous blowing ratio and the actual delivered pulse form. This variability is usually more pronounced at higher frequencies. For instance, experimental Contributed by the International Gas Turbine Institute (IGTI) of ASME for publication in the JOURNAL OF TURBOMACHINERY. Manuscript received August 4, 2013; final manuscript received August 18, 2013; published online November 28, 2013. Editor: Ronald Bunker. Journal of Turbomachinery JUNE 2014, Vol. 136 / 061016-1 Copyright V C 2014 by ASME Downloaded From: http://turbomachinery.asmedigitalcollection.asme.org/ on 12/01/2013 Terms of Use: http://asme.org/terms
Optimization of ForcingParameters of Film CoolingEffectivenessAn optimization strategy is described that combines high-fidelity simulations withresponse surface construction, and is applied to pulsed film cooling for turbine blades.The response surface is constructed for the film cooling effectiveness as a function of dutycycle, in the range of DC between 0.05 and 1, and pulsation frequency St in the range of0.2–2, using a pseudospectral projection method. The jet is fully modulated and the blow-ing ratio, when the jet is on, is 1.5 in all cases. Overall 73 direct numerical simulations(DNS) using spectral element method were performed to sample the film cooling effec-tiveness on a Clenshaw–Curtis grid in the design space. The geometry includes a35-degree delivery tube and a plenum. It is observed that in the parameter space exploreda global optimum exists, and in the present study, the best film cooling effectiveness isfound at DC¼ 0.14 and St¼ 1.03. In the same range of DC and St, four other local opti-mums were found. The physical mechanisms leading to the forcing parameters of theglobal optimum are explored and ingestion of the crossflow into the delivery tube isobserved to play an important role in this process. The gradient-based optimization algo-rithms are argued to be unsuitable for the current problem due to the nonconvexity of theobjective function. [DOI: 10.1115/1.4025732]
1 Introduction
To enhance the thermal efficiency of a gas turbine, higher rotorinlet temperatures are desired requiring more effective coolingstrategies of the components downstream. Film cooling of thehigh pressure turbine is commonly employed in modern turbinedesigns [1]. The coolant flow is extracted from the compressorand is bled through discrete film holes on the surface of the blade.The role of the coolant layer is to protect the components on thehot gas path and therefore increases the life of these components.The interaction between the coolant air and the mainstream causesaerodynamic losses in the turbine stage. In addition, coolant airrepresents a loss of the process air available for power or thrust.For these reasons one of the main objectives in cooling design isto use coolant as minimally as possible while ensuring a propercoverage of the coolant on the hot gas path components.
In order to improve cooling effectiveness, there have been alarge number of studies that have explored hole shapes, blowingratios (the ratio of the jet velocity to the crossflow velocity), cool-ant injection angles and other design parameters [1–3]. The major-ity of the studies that have explored parametric effects are eitherexperimental or simulations that utilize the Reynolds-averagedNavier–Stokes (RANS) equations and a turbulence model. How-ever, turbulence models in RANS have been shown to not capturethe dynamics of the flow field accurately, and high-fidelity spa-tially and temporally resolved simulations that do not requiremodels to capture the effects of the entire turbulent spectrum areneeded [4]. Such techniques represented by direct numerical sim-ulations (DNS), which resolves the entire spectrum, or large eddysimulations (LES), that captures the energetic parts of the spec-trum, have indeed been recently employed in a number of filmcooling studies [5–9]. Such high-fidelity simulations are used inthe present work.
In recent years, pulsation of the coolant air has been suggestedas one of the strategies that can possibly increase the film coolingeffectiveness. Several researchers have studied the impact of
pulsation on film cooling effectiveness, but the reported resultshave been mixed with no clear conclusive outcomes. Some keystudies are reviewed below in order to motivate the present work.
Coulthard et al. [10] carried out an experimental study for aninclined jet with inclination angle of 35 deg. Their results showthat the steady jet with BR of 0.5 resulted in the best film coolingeffectiveness, and pulsations adversely impacted cooling effec-tiveness. Ekkad et al. [11] performed an experimental study inwhich they investigated the effect of pulsation on the film coolingeffectiveness on a leading edge model for a variety of forcing pa-rameters. At the lowest blowing ratio, BR ¼ 0:75, the effect ofpulsation was negligible. However, at higher blowing ratios pulsa-tion had a positive effect on the film cooling effectiveness. Theyalso observed that the pulsed jet outperformed the steady jet withthe same time-averaged blowing ratio. El-Gabry and Rivir [12]studied the effect of pulsation on the leading edge film cooling onthe same geometry [11], and observed that the film effectivenessof the pulsed cases were lower than that of steady jets with thesame time-averaged blowing ratios.
Muldoon and Acharya [13] performed direct numerical simula-tions for St in the range of 0.004 to 0.32 and DC of 0.25 and 0.5.The baseline simulation was a steady jet at BR ¼ 1:5. Pulsedcases at DC ¼ 0:5 improved the film cooling effectiveness com-pared to the baseline case. The pulsed jet also showed improvedfilm cooling effectiveness than a steady jet with the same effectivemass flow rate, i.e., BR ¼ 0:75.
Recently Bidan et al. [14] carried out an experimental/numeri-cal study of a 35-deg jet in a crossflow. They observed that pulsa-tion resulted in decrease of film cooling performance whencompared against steady jets at the same mass flow rate. However,pulsated jets showed improvement of film cooling effectivenesswhen compared with steady cases with the same high blowingratio.
It is clear from the studies above [10–14] that the reportedresults are not consistent with both positive and negative effectsof coolant pulsations on film cooling. Further, in the experimentalstudies reported in the literature, there is a significant amount ofdeviation between the desired instantaneous blowing ratio andthe actual delivered pulse form. This variability is usually morepronounced at higher frequencies. For instance, experimental
Contributed by the International Gas Turbine Institute (IGTI) of ASME forpublication in the JOURNAL OF TURBOMACHINERY. Manuscript received August 4, 2013;final manuscript received August 18, 2013; published online November 28, 2013.Editor: Ronald Bunker.
Journal of Turbomachinery JUNE 2014, Vol. 136 / 061016-1Copyright VC 2014 by ASME
Downloaded From: http://turbomachinery.asmedigitalcollection.asme.org/ on 12/01/2013 Terms of Use: http://asme.org/terms
measurements of Ref. [10] shows 100% deviation between thephased average blowing ratio at St ¼ 0:19 compared to thedesired blowing ratio. In the experimental studies carried out byRefs. [12] and [14], significant amount of uncertainty, particularlyat high St in Ref. [14], is reported. This variability in deliveringthe desired blowing ratio for the pulsed film cooling, howeverunavoidable, renders the task of comparing these studies cumber-some if not impossible, and this may, among other factors, explainthe mixed results in the literature. Moreover, the majority of thestudies to date have focused on preselecting the forcing frequencybased on available hardware or on natural time scales in the flow.Thus, the parametric window exploring the role of pulsations havebeen limited, and it is possible that the optimal forcing frequencymay be outside the preselected ranges considered.
Based on the results reported and the above arguments, it isclear that the role of pulsation on the cooling effectiveness needsto be better understood. In the current study, we perform con-trolled numerical experiments using high-fidelity direct numericalsimulations for a wide range of pulsation frequencies(St 2 ½0:2; 2�) and duty cycles (DC 2 ½0:05; 1�Þ. We extract theresponse surface of the system with respect to DC and St, andidentify global and local optimums in the DC� St space. In all ofour simulations plenum and the delivery tube are included,since these are recognized to play an important role on the filmcooling behavior [1–3]. To overcome the expensive computationalcost of such a problem, we employ an efficient discretization strat-egy in the design space by using fast-converging spectral polyno-mials along with a high-order spectral/hp element method to carryout the direct numerical simulations. Within the range of parame-ters considered, a key goal of the paper is to find the optimal pul-sation parameters, and to understand the mechanisms leading tothe global optimal condition for film cooling effectiveness. Adescription of this optimization approach, and the correspondingresults obtained for the film cooling cases are presented in thispaper.
2 Methodology
We solve the incompressible Navier–Stokes equations withoutany use of a turbulence model by resolving all time and spacescales. These equations in nondimensional form are
@u
@tþ ðu � rÞu ¼ �rpþ 1
Rer2u (1)
r � u ¼ 0 (2)
where u ¼ uðx; t; nÞ is the nondimensional velocity vector fieldand p ¼ pðx; t; nÞ is the nondimensional pressure field in aspace(x)-time (t) domain and n ¼ ðn1; n2Þ is a two-dimensionalvector of design or control parameters. In the current study,design parameters are the duty cycle DC, and the nondimensionalpulsation period Tp ¼ U1=Df , where U1 is the crossflowvelocity, D is the jet diameter and f is the dimensional pulsationfrequency. As it will be explained later in this section DC and Tp
are related to n1 and n2 through a linear mapping. The Reynoldsnumber is defined as Re ¼ U1D=�, where � is the kinematic vis-cosity. In order to calculate the heat transfer on the blade surfacethe energy equation for the incompressible flow is solved. Thisequation is given by
@h@tþ ðu � rÞh ¼ 1
RePrr2h (3)
where h ¼ hðx; t; nÞ is the nondimensional temperature given by
h ¼ T � Tc
Th � Tc(4)
Here Tc is the coolant temperature and Th is the hot gastemperature.
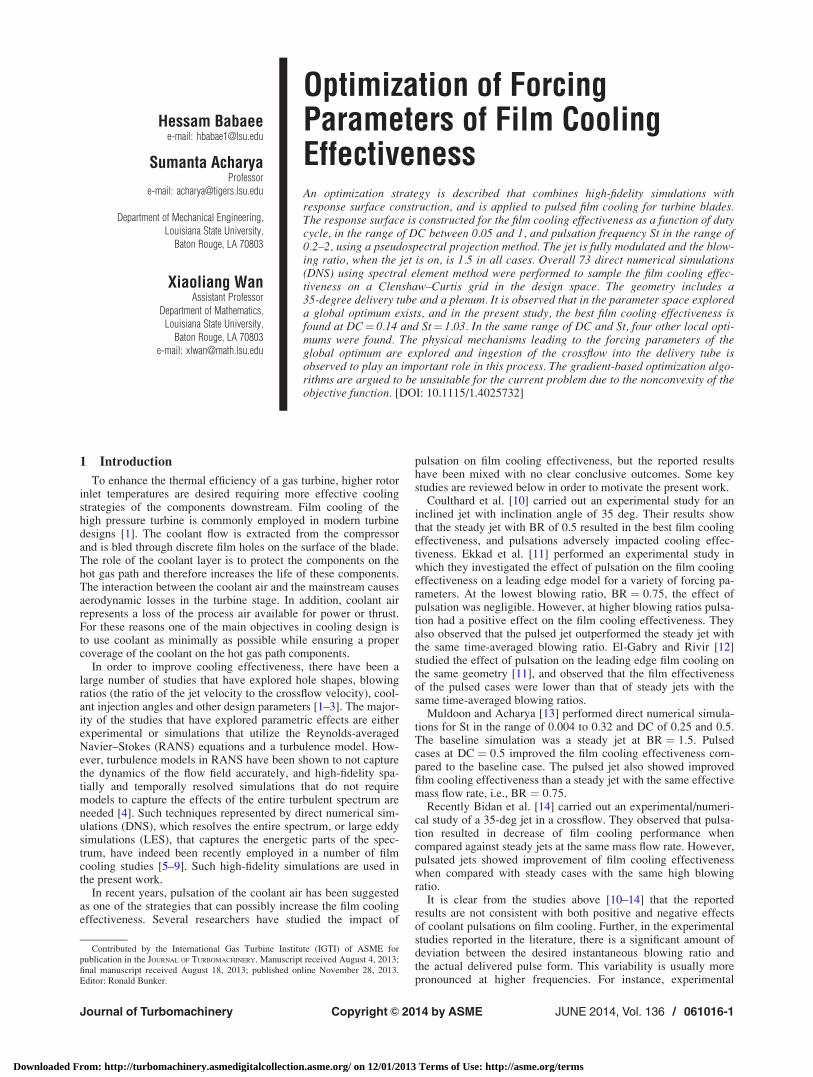
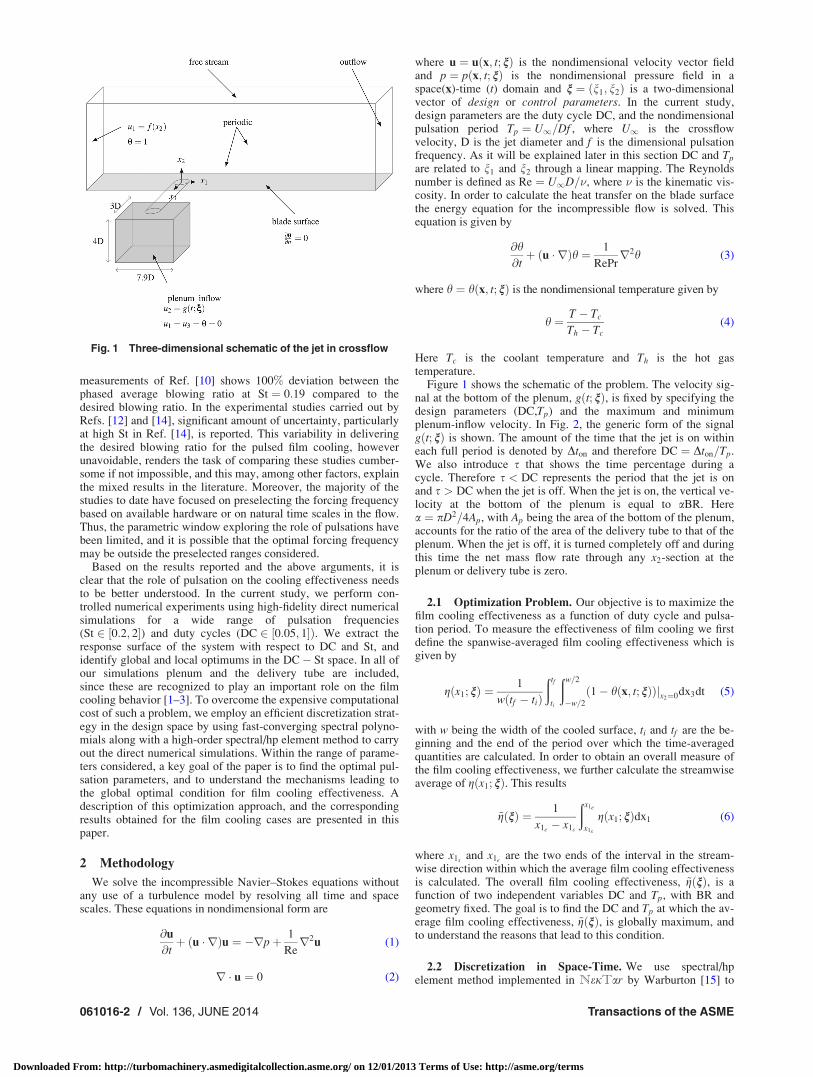
Figure 1 shows the schematic of the problem. The velocity sig-nal at the bottom of the plenum, gðt; nÞ, is fixed by specifying thedesign parameters (DC,Tp) and the maximum and minimumplenum-inflow velocity. In Fig. 2, the generic form of the signalgðt; nÞ is shown. The amount of the time that the jet is on withineach full period is denoted by Dton and therefore DC ¼ Dton=Tp.We also introduce s that shows the time percentage during acycle. Therefore s < DC represents the period that the jet is onand s > DC when the jet is off. When the jet is on, the vertical ve-locity at the bottom of the plenum is equal to aBR. Herea ¼ pD2=4Ap, with Ap being the area of the bottom of the plenum,accounts for the ratio of the area of the delivery tube to that of theplenum. When the jet is off, it is turned completely off and duringthis time the net mass flow rate through any x2-section at theplenum or delivery tube is zero.
2.1 Optimization Problem. Our objective is to maximize thefilm cooling effectiveness as a function of duty cycle and pulsa-tion period. To measure the effectiveness of film cooling we firstdefine the spanwise-averaged film cooling effectiveness which isgiven by
gðx1; nÞ ¼ 1
wðtf � tiÞ
ðtf
ti
ðw=2
�w=2
ð1� hðx; t; nÞÞjx2¼0dx3dt (5)
with w being the width of the cooled surface, ti and tf are the be-ginning and the end of the period over which the time-averagedquantities are calculated. In order to obtain an overall measure ofthe film cooling effectiveness, we further calculate the streamwiseaverage of gðx1; nÞ. This results
~gðnÞ ¼ 1
x1e� x1s
ðx1e
x1s
gðx1; nÞdx1 (6)
where x1sand x1e
are the two ends of the interval in the stream-wise direction within which the average film cooling effectivenessis calculated. The overall film cooling effectiveness, ~gðnÞ, is afunction of two independent variables DC and Tp, with BR andgeometry fixed. The goal is to find the DC and Tp at which the av-erage film cooling effectiveness, ~gðnÞ, is globally maximum, andto understand the reasons that lead to this condition.
2.2 Discretization in Space-Time. We use spectral/hpelement method implemented in NejTar by Warburton [15] to
Fig. 1 Three-dimensional schematic of the jet in crossflow
061016-2 / Vol. 136, JUNE 2014 Transactions of the ASME
Downloaded From: http://turbomachinery.asmedigitalcollection.asme.org/ on 12/01/2013 Terms of Use: http://asme.org/terms
perform direct numerical simulations of the incompressibleNavier–Stokes equations along with the advection-diffusion equa-tion for temperature given by Eqs. (1)–(3). For time advancement,the semi-implicit third-order fractional step method [16] isemployed. In space unstructured hexahedral element with spectralorder of three or four is used. More details of the spectral/hpelement solver are given in Ref. [17].
2.3 Discretization in Design Parameter Space. We intendto estimate the response surface for film cooling pulsation wherethe design parameters, DC and Tp, constitute a Cartesian two-dimensional space and the response surface is f :¼ f ðx; nÞ. Here, fis a generic time-averaged variable. In order to discretize thegoverning Eqs. (1)–(3) in the design space ðn1; n2Þ, we use pseu-dospectral method [18] to project f ðx; nÞ to a polynomial space.This follows
f ðx; nÞ ¼ fNðx; nÞ þ eðx; nÞ (7)
with
fNðx; nÞ ¼XP2
j¼0
XP1
i¼0
bfijðxÞ/iðn1Þ/jðn2Þ (8)
where /iðn1Þ and /jðn2Þ are polynomials up to degree P1 and P2,respectively, and eðx; nÞ is the error of the expansion. For conven-ience we use a two-dimensional basis which is obtained bymultiplying the univariate basis in each direction. This follows
/rðnÞ ¼ /iðn1Þ/jðn2Þ; 0 � i � P1; 0 � j � P2 (9)
where r is
r ¼ iþ jðP1 þ 1Þ; 0 � i � P1; 0 � j � P2
Therefore 0 � r � N with N ¼ ðP1 þ 1ÞðP2 þ 1Þ � 1. Thus,Eq. (8) can be rewritten as
fNðx; nÞ ¼XN
i¼0
bfiðxÞ/iðnÞ (10)
We use Legendre polynomials for their fast convergence for asmooth function f . We define an inner product and a norm givenby
ðf ; gÞ :¼ð
f ðnÞgðnÞdn; fk k :¼ ðf ; f Þ1=2(11)
Legendre polynomials form an orthogonal basis, and therefore
ð/i;/jÞ ¼ dijc2j ; i; j ¼ 0; 1; 2;…;N (12)
where cj ¼ /j
�� ��The coefficients f̂iðxÞ are obtained using Galerkin projection by
taking the inner product of two sides of Eq. (10) with /j. Usingthe orthogonality relation of the Legendre polynomial given byEq. (12), we have
bfjðxÞ ¼
ðf ðx; nÞ/jðnÞdn
c2j
; j ¼ 0; 1; 2;…;N (13)
To calculateÐ
f ðx; nÞdn, we use pseudospectral method [18] inwhich the integral is estimated using a quadrature rule. Thisfollows
ðf ðx; nÞ/jðnÞdn ’
XQ
i¼1
wðiÞf ðnðiÞÞ/jðnðiÞÞ (14)
where nðiÞ and wðiÞ; i ¼ 1; 2;…Q are quadrature points andweights in the two-dimensional space of design variables,respectively.
We use Clenshaw–Curtis nodes [19] which are the extrema ofChebychev polynomials and for a one-dimensional Chebyshevpolynomial of order P are given by
HP ¼ cos2pi
P; i ¼ 0; 1…;P
� �(15)
Using Clenshaw–Curtis nodes (HP) results in accurate evaluationof expansion coefficients (Eq. (13)) and thus, leading to fast con-vergence of fNðx; nÞ to f ðx; nÞ for a smooth function f [20]. Thisfact is at the core of the efficiency of the method that we are usingto discretize Eqs. (1)–(3) in the design space. Since evaluating ateach sample point is in fact solving an expensive DNS simulation,our goal is to minimize the number of samples for a desirableaccuracy.
Following the above notation, if the Clenshaw–Curtis nodes fora polynomial of order P in the ni-direction are denoted by HP
i , theClenshaw–Curtis nodes in the two-dimensional design space aregiven by the full tensor product of the corresponding one-dimensional nodes in each direction. This follows
HðP1;P2Þ ¼ HP1
1 �HP2
2 (16)
In this study we always use P1 ¼ P2 ¼ P, however, in general,they can be different. This results in Q ¼ ðPþ 1Þ2 quadraturepoints in the design space. Note that
ni 2 ½�1; 1�; i ¼ 1; 2
A linear mapping is then used to transform ni’s to arbitrary inter-vals. This follows
n�i ¼1� ni
2ai þ
1þ ni
2bi; i ¼ 1; 2
where
n�i 2 ½ai; bi�; i ¼ 1; 2
Fig. 2 Blowing ratio signal gðt ; nÞ specified as vertical velocityat the plenum inlet
Journal of Turbomachinery JUNE 2014, Vol. 136 / 061016-3
Downloaded From: http://turbomachinery.asmedigitalcollection.asme.org/ on 12/01/2013 Terms of Use: http://asme.org/terms
In the current study n�1 and n�2 represent pulsation period (Tp) andduty cycle (DC) respectively. Now we can use a similar polyno-mial expansion as in the Eq. (10), to estimate the time-averagedquantities:
�uNðx; nÞ ¼XN
k¼0
b�ukðxÞ/kðnÞ (17)
�pNðx; nÞ ¼XN
k¼0
b�pkðxÞ/kðnÞ (18)
hNðx; nÞ ¼XN
k¼0
b�hkðxÞ/kðnÞ (19)
where the expansion coefficients are obtained from
�̂ukðxÞ ¼XQ
i¼1
wðiÞuðx; nðiÞÞ/kðnðiÞÞ=c2k ; 0 � k � N (20)
b�pkðxÞ ¼XQ
i¼1
wðiÞpðx; nðiÞÞ/kðnðiÞÞ=c2k ; 0 � k � N (21)
b�hkðxÞ ¼XQ
i¼1
wðiÞhðx; nðiÞÞ/kðnðiÞÞ=c2k ; 0 � k � N (22)
Similarly, ~gðnÞ is approximated using the polynomial expansion.This follows
~gNðnÞ ¼XN
k¼0
b~gk/kðnÞ (23)
Using Eqs. (5), (6), and (23), it is easy to verify that
~̂gk ¼ 1� 1
wðx1e� x1s
Þ
ðw=2
�w=2
ðx1e
x1s
b�hkðxÞjx2¼0dx1dx3 (24)
3 Simulation Details
In all the cases in this study we perform direct numerical simu-lation on the jet in crossflow with the schematic of the problemshown in Fig. 1. The origin of the coordinate system is at the cen-ter of the jet exit and x1 is aligned with the streamwise direction,x2 with the direction normal to the cooled surface and x3 with thespanwise direction. The plenum has the length, height and widthof 7.9D, 4D and 3D, respectively. The length of the delivery tubeis 3.5D and the inclination angle is 35 deg. The mainstream do-main, where the crossflow and the coolant interact, spans the
volume with the size of 22D� 10D� 3D. The center of the jetexit is located 7D downstream from the crossflow inlet. The cross-flow boundary condition is assumed to be a laminar boundarylayer flow with boundary layer thickness of d99%=D ¼ 0:5, whered99% is the thickness at which the streamwise velocity in theboundary layer reaches 99% of the free-stream velocity. On thetop boundary plane, free-stream flow is assumed withuðx1; 10; x3Þ ¼ ðU1; 0; 0Þ and hðx1; 10; x3Þ ¼ 1, and on thespanwise direction periodic boundary condition is enforced. Theperiodic boundary condition mimics the situation where a row ofholes are arranged in the spanwise direction. In the current case,the center-to-center distance between two consecutive holes is3D. A zero normal derivative boundary condition is assumed atthe outflow. The uniform boundary condition gðt; nÞ (see Fig. 2) isused for the vertical velocity component u2 at the bottom of theplenum with u1 ¼ u3 ¼ 0 and h ¼ 0. The area scaling factor isa ¼ 0:0331. As noted earlier, each pair of the design variablesðDC; TpÞ, and the peak blowing ratio (the blowing ratio when thejet is on and is set to 1.5) specifies the signal gðt; nÞ. The Reynoldsnumber, Rej ¼ UjD=�, based on the jet space-averaged velocity(when the jet is on) is 1500 throughout and Prandtl number isPr ¼ 1. For all the wall boundaries, adiabatic condition isassumed for temperature. The computational time step wasroughly 0.001. All simulations were advanced at least 40D=U1before the statistics are collected. The statistics are then collectedfor approximately another 40D=U1. Care was taken to ensurethat the calculation of the statistics starts at the beginning of a pul-sation cycle and finishes at the end of another pulsation cycle.Additional sampling did not change the result.
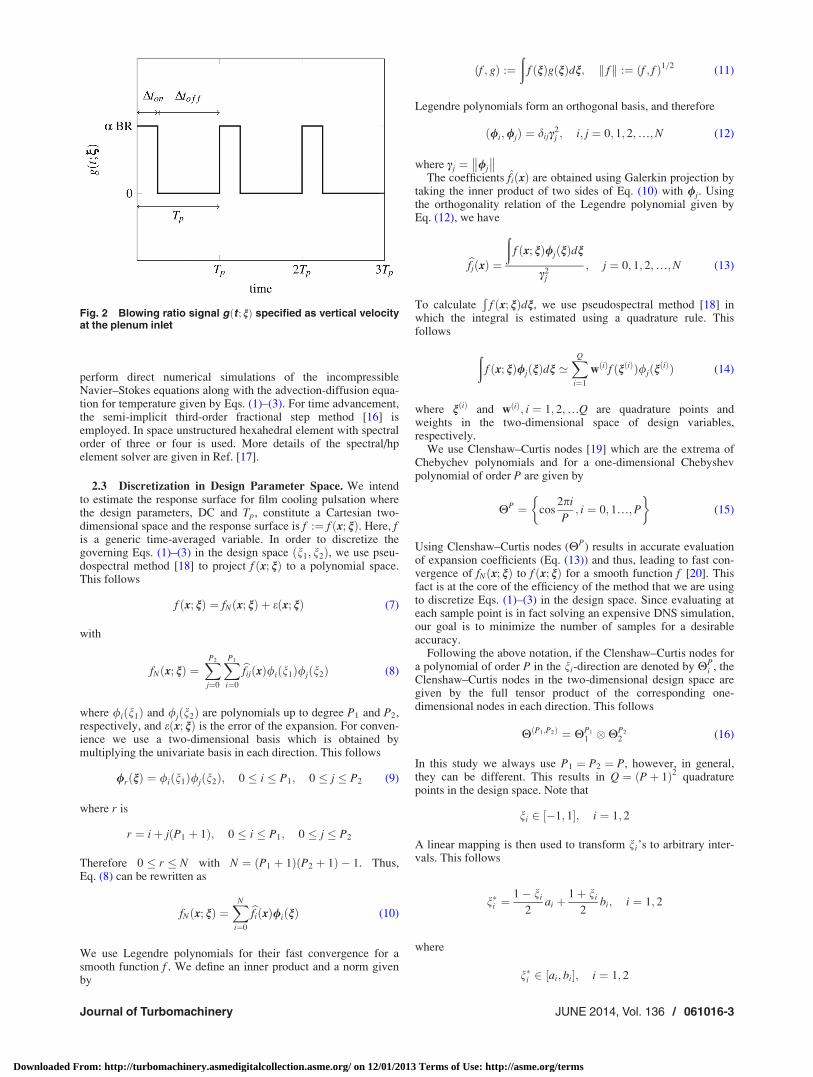
3.1 Computational Mesh. We use hexahedral elements ofspectral order of three and four in the current simulations. Figure 3shows the three-dimensional view of the grid. To generate thegrid, quadrilateral meshes were first generated in the x1 � x3
planes in the main-stream domain, the delivery tube and the ple-num. The quadrilateral elements exactly match across the com-mon faces in between the volume parts. The two-dimensionalmesh was then swept along the x2 direction in the mainstream do-main and plenum and along the axis of the cylinder in the deliverytube. The height of the first element in the crossflow boundarylayer is 0.06D. The height of the elements increases (with 16elements) using hyperbolic distribution to 0.3D at x2 ¼ 4. Twoelements were used from x2 ¼ 4 to the top boundary at x2 ¼ 10.Note that flow in this region remains steady with small gradientswhich justifies using large elements. Along the delivery tube, 16elements with uniform distribution were used. The finest elementsare found in the delivery tube, especially in the boundary layerregion where flow is highly unsteady with steep gradients. A closex1 � x3 view of the mesh in the vicinity of the jet exit is shown inFig. 3. In the plenum, 11 elements were used in the x2 directionwith Dx2 ¼ 0:06D for the topmost elements and Dx2 ¼ 0:12D forthe first element in the bottom. The elements in between were dis-tributed using hyperbolic distribution. In total, 48,162 hexahedralelements were created. In each element spectral polynomials withorder three or four were used. This amounts to a total degree offreedom of 3.1� 106s for spectral order three, and 6.0 �106 forspectral order of four.
In the design space, we use polynomial order up to degreeP ¼ 8 for each design variable. This results in ðPþ 1Þ2 ¼ 81points in the design space. In total, 73 DNS runs were performed,each on 56 processors and for six days. For all of the simulationsstudied in this work, roughly 600,000 CPU hours were consumed.
3.2 Convergence in Space and Time. To study the depend-ence of the numerical solution to grid resolution, we consideredfour simulations whose specifications are shown in Table 1. As arefinement strategy, we increased the spectral order of the meshfrom three to four. As explained in the previous section, the meshwith spectral order four has almost twice as many degrees of
Fig. 3 Unstructured hexahedral grid; (a) three-dimensionalview; (b) x1 � x3 view of the grid in the vicinity of the jet exitwith spectral order m 5 4
061016-4 / Vol. 136, JUNE 2014 Transactions of the ASME
Downloaded From: http://turbomachinery.asmedigitalcollection.asme.org/ on 12/01/2013 Terms of Use: http://asme.org/terms
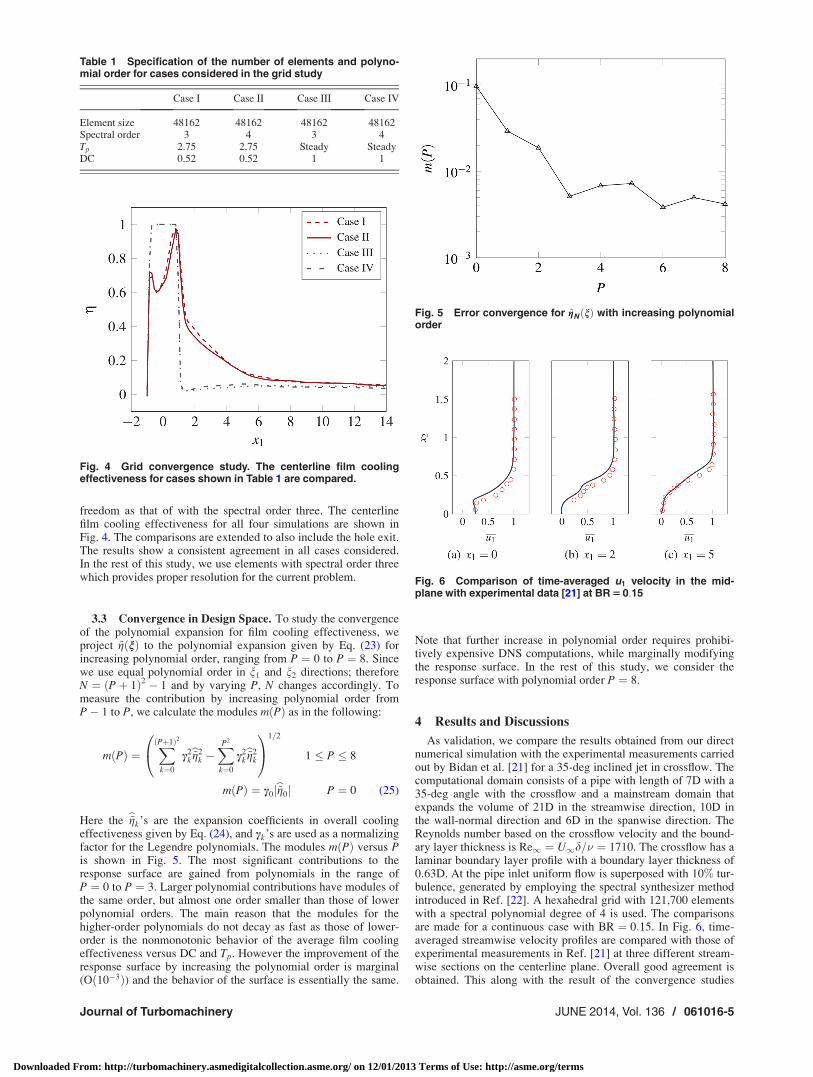
freedom as that of with the spectral order three. The centerlinefilm cooling effectiveness for all four simulations are shown inFig. 4. The comparisons are extended to also include the hole exit.The results show a consistent agreement in all cases considered.In the rest of this study, we use elements with spectral order threewhich provides proper resolution for the current problem.
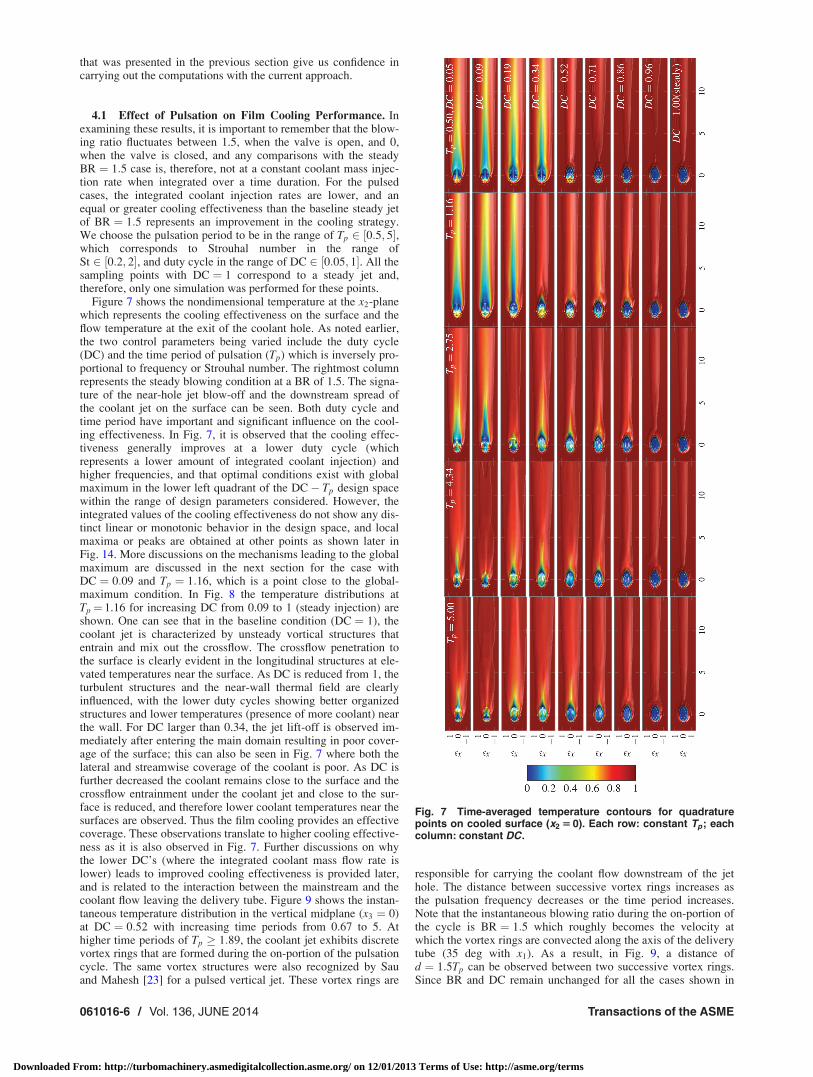
3.3 Convergence in Design Space. To study the convergenceof the polynomial expansion for film cooling effectiveness, weproject ~gðnÞ to the polynomial expansion given by Eq. (23) forincreasing polynomial order, ranging from P ¼ 0 to P ¼ 8. Sincewe use equal polynomial order in n1 and n2 directions; thereforeN ¼ ðPþ 1Þ2 � 1 and by varying P, N changes accordingly. Tomeasure the contribution by increasing polynomial order fromP� 1 to P, we calculate the modules mðPÞ as in the following:
mðPÞ ¼XðPþ1Þ2
k¼0
c2kb~g2
k �XP2
k¼0
c2kb~g2
k
0@
1A1=2
1 � P � 8
mðPÞ ¼ c0jb~g0j P ¼ 0 (25)
Here the b~gk’s are the expansion coefficients in overall coolingeffectiveness given by Eq. (24), and ck’s are used as a normalizingfactor for the Legendre polynomials. The modules mðPÞ versus Pis shown in Fig. 5. The most significant contributions to theresponse surface are gained from polynomials in the range ofP ¼ 0 to P ¼ 3. Larger polynomial contributions have modules ofthe same order, but almost one order smaller than those of lowerpolynomial orders. The main reason that the modules for thehigher-order polynomials do not decay as fast as those of lower-order is the nonmonotonic behavior of the average film coolingeffectiveness versus DC and Tp. However the improvement of theresponse surface by increasing the polynomial order is marginal(Oð10�3Þ) and the behavior of the surface is essentially the same.
Note that further increase in polynomial order requires prohibi-tively expensive DNS computations, while marginally modifyingthe response surface. In the rest of this study, we consider theresponse surface with polynomial order P ¼ 8.
4 Results and Discussions
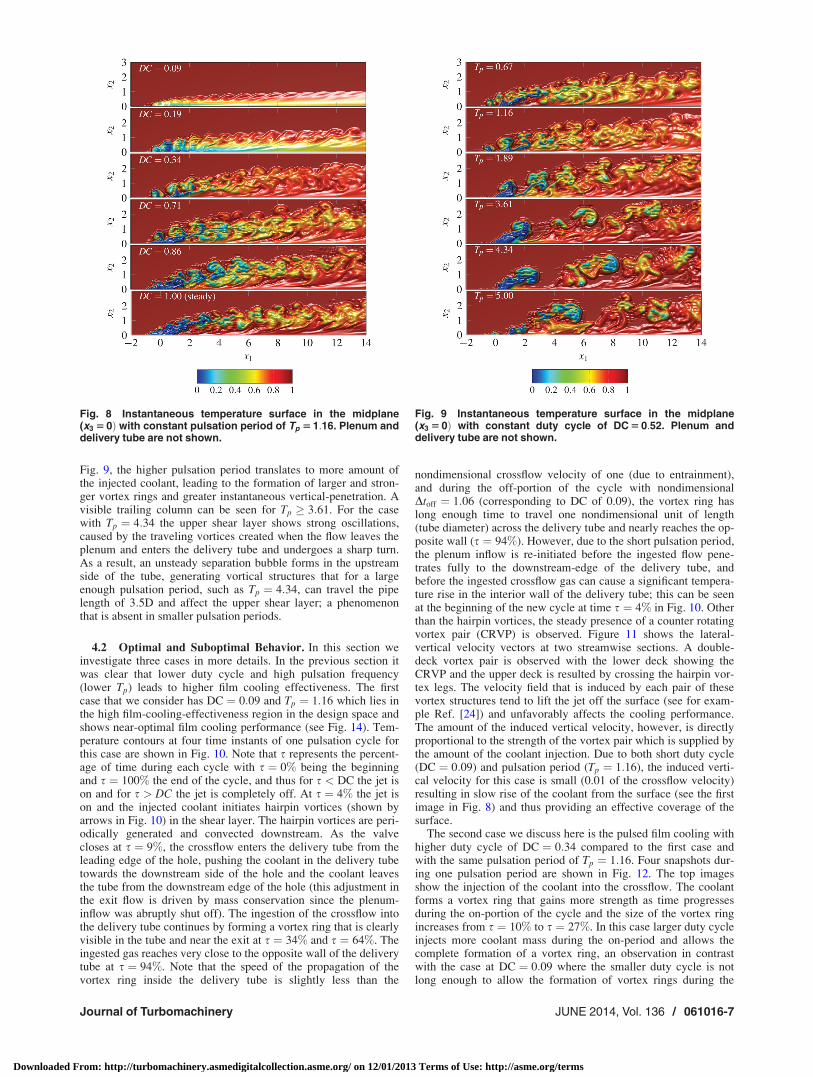
As validation, we compare the results obtained from our directnumerical simulation with the experimental measurements carriedout by Bidan et al. [21] for a 35-deg inclined jet in crossflow. Thecomputational domain consists of a pipe with length of 7D with a35-deg angle with the crossflow and a mainstream domain thatexpands the volume of 21D in the streamwise direction, 10D inthe wall-normal direction and 6D in the spanwise direction. TheReynolds number based on the crossflow velocity and the bound-ary layer thickness is Re1 ¼ U1d=� ¼ 1710. The crossflow has alaminar boundary layer profile with a boundary layer thickness of0:63D. At the pipe inlet uniform flow is superposed with 10% tur-bulence, generated by employing the spectral synthesizer methodintroduced in Ref. [22]. A hexahedral grid with 121,700 elementswith a spectral polynomial degree of 4 is used. The comparisonsare made for a continuous case with BR ¼ 0:15. In Fig. 6, time-averaged streamwise velocity profiles are compared with those ofexperimental measurements in Ref. [21] at three different stream-wise sections on the centerline plane. Overall good agreement isobtained. This along with the result of the convergence studies
Table 1 Specification of the number of elements and polyno-mial order for cases considered in the grid study
Case I Case II Case III Case IV
Element size 48162 48162 48162 48162Spectral order 3 4 3 4Tp 2.75 2.75 Steady SteadyDC 0.52 0.52 1 1
Fig. 4 Grid convergence study. The centerline film coolingeffectiveness for cases shown in Table 1 are compared.
Fig. 5 Error convergence for ~gN ðnÞ with increasing polynomialorder
Fig. 6 Comparison of time-averaged u1 velocity in the mid-plane with experimental data [21] at BR 5 0:15
Journal of Turbomachinery JUNE 2014, Vol. 136 / 061016-5
Downloaded From: http://turbomachinery.asmedigitalcollection.asme.org/ on 12/01/2013 Terms of Use: http://asme.org/terms
that was presented in the previous section give us confidence incarrying out the computations with the current approach.
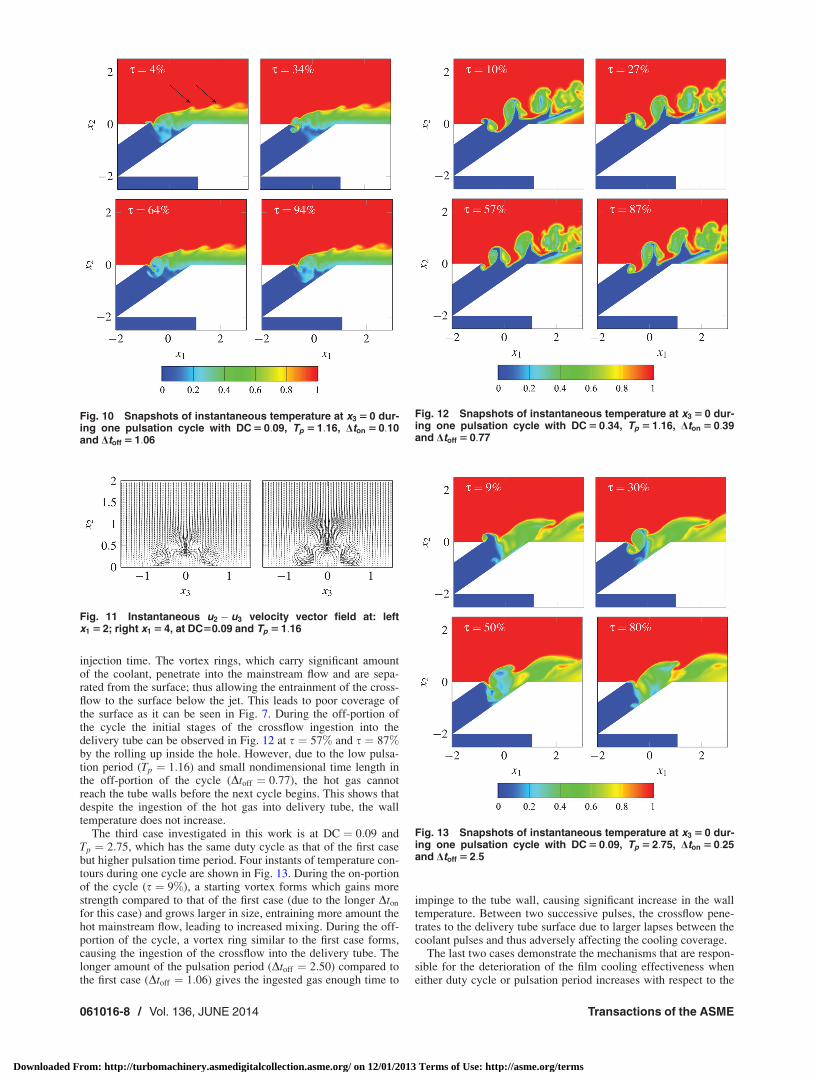
4.1 Effect of Pulsation on Film Cooling Performance. Inexamining these results, it is important to remember that the blow-ing ratio fluctuates between 1.5, when the valve is open, and 0,when the valve is closed, and any comparisons with the steadyBR ¼ 1:5 case is, therefore, not at a constant coolant mass injec-tion rate when integrated over a time duration. For the pulsedcases, the integrated coolant injection rates are lower, and anequal or greater cooling effectiveness than the baseline steady jetof BR ¼ 1:5 represents an improvement in the cooling strategy.We choose the pulsation period to be in the range of Tp 2 ½0:5; 5�,which corresponds to Strouhal number in the range ofSt 2 ½0:2; 2�, and duty cycle in the range of DC 2 ½0:05; 1�. All thesampling points with DC ¼ 1 correspond to a steady jet and,therefore, only one simulation was performed for these points.
Figure 7 shows the nondimensional temperature at the x2-planewhich represents the cooling effectiveness on the surface and theflow temperature at the exit of the coolant hole. As noted earlier,the two control parameters being varied include the duty cycle(DC) and the time period of pulsation (Tp) which is inversely pro-portional to frequency or Strouhal number. The rightmost columnrepresents the steady blowing condition at a BR of 1.5. The signa-ture of the near-hole jet blow-off and the downstream spread ofthe coolant jet on the surface can be seen. Both duty cycle andtime period have important and significant influence on the cool-ing effectiveness. In Fig. 7, it is observed that the cooling effec-tiveness generally improves at a lower duty cycle (whichrepresents a lower amount of integrated coolant injection) andhigher frequencies, and that optimal conditions exist with globalmaximum in the lower left quadrant of the DC� Tp design spacewithin the range of design parameters considered. However, theintegrated values of the cooling effectiveness do not show any dis-tinct linear or monotonic behavior in the design space, and localmaxima or peaks are obtained at other points as shown later inFig. 14. More discussions on the mechanisms leading to the globalmaximum are discussed in the next section for the case withDC ¼ 0:09 and Tp ¼ 1:16, which is a point close to the global-maximum condition. In Fig. 8 the temperature distributions atTp¼ 1.16 for increasing DC from 0.09 to 1 (steady injection) areshown. One can see that in the baseline condition (DC ¼ 1), thecoolant jet is characterized by unsteady vortical structures thatentrain and mix out the crossflow. The crossflow penetration tothe surface is clearly evident in the longitudinal structures at ele-vated temperatures near the surface. As DC is reduced from 1, theturbulent structures and the near-wall thermal field are clearlyinfluenced, with the lower duty cycles showing better organizedstructures and lower temperatures (presence of more coolant) nearthe wall. For DC larger than 0.34, the jet lift-off is observed im-mediately after entering the main domain resulting in poor cover-age of the surface; this can also be seen in Fig. 7 where both thelateral and streamwise coverage of the coolant is poor. As DC isfurther decreased the coolant remains close to the surface and thecrossflow entrainment under the coolant jet and close to the sur-face is reduced, and therefore lower coolant temperatures near thesurfaces are observed. Thus the film cooling provides an effectivecoverage. These observations translate to higher cooling effective-ness as it is also observed in Fig. 7. Further discussions on whythe lower DC’s (where the integrated coolant mass flow rate islower) leads to improved cooling effectiveness is provided later,and is related to the interaction between the mainstream and thecoolant flow leaving the delivery tube. Figure 9 shows the instan-taneous temperature distribution in the vertical midplane (x3 ¼ 0)at DC ¼ 0:52 with increasing time periods from 0.67 to 5. Athigher time periods of Tp 1:89, the coolant jet exhibits discretevortex rings that are formed during the on-portion of the pulsationcycle. The same vortex structures were also recognized by Sauand Mahesh [23] for a pulsed vertical jet. These vortex rings are
responsible for carrying the coolant flow downstream of the jethole. The distance between successive vortex rings increases asthe pulsation frequency decreases or the time period increases.Note that the instantaneous blowing ratio during the on-portion ofthe cycle is BR ¼ 1:5 which roughly becomes the velocity atwhich the vortex rings are convected along the axis of the deliverytube (35 deg with x1). As a result, in Fig. 9, a distance ofd ¼ 1:5Tp can be observed between two successive vortex rings.Since BR and DC remain unchanged for all the cases shown in
Fig. 7 Time-averaged temperature contours for quadraturepoints on cooled surface (x2 5 0). Each row: constant Tp; eachcolumn: constant DC.
061016-6 / Vol. 136, JUNE 2014 Transactions of the ASME
Downloaded From: http://turbomachinery.asmedigitalcollection.asme.org/ on 12/01/2013 Terms of Use: http://asme.org/terms
Fig. 9, the higher pulsation period translates to more amount ofthe injected coolant, leading to the formation of larger and stron-ger vortex rings and greater instantaneous vertical-penetration. Avisible trailing column can be seen for Tp 3:61. For the casewith Tp ¼ 4:34 the upper shear layer shows strong oscillations,caused by the traveling vortices created when the flow leaves theplenum and enters the delivery tube and undergoes a sharp turn.As a result, an unsteady separation bubble forms in the upstreamside of the tube, generating vortical structures that for a largeenough pulsation period, such as Tp ¼ 4:34, can travel the pipelength of 3:5D and affect the upper shear layer; a phenomenonthat is absent in smaller pulsation periods.
4.2 Optimal and Suboptimal Behavior. In this section weinvestigate three cases in more details. In the previous section itwas clear that lower duty cycle and high pulsation frequency(lower Tp) leads to higher film cooling effectiveness. The firstcase that we consider has DC ¼ 0:09 and Tp ¼ 1:16 which lies inthe high film-cooling-effectiveness region in the design space andshows near-optimal film cooling performance (see Fig. 14). Tem-perature contours at four time instants of one pulsation cycle forthis case are shown in Fig. 10. Note that s represents the percent-age of time during each cycle with s ¼ 0% being the beginningand s ¼ 100% the end of the cycle, and thus for s < DC the jet ison and for s > DC the jet is completely off. At s ¼ 4% the jet ison and the injected coolant initiates hairpin vortices (shown byarrows in Fig. 10) in the shear layer. The hairpin vortices are peri-odically generated and convected downstream. As the valvecloses at s ¼ 9%, the crossflow enters the delivery tube from theleading edge of the hole, pushing the coolant in the delivery tubetowards the downstream side of the hole and the coolant leavesthe tube from the downstream edge of the hole (this adjustment inthe exit flow is driven by mass conservation since the plenum-inflow was abruptly shut off). The ingestion of the crossflow intothe delivery tube continues by forming a vortex ring that is clearlyvisible in the tube and near the exit at s ¼ 34% and s ¼ 64%. Theingested gas reaches very close to the opposite wall of the deliverytube at s ¼ 94%. Note that the speed of the propagation of thevortex ring inside the delivery tube is slightly less than the
nondimensional crossflow velocity of one (due to entrainment),and during the off-portion of the cycle with nondimensionalDtoff ¼ 1:06 (corresponding to DC of 0.09), the vortex ring haslong enough time to travel one nondimensional unit of length(tube diameter) across the delivery tube and nearly reaches the op-posite wall (s ¼ 94%). However, due to the short pulsation period,the plenum inflow is re-initiated before the ingested flow pene-trates fully to the downstream-edge of the delivery tube, andbefore the ingested crossflow gas can cause a significant tempera-ture rise in the interior wall of the delivery tube; this can be seenat the beginning of the new cycle at time s ¼ 4% in Fig. 10. Otherthan the hairpin vortices, the steady presence of a counter rotatingvortex pair (CRVP) is observed. Figure 11 shows the lateral-vertical velocity vectors at two streamwise sections. A double-deck vortex pair is observed with the lower deck showing theCRVP and the upper deck is resulted by crossing the hairpin vor-tex legs. The velocity field that is induced by each pair of thesevortex structures tend to lift the jet off the surface (see for exam-ple Ref. [24]) and unfavorably affects the cooling performance.The amount of the induced vertical velocity, however, is directlyproportional to the strength of the vortex pair which is supplied bythe amount of the coolant injection. Due to both short duty cycle(DC ¼ 0:09) and pulsation period (Tp ¼ 1:16), the induced verti-cal velocity for this case is small (0.01 of the crossflow velocity)resulting in slow rise of the coolant from the surface (see the firstimage in Fig. 8) and thus providing an effective coverage of thesurface.
The second case we discuss here is the pulsed film cooling withhigher duty cycle of DC ¼ 0:34 compared to the first case andwith the same pulsation period of Tp ¼ 1:16. Four snapshots dur-ing one pulsation period are shown in Fig. 12. The top imagesshow the injection of the coolant into the crossflow. The coolantforms a vortex ring that gains more strength as time progressesduring the on-portion of the cycle and the size of the vortex ringincreases from s ¼ 10% to s ¼ 27%. In this case larger duty cycleinjects more coolant mass during the on-period and allows thecomplete formation of a vortex ring, an observation in contrastwith the case at DC ¼ 0:09 where the smaller duty cycle is notlong enough to allow the formation of vortex rings during the
Fig. 8 Instantaneous temperature surface in the midplane(x3 5 0Þ with constant pulsation period of Tp 5 1:16. Plenum anddelivery tube are not shown.
Fig. 9 Instantaneous temperature surface in the midplane(x3 5 0Þ with constant duty cycle of DC 5 0:52. Plenum anddelivery tube are not shown.
Journal of Turbomachinery JUNE 2014, Vol. 136 / 061016-7
Downloaded From: http://turbomachinery.asmedigitalcollection.asme.org/ on 12/01/2013 Terms of Use: http://asme.org/terms
injection time. The vortex rings, which carry significant amountof the coolant, penetrate into the mainstream flow and are sepa-rated from the surface; thus allowing the entrainment of the cross-flow to the surface below the jet. This leads to poor coverage ofthe surface as it can be seen in Fig. 7. During the off-portion ofthe cycle the initial stages of the crossflow ingestion into thedelivery tube can be observed in Fig. 12 at s ¼ 57% and s ¼ 87%by the rolling up inside the hole. However, due to the low pulsa-tion period (Tp ¼ 1:16) and small nondimensional time length inthe off-portion of the cycle (Dtoff ¼ 0:77), the hot gas cannotreach the tube walls before the next cycle begins. This shows thatdespite the ingestion of the hot gas into delivery tube, the walltemperature does not increase.
The third case investigated in this work is at DC ¼ 0:09 andTp ¼ 2:75, which has the same duty cycle as that of the first casebut higher pulsation time period. Four instants of temperature con-tours during one cycle are shown in Fig. 13. During the on-portionof the cycle (s ¼ 9%), a starting vortex forms which gains morestrength compared to that of the first case (due to the longer Dton
for this case) and grows larger in size, entraining more amount thehot mainstream flow, leading to increased mixing. During the off-portion of the cycle, a vortex ring similar to the first case forms,causing the ingestion of the crossflow into the delivery tube. Thelonger amount of the pulsation period (Dtoff ¼ 2:50) compared tothe first case (Dtoff ¼ 1:06) gives the ingested gas enough time to
impinge to the tube wall, causing significant increase in the walltemperature. Between two successive pulses, the crossflow pene-trates to the delivery tube surface due to larger lapses between thecoolant pulses and thus adversely affecting the cooling coverage.
The last two cases demonstrate the mechanisms that are respon-sible for the deterioration of the film cooling effectiveness wheneither duty cycle or pulsation period increases with respect to the
Fig. 10 Snapshots of instantaneous temperature at x3 5 0 dur-ing one pulsation cycle with DC 5 0:09, Tp 5 1:16, Dton 5 0:10and Dtoff 5 1:06
Fig. 11 Instantaneous u2 � u3 velocity vector field at: leftx1 5 2; right x1 5 4, at DC50.09 and Tp 5 1:16
Fig. 12 Snapshots of instantaneous temperature at x3 5 0 dur-ing one pulsation cycle with DC 5 0:34, Tp 5 1:16, Dton 5 0:39and Dtoff 5 0:77
Fig. 13 Snapshots of instantaneous temperature at x3 5 0 dur-ing one pulsation cycle with DC 5 0:09, Tp 5 2:75, Dton 5 0:25and Dtoff 5 2:5
061016-8 / Vol. 136, JUNE 2014 Transactions of the ASME
Downloaded From: http://turbomachinery.asmedigitalcollection.asme.org/ on 12/01/2013 Terms of Use: http://asme.org/terms
near-optimal case (DC ¼ 0:09 and Tp ¼ 1:16). We also note thatfor pulsed cases with very small duty cycle (DC < 0:05), the filmcooling coverage is severely affected by the overwhelmingamount of the crossflow compared to the coolant. Also for lowerpulsation periods than Tp ¼ 1:16 the overall film cooling effec-tiveness slightly decreases, but the physical mechanisms in theflow remain similar to the first case. Thus clearly, optimal condi-tions exists for the pulsation parameters, and the mechanisms con-trolling this are related to the dynamics near the jet-hole exit.
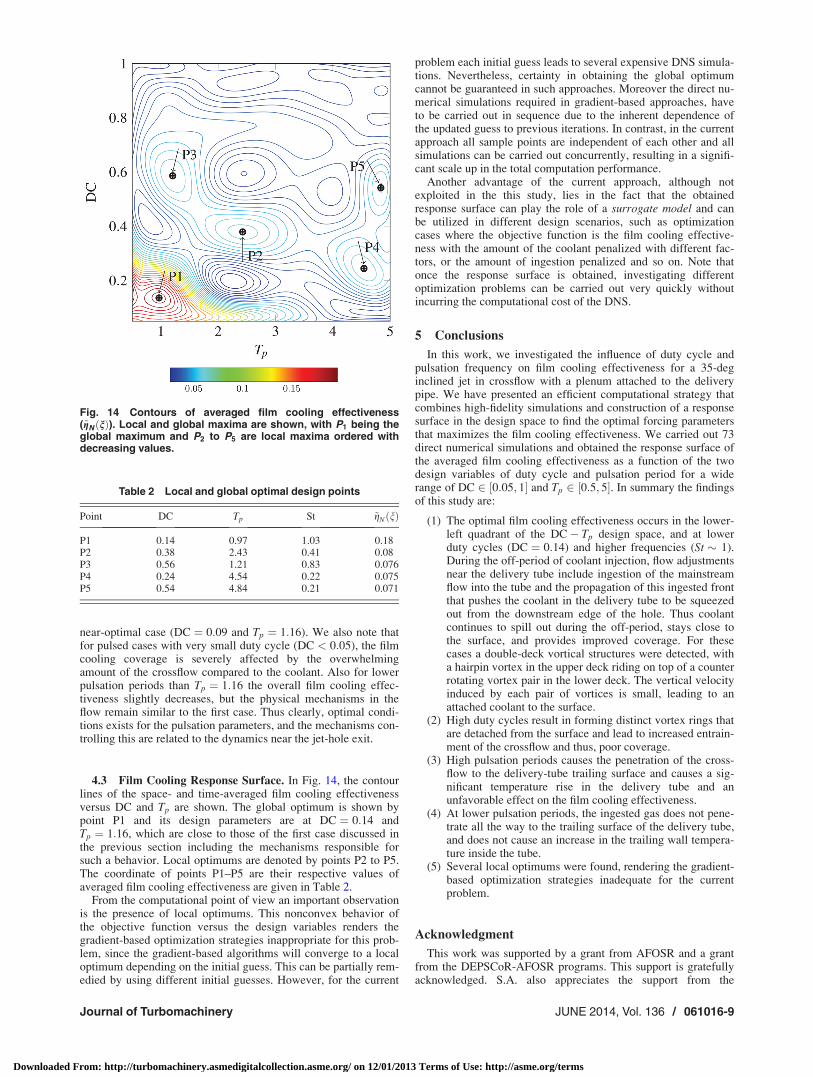
4.3 Film Cooling Response Surface. In Fig. 14, the contourlines of the space- and time-averaged film cooling effectivenessversus DC and Tp are shown. The global optimum is shown bypoint P1 and its design parameters are at DC ¼ 0:14 andTp ¼ 1:16, which are close to those of the first case discussed inthe previous section including the mechanisms responsible forsuch a behavior. Local optimums are denoted by points P2 to P5.The coordinate of points P1–P5 are their respective values ofaveraged film cooling effectiveness are given in Table 2.
From the computational point of view an important observationis the presence of local optimums. This nonconvex behavior ofthe objective function versus the design variables renders thegradient-based optimization strategies inappropriate for this prob-lem, since the gradient-based algorithms will converge to a localoptimum depending on the initial guess. This can be partially rem-edied by using different initial guesses. However, for the current
problem each initial guess leads to several expensive DNS simula-tions. Nevertheless, certainty in obtaining the global optimumcannot be guaranteed in such approaches. Moreover the direct nu-merical simulations required in gradient-based approaches, haveto be carried out in sequence due to the inherent dependence ofthe updated guess to previous iterations. In contrast, in the currentapproach all sample points are independent of each other and allsimulations can be carried out concurrently, resulting in a signifi-cant scale up in the total computation performance.
Another advantage of the current approach, although notexploited in the this study, lies in the fact that the obtainedresponse surface can play the role of a surrogate model and canbe utilized in different design scenarios, such as optimizationcases where the objective function is the film cooling effective-ness with the amount of the coolant penalized with different fac-tors, or the amount of ingestion penalized and so on. Note thatonce the response surface is obtained, investigating differentoptimization problems can be carried out very quickly withoutincurring the computational cost of the DNS.
5 Conclusions
In this work, we investigated the influence of duty cycle andpulsation frequency on film cooling effectiveness for a 35-deginclined jet in crossflow with a plenum attached to the deliverypipe. We have presented an efficient computational strategy thatcombines high-fidelity simulations and construction of a responsesurface in the design space to find the optimal forcing parametersthat maximizes the film cooling effectiveness. We carried out 73direct numerical simulations and obtained the response surface ofthe averaged film cooling effectiveness as a function of the twodesign variables of duty cycle and pulsation period for a widerange of DC 2 ½0:05; 1� and Tp 2 ½0:5; 5�. In summary the findingsof this study are:
(1) The optimal film cooling effectiveness occurs in the lower-left quadrant of the DC� Tp design space, and at lowerduty cycles (DC ¼ 0:14) and higher frequencies (St 1).During the off-period of coolant injection, flow adjustmentsnear the delivery tube include ingestion of the mainstreamflow into the tube and the propagation of this ingested frontthat pushes the coolant in the delivery tube to be squeezedout from the downstream edge of the hole. Thus coolantcontinues to spill out during the off-period, stays close tothe surface, and provides improved coverage. For thesecases a double-deck vortical structures were detected, witha hairpin vortex in the upper deck riding on top of a counterrotating vortex pair in the lower deck. The vertical velocityinduced by each pair of vortices is small, leading to anattached coolant to the surface.
(2) High duty cycles result in forming distinct vortex rings thatare detached from the surface and lead to increased entrain-ment of the crossflow and thus, poor coverage.
(3) High pulsation periods causes the penetration of the cross-flow to the delivery-tube trailing surface and causes a sig-nificant temperature rise in the delivery tube and anunfavorable effect on the film cooling effectiveness.
(4) At lower pulsation periods, the ingested gas does not pene-trate all the way to the trailing surface of the delivery tube,and does not cause an increase in the trailing wall tempera-ture inside the tube.
(5) Several local optimums were found, rendering the gradient-based optimization strategies inadequate for the currentproblem.
Acknowledgment
This work was supported by a grant from AFOSR and a grantfrom the DEPSCoR-AFOSR programs. This support is gratefullyacknowledged. S.A. also appreciates the support from the
Fig. 14 Contours of averaged film cooling effectiveness(~gN ðnÞ). Local and global maxima are shown, with P1 being theglobal maximum and P2 to P5 are local maxima ordered withdecreasing values.
Journal of Turbomachinery JUNE 2014, Vol. 136 / 061016-9
Downloaded From: http://turbomachinery.asmedigitalcollection.asme.org/ on 12/01/2013 Terms of Use: http://asme.org/terms
National Science Foundation (NSF) in the preparation of thismanuscript. The computations were performed on LouisianaOptical Network Initiative (LONI) systems at Louisiana StateUniversity.
Nomenclature
BR ¼ blowing ratioD ¼ jet diameter
DC ¼ duty cyclep ¼ pressure
Pi ¼ polynomial order of the expansion in ni directionPr ¼ Prandtl numberQ ¼ number of quadrature points
Re ¼ Reynolds numberSt ¼ nondimensional pulsation frequencyTc ¼ coolant temperatureTh ¼ hot gas temperatureTp ¼ pulsation periodu ¼ velocity vector
Dtoff ¼ time portion of the cycle that the jet in offDton ¼ time portion of the cycle that the jet in on
g ¼ spanwise- and time-averaged film coolingeffectiveness
~g ¼ overall film cooling effectivenessh ¼ normalized temperature
HP ¼ one dimensional Clenshaw–Curtis grid with Pþ 1nodes
HðP1;P2Þ ¼ two dimensional Clenshaw–Curtis grid with P1 þ 1nodes in n1-direction and P2 þ 1 nodes in n2-direction
n ¼ design parameter
nðiÞ ¼ ith quadrature points ¼ time percentage during a cycle
/iðnÞ ¼ univariate Legendre polynomial of degree i/rðnÞ ¼ multidimensional Legendre polynomial of degree rð; Þ ¼ inner productð:Þ ¼ Fourier coefficient in polynomial expansion
ð:Þ ¼ time-averagedð:ÞN ¼ projected to a space of polynomial of degree Nð:Þk k ¼ norm induced by inner product
cj L2 � norm of Legendre polynomial
References
[1] Bogard, D. G., and Thole, K. A., 2006, “Gas Turbine Film Cooling,” J. Propul.Power, 22(2), pp. 249–270.
[2] Bunker, R. S., 2005, “A Review of Shaped Hole Turbine Film-Cooling Tech-nology,” ASME J. Heat Transfer, 127, pp. 441–453.
[3] Lutum, E., and Johnson, B. V., 1999, “Influence of the Hole Length-to-Diame-ter Ratio on Film Cooling With Cylindrical Holes,” ASME J. Turbomach.,121(2), pp. 209–216.
[4] Acharya, S., Tyagi, M., and Hoda, A., 2006, “Flow and Heat Transfer Predic-tions for Film Cooling,” Ann. N.Y. Acad. Sci., 934(1), pp. 110–125.
[5] Acharya, S., and Tyagi, M., 2003, “Large Eddy Simulation of Film CoolingFlow From an Inclined Cylindrical Jet,” ASME Paper No. GT2003-38633.
[6] Iourokina, I., and Lele, S., 2005, “Towards Large Eddy Simulation of Film-Cooling Flows on a Model Turbine Blade With Free-Stream Turbulence,”AIAA Paper No. 2005-670.
[7] Peet, Y., and Lele, S. K., 2008, “Near Field of Film Cooling Jet Issued Into aFlat Plate Boundary Layer: LES Study,” ASME Paper No. GT2008-50420.
[8] Guo, X., Schroder, W., and Meinke, M., 2006, “Large-Eddy Simulations ofFilm Cooling Flows,” Comput. Fluids, 35(6), pp. 587–606.
[9] Renze, P., Schroder, W., and Meinke, M., 2008, “Large-Eddy Simulation of FilmCooling Flows at Density Gradients,” Int. J. Heat Fluid Flow, 29(1), pp. 18–34.
[10] Coulthard, S. M., Volino, R. J., and Flack, K. A., 2007, “Effect of Jet Pulsingon Film Cooling—Part I: Effectiveness and Flow-Field Temperature Results,”ASME J. Turbomach., 129(2), pp. 232–246.
[11] Ekkad, S. V., Ou, S., and Rivir, R. B., 2006, “Effect of Jet Pulsation and DutyCycle on Film Cooling From a Single Jet on a Leading Edge Model,” ASME J.Turbomach., 128(3), pp. 564–571.
[12] El-Gabry, L. A., and Rivir, R. B., 2012, “Effect of Pulsed Film Cooling on Lead-ing Edge Film Effectiveness,” ASME J. Turbomach., 134(4), p. 041005.
[13] Muldoon, F., and Acharya, S., 2009, “DNS Study of Pulsed Film Cooling forEnhanced Cooling Effectiveness,” Int. J. Heat Mass Transfer, 52(13–14), pp.3118–3127.
[14] Bidan, G., Vezier, C., and Nikitopoulos, D. E., 2013, “Study of Unforced andModulated Film-Cooling Jets Using Proper Orthogonal Decomposition—PartII: Forced Jets,” ASME J. Turbomach., 135(2), p. 021038.
[15] Warburton, T., 1999, “Spectral/hp Methods on Polymorphic Multi-Domains:Algorithms and Applications,” Ph.D. thesis, Brown, Providence, RI.
[16] Karniadakis, G. E., Israeli, M., and Orszag, S. A., 1991, “High-Order SplittingMethods for the Incompressible Navier–Stokes Equations,” J. Comput. Phys.,97(2), pp. 414–443.
[17] Karniadakis, G. E., and Sherwin, S. J., 2005, Spectral/hp Element Methods forComputational Fluid Dynamics, Oxford University Press, New York.
[18] Xiu, D., 2007, “Efficient Collocational Approach for Parametric UncertaintyAnalysis,” Comm. Comp. Phys., 2(2), pp. 293–309.
[19] Clenshaw, C. W., and Curtis, A. R., 1960, “A Method for Numerical Integrationon an Automatic Computer” Numerische Mathematik, 2(1), pp. 197–205.
[20] Battles, Z., and Trefethen, L., 2004, “An Extension of Matlab to ContinuousFunctions and Operators,” SIAM J. Comput., 25(5), pp. 1743–1770.
[21] Bidan, G., Vezier, C., and Nikitopoulos, D. E., 2013, “Study of Unforced andModulated Film-Cooling Jets Using Proper Orthogonal Decomposition—Part I:Unforced Jets,” ASME J. Turbomach., 135(2), p. 021037.
[22] Smirnov, A., Shi, S., and Celik, I., 2001, “Random Flow Generation Techniquefor Large Eddy Simulations and Particle-Dynamics Modeling,” ASME J. FluidsEng., 123(2), pp. 359–371.
[23] Sau, R., and Mahesh, K., 2008, “Dynamics and Mixing of Vortex Rings inCrossflow,” J. Fluid Mech., 604, pp. 389–409.
[24] Haven, B. A., and Kurosaka, M., 1997, “Kidney and Anti-Kidney Vortices inCrossflow Jets,” J. Fluid Mech., 352(1997), pp. 27–64.
061016-10 / Vol. 136, JUNE 2014 Transactions of the ASME
Downloaded From: http://turbomachinery.asmedigitalcollection.asme.org/ on 12/01/2013 Terms of Use: http://asme.org/terms