Process Systems Engineering AIChE Journal
DOI10.1002/aic.16588
Optimization of Multistage Olefin/Paraffin Membrane Separation Processes
through Rigorous Modeling
Authors: Raúl Zarca1, Alfredo Ortiz1, Daniel Gorri1, Lorenz T. Biegler2, Inmaculada
Ortiz1*.
1Dept. of Chemical and Biomolecular Engineering. University of Cantabria, Av. Los
Castros 46, 39005 Santander, Spain
2Dept. of Chemical Engineering, Carnegie-Mellon University, 5000 Forbes Avenue,
Pittsburgh, PA 15213
*corresponding author: [email protected]
Revised Manuscript
Submitted to AIChE Journal
February 2019
This article has been accepted for publication and undergone full peer review but has not been through the copyediting, typesetting, pagination and proofreading process which may lead to differences between this version and the Version of Record. Please cite this article as doi: 10.1002/aic.16588 © 2019 American Institute of Chemical Engineers Received: Aug 10, 2018;Revised: Nov 27, 2018;Accepted: Feb 25, 2019
This article is protected by copyright. All rights reserved.
Abstract
In this work, we explore the capabilities of an NLP optimization model to determine the
viability of facilitated transport membrane processes intended to replace traditional
distillation currently employed for propane/propylene separation. An NLP optimization
model for multistage membrane processes has been formulated, introducing the
mathematical description of the facilitated transport mechanisms in the PVDF-
HFP/BMImBF4/AgBF4 membranes previously developed by our research group. For
the first time, a simultaneous optimization of the process and the membrane material
(i.e. carrier concentration) has been performed, thanks to the implementation of the
governing equations for the fixed site and mobile carrier mechanisms. Once the model
is solved in GAMS it returns the optimal membrane area, carrier loading and permeate
pressure of each stage based on Net Present Value Cost (NPVC) minimization.
Different process flowsheets were evaluated and the results show prominent reductions
on NPVC for facilitated transport multistage processes when compared to distillation.
Keywords
optimization, propylene, propane, multistage process, membrane, mathematical model,
process intensification
This article is protected by copyright. All rights reserved.
Introduction
Propane/propylene gaseous mixtures resulting from fluid catalytic cracking and steam
cracking are commonly separated using high pressure or cryogenic distillation, which is
associated to major energy and capital consumptions.1 Through the last years, process
intensification by means of membrane technology has emerged as a promising
alternative to large, expensive and energy-intensive distillation units.2
Many membrane materials have been reported for olefin/paraffin separation, including
polymers,3–5 and more complex materials, such as carbon molecular sieves (CMSs),6–9
zeolitic imidazolate frameworks (ZIFs)10–14 or facilitated transport membranes.15,16
Among these, facilitated transport membranes can easily surpass the permeability-
selectivity trade-off of polymeric membranes thanks to the reversible reaction between
the olefin and a carrier cation, typically silver, which is added to the membrane
composition.17,18 Facilitated transport membranes have been synthesized following
different approaches, from supported liquid membranes (SLM)19,20 to supported ionic
liquid membranes (SILM)21 that replace organic solvents with non-volatile room
temperature ionic liquids (RTILs)22 in order to avoid solvent losses through
evaporation.23 Recently, composite facilitated transport membranes prepared by solvent
casting of a polyvinylidene fluoride-hexafluoropropylene (PVDF-HFP) polymeric
solution containing the ionic liquid and the silver salt have been reported.24 In these
dense membranes, which feature a combination of fixed site and mobile carrier
transport mechanisms,25 selectivities up to 150 and propylene permeabilities higher than
1000 Barrer have been achieved that avoid the issues of supported liquid membranes.
This article is protected by copyright. All rights reserved.
Since a single-stage membrane process that produces polymer grade propylene and fuel
grade propane simultaneously is only feasible for high concentrated feeds 26, due to the
purity-recovery trade-off inherent in membrane operation, the implementation of
membrane technology to intensify the olefin/paraffin separation process can be carried
out according to two different approaches. The first one involves the use of membrane
modules along with new or existing distillation columns to create a hybrid process that
reduces the required reflux ratio and its associated expenses.27–31 The second approach
achieves complete replacement of the distillation column with membrane technology by
designing and optimizing appropriate multistage/multistep membrane processes.32,33
In particular, several trade-offs should be balanced when designing a multistage
membrane process based on facilitated transport membranes. Firstly, the total
membrane area of each stage determines the flowrates and purities of the product
streams in that stage. Thus, higher stage areas generate larger permeate flowrates at the
expense of permeate purity. In addition, the transmembrane flux of the transported
species in these membranes is strongly dependent on the carrier loading, as derived
from the experimental analysis and the mathematical models.21,25 However, high carrier
concentrations imply high membrane cost per unit area, which could affect the process
economics. Finally, higher transmembrane pressures increase the available driving force
for the permeation but at the expense of higher recompression requirements.
Moreover, the whole process flowsheet can be optimized in order to obtain the optimal
process configuration in terms of number of stages, mixers, splitters and compressors.
This type of optimization involves the design of superstructures that are solved using
This article is protected by copyright. All rights reserved.
binary variables, which result in complex mixed integer nonlinear programming
problems “MINLP”.34 In this regard, the works by Prof. Agrawal’s group provide
extensive insight on this design strategy. 35,36 However, MINLP problems are difficult
to solve because they combine challenges of nonlinear and mixed integer programming,
and require dedicated methods for its resolution.37 Instead, while it is often possible to
study all potential multistage configurations in one single superstructure, most studies
dealing with superstructure optimization for membrane separation show that in many
cases a two-stage configuration is optimal.38–40
Therefore, in this work we focus on the optimization of the implicit trade-offs in two
multistage facilitated transport processes, specifically, one conventional two-stage
configuration and one two-stage configuration with a two-step second stage, commonly
known as “two-and-one-half” stage process.32 In this manner, the complex mixed-
integer nonlinear formulations associated to superstructures can be replaced with a
nonlinear programming problem. The membrane modules have been modelled as
hollow fiber modules, which is the most adequate configuration for gas separation,
featuring high packing densities and energy efficiency.41–44 Furthermore, the mass
balances in the membrane modules have been described as ordinary differential
equations and have been solved using orthogonal collocation on finite elements.45
Consequently, black box modeling approaches can be avoided, thus allowing the study
of the transmembrane flux profiles along the fibers. These profiles will show how the
optimization works in balancing the recovery-purity trade-off by varying the membrane
total area of each stage. Additionally, a simultaneous optimization of the process and
This article is protected by copyright. All rights reserved.
the membrane material (i.e. carrier load) has been possible thanks to the introduction of
the equations that govern the facilitated transport mechanisms.25 To the best of our
knowledge, this is the first time that this joint optimization is performed without solving
an upper-bound type equation for the selectivity-permeability trade-off, whose solution
does not necessarily represent a real membrane material.46 Finally, the objective
function accounts for the process economics, which assesses the potential of facilitated
transport multistage processes to replace current distillation.
This article is protected by copyright. All rights reserved.
Theoretical Background
Single-Stage and Multistage Membrane Processes
In membrane process design the basic unit is the membrane stage, which can be defined
as an operating unit, comprising one or more membrane modules, which performs a
specific task different from any other membrane stages existing in the same process. A
single-stage process, shown in Figure 1, is the simplest membrane process that can be
designed, although some major limitations in membrane operations affect these
processes. In particular, membrane material selectivity and the industrially reachable
pressure ratio prevent satisfying high product purity and recovery simultaneously, and
process engineers may have to sacrifice one of these specifications. Therefore, single-
stage processes are often used for bulk concentration prior to further purification
processes.47
To overcome the limitations of single-stage membrane processes more stages could be
interconnected, generating different multistage configurations. Staging a membrane
process involves solving the trade-off between capital expenses (additional compressors
and membrane modules) and product recovery. Although there are many multistage
configurations, the two-stage and the so-called two-and-one-half stage processes,48 are
preferred over three stage or higher multistage processes.32 In the two-stage process,
shown in Figure 2, the recompressed permeate of the first stage is fed into a second
stage for a further purification step. The retentate of the second stage is then recycled
and mixed with the original feed. Another usual two-stage variation uses the retentate of
This article is protected by copyright. All rights reserved.
the first stage as feed for the second stage. However, such configuration is commonly
used when the retentate is the final product and the purity of the more permeant species
is not a concern.32
In comparison, the two-and-one-half process shown in Figure 3 uses a two-step
separation for the second stage and the permeate stream of the second step is recycled to
the first step feed. This configuration can achieve any desired concentration of the more
permeable gas by controlling the relative size of the second stage modules. Moreover, to
balance the tradeoffs and calculate the feed and permeate pressures and the membrane
area of each stage, process optimization is required.
Discretized membrane model
Previous studies on membrane process optimization usually make use of simplified
membrane models. These shortcut models are typically implemented within
superstructures that are solved as mixed-integer optimization problems.38 For processes
where a more detailed description of the membrane separator is needed as in the case of
hollow fibers modules, a perfect cross-flow model is usually employed. This model
assumes plug-flow in the high pressure side of the fiber, usually the lumen side, and
perfect mixed flow in the permeate side, i.e. shell side.28 However, assuming that the
feed flows through the lumen side may seem unrealistic in gas separation hollow fibers,
whereby the active layer is often formed in the outer fiber surface. In addition, most
membrane models assume fixed permeability/selectivity values for a given membrane
material. In contrast, the rigorous facilitated transport model used in this work requires
This article is protected by copyright. All rights reserved.
calculating the partial pressure profiles along the module. To address these issues, a
fully discretized optimization model has been developed in this work.
The membrane model is depicted in Figure 4 and is based on the following
assumptions:
• The feed and permeate streams flow through the shell and lumen sides of the
fibers respectively.
• The module operates isothermally and in steady state.
• The feed and permeate streams flow in co-current mode.
• Plug-flow is assumed at both sides of the membrane.
• The total feed and permeate pressures are operation constants.
• The only pressure drop in the membrane module is the transmembrane
pressure.
The component molar flowrates are discretized according to the following mass
balances:
( ) ( ) dAzJzdF jFj ⋅−= (1)
( ) ( ) dAzJzdF jPj ⋅= (2)
where jF and 𝐽𝑗 are the molar flowrate and the transmembrane flux of component 𝑗,
respectively, and dA is the fiber outer wall area differential element. The
dimensionless fiber axial length is defined as:
This article is protected by copyright. All rights reserved.
Lzz = [ ]1,0∈z (3)
where L is the total fiber length. Rearranging terms, the mass balances (ODEs) and the
boundary conditions can now be rewritten as:
𝑑𝐹𝑗𝐹(�̅�)
𝑑�̅�= −𝐽𝑗(𝑧̅) · 𝐴𝑇𝑜𝑡𝑎𝑙 (4)
𝑑𝐹𝑗𝑃(�̅�)
𝑑�̅�= 𝐽𝑗(𝑧̅) · 𝐴𝑇𝑜𝑡𝑎𝑙 (5)
𝐹𝑗𝐹|�̅�=0 = 𝐹𝑗𝐹(𝑧̅ = 0) (6)
𝐹𝑗𝑃|�̅�=1 = 𝐹𝑗𝑃(𝑧̅ = 1) (7)
One of the main features of this work is that the membrane material optimization (i.e.
carrier concentration) and the multistage process optimization are performed
simultaneously. For this purpose, the rigorous facilitated transport model previously
developed by this research group has been implemented in the optimization,25
particularly for PVDF-HFP/BMImBF4/AgBF4 membranes containing silver as carrier.
In this model, which was specifically developed for facilitated transport membranes that
combine fixed and mobile carrier mechanisms, the permeability of the paraffin can be
considered constant. Thus its transmembrane flux is described through the solution-
diffusion model:49
𝐽𝐶3𝐻8(𝑧̅) =𝑃𝐶3𝐻8𝛿
�𝑝𝐶3𝐻8𝐹 (𝑧̅) − 𝑝𝐶3𝐻8
𝑃 (𝑧̅)� (8)
This article is protected by copyright. All rights reserved.
where 𝑃𝐶3𝐻8 is the paraffin permeability, 𝛿 is the active layer thickness and 𝑝𝐶3𝐻8𝐹 and
𝑝𝐶3𝐻8𝑃 are the feed and permeate partial pressure of the paraffin.
Conversely, the olefin flux, i.e. the preferentially transported species, is affected by the
complexation reaction with the silver cations:
[𝐴𝑔+] + 𝐶3𝐻6𝑘𝑒𝑞��𝐴𝑔+(𝐶3𝐻6) (9)
The flux can be calculated as the sum of the contributions of three transport
mechanisms: solution-diffusion, fixed-site carrier and mobile carrier:
𝐽𝐶3𝐻6(𝑧̅) = 𝐽𝐶3𝐻6,𝑆𝐷(𝑧̅) + 𝐽𝐶3𝐻6,𝑀𝐶
(𝑧̅) + 𝐽𝐶3𝐻6,𝐹𝐶(𝑧̅) (10)
𝐽𝐶3𝐻6,𝑆𝐷(𝑧̅) = 𝐷𝐶3𝐻6,𝑚 · 𝑆𝐶3𝐻6,𝑚
𝑝𝐶3𝐻6𝐹 (�̅�)−𝑝𝐶3𝐻6
𝑃 (�̅�)
𝛿 (11)
𝐽𝐶3𝐻6,𝑀𝐶(𝑧̅) = 𝑘𝑒𝑞·�𝐴𝑔𝑇�·𝐻𝐶3𝐻6
1+𝑘𝑒𝑞·𝑝𝐶3𝐻8𝑃 (�̅�)·𝐻𝐶3𝐻6
𝐷𝑐𝑜𝑚𝑝𝑝𝐶3𝐻6𝐹 (�̅�)−𝑝𝐶3𝐻6
𝑃 (�̅�)
𝛿𝑥𝐼𝐿 (12)
𝐽𝐶3𝐻6,𝐹𝐶 (𝑧̅) = 𝐾𝐹𝐶(𝑧̅) ·
𝑝𝐶3𝐻6𝐹 (�̅�)−𝑝𝐶3𝐻6
𝑃 (�̅�)
𝛿(1 − 𝑥𝐼𝐿) (13)
𝐾𝐹𝐶(𝑧̅) = 𝛼 � �𝐴𝑔𝑇�1+𝑘𝑝𝑝𝐶3𝐻6
𝑃 (�̅�)� (14)
where 𝑘𝑒𝑞 is the complexation constant, 𝐻𝐶3𝐻6 is the propylene solubility in the
composite membrane, 𝑥𝐼𝐿 is the ionic liquid mass fraction in the membrane
composition, 𝛼 is a fitting parameter for the fixed-site carrier mechanism and [𝐴𝑔𝑇] is
the silver concentration in the membrane. The temperature dependencies have been
This article is protected by copyright. All rights reserved.
omitted as isothermal operation has been assumed. The contribution of the Fickian
diffusion to the olefin transmembrane flux (Eq.11) is negligible compared to the
contribution of the facilitated transport mechanisms (Eq. 12-13) and, in consequence, it
has not been included in the optimization. A detailed description of the model can be
found in the original source.25 Table 1 shows the values of the model parameters.
As commented before, the use of this specific model for facilitated transport avoids
using a fixed permeability parameter and introduces carrier concentration as a decision
variable. In this way, the membrane material and the multistage process can be
optimized at the same time.
Finally, the ordinary differential equations (Eqs 4-7) are solved as algebraic equations
after discretization through implicit Runge-Kutta collocation methods using 100 finite
elements and 3 internal collocation points.
Optimization details
The aim of this work is to optimize two multistage membrane processes: a) a two-stage
and b) a two-and-one-half stage, intended to produce polymer grade propylene, and
enriched propane, from a C3 refinery stream minimizing the Net Present Value Costs
(NPVC) of both configurations. The feed stream is considered to come from the partial
condenser of a depropanizer column. In this manner a vapor stream would be available
without further processing. The pressure, temperature and composition of the original
feed, stream F in Figures 1-3, are fixed by common refinery specifications.50 Table 2
This article is protected by copyright. All rights reserved.
displays the properties of the propylene/propane mixed stream, the target product
purities and the process constants and constraints.
The decision variables of the model are:
• The membrane area of each module.
• The carrier concentration of each membrane.
• The permeate pressure.
The mathematical standard form of the optimization problem can be described as:
𝑀𝑖𝑛𝑖𝑚𝑖𝑧𝑒 𝑁𝑃𝑉𝐶(𝑣)𝑠. 𝑡.
ℎ(𝑣) = 0𝑡(𝑣) ≥ 0
𝑈′ ≤ 𝑣 ≤ 𝑈"
(15)
where v is the vector of decision variables, )(vh represents the set of model algebraic
equations, )(vt is the set of constraints (Eqs. 16-17) and 𝑈′and 𝑈" are the lower and
upper limits of the decision variables, respectively.
𝑥𝐶3𝐻6 ≥ 𝑥𝐶3𝐻6,𝑚𝑖𝑛 (16)
𝑥𝐶3𝐻8 ≥ 𝑥𝐶3𝐻8,𝑚𝑖𝑛 (17)
Finally, the objective function (NPVC) has been calculated as a combination of OPEX
and CAPEX, correcting the operating expenses according to the time value of money:
𝑁𝑃𝑉𝐶 = 𝐶𝐴𝑃𝐸𝑋 + 𝑂𝑃𝐸𝑋 · (1 − (1 + 𝑟)−𝑇) 𝑟⁄ (18)
This article is protected by copyright. All rights reserved.
The parameters and constants used are shown in Table 3. A detailed description of the
economic calculations can be found in a previous work.51 Briefly, the compressor
expenses have been calculated according to the Guthrie’s Modular Method for Costing
and Sizing 52 and the membrane cost is calculated using the market prices for its
constituents and the optimized composition. To maintain a conservative estimation of
the membrane cost, the lab-scale price of its constituents has been considered:
𝑀𝐶𝐴 = 𝛿 · (𝑃𝐿 · 𝑃𝑃 + 𝐼𝐿𝐿 · 𝐼𝐿𝑃 + [𝐴𝑔𝑇] · 𝑀𝐴𝑔 · 𝐴𝐺𝑃) (19)
where 𝑀𝐶𝐴 is the membrane cost per unit area, δ is the membrane thickness and 𝑀𝐴𝑔 is
the molar mass of AgBF4. The membrane replacement cost has been introduced through
a membrane replacement factor (𝑀𝑅), which is estimated as a percentage of the
membrane capital cost.
The detailed equations used to assess the process economics are outlined in Appendix
A. The optimization model renders a NLP problem solved in GAMS using as solver the
multi-start heuristic algorithm OQNLP on a 3.40 GHz Intel® Core™ i7–3770
processor. The model statistics are detailed in Table 4. The model is solved in less than
0.1 seconds when CONOPT is used as local solver for OQNLP. The reported results are
typically obtained in 500 to 1500 iterations depending on the complexity of each case.
Results and Discussion
This section presents and discusses the main results regarding the design and
optimization of the proposed flowsheets. The feed stream to both flowsheets consists of
This article is protected by copyright. All rights reserved.
an equimolar propane/propylene mixture and the objective is to obtain propylene and
propane purities of 99.5 mol% and 95 mol% respectively. The Net Present Value Cost
(NPVC) of both multistage processes will be compared with the NPVC of the reference
distillation column. Heat integration strategies are not considered in the distillation base
case, as they heavily rely on the specific layout of each olefin production unit.
Multistage membrane process optimization results
The optimized two stage flowsheet is displayed in Figure 5. The optimal design
comprises two membrane stages showing considerable size differences. The first stage
requires around 14000 m2 of membrane area to generate a propylene depleted retentate
stream, thus achieving the desired propane purity. However, the second stage area is
almost ten times smaller and is intended to produce a high purity propylene permeate
regardless of the retentate purity.
Regarding the optimal carrier loading, its value is allowed to vary between the
experimentally studied range from 0 to 6 M, where 0 M implies no facilitated transport
and 6 M is the highest concentration assessed for PVDF-HFP/BMImBF4/AgBF4
membranes. Eventually, the optimization balances the cost-performance trade-off of the
first stage at 2.33 M Ag+, far below the upper limit. Since higher concentrations of
carrier result in high membrane prices per unit area, this decreased optimal value helps
to reduce the expenses caused by the large size of this stage. On the other hand, the
second stage carrier loading hits the highest allowed level of 6 M Ag+, which is
consistent with the purity-oriented nature of this stage. Although the high carrier
This article is protected by copyright. All rights reserved.
loading of the second stage raises the membrane specific cost to 324 $/m2, the relative
small size of this stage dampens the total membrane cost.
Finally, it should be noted that this multistage configuration generates a large reflux
stream with high associated compression costs. Nonetheless, the optimal permeate
pressure of both stages falls to 1 bar, promoting higher driving force in the modules at
the expense of higher compression duty.
In order to gain better insight on the optimal stage design, the transmembrane flux
profiles along the fiber modules have been calculated. Figure 6 displays the propylene
and propane transmembrane flux along the dimensionless axial length in each
membrane stage. As it can be observed in Figure 6A the propylene transmembrane flux
of stage M1 starts at a high level (~6x10⁻³ mol m-2 s-1) thanks to the facilitated transport
mechanisms and the significant driving force achieved in the hollow fibers. The
resulting high permeation flux in combination with the large membrane area depletes
the propylene concentration of the retentate stream and, eventually, its driving force
falls until the transmembrane flux of propane (~6x10⁻⁴ mol m-2 s-1) exceeds that of the
propylene. The optimal solution involves continuing the operation past that point to be
able to generate the optimal cut-off. Figure 7 shows the molar fractions of propane and
propylene in the retentate and permeate streams. In contrast, Figure 6B shows the same
profiles in stage M2, but in this case the propylene transmembrane flux remains almost
constant due to the reduced membrane area required, which produces a polymer grade
propylene stream as permeate but maintains a notable propylene concentration in the
retentate.
This article is protected by copyright. All rights reserved.
This is a good example of how optimization can solve the intrinsic tradeoff between
productivity and purity, and displaces it towards high permeate volume production or
high product purity depending on the specific task of each stage within the multistage
process.
The “two-and-one-half stage” process optimization results are shown in Figure 8. The
main feature of this process is the introduction of a third stage intended to recycle a
propylene enriched stream back to the second stage feed, in this manner the outer loop
recycle is reduced, minimizing the total membrane area requirements in the stage M1
and the subsequent compression duty. As in the two stage process, the first stage (M1)
is significantly larger than the next stages (M2 and M3) and its optimal carrier
concentration is below the upper bound, at 2.30 M Ag+. Again, the M2 and M3 stages
require the maximum carrier loading of 6 M Ag+, which increases the membrane
performance at the expense of higher membrane costs. However, although the
introduction of a third stage helps to minimize the compression requirements by
decreasing the recycle flowrate, this reduction is not significant enough and may not
justify its implementation. This can be observed by the relative small size of stage M3,
which is almost negligible compared with the other stages. The optimization results of
both processes are detailed in Table 5.
It should be noted that the optimal permeate pressure in both case studies and in all
stages falls to 1 bar. Although the compression is a capital-intensive operation, the
permeate pressure has a major influence on the objective function. A higher permeate
pressure reduces the available driving force for the permeation, which involves larger
This article is protected by copyright. All rights reserved.
membrane areas and a higher recycle flowrate. In this manner, the reduction in the
required recompression does not produce any savings, because the potential benefits are
hindered by the large flowrate that needs to be recompressed and the CAPEX associated
to extra membrane area.
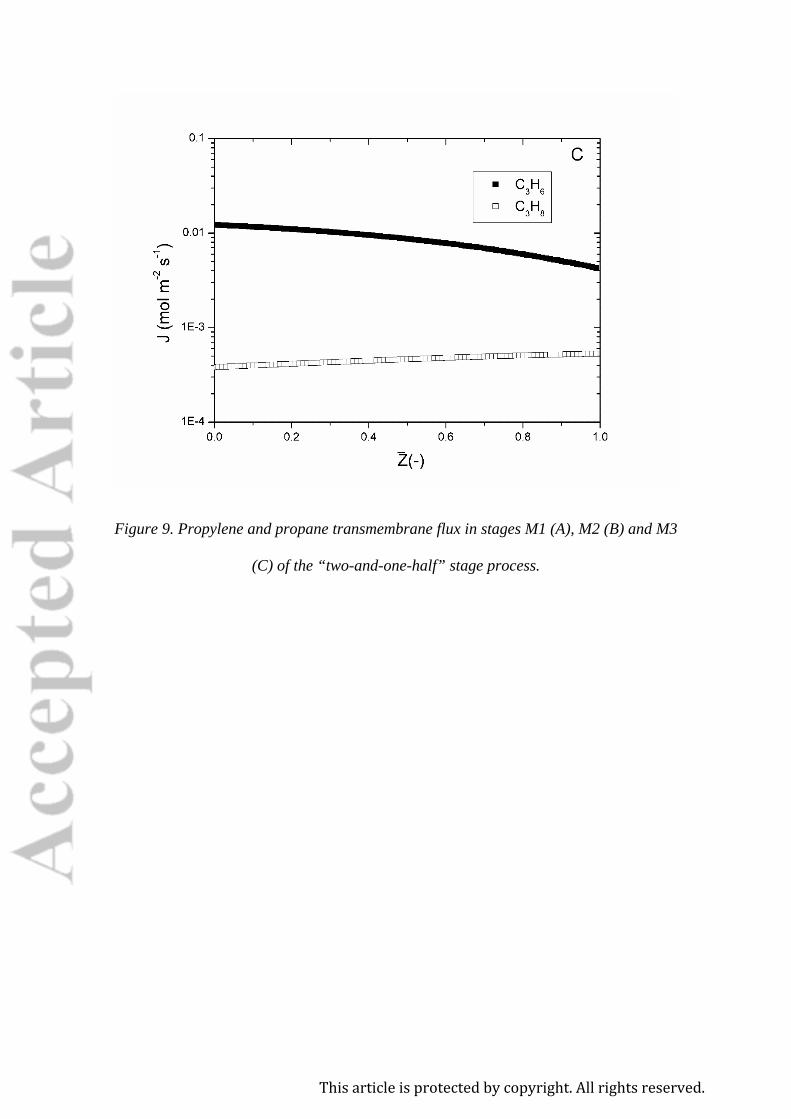
A brief analysis of the transmembrane flux profiles in the “two-and-one-half” stage
process reveals similar design criteria as in the first studied case. Figure 9A-C displays
the propylene and propane transmembrane flux along the dimensionless axial length of
the fibers module.
As commented before, the large membrane area required in the first stage is intended to
achieve the desired propane purity in one single pass. As a result, most of the propylene
permeates and its driving force is reduced until its transmembrane flux falls below the
propane level, see Figure 9A. Notice that this is not detrimental when the product
stream is the retentate, as is the case for stage M1. However, the subsequent stages,
Figures 8B-C, are intended to produce a propylene-enriched permeate and consequently,
the propylene transmembrane flux remains high along the fiber modules, thanks to the
relatively small areas involved in these stages.
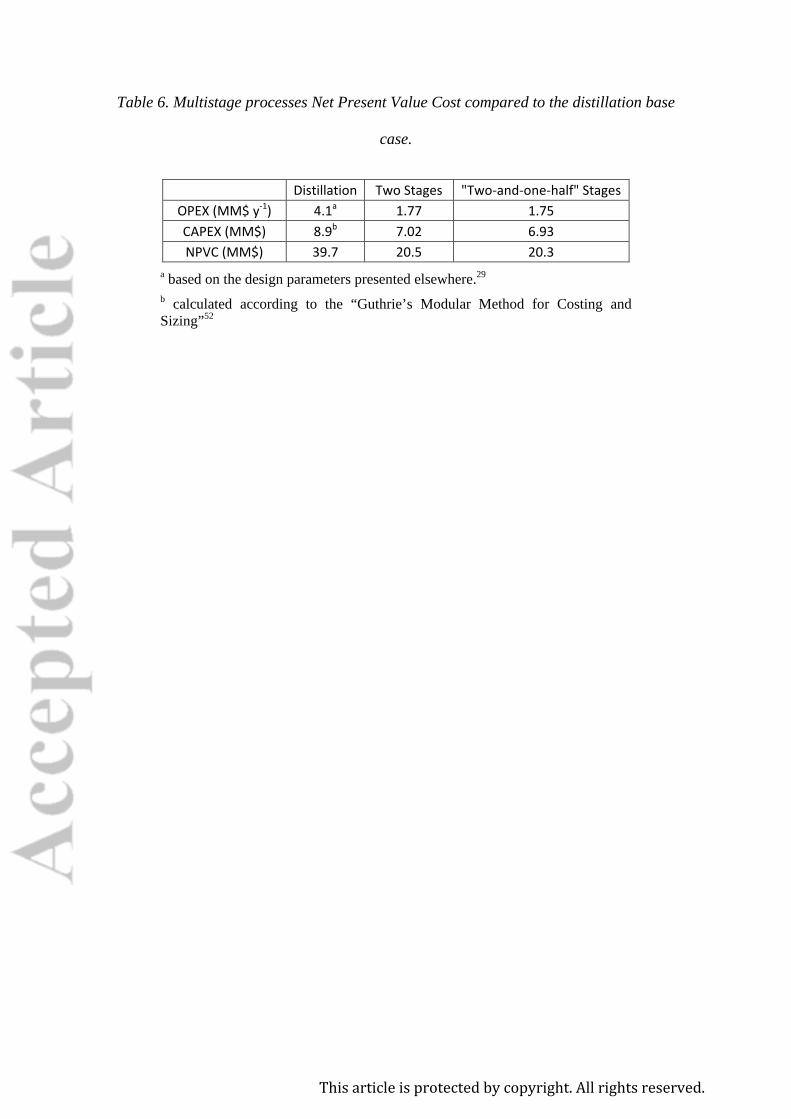
NPVC comparison
The NPVC of both membrane processes and the base case distillation are itemized in
Table 6. The results reveal the prominent potential of facilitated transport membrane
processes to replace the traditional distillation and to sharply decrease the investment
This article is protected by copyright. All rights reserved.
expenses when implementing the two stage membrane process. On the other hand, the
introduction of an additional separation step in the “two-and-one-half” stage flowsheet
produces minor savings compared to the two stages process and, therefore, a less
complex process may be preferred. It is worth noting that the main difference between
the base case distillation and the membrane processes is not in the capital expenses but
in the operating costs, which is consistent with the use of process steam in the
distillation reboiler. As expected, process intensification through membrane technology
plays here a major role in energy saving.
The cost data included in Table 6 for the distillation column correspond to the base case
reported in our previous paper,29 that is, for a distillation column without heat
integration. However, OPEX could be overestimated since the distillation columns can
be heat integrated. Calculations reported in the literature show that heat-pump based
heat-integrated columns (also known as vapor recompression design) are capable of
achieving up to 75% energy savings.14, 26, 53 Those same studies note that such designs
are not routinely employed due to operational and control challenges. Instead, heat-
integration can be implemented through other parts of the plant generating extra amount
of low-grade heat, such as, quench water.14 A detailed heat-integration study for
distillation columns is beyond the scope of this study, since it would require analyzing
the complete process flowsheet where the C3 splitter is included. However, our
estimates show that even for a 50% heat-integrated column (i.e., with 50% of the
reboiler duty provided by heat-integration), our proposed separation process with
This article is protected by copyright. All rights reserved.
membrane modules can achieve savings in energy requirement over heat-integrated
distillation.
Comparison for an Extreme Purity Specification
Although propylene purities higher than 99.5% are not demanded by the polypropylene
industry, it is instructive to consider a final comparison between the two-stage and two-
and-half stage optimization models. For a propylene permeate specification of 99.9%
we observe that the two stage process becomes infeasible and has no solution. In
contrast, the two-and-half stage model is able to obtain any permeate concentration, and
consequently satisfies this specification. As shown in Table 7, the optimum for this
process is achieved at a much higher cost, with more than double the NPVC.
Conclusions
The complete replacement of propane/propylene distillation processes by membrane
technology strongly relies on adequate membrane processes and materials design. In
this work, the simultaneous optimization of multistage processes and facilitated
transport membrane composition reveals potential Net Present Value Cost reductions of
around 45% compared to the standalone distillation. Additionally, the optimization
results showed minor differences between the two studied multistage processes. Thus,
the simpler two-stage layout may be more adequate in a real scenario. Furthermore, full
discretization of the model reveals how the recovery-purity trade-off and the position of
This article is protected by copyright. All rights reserved.
each stage within the multistage flowsheet affect the transmembrane flux profiles along
the modules. In this sense, this work outlines the importance of previous mathematical
modeling of transport phenomena as valuable foundations for further computer aided
process engineering. Finally, future in-depth optimization works on specific olefin
production plants should also consider heat integration in the benchmark distillation and
product phase change in the membrane process, as it might alter the potential
advantages of membrane multistage processes.
Acknowledgments
Financial support from the Spanish Ministry of Science under the projects CTQ2015-
66078-R and CTQ2016-75158-R (MINECO, Spain-FEDER 2014–2020) is gratefully
acknowledged. Raúl Zarca also thanks the Universidad de Cantabria for the
postgraduate fellowship.
This article is protected by copyright. All rights reserved.
Notation
A membrane effective area [m2]
D diffusion coefficient [m2 s-1]
F molar flowrate [mol s-1]
H Henry’s solubility constant [mol bar-1 m-3]
h set of model algebraic equations
J molar transmembrane flux [mol m-2 s-1]
𝐾𝑒𝑞 equilibrium constant [m3 mol-1]
𝐾𝐹𝐶 fixed carrier effective permeability [mol bar-1 m-1 s-1]
𝐾𝑝 heterogeneous equilibrium constant [bar-1]
L fiber length [m]
P permeability [mol bar-1 m-1 s-1]
p pressure [bar]
R universal gas constant [8.314 J mol-1 K-1]
r investment rate [%]
S gas solubility in the membrane [mol bar-1 m-3]
T investment period [y]
This article is protected by copyright. All rights reserved.
t set of model constraints
U’ lower limit of the decision variables
U” upper limit of the decision variables
x molar fraction [-]
𝑥𝐼𝐿 ionic liquid mass fraction [-]
z hollow fiber axial dimension [m]
Greek letters
α fitting parameter
δ active layer thickness [m]
Superscript / subscript
0 feed side
C3H6 propylene
C3H8 propane
comp organometallic complex
FC fixed-site carrier
IL ionic liquid
L permeate side
This article is protected by copyright. All rights reserved.
m membrane
MC mobile carrier
r reaction
SD solution-diffusion
This article is protected by copyright. All rights reserved.
Literature Cited
1. Sholl DS, Lively RP. Seven chemical separations to change the world. Nature.
2016; 532:435-437.
2. Charpentier JC. In the frame of globalization and sustainability, process
intensification, a path to the future of chemical and process engineering
(molecules into money). Chem Eng J. 2007;134(1-3):84-92.
3. Faiz R, Li K. Polymeric membranes for light olefin/paraffin separation.
Desalination. 2012;287:82-97.
4. Staudt-Bickel C, Koros WJ. Olefin/paraffin gas separations with 6FDA-based
polyimide membranes. J Memb Sci. 2000;170(2):205-214.
5. Alghunaimi F, Ghanem B, Alaslai N, Mukaddam M, Pinnau I. Triptycene
dimethyl-bridgehead dianhydride-based intrinsically microporous hydroxyl-
functionalized polyimide for natural gas upgrading. J Memb Sci. 2016;520:240-
246.
6. Xu L, Rungta M, Brayden MK, et al. Olefins-selective asymmetric carbon
molecular sieve hollow fiber membranes for hybrid membrane-distillation
processes for olefin/paraffin separations. J Memb Sci. 2012;423-424:314-323.
7. Liu J, Liu Y, Kayrak Talay D, Calverley E, Brayden M, Martinez M. A new
carbon molecular sieve for propylene/propane separations. Carbon N Y.
2015;85:201-211.
8. Ma X, Lin YS, Wei X, Kniep J. Ultrathin carbon molecular sieve membrane for
propylene/propane separation. AIChE J. 2016;62(2):491-499.
9. Salinas O, Ma X, Litwiller E, Pinnau I. High-performance carbon molecular
sieve membranes for ethylene/ethane separation derived from an intrinsically
microporous polyimide. J Memb Sci. 2016;500:115-123.
This article is protected by copyright. All rights reserved.
10. Kwon HT, Jeong HK, Lee AS, An HS, Lee JS. Heteroepitaxially grown zeolitic
imidazolate framework membranes with unprecedented propylene/propane
separation performances. J Am Chem Soc. 2015;137(38):12304-12311.
11. Liu D, Ma X, Xi H, Lin YS. Gas transport properties and propylene/propane
separation characteristics of ZIF-8 membranes. J Memb Sci. 2014;451:85-93.
12. An H, Park S, Kwon HT, Jeong HK, Lee JS. A new superior competitor for
exceptional propylene/propane separations: ZIF-67 containing mixed matrix
membranes. J Memb Sci. 2017;526:367-376.
13. Da Silva FA, Rodrigues AE. Propylene/propane separation by vacuum swing
adsorption using 13X zeolite. AIChE J. 2001;47(2):341-357.
14. Ma X, Kumar P, Mittal N, et al. Zeolitic imidazolate framework membranes
made by ligand-induced permselectivation. Science 2018;361:1008-1011.
15. Faiz R, Li K. Olefin/paraffin separation using membrane based facilitated
transport/chemical absorption techniques. Chem Eng Sci. 2012;73:261-284.
16. Yoon Y, Won J, Kang YS. Polymer electrolyte membranes containing silver ion
for facilitated olefin transport. Macromolecules. 2000;33(9):3185-3186.
17. Nymeijer K, Visser T, Brilman W, Wessling M. Analysis of the complexation
reaction between Ag+ and ethylene. Ind Eng Chem Res. 2004;43(11):2627-
2635.
18. Rungta M, Zhang C, Xu L, Koros WJ. Membrane-based ethylene/ethane
separation: The upper bound and beyond. AIChE J. 2013;59(9):3475-3489.
19. Duan S, Ito A, Ohkawa A. Separation of propylene/propane mixture by a
supported liquid membrane containing triethylene glycol and a silver salt. J
Memb Sci. 2003;215(1-2):53-60.
This article is protected by copyright. All rights reserved.
20. Ravanchi MT, Kaghazchi T, Kargari A. Supported liquid membrane separation
of propylene-propane mixtures using a metal ion carrier. Desalination.
2010;250(1):130-135.
21. Fallanza M, Ortiz A, Gorri D, Ortiz I. Experimental study of the separation of
propane/propylene mixtures by supported ionic liquid membranes containing
Ag+–RTILs as carrier. Sep Purif Technol. 2012;97:83-89.
22. Ortiz A, Ruiz A, Gorri D, Ortiz I. Room temperature ionic liquid with silver salt
as efficient reaction media for propylene/propane separation: Absorption
equilibrium. Sep Purif Technol. 2008;63(2):311-318.
23. Teramoto M, Matsuyama H, Yamashiro T, Katayama Y. Separation of ethylene
from ethane by supported liquid membranes containing silver-nitrate as a carrier.
J Chem Eng Japan. 1986;19:419-424.
24. Fallanza M, Ortiz A, Gorri D, Ortiz I. Polymer-ionic liquid composite
membranes for propane/propylene separation by facilitated transport. J Memb
Sci. 2013;444:164-172.
25. Zarca R, Ortiz A, Gorri D, Ortiz I. Generalized predictive modeling for
facilitated transport membranes accounting for fixed and mobile carriers. J
Memb Sci. 2017;542:168-176.
26. Lee U, Kim J, Seok Chae I, Han C. Techno-economic feasibility study of
membrane based propane/propylene separation process. Chem Eng Process -
Process Intensif. 2017;119:62-72.
27. Kookos IK. Optimal design of membrane/distillation column hybrid processes.
Ind Eng Chem Res. 2003;42(8):1731-1738.
28. Caballero JA, Grossmann IE, Keyvani M, Lenz ES, Square N, Pennsyl V.
Design of hybrid distillation - vapor membrane separation systems. Ind Eng
Chem Res. 2009;48:9151-9162.
This article is protected by copyright. All rights reserved.
29. Zarca R, Ortiz A, Gorri D, Biegler LT, Ortiz I. Optimized distillation coupled
with state-of-the-art membranes for propylene purification. J Memb Sci.
2018;556:321-328.
30. Tula AK, Befort B, Garg N, Camarda K V., Gani R. Sustainable process design
& analysis of hybrid separations. Comput Chem Eng. 2017;105:96-104.
31. Pressly TG, Ng KM. A break-even analysis of distillation-membrane hybrids.
AIChE J. 1998;44(1):93-105.
32. Baker RW. Membrane Technology and Applications, chapter 8, 3rd edition.
Chichester: Wiley; 2012.
33. Ahmad F, Lau KK, Shariff AM, Murshid G. Process simulation and optimal
design of membrane separation system for CO2 capture from natural gas.
Comput Chem Eng. 2012;36(1):119-128.
34. Qi R, Henson MA. Membrane system design for multicomponent gas mixtures
via mixed-integer nonlinear programming. Comput Chem Eng.
2000;24(12):2719-2737.
35. Agrawal R, Xu J. Gas-separation membrane cascades utilizing limited numbers
of compressors. AIChE J. 1996;42(8):2141-2154.
36. Pathare R, Agrawal R. Design of membrane cascades for gas separation. J
Memb Sci. 2010;364(1-2):263-277.
37. Zhou K, Chen X, Shao Z, Wan W, Biegler LT. Heterogeneous parallel method
for mixed integer nonlinear programming. Comput Chem Eng. 2014;66:290-
0300.
38. Ohs B, Lohaus J, Wessling M. Optimization of membrane based nitrogen
removal from natural gas. J Memb Sci. 2016;498:291-301.
This article is protected by copyright. All rights reserved.
39. Kunde C, Kienle A. Global optimization of multistage binary separation
networks. Chem Eng Process - Process Intensif. 2018; 131: 164-177.
40. Aliaga-Vicente A, Caballero JA, Fernandez-Torres MJ. Synthesis and
optimization of membrane cascade for gas separation via mixed-integer
nonlinear programming. AIChE J. 2017;63(6):1989-2006.
41. Nymeijer DC, Visser T, Assen R, Wessling M. Composite hollow fiber gas-
liquid membrane contactors for olefin/paraffin separation. Sep Purif Technol.
2004;37(3):209-220.
42. Coker DT, Freeman BD, Fleming GK. Modeling multicomponent gas separation
using hollow-fiber membrane contactors. AIChE J. 1998;44(6):1289-1302.
43. Gilassi S, Taghavi SM, Rodrigue D, Kaliaguine S. Simulation of gas separation
using partial element stage cut modeling of hollow fiber membrane modules.
AIChE J. 2018;64(5):1766-1777.
44. Pan CY. Gas separation by high‐flux, asymmetric hollow‐fiber membrane.
AIChE J. 1986;32(12):2020-2027.
45. Marriott JI, Sørensen E, Bogle IDL. Detailed mathematical modeling of
membrane modules. Comput Chem Eng. 2001;25:693–700.
46. Burns RL, Koros WJ. Defining the challenges for C3H6/C3H8 separation using
polymeric membranes. J Memb Sci. 2003;211(2):299-309.
47. Spillman R. Economics of gas separation membrane processes. In: Noble RD,
Stern SA, eds. Membrane Separations Technology. Principles and Applications.
Amsterdam: Elsevier Science; 1995.
48. Baker RW, Wijmans JG. Two-stage membrane process and apparatus, US
patents 5,256,295 and 5,256,296, 1993.
This article is protected by copyright. All rights reserved.
49. Wijmans JG, Baker RW. The solution-diffusion model: a review. J Memb Sci.
1995;107(1-2):1-21.
50. Luyben WL. Dynamic simulation of flooded condensers. Chem Eng Res Des.
2017;118:12-20.
51. Zarca G, Urtiaga A, Biegler LT, Ortiz I. An optimization model for assessment
of membrane-based post-combustion gas upcycling into hydrogen or syngas. J
Memb Sci. 2018;563:83-92.
52. Biegler LT, Grossmann IE, Westerberg AW. Systematic methods of chemical
process design. Upper Saddle River, NJ: Prentice Hall; 1997.
53. Alcántara-Avila JR, Gómez-Castro FI, Segovia-Hernández JG, Sotowa K-I,
Horikawa T. Optimal design of cryogenic distillation columns with side heat
pumps for the propylene/propane separation. Chem Eng Process - Process
Intensif. 2014;82:112-122.
This article is protected by copyright. All rights reserved.
List of figure captions
Figure 1. Single-stage membrane process.
Figure 2. Two-step membrane process.
Figure 3. Two-and-one-half membrane process.
Figure 4. Schematic diagram of the hollow fibers model.
Figure 5. Two stage process optimal design.
Figure 6. Propylene and propane transmembrane flux in stages M1 (A) and M2 (B) of
the two stage process.
Figure 7. Propylene and propane molar fractions in the retentate and permeate streams
of Stage 1 (M1).
Figure 8. Two-and-one-half stage process optimal design.
Figure 9. Propylene and propane transmembrane flux in stages M1 (A), M2 (B) and M3
(C) of the “two-and-one-half” stage process.
This article is protected by copyright. All rights reserved.
Figure 1. Single-stage membrane process.
F R
P
M1
This article is protected by copyright. All rights reserved.
Figure 2. Two-step membrane process.
This article is protected by copyright. All rights reserved.
Figure 3. Two-and-one-half membrane process.
This article is protected by copyright. All rights reserved.
Figure 4. Schematic diagram of the hollow fibers model.
This article is protected by copyright. All rights reserved.
Figure 5. Two stage process optimal design.
This article is protected by copyright. All rights reserved.
This article is protected by copyright. All rights reserved.
Figure 6. Propylene and propane transmembrane flux in stages M1 (A) and M2 (B) of
the two stage process.
This article is protected by copyright. All rights reserved.
Figure 7. Propylene and propane molar fractions in the
retentate and permeate streams of Stage 1 (M1).
This article is protected by copyright. All rights reserved.
Figure 8. Two-and-one-half stage process optimal design.
This article is protected by copyright. All rights reserved.
This article is protected by copyright. All rights reserved.
This article is protected by copyright. All rights reserved.
Figure 9. Propylene and propane transmembrane flux in stages M1 (A), M2 (B) and M3
(C) of the “two-and-one-half” stage process.
This article is protected by copyright. All rights reserved.
List of Table captions
Table 1. Facilitated Transport Model Parameters at 323 K
Table 2. Process Feed Specifications, Parameters and Constraints
Table 3. Economic Evaluation Parameters
Table 4. Models Statistics
Table 5. Optimization Results of the Multistage Processes
Table 6. Multistage Processes Net Present Value Cost Compared to the Distillation Base
Case
Table 7. Multistage Processes Net Present Value Cost for 99.9% Propylene
Specification
This article is protected by copyright. All rights reserved.
Table 1. Facilitated transport model parameters at 323 K.
Parameter Value Reference
Dcomp (x1011 m2 s-1) 4.3 21
𝑥𝐼𝐿 (-) 0.20 25
𝐻𝐶3𝐻6 (mol bar-1 m-3) 31.97 22
keq (m3 mol-1) 0.17 22
α (x1011 m2 mol-1 s-1) 2.37 25
This article is protected by copyright. All rights reserved.
Table 2. Process feed specifications, parameters and constraints.
Parameter Value
Feed temperature (K) 323
Feed pressure (bar) 18
Feed flowrate (kmol h-1) 360
Feed composition (C3H6 mole frac.) 0.50
Permeate pressure (bar) 1-18
Required C3H6 purity (xi) ≥ 0.995
Required C3H8 purity (xi) ≥ 0.950
C3H8 permeability (Barrer) a 20
Membrane thickness (µm) 20
Silver loadingb (mol l-1) 0-6
a 1 Barrer = 3.348x10⁻¹⁶ mol3 m m−2 Pa−1 s−1. b Silver loading delimited according to the experimentally studied concentration range.24,25
This article is protected by copyright. All rights reserved.
Table 3. Economic evaluation parameters.
Parameter Symbol Value Membrane Membrane replacement factor (%) MR 10 Polymer load (g m-3) PL 1.11x10⁶ Ionic liquid load (g m-3) ILL 2.76x10⁵ Polymer cost ($ g-1) PP 0.7 Ionic liquid cost ($ g-1) ILP 0.8 Silver salt cost ($ g-1) AGP 13.0 Compressors Compressor stages Nst 3 Cost function exponent a 0.77 Electricity price ($ kWh-1) EP 0.15 Isentropic efficiency ηc 0.70 Material and pressure factor MPF 1 Compression ratio Crmax 2.62 Module factor MF 3.11 Ratio of heat capacities ϒ 1.15 Reference cost ($) C0 23000 Reference size (kW) S0 74.57 Update factor UF 4.71 Project Annual operation (h y-1) OF 8000 Investment rate (%) r 10 Period (y) 𝑇𝑖𝑛𝑣 15
This article is protected by copyright. All rights reserved.
Table 4. Models statistics
Two-stages Two-and-one-half stages Number of single equations 4314 8122 Number of single variables 4321 8130
This article is protected by copyright. All rights reserved.
Table 5. Optimization results of the multistage processes
Two Stages Two-and-one-half Stages Compressor power 1 (kW) 704 694 Compressor power 2 (kW) 563 563 M1 total area (m2) 14590 13806 M2 total area (m2) 1573 1574 M3 total area (m2) n/a 210 M1 carrier loading (M) 2.33 2.30 M2 carrier loading (M) 6 6 M3 carrier loading (M) n/a 6 M1 membrane cost ($ m-2) 138 136 M2 membrane cost ($ m-2) 324 324 M3 membrane cost ($ m-2) n/a 324 M1 permeate pressure (bar) 1 1 M2 permeate pressure (bar) 1 1 M3 permeate pressure (bar) n/a 1 Compressors CAPEX (MM$) 4.49 4.47 Membrane CAPEX (MM$) 2.53 2.46 Compressors OPEX (MM$ yr-1) 1.51 1.51 Membrane OPEX (MM$ yr-1) 0.258 0.246
This article is protected by copyright. All rights reserved.
Table 6. Multistage processes Net Present Value Cost compared to the distillation base
case.
Distillation Two Stages "Two-and-one-half" Stages OPEX (MM$ y-1) 4.1a 1.77 1.75 CAPEX (MM$) 8.9b 7.02 6.93 NPVC (MM$) 39.7 20.5 20.3
a based on the design parameters presented elsewhere.29
b calculated according to the “Guthrie’s Modular Method for Costing and Sizing”52
This article is protected by copyright. All rights reserved.
Table 7. Multistage processes Net Present Value Cost for 99.9% propylene specification
Propylene 99.5 % Propylene 99.9 %
Two stages "Two-and-one-half" stages Two stages "Two-and-one-half" stages
OPEX (MM$ y-1) 1.77 1.75 Not feasible
3.09 CAPEX (MM$) 7.02 6.93 10.6 NPVC (MM$) 20.5 20.3 34.09
This article is protected by copyright. All rights reserved.