OPTIMIZATION OF NEGATIVE CENTRAL SHEAR DISCHARGES IN SHAPED CROSS SECTIONS by A.D. TURNBULL, M.S. CHU, T.S. TAYLOR, T.A. CASPER, J.M. GREENE, C.M. GREENFIELD, R.J. LA HAYE, L.L. LAO, B.J. LEE, R.L. MILLER, C. REN, C.L. REllIG, T.L. RHODES, B.W. RICE, 0. SAUTER, E.J. STRAIT, and K. TRlTZ OCTOBER 1996 GENE-L ATOMICS
Transcript
OPTIMIZATION OF NEGATIVE CENTRAL SHEAR DISCHARGES IN SHAPED CROSS SECTIONS
by A.D. TURNBULL, M.S. CHU, T.S. TAYLOR, T.A. CASPER, J.M. GREENE,
This report was prepared as an account of work sponsored by an agency of the United States Government. Neither the United States Government nor any agency thereof, nor any of their employees, makes any warranty, express or implied, or assumes any legal liability or responsibility for the accuracy, completeness, or usefulness of any information, apparatus, product, or process disclosed, or represents that its use would not infringe privately owned rights. Reference herein to any specific commercial product, process, or service by trade name, trademark, manufacturer, or otherwise, does not necessarily constitute or imply its endorsement, recommendation, or favoring by the United States Government or any agency thereof. The views and opinions of authors expressed herein do not necessarily state or reflect those of the United States Government or any agency thereof.
Portions of this document may be illegible in electronic image products. Images are produced from the best avaiiable original document.
GkA22482
OPTIMIZATION OF NEGATIVE CENTRAL SHEAR DISCHARGES IN SHAPED CROSS SECTIONS
by
C.M. GREENFIELD, R.J. LA HAYE, L.L. LAO, B.J. LEE,^ R.L. MILLER, c. REN? C.L. RETTIG,* T.L. RHODES: B.W. RICE,*O. SAUTER,~
A.D. TURNBULL, M.S. CHU, T.S. TAYLOR, T.A. CASPER,* J.M. GREENE,
E.J. STRAIT, and K. TRITZS
This is a preprint of a paper to be presented at the Sixteenth IAEA International Conference on Plasma Physics and Controlled Nuclear Research, October 7-1 1, 1996, Montreal, Canada, and to be published in The Proceedings.
*Lawrence Livermore National Laboratory, Livermore, California. tuniversity of California, San Diego, California. *University of Wisconsin, Madison, Wisconsin. 'University of California, Los Angeles, California. OCRPP-EPFL, Lausanne, Switzerland.
Work supported by the U.S. Department of Energy under Contract Nos.
DE-AC03-89ER51114 and W-7405-ENG-48, and Grant Nos. DE-FG03-95ER54294 and DE-FG03-86ER53266
GA PROJECT 3940 OCTOBER 1996
GENEHL ATOMiCS
OPTIMIZATION OF NEGATIVE CENTRAL SHEAR DISCHARGES IN SHAPED CROSS SECTIONS A.D. Turnbull, et al.
F1-CN-64/DP-1
OPTIMIZATION OF NEGATIVE CENTRAL SHEAR DISCHARGES IN SHAPED CROSS-SECTIONS
ABSTRACT
Magnetohydrodynamic (MHD) stability analyses of Negative Central Shear (NCS) equilibria have revealed a new understanding of the limiting MHD instabilities in NCS experiments. Ideal stability calculations show a synergistic effect between cross sec- tion shape and pressure profile optimization; strong shaping and broader pressure inde- pendently lead to moderately higher p limits, but broadening of the pressure profile in a strongly dee-shaped cross-section leads to a dramatic increase in the ideal p limit. Localized resistive interchange (RI) modes can be unstable in the negative shear region and are most restrictive for peaked pressure profiles. Resistive global modes can also be destabilized significantly below the ideal p limit. Experiments largely confirm the general trends, and diagnostic measurements and numerical stability calculations are found to be in good qualitative agreement. Observed disruptions in NCS discharges with L-mode edge and strongly peaked pressure, appear to be initiated by interactions between the RI, and the global ideal and resistive modes.
1. INTRODUCTION
The aim of research in tokamak concept development has been the identification and achievement of configurations with significantly improved p limits, enhanced con- finement, and sustained non-inductive current-drive. Each has been achieved, with varying degrees of success, in separate regimes in DIII-D [l-31, and other major toka- maks [4-71, but meaningful gains inficsion pe$ormance with substantially reduced size and cost [SI will require that all three features be achieved simultaneously with ade- quate fusion power and particle exhaust - this is the concept of the Advanced Tokamak (AT) [9,10].
Reversal of the central shear is one possible route to the AT goal [ l l ] . Negative Central Shear (NCS) experiments in DIII-D [1,12-141, and TFTR [15] show some of the desired features, most notably, the expected [ 11,161 core transport improvements [1,12-14,171, to a lesser extent, the high bootstrap fraction [12-141 necessary for prac- tical steady-state operation [11,16], and in some instances [1,12,14], high p limits as well. However, these configurations are so far transient, and are ultimately limited by a variety of magnetohydrodynamic (MHD) instabilities. Further progress requires a more thorough understanding of these MHD limits.
This work presents the results from systematic numerical calculations of the MHD stability limits in NCS configurations and correlates the limiting instabilities with the MHD activity observed in the experiments. The following section presents the ideal MHD stability picture, showing the dependence on the safety factor q and pressure p profiles, and on the cross-section shape. In particular, the effects of optimizing the pressure profile and shape are synergistic; moderate increases in the p limit are obtained by either broadening the pressure profile or increasing the triangularity, but a dramatic increase in the p limit results with strong shaping and broadened pressure together, in the presence of a nearby conducting wall (Section 3). Resistive inter- change modes are shown to be destabilized by a pressure gradient in a region of nega-
GENERAL ATOMICS REPORT GA-A22482 1
A.D. Turnbull, et al. OPTIMIZATION OF NEGATIVE CENTRAL
SHEAR DISCHARGES IN SHAPED CROSS SECTIONS
tive shear. Global resistive modes can also be unstable significantly below the ideal fi limit. Both are most restrictive for peaked pressure profiles. In Section 4, the observed p limits and MHD activity are in good agreement with the predicted ideal and resistive p limits over the range of parameters considered. The conclusions are sum- marized in Section 5.
2. IDEAL MHD STABILITY
2.1. Dependence on 4min
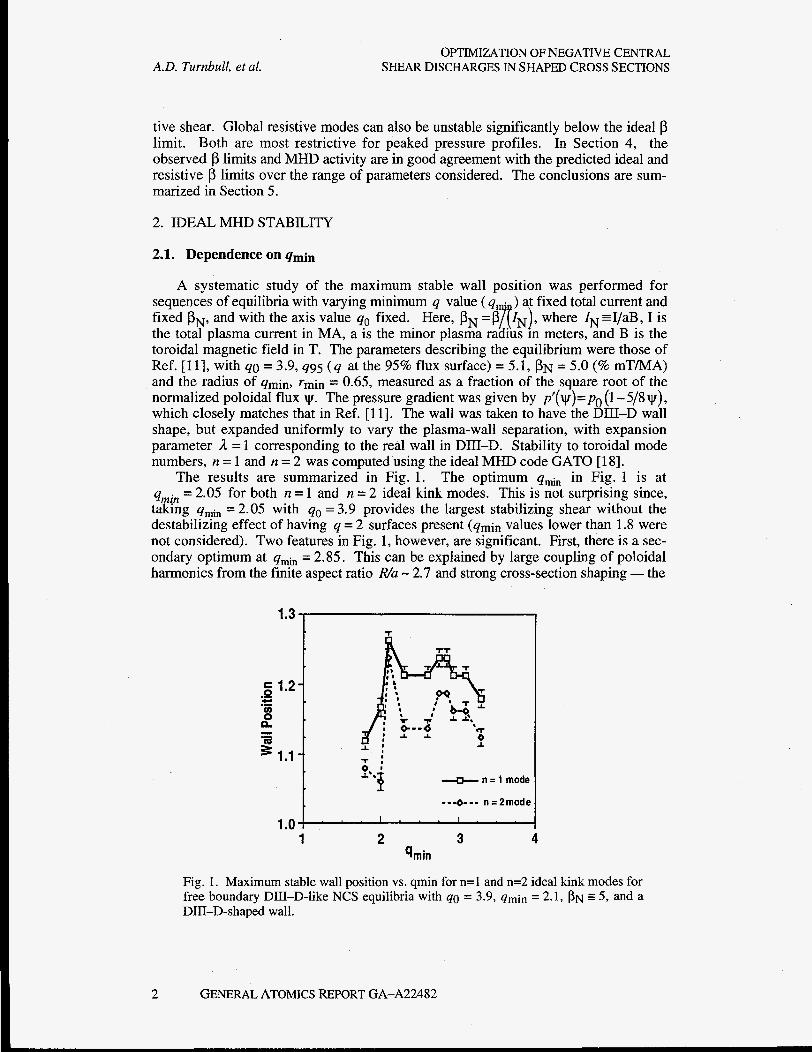
A systematic study of the maximum stable wall position was performed for sequences of equilibria with varying minimum q value ( qm. ) at fixed total current and fixed pN, and with the axis value qo fixed. Here, pN =p/[ZN), where ZN=I/aB, I is the total plasma current in MA, a is the minor plasma radius in meters, and B is the toroidal magnetic field in T. The parameters describing the equilibrium were those of Ref. [ll], with qo = 3.9,495 ( q at the 95% flux surface) = 5.1, PN = 5.0 (% mT/MA) and the radius of qmin, rmin = 0.65, measured as a fraction of the square root of the normalized poloidal flux w. The pressure gradient was given by p’(v)=po (1 -5/8y1), which closely matches that in Ref. [ll]. The wall was taken to have the DIII-D wall shape, but expanded uniformly to vary the plasma-wall separation, with expansion parameter A = 1 corresponding to the real wall in DIII-D. Stability to toroidal mode numbers, n = 1 and n = 2 was computed using the ideal MHD code GAT0 [ 181.
The optimum qmin in Fig. 1 is at qmi, = 2.05 for both n = 1 and n = 2 ideal kink modes. This is not surprising since, taking qmin = 2.05 with qo = 3.9 provides the largest stabilizing shear without the destabilizing effect of having q = 2 surfaces present (qmin values lower than 1.8 were not considered). Two features in Fig. 1, however, are significant. First, there is a sec- ondary optimum at q ~ i , = 2.85. This can be explained by large coupling of poloidal harmonics from the finite aspect ratio Wu - 2.7 and strong cross-section shaping -the
The results are summarized in Fig. 1.
I
= 1.2- .Q
n
- .- 8 - - E 1.1 -’
n = I mode
--e--- n=2model
1.0- 1 2 3 4
qmin
Fig. 1. Maximum stable wall position vs. qmin for n=l and n=2 ideal kink modes for free boundary DIII-D-like NCS equilibria with 40 = 3.9, 4min = 2.1, PN 5 , and a DIU-D-shaped wall.
2 GENERAL ATOMICS REPORT GA-A22482
OPTIMIZATION OF NEGATIVE CENTRAL SHEAR DISCHARGES IN SHAPED CROSS SECTIONS A.D. Turnbull, et al.
usual intuition from straight cylindrical models with no coupling would lead one to anticipate degraded stability for 2.5 5 qdn 5 3 for both n = 1 and n = 2 modes.
Second, the optima for n = I and n = 2 modes coincide. In particular, there is no significant degradation in the stability of the n = 2 modes just below qmin = 2.5, as might again be anticipated from the usual intuitive pictures. The fact that the optima for n=l and n=2 modes occurs at the same qmin makes operation of NCS much simpler than it otherwise would be since there is no compromise necessary between the stabil- ity of the two most dangerous modes.
The effect of varying qo was also studied. Varying qo from 3.9 to 3.1 had a small effect on the stability so this was not pursued further. The effect of qmin on the stabil- ity is significant. In terms of placement in the wall position for the pN = 5 case studied, the difference between the optimum qmin and the least stable qmin translates into roughly an extra 10 cm in the separation of the plasma from the wall for a DIII-D sized machine. This could have important consequences in the engineering design of an AT power plant.
2.2. Dependence on Cross-section and Pressure Profile
The pressure profile can have a dramatic effect on the stability. A systematic study was performed to investigate this dependence in a variety of cross-section shapes. The pressure profiles were given by p ' (y ) = po (1 - y)", where v was used to specify the peaking factor po[(p) , and po specifies the pressure on axis. ( p ) is a volume average over the cross section. Note that p' vanishes at the edge for v > 1. The cross-sections were parameterized by varying elongation and triangularity, and the q profiles were fixed near the optimum from Section 2.1, with qo = 3.9, qmn = 2.1; rmin = 0.65, and qg5 = 5.1. In contrast to the study in Section 2.1, the wall position was fixed here to be a conformal (i.e. constant normal distance) wall at 1.5 times the mid-axis minor plasma radius. The f.3 limits were computed by considering sequences of similar equilibria with increasing pressure. Note that I is not held fixed and varies with cross-section shape. Also, the current density was forced to vanish at the plasma edge by allowing slight modifications to the edge q profile so as to avoid f.3 ravines as the pressure was increased [19]. The f.3 limits for each peaking factor were computed by increasing p o keeping v fixed, and computing the n=l stability using the GAT0 code [ 181.
The results are summarized in Fig. 2 in terms of the p limit versus peaking factor for each of the cross-sections. The two curves correspond to the circular (IC, 6) = (1.0,0.0), and highly triangular elongated case with (IC, 6) = (1.8,0.7), for which complete scans over peaking factor were performed. For the intermediate cross sec- tions, p limits for the two extreme peaking factors were computed.
Several important conclusions can be drawn from these results. First, for a circular cross-section, the variation of the p limit with peaking factor is quite weak. Broad pressure is marginally better in terms of p, but in terms of the Root Mean Square (RMS) p, f.3* = (I p2dV)1/2A32, which is perhaps more relevant to fusion performance [20], the strongly peaked profiles are marginally better. For an elongated cross-section, however, the dependence on pressure peaking is stronger and increases considerably with higher triangularity. For the most strongly shaped cross section, (IC, 6) = (1.8,0.7) an increase in the p limit of a factor 3 is achievable by broadening the pressure profile, with a similar gain in p* as well.
Second, comparing the circular and highly shaped cross-sections, the p limits for the latter are above those in the circular case for all peaking factors, and the optimum p is a factor 5 above the optimum achievable in a circular cross-section. The same holds
GENERAL ATOMICS REPORT GA-A22482 3
A.D. Turnbull, et al.
2-
0
OPTIMIZATION OF NEGATIVE CENTRAL SHEAR DISCHARGES IN SHAPED CROSS SECTIONS
Y A 6 = 0.1 +
K -7.b 6 -0.1 I I I
for p* as well as p. The increase from shaping is due partly to the increased current- carrying capacity of a highly elongated, highly triangular cross-section at the same q , but is also due to a significant increase in the normalized PN limit. For the most peaked profiles, this increase in PN from shaping is relatively weak. However, for the broad pressure profiles it is a factor of 2.
The factor of 5 increase in P* from optimizing both shaping and pressure rofile
(V is the plasma volume). The fusion yield Qdd is increased by a factor of 5, since, with given field and major radius RB , Qdd can be represented as [20]
translates into a factor 25 gain in the expected fusion reactivity since, Pfus - @*> s B4V.
This large increase can be viewed as a route to increasing Gd. Alternative1 , if one requires a certain Gd, the product BR can be reduced by a factor of .$I 5 with a roughly proportional reduction in the system capital cost.
2.3. Dependence on Wall Position and Shape
Wall stabilization is necessary for achieving large PN values in NCS discharges. A studyewas undertaken, in which the P limits for the circular and highly shaped cross- sections of Section 2.2 were computed with several conformal wall positions, as well as with no wall. This was done for the two extreme peaking factors with v = 1.5 and 5.0. The results are summarized in Fig. 3, showing the four p limits as a function of wall position.
Much of the gain in PN from shaping results from the presence of a nearby stabiliz- ing wall. If a closer wall is allowed, the gains are even more dramatic than in Fig. 2; the n=l PN limit for the strongly shaped equilibria increases extremely fast as the wall is brought closer to the plasma. This is true for both extreme pressure profiles, but is
6
h
5 4 a
A
i
Fig. 2 . f3 limit vs. peaking factor for circular and highly shaped (K = 1.8, 6 = 0.7) cross sections. Shown also are the f3 limits for cross sections with K = 1.8 and 6 = 0.1 (A), 6 = 0.3 (O), and 6 = 0.5 (V), with broad (v -1.5) and peaked (v - 5 ) pressure profiles. For the circular case, IN = 0.47 and for the highly shaped Dee, IN = 1.4.
4 GENERAL ATOMICS REPORT GA-A22482
OF'TIMIZATION OF NEGATIVE CENTRAL SHEAR DISCHARGES IN SHAPED CROSS SECTIONS A.D. Turnbull, et al.
especially so for the optimum broad profile. In this case, PN > 10 for a wall at 1.2 times the plasma minor radius, which is still within present engineering limits. The circular cross section p limits are largely unaffected by the wall until the wall is brought within 1.1 times the minor radius. Note that the comparison here is with con- formal walls - the plasma wall distances around the poloidal cross section are fixed and are the same for the two different shapes. Note also that only n=l modes were considered here. From the results in Section 2.1, the n 2 2 modes are expected to have similar trends but would be more limiting at the large p values shown in Fig. 3.
3. RESISTIVE STABILITY
Two distinct resistive modes are of concern in the case of negative shear. Double tearing modes [21] have been predicted to be virulently unstable and global in nature as a result of coupling between the two rational surfaces with the same helicity. Second, although ideal interchange stability tends to be easily satisfied in the negative shear region, negative shear destabilizes the resistive interchange (RI) mode. This can be demonstrated by analysis and numerical evaluation of the analytic RI criterion [22], as well as by stability calculations for n = 1 modes using the MARS resistive MHD code [23]. The latter calculations used model equilibria having qmin = 1.5, qo = qmin + 1, 995 = 5.1, rmin = 0.5, and a self-similar, rather than conformal, wall; that is, at each point on the plasma surface, the wall was extended along a ray subtended from the geometric center of the plasma by a constant factor, so that the plasma and wall shapes are similar but the plasma-wall separation varies with poloidal angle. The wall factor was taken to be at 1.3 times the minor radius ,
2ot \ 15L \
......... I * . . . , ' . . ,
5
0 0.0 0.5 1 .o 1.5 2.0
( h a i l - RPiasma) I b i a s m a
Fig. 3. p limit VS. conformal wall position (Rwal1- Rplasma)/Rplasma for cross section with v = 1.5 and v = 5 and highly shaped Dee cross section also with v = 1.5 and v = 5.
GENERAL ATOMICS REPORT GA-A22482 5
A.D. Turnbull, et al. OPTIMIZATION OF NEGATIVE CENTRAL
SHEAR DISCHARGES IN SHAPED CROSS SECTIONS
3.1. Localized Interchange Stability
For an axisymmetric tokamak, the condition for RI instability is [22]
13k=D1+-(1-2H) 1 2 > o , 4
where the Mercier criterion [24], 4 > 0 implies instability to ideal interchanges, and H is given in Ref. [22]. Numerical evaluation of 4 across the plasma for the NCS equilibria in Section 2 invariably show 4 > 0 in the negative shear region when p is above a critical value that is below the ideal n = 1 kink limit. However, like the ideal PN limit, the RI PN limit depends strongly on the pressure profile peakedness, and for a given cross-section, roughly follows the ideal limit at some fraction below it. For the highly triangular dee shapes, this fraction is in the range 65% to SO%, whereas for a circular cross-section, it is generally closer to 85% to 90%, reflecting the fact that the dependence of the RI PN limit is less sensitive to cross-section shape than the ideal kink limit. Nevertheless, the dependence on shape is still considerable. This dependence can be seen from the following analysis. I& can be written
where
and
with vt given in Ref. [24]. The primes here refer to derivatives with respect to \v. For typical NCS equilibria, n'f > 0, when q > 1, so Mercier stability is usually satis- fied, ( p f < 0). Also, from Eq. (3), the term proportional to p f is always destGbilizing for any p f . The last term, however, flips sign when q' is reversed. Taking H < 0, as is usually the case with a large Shafranov shift, the last term in Eq. (3) is stabilizing for normal shear, but destabilizing for negative shear.
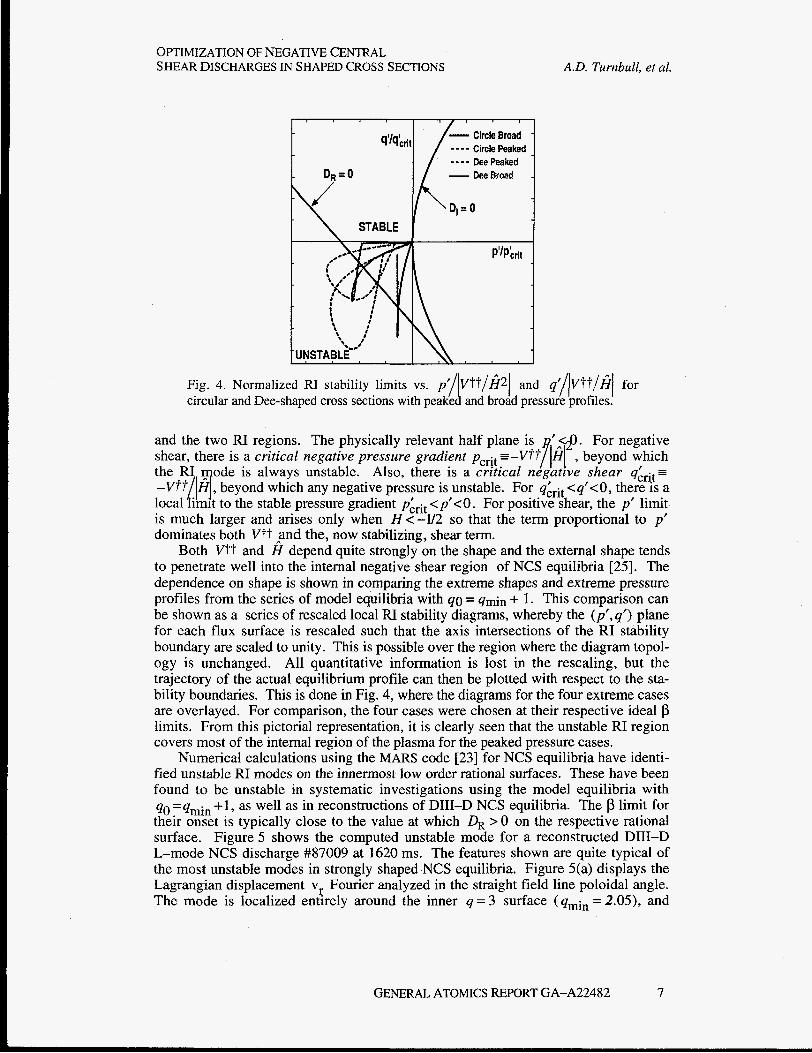
Negative shear, coupled with a large Shafranov shift and large negative p f can therefore lead to positive 4 and RI instability, even when the system is Mercier sta- ble with Vft > 0. This can also be seen pictorially as follows. The condition for local- ized RI instability can be evaluated simply in a space spanned by varying p' and qf , in the same way as the so-called (s,a) diagram is constructed for ideal ballooning and interchange stability in Ref. [24]. The generic stability diagram for the case V t t > 0 and H < 0 is shown in Fig. 4(a), showing the Mercier unstable region as in Ref. [24]
6 GENERAL ATOMICS REPORT GA-A22482
OPTIMIZATION OF NEGATIVE CENTRAL SHEAR DISCHARGES IN SHAPED CROSS SECTIONS A.D. Turnbull, et al.
Fig. 4. Normalized RI stability limits vs. p’/rtt/fi2/ and q’//V?t/fiI for circular and Dee-shaped cross sections with peake and broad pressure profiles.
and the two RI regions. The physically relevant half plane is ’ 9. For negative shear, there is a critical negative pressure gradient pcrit --VffAEi[ , beyond which
ode is always unstable. Also, there is a critical negative shear , beyond which any negative pressure is unstable. For <q’<O, there is a to the stable pressure gradient plrit <p’<O. For positive shear, the p’ limit
is much larger and arises only when H<-1/2 so that the term proportional to p’ dominates both Vtt 3nd the, now stabilizing, shear term.
Both V t t and H depend quite strongly on the shape and the external shape tends to penetrate well into the internal negative shear region of NCS equilibria [25 ] . The dependence on shape is shown in comparing the extreme shapes and extreme pressure profiles from the series of model equilibria with 40 = qmin + 1. This comparison can be shown as a series of rescaled local RI stability diagrams, whereby the (p’,q’) plane for each flux surface is rescaled such that the axis intersections of the RI stability boundary are scaled to unity. This is possible over the region where the diagram topol- ogy is unchanged. All quantitative information is lost in the rescaling, but the trajectory of the actual equilibrium profile can then be plotted with respect to the sta- bility boundaries. This is done in Fig. 4, where the diagrams for the four extreme cases are overlayed. For comparison, the four cases were chosen at their respective ideal p limits. From this pictorial representation, it is clearly seen that the unstable RI region covers most of the internal region of the plasma for the peaked pressure cases.
Numerical calculations using the MARS code [23] for NCS equilibria have identi- fied unstable RI modes on the innermost low order rational surfaces. These have been found to be unstable in systematic investigations using the model equilibria with qo =qmin +1 , as well as in reconstructions of DIII-D NCS equilibria. The p limit for their onset is typically close to the value at which & > 0 on the respective rational surface. Figure 5 shows the computed unstable mode for a reconstructed DIII-D L-mode NCS discharge #87009 at 1620 ms. The features shown are quite typical of the most unstable modes in strongly shaped NCS equilibria. Figure 5(a) displays the Lagrangian displacement vr Fourier analyzed in the straight field line poloidal angle. The mode is localized entirely around the inner q = 3 surface ( qmin = 2.05), and
GENERAL ATOMICS REPORT GA-A22482 7
A.D. Turnbull, et al, OPTIMIZATION OF NEGATIVE CENTRAL
SHEAR DISCHARGES IN SHAPED CROSS SECTIONS
k > 0 over most of the negative shear region. The perturbed radial magnetic field, b, is shown in Fig. 5(b). This is also highly localized around q = 3.
The structure is that of an interchange mode, with vr having dominant poloidal mode number m = IZ q , and b, having dominant m = n q + 1, and n q + 2 components. Numerical grid sensitivity and convergence tests for several cases, including that shown in Fig. 5 , have verified that the computed modes are properly resolved and are unstable. Scaling studies with varying resistivity [26]. also confirm the expected 771’3 scaling of the RI growth rate [22]. The growth rate is found to be insensitive to plasma boundary conditions and sheared plasma rotation, as expected from the localized nature of the mode, and the real mode frequency scales with the local fluid rotation. Systematic studies of the critical pN for the onset of the RI mode with respect to vari- ous equilibrium parameters reveal a strong decreasing dependence of PNcrit on increased pressure peaking, in line with the similar dependence of the 41 criterion. However, PN crit is found to be relatively insensitive to qmin; although the surface at which the computed mode appears varies with qmin, PN crit does not. This is consis- tent with the instability criterion 4 > 0 indicating instability over most of the NCS region in each case - while there is at least one rational surface in this region, there will be a corresponding RI instability. The RI diagram for this discharge is essentially that shown in Fig. 4 for the peaked pressure Dee shape.
3.2. Global Resistive Modes
NCS equilibria with multiple low order rational surfaces of the same helicity are known to be susceptible to double tearing mode instabilities, with a global mode structure straddling the two rational surfaces, and significantly higher growth rates ( y - 771’3) than the usual single pitch tearing modes [21]. Numerical calculations with the MARS code [23] have identified these instabilities routinely in NCS equilibria.
However, in many cases, the global mode structure is modified from the simple double tearing structure by external conditions, most notably, the plasma shape and associated boundary conditions, plasma rotation, and finite p effects. In general, the resulting mode has some double tearing-like structure, some RI component at the inner rational surface, plus an ideal kink-like component. The dependence on external conditions can be summarized as follows. For circular cross-sections, in the absence of plasma rotation, the mode has a critical pN below the ideal and RI limits. On the other hand, in dee-shaped cross-sections it is invariably more stable than the RI mode, having higher critical pN and a lower growth rate. In either case, near the critical pN, the global
0.15
0.05 L >
-0.05
-0.15 0.0 0.2 0.4 0.6 0.8
P 1 .o 0.0 0.2 0.4 0.6 0.8 1.0 P
Fig. 5. Unstable RI mode computed for DIII-D discharge #87009 at 1620 ms. (a) Perturbed radial displacement vr (b) perturbed radial field b,.
8 GENERAL ATOMICS REPORT GA-A22482
OPTIMIZATION OF NEGATIVE CENTRAL SHEAR DISCHARGES IN SHAPED CROSS SECTIONS A.D. Turnbull, et al.
mode is still predominantly double tearing, with growth rate scaling like y - q", where a - V3 Plasma rotation can, however, greatly affect the mode structure, and rotation speeds of the order of those measured experimentally in DIII-D can stabilize the mode near the critical pN by decoupling the two rational surfaces to produce a mode with characteristics of the more stable single pitch tearing mode.
Increasing p, however, increases the coupling between the global resistive mode and the external boundary. The unstable mode then takes on increasing ideal character- istics. The resonant structures at the rational surfaces are broadened and dominated by the global structure across the plasma and out to the edge. In addition, there is increased coupling to the RI with increasing p. The resistivity scaling, y - q" becomes more ideal, as a decreases; at the ideal p limit, a 4 0 and the mode becomes a global ideal mode such as was discussed in Section 2.
These trends appear to be quite robust, although the details depend quantitatively on the external boundary conditions, such as the presence of a nearby wall, or a nearby divertor. In particular, the higher growth rate of the global mode in circular cross sec- tion, and of the RI in the dee-shaped cross-sections is a significant observation, as will be discussed in Section 4. A typical unstable resistive global mode, displaying most of the features, is shown in Fig. 6. This is for the same DIII-D discharge as in Fig. 5, but at a later time (1675 ms), and corresponds to the most unstable n = 1 mode at this time. The double tearing structure can be seen in the two peaks in vr [Fig. 6(a)]. The coupling with the edge of the plasma is also clearly seen and contnbutes ideal charac- teristics to the mode. Also clear is the relative dominance of the innermost peak in vr due to mixing with the RI mode. However, the global character of this mode is most obvious in the plot of b, in Fig. 6(b). The perturbation in br extends from the core of the plasma to the plasma boundary, with no obvious resonant structures at the rational q surfaces, characteristic of an ideal instability.
Systematic stability studies for the dependence of the global mode on the equilib- rium parameters have not been performed since the RI mode is the more unstable in dee-shaped plasmas, and since the global mode stability is sensitive to external bound- ary conditions and plasma rotation. Nevertheless, since the stability limit for these modes lies between the more unstable RI mode and the more stable ideal modes, it is a strongly decreasing function of the pressure peaking. The dependence on qo and qmin is less clear and merits further investigation. It is notable, however, that unstable resistive global modes have been identified when qmin > 2 , as well as when qmin < 2 .
0.0 0.2 0.4 0.6 0.8 1.0 0.0 0.2 0.4 0.6 0.8 1.0 P
Fig. 6. Unstable resistive global mode computed for DIII-D discharge #87009 at 1675 ms (a) perturbed radial displacement vr, (b) perturbed radial field b,.
GENERAL ATOMICS REPORT GA-A22482 9
A.D. Turnbull, et al. OPTIMIZATION OF NEGATIVE CENTRAL
SHEAR DISCHARGES IN SHAPED CROSS SECTIONS
4. EXPERIMENTAL CONFIRMATION
In DIII-D and TFTR, NCS discharges with L-mode type edge conditions are sometimes observed to form an internal barrier near the minimum q position [ 12-15]. With continued neutral beam fueling, this results in a dramatic peaking of the density profile and ultimately the discharges undergo a fast n = 1 disruption at low pN values near 2.0. In strongly shaped DIII-D discharges the pN limit is typically a little above 2.0, and in circular cross-section TFTR, pN is usually a little below 2.0. Also, bursts of n = 1 MHD activity are commonly observed in DIII-D during the discharge evolution. In TFTR, these bursts have not been observed.
Broadening the pressure profile greatly increases the achievable p limit. In DIII-D this is achieved by forcing a transition to H-mode prior to reaching the disruption p limit [ 131. In that case, pN continues to increase with continued neutral beam fueling, reaching values in excess of PN - 4 - double the L-mode limit. This limit is gener- ally not disruptive and corresponds to the onset of ELMS, though the NCS region usu- ally then collapses.
These general observations are in good agreement with the overall stability picture found in Sections 2 and 3. Figure 7 shows the ideal and resistive p limits as functions of the pressure profile peakedness, for the model equilibria with qo =qmin +1 overlaid with the experimental data obtained from the DIII-D NCS experiments. For strongly peaked pressure profiles with p , / (p ) - 5 to 7, as observed in the experiments near the disruption times, the ideal p limits are typically pN 2 2 for strongly dee shaped equi- libria. The global resistive p limits are generally around 10% to 20% lower than this.
Moreover, in the noncircular cases, the localized resistive interchange limit is the most stringent. Thus, the prior MHD bursts in DIII-D can be identified with the resis- tive interchange mode 1261. In addition, the mode structures, as identified from soft x- ray (SXR) and other fluctuation diagnostics on DIII-D show a structure localized very close to the inner rational surfaces as predicted for a resistive interchange mode.
One can therefore hypothesize that in the noncircular DIII-D L-mode discharges, the equilibria evolve with increasing /3 and increasing peakedness, reaching first the resistive interchange limit in Fig. 7 at PN - 1.5 to 2.0 and consequently suffering the
6 0 M o d e 0 Lmode
0
H Transition 0- 4 6 0 0 2
P(0) I cP> I
Fig. 7. Comparison of computed ideal and RI p limits for model equilibria with 40 = 2.5, 4min = 1.5, and 495 = 5.1 as a function of poI<p>, with DIII-D NCS discharges (solid points L- mode, open points H-mode). Discharge trajectories for #87009 (L-mode) and #84736 (H-mode) are shown overlayed, the latter with the H transition identified.
10 GENERAL ATOMICS REPORT GA-A22482
OPTIMIZATION OF NEGATIVE CENTRAL SHEAR DISCHARGES IN SHAPED CROSS SECTIONS A.D. Turnbull, et al.
observed localized MHD bursts. These bursts cause some changes in both the mag- netic and rotational shear profiles [ 141, which have a significant destabilizing effect.
However, the modes stabilize and the discharges recover since the perturbations are quite localized in both vr and b,. The trajectory of discharge #87009 is shown in Fig. 7. This was an L-mode discharge with an early MHD burst and final disruption as shown. The computed resistive interchange mode for this discharge is shown in Fig. 5 using an equilibrium reconstructed from motional Stark effect (MSE), pressure profile, and magnetic data, at the time of one of the early MHD bursts (1620 ms). Of particularnote is the high degree of localization of br around the q = 3 surface. In contrast, the fastest growing mode computed just prior to the time of the fast n > l disruption, (Fig. 6), shows structure in the fluid displacement at both q = 3 surfaces. More important, however, is the global nature of b,. in Fig. 6(b), especially the large relative amplitude near the edge. This seems likely to cause a gross disturbance over the whole plasma, which could be identified with the observed disruption.
Another general observation is consistent with the calculations in Section 3. Both the calculations and experiments show no discernible dependence of either the disrup- tion limit or the prior bursts in DIII-D on the value of qmin, particularly near qmin = 2. For the resistive interchange modes, when qmin < 2, unstable modes can be found on either of the q = 2 or q = 3 surfaces, though the experimental data has not been analyzed in sufficient detail to determine if and when the bursts are predominantly rn = 2 or m = 3, in such cases. SXR analysis has shown an m = 3 structure at the q = 3 surface in the one instance where complete analysis was done. For the disrup- tion, the gross characteristics also appear to be independent of whether qmin c 2 or qmin > 2. The calculations show global modes generally associated with the lowest double rational surface in the plasma but they are otherwise similar, as are the ideal modes in Section 2.
The trajectory of an NCS discharge, #84736, in which a transition to H-mode was triggered during the density peaking, is also shown in Fig. 7. Following the transition, p o / ( p ) suddenly decreases, and pN is then able to increase to PN - 4 while remaining in the stable region. This discharge does not reach any of the computed p limits (ideal or resistive) shown in Fig. 7. Instead, the discharge was ultimately limited by the onset of ELMS, at which point the inverted q profile collapsed - the discharge continued ELMing at lower p with a monotonic q profile. The first ELM which resulted in the profile collapse appears to be associated with an ideal or resistive instability not con- sidered in the present calculations since the edge pressure gradient was taken to van- ish; this first ELM bears many of the characteristics of the VH-mode termination event [27] which has been identified as a low a , edge-localized ideal kink mode driven unstable by the finite edge pressure gradient. With this proviso, the development of this discharge is also consistent with the stability limits in Fig. 7.
Finally, the TFTR p limits are also consistent with the limits for circular cross- section, being limited to pN 5 2. The fact that the resistive interchange-like MHD bursts are not observed is in accordance with the calculation result that, for circular cross-section, the resistive global mode is found to be more unstable than the RI.
5. SUMMARY
Investigations of the ideal and resistive MHD stability of NCS equilibria reveals a new understanding of the effects of profiles and cross section shape on the MHD instabilities that presently limit the performance of NCS discharges. For global, low n, ideal modes, stability is optimized when qmin is just above a rational value as expected.
GENERAL ATOMICS REPORT GA-A22482 11
A.D. Turnbull, et al. OPTIMIZATION OF NEGATIVE CENTRAL
SHEAR DISCHARGES IN SHAPED CROSS SECTIONS
However, local, sub-optimum values also exist between the rational values that are not intuitively predicted. Cross-section shape and the pressure profile, together, have a synergistic effect on the ideal stability. For a circular cross section, pN is limited, for any reasonable pressure profile, to values of fiN - 1.5 to 2.5. Optimization of the pres- sure profile in a strongly dee-shaped cross-section, however, leads to qualitatively dif- ferent optimum profiles and dramatically higher ideal p limits, up to factors of five above those obtainable in a circular cross-section. If a closer wall is allowed, the quantitative gains in p from pressure and cross-section optimization are even more dramatic. These general trends are robustly insensitive to the details of the q profile and the shape of the stabilizing wall.
Localized RI modes can be unstable in the negative shear region due to desta- bilization of the magnetic well by profile effects. For the most strongly peaked pressure profiles, these modes are the most restrictive on PN. They depend sensitively on the pressure peakedness and the degree of inner shear reversal, qo - qmin, but are relatively insensitive to qmin, per se. The dependence on the cross-section shape is less than that for the ideal kink modes, but is nonetheless, still significant. Resistive global modes can also be easily destabilized below the ideal p limits if the plasma rotation is low. Sheared plasma rotation, however, can decouple multiple rational surfaces with the same or different helicity if the equilibrium is sufficiently far from the ideal limit, and this can stabilize the modes.
Experiments in the DIII-D tokamak largely confirm the general trends. In cases where the detailed comparisons have been done, diagnostic measurements and numeri- cal stability calculations are found to be in excellent agreement. Observed disruptions in NCS L-mode discharges with strongly peaked pressure, appear to be initiated by interactions between the RI, and the global ideal and resistive modes, directly, and indirectly through the current density, pressure, and rotation profiles.
A clear and consistent picture has therefore emerged which goes a long way to explaining the observed MHD behavior of NCS discharges, but some challenges still remain. First, identification of the disruption event, as a near-ideal resistive global mode, from direct observation of the mode structure during the disruption is needed. The large ELMS in the H-mode phase also need to be unambiguously identified. As for the MHD bursts, though the internal fluctuation diagnostic measurements are in good agreement with the localized nature of the computed RI modes, the observed linear growth rates of the fluctuations are typically up to an order of magnitude faster than the computed growth rates for the experimental Lundquist values. This needs to be resolved. Also, linear MHD calculations find n = 2 and higher n modes with faster growth rate than the n = 1 modes ( y - r ~ ” ~ ) . Yet n = 2 bursts are rarely observed and n > 2 bursts have not been identified. The resolution of this is probably to be found in kinetic or neoclassical corrections to the linear MHD theory.
6. ACKNOWLEDGMENTS
This is a report of work sponsored by the US. Department of Energy under Contract Nos. DE-AC03-89ER51114 and W-7405-ENG-48, Grant Nos. DE-AC03- 95ER54294 and DE-FG03-86ER53266, and in part by the Swiss National Science Foundation.
12 GENERAL ATOMICS REPORT GA-A22482
OF’TIMIZATION OF NEGATIVE CENTRAL SHEAR DISCHARGES IN SHAPED CROSS SECTIONS
7. REFERENCES
A.D. Turnbull, et al.
LAZARUS, E.A., et al.., Phys. Fluids B 4 3644 (1992). JACKSON, G.L., et al., Phys. Rev. Lett. 67 3098 (1991). POLITZER, P.A.,et al., Phys. Plasmas 1 1545 (1994). HUGON, M., et al., Nucl. Fusion 32 33 (1992). KOIDE, Y., et al., Phys. Rev. Lett. 72 3662 (1994). HOANG, G.T., et al., Nucl. Fusion 34 75 (1994) . STRACHAN, J.D., et a]., Phys. Rev. Let. 58 1004 (1987). GALAMBOS, J.D. et al., Nucl. Fusion 35 551 (1995). TAYLOR, T.S., Plasma Physics and Controlled Fusion 36 B229 (1994). GOLDSTON, R., Plasma Physics and Controlled Fusion 36 B213 (1994). TURNBULL, A.D., et al., Phys. Rev. Lett. 74 718 (1995). STRAIT, E.J., et al., Phys. Rev. Lett, 75 4421 (1995). RICE, B.W., et al., Phys. Plasmas 3 1983 (1996). LAO, L.L., et al., Phys. Plasma 3 1951 (1996). LEVINTON, F., et al., Phys. Rev. Lett. 75 4417 (1995). KESSEL, C., et al., Phys. Rev. Lett. 74 1212 (1994); MANICKAM, J,. et al., Phys. Plasmas 1 1601 (1994). ZARNSTORFF, M., private communication. BERNARD, L.C., et al., Comput. Phys. Commun. 24 377 (1981). PHILLIPS, M., et al., Nucl. Fusion 28 1499 (1988). LAZARUS, E.A., et al., “I need a title for this one,” to be published in Nucl. Fusion; LAZARUS, .E.A., et al. Phys. Rev. Lett. 77 2714 (1996). DEWAR, R.L., and PERSSON, M., Phys. Fluids B5 4273 (1993). GLASSER, A.M., et al., Phys. Fluids 19 567 (1985). BONDESON, A., et al., Phys. Fluids B4 1889 (1992). GREENE, J.M., CHANCE, M.S., Nucl. Fusion 21 453 (1981). LEE, B.J., et al., submitted to Nucl. Fusion (1996). CHU, M.S., et al., Phys. Rev. Lett. 77 2710 (1996). STRAIT, E.J., et al., in Proc. 20th Euro. Conf. on Contr. Fusion and Plasma Phys., Lisbon, Portugal (European Physical Society, Petit-Lancy, 1994) Vol. 1, p. 211.