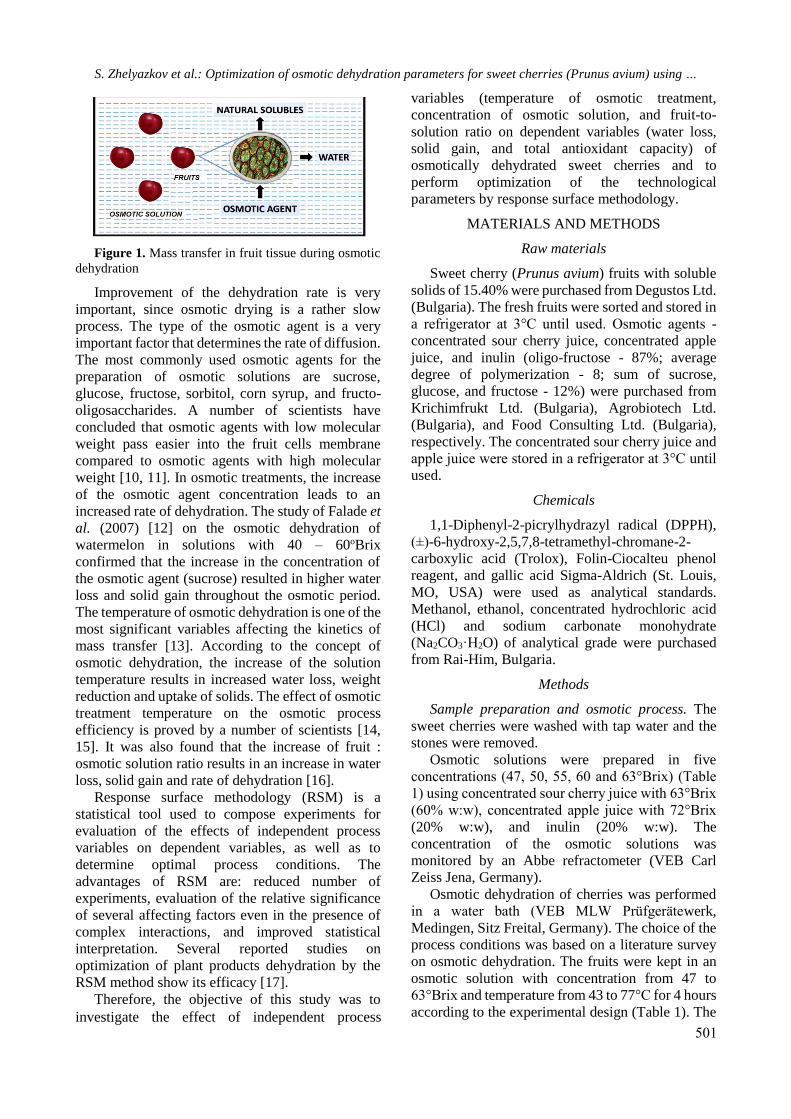
Bulgarian Chemical Communications, Volume 52, Issue 4 (pp. 500-505) 2020 DOI: 10.34049/bcc.52.4.5304
500
Optimization of osmotic dehydration parameters for sweet cherries (Prunus avium)
using response surface methodology
S. Zhelyazkov1*, S. Aleksandrov1, M. Ruskova1, T.Petrova1, V. Gotcheva2, N. Penov3
1Institute of Food Preservation and Quality, Plovdiv, Bulgaria 2Department of Biotechnology, University of Food Technologies, Plovdiv, Bulgaria
3Department of Canning and Refrigeration Technology, University of Food Technologies, Plovdiv, Bulgaria
Received: June 30, 2020; Revised: August 04, 2020
Osmotic dehydration of foods has recently gained attention as a processing method for obtaining better quality fruit
products. The objective of this study was to investigate the effect of temperature of osmotic treatment (43, 50, 60, 70, and
77°C), concentration of osmotic solution (47, 50, 55, 60, and 63°Brix) and fruit-to-solution ratio (1:2, 1:3, 1:4, 1:5, and
1:6 w/w) on water loss (WL), solid gain (SG), and total antioxidant capacity (TAC) of osmotically dehydrated sweet
cherries and to perform optimization of technological parameters by response surface methodology (RSM). The optimized
criteria yielded high values of water loss, solid gain, and total antioxidant capacity.
Keywords: optimization, osmotic dehydration, sweet cherries, response surface methodology
Abbreviations:
OD – osmotic dehydration
WL – water loss
SG – solid gain
TAC – total antioxidant capacity
RSM – response surface methodology
INTRODUCTION
Cherries are one of the most popular early
summer fruits. They comprise about 30 species, of
which the most popular edible types are sweet cherry
(Prunus avium), tart (sour) cherry (Prunus cerasus),
and duke cherry. Cherries could be yellow, red, or
yellow-red colored and are consumed fresh, dried, or
processed. Sweet cherry fruits contain carbohydrates
(12 – 26%), organic acids (0.3 – 0.8%), water-
soluble vitamins (vitamin C, B vitamins) and fat-
soluble vitamins (vitamins A, E and K), and some
carotenoids [1, 2]. They are a good source of
polyphenols (44 – 87 mg gallic acid equivalents/ 100
g) [1], anthocyanins (70 – 100 mg cyanidin 3-
glucoside equivalents /100 g) [3], and flavonols (3 –
5 mg ⁄100 g) [4]. The listed phytochemicals have
been shown to exhibit high antioxidant capacity and
to play a pivotal role in cell protection from reactive
oxygen species (ROS) produced in the human body.
Therefore, consumption of these fruits can reduce
the risk of diseases such as cancer [5], arthritis,
inflammation [6], and neurodegenerative diseases
[7]. In the last few decades, sweet cherries are used
for manufacturing health-promoting juices, syrups,
jams, dried, and dietary foods, where preservation of
antioxidants during cherry processing is of key
importance.
Osmotic dehydration (OD) is one of the
perspective pre-treatments for manufacturing dried
fruit products, since it offers a number of benefits
such as reducing the heat degradation of biologically
active phytochemicals, color retention, reduction of
fruit browning and decrease of the energy costs [8].
Osmotic dehydration often precedes processes such
as air drying, freeze drying, or vacuum drying.
Osmotic dehydration is based on partial removal
of water from plant tissues by immersion of
foodstuff in a hypertonic water solution. It involves
three simultaneous mass transfer flows (Fig. 1). The
first one is water removal from the plant tissues into
the osmotic solution, the second is the diffusion of
osmotic agent from the osmotic solution into the
plant cells and the third mass transfer flow is
excretion of plant compounds (organic acids,
mineral salts and vitamins) from the tissues to the
osmotic solution. Although this third flow is not
significant in the mass exchange, it is essential for
the chemical composition and organoleptic qualities
of the products [9].
Several factors are responsible for osmotic
process efficiency, including type and concentration
of the osmotic agent, temperature of the osmotic
treatment, fruit : osmotic solution ratio and process
duration.
* To whom all correspondence should be sent:
E-mail: [email protected] 2020 Bulgarian Academy of Sciences, Union of Chemists in Bulgaria
S. Zhelyazkov et al.: Optimization of osmotic dehydration parameters for sweet cherries (Prunus avium) using …
Figure 1. Mass transfer in fruit tissue during osmotic
dehydration
Improvement of the dehydration rate is very
important, since osmotic drying is a rather slow
process. The type of the osmotic agent is a very
important factor that determines the rate of diffusion.
The most commonly used osmotic agents for the
preparation of osmotic solutions are sucrose,
glucose, fructose, sorbitol, corn syrup, and fructo-
oligosaccharides. A number of scientists have
concluded that osmotic agents with low molecular
weight pass easier into the fruit cells membrane
compared to osmotic agents with high molecular
weight [10, 11]. In osmotic treatments, the increase
of the osmotic agent concentration leads to an
increased rate of dehydration. The study of Falade et
al. (2007) [12] on the osmotic dehydration of
watermelon in solutions with 40 – 60oBrix
confirmed that the increase in the concentration of
the osmotic agent (sucrose) resulted in higher water
loss and solid gain throughout the osmotic period.
The temperature of osmotic dehydration is one of the
most significant variables affecting the kinetics of
mass transfer [13]. According to the concept of
osmotic dehydration, the increase of the solution
temperature results in increased water loss, weight
reduction and uptake of solids. The effect of osmotic
treatment temperature on the osmotic process
efficiency is proved by a number of scientists [14,
15]. It was also found that the increase of fruit :
osmotic solution ratio results in an increase in water
loss, solid gain and rate of dehydration [16].
Response surface methodology (RSM) is a
statistical tool used to compose experiments for
evaluation of the effects of independent process
variables on dependent variables, as well as to
determine optimal process conditions. The
advantages of RSM are: reduced number of
experiments, evaluation of the relative significance
of several affecting factors even in the presence of
complex interactions, and improved statistical
interpretation. Several reported studies on
optimization of plant products dehydration by the
RSM method show its efficacy [17].
Therefore, the objective of this study was to
investigate the effect of independent process
variables (temperature of osmotic treatment,
concentration of osmotic solution, and fruit-to-
solution ratio on dependent variables (water loss,
solid gain, and total antioxidant capacity) of
osmotically dehydrated sweet cherries and to
perform optimization of the technological
parameters by response surface methodology.
MATERIALS AND METHODS
Raw materials
Sweet cherry (Prunus avium) fruits with soluble
solids of 15.40% were purchased from Degustos Ltd.
(Bulgaria). The fresh fruits were sorted and stored in
a refrigerator at 3°C until used. Osmotic agents -
concentrated sour cherry juice, concentrated apple
juice, and inulin (oligo-fructose - 87%; average
degree of polymerization - 8; sum of sucrose,
glucose, and fructose - 12%) were purchased from
Krichimfrukt Ltd. (Bulgaria), Agrobiotech Ltd.
(Bulgaria), and Food Consulting Ltd. (Bulgaria),
respectively. The concentrated sour cherry juice and
apple juice were stored in a refrigerator at 3°C until
used.
Chemicals
1,1-Diphenyl-2-picrylhydrazyl radical (DPPH),
(±)-6-hydroxy-2,5,7,8-tetramethyl-chromane-2-
carboxylic acid (Trolox), Folin-Ciocalteu phenol
reagent, and gallic acid Sigma-Aldrich (St. Louis,
MO, USA) were used as analytical standards.
Methanol, ethanol, concentrated hydrochloric acid
(HCl) and sodium carbonate monohydrate
(Na2CO3·H2O) of analytical grade were purchased
from Rai-Him, Bulgaria.
Methods
Sample preparation and osmotic process. The
sweet cherries were washed with tap water and the
stones were removed.
Osmotic solutions were prepared in five
concentrations (47, 50, 55, 60 and 63°Brix) (Table
1) using concentrated sour cherry juice with 63°Brix
(60% w:w), concentrated apple juice with 72°Brix
(20% w:w), and inulin (20% w:w). The
concentration of the osmotic solutions was
monitored by an Abbe refractometer (VEB Carl
Zeiss Jena, Germany).
Osmotic dehydration of cherries was performed
in a water bath (VEB MLW Prüfgerätewerk,
Medingen, Sitz Freital, Germany). The choice of the
process conditions was based on a literature survey
on osmotic dehydration. The fruits were kept in an
osmotic solution with concentration from 47 to
63°Brix and temperature from 43 to 77°C for 4 hours
according to the experimental design (Table 1). The
501
S. Zhelyazkov et al.: Optimization of osmotic dehydration parameters for sweet cherries (Prunus avium) using …
502
fruit : solution ratio was 1:2, 1:3, 1:4, 1:5, and 1:6
(w:w) (Table 1). Further, the osmotically dehydrated
cherries were removed from the solutions, quickly
rinsed with hot water (40°C) and gently dried with
paper towel to remove surface moisture. Total dry
matter and drained weight (final sample weight) of
the osmotically dehydrated fruits were determined.
The fruits were also analyzed for the mass transfer
indicators (water loss, solid gain) and total
antioxidant capacity.
Water loss (WL) is defined as the net loss of water
from the fresh fruits after osmotic dehydration based
on the initial sample.
Solid gain (SG) is defined as the net uptake of
sugar by the osmotically dehydrated fruits based on
the initial sample weight.
WL and SG were calculated according to the
following equations [18]:
𝑊𝐿 = 𝑥𝑜
𝑤𝑀𝑜𝑜− 𝑥𝑓
𝑤 𝑀𝑓𝑜
𝑀𝑜𝑜 100 , % + (1)
𝑆𝐺 = 𝑥𝑓
𝑠𝑡 𝑀𝑓𝑜− 𝑥𝑜
𝑠𝑡 𝑀𝑜𝑜
𝑀𝑜𝑜 100, % (2)
where: 𝑥𝑜 𝑤 – initial moisture content (%), 𝑥𝑓
𝑤 – final
moisture content (%), 𝑀𝑜 𝑜 – initial sample weight
(kg), 𝑀𝑓 𝑜 – final sample weight (kg), 𝑥𝑜
𝑠𝑡 – initial
solids content (%), 𝑥𝑓 𝑠𝑡 – final solids content (%).
The moisture content in the fruits and the
concentrated juices was determined according to
BCS EN 12143:2000 and BCS EN 12145:2000.
Extract preparation. The osmotically dehydrated
sweet cherries (5.00 g) were mixed with acidified
methanol HCl (1000 ml MeOH with 2.3 ml conc.
HCl) in a 50 ml volumetric flask. After 12 hours in a
refrigerator at 3°C, the extracts were filtered through
filter paper and transferred into flasks.
Total antioxidant capacity (TAC) was determined
by the DPPH assay (free radical scavenging
activity).
The ability of the fruit extract to interact with free
radicals (scavenger again DPPH•) was determined
by the colorimetric method of Brand-Williams et al.
(1995) [19]. A 2250 μl aliquot of DPPH - ethanol
solution (2.4 mg DPPH in 100 cm3 ethanol) was
mixed with 250 μL of methanol extract. The samples
were incubated in a dark cabinet at room
temperature. The change in absorbance after 15
minutes was measured at 515 nm by a
spectrophotometer (UV-Vis Thermo Fisher
Scientific, Madison, WI, USA). The standard curve
for the method was created with ethanol solutions of
Trolox in a concentration range between 100 and
1000 μmol per 100 ml. The total antioxidant capacity
(TAC) was expressed as μmol Trolox equivalent per
100 g of samples on dry weight basis (dw). All
determinations were performed in triplicate (n = 3).
Experimental design and statistical analysis.
Response surface methodology (RSM) was used to
investigate the main effects of the process variables
(osmotic treatment temperature, solution
concentration and fruit : solution ratio) on WL, SG,
and TAC during osmotic dehydration of sweet
cherries and to find the optimum parameters of
dehydration. The experimental design adopted was a
central composite rotatable design with three factors
and five levels for each factor [20]. Selection of the
actual factor values was based on the literature. The
independent variable values and their corresponding
levels are presented in Table 1.
The complete design consisted of 17
experimental runs with three replications of the
central point. The generalized second-order
polynomial model used in the response surface
analysis was the following:
n
i
n
jjiiji
n
iiii
n
iio xxbxbxbbY
1 1
2
11(3)
where: Y is the dependent variable (response), xi
and xj are the independent variables (factors), βo, βi,
βii, βij are the regression coefficients for intercept,
linear, quadratic, and interaction terms.
Experimental design data were analysed through the
analysis of variance (Anova) and the F-test at P <
0.1, using the statistical software SYSTAT (SPSS
Inc., Chicago, USA, version 7.1) and Excel
(Microsoft Office, 97, 2003).
RESULTS AND DISCUSSION
The average values for WL, SG, and TAC of the
osmotic dehydrated sweet cherries are presented in
Table 2.
Regression analyses of the water loss, solid gain,
and total antioxidant capacity of osmotically
dehydrated sweet cherries indicated that all second-
order polynomial models correlated well with the
measured data and were statistically significant (p <
0.05).
S. Zhelyazkov et al.: Optimization of osmotic dehydration parameters for sweet cherries (Prunus avium) using …
503
Table 1. Central composite rotatable design in coded form and natural units of independent variables
Run
№
Osmotic treatment
temperature - X1 (°C)
Solution concentration
X2 (°Brix)
Fruit : solution ratio
X3 (w/w)
1. 50 (-) 50 (-) 1:3 (-)
2. 70 (+) 50 (-) 1:3 (-)
3. 50 (-) 60 (+) 1:3 (-)
4. 70 (+) 60 (+) 1:3 (-)
5. 50 (-) 50 (-) 1:5 (+)
6. 70 (+) 50 (-) 1:5 (+)
7. 50 (-) 60 (+) 1:5 (+)
8. 70 (+) 60 (+) 1:5 (+)
9. 43 (-1.68) 55 (0) 1:4 (0)
10. 77 (+1.68) 55 (0) 1:4 (0)
11. 60 (0) 47 (-1.68) 1:4 (0)
12. 60 (0) 63 (+1.68) 1:4 (0)
13. 60 (0) 55 (0) 1:2 (-1.68)
14. 60 (0) 55 (0) 1:6 (+1.68)
15. 60 (0) 55 (0) 1:4 (0)
16. 60 (0) 55 (0) 1:4 (0)
17. 60 (0) 55 (0) **1:4 (0)
The resulting models, after removing the non-
significant terms, were evaluated in terms of
uncoded factors and are presented below:
WL = 564.81 – 6.74X1 – 16.33X2 + 0.07X12 +
0.18X22 – 0.64X2X3, % (R2 = 0.97) (4)
SG = 20.13 – 1.38X1 + 0.87X2 + 0.02X1X2 +
1.03X32, % (R2 = 0.93) (5)
TAC = 74452.7 + 2313.57X1 – 4089.52X2 –
15.94X12, µmol TE/100g (R2 = 0.93) (6)
It was found that the osmotic treatment
temperature and solution concentration were the
most significant factors affecting the water loss,
solids gain, and total antioxidant capacity. The
effects of the independent variables (osmotic
treatment temperature, solution concentration and
fruit: solution ratio) on the dependent variables (WL,
SG, and TAC) are indicated by the response
surfaces plots (Figs. 2, 3, and 4) developed from the
equation models shown above.
The criterion for estimation of the optimal
osmotic dehydration conditions of sweet cherries
was the achievement of high values of water loss
(WL > 35%), solid gain (SG > 7.5%), and total
antioxidant capacity (TAC > 21000 µmol TE/100 g).
Optimization was carried out by the
superposition of several contour surfaces of
competing responses. The response surface plots
were generated for interaction of two independent
variables (osmotic treatment temperature and
solution concentration), while the value of the third
variable (fruit : solution ratio) remained constant (at
the central value). The best conditions that
correspond to the shaded area obtained by
superimposing contour plots of water loss, solid gain
and total antioxidant capacity, are shown in Figure
5.
S. Zhelyazkov et al.: Optimization of osmotic dehydration parameters for sweet cherries (Prunus avium) using …
504
Table 2. Water loss, solids gain, and total antioxidant capacity of osmotically dehydrated sweet cherries
№ Water loss
Y1 (%)
Solids gain
Y2 (%)
Total antioxidant capacity
Y3 (µmol TE / 100 g dw)
1 28.35 6.84 18982.5
2 58.89 8.83 16804.5
3 44.48 7.14 24304.6
4 74.25 15.62 19832.2
5 31.55 6.16 18540.1
6 56.79 9.54 18201.2
7 33.37 6.57 26811.5
8 60.89 12.63 23750.2
9 30.29 7.28 19198.6
10 72.49 12.07 14894.2
11 37.33 6.34 23773.3
12 51.66 9.11 25325.3
13 35.06 12.19 19417.4
14 35.63 11.25 23890.1
15 34.23 8.47 23174.7
16 35.11 8.32 21470.8
17 34.47 8.43 19723.7
Figure 2. WL (%) depending on X1 (ºC) and X2 (°Brix)
at fruit : solution ratio 1:4 (w:w). Figure 3. SG (%) depending on X1 (ºC) and X2
(°Brix) at fruit : solution ratio 1:4 (w:w).
S. Zhelyazkov et al.: Optimization of osmotic dehydration parameters for sweet cherries (Prunus avium) using …
505
Figure 4. TAC (µmol TE/100 g) depending on X1 (ºC)
and X2 (°Brix) at fruit : solution ratio 1:4 (w:w).
Figure 5. Superposition area of the responses as an
effect of the treatment temperature (X1) and solution
concentration (X2) on the osmotic dehydration of sweet
chokeberry.
CONCLUSION
Response surface methodology was used for a
quantitative study on the effects of process variables
on water loss, solid gain, and total antioxidant
capacity of osmotic-dehydrated cherry fruits.
Optimization was carried out by the superposition of
several contour surfaces of competing responses.
The criterion to determine the optimal osmotic
dehydration conditions of sweet cherries was the
achievement of high values of water loss (WL >
35%), solid gain (SG > 7.5%), and total antioxidant
capacity (TAC > 21000 µmol TE/100 g). Results
from the present study showed that the osmotic
treatment temperature and solution concentration
had a significant effect on the mass transfer (water
loss and solid gain) and the total antioxidant
capacity. The increase of the osmotic treatment
temperature resulted in degradation of the
biologically active components and, respectively, in
decreased total antioxidant capacity. The application
of response surface methodology proved to be very
efficient for the optimization of osmotic dehydration
of sweet cherries.
Acknowledgements: This work is supported by the
Bulgarian Ministry of Education and Science under
the National Program for Research "Young
Scientists and Postdoctoral Students". This program
was approved by RMS № 577 from 17.08.2018.
REFERENCES
1. V. Usenik, J. Fabčič, F. Štampar, Food Chemistry,
107, 185 (2008).
2. G. Ferretti, T. Bacchetti, A. Belleggia, D. Neri,
Molecules, 15, 6993 (2010).
3. V. Usenik, N. Fajt, M. Mikulic-Petkovsek, A.
Slatnar, F. Stampar, R. Veberic, J. Agric. Food
Chem., 58, 4928 (2010).
4. H. Kelebek, S. Selli, Int. J. Food Sci.Technol., 46,
2530 (2011).
5. S.-Y. Kang, N. Seeram, M. Nair, L. Bourquin, J.
Crohn's Colitis, 7, 202 (2003).
6. R. Jacob, G. M. Spinozzi, V. A. Simon, D. S. Kelley,
R. Prior, B. Hess-Pierce, J. Nutrition, 133, 1826
(2003).
7. D.-O. Kim, H. Heo, Y. Kim, H. Yang, C. Lee, J.
Agric. Food Chem., 53, 9921 (2005).
8. J. Alakali, C. Ariahu, N. Nkpa, J. Food Process.
Preservation, 30, 597 (2006).
9. H. Lazarides, K. Petrotos, J. Food Eng., 49, 201
(2001).
10. Â. El-Aouar, P. Azoubel, F. Murr, J. Food Eng., 75,
267 (2006).
11. A. İspir, İ. Toğrul, Chem. Eng. Research Design, 87,
166 (2009).
12. K. Falade, J. Igbeka, F. Ayanwuyi, J. Food Eng., 80,
979 (2007).
13. C. Tortoe, African J. Food Sci., 4, 303 (2010).
14. E. Devic, S. Guyot, J.-D. Daudin, C. Bonazzi, J.
Agric. Food Chem., 58, 606 (2010).
15. M. Khan, Pakistan J. Food Sci., 22, 71 (2012).
16. J. Ponting, G. Walters, R. Forrey, R. Jackson, W.
Stanley, Food Technol., 20, 125 (1966).
17. İ. Eren, F. Kaymak-Ertekin, J. Food Eng., 79, 344
(2007).
18. F. Kaymak-Ertekin, M. Sultanoğlu, J. Food Eng., 46,
243 (2000).
19. W. Brand-Williams, M. Cuvelier, C. Berset, LWT –
Food Sci. Technol., 28, 25 (1995).
20. P. Haaland, Experimental Design in Biotechnology.
CRC Press, 1989, ISBN 9780824778811.