Page 1
ISSN: 2348 9510
International Journal Of Core Engineering & Management (IJCEM)
Volume 2, Issue 3, June 2015
229
Optimization of Reactive Power by Using SVC and
TCSC Devices for Reducing Transmission Losses
Kuldeep G, Thakre 1 Dr. Z. J. Khan
2
1Department of electrical engineering, RCERT, Gondwana University, Chandrapur,
Maharashtra, 442403, India
[email protected]
2 Department of electrical engineering, RCERT, Gondwana University, Chandrapur,
Maharashtra, 442403, India
[email protected]
Abstract
In general the optimization of reactive power is viewed from two aspects: load compensation
and voltage support. This is utilized to reduce the total system active power loss or voltage
deviation as an objective to compute optimal settings of reactive power output or terminal
voltages of generating plants, transformer tap settings and output of other compensating
devices such as synchronous condensers and capacitor banks. This paper has considered the
setting of flexible AC transmission system (FACTS) devices as additional control parameters
using Newton Raphson technique and the impact on system loss reduction in power system.
Static models of two FACTS devices consisting of static var compensator (SVC), thyristor
controlled series compensator (TCSC) have been included in the problem formulation. The
proposed algorithm has been applied to 9-bus test system and IEEE 14-bus system.
Keyword: Reactive power, SVC, TCSC
I. Introduction
Almost all bulk electric power is generated, transmitted and consumed in an alternating current
(AC) network. Elements of AC systems produce and consume two kinds of power: active power
(measured in watts) and reactive power (measured in volt-amperes reactive, or var). Active
power accomplishes useful work (e.g., running motors and lighting lamps). Reactive power
supports the voltages that must be controlled for system reliability.
It is expected that the secure, efficient and economical operation of power system will become
more difficult because of more complex power flow in the future. As a result, the cost reduction
and efficiency improvement are needed not only for the power plant operation but also for the
power system operation.
Page 2
ISSN: 2348 9510
International Journal Of Core Engineering & Management (IJCEM)
Volume 2, Issue 3, June 2015
230
Voltage profile is improved by controlling the production, absorption and flow of reactive power
throughout the network. Reactive power flows are minimized so as to reduce system losses.
Transmission losses can be calculated based on the natural properties of components in the
power system: resistance, reactance, capacitance, voltage, current, and power, which are
routinely calculated by utility companies as a way to specify what components will be added to
the systems, in order to reduce losses and improve the voltage levels.
The centralized voltage reactive control is one such control which can help not only to keep the
system voltages within specified limits but also to preserve the reactive power balances for
enhanced security and to decrease the transmission losses for the efficient system operation.
Power flow solution is a solution of the network under steady state conditions subjected to
certain constraints under which the system operates. The power flow solution gives the nodal
voltages and phase angle given a set of power injections at all buses and specified voltages.
Voltage regulation is achieved by controlling the production, absorption and flow of reactive
power throughout the network. Reactive power flows are minimized so as to reduce system
losses. Sources and sinks of reactive power, such as shunt capacitors, shunt reactors, rotating
synchronous condensers and SVC’s are used for this purpose. Thyristor Controlled series
Compensators are versatile devices that controls the reactive power injection at a bus using
power electronic switching components. The reactive source is usually a combination of reactors
and capacitors.
The proposed power flow algorithm for reduction of transmission loss incorporating TCSC and
SVC devices is independent of the system size. The algorithm uses Newton-Raphson technique.
II. Power Flow Control The power transmission line can be represented in power system from bus ―p‖ to ―q‖. The active
power transmitted betweens bus p and q is given by:
P =Vp Vq
X sin(δp − δq) …(1)
Where Vp and Vq are the voltages at the buses, ( δp-δq) is the angle between the voltages
and X is the line impedance.
The power flow can be controlled by altering the voltages at a node, the impedance between
the buses and the angle between the end voltages. The reactive power transmitted betweens bus p
and q is given by:
Q =Vp 2
X−
VpVq
X cos δp − δq …(2)
Page 3
ISSN: 2348 9510
International Journal Of Core Engineering & Management (IJCEM)
Volume 2, Issue 3, June 2015
231
NEWTON-RAPHSON Technique
The Newton- Raphson technique has proved most successful owing to its strong convergence
characteristics. The power flow Newton-Raphson algorithm is expressed by using Jacobian
matrix.
∆𝑃∆𝑄
= 𝐽1 𝐽2𝐽3 𝐽4
∗ ∆𝛿∆𝑉
…(3)
Where ΔP and ΔQ are change in active and reactive power, while δ and V are bus magnitude and
angle, respectively.
Jacobian is the matrix of partial derivatives of real and reactive power with respect to the
voltage magnitude and angles.
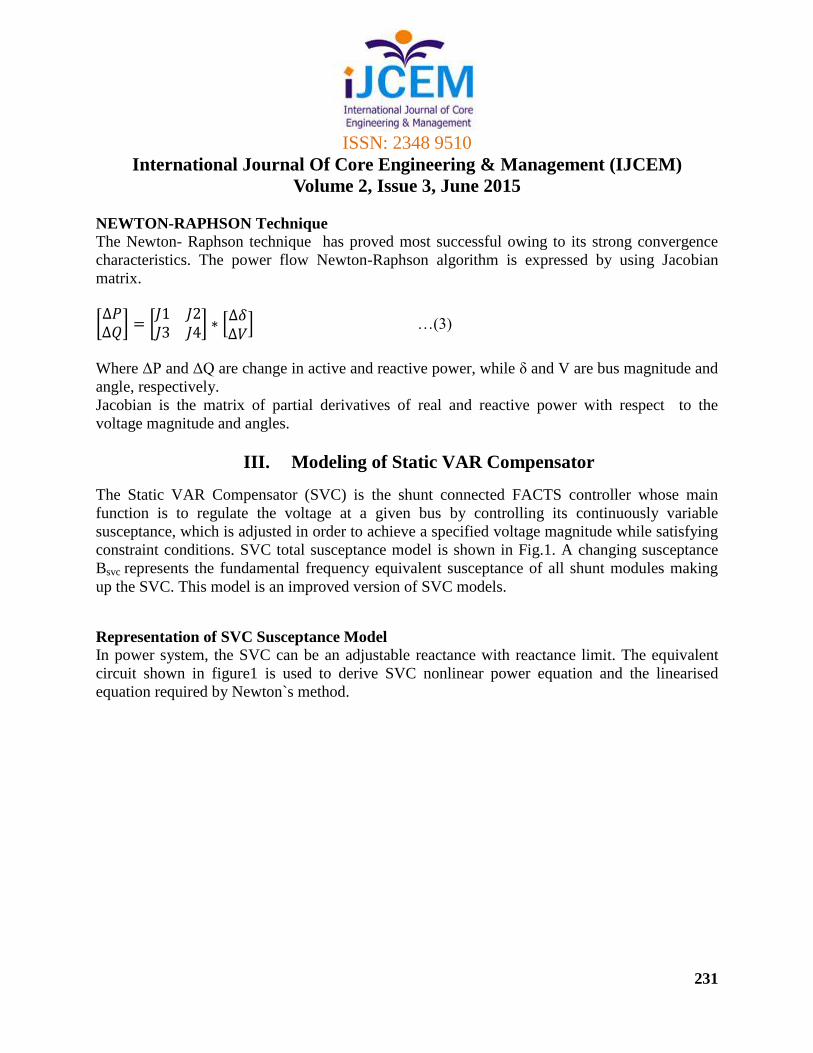
III. Modeling of Static VAR Compensator
The Static VAR Compensator (SVC) is the shunt connected FACTS controller whose main
function is to regulate the voltage at a given bus by controlling its continuously variable
susceptance, which is adjusted in order to achieve a specified voltage magnitude while satisfying
constraint conditions. SVC total susceptance model is shown in Fig.1. A changing susceptance
Bsvc represents the fundamental frequency equivalent susceptance of all shunt modules making
up the SVC. This model is an improved version of SVC models.
Representation of SVC Susceptance Model
In power system, the SVC can be an adjustable reactance with reactance limit. The equivalent
circuit shown in figure1 is used to derive SVC nonlinear power equation and the linearised
equation required by Newton`s method.
Page 4
ISSN: 2348 9510
International Journal Of Core Engineering & Management (IJCEM)
Volume 2, Issue 3, June 2015
232
Vp
Isvc
Bsvc
Fig 1. Variable shunt susceptance
Current drawn by the SVC is
Isvc = jBsvc Vp …(4)
and the reactive power drawn by the SVC, which is injected reactive power at bus p
Qsvc= Qp= -V2Bsvc …(5)
The equivalent susceptance Bsvc is taken to be
∆𝑃𝑝∆𝑄𝑝
= 0 00 𝑄𝑝
𝑥 ∆𝛿𝑝
∆𝐵𝑠𝑣𝑐/𝐵𝑠𝑣𝑐 …(6)
The variable susceptance Bsvc is updated according to
B(i)
svc=B(i-1)
svc +(ΔBsvc/Bsvc)(i)
x B(i-1)
svc …(7)
The changing susceptance represents the total SVC susceptance necessary to maintain the nodal
voltage magnitude.
IV. Modeling of Thyristor Controlled Series Compensator
The TCSC is based on the concept of a variable series reactance, the value of which is adjusted
automatically to constraint the power flow across the branch to specified value. The amount of
Page 5
ISSN: 2348 9510
International Journal Of Core Engineering & Management (IJCEM)
Volume 2, Issue 3, June 2015
233
reactance is determined efficiently using Newton’s method. The changing XTCSC is shown in fig
2.
Fig 2. TCSC model with series reactance
The transfer admittance matrix of the variable series compensator is given by
𝐼𝑝𝐼𝑞
= 𝑗𝐵𝑝𝑝 𝑗𝐵𝑝𝑞𝑗𝐵𝑞𝑝 𝑗𝐵𝑞𝑞
𝑥 𝑉𝑝𝑉𝑞
…(8)
For the inductive operation
𝐵𝑝𝑝 = 𝐵𝑞𝑞 = −1
𝑋𝑡𝑐𝑠𝑐 …(9a)
𝐵𝑝𝑞 = 𝐵𝑞𝑝 = 1
𝑋𝑡𝑐𝑠𝑐. …(9b)
The Active and Reactive power equation for bus P are
Pp=VpVq Bpq sin(δp-δq) (10a)
Qp=-Vp2Bpp-VpVqBpqcos(δp-δq) (10b)
The series reactance ΔXtcsc is the incremental change in the reactance.
ΔXtcsc=X(i)
tcsc – X(i-1)
tcsc …(11)
Updating the XTCSC of the series reactance is given by
X(i)
tcsc = X(i-1)
tcsc + (ΔXtcsc/Xtcsc)(i)
X(i-1)
tcsc …(12)
Page 6
ISSN: 2348 9510
International Journal Of Core Engineering & Management (IJCEM)
Volume 2, Issue 3, June 2015
234
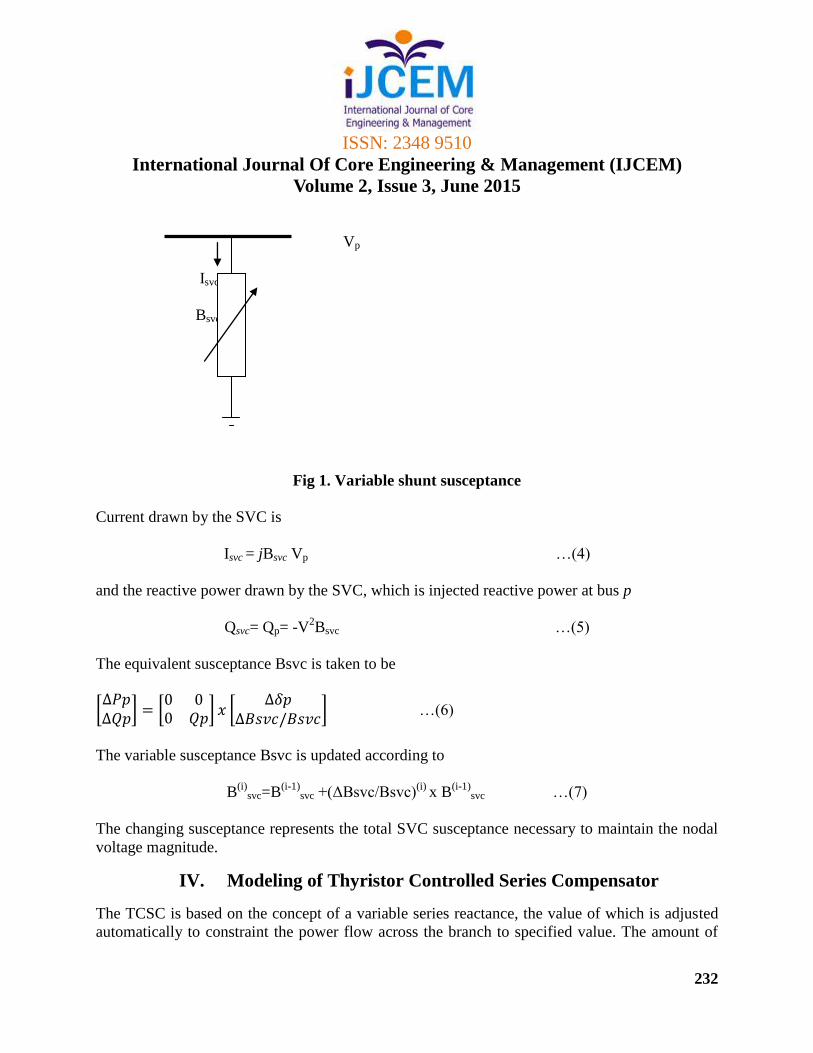
Star
t
Prepare network input data
& SVC /TCSC input data
Formation of Admittance Matrix
Y bus
Set iteration counter k=0
Calculate Real & Reactive power
Calculate Real & Reactive power
with SVC / TCSC
Calculate power mismatch and power
mismatch with SVC / TCSC
Test for
covergence ΔP =ε
ΔQ = ε
Formation of jacobian Matrix J
𝛥𝑃𝛥𝑄
= 𝐽1 𝐽2𝐽3 𝐽4
∗ ∆𝛿∆|𝑉|
Determine the voltage correction
Calculate the new bus voltages Vp
K+1 = VpK + ΔVp
K
δpK+1 = δp
K + ΔδpK
Greater
K=K+1
Calculate
Total
Power
Loss
Stop
Equal or less
Page 7
ISSN: 2348 9510
International Journal Of Core Engineering & Management (IJCEM)
Volume 2, Issue 3, June 2015
235
Fig 3. Flow chart for N-R Method with SVC/TCSC
V. Simulation and Result
Case-I: 9 Bus Test System
9-bus test system is used to assess the effectiveness of SVC and TCSC models for reduction of
transmission loss. The 9 bus test system consists of 3 generator, 9 buses, 9 branches with 230kV
and 100MVA base. The system data is taken from [9].
The placement of SVC has been considered at load buses only SVC is connected at bus 5, bus 6
and at bus 8. TCSC connected between line 9-8, 7-8, and between line 4-6.
Fig. 4. 9-bus test System.
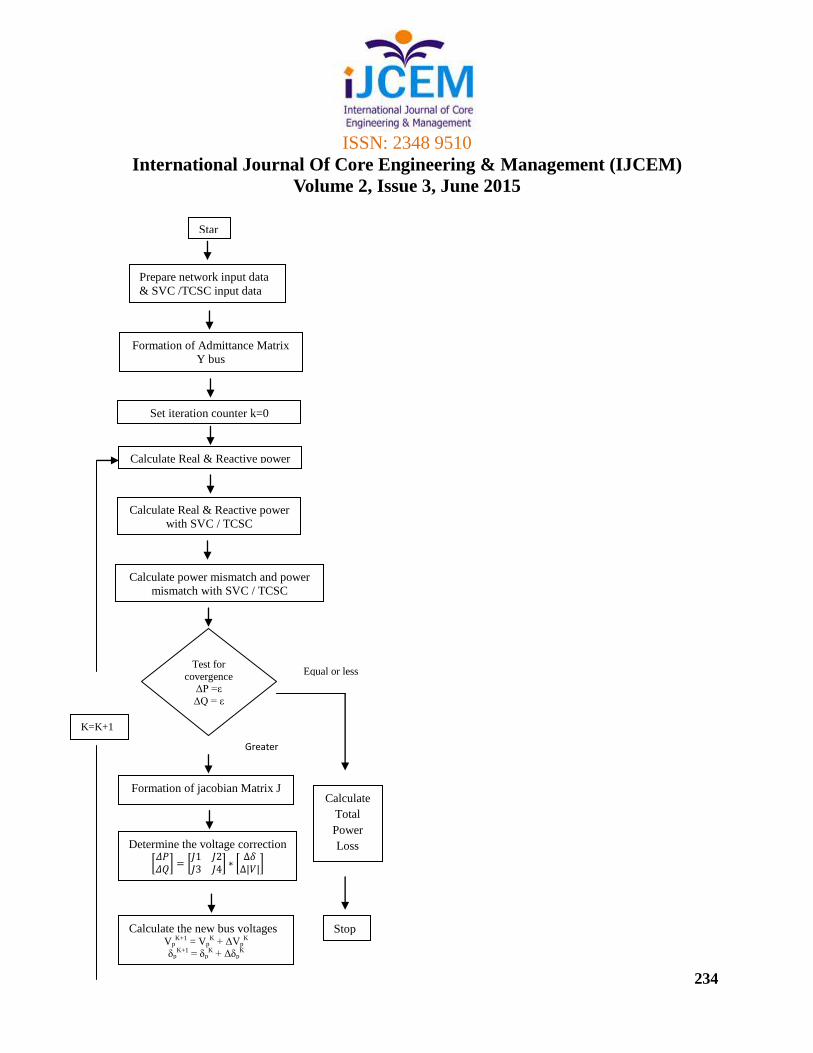
The SVC absorbs 27.4595MVAr from the bus 8 and keeps the magnitude of voltage at 1 pu. The
convergence is obtained after 5 iteration and Bsvc is measured -0.2746 pu.
When SVC is connected to the bus 6 then it absorbs 15.2861MVAr and keeps the voltage at that
bus is 1.0 pu and Bsvc equal to -0.1529 pu.
The SVC inject 1.4707MVAr into the bus 5 the transmission loss reduces to 4.5858MW which is
more effective than the SVC connected at bus 8 and Bus 6.
Replaced VpK by Vp
K+1
and δpK by δp
K+1
Page 8
ISSN: 2348 9510
International Journal Of Core Engineering & Management (IJCEM)
Volume 2, Issue 3, June 2015
236
Table1
Voltage magnitude and phase angle for 9bus system with and without SVC
Base case SVC at bus 8 SVC at bus 6 SVC at bus 5
Ploss5.2996 4.7732 4.6876 4.5858
Qsvc 27.4595 15.2861 -1.4707
B = -0.2746 -0.1529 0.0147
B
u
s
|V|
(V)
δ
Degr
ee
|V|
(V)
Δ
Degre
e
|V|
(V)
δ
Degre
e
|V|
(V)
δ
Degre
e
1 1.04 0 1.04 0 1.04 0 1.0400 0
2 1.025 9.16 1.025 9.34 1.025 9.16 1.0250 9.1642
3 1.025 4.63 1.025 4.73 1.025 4.64 1.0250 4.6396
4 1.027 -2.21 1.024 -2.22 1.022 -2.22 1.0276 -2.211
5 0.998 -3.98 0.99 -3.99 0.994 -4.01 1.0000 -3.982
6 1.014 -3.68 1.01 -3.69 1.00 -3.63 1.0145 -3.681
7 1.0315 3.63 1.023 3.77 1.03 3.62 1.0318 3.6367
8 1.020 0.68 1.00 0.81 1.02 0.67 1.0202 0.6908
9 1.033 1.94 1.027 2.01 1.03 1.9406 1.0340 1.9459
Table 2
Comparison of results
Matlab Programming Power World Simulator
Power
loss
(MW)
Qsvc
MVAr
Power loss
(MW)
Qsvc
MVAr
Base case 5.2996 - 5.6 -
SVC at bus 8 4.7732 27.4595 4.9 30.5
SVC at bus 6 4.6876 15.2861 4.7 15.1
SVC at bus 5 4.5858 -1.4707 4.7 -1.5
Page 9
ISSN: 2348 9510
International Journal Of Core Engineering & Management (IJCEM)
Volume 2, Issue 3, June 2015
237
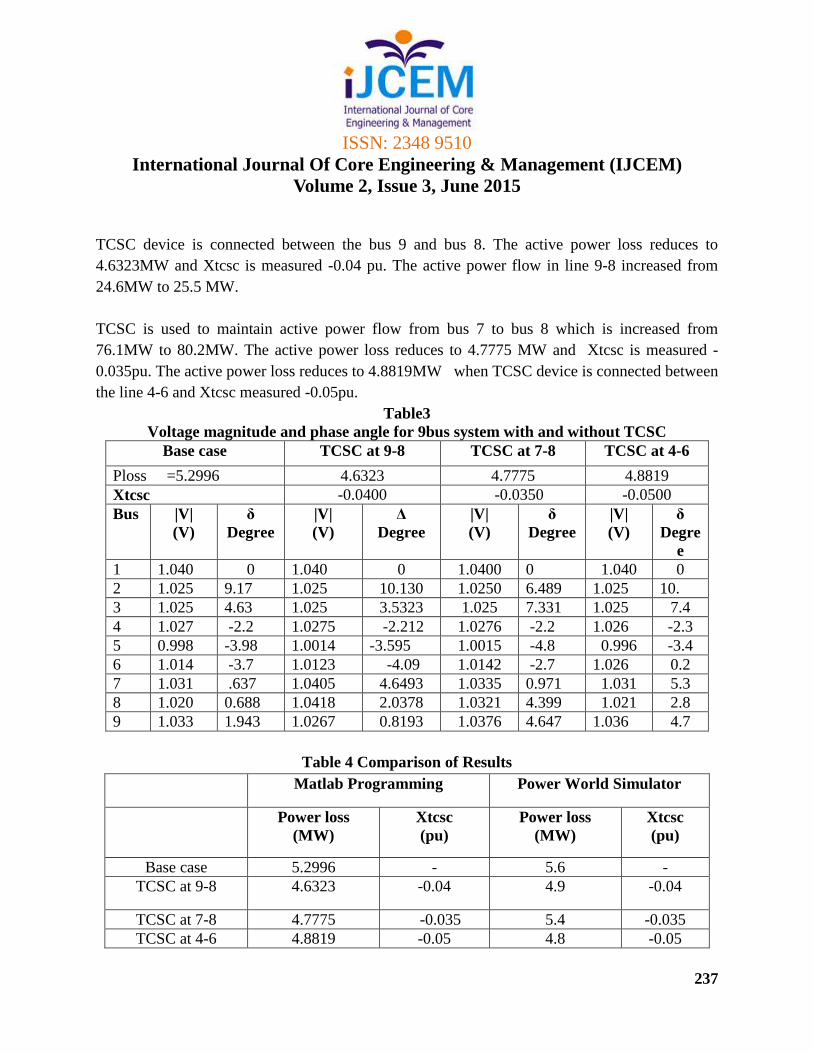
TCSC device is connected between the bus 9 and bus 8. The active power loss reduces to
4.6323MW and Xtcsc is measured -0.04 pu. The active power flow in line 9-8 increased from
24.6MW to 25.5 MW.
TCSC is used to maintain active power flow from bus 7 to bus 8 which is increased from
76.1MW to 80.2MW. The active power loss reduces to 4.7775 MW and Xtcsc is measured -
0.035pu. The active power loss reduces to 4.8819MW when TCSC device is connected between
the line 4-6 and Xtcsc measured -0.05pu.
Table3
Voltage magnitude and phase angle for 9bus system with and without TCSC
Base case TCSC at 9-8 TCSC at 7-8 TCSC at 4-6
Ploss =5.2996 4.6323 4.7775 4.8819
Xtcsc -0.0400 -0.0350 -0.0500
Bus |V|
(V)
δ
Degree
|V|
(V)
Δ
Degree
|V|
(V)
δ
Degree
|V|
(V)
δ
Degre
e
1 1.040 0 1.040 0 1.0400 0 1.040 0
2 1.025 9.17 1.025 10.130 1.0250 6.489 1.025 10.
3 1.025 4.63 1.025 3.5323 1.025 7.331 1.025 7.4
4 1.027 -2.2 1.0275 -2.212 1.0276 -2.2 1.026 -2.3
5 0.998 -3.98 1.0014 -3.595 1.0015 -4.8 0.996 -3.4
6 1.014 -3.7 1.0123 -4.09 1.0142 -2.7 1.026 0.2
7 1.031 .637 1.0405 4.6493 1.0335 0.971 1.031 5.3
8 1.020 0.688 1.0418 2.0378 1.0321 4.399 1.021 2.8
9 1.033 1.943 1.0267 0.8193 1.0376 4.647 1.036 4.7
Table 4 Comparison of Results
Matlab Programming Power World Simulator
Power loss
(MW)
Xtcsc
(pu)
Power loss
(MW)
Xtcsc
(pu)
Base case 5.2996 - 5.6 -
TCSC at 9-8 4.6323 -0.04 4.9 -0.04
TCSC at 7-8 4.7775 -0.035 5.4 -0.035
TCSC at 4-6 4.8819 -0.05 4.8 -0.05
Page 10
ISSN: 2348 9510
International Journal Of Core Engineering & Management (IJCEM)
Volume 2, Issue 3, June 2015
238
Case-II: IEEE 14 Bus System
This method is extended to the IEEE 14 bus system. The SVC device is connected to the bus 14
and bus 4. TCSC device is connected between the line 12-13 and line10-11 [3].
Fig 5. : IEEE 14 bus system
Table 5
Voltage magnitude and phase angle for IEEE 14bus system with and without SVC
Base Case SVC at Bus 4 SVC at 14
Ploss = 16.0811 Ploss = 13.7587 Ploss = 13.5183
Qsvc = 46.4601 Qsvc = 8.4664
Bus |V|
(V)
δ
Degree
|V|
(V)
δ
Degree
|V|
(V)
δ
Degree
1 1.060 0 1.060 0 1.0600 0
2 1.045 -5.4778 1.045 -5.0035 1.0450 -4.9682
3 1.0247 -13.682 1.0100 -12.839 1.0263 -12.8400
4 1.0230 -11.464 1.0000 -10.069 1.0261 -10.3534
5 1.0282 -9.8823 1.0132 -8.7109 1.0308 -8.8944
6 1.0564 -16.813 1.0399 -14.797 1.0515 -14.8254
7 1.0379 -15.626 1.0198 -13.376 1.0379 -13.5153
8 1.0771 -15.626 1.0597 -13.376 1.0772 -13.5153
Page 11
ISSN: 2348 9510
International Journal Of Core Engineering & Management (IJCEM)
Volume 2, Issue 3, June 2015
239
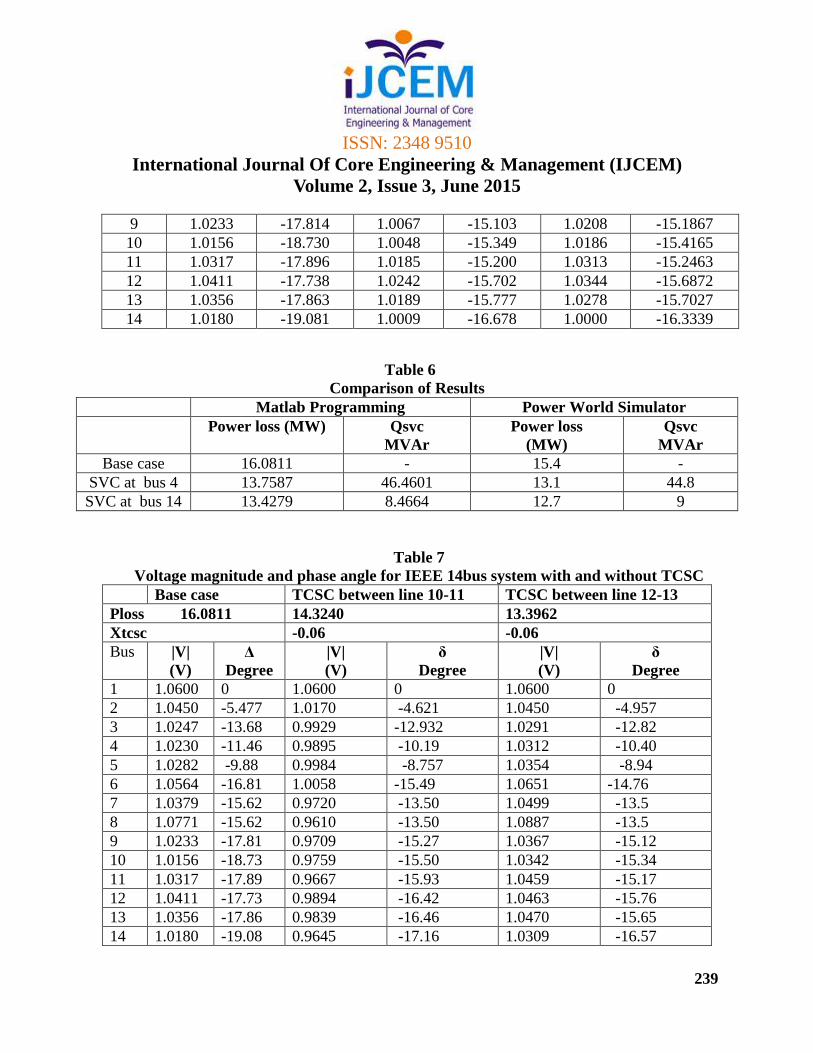
9 1.0233 -17.814 1.0067 -15.103 1.0208 -15.1867
10 1.0156 -18.730 1.0048 -15.349 1.0186 -15.4165
11 1.0317 -17.896 1.0185 -15.200 1.0313 -15.2463
12 1.0411 -17.738 1.0242 -15.702 1.0344 -15.6872
13 1.0356 -17.863 1.0189 -15.777 1.0278 -15.7027
14 1.0180 -19.081 1.0009 -16.678 1.0000 -16.3339
Table 6
Comparison of Results
Matlab Programming Power World Simulator
Power loss (MW) Qsvc
MVAr
Power loss
(MW)
Qsvc
MVAr
Base case 16.0811 - 15.4 -
SVC at bus 4 13.7587 46.4601 13.1 44.8
SVC at bus 14 13.4279 8.4664 12.7 9
Table 7
Voltage magnitude and phase angle for IEEE 14bus system with and without TCSC
Base case TCSC between line 10-11 TCSC between line 12-13
Ploss 16.0811 14.3240 13.3962
Xtcsc -0.06 -0.06
Bus |V|
(V)
Δ
Degree
|V|
(V)
δ
Degree
|V|
(V)
δ
Degree
1 1.0600 0 1.0600 0 1.0600 0
2 1.0450 -5.477 1.0170 -4.621 1.0450 -4.957
3 1.0247 -13.68 0.9929 -12.932 1.0291 -12.82
4 1.0230 -11.46 0.9895 -10.19 1.0312 -10.40
5 1.0282 -9.88 0.9984 -8.757 1.0354 -8.94
6 1.0564 -16.81 1.0058 -15.49 1.0651 -14.76
7 1.0379 -15.62 0.9720 -13.50 1.0499 -13.5
8 1.0771 -15.62 0.9610 -13.50 1.0887 -13.5
9 1.0233 -17.81 0.9709 -15.27 1.0367 -15.12
10 1.0156 -18.73 0.9759 -15.50 1.0342 -15.34
11 1.0317 -17.89 0.9667 -15.93 1.0459 -15.17
12 1.0411 -17.73 0.9894 -16.42 1.0463 -15.76
13 1.0356 -17.86 0.9839 -16.46 1.0470 -15.65
14 1.0180 -19.08 0.9645 -17.16 1.0309 -16.57
Page 12
ISSN: 2348 9510
International Journal Of Core Engineering & Management (IJCEM)
Volume 2, Issue 3, June 2015
240
Table 8
Comparison of Results
VI. Conclusion
The reactive power control and reduction of transmission loss with realization of SVC and TCSC
device is applied to IEEE 9-bus test system and IEEE 14 bus system. The results are compared
with MATLAB and Power World Simulator.
The Newton-Raphson power flow solution method which is capable of solving large power
network reliably is used to calculate transmission system power loss with flexible AC
transmission system (FACTS) devices. The proposed method with FACTS devices are
introduced in conventional power flow problem. It considered SVC and TCSC devices in the
system to reduced total active power loss.
In 9 bus test system, the SVC device connected to the bus 5 is more effective than the SVC
device connected to bus 6 and bus 8 which has reduced power loss to 13.46%. It has also
improved the voltage profile of the system.
With TCSC device connected between bus 9 and bus 8, the power loss has reduced to 12.59%. It
is more effective than the TCSC device connected between the line 7-8 and 4-6.
This method also applied to the IEEE 14 bus system, the SVC device connected to bus 14 is
more effective than the SVC device connected to bus 4 which has reduced power loss to 15.93%.
It has also improved the voltage profile of the system.
Matlab Programming Power World Simulator
Power loss (MW) Xtcsc Power loss
(MW)
Xtcsc
Base case 16.0811 - 15.4 -
TCSC at 10-11 14.3240 -0.06 12.8 -0.05
TCSC at 12-13 13.3962 -0.06 12.9 -0.05
Page 13
ISSN: 2348 9510
International Journal Of Core Engineering & Management (IJCEM)
Volume 2, Issue 3, June 2015
241
With TCSC device connected between line 12-13, the power loss has reduced to 16.69%. It is
more effective than the TCSC device connected between line 10-11.
The SVC and TCSC device are also used to control the power flow of the system.
References
Kumar, G.R. Rao, R.K. Ram, S.S.T. ―Power Flow Control and Transmission Loss
Minimization model with TCSC and SVC for Improving System Stability and Security‖
Industrial and Information Systems, 2008. ICIIS 2008. and the Third international
Conference on Dec. 2008
Mohammad osman Hassan, S.J. Cheng, zakaria Anwar Zakaria,‖ Steady-State Modeling
of SVC and TCSC for power Flow Analysis‖, IMECS 2009 Vol II, March 18-20,2009,
Hong Kong.
Mrinal Ranjan, B. Vedik,‖ Optimal Location of FACTS Devices in power system by
Means of Sensitivity Analysis‖, TECE(1) 1-9,2011.
Preecha Preedavichit, S.C. srivastava ―Optimal reactive power dispatch considering
FACTS Devices‖ electric power system reaserch 46 (1998) 251-257.
N.G. Hingorani, Flexible AC transmission, IEEE Spectrum, April (1993) 40–45.
D. P. Kothari, J. S. Dhillon ―Power System Optimization‖
Enrique Achha, Claudio R. Fuerte-Esquivel, Hugo Ambriz-Perez and Cesar Angeles
Camacho ―FACTS Modeling and Simulation in power Networks‖.
Paul M. Anderson, A. A. Fouad,‖ Power System Control and Stability‖, IEEE press
power engineering series,2003
K. R. C. Mamandur, R. D. Chenoweth, ―Optimal control of reactive power flow for
improvements in voltage profiles and for real power loss minimization‖ IEEE
Transactions on Power Apparatus and Systems, Vol. PAS-I1O, No. 7 July 1981,page no.
3185-3194
S. RamaIyer, R. Ramachandran, S. Hariharan, New technique for optimal reactive power
allocation for loss minimization in power system, IEE Proc. C 130 (4) (1983) 178–182.
J. Carpentier, Optimum power flow—a survey, Int. J. Electric. Power Energy Syst. 1 (1)
(1979) 3–15.
Page 14
ISSN: 2348 9510
International Journal Of Core Engineering & Management (IJCEM)
Volume 2, Issue 3, June 2015
242
Yoshiki Nakachi, Atsushi Kato, Hiroyuki Ukai, ―Voltage / Reactive Power Control
Optimization with Economy and Security using Tabu Search‖
M. Khiat , Chaker , A. Go´mez Expo´ sito , J.L. Martı´nez Ramo ―Reactive power
optimization and voltage control in the Western Algerian transmission system: a hybrid
approach‖,
About the authors
First Author Kuldeep G. Thakre, Diploma in Electrical Engineering (2005), B.E. Electrical,
Electronics & Power (2011), Persuing M.Tech in Energy Management System .
Second Author Dr. Z. J. Khan, B.E.(Electronics & Power),M.Tech.(Electrical),Ph.D, Member
of IEEE, Fellow Institution of Engineers, Member of Computer Society Of India.