1 Optimization of site exploration effort for improving accuracy of tunneling-induced ground settlement prediction Wenping Gong, Zhe Luo, Lei Wang, Hongwei Huang, C. Hsein Juang Clemson University
Transcript
1
Optimization of site exploration effort for improving accuracy of tunneling-induced
ground settlement prediction
Wenping Gong, Zhe Luo, Lei Wang, Hongwei Huang, C. Hsein Juang
Clemson University
2
Outline
Introduction Tunneling-induced ground settlement
prediction Numerical site exploration with MCS A framework to optimize the level of site
exploration effort Illustrative example Conclusions
3
Introduction
Shield tunneling on adjacent utility (Loganathan 2011)
Shield tunneling in Shanghai, China
Shield tunnels are widely adopted in urban areas, and tunneling-induced ground settlement poses a great risk to adjacent infrastructures and utilities.
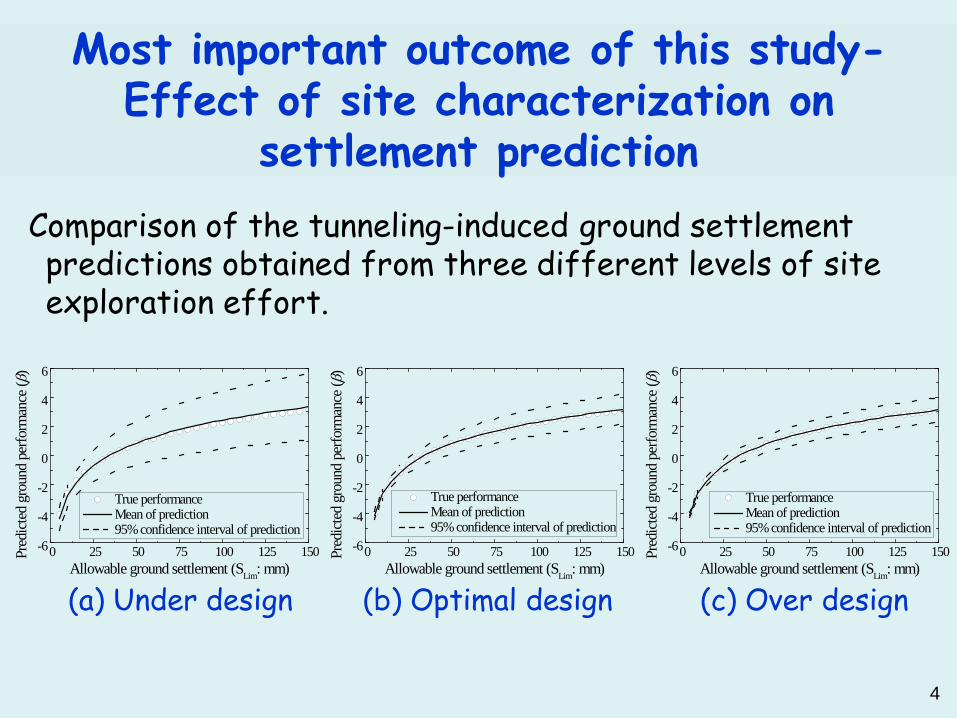
Comparison of the tunneling-induced ground settlement predictions obtained from three different levels of site exploration effort.
4
Most important outcome of this study- Effect of site characterization on
settlement prediction
(a) Under design (b) Optimal design (c) Over design
0 25 50 75 100 125 150-6
-4
-2
0
2
4
6
True performance Mean of prediction 95% confidence interval of prediction
True performance Mean of prediction 95% confidence interval of prediction
Pred
icted
gro
und
perfo
rman
ce (β
)
Allowable ground settlement (SLim: mm)
5
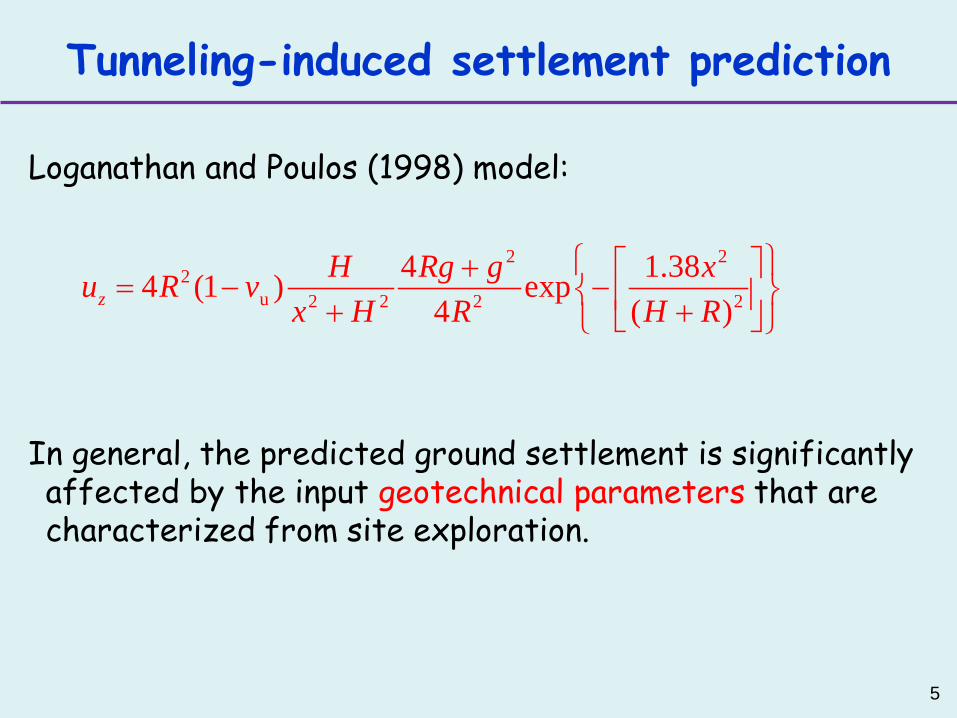
Tunneling-induced settlement prediction
Loganathan and Poulos (1998) model:
In general, the predicted ground settlement is significantly
affected by the input geotechnical parameters that are characterized from site exploration.
2 22
u 2 2 2 2
4 1.384 (1 ) exp4 ( )z
H Rg g xu R vx H R H R
+= − − + +
6
Numerical site exploration with MCS
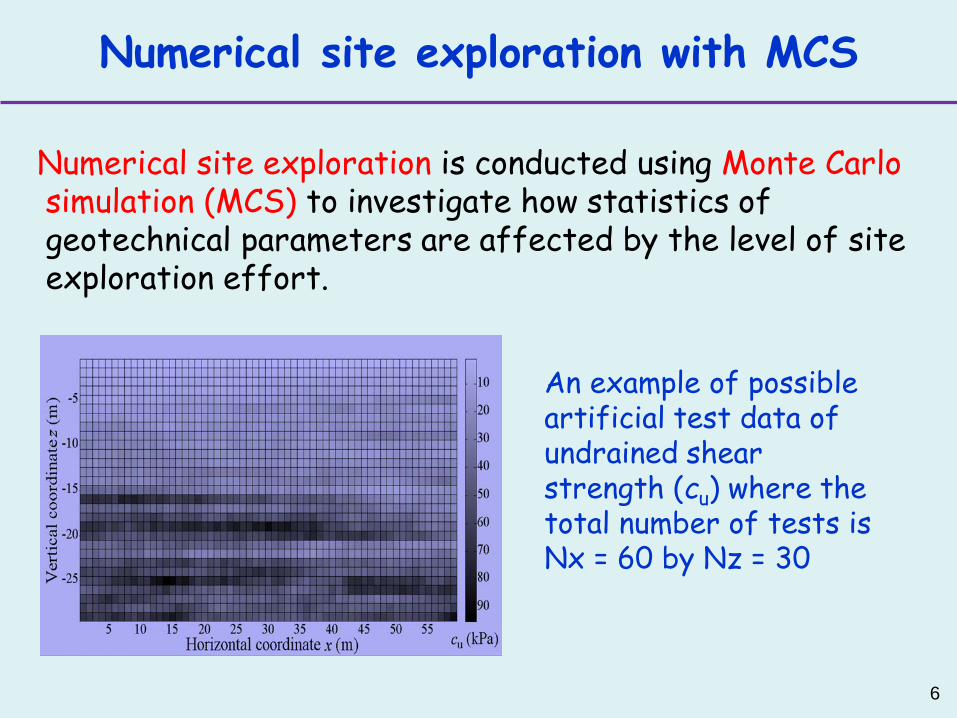
Numerical site exploration is conducted using Monte Carlo simulation (MCS) to investigate how statistics of geotechnical parameters are affected by the level of site exploration effort.
An example of possible artificial test data of undrained shear strength (cu) where the total number of tests is Nx = 60 by Nz = 30
7
Statistical characterization of soil property
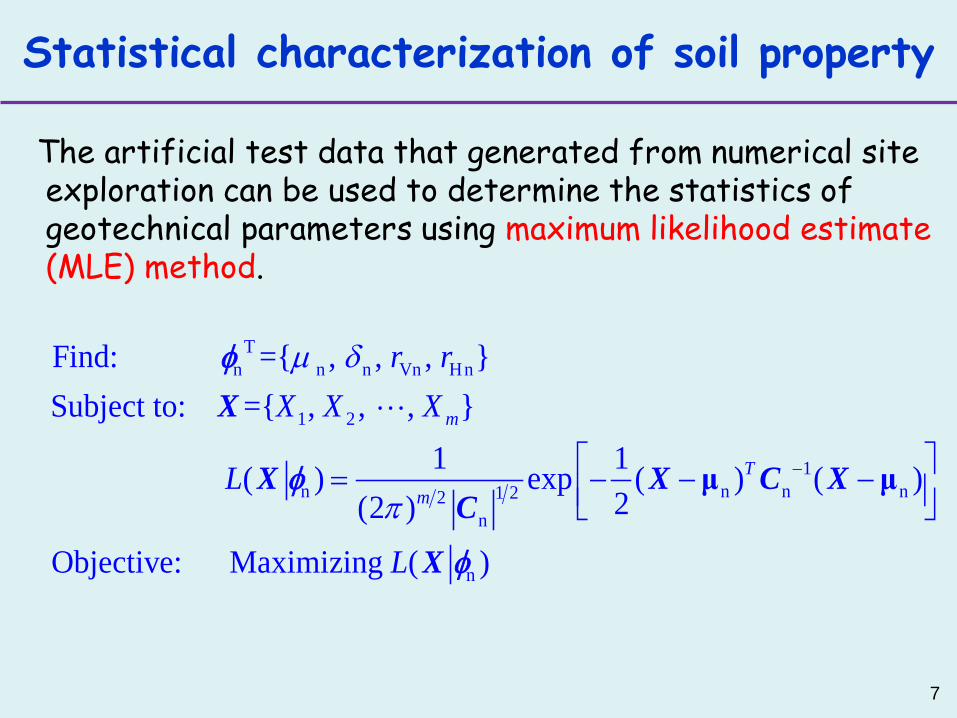
The artificial test data that generated from numerical site exploration can be used to determine the statistics of geotechnical parameters using maximum likelihood estimate (MLE) method.
Tn n n Vn Hn
1 2
1n n n n1 22
n
n
Find: ={ , , , }Subject to: ={ , , , }
1 1 ( ) exp ( ) ( )2(2 )
Objective: Maximizing ( )
m
Tm
r rX X X
L
L
µ δ
π− = − − −
μ μ
φ
φ
φ
X
X X C XC
X
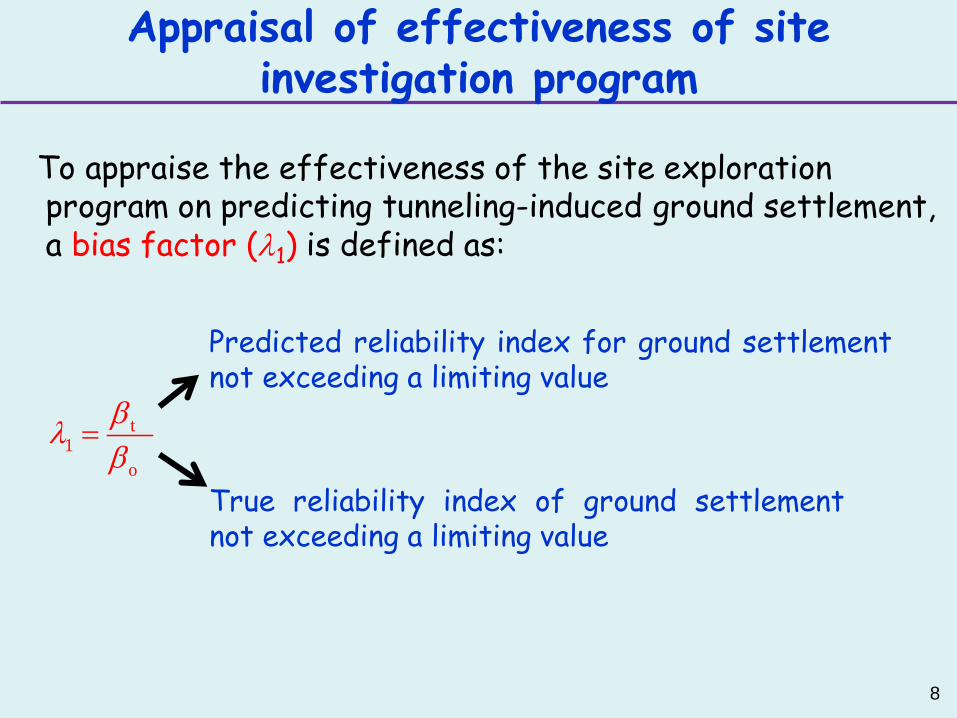
To appraise the effectiveness of the site exploration program on predicting tunneling-induced ground settlement, a bias factor (λ1) is defined as:
8
Appraisal of effectiveness of site investigation program
True reliability index of ground settlement not exceeding a limiting value
t1
o
βλβ
=
Predicted reliability index for ground settlement not exceeding a limiting value
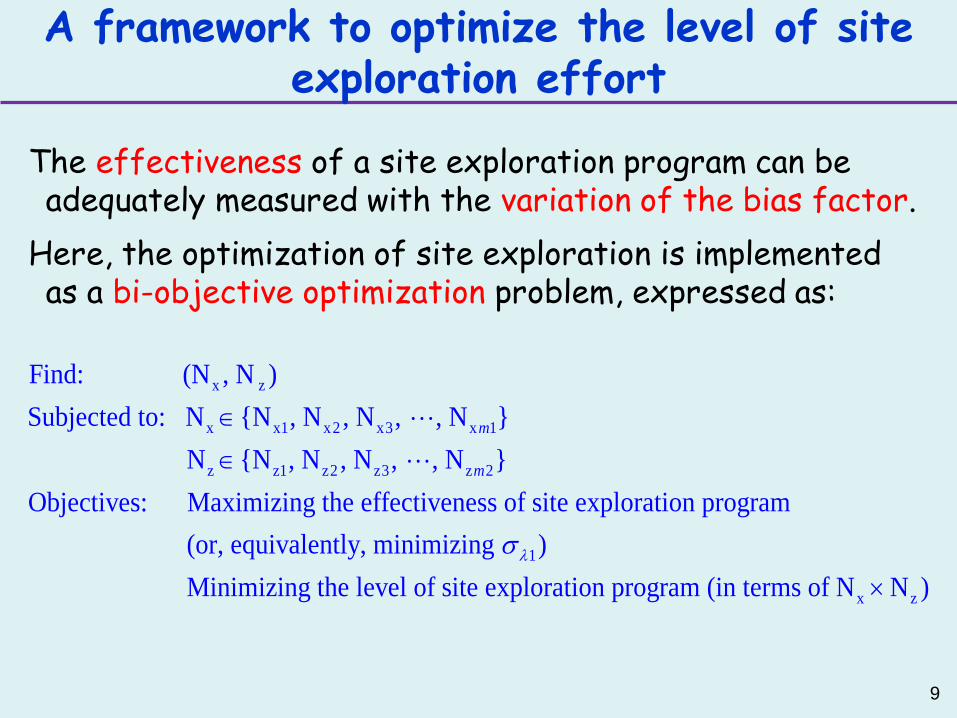
The effectiveness of a site exploration program can be adequately measured with the variation of the bias factor.
Here, the optimization of site exploration is implemented as a bi-objective optimization problem, expressed as:
9
A framework to optimize the level of site exploration effort
x z
x x1 x2 x3 x 1
z z1 z2 z3 z 2
Find: (N , N )Subjected to: N {N , N , N , , N } N {N , N , N , , N }Objectives: Maximizing the effectiveness of site exploration program
m
m
∈∈
1
x z
(or, equivalently, minimizing ) Minimizing the level of site exploration program (in terms of N N )
λσ×
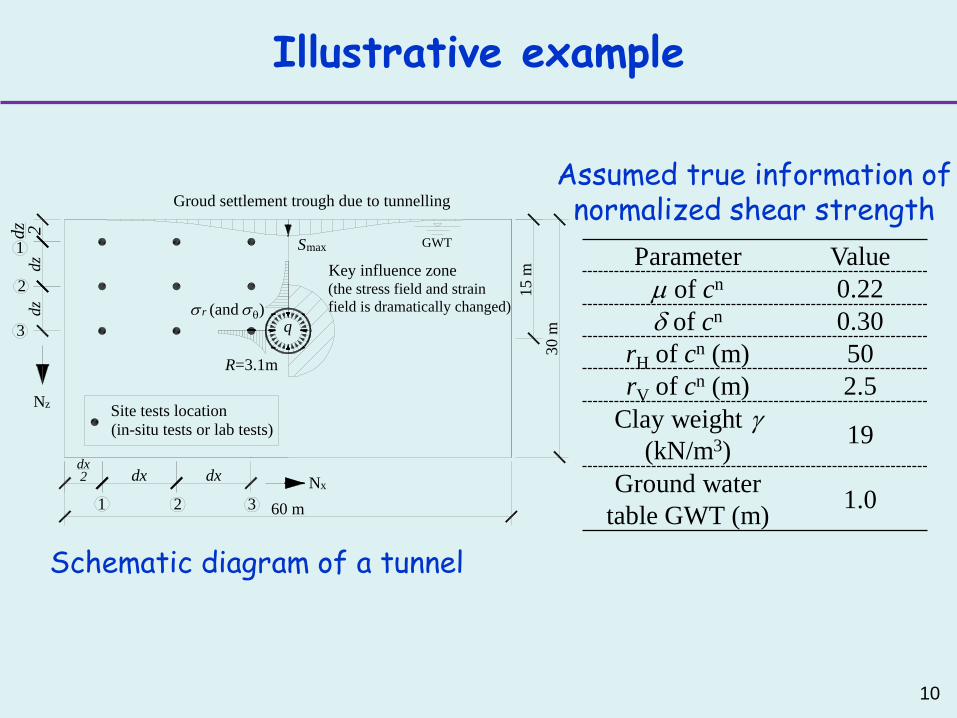
Illustrative example
Schematic diagram of a tunnel
R=3.1m
60 m
30 mq
σ r (and σθ)
15 m
GWTSmax
Groud settlement trough due to tunnelling
dx2 dx
dz 2dz
dz
Nz
1 2
1
2
3
Site tests location(in-situ tests or lab tests)
Key influence zone(the stress field and strainfield is dramatically changed)
Nxdx
3
Parameter Value µ of cn 0.22 δ of cn 0.30
rH of cn (m) 50 rV of cn (m) 2.5
Clay weight γ (kN/m3) 19
Ground water table GWT (m) 1.0
Assumed true information of normalized shear strength
10
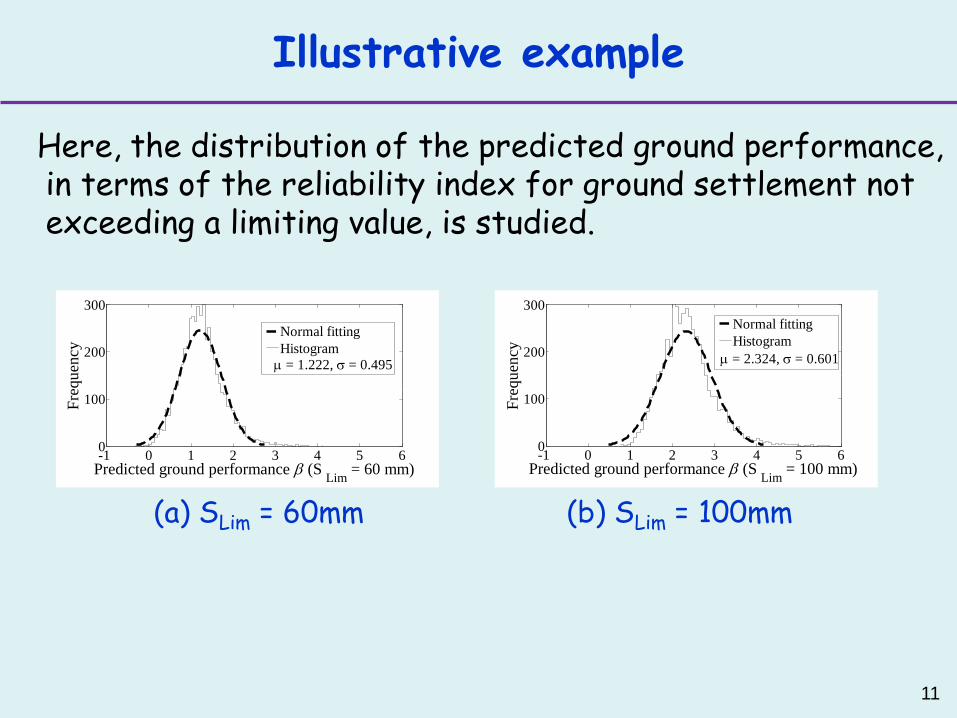
Here, the distribution of the predicted ground performance, in terms of the reliability index for ground settlement not exceeding a limiting value, is studied.
11
Illustrative example
-1 0 1 2 3 4 5 60
100
200
300
Predicted ground performance β (S Lim = 60 mm)
Freq
uenc
y
Normal fittingHistogramµ = 1.222, σ = 0.495
-1 0 1 2 3 4 5 60
100
200
300
Predicted ground performance β (S Lim = 100 mm)
Freq
uenc
y
Normal fittingHistogram
µ = 2.324, σ = 0.601
(a) SLim = 60mm (b) SLim = 100mm
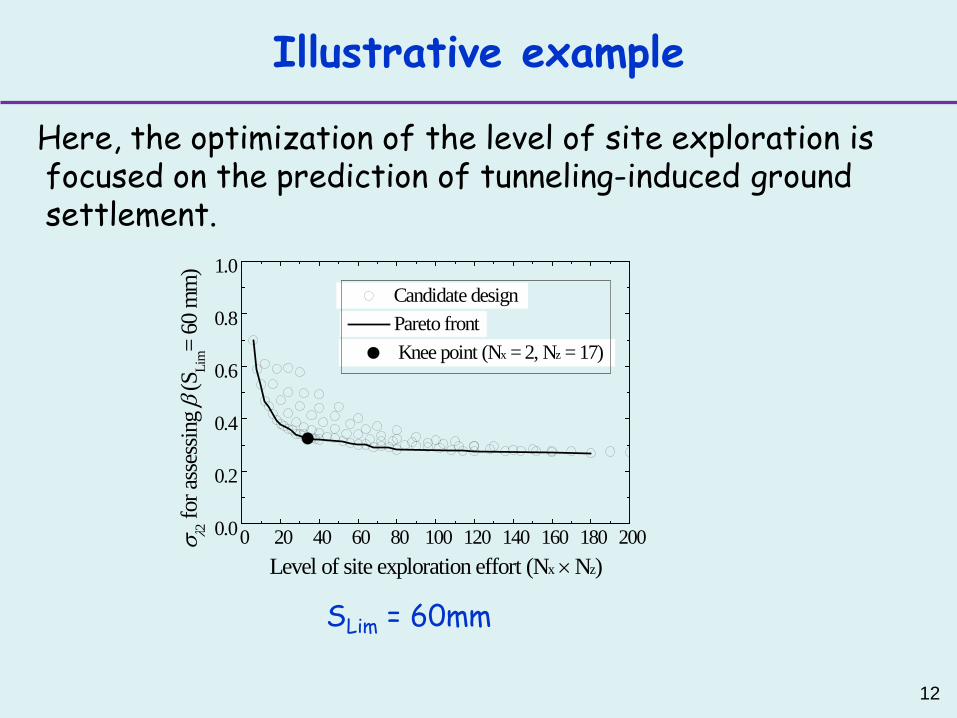
Here, the optimization of the level of site exploration is focused on the prediction of tunneling-induced ground settlement.
12
Illustrative example
0 20 40 60 80 100 120 140 160 180 2000.0
0.2
0.4
0.6
0.8
1.0 Candidate design
σ λ2 fo
r ass
essin
g β
(SLi
m=
60 m
m)
Level of site exploration effort (Nx × Nz)
Pareto front Knee point (Nx = 2, Nz = 17)
SLim = 60mm
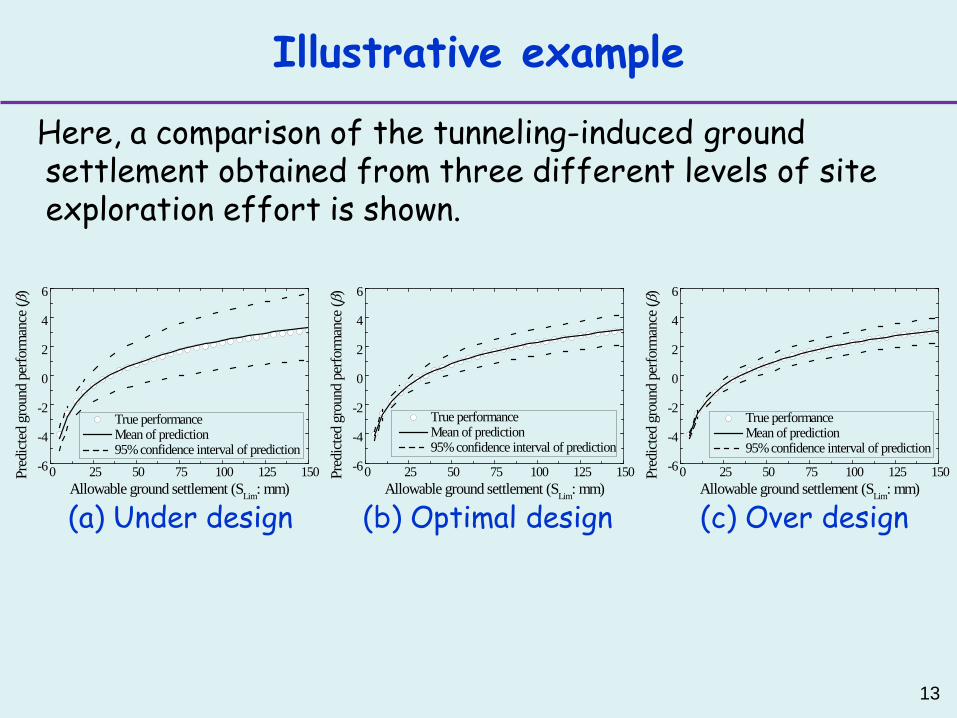
Here, a comparison of the tunneling-induced ground settlement obtained from three different levels of site exploration effort is shown.
13
Illustrative example
(a) Under design (b) Optimal design (c) Over design 0 25 50 75 100 125 150-6
-4
-2
0
2
4
6
True performance Mean of prediction 95% confidence interval of prediction
True performance Mean of prediction 95% confidence interval of prediction
Pred
icted
gro
und
perfo
rman
ce (β
)
Allowable ground settlement (SLim: mm)
14
Conclusions
• The results presented in this paper show that the proposed framework to optimize site exploration program is effective.
• In the multi-objective optimization of site exploration, a trade-off relationship is generally observed between the desire to maximize site exploration effectiveness and the desire to minimize site exploration effort. The best compromise is an optimal design represented by the knee point on the Pareto front.