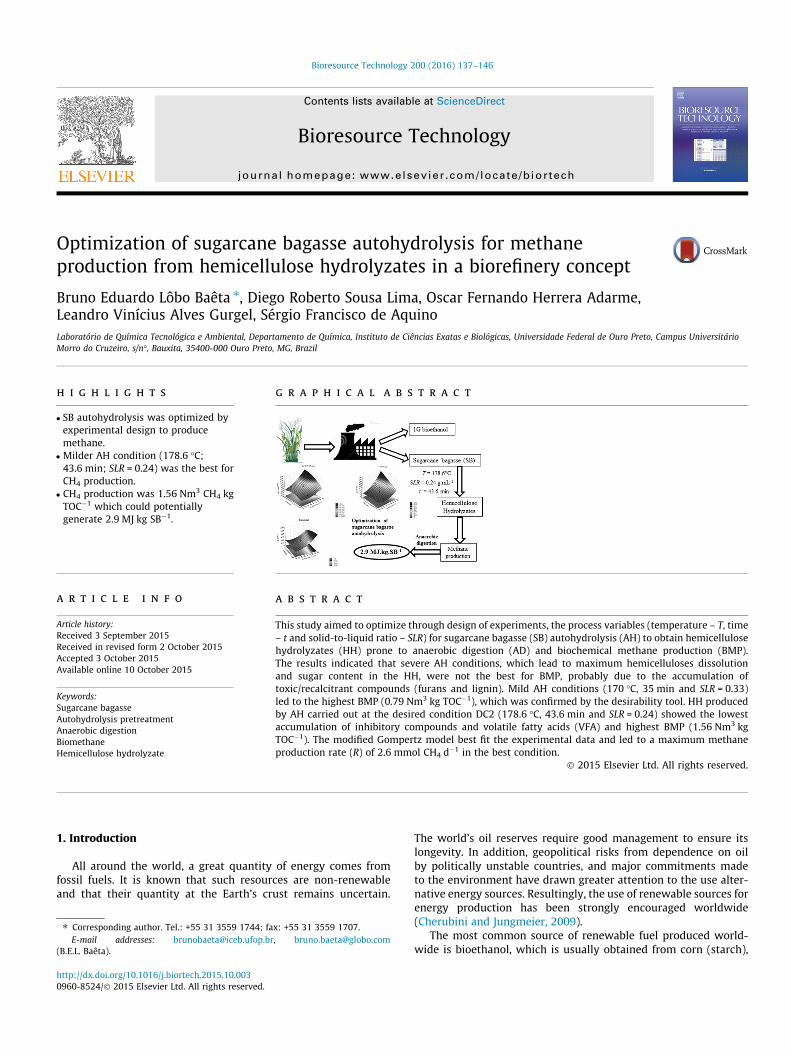
Optimization of sugarcane bagasse autohydrolysis for methane production from hemicellulose hydrolyzates in a biorefinery concept Bruno Eduardo Lôbo Baêta ⇑ , Diego Roberto Sousa Lima, Oscar Fernando Herrera Adarme, Leandro Vinícius Alves Gurgel, Sérgio Francisco de Aquino Laboratório de Química Tecnológica e Ambiental, Departamento de Química, Instituto de Ciências Exatas e Biológicas, Universidade Federal de Ouro Preto, Campus Universitário Morro do Cruzeiro, s/n°, Bauxita, 35400-000 Ouro Preto, MG, Brazil highlights SB autohydrolysis was optimized by experimental design to produce methane. Milder AH condition (178.6 °C; 43.6 min; SLR = 0.24) was the best for CH 4 production. CH 4 production was 1.56 Nm 3 CH 4 kg TOC 1 which could potentially generate 2.9 MJ kg SB 1 . graphical abstract article info Article history: Received 3 September 2015 Received in revised form 2 October 2015 Accepted 3 October 2015 Available online 10 October 2015 Keywords: Sugarcane bagasse Autohydrolysis pretreatment Anaerobic digestion Biomethane Hemicellulose hydrolyzate abstract This study aimed to optimize through design of experiments, the process variables (temperature – T, time – t and solid-to-liquid ratio – SLR) for sugarcane bagasse (SB) autohydrolysis (AH) to obtain hemicellulose hydrolyzates (HH) prone to anaerobic digestion (AD) and biochemical methane production (BMP). The results indicated that severe AH conditions, which lead to maximum hemicelluloses dissolution and sugar content in the HH, were not the best for BMP, probably due to the accumulation of toxic/recalcitrant compounds (furans and lignin). Mild AH conditions (170 °C, 35 min and SLR = 0.33) led to the highest BMP (0.79 Nm 3 kg TOC 1 ), which was confirmed by the desirability tool. HH produced by AH carried out at the desired condition DC2 (178.6 °C, 43.6 min and SLR = 0.24) showed the lowest accumulation of inhibitory compounds and volatile fatty acids (VFA) and highest BMP (1.56 Nm 3 kg TOC 1 ). The modified Gompertz model best fit the experimental data and led to a maximum methane production rate (R) of 2.6 mmol CH 4 d 1 in the best condition. Ó 2015 Elsevier Ltd. All rights reserved. 1. Introduction All around the world, a great quantity of energy comes from fossil fuels. It is known that such resources are non-renewable and that their quantity at the Earth’s crust remains uncertain. The world’s oil reserves require good management to ensure its longevity. In addition, geopolitical risks from dependence on oil by politically unstable countries, and major commitments made to the environment have drawn greater attention to the use alter- native energy sources. Resultingly, the use of renewable sources for energy production has been strongly encouraged worldwide (Cherubini and Jungmeier, 2009). The most common source of renewable fuel produced world- wide is bioethanol, which is usually obtained from corn (starch), http://dx.doi.org/10.1016/j.biortech.2015.10.003 0960-8524/Ó 2015 Elsevier Ltd. All rights reserved. ⇑ Corresponding author. Tel.: +55 31 3559 1744; fax: +55 31 3559 1707. E-mail addresses: [email protected], [email protected](B.E.L. Baêta). Bioresource Technology 200 (2016) 137–146 Contents lists available at ScienceDirect Bioresource Technology journal homepage: www.elsevier.com/locate/biortech
Bruno Eduardo Lôbo Baêta ⇑, Diego Roberto Sousa Lima, Oscar Fernando Herrera Adarme,Leandro Vinícius Alves Gurgel, Sérgio Francisco de AquinoLaboratório de Química Tecnológica e Ambiental, Departamento de Química, Instituto de Ciências Exatas e Biológicas, Universidade Federal de Ouro Preto, Campus UniversitárioMorro do Cruzeiro, s/n�, Bauxita, 35400-000 Ouro Preto, MG, Brazil
h i g h l i g h t s
� SB autohydrolysis was optimized byexperimental design to producemethane.
� Milder AH condition (178.6 �C;43.6 min; SLR = 0.24) was the best forCH4 production.
� CH4 production was 1.56 Nm3 CH4 kgTOC�1 which could potentiallygenerate 2.9 MJ kg SB�1.
g r a p h i c a l a b s t r a c t
a r t i c l e i n f o
Article history:Received 3 September 2015Received in revised form 2 October 2015Accepted 3 October 2015Available online 10 October 2015
This study aimed to optimize through design of experiments, the process variables (temperature – T, time– t and solid-to-liquid ratio – SLR) for sugarcane bagasse (SB) autohydrolysis (AH) to obtain hemicellulosehydrolyzates (HH) prone to anaerobic digestion (AD) and biochemical methane production (BMP).The results indicated that severe AH conditions, which lead to maximum hemicelluloses dissolutionand sugar content in the HH, were not the best for BMP, probably due to the accumulation oftoxic/recalcitrant compounds (furans and lignin). Mild AH conditions (170 �C, 35 min and SLR = 0.33)led to the highest BMP (0.79 Nm3 kg TOC�1), which was confirmed by the desirability tool. HH producedby AH carried out at the desired condition DC2 (178.6 �C, 43.6 min and SLR = 0.24) showed the lowestaccumulation of inhibitory compounds and volatile fatty acids (VFA) and highest BMP (1.56 Nm3 kgTOC�1). The modified Gompertz model best fit the experimental data and led to a maximum methaneproduction rate (R) of 2.6 mmol CH4 d�1 in the best condition.
� 2015 Elsevier Ltd. All rights reserved.
1. Introduction
All around the world, a great quantity of energy comes fromfossil fuels. It is known that such resources are non-renewableand that their quantity at the Earth’s crust remains uncertain.
The world’s oil reserves require good management to ensure itslongevity. In addition, geopolitical risks from dependence on oilby politically unstable countries, and major commitments madeto the environment have drawn greater attention to the use alter-native energy sources. Resultingly, the use of renewable sources forenergy production has been strongly encouraged worldwide(Cherubini and Jungmeier, 2009).
The most common source of renewable fuel produced world-wide is bioethanol, which is usually obtained from corn (starch),
sugar beet (sucrose), and sugarcane (sucrose). In this context, Bra-zil has occupied a prominent place along with the United Statesregarding the production of bioethanol from sugarcane juice andcornstarch (Soccol et al., 2010).
Other sources of renewable raw materials widely studied forconversion into biofuel and biogas are the lignocellulose residues.The production of liquid or gaseous biofuels and value-addedbyproducts from wasted lignocellulosic biomass have highly favor-able environmental aspects (Sanchez and Cardona, 2008). Everyyear, large quantities of lignocellulosic wastes accumulate world-wide due to the agricultural and agro-forestry production. Often,the allocation of these materials is not entirely noble, representsa loss of their energy production potential, besides posing environ-mental issues. In this context, Brazil assumes a prominent position,when considering the volume of agricultural and agro-forestry pro-duction in the country and the consequent generation of lignocel-lulose residues. Such residual biomasses are available in areasonably clean form and in large amounts (Pandey et al., 2000).
Among the agricultural wastes generated in large amounts inBrazilian territory, one should highlight that sugarcane bagasse(SB), is a waste generated during the production of first generation(1G) bioethanol in sugarcane mills. It is estimated that the sugar-cane crop during 2015/2016 season has reached 663 million tons(CONAB, 2015). Considering that approximately 250–280 kg of SBis generated by 1.0 ton of processed sugarcane, it is proposed thatthe Brazilian sugar and alcohol sector has reached 166–186 milliontons of bagasse during 2015/2016 season (Rocha et al., 2015).
Currently, in Brazil, the majority of SB is used to meet theenergy demands in alcohol/sugar plants. It is estimated that theamount of energy produced by its burning to produce steamexceeds by twofold, the amount of energy required for sugar andalcohol production (Costa et al., 2014). Therefore, part of the resid-ual SB is not energetically harnessed. A complete use of this SB isextremely desirable from both economically and environmentallypoints of view; and, its chemical composition makes it an interest-ing industrial raw material of strategic economic importance.
The peculiar characteristics of SB, particularly the large amountof carbohydrates in the form of hemicelluloses and cellulose, haveencouraged research on bioconversion processes of this materialfor the production of second generation (2G) bioethanol, biogas(CH4 and H2) and other bioproducts (Batalha et al., 2015; Costaet al., 2014). In fact, some authors do not consider SB a byproductor residue of the sugar and alcohol industry, but instead as a highvalue co-product, which can be used as a raw material for the pro-duction of biofuels and bioproducts (Pandey et al., 2000).
Generally speaking, lignocellulosic biomass is a natural, cheapand abundant source that can be exploited for the production ofbiofuels and bioproducts. SB, particularly, is mainly composed ofcellulose (30–45%), hemicelluloses (25–30%) and lignin (25–30%),which account for about 90% of its dry weight (Badshah et al.,2012). However, the complex interactions between these threemain components (cellulose, hemicelluloses and lignin) in the cellwall propose the main challenge for the biotechnological use of lig-nocellulose residues such as sugarcane bagasse (Sun, 2004). As aresult, the development of processes for the conversion of suchresidues into biofuels should involve an integrated optimizationof the type of lignocellulose biomass, chemical characterizationand pretreatment needs (Gouveia et al., 2009).
Generally, the methods for lignocellulosic biomass pretreat-ments can be grouped into different categories: physical,physico-chemical, biological and chemical. The hydrothermal pre-treatment, also known as autohydrolysis (AH) pretreatment, hasbeen studied by different researchers (Batalha et al., 2015;Santucci et al., 2015) as a step prior to enzymatic hydrolysis ofSB to increase enzymes accessibility and thereby cellulose conver-sion to C-6 sugar (glucose). Consequently, this could be further
used as a substrate for 2G bioethanol production via yeastfermentation.
During AH pretreatment, water molecules penetrate the bio-mass, promoting cellulose hydration, hemicelluloses dissolution,and slight lignin removal. AH pretreatment is highly effective inincreasing the accessibility and susceptibility of cellulose surfacearea, thereby enhancing its biodegradability and enzymaticconversion. AH pretreatment has the potential of improvingmonomeric sugars extraction, pentoses recovery and cellulosedegradability, with the advantage of producing a hydrolyzate withlower concentration of toxic compounds, such as 2-furfuraldehyde(FF) and 5-hydroxymethyl-2-furfuraldehyde (HMF), whencompared to acidic or steam explosion pretreatments (Zhenget al., 2014).
Moreover, AH pretreatment of SB leads to the production of ahemicellulose hydrolyzate rich in pentose sugars (mainly xyloseand arabinose), which cannot be easily converted into bioethanolvia biochemical processes (Kaparaju et al., 2009). The use of hemi-cellulose hydrolyzate for the production of 2G bioethanol normallyrequires the development of genetically modified microorganismsthat could thrive on pentose. A process that enables the applicationof such microorganisms on an industrial scale, however, has notyet been developed (Rabelo et al., 2011).
Another alternative to harvest the energy of hemicellulosehydrolyzates is the production of biomethane via anaerobic diges-tion (AD). Such an alternative may be part of an energy-viable andsustainable solution for integrating 1G and 2G bioethanol produc-tion processes in the sugar and alcohol industries. The biomethanecould be an additional source of energy to partially replace sugar-cane bagasse as a fuel in cogeneration systems. Furthermore, theuse of biomethane produced from anaerobic digestion of hemicel-lulose hydrolyzates opens the possibility of integral use of the SB inthe lignocellulose biorefinery. The remaining cellulose-rich solidfraction generated after hemicellulose extraction could be furtherused for 2G bioethanol production.
Most of the studies available in the literature consider thewhole use of pretreated biomass, i.e. solid and liquid fractions, toproduce CH4 and evaluate the effects of pretreatment in thedigestibility of SB when compared to raw SB. The use of whole pre-treated material for methane production hinders the rational andefficient use of all biomass fractions, such as the destination ofthe cellulose-rich solid fraction for 2G bioethanol production.Therefore, this study aimed to evaluate the AH pretreatment ofSB in order to obtain hemicellulose hydrolyzates adequate for bio-methane production via classic anaerobic digestion. In addition,the present study tests the hypothesis that the optimization ofAH conditions cannot be solely based on the sugar content in thehydrolysates if methane production is the main goal.
Special attention has been given to the use of high values of SLR,which were evaluated aiming to decrease the water consumptionin the AH pretreatment. The biomethane production via AD ofhemicellulose hydrolyzates was also intensively studied and opti-mized through a Doehlert experimental design and desirabilitytool of Statistica� software. The potential for power generationusing biomethane in a biorefinery concept using the best scenariofound in this study was also estimated.
2. Methods
2.1. Chemicals
Cyclohexane and ethanol (99.5%) were purchased from Synth(Brazil). Sulfuric acid (95–98%) was purchased from Synth (Brazil).The chromatography–grade standards cellobiose, D-glucose,
butyric, valeric, isovaleric, 5-hydroxymethyl-2-furfuraldehyde(HMF), and 2-furfuraldehyde (FF) were purchased from Sigma–Aldrich (Brazil).
2.2. Sugarcane bagasse preparation
SB was provided by Jatiboca Sugar and Ethanol Plant (PonteNova, MG, Brazil), and was generated in the 2012/2013 harvest.Whole SB was subjected to a washing process employing distilledwater at 70 �C for a period of 1 h under mechanical stirring. Thisstep was intended to remove the residual sugars from the sugar-cane grinding process. After this procedure the SB was stored attemperatures below 0 �C until processing.
Table 1Experimental conditions used for optimizing the AH pretreatment of SB andhydrolyzate chemical composition after AH pretreatment.
a Content of FF plus HMF.b Soluble lignin.c Hemicelluloses removal (HR), as calculated using Eq. (2).
2.3. Analytical methods for characterization of SB and hemicellulosehydrolyzates
An oven dried sample of SB was ground to pass through a0.40 mm (40 mesh) screen for the compositional tests. A SB samplewas then used to determine the ash (inorganic) content accordingto the method ‘‘Ash in wood, pulp, paper and paperboard”, TAPPIT211 om-02. The quantitative determination of SB extractiveswas made by Soxhlet extraction using cyclohexane/ethanol (1:1,v/v), in agreement with the method ‘‘Solvent Extractives of Woodand Pulp”, TAPPI T204 cm-07. An extractive-free SB sample wasused to determine the acid-insoluble lignin content, in accordancewith the test method ‘‘Acid-insoluble lignin in wood and pulp”,TAPPI T222 om-02. In its turn, the determination of acid-solublelignin was made in accordance with the test method ‘‘Determina-tion of acid-insoluble lignin in Biomass”, NREL LAP-004.
The concentration of sugars (cellobiose, glucose, xylose and ara-binose), acids (acetic and formic acids) and sugar degradationproducts (FF and HMF) in the hydrolyzate, resulting from thedetermination of acid-insoluble lignin in SB, was used to estimatethe contents of cellulose and hemicelluloses in SB. In addition, suchanalyses were also used to characterize the hydrolyzates generatedby treating the SB under different AH pretreatment conditions. Thecoefficients used to convert sugars, acids and sugar degradationproducts into cellulose and hemicelluloses were those reportedby Gurgel et al. (2014). The concentration of sugars and sugardegradation products was determined by high performance liquidchromatography (HPLC) in accordance with the test method‘‘Determination of carbohydrates in biomass by high performanceliquid chromatography”, NREL LAP-002. A Shimadzu HPLC systemwas used, equipped with a refractive index detector (ShimadzuRID-6A) and an Aminex HPX 87H column (300 � 7.8 mmBio-Rad) kept at 45 �C. The chromatographic conditions used forseparating the analytes involved the use of sulfuric acid(0.5 mmol L�1) as an eluent at a flow rate of 0.6 mL min�1.
The content of organic acids (formic, acetic, propionic, isobu-tyric, butyric, valeric and isovaleric), FF and HMF were also deter-mined using the same chromatographic conditions describedabove. However, the detection of these analytes was performedin a UV–Vis detector (Shimadzu SPD-10AV) at the wavelength of210 nm for acids and 274 nm for the FF and HMF.
The concentration of total organic carbon (TOC) in thehydrolyzates from AH pretreatment of SB was determined usinga TOC-L CPH/CPN Shimadzu equipment. Moreover, the xylooligo-mers (XOS) present in the hydrolyzates were determined asdescribed by NREL LAP-015 by means of an acidic treatment of ahydrolyzate sample (hydrolyzate-to-water ratio of 1:10, 4 wt.%H2SO4 at 121 �C for 1 h). The resulting products (sugars, acids, FFand HMF) were quantified according to the methodology describedbefore. The content of XOS was then estimated from the differencein the concentration of monomeric sugars and sugar degradation
products found in the hydrolyzates before and after the post-hydrolysis (acidic treatment).
2.4. Experimental design and statistical analysis
The conditions for AH pretreatment of SB were optimized by aDoehlert experimental design (DED). The independent variablesevaluated were temperature (T, �C), time (t, min) and thesolid-to-liquid ratio (SLR, g mL�1). The dependent variables moni-tored during the study were the concentration of C5–C6 sugars(Y1 – glucose, xylose and arabinose), furans (Y2 – FF plus HMF)and lignin (Y3 – SL) in the hemicellulose hydrolyzates. The levelsassumed for each independent variable are depicted inSupplementary Table 1, whereas the experimental conditionsemployed for each AH pretreatment are presented in Table 1.Statistical analyses were performed with a 95% significance level,and a response surface was constructed for the three dependentvariables (DV) using Eq. (1). The values of all coefficients depictedin Eq. (1) are shown in Supplementary Table 2.
After analyzing the results obtained by DED, a ‘desirability tool’was used to assess the relationship between the model outputsand the features of dependent variables wanted to obtain a hydro-lyzate with a greater biomethane production capacity. The desiredconditions used in the ‘desirability tool’ are shown in Table 2. Boththe experimental design and the ‘desirability tool’ were run usingthe Statistica� software (version 10.0).
2.5. Autohydrolysis (AH) pretreatment
AH pretreatment experiments of SB were carried out in a tubu-lar reactor made of stainless steel (316 L) (190 mm ofheight � 58 mm internal diameter � 76 mm external diameter)with a capacity of 195 cm3. The water content of SB was taken intoaccount only in the mass balances, and the reactor was loaded with30.0 g of SB, on dry-weight basis, and heated in a 25 L thermostat-ically controlled bath containing glycerin as a heating fluid. The
Table 2AH pretreatment conditions of SB and AH hydrolyzate composition outputted by the desirability tool.
temperatures set were programmed and monitored with the aid ofa thermocouple. After the AH pretreatment, the reactor was imme-diately cooled in an ice bath and opened. Then, the pretreated SBwas dewatered in a hydraulic press by applying a pressure of 9tons (SOLAB�, model SL-10). The hemicellulose syrup (hydroly-zate) recovered after pressing the pretreated SB was collected,stored at temperatures below 0 �C, and characterized in terms ofmonosaccharides (glucose, xylose and arabinose), organic acids(acetic and formic acids), sugar degradation products (FF andHMF), XOS, SL and TOC, as previously described.
After the characterization, portions of the hydrolyzates weresubmitted to anaerobic biodegradability tests to determine theirbiochemical methane potentials (BMP). The pretreated SB (solidfraction) was dried (without washing after pressing) in a forcedair circulation oven at 85 �C for 24 h, transferred to a desiccatorto cool, and then weighed. The weight loss (WL) was gravimetri-cally determined, and the hemicelluloses removal (HR) was calcu-lated using Eq. (2).
HR=% ¼ HCSB � HCAH�SB YAH�SB=100ð Þ½ �HCSB
� �� 100 ð2Þ
where HR is hemicelluloses removal (%), HCAH-SB and HCSB are hemi-cellulose contents in SB after and before AH pretreatment, respec-tively, and YAH-SB (%) is the yield of AH pretreatment (Y = 100 �WL).
2.6. Anaerobic biodegradability
Batch anaerobic digestion tests were carried out in triplicate toassess the BMP of hemicellulose hydrolyzates obtained from AHpretreatment of SB. A control test, without substrate, was alsoincluded in the tests to check the methanogenic activity of theinoculum. All experiments were carried out at mesophilic condi-tions in glass bottles of 275 mL that were placed in a thermostaticorbital shaker (35.1 ± 0.3 �C) at 200 rpm. The liquid volume of eachglass bottle was 150 mL, leaving a headspace volume of 125 mL.
The anaerobic inoculum used for the BMP tests was taken froma pilot-scale mesophilic anaerobic digester that had been feedingwith raw sewage. The inoculum was pre-incubated for four days(35 �C) in order to offset the methane production from thebiodegradation of any residual organic matter.
A sample of hydrolyzate (15.0 mL) was added to the glass bot-tles containing varied volumes of inoculum, depending on theTOC concentration in each hydrolyzate sample, to keep afood-to-microorganism ratio of 0.4 g TOC g VSS�1. In each experi-ment a solution containing sodium bicarbonate (pH buffer) andmicro- and macronutrients was added. The concentration of thesecompounds varied and was determined for each experiment inorder to maintain a minimum COD:N:P ratio of 350:5:1, as usedby Baêta et al. (2013).
The biogas production was monitored until stabilization, andthe gas composition was measured by gas chromatography (Shi-madzu GC, model 2014/TCD). All values of BMP (Nm3 kg TOC�1)are presented under standard temperature and pressure conditions
(STP: 273 K; 101,315 Pa) as defined by IUPAC (International Unionof Pure Applied Chemistry).
2.7. Modeling the experimental data
A mathematical model, the modified Gompertz model, wasused to model the experimental data obtained from the BMP tests.The maximum accumulated methane production (AMP) wasobtained by nonlinear sigmoidal regression of the modified Gom-pertz model (Lay, 2000) as follows in Eq. (3):
AMP ¼ P exp � expRePðk� tÞ þ 1
� � �ð3Þ
where P is the methane production potential (mmol CH4), R is themaximum methane production rate (mmol CH4 h�1), k is the lagphase time (d) and e is exp(1).
3. Results and discussion
3.1. Characterization of sugarcane bagasse
The chemical composition of SB used in this study averaged44.16% cellulose, 23.61% hemicelluloses, 25.79% lignin, 2.22%extractives and 1.45% ash (inorganics). This composition is in goodagreement with that reported by Vallejos et al. (2012).
3.2. Autohydrolysis pretreatment of sugarcane bagasse
The optimization of AH pretreatment of SB was carried outusing the content of C5–C6 sugars (Y1), furans (Y2) and SL (Y3) inthe hydrolyzates as response variables. These variables were cho-sen due to the fact that there are direct relationships betweenthem and the methane production via anaerobic digestion of thehydrolyzates. Since this optimization aimed to produce an easilyfermentable hydrolyzate that would lead to an increased methaneproduction, it was important to define an autohydrolysis conditionthat allowed an effective release of C5–C6 sugars altogether with asmall generation of toxic/recalcitrant compounds such as furansand SL. The statistical significant effects of the independent vari-ables (T, t and SLR) of AH pretreatment of SB on the dependent vari-ables Y1, Y2 and Y3 can be seen in Supplementary Fig. 1.
The Pareto’s diagram (Supplementary Fig. 1) shows that thevariable temperature (T), as well as its squared effect (T2), alongwith the variable time (t), had a significant positive effect on thedependent variable content of C5–C6 sugars. It is possible to noticethat the standardized value of the temperature effect is the mostpronounced (9.064) when compared to the effects obtained bythe other independent variables (t = 5.920; T2 = 2.367). One possi-ble explanation for this is the influence of these variables on thepH of the reactional medium, more specifically on the concentra-tion of acetic acid. As pointed out by Costa et al. (2014), the aceticacid released by the cleavage of acetyl groups can act as a catalystfor the hemicellulose hydrolysis reaction, thereby contributing tothe increased release of sugars. As can be later shown, this
hypothesis was confirmed by Supplementary Fig. 2, which showsthe acetic acid concentration in the hydrolyzates obtained afterdistinct AH pretreatment assays.
Given these results, it can be inferred that the increase in tem-perature combined with an increased pretreatment time, con-tributes for the hydrolysis of hemicelluloses, consequentlyleading to an increased release of C5 sugars (xylose and arabinose).Furthermore, the increased contact time combined with the highertemperature releases a higher amount of C6 sugars (glucose) fromcellulose, which are concurrent with the results found by otherauthors such as Vallejos et al. (2012). In addition to the effects ofT and t, it is also possible to notice that the SLR has a negative effecton the concentration of C5–C6 sugars, whereas for SLR2 the oppo-site occurs. This can be explained by the fact that water is neededfor the hydrolysis reactions of hemicelluloses to occur efficiently;this also leads to a concomitant release of XOS, monosaccharides(xylose and arabinose) and acetic acid.
When assessing the effect of independent variables on thelevels of furans, Supplementary Fig. 1 shows that the greatesteffects were related to the variables T (9.9616) and t (6.1942).These results are similar to those observed for C5–C6 sugars, inthe way that an increase in temperature and time, positively con-tributes to higher levels in the hydrolyzate. The effect of varyingthe SLR on furan production was significant and had a negativeeffect, implying that the use of higher amounts of water duringthe AH pretreatment can contribute to higher levels of sugar degra-dation products in the hydrolyzate. Thus, it is clear that higher val-ues of SLR during SB pretreatment can generate a hydrolyzate withlower levels of compounds (furans) considered toxic to anaerobicmicroorganisms, thereby rendering a hemicellulose hydrolyzatewith a greater potential for methane production.
However, as smaller SLR values increase the sugar content inhemicellulose hydrolyzates, the optimization of this variable dur-ing the pretreatment by AH should seek the best compromisebetween water savings, increased generation of C5–C6 sugars,and lower production of sugar degradation compounds, potentialinhibitors of the anaerobic digestion. The analysis of the effect ofthis variable is very important due to the commitment that mustbe held by AH process in a lignocellulose biorefinery: the lowestwater consumption, and least generation of waste as possible.Moreover, the few studies that sought to evaluate the effect ofSLR in the AH pretreatment of lignocellulose biomass presentedno clear conclusions on the effect of this variable (Jacobsen andWyman, 2002).
When the system’s behavior in relation to SL content in thehydrolyzate is considered, it can be seen that the variable T andits quadratic term (T2) have a positive effect on lignin dissolution.At high temperatures and acidic pH values, chemical bonds in lig-nin such as a–O–4 and b–O–4 breakdown, allowing the condensa-tion reactions and modification of lignin in the plant cell. However,some fragments of lignin that did not undergo condensation reac-tions are released in the hydrolyzate. The presence of higher con-centrations of SL fragments in the hydrolyzate can cause toxicityto methanogenic microorganisms. Alvarez et al. (1991) reportedthat low molar mass lignin fragments caused major toxicity effectsagainst growth of methanogenic microorganisms.
Supplementary Fig. 2 shows that assay 9 (T = 185 �C andt = 35 min) led to a higher concentration of acetic acid in thehydrolyzate, and a higher amount (0.516 g) of C5–C6 sugars. Thisconfirms the hypothesis presented by other authors (Costa et al.,2014; Vallejos et al., 2012) that hemicellulose hydrolysis intoC5–C6 sugars depends on the accumulation of acetic acid, whichcan be produced in higher amounts at high temperatures and/orcontact times, thereby acting as a catalyst for hydrolysis of esterand ether bonds in hemicelluloses. As confirmed in Table 1, thehighest hemicellulose removal (83%) was obtained during assay 9.
In assay 2, which was also carried out at 185 �C and 35 min ofcontact time, led to the second highest accumulation of acetic acidand production of C5–C6 sugars (0.387 g), with a hemicelluloseconversion of �69%. This thereby confirms the direct relationshipbetween the variables T and t and contents of acetic acid andC5–C6 sugars during AH pretreatment of SB. This is in good agree-ment with other authors as Boussarsar et al. (2009), who showedthat maximum sugar accumulation occurred at high temperatures(190 �C) and contact times (15–240 min).
The response surface graphs (Fig. 1a–c) generated by quadraticmodels that resulted from the Doehlert planning when fixing theSLR variable at the center point (0.222), show how the independentvariables T and t positively influence the levels of C5–C6 sugars,furans and SL.
Analyzing the response surface graphs, it is noticed that the AHconditions of SB that led to higher C5–C6 sugars release also led tohigher accumulation of furans and SL in the hydrolyzate. Sincesuch compounds are considered toxic to the methanogenicmicroorganisms (low growth rate effect), it is evident that AH opti-mization cannot be performed considering only the hydrolyzateC5–C6 levels or the total amount or reducing sugars as proposedby different research groups (Costa et al., 2014). Such an optimiza-tion can further impede the methane production due to the accu-mulation of inhibiting compounds in the hydrolyzate. Given theabove conclusion, it is clear that a thorough evaluation of the SBhydrolyzate must be made, and this can be done by carrying onBMP tests, as described next.
3.3. Anaerobic biodegradability tests
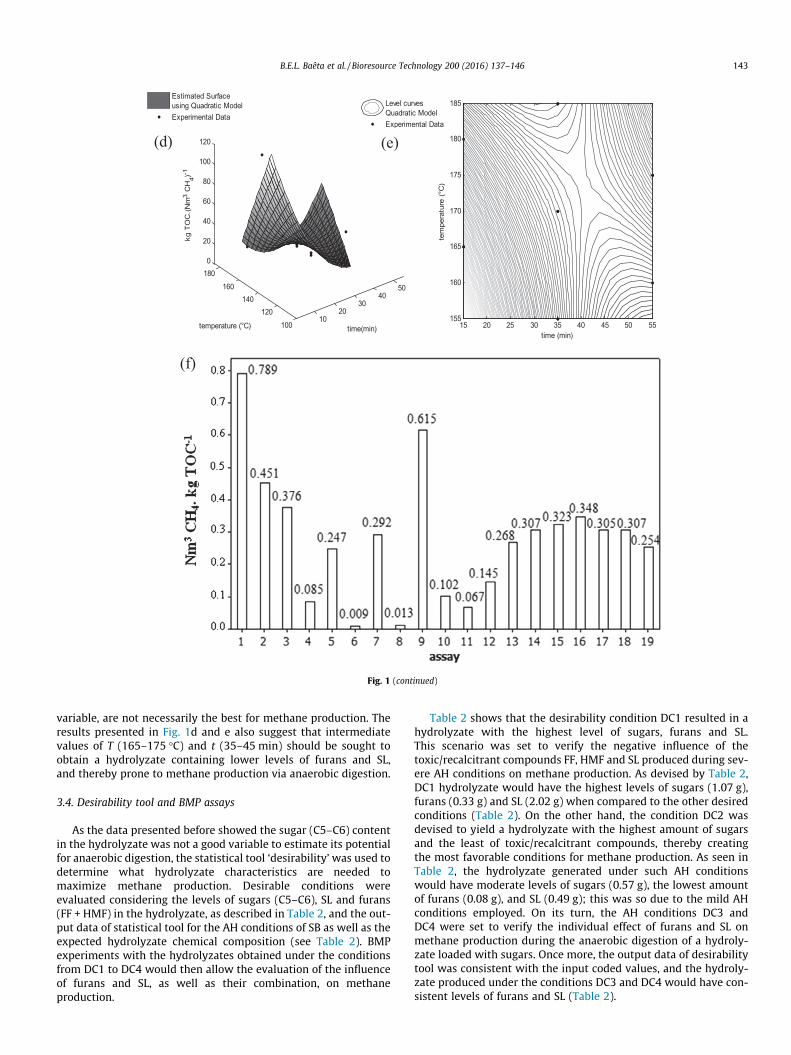
BMP tests were carried out with all 19 hydrolyzates obtainedwith Doehlert planning, in an attempt to evaluate which AH condi-tions of SB would be better for methane production through anaer-obic digestion. Fig. 1f shows that the BMP test carried out with thehydrolyzate obtained from pretreatment assay 9 (SLR = 0.167;T = 185 �C; t = 35 min), which was expected to have the highestmethane potential considering its level of C5–C6 sugars (seeTable 1), was actually the second best regarding the methane pro-duction, with a BMP value of 0.615 Nm3 kg TOC�1. The highestmethane production (0.789 Nm3 kg TOC�1) was observed withthe hydrolyzate generated during pretreatment assay 1(SLR = 0.333; T = 170 �C; t = 35 min), which contained 2.6 times les-ser C5–C6 sugars, and was a result of poor hemicellulose conver-sion (of only 57%, see Table 1).
These results are important to demonstrate that the pretreat-ment condition that leads to the hemicellulose conversion andhigher sugar content in the hydrolyzate is not necessarily the bestfor methane production, contrary to what is normally employed bydifferent researchers (Costa et al., 2014).
The BMP results presented in this study proved the hypothesisthat was previously mentioned, that using only the variable C5–C6sugars (or reducing sugars) as a response of AH pretreatment of SB,is flawed when the resulting hydrolyzate is to be submitted toanaerobic digestion. In addition to the sugar content, one shouldalso observe the amount of recalcitrant and toxic compounds, suchas SL and furans, which are concomitantly produced during AHpretreatment of SB. Table 1 shows that the concentrations of furansand SL in the hydrolyzate generated by pretreatment assay 1 were3.7 and 3.2 times lower than those observed in assay 9; and, thisseemed to be crucial for the higher methane production obtainedwith this hydrolyzate.
Recent studies have indicated that methanogenic archaeas canbe severely inhibited in environments with high amounts of furanssuch as FF (Boopathy, 2009), thereby hampering methanogenesis.Therefore, it can be inferred that AH pretreatment conditions ofSB with lower severity, although implying in lesser amounts of
Fig. 1. Response surface graphs (a, b and c) generated from the quadratic model describing the levels of C5–C6 sugars, furans and SL and response surface graphs (d) andcontour lines (e) for conversion of organic matter in the hydrolyzates (1–19) (kg of TOC per Nm�3 of methane) as function of temperature and time and (f) BMP for thehydrolyzates obtained after AH pretreatment of SB according to Doehlert experimental design.
C5–C6 sugars in the hydrolyzates, should be preferred if methaneproduction is the aim.
Seeking to find a relationship between biomass conversion (intomethane) and the AH dependent variables T and t, a nonlinear(second-order polynomial) regression analysis was carried outusing the methane production capacity (kg TOC Nm3 CH4
�1) as aresponse. This relationship would show which experimentalcondition (T and t) led to the higher specific methane production,i.e., methane accumulation in relation to the incubated mass ofsubstrate.
Eq. (4) describes the behavior of the response variable methaneproduction capacity (kg TOC Nm3 CH4
�1) in relation to the temper-ature and time during AH pretreatment of SB, as per the responsesurface graphs and contour lines presented in Fig. 1d and e. Thepolynomial model resulted in a correlation value (R2) of 0.84,implying that the model was able to satisfactorily predict 84% ofthe response variable in function of T and t. Considering the com-plexity of the system studied here and comparing this value withthose found by other authors, one can say that the adjustment
was pretty good. For instance, Ferreira et al. (2013) tried to find arelationship between methane production and the values of Tand t used in the AH pretreatment of wheat straw and found a cor-relation coefficient (R2) of only 0.57.
kg TOC Nm3 CH4
� ��1¼ 916:5695� 31:6044t � 3:2075T
þ 0:0840t2 � 0:0074T2 þ 0:1427tT ð4ÞAssessing Fig. 1d, it can be seen that the lowest values of the
response variable methane production capacity (kg TOC Nm3
CH4�1), were observed for temperatures near 175 �C and contact
times in the range of 40–45 min. These values are close to thoseobserved in pretreatment assay 1 of Doehlert planning (Supple-mentary Table 1), which despite having resulted in only moderatehemicellulose conversion and low C5–C6 sugars content in thehydrolyzate, led to the highest BMP values. This strengthens thehypothesis that the AH conditions that produces high hemicellu-lose hydrolysis and sugar release, as inferred by Doehlert designshaving the chemical composition of hydrolyzate as response
1020
3040
50
100120
140160
1800
20
40
60
80
100
120
time(min)temperature (°C)
kg T
OC
.(Nm
3 C
H4)-1
Estimated Surfaceusing Quadratic ModelExperimental Data
variable, are not necessarily the best for methane production. Theresults presented in Fig. 1d and e also suggest that intermediatevalues of T (165–175 �C) and t (35–45 min) should be sought toobtain a hydrolyzate containing lower levels of furans and SL,and thereby prone to methane production via anaerobic digestion.
3.4. Desirability tool and BMP assays
As the data presented before showed the sugar (C5–C6) contentin the hydrolyzate was not a good variable to estimate its potentialfor anaerobic digestion, the statistical tool ‘desirability’ was used todetermine what hydrolyzate characteristics are needed tomaximize methane production. Desirable conditions wereevaluated considering the levels of sugars (C5–C6), SL and furans(FF + HMF) in the hydrolyzate, as described in Table 2, and the out-put data of statistical tool for the AH conditions of SB as well as theexpected hydrolyzate chemical composition (see Table 2). BMPexperiments with the hydrolyzates obtained under the conditionsfrom DC1 to DC4 would then allow the evaluation of the influenceof furans and SL, as well as their combination, on methaneproduction.
Table 2 shows that the desirability condition DC1 resulted in ahydrolyzate with the highest level of sugars, furans and SL.This scenario was set to verify the negative influence of thetoxic/recalcitrant compounds FF, HMF and SL produced during sev-ere AH conditions on methane production. As devised by Table 2,DC1 hydrolyzate would have the highest levels of sugars (1.07 g),furans (0.33 g) and SL (2.02 g) when compared to the other desiredconditions (Table 2). On the other hand, the condition DC2 wasdevised to yield a hydrolyzate with the highest amount of sugarsand the least of toxic/recalcitrant compounds, thereby creatingthe most favorable conditions for methane production. As seen inTable 2, the hydrolyzate generated under such AH conditionswould have moderate levels of sugars (0.57 g), the lowest amountof furans (0.08 g), and SL (0.49 g); this was so due to the mild AHconditions employed. On its turn, the AH conditions DC3 andDC4 were set to verify the individual effect of furans and SL onmethane production during the anaerobic digestion of a hydroly-zate loaded with sugars. Once more, the output data of desirabilitytool was consistent with the input coded values, and the hydroly-zate produced under the conditions DC3 and DC4 would have con-sistent levels of furans and SL (Table 2).
Table 3 shows the measured concentrations of C5–C6 sugars(glucose, xylose, arabinose), furans (FF and HMF) and SL in thehydrolyzates generated according to the four desirability conditions.As seen in Table 3, the concentration of C5–C6 sugars, furans and SLare in good agreement with those predicted by desirability tool.
The BMP values resulting from the anaerobic digestion of thefour hydrolyzates obtained in the desired conditions (DC1, DC2,DC3 and DC4), shows that the methane production was higherfor the DC2 condition (1.56 ± 0.11 Nm3 kg TOC�1) when comparedto the others (DC1 = 0.74 ± 0.08 Nm3 kg TOC�1, DC3 = 0.48 ± 0.04Nm3 kg TOC�1 and DC4 = 0.35 ± 0.07 Nm3 kg TOC�1). These resultsconfirm the hypothesis that lower concentrations of furans and SLcontribute to increase the methanogenic activity. These results alsoconfirm and validate the model proposed by Eq. (4), which predictsthat the highest methane production from hydrolyzate is expectedto be observed when the AH pretreatment of SB is performed in thetemperature and time ranges of 170–180 �C and 40–45 min,respectively (Fig. 1d and e).
According to some authors as Santucci et al. (2015), the AH pre-treatment of SB carried out at temperatures near to 170 �C arepromising to generate hydrolyzates containing high amounts ofXOS and monomeric sugars, as well as low concentration of sugardegradation byproducts, i.e. furans. Moreover, the SLR valueemployed in this study (0.24) is higher when compared to otherstudies reported in the literature (e.g. SLR = 0.10 used by Batalhaet al. (2015)) and highly desired since it implies using loweramounts ofwater, encompassing both environmental and economicadvantages. In addition, lower water content during AH pretreat-ment implies that autoclave reactors were being fed with higheramount of solids, thereby maximizing the quantity of SB per run.
Besides leading to a higher methane production, the hydroly-zate generated by DC2 condition exhibited the highest TOCremoval efficiency (93.13%) when compared to DC1 (76.24%),DC3 (67.14%) and DC4 (52.55%) conditions. This indicates thatDC2 hydrolyzate had better biodegradability; a possible explana-tion for this may be related to its higher concentration of arabi-nose. Some authors as Desai and Rao (2010) stated that someanaerobic and facultative bacteria prefer utilizing arabinose as sub-strate rather than xylose. These authors also reported that suchmicroorganisms, when fed with mixtures of C-5 sugars (xyloseand arabinose), tend to alter their metabolism as the presence ofarabinose in the medium cause a catabolite repression for xyloseassimilation. This may explain the increased production ofmethane from the DC2 hydrolyzate since it had the highest amount(309.4 mg L�1) of arabinose (Table 3).
A hypothesis to explain the higher levels of arabinose in thehydrolyzate generated byDC2 condition is the relatively low severity(T = 178.6 �C and t = 43.6 min) employed during this pretreatment. Itis well-known that extreme conditions of temperature and time, asthose imposed on DC1 and DC4 experiments, are able to solubilizea large amount of C-5 sugars (xylose and arabinose) that are con-stituents of hemicelluloses. However, under more severe conditionsboth arabinose and xylose are degraded into furfural (FF), a well-known toxic compound to methanogenic microorganisms.
The C-5 sugars levels in the distinct hydrolyzates (Table 3)imply that the harshest AH conditions (DC1 and DC4) led to the
Table 3Hydrolyzate characteristics obtained by the desirability conditions at the beginning of BM
Glu – glucose; Xyl – xylose; Ara – arabinose; FA – formic acid; HAc – acetic acid; HMF
production of hydrolyzates containing less arabinose and moreFF. The highest levels of FF in these conditions are due to a higherconversion rate of arabinose into FF, prompted by the lowest acti-vation energy involved in the degradation reaction of arabinose toFF when compared to that of xylose (Jacobsen and Wyman, 2002;Lavarack et al., 2002; Zhao et al., 2012).
The ease conversion of arabinose into FF can also be explainedby the sugar position in the hemicelluloses chain. Arabinose is asubstituent of the hemicelluloses chain, and therefore, is moreeasily hydrolyzed as compared to xylose, the major constituentof hemicelluloses chain. The easier solubilization of arabinose dur-ing AH pretreatment causes this sugar molecule to remain longertimes in the bulk solution under the action of temperature andpH, which favors its degradation into FF and provides the hydroly-zate a higher toxicity. It is noteworthy that in addition to the FFgenerated from arabinose degradation there is also the contribu-tion of FF coming from xylose. Therefore, the more severe AH con-ditions impair a further anaerobic digestion of the hydrolyzate dueto the greater release of FF (a toxic furan) and the decrease in ara-binose, a sugar considered of easy degradation by anaerobicmicroorganisms.
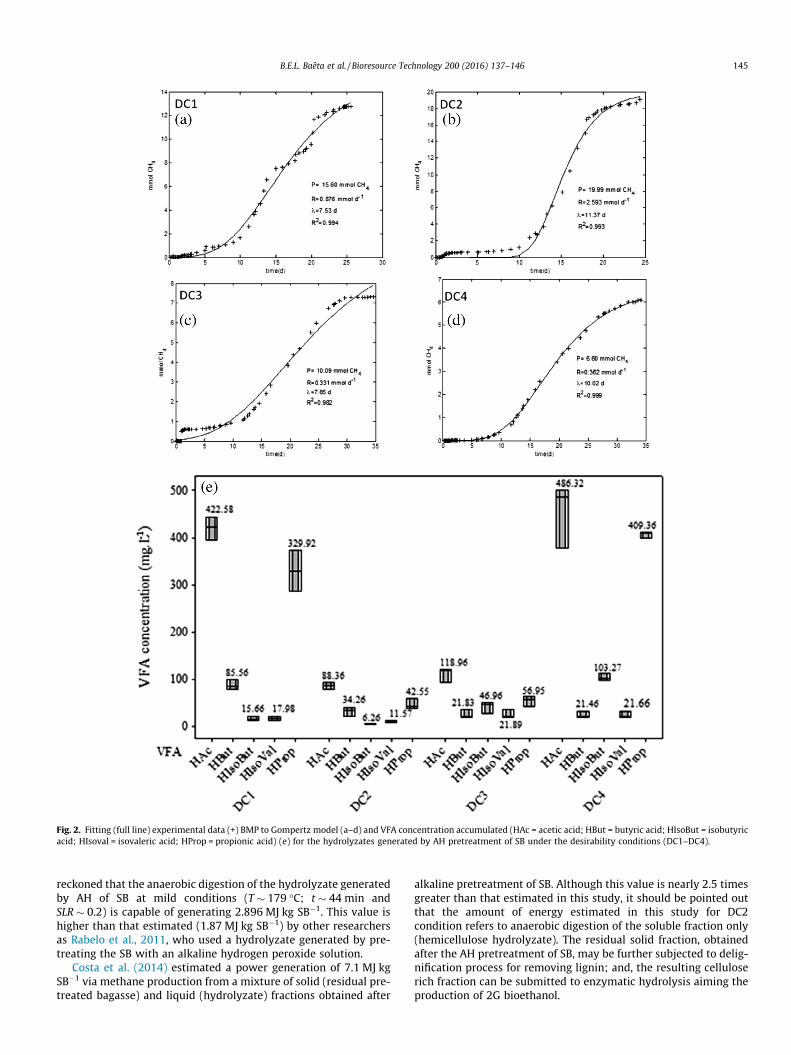
The lower toxicity observed for the DC2 hydrolyzate when com-pared to the others (DC1, DC3 and DC4) can be confirmed whenevaluating the accumulation of volatile fatty acids (VFA) at theend of the BMP test. It is known that the VFA accumulation in anaer-obic systems can occur due to amicrobial growth imbalance causedby stressful conditions, such as nutritional deficiency and toxicity.Such conditions can lead to thermodynamic and kinetic constraintsin the system compromising the conversion of organic matter intomethane. Fig. 2e shows that the concentrations of all monitoredVFA at the end of the BMP tests were lower for the DC2 hydrolyzatewhen compared to the others. This clearly shows that themore sev-ere conditions (higher T or t) that normally lead to higher hemicel-luloses dissolution during AH pretreatment of SB are notnecessarily the most appropriate if the hydrolyzate is to be furthersubmitted to anaerobic digestion and methane production.
Further evidence that the hemicellulose hydrolyzate generatedby the AH condition DC2 showed the best biodegradability and themaximum production rate of methane (R) estimated by the modi-fied Gompertz model following its adjustment to the BMP experi-mental data (Fig. 2a–d). It is possible to note that the model wascapable of reproducing the methane production with very good fit-tings with values of correlation coefficients (R2) higher than 0.98for four AH conditions.
The R-value for the hydrolyzate generated by DC2 condition(2.59 mmol CH4 d�1) was higher than the values found for DC1(0.88 mmol CH4 d�1), DC3 (0.33 mmol CH4 d�1) and DC4(0.36 mmol CH4 d�1) conditions. This is an indication that thehemicellulose hydrolyzate generated by DC2 condition (whichhad lower furan and SL contents) resulted in lower kinetic imbal-ance during its anaerobic digestion, which was transformed intofaster methane production.
Considering that CH4 has an inferior calorific power of34,450 kJ Nm�3 (Boussarsar et al., 2009), that the BMP for DC2hydrolyzate was 1.56 Nm3 kg TOC�1, and that TOC dissolution dur-ing AH of SB was 0.0539 kg TOC kg SB�1 (on dry-weight basis), it is
P assays.
) FA (mg L�1) HAc (mg L�1) HMF (mg L�1) FF (mg L�1) SL (mg L�1)
reckoned that the anaerobic digestion of the hydrolyzate generatedby AH of SB at mild conditions (T � 179 �C; t � 44 min andSLR � 0.2) is capable of generating 2.896 MJ kg SB�1. This value ishigher than that estimated (1.87 MJ kg SB�1) by other researchersas Rabelo et al., 2011, who used a hydrolyzate generated by pre-treating the SB with an alkaline hydrogen peroxide solution.
Costa et al. (2014) estimated a power generation of 7.1 MJ kgSB�1 via methane production from a mixture of solid (residual pre-treated bagasse) and liquid (hydrolyzate) fractions obtained after
alkaline pretreatment of SB. Although this value is nearly 2.5 timesgreater than that estimated in this study, it should be pointed outthat the amount of energy estimated in this study for DC2condition refers to anaerobic digestion of the soluble fraction only(hemicellulose hydrolyzate). The residual solid fraction, obtainedafter the AH pretreatment of SB, may be further subjected to delig-nification process for removing lignin; and, the resulting celluloserich fraction can be submitted to enzymatic hydrolysis aiming theproduction of 2G bioethanol.
The use of hemicellulose hydrolyzates for methane productionand power generation can pave the way for a sustainable integra-tion of the 1G and 2G bioethanol production, as demonstrated bysome authors (Dias et al., 2013; Moraes et al., 2015). It is knownthat the presence of hemicelluloses during the enzymatic hydroly-sis may worsen the conversion yields (Batalha et al., 2015), andtherefore, its previous solubilization by AH is beneficial from a pro-cess and economical point of view. Moreover, the microorganismsresponsible for fermenting sugars to ethanol are not able to use C-5sugars such as xylose and arabinose, which are the major compo-nents of hemicelluloses (Kaparaju et al., 2009). Therefore, theanaerobic digestion of the hemicellulose hydrolyzate creates anew energetic vector (methane), which might help to close theenergetic balance in a lignocellulose biorefinery.
The strategic biomethane generation from the hemicellulosesfraction of SB also avoids the necessity of its combustion to pro-duce power and steam, since the biogas could supply this energeticdemand. This would spare the pretreated bagasse, a fraction rich incellulose and lignin, to be further used to obtain 2G bioethanoland/or recover lignin derived value-added compounds.
During the integration of the 1G and 2G ethanol plants, it is alsopossible to use the vinasse generated during ethanol production forco-digestion with the hemicellulose hydrolyzate. Such action isinteresting from an application standpoint since the use of vinassefor biogas production is currently compromised by the high levelsof hydrogen sulfide (H2S) normally formed in the digesters. Theconcomitant anaerobic digestion of hemicellulose hydrolyzateand vinasse would allow the dilution of sulfate since this anion isnot normally present in the SB hydrolyzates, thereby decreasingH2S in the biogas and improving its quality.
The co-digestion of vinasse and hemicellulose hydrolyzatecould also be benefit the methanogenic activity in the digesters ifone considers the dilution of toxic compounds, such as FF andHMF, which are normally present in SB hydrolyzates and absentin the vinasse. Another important issue that might boost biogasproduction in co-digestion is the exploitation of essential nutrients,such as N, P and K, which are present in high concentration in thevinasse and normally scarce in the hydrolyzates. Despite theadvantages, Moraes et al. (2015) highlight there are quite a fewpapers in the literature that aimed at evaluating the possibility ofbiogas production from combined digestion of vinasse and hemi-cellulose hydrolyzates.
4. Conclusions
The AH of SB showed that severe conditions (185 �C; 55 min)and lower SLR (0.14) led to HH with low BMP (0.74 Nm3 kg TOC�1),and that milder conditions (178.6 �C; 43.6 min) and SLR (0.23) ledto a higher BMP (1.56 Nm3 kg TOC�1). The rate of CH4 estimated bythe Gompertz model was 2.6 mmol d�1 for the best desired condi-tion, which was equivalent to 2.9 MJ kg SB�1. The anaerobic diges-tion of HH contributes to close the energetic balance in a sugarcanebiorefinery, thereby sparing the SB for more noble uses such as 2Gbioethanol production and value-added compounds recovery.
Acknowledgements
The authors would like to thank the Brazilian National ResearchCouncil (CNPq) and the Minas Gerais State Research FundingAgency (FAPEMIG) for their financial support.
Appendix A. Supplementary data
Supplementary data associated with this article can be found, inthe online version, at http://dx.doi.org/10.1016/j.biortech.2015.10.003.
References
Alvarez, R.S.a., Gatze, L., 1991. The methanogenic toxicity of wastewater lignins andlignin related compounds. J. Chem. Technol. Biotechnol. 50, 443–445.
Badshah, M., Lam, D.M., Liu, J., Mattiasson, B., 2012. Use of an automatic methanepotential test system for evaluating the biomethane potential of sugarcanebagasse after different treatments. Bioresour. Technol. 114, 262–269.
Batalha, L.A., Han, Q., Jameel, H., Chang, H.M., Colodette, J.L., Borges Gomes, F.J.,2015. Production of fermentable sugars from sugarcane bagasse by enzymatichydrolysis after autohydrolysis and mechanical refining. Bioresour. Technol.180, 97–105.
Boopathy, R., 2009. Anaerobic biotransformation of furfural to furfuryl alcohol. Int.Biodeterior. Biodegradation 63, 1070–1072.
Boussarsar, H., Roge, B., Mathlouthi, M., 2009. Optimization of sugarcane bagasseconversion by hydrothermal treatment for the recovery of xylose. Bioresour.Technol. 100 (24), 6537–6542.
Cherubini, F., Jungmeier, G., 2009. LCA of a biorefinery concept producingbioethanol, bioenergy, and chemicals from switchgrass. Int. J. Life CycleAssess. 15 (1), 53–66.
CONAB, 2015. Companhia Nacional de Abastecimento. Avaliação da safra agrícolabrasileira de cana-de-acúcar, safra 2015/2016, segundo levantamento, Agosto(in Portuguese).
Costa, A.G., Pinheiro, G.C., Pinheiro, F.G.C., Dos Santos, A.B., Santaella, S.T., Leitão, R.C., 2014. The use of thermochemical pretreatment to improve the anaerobicbiodegradability and biochemical methane potential of the sugarcane bagasse.Chem. Eng. J. 248, 363–372.
Desai, T.A., Rao, C.V., 2010. Regulation of arabinose and xylose metabolism inEscherichia coli. Appl. Environ. Microbiol. 76 (5), 1524–1532.
Dias, M.O.S., Junqueira, T.L., Cavalett, O., Pavanello, L.G., Cunha, M.P., Jesus, C.D.F.,Maciel Filho, R., Bonomi, A., 2013. Biorefineries for the production of first andsecond generation ethanol and electricity from sugarcane. Appl. Energy 109,72–78.
Ferreira, L.C., Donoso-Bravo, A., Nilsen, P.J., Fdz-Polanco, F., Perez-Elvira, S.I., 2013.Influence of thermal pretreatment on the biochemical methane potential ofwheat straw. Bioresour. Technol. 143, 251–257.
Gouveia, E.R., Nascimento, R.T., Souto-Maior, A.M., Rocha, G.J.d.M., 2009. Validaçãode metodologia para a caracterização química de bagaço de cana-de-açúcar.Quim. Nova 32 (6), 3.
Gurgel, L.V.A., Pimenta, M.T.B., Curvelo, A.A.d.S., 2014. Enhancing liquid hot water(LHW) pretreatment of sugarcane bagasse by high pressure carbon dioxide (HP-CO2). Ind. Crops Prod. 57, 141–149.
Jacobsen, S.E., Wyman, C.E., 2002. Xylose monomer and oligomer yields foruncatalyzed hydrolysis of sugarcane bagasse hemicellulose at varying solidsconcentration. Ind. Eng. Chem. Res. 41 (6), 1454–1461.
Kaparaju, P., Serrano, M., Thomsen, A.B., Kongjan, P., Angelidaki, I., 2009. Bioethanol,biohydrogen and biogas production from wheat straw in a biorefinery concept.Bioresour. Technol. 100 (9), 2562–2568.
Lavarack, B.P., Gri, G.J., Rodman, D., 2002. The acid hydrolysis of sugarcane bagassehemicellulose to produce xylose, arabinose, glucose and other products.Biomass Bioenergy 23, 13.
Moraes, B.S., Zaiat, M., Bonomi, A., 2015. Anaerobic digestion of vinasse fromsugarcane ethanol production in Brazil: challenges and perspectives. Renew.Sustain. Energy Rev. 44, 888–903.
Rabelo, S.C., Carrere, H., Maciel Filho, R., Costa, A.C., 2011. Production of bioethanol,methane and heat from sugarcane bagasse in a biorefinery concept. Bioresour.Technol. 102 (17), 7887–7895.
Sanchez, O.J., Cardona, C.A., 2008. Trends in biotechnological production of fuelethanol from different feedstocks. Bioresour. Technol. 99 (13), 5270–5295.
Santucci, B.S., Maziero, P., Rabelo, S.C., Curvelo, A.A.S., Pimenta, M.T.B., 2015.Autohydrolysis of hemicelluloses from sugarcane bagasse during hydrothermalpretreatment: a kinetic assessment. BioEnergy Res.
Soccol, C.R., Vandenberghe, L.P.,Medeiros, A.B., Karp, S.G., Buckeridge,M., Ramos, L.P.,Pitarelo, A.P., Ferreira-Leitao, V., Gottschalk, L.M., Ferrara, M.A., da Silva Bon, E.P.,deMoraes, L.M., Araujo Jde, A., Torres, F.A., 2010. Bioethanol from lignocelluloses:status and perspectives in Brazil. Bioresour. Technol. 101 (13), 4820–4825.
Sun, J., 2004. Isolation and characterization of cellulose from sugarcane bagasse.Polym. Degrad. Stab. 84 (2), 331–339.
Vallejos, M.E., Zambon, M.D., Area, M.C., da Silva Curvelo, A.A., 2012. Low liquid–solid ratio (LSR) hot water pretreatment of sugarcane bagasse. Green Chem. 14(7), 1982.
Zhao, X., Zhou, Y., Liu, D., 2012. Kinetic model for glycan hydrolysis and formation ofmonosaccharides during dilute acid hydrolysis of sugarcane bagasse. Bioresour.Technol. 105, 160–168.