Optimization of the Analysis of Flavor Volatile Compounds byLiquid −Liquid Microextraction (LLME). Application to the Aroma
Analysis of Melons, Peaches, Grapes, Strawberries, andTomatoes
CHRISTOPHEAUBERT,* SEVERINE BAUMANN , AND HELENE ARGUEL
Centre Technique Interprofessionnel des Fruits et Le´gumes, route de Molle´ges,13210 Saint-Re´my-de-Provence, France
A fast method based on liquid-liquid microextraction (LLME) has been developed for the analysis ofvolatile compounds in fruit and vegetable juices. The method was tested in an aqueous solutioncontaining 49 common flavor compounds typically found in fruit aroma. Influence on extraction yieldof the salts used, their levels, and the time of extraction was investigated. The efficiency of n-propylgallate to inhibit the formation of secondary compounds from lipids during the crushing of fruit tissueswas also tested. The proposed method was then applied to several authentic samples such as melons,peaches, grapes, strawberries, and tomatoes. The advantages and limitations of LLME are discussed.
Liquid-liquid extraction (LLE) is certainly one of the mostfrequently reported methods in the literature for the isolationof volatile compounds in fruits and vegetables. Nevertheless,because LLE requires large amounts of high-purity solvents,this technique is relatively tedious and time-consuming andcauses serious environmental problems. Furthermore, extractsoften have to be concentrated hundreds of times, and loss ofanalytes and artifact formation, due to elevated temperatures,during the concentration step are generally observed. Numerousefforts have been made to improve the LLE methods, inparticular with the introduction of liquid-liquid microextraction(LLME) techniques. LLME is a single-step extraction with avery high liquid sample/solvent ratio and a saturation of theaqueous phase with inorganic salts. Microextractions avoid theconcentration process and reduce solvent consumption and timeof analysis. In the 1980s, Jennings (1) and Kok et al. (2) hadalready proposed analytical methods based on this idea, but theirresults were semiquantitative. Up to now, LLME has beenmainly used for pesticide residue determinations in water (3-6) or for volatiles analysis in grape (7) and wine (8-13). Exceptfor the method developed by Cacho et al. (7), including steamstream distillation and microextraction, no study using microex-traction has appeared in the literature on the determination ofaroma components in fruits and vegetables. The aim of this workwas to develope a fast and quantitative method for thedetermination of the main volatile compounds in fruits andvegetables. Melons, peaches, grapes, strawberries, and tomatoeshave been analyzed using the proposed method.
MATERIALS AND METHODS
Solvent and Chemicals.Analytical grade dichloromethane (Pestanal,g99.8%), ammonium sulfate (NH4)2SO4 (puriss. p.a.,g99%), ethanolabsolute (Spectranal,g99.8%), andn-alkane standards (C8-C40) werefrom Riedel-de Hae¨n, andn-propyl gallate (g98%) was from Fluka.A stock solution containing 49 reference compounds was prepared inethanol (Table 1). Reference compounds were obtained from varioussuppliers given in parentheses: no. 1-11, 13-15, 18-27, 32-37, 40-42, 44, 48, and 49 (Aldrich); no. 16, 17, 30, and 38 (Fluka); no. 12,28, 29, 31, 39, 43, and 45-47 (Interchim) (seeTable 1 for compoundnumbers). All reference compound purities were>95%. A flavor testsolution was prepared by taking 25µL of the stock solution and dilutingit to 500.0 mL with deionized water, giving∼1 ppm of each flavorcompound (except for Furaneol,∼3 ppm). A flavor standard solutionin dichloromethane was also prepared by taking 50µL of the stocksolution and diluting it to 10.0 mL.
Juice Sample Preparation.Amounts of 250 g of sample (fruit orvegetable), 250 mL ofn-propyl gallate (10 mM), and 25µL of 2-octanol(3.32µg/mL) (internal standard) were homogenized in a Waring blenderfor 2 min. The mixture was centrifuged (13000g, 5 min, 4°C), and thesupernatant was filtered on a stainless steel sieve (16 mesh).
Optimized LLME. Forty milliliters of the flavor test solution (orsample juice previously obtained) and 12.8 g of (NH4)2SO4 (32%; w/v)were agitated until complete salt dissolution and ultracentrifuged(21000g, 5 min, 4 °C). The supernatant was then filtered through aWhatman paper filter (grade 113v) into a 50 mL screw-capped conicalcentrifuge tube (34× 98 mm glass borosilicate) containing a magneticstir bar (15× 6 mm). Two hundred and fifty microliters of dichlo-romethane was added, and the mixture was extracted for 60 min undermagnetic stirring at 4°C. After removal of the magnetic stir bar, thetube was sonicated for 1 min in a Branson Ultrasonic Cleaner 5510and centrifuged (1000g, 5 min, 4 °C). The dichloromethane extractwas then recovered with a 50µL syringe, transferred to a 100µL vial,and immediately injected in GC-MS and GC-FID.
Conventional LLE. One hundred and fifty milliliters of the flavortest solution (or sample juice previously obtained) was extracted threetimes with 50 mL (3× 15 min) of dichloromethane under magneticstirring at 4°C. The solvent was then removed using a small Vigreuxcolumn at 50°C and concentrated to∼500 µL. The extract was thenimmediately injected in GC-MS and GC-FID.
Extraction Recoveries.The flavor test solution was extracted intriplicate using the optimized LLME and the conventional LLE methods.For both, the final volume of dichloromethane extract was preciselyrecovered and noted. To 50µL of each recovered extract was added50 µL of 4-nonanol (50 ppm), and the mixtures were homogenizedand injected in GC-FID. The recoveries were calculated as a percent,based on the ratio of the peak areas of the reference compoundsextracted to the peak area of 4-nonanol, using calibration graphs foreach standard constructed using solutions at known concentrations.
GC-FID Conditions. A Varian 3800 gas chromatograph equippedwith a SolGel-Wax (SGE) capillary column (30 m× 0.25 mm i.d.,
0.25 µm film thickness) was used. The flow of hydrogen 5.7 carriergas was 1 mL/min. The oven temperature was kept at 35°C for 5 min,then programmed to 150°C at 3°C/min and to 250°C at 5°C/min,and kept at 250°C for 10 min. Injections (2µL) were performed at220°C in splitless mode (3 min) using a CombiPAL autosampler (CTCAnalytics). The FID detector was kept at 250°C. The levels of thevolatile compounds in the authentic sample juices were expressed as2-octanol equivalents (assuming all of the response factors were 1).The concentrations are to be considered as relative data becauserecovery after extraction and calibration factors related to the standardwere not determined.
GC-MS Conditions. A Varian 3800 gas chromatograph was usedwith the same SolGel-Wax capillary column as above. Injections (1µL) were performed at 220°C in splitless mode (3 min) using aCombiPAL autosampler (CTC Analytics). The flow of helium 6.0carrier gas was 1 mL/min. The oven temperature program was as above.A Saturn ion-trap mass spectrometer was used. Mass spectra were
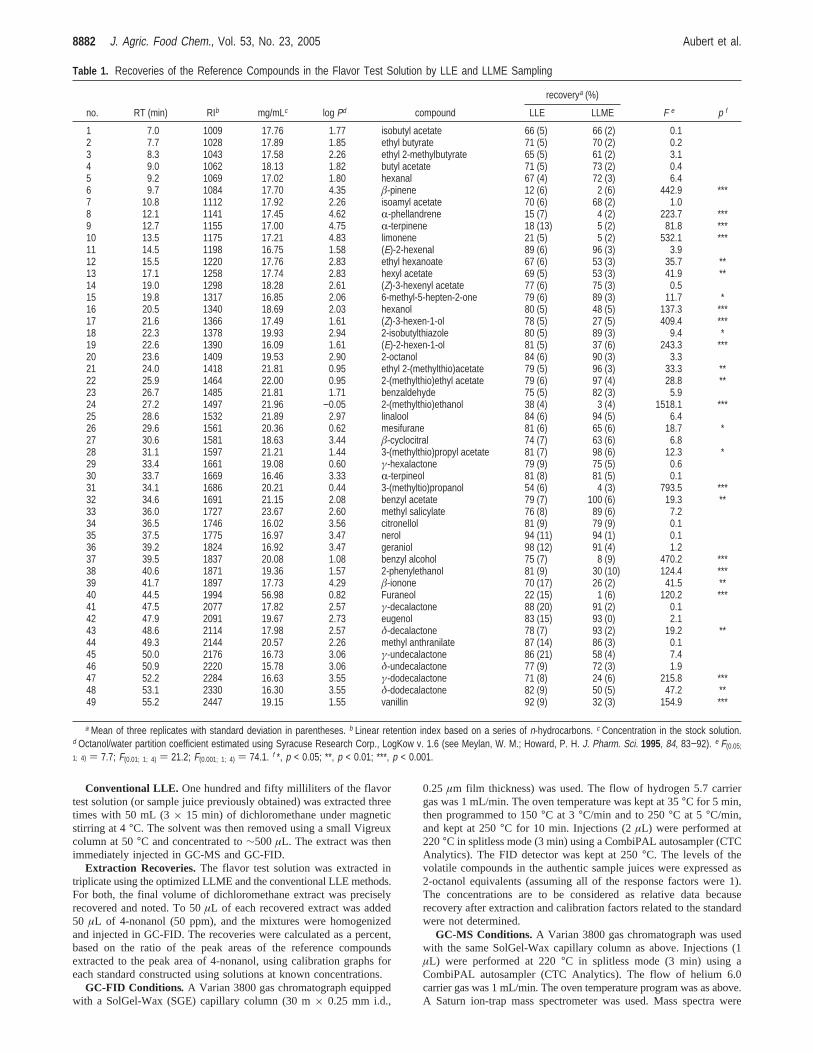
Table 1. Recoveries of the Reference Compounds in the Flavor Test Solution by LLE and LLME Sampling
recoverya (%)
no. RT (min) RIb mg/mLc log Pd compound LLE LLME F e p f
a Mean of three replicates with standard deviation in parentheses. b Linear retention index based on a series of n-hydrocarbons. c Concentration in the stock solution.d Octanol/water partition coefficient estimated using Syracuse Research Corp., LogKow v. 1.6 (see Meylan, W. M.; Howard, P. H. J. Pharm. Sci. 1995, 84, 83−92). e F(0.05;
1; 4) ) 7.7; F(0.01; 1; 4) ) 21.2; F(0.001; 1; 4) ) 74.1. f *, p < 0.05; **, p < 0.01; ***, p < 0.001.
8882 J. Agric. Food Chem., Vol. 53, No. 23, 2005 Aubert et al.
recorded in electron impact (EI) ionization mode. The ion trap, themanifold, and the transfer line temperatures were set, respectively, at150, 45, and 250°C. Mass spectra were scanned in the rangem/z 30-350 amu at 1 s intervals. Identifications were carried out by comparisonof linear retention indices and EI mass spectra with data from authenticcompounds.
RESULTS AND DISCUSSION
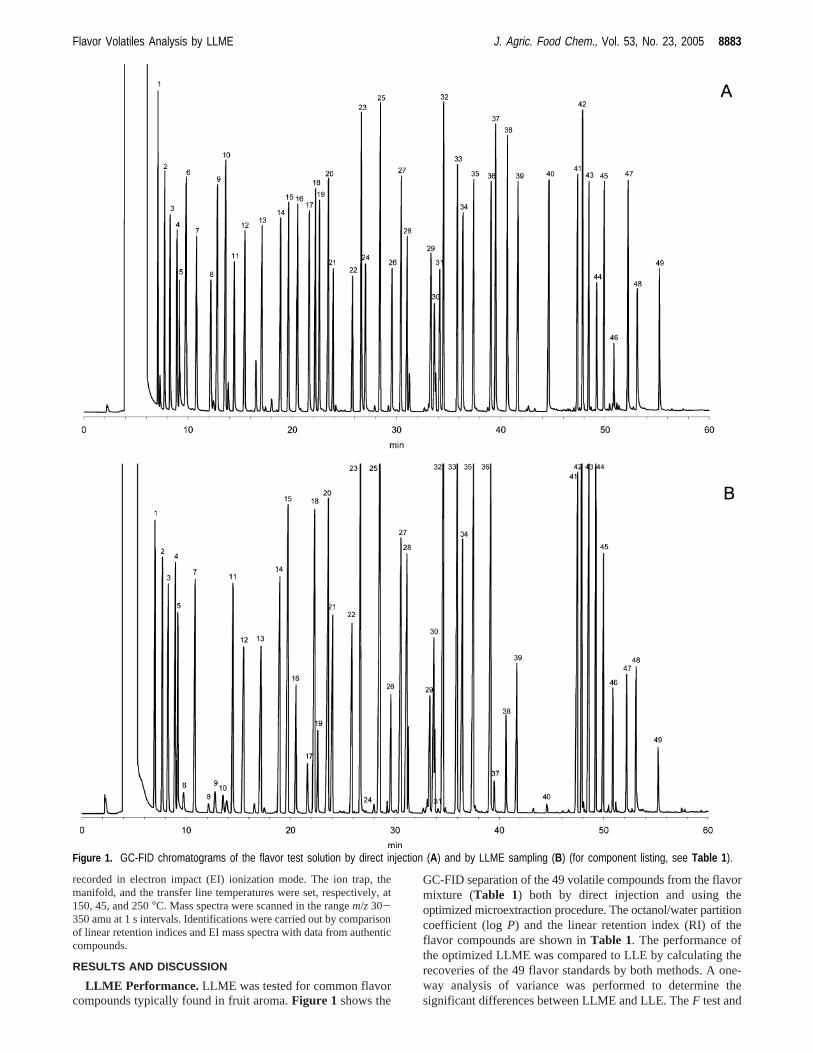
LLME Performance. LLME was tested for common flavorcompounds typically found in fruit aroma.Figure 1 shows the
GC-FID separation of the 49 volatile compounds from the flavormixture (Table 1) both by direct injection and using theoptimized microextraction procedure. The octanol/water partitioncoefficient (logP) and the linear retention index (RI) of theflavor compounds are shown inTable 1. The performance ofthe optimized LLME was compared to LLE by calculating therecoveries of the 49 flavor standards by both methods. A one-way analysis of variance was performed to determine thesignificant differences between LLME and LLE. TheF test and
Figure 1. GC-FID chromatograms of the flavor test solution by direct injection (A) and by LLME sampling (B) (for component listing, see Table 1 ).
Flavor Volatiles Analysis by LLME J. Agric. Food Chem., Vol. 53, No. 23, 2005 8883
thep value of the ANOVA are also given inTable 1. As seenin Figure 1 and Table 1, under the experimental conditionsemployed, most of the compounds are well extracted by LLME,particularly esters, thioesters, aldehydes, nitro compounds,terpenols, and lactones (exceptγ-dodecalactone). Generally, forthese compounds, most of recoveries were found to be similarbetween the two methods, except for thioesters, benzyl acetate,δ-decalactone, 2-isobutylthiazole, and 6-methyl-5-hepten-2-one,for which recoveries by LLME were found to be significantlyhigher. In contrast, those observed forγ-hexalactone, mesi-furane, hexyl acetate, ethyl hexanoate, andδ-dodecalactone werefound to be significantly lower by the LLME method. As seen
in Table 1, the main significant differences observed betweenthe two methods were observed for C6 alcohols,â-ionone, andthree shikimic-derivatives (vanillin, 2-phenylethanol, and benzylalcohol) and more particularly for terpenes, thioalcohols, andFuraneol, which are, respectively, fairly and badly extracted bythe LLME method. As observed inTable 1, except for ethyl2-(methylthio)acetate, 2-(methylthio)ethyl acetate, mesifurane,andγ-hexalactone, the efficiency of the LLME method is verypoor for compounds with a logP lower or higher than 1, andit would seem that the most polar, and/or apolar, compoundsare rather badly extracted by this method. Nevertheless, it isnoteworthy that terpenes and Furaneol are also fairly extracted
Figure 2. Effects of different (NH4)2SO4 concentrations on the relative levels of reference compounds extracted by LLME (for component listing, seeTable 1 ).
8884 J. Agric. Food Chem., Vol. 53, No. 23, 2005 Aubert et al.
by the conventional LLE.Table 1 shows the relative standarddeviations (%RSD) for the recovery of flavor compounds byLLME. Most of the compounds, even those badly extracted,had a very good %RSD. The average relative standard deviationof 4% was judged to be satisfactory compared to that observedfor LLE (8%). As observed inFigure 1, a detection limit ofthe order of 1-50 ppb was estimated for linalool, benzyl acetate,eugenol, geraniol, benzaldehyde, methyl salicylate, nerol, 2-oc-tanol, γ-decalactone,δ-decalactone, 6-methyl-5-hepten-2-one,
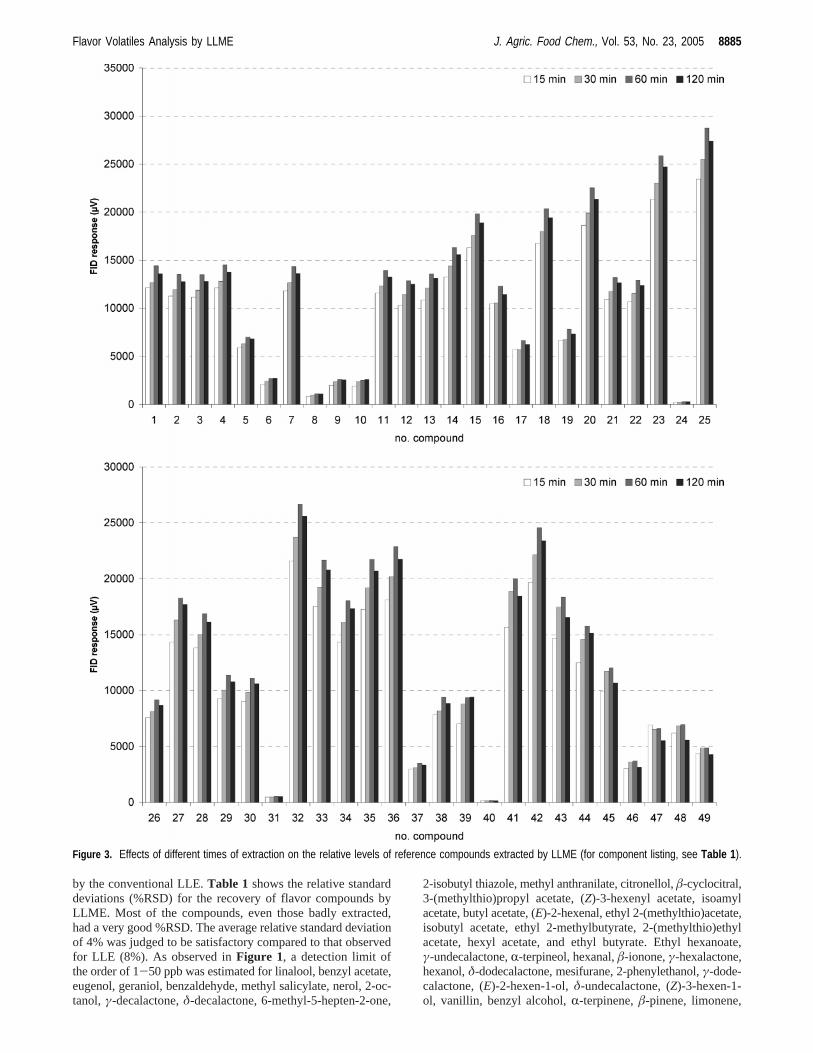
Figure 3. Effects of different times of extraction on the relative levels of reference compounds extracted by LLME (for component listing, see Table 1 ).
Flavor Volatiles Analysis by LLME J. Agric. Food Chem., Vol. 53, No. 23, 2005 8885
and R-phellandrene could be detected at 0.05-1 ppm. Adetection limit of 1 ppm was estimated for 2-(methylthio)-ethanol, 3-(methylthio)propanol, and Furaneol.
Extraction Optimization. In this study, different preliminaryexperiments were carried out using different salts (ammoniumsulfate, sodium chloride, and calcium chloride). They haveshown that ammonium sulfate was the most appropriate forachieving a good salting out effect. Use of sodium and/orcalcium chloride (20-80%; w/v) generally resulted in a lowerorganic phase recovery and a high emulsion formation tendency.Figure 2 shows the results of the extraction with differentamounts of (NH4)2SO4 (12.8-22.4 g of salt for 40 mL ofsample, i.e., 32-56%; w/v). Except for hexanol (16), (Z)-3-hexen-1-ol (17), (E)-2-hexen-1-ol (19), 2-(methylthio)ethanol(24), benzyl alcohol (37), 2-phenylethanol (38), Furaneol (40),and vanillin (49), the FID response drastically decreased withincreased amounts of salt, in particular for ethyl hexanoate (12),hexyl acetate (13), linalool (25),â-cyclocitral (27), nerol (35),geraniol (36), citronellol (34);â-ionone (39);γ-decalactone (41),γ- andδ-undecalactone (45, 46), andγ- andδ-dodecalactone(47, 48). Best results were observed with 32% ammoniumsulfate. The time of extraction has also a great influence on theextraction efficiency.Figure 3 shows the results of the extractionwith different times of extraction (15-60 min). Best results wereobserved with 60 min.
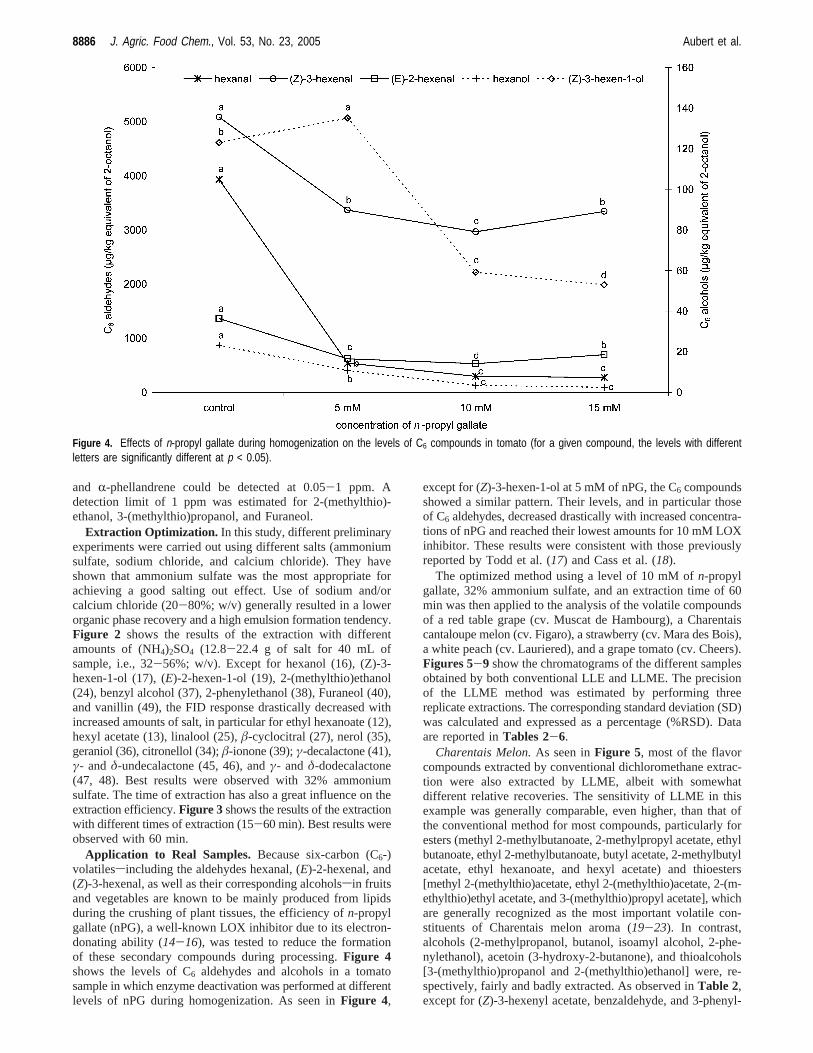
Application to Real Samples. Because six-carbon (C6-)volatilessincluding the aldehydes hexanal, (E)-2-hexenal, and(Z)-3-hexenal, as well as their corresponding alcoholssin fruitsand vegetables are known to be mainly produced from lipidsduring the crushing of plant tissues, the efficiency ofn-propylgallate (nPG), a well-known LOX inhibitor due to its electron-donating ability (14-16), was tested to reduce the formationof these secondary compounds during processing.Figure 4shows the levels of C6 aldehydes and alcohols in a tomatosample in which enzyme deactivation was performed at differentlevels of nPG during homogenization. As seen inFigure 4,
except for (Z)-3-hexen-1-ol at 5 mM of nPG, the C6 compoundsshowed a similar pattern. Their levels, and in particular thoseof C6 aldehydes, decreased drastically with increased concentra-tions of nPG and reached their lowest amounts for 10 mM LOXinhibitor. These results were consistent with those previouslyreported by Todd et al. (17) and Cass et al. (18).
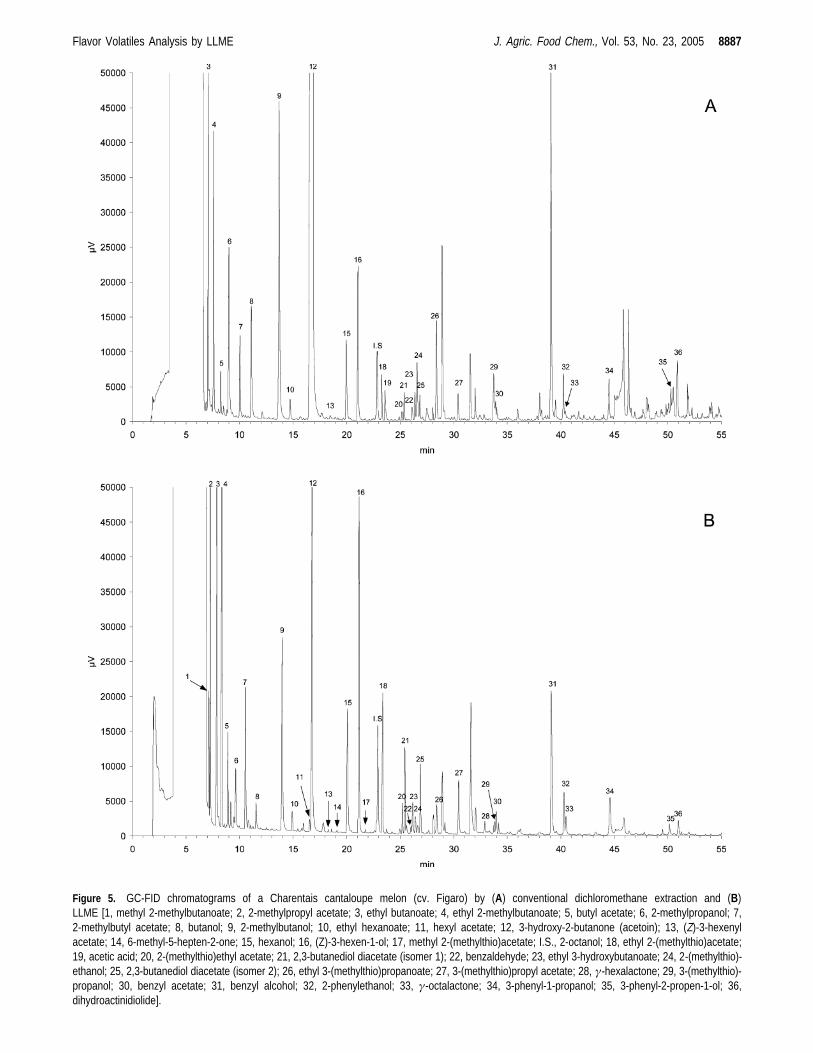
The optimized method using a level of 10 mM ofn-propylgallate, 32% ammonium sulfate, and an extraction time of 60min was then applied to the analysis of the volatile compoundsof a red table grape (cv. Muscat de Hambourg), a Charentaiscantaloupe melon (cv. Figaro), a strawberry (cv. Mara des Bois),a white peach (cv. Lauriered), and a grape tomato (cv. Cheers).Figures 5-9 show the chromatograms of the different samplesobtained by both conventional LLE and LLME. The precisionof the LLME method was estimated by performing threereplicate extractions. The corresponding standard deviation (SD)was calculated and expressed as a percentage (%RSD). Dataare reported inTables 2-6.
Charentais Melon.As seen inFigure 5, most of the flavorcompounds extracted by conventional dichloromethane extrac-tion were also extracted by LLME, albeit with somewhatdifferent relative recoveries. The sensitivity of LLME in thisexample was generally comparable, even higher, than that ofthe conventional method for most compounds, particularly foresters (methyl 2-methylbutanoate, 2-methylpropyl acetate, ethylbutanoate, ethyl 2-methylbutanoate, butyl acetate, 2-methylbutylacetate, ethyl hexanoate, and hexyl acetate) and thioesters[methyl 2-(methylthio)acetate, ethyl 2-(methylthio)acetate, 2-(m-ethylthio)ethyl acetate, and 3-(methylthio)propyl acetate], whichare generally recognized as the most important volatile con-stituents of Charentais melon aroma (19-23). In contrast,alcohols (2-methylpropanol, butanol, isoamyl alcohol, 2-phe-nylethanol), acetoin (3-hydroxy-2-butanone), and thioalcohols[3-(methylthio)propanol and 2-(methylthio)ethanol] were, re-spectively, fairly and badly extracted. As observed inTable 2,except for (Z)-3-hexenyl acetate, benzaldehyde, and 3-phenyl-
Figure 4. Effects of n-propyl gallate during homogenization on the levels of C6 compounds in tomato (for a given compound, the levels with differentletters are significantly different at p < 0.05).
8886 J. Agric. Food Chem., Vol. 53, No. 23, 2005 Aubert et al.
Flavor Volatiles Analysis by LLME J. Agric. Food Chem., Vol. 53, No. 23, 2005 8887
2-propen-1-ol, the relative standard deviation values were below10%. With an average relative standard deviation of 7.2%, theprecision of the proposed method was judged to be satisfactorycompared with other isolation procedures.
Grape Tomato.As seen inFigure 6, C6 compounds [hexanal,(Z)-3-hexenal, (E)-2-hexenal, and (Z)-3-hexen-1-ol], nitro com-pounds (isobutyl cyanide, 1-nitro-3-methylbutane, 2-isobutylthi-azole, and 1-nitro-2-phenylethane), methyl salicylate, and
2-phenylethanol, compounds previously identified as importantaroma components in tomato flavor (24, 25), were generallybetter extracted by LLME. As previously observed, polarcompounds such as isovaleric acid and isoamyl alcohol werepoorly extracted compared to the classical LLE. As indicatedin Table 3, the %RSD values ranged between 1 and 8.6%. Withan average relative standard deviation of 5.2%, the precisionof the method in this example was judged to be very good.
8888 J. Agric. Food Chem., Vol. 53, No. 23, 2005 Aubert et al.
Red Table Grape.The importance of the terpenoid fractionin the characteristic “floral” aroma of Muscat grapes is nowwidely accepted, linalool, geraniol, nerol, citronellol,R-terpineol,and linalool oxides being, qualitatively and quantitatively, themain volatile compounds (26). As shown inFigure 7, excepted
for butanol, 3-penten-2-ol, acetoin (3-hydroxy-2-butanone),1-methyl-2-pyrrolidinone, and benzyl alcohol, the sensitivity ofthe LLME is comparable to that of the conventional method,in particular for C6 aldehydes [hexanal and (E)-2-hexenal],monoterpenols (linalool, geraniol, nerol, citronellol, andR-ter-
Flavor Volatiles Analysis by LLME J. Agric. Food Chem., Vol. 53, No. 23, 2005 8889
pineol), linalool oxides [furan and pyran linalool oxides (E, Z)],and geranic acid. As mentioned inTable 4, the %RSD values,ranging between 0.6 and 11.2%, were acceptable, the averagerelative standard deviation being∼6%.
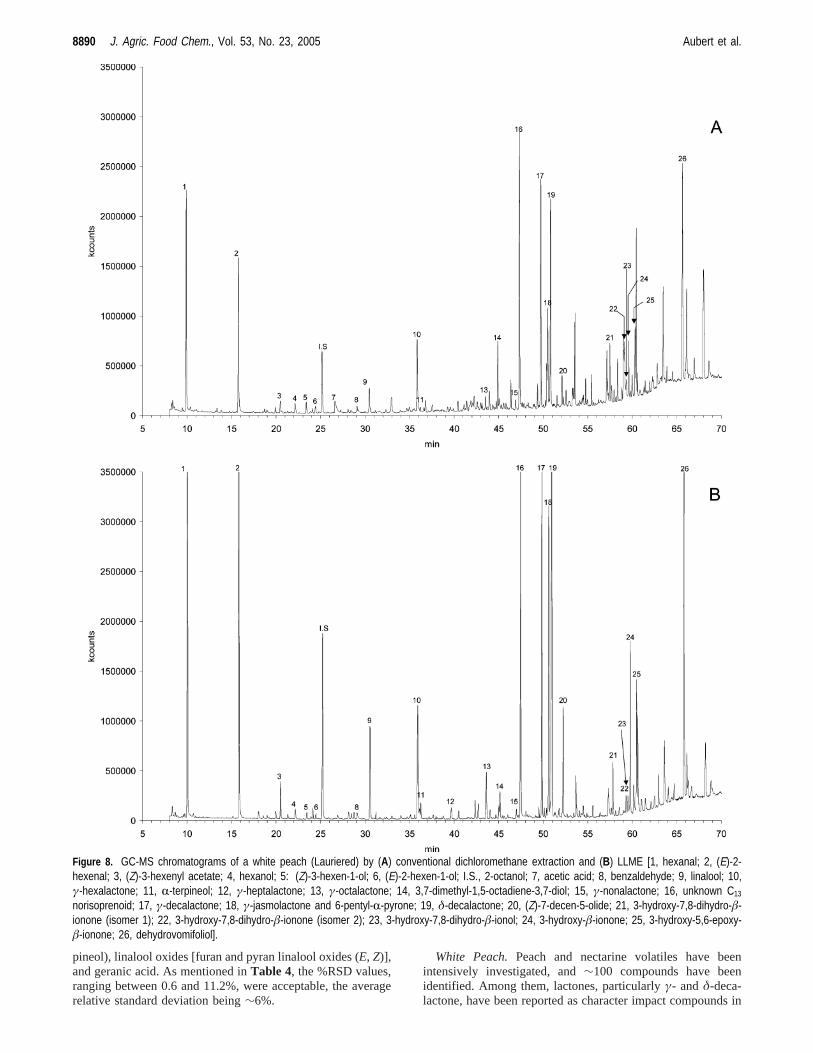
White Peach.Peach and nectarine volatiles have beenintensively investigated, and∼100 compounds have beenidentified. Among them, lactones, particularlyγ- andδ-deca-lactone, have been reported as character impact compounds in
8890 J. Agric. Food Chem., Vol. 53, No. 23, 2005 Aubert et al.
peach flavor. The importance of other volatiles, such as C6
aldehydes, terpenes, and C13 norisoprenoid compounds, has beenalso previously described (27-31). As seen inFigure 8, mostof the compounds were generally better extracted by LLME,in particular C6 aldehydes [hexanal and (E)-2-hexenal], linalool,
lactones [γ- C6, C7, C8, C10, δ-C10, and (Z)-7-decen-5-olide],and C13 norisoprenoid compounds (3-hydroxy-â-ionone, 3-hy-droxy-5,6-epoxy-â-ionone, and 4,5-dihydrovomifoliol).Table5 shows the precision of the method in this example. Exceptfor an unknown C13 norisoprenoid compound and 3-hydroxy-
Flavor Volatiles Analysis by LLME J. Agric. Food Chem., Vol. 53, No. 23, 2005 8891
7,8-dihydro-â-ionone (isomer 2), the %RSD values, rangingbetween 0.6 and 12.8%, were judged to be satisfactory, theaverage relative standard deviation being∼7%.
Strawberry. Because of its typical aroma, the volatilecompounds of strawberry have been extensively studied, and>360 volatiles have been reported (37-43). Due to their verylow odor threshold and their large amounts in several cultivars,Furaneol [2,5-dimethyl-4-hydroxy-3(2H)-furanone] (DHF) andmesifurane [2,5-dimethyl-4-methoxy-3(2H)-furanone] (DMF)are considered to be the two major flavor contributors. Previousstudies have shown that linalool and esters, in particular, ethyl2-methylbutanoate, methyl and ethyl butanoates, methyl andethyl hexanoates, and hexyl and (E)-hex-2-enyl acetates, alsosignificantly contribute to the strawberry aroma. Methyl an-thranilate, which is characterized by an intense spicy-aromaticand flowery note, could be, according to Ulrich et al. (44),responsible for the typical character of the wild strawberryaroma. Finally, acids are generally described to have no impacton strawberry flavor, except for 2-methylbutanoic acid due toits relatively low odor threshold (180 ppb). As seen inFigure
9, the sensitivity of LLME is generally comparable to, or evenhigher than, that of the conventional LLE method for esters(ethyl butanoate, ethyl 2-methylbutanoate, butyl acetate, andmethyl hexanoate), C6 dldehydes [hexanal and (E)-2-hexenal],linalool, and mesifurane [2,5-dimethyl-4-methoxy-3(2H)-fura-none]. In contrast, acids (2-methylpropanoic, butanoic, 2-me-thylbutanoic, and hexanoic acids) and Furaneol [2,5-dimethyl-
Table 2. Levelsa of Volatile Compounds in Charentais Melon (Cv.Figaro)
no. RIbassign-mentc compound mean SD %RSD
1 1003 A methyl 2-methylbutanoate 147.3 10.1 6.92 1009 A 2-methylpropyl acetate 579.3 43.6 7.53 1028 A ethyl butanoate 1488.1 92.9 6.24 1043 A ethyl 2-methylbutanoate 1040.2 86.7 8.35 1062 A butyl acetate 211.5 13.8 6.56 1068 A 2-methylpropanol 160.6 11.6 7.27 1112 A 2-methylbutyl acetate 397.8 30.2 7.68 1118 A butanol 82.5 5.6 6.89 1182 A 2-methylbutanol 641.5 33.4 5.210 1220 A ethyl hexanoate 50.5 4.6 9.211 1258 A hexyl acetate 24.4 2.4 9.812 1265 A 3-hydroxy-2-butanone
(acetoin)1330.2 101.5 7.6
13 1298 A (Z)-3-hexenyl acetate 3.6 0.5 14.714 1317 A 6-methyl-5-hepten-2-one 5.6 0.3 5.815 1340 A hexanol 415.0 20.2 4.916 1366 A (Z)-3-hexen-1-ol 891.2 34.0 3.817 1386 A methyl 2-(methyl-
thio)acetate4.4 0.2 3.7
18 1418 A ethyl 2-(methyl-thio)acetate
331.2 15.8 4.8
20 1464 A 2-(methylthio)ethylacetate
71.8 3.5 4.9
21 1483 C 2,3-butanediol diacetate(isomer 1)
198.2 10.6 5.3
22 1485 A benzaldehyde 5.8 1.3 21.823 1497 C ethyl 3-hydroxybutanoate 89.9 6.0 6.624 1502 A 2-(methylthio)ethanol 48.3 2.3 4.825 1521 C 2,3-butanediol diacetate
(isomer 2)164.4 9.4 5.7
26 1561 A ethyl 3-(methyl-thio)propanoate
101.3 4.2 4.1
27 1597 A 3-(methylthio)propyl acetate 170.8 9.4 5.528 1661 A γ-hexalactone 24.7 2.3 9.329 1686 A 3-(methylthio)propanol 35.9 2.4 6.730 1691 A benzyl acetate 184.1 10.7 5.831 1837 A benzyl alcohol 575.5 33.8 5.932 1871 A 2-phenylethanol 166.9 8.5 5.133 1878 A γ-octalactone 57.8 5.0 8.734 1985 C 3-phenyl-1-propanol 195.8 15.0 7.735 2121 C 3-phenyl-2-propen-1-ol 42.7 4.3 10.236 2156 C dihydroactinidiolide 90.3 7.9 8.8
a Values expressed in µg/kg equiv of 2-octanol. b Linear retention index basedon a series of n-hydrocarbons. c A, identity confirmed by comparing mass spectraand retention time with those of authentic standards; C, tentatively identified.
Table 3. Levelsa of Volatile Compounds in Grape Tomato (Cv.Cheers)
no. RIbassign-mentc compound mean SD %RSD
1 1069 A hexanal 45.9 2.5 5.42 1090 C isobutyl cyanide 124.2 6.4 5.23 1096 C (E)-2-pentenal 18.5 1.1 6.04 1111 A (Z)-3-hexenal 887.1 33.6 3.85 1182 A isoamyl alcohol 208.8 17.5 8.46 1198 A (E)-2-hexenal 211.5 16.0 7.57 1308 B (25) 1-nitro-3-methylbutane 755.2 22.1 2.98 1317 A 6-methyl-5-hepten-2-one 33.7 1.2 3.69 1340 A hexanol 2.4 0.1 4.010 1366 A (Z)-3-hexen-1-ol 50.1 3.3 6.511 1378 A 2-isobutylthiazole 86.0 0.9 1.012 1461 C 6-methyl-5-hepten-2-ol 21.2 0.5 2.213 1488 C 2-ethyl-1-hexanol 44.1 0.7 1.514 1485 A benzaldehyde 11.1 0.6 5.015 1581 A isovaleric acid 7.4 0.6 7.916 1717 A geranial 1.6 0.1 3.917 1727 A methyl salicylate 29.9 1.3 4.418 1826 A guaiacol 7.6 0.6 8.219 1837 A benzyl alcohol 16.0 0.6 3.620 1871 A 2-phenylethanol 187.5 9.2 4.921 2032 B (25) 1-nitro-2-phenylethane 43.8 1.6 3.822 2091 A eugenol 12.2 0.9 7.623 2156 C dihydroactinidiolide 12.4 1.1 8.6
a Values expressed in µg/kg equiv of 2-octanol. b Linear retention index basedon a series of n-hydrocarbons. c A, identity confirmed by comparing mass spectraand retention time with those of authentic standards; B, identity tentatively assignedby comparing mass spectra with those obtained from the literature numbered anditalicized in parentheses; C, tentatively identified.
Table 4. Levelsa of Volatile Compounds in Red Table Grape (Cv.Muscat de Hambourg)
no. RIbassign-mentc compound mean SD %RSD
1 1069 A hexanal 168.2 4.0 2.44 1198 A (E)-2-hexenal 424.5 11.0 2.67 1340 A hexanol 16.7 1.1 6.68 1366 A (Z)-3-hexen-1-ol 3.3 0.4 11.29 1430 A (E)-furan linalool oxide 16.4 0.8 4.611 1460 A (Z)-furan linalool oxide 20.6 1.1 5.112 1532 A linalool 262.9 9.6 3.713 1602 C hotrienol 10.4 1.0 9.515 1668 A R-terpineol 9.3 0.7 7.016 1716 A (E)-pyran linalool oxide 115.0 10.0 8.717 1741 A (Z)-pyran linalool oxide 43.7 3.8 8.718 1746 A citronellol 22.1 0.6 2.718 1775 A nerol 58.4 0.4 0.621 1824 A geraniol 160.8 3.5 2.222 1837 A benzyl alcohol 28.0 2.7 9.623 1871 A 2-phenylethanol 13.7 1.3 9.224 1910 A 3,7-dimethyl-1,7-octadiene-
3,7-diol28.0 2.2 7.9
25 2042 A 2,6-dimethyl-1,7-octadiene-3,6-diol
11.0 1.0 9.4
26 2151 A geranic acid 426.9 27.8 6.5
a Values expressed in µg/kg equiv of 2-octanol. b Linear retention index basedon a series of n-hydrocarbons. c A, identity confirmed by comparing mass spectraand retention time with those of authentic standards; C, tentatively identified.
8892 J. Agric. Food Chem., Vol. 53, No. 23, 2005 Aubert et al.
4-hydroxy-3(2H)-furanone] are poorly extracted by LLME. Dueto its water-soluble nature and its thermal instability, Furaneol(DHF) has always proved to be difficult to isolate by otherisolation procedures (dynamic headspace, simultaneous distil-lation-extraction, or solid phase microextraction), and in moststudies this compound is rarely quantified (45-53). Probablythat the most reliable and accurate method for the quantitativeanalysis of DHF, and its methyl ether, is the stable isotopedilution analysis described by Sen et al. (54). Except for2-methylbutanoic acid, which could contribute to strawberryaroma, the low affinity of LLME for fatty acids could beadvantageous, for example, by reducing possible coelution ofthese compounds with other trace flavor constituents. Asobserved inTable 6, the %RSD values ranged between 0.3 and24.1%. With an average relative standard deviation of 8.3%,the precision of the method in this example was judged to beacceptable.
Conclusion. Traditional LLE of volatile compounds is awidely used technique. However, this method involves largeamounts of solvents, laborious and time-consuming extractionphases, and a possible thermal degradation of volatiles duringthe concentration step. In comparison, LLME provides manyadvantages. LLME is fast and simple and uses microquantitiesof solvent. Because this method requires no concentration step,
LLME is less time-consuming than LLE and minimizes the riskof a thermal degradation of volatile compounds and the possibleartifacts formation. This method also produces cleaner chro-matograms compared with conventional LLE and prevents fastercolumn degradation and rapid contamination of the MS source.Compared to conventional solvent extraction, except for somecompounds, the sensitivity of LLME is generally comparableto, or even higher than, that for most volatile compounds.Finally, this method is generally as precise as classical extrac-tions, or even better, and LLME is an interesting alternativefor the analysis of volatile compounds in fruit and vegetablejuices.
LITERATURE CITED
(1) Jenning, W. Recent development in high-resolution GC. InFlaVour ’81; Schreier, P., Ed.; de Gruyter: Berlin, Germany,1981; pp 233-251.
(2) Kok, M. F.; Yong, F. M.; Lim, G. Rapid extraction method forreproducible analysis of aroma volatiles.J. Agric. Food Chem.1987, 35, 779-781.
(3) Jeannot, M. A.; Cantwell, F. F. Solvent microextraction into asingle drop.Anal. Chem.1996, 68, 2236-2240.
(4) Beltran, J.; Lopez, F. J.; Forcada, M.; Hernandez, F. Microex-traction procedures combined with large volume injection incapillary gas chromatography for the determination of pesticideresidues in environmental aqueous samples.Anal. Chim. Acta1997, 356, 125-133.
(5) Ma, M.; Cantwell, F. F. Solvent microextraction with simulta-neous back-extraction for sample cleanup and preconcentra-tion: quantitative extraction.Anal. Chem.1998, 70, 3912-3919.
(6) Fernandez-Gutierrez, A.; Martinez-Vidal, J. L.; Arrebola-Lie-banas, F. J.; Gonzalez-Casado, A.; Vilchez, J. L. Determination
Table 5. Levelsa of Volatile Compounds in White Peach (Cv.Lauriered)
no. RIbassign-mentc compound mean SD %RSD
1 1069 A hexanal 1263.8 48.0 3.82 1198 A (E)-2-hexenal 1031.5 27.4 2.73 1298 A (Z)-3-hexenyl acetate 43.3 5.5 12.84 1340 A hexanol 18.2 0.4 2.45 1366 A (Z)-3-hexenol 11.7 0.8 6.96 1390 A (E)-2-hexenol 9.9 0.7 7.58 1485 A benzaldehyde 24.7 1.1 4.49 1532 A linalool 159.0 6.1 3.810 1661 A γ-hexalactone 452.1 9.0 2.011 1669 A R-terpineol 15.4 0.5 3.412 1777 C γ-heptalactone 23.2 0.9 3.913 1878 A γ-octalactone 100.2 4.6 4.514 1910 C 3,7-dimethyl-1,5-octa-
17 2075 A γ-decalactone 1004.3 100.8 10.018 2081 B (32) γ-jasmolactone + 6-pentyl-
R-pyrone636.1 36.9 5.8
19 2114 A δ-decalactone 1186.6 118.9 10.020 2121 B (27) (Z)-7-decen-5-olide 206.7 14.3 6.921 2269 B (33) 3-hydroxy-7,8-dihydro-â-
ionone (isomer 1)111.5 1.3 1.2
22 2310 B (33) 3-hydroxy-7,8-dihydro-â-ionone (isomer 2)
13.6 4.6 33.9
23 2315 B (34) 3-hydroxy-7,8-dihydro-â-ionol
17.3 1.1 6.5
24 2317 B (35) 3-hydroxy-â-ionone 524.1 3.0 0.625 2339 B (33) 3-hydroxy-5,6-epoxy-
â-ionone397.9 9.5 2.4
26 2472 B (36) 4,5-dihydrovomifoliol 1828.0 33.7 1.8
a Values expressed in µg/kg equiv of 2-octanol. b Linear retention index basedon a series of n-hydrocarbons. c A, identity confirmed by comparing mass spectraand retention time with those of authentic standards; B, identity tentatively assignedby comparing mass spectra with those obtained from the literature numbered anditalicized in parentheses; C, tentatively identified. d Major mass spectral fragments[m/e (%)]: 108 (100), 43 (70), 206 (69), 93 (67), 39 (62), 150 (44), 77 (30), 41(28), 121 (27), 136 (26).
Table 6. Levelsa of Volatile Compounds in Strawberry (Cv. Mara desBois)
no. RIbassign-mentc compound mean SD %RSD
1 1028 A ethyl butanoate 515.2 14.6 2.82 1043 A ethyl 2-methylbutanoate 66.8 3.0 4.53 1062 A butyl acetate 42.6 0.4 1.04 1069 A hexanal 27.3 1.9 6.85 1159 A methyl hexanoate 207.7 19.1 9.26 1198 A (E)-2-hexenal 165.0 16.2 9.87 1120 A ethyl hexanoate 33.1 1.6 4.98 1258 A hexyl acetate 10.9 0.7 6.89 1319 A (E)-2-hexenyl acetate 42.2 4.1 9.8
10 1340 A hexanol 21.8 2.4 11.111 1366 A (Z)-3-hexen-1-ol 5.0 0.8 15.812 1390 A (E)-2-hexen-2-ol 34.1 2.8 8.113 1430 A (E)-furan linalool oxide 5.8 0.6 10.514 1461 A (Z)-furan linalool oxide 9.9 0.3 3.415 1532 A linalool 251.5 12.9 5.116 1561 A 2-methylpropanoic acid 34.4 4.6 13.517 1565 A mesifurane 1848.8 156.9 8.518 1624 A butanoic acid 29.8 3.7 12.319 1665 A 2-methylbutanoic acid 376.8 51.5 13.720 1691 A benzyl acetate 81.6 2.5 3.121 1743 A methyl salicylate 15.9 0.6 3.922 1761 C methyl nicotinate 15.1 2.1 13.623 1826 A hexanoic acid 764.4 39.8 5.224 1994 A Furaneol 97.2 15.5 15.925 2006 C nerolidol 17.9 4.3 24.126 2091 A eugenol 3.2 0.0 0.327 2114 A δ-decalactone 4.5 0.3 6.228 2144 A methyl anthranilate 58.8 1.5 2.5
a Values expressed in µg/kg equiv of 2-octanol. b Linear retention index basedon a series of n-hydrocarbons. c A, identity confirmed by comparing mass spectraand retention time with those of authentic standards; C, tentatively identified.
Flavor Volatiles Analysis by LLME J. Agric. Food Chem., Vol. 53, No. 23, 2005 8893
of endosulfan and some pyrethroids in waters by micro liquid-liquid extraction and GC-MS.Fresenius’ J. Anal. Chem.1998,360, 568-572.
(7) Cacho, J.; Melendez, J.; Ferreira, V. Development of a methodfor analyzing volatiles from foodstuff matrices, including mi-croextraction by demixture. Application to the analysis of grapes.Mikrochim. Acta1992, 108, 61-72.
(8) Ferreira, V.; Rapp, A.; Cacho, J. F.; Hastrich, H.; Yavas, I. Fastand quantitative determination of wine flavor compounds usingmicroextraction with Freon 113.J. Agric. Food Chem.1993,41, 1413-1420.
(9) Moio, L.; Chambellant, E.; Lesschaeve, I.; Issanchou, S.; Schlich,P.; Etievant, P. X. Production of representative wine extractsfor chemical and olfactory analysis.Ital. J. Food Sci. 1995, 3,265-277.
(10) Ferreira, V.; Escudero, A.; Lopez, R.; Cacho, J. F. Analyticalcharacterization of the flavor of oxygen-spoiled wines throughthe gas chromatography-ion-trap mass spectrometry of ultratraceodorants: optimisation of conditions.J. Chromatogr. Sci.1998,36, 331-339.
(11) Ferreira, V.; Lopez, R.; Escudero, A.; Cacho, J. F. Quantitativedetermination of trace and ultratrace flavour active compoundsin red wines through gas chromatographic-ion trap massspectrometric analysis of microextracts.J. Chromatogr. A1998,806, 349-354.
(12) Saenz-Barrio, C.; Cedron-Fernandez, T. Microextraction ofvolatile compounds from wine samples and their determinationby GC-FID. The effect of the salts and extraction solvents used.Chromatographia2000, 51, 221-225.
(13) Ortega, C.; Lopez, R.; Cacho, J.; Ferreira, V. Fast analysis ofimportant wine volatile compounds. Development and validationof a new method based on gas chromatographic-flame ionisationdetection analysis of dichloromethane microextracts.J. Chro-matogr. A2001, 923, 205-214.
(14) Gunckel, S.; Santander, P.; Cordano, G.; Ferreira, J.; Munoz,S.; Nunez-Vegara, L. J.; Squella, J. A. Antioxidant activity ofgallates: An electrochemical study in aqueous media.Chem.Biol. Interact.1998, 114, 45-49.
(15) Kristie, D.; Thompson, J. E. Inhibition of lipoxygenase activ-ity: a cautionary note.Phytochemistry1989, 28, 2577-2581.
(16) Luning, P. A.; Carey, A. T.; Roozen, J. P.; Wichers, H. J.Characterisation and occurrence of lipoxygenase in bell peppersat different ripening stages in relation to the formation of volatileflavor compounds.J. Agric. Food Chem.1995, 42, 1492-1500.
(17) Todd, J. F.; Paliyath, G.; Thompson, J. E. Characteristics of amembrane-associated lipoxygenase in tomato fruit.Plant Physiol.1990, 94, 1225-1232.
(18) Cass, B. J.; Schade, F.; Robinson, C. W.; Thompson, J. E.; Legge,R. L. Production of tomato flavor volatiles from a crude enzymepreparation using a hollow-fiber reactor.Biotechnol. Bioeng.2000, 67, 372-377.
(19) Homatidou, V.; Karvouni, S.; Dourtoglou, V. Determination ofcharacteristic aroma components of “Cantaloupe”Cucumis melousing multidimensional gas chromatography (MDGC). InFlaVorsand Off-FlaVors; Proceedings of the 6th International FlavorConference, Crete, Greece; Charlambous, G., Ed.; Elsevier:Amsterdam, The Netherlands, 1989; pp 1011-1023.
(20) Homatidou, V. I.; Karvouni, S. S.; Dourtoglou, V. G.; Poulos,C. N. Determination of total volatile components ofCucumismeloL. variety Cantaloupensis.J. Agric. Food Chem.1992, 40,1385-1388.
(21) Bauchot, A. D.; Motram, D. S.; Dodson, A. T.; John, P. Effectof aminocyclopropane-1-carboxylic acid oxidase antisense geneon the formation of volatile esters in Cantaloupe Charentaismelon (cv. Vedrantais).J. Agric. Food Chem.1998, 46, 4787-4792.
(22) Flores, F.; El Yahyaoui, F.; de Billerbeck, G.; Romojaro, F.;Latche, A.; Bouzayen, M.; Pech, J. C.; Ambid, C. Role ofethylene in the biosynthetic pathway of aliphatic ester aromavolatiles in Charentais Cantaloupe melons.J. Exp. Bot. 2002,53, 201-206.
(23) Aubert, C.; Bourger, N. Investigation of volatiles in CharentaisCantaloupe melons (Cucumis melovar.cantalupensis). Charac-terization of aroma constituents in some cultivars.J. Agric. FoodChem.2004, 52, 4522-4528.
(24) Buttery, R. G.; Teranishi, R.; Ling, L. C.; Flath, R. A.; Stern,D. J. Quantitative studies on origins of fresh tomato aromavolatiles.J. Agric. Food Chem.1988, 36, 1247-1250.
(25) Buttery, R. G.; Teranishi, R.; Flath, R. A.; Ling, L. C. Freshtomato volatiles. Composition and sensory studies. InFlaVorsChemistry, Trends and DeVelopments; Teranishi, R., Buttery, R.G., Shahidi, F., Eds.; ACS Symposium Series 388; AmericanChemical Society: Washington, DC, 1989; pp 213-222.
(26) Mateo, J. J.; Jimenez, M. Monoterpenes in grape juice and wines(review).J. Chromatogr. A 2000, 881, 557-567.
(27) Engel, K. H.; Flath, R. A.; Buttery, R. G.; Mon, T. R.; Ramming,D. W.; Teranashi, R. Investigation of volatile constituents innectarines. 1. Analytical and sensory characterization of aromacomponents in some nectarine cultivars.J. Agric. Food Chem.1988, 36, 549-533.
(28) Horvat, R. J.; Chapman, G. W.; Robertson, J. A.; Meredith, F.I.; Scorza, R.; Callahan, A. M.; Morgens, P. Comparison of thevolatile compounds from several commercial peach cultivars.J. Agric. Food Chem.1990, 38, 234-237.
(29) Berger, R. G. Fruits, I. InVolatile Compounds in Foods andBeVerages; Maarse, H., Ed.; Dekker: New York, 1991; pp 291-304.
(30) Takeoka, G. R.; Flath, R. A.; Buttery, R. G.; Winterhalter, P.;Guntert, M.; Ramming, D. W.; Teranishi, R. Free and boundflavor constituents of white-fleshed nectarines. InFlaVorPrecursorssThermal and Enzymatic ConVersions; ACS Sym-posium Series 490; Teranishi, R., Takeoka, G. R., Gu¨ntert, M.,Eds.; American Chemical Society: Washington, DC, 1992; pp116-138.
(31) Aubert, C.; Gu¨nata, Z.; Ambid, C.; Baumes, R. Changes inphysicochemical characteristics and volatile constituents ofyellow- and white-fleshed nectarines during maturation andartificial ripening.J. Agric. Food Chem.2003, 51, 3083-3091.
(32) Derail, C.; Hofmann, T.; Schieberle, P. Differences in keyodorants of handmade juice of yellow-flesh peaches (PrunuspersicaL.) induced by the workup procedure.J. Agric FoodChem.1999, 47, 4742-4745.
(33) Krammer, G.; Winterhalter, P.; Schwab, M.; Schreier, P.Glycosidally bound aroma compounds in the fruits ofPrunusspecies apricot (P. armenica, L.), peach (P. persica, L.), yellowplum (P. domestica, L. srp Syriaca).J. Agric. Food Chem.1991,39, 778-781.
(34) Winterhalter, P.; Schreier, P. Free and bound C13 norisoprenoidsin quince (Cydonia oblongaMill.) fruit. J. Agric. Food Chem.1988, 36, 1251-1256.
(35) Guldner, A. P.; Winterhalter, P. Structure of two iononeglycosides from quince fruit (Cydonia oblongaMill.). J. Agric.Food Chem.1991, 39, 2142-2146.
(36) Sefton, M.; Winterhalter, P.; Williams, P. J. Free and bound 6,9-dihydroxy megastigm-7-en-3-one inVitis Vinifera grapes andwine. Phytochemistry1992, 31, 1813-1815.
(37) Douillard, C.; Guichard, E. Comparison by multidimensionalanalysis of concentrations of volatile compounds in fourteenfrozen strawberry varieties.Sci. Aliments1989, 9, 53-76.
(38) Latrasse, A. Fruits III. InVolatile Compounds in Foods andBeVerages; Maarse, H., Ed.; Dekker: New York, 1991; pp 329-387.
(39) Zabetakis, I.; Holden, M. A. A study of strawberry flavourbiosynthesis. InBioflaVour ’95; Etievant, P., Schreier, P., Eds.;INRA Editions: Dijon, France, 1995; pp 211-216.
(40) Schieberle, P.; Hofmann, T. Evaluation of the character impactodorants in fresh strawberry juice by quantitative measurementsand sensory studies on model mixtures.J. Agric. Food Chem.1997, 45, 227-232.
(41) Zabetakis, I.; Holden, M. A. Strawberry flavour: analysis andbiosynthesis.J. Sci. Food Agric.1997, 74, 421-434.
8894 J. Agric. Food Chem., Vol. 53, No. 23, 2005 Aubert et al.
(42) Zabetakis, I.; Gramshaw, J. W.; Robinson, D. D. 2,5-Dimethyl-4-hydroxy-2H-furan-3-one and its derivatives: analysis, synthesisand biosynthesissa review.Food Chem.1999, 65, 139-151.
(43) Menager, I.; Jost, M.; Aubert, C. Changes in physicochemicalcharacteristics and volatile constituents of strawberry (cv. Ciga-line) during maturation.J. Agric. Food Chem. 2004, 52, 1248-1254.
(44) Ulrich, D.; Hoberg, E.; Rapp, A.; Kecke, S. Analysis ofstrawberry flavoursdiscrimination of aroma types by quantifica-tion of volatile compounds. Z. Lebensm. Unters. Forsch.1997,205, 218-223.
(45) Pickenhagen, W.; Veluz, A.; Passerat, J. P.; Ohloff, G. Estimationof 2,5-dimethyl-4-hydroxy-3(2H)-furanone (Furaneol) in culti-vated and wild strawberries, pineapples and mangoes.J. Sci.Food Agric. 1981, 32, 1132-1134.
(46) Dirinck, P.; De Pooter, H.; Willaert, G.; Schamp, N. Flavorquality of cultivates strawberries: the role of the sulfur com-pounds.J. Agric. Food Chem.1981, 29, 316-321.
(47) Perez, A. G.; Rios, J. J.; Sanz, C.; Olias, J. M., Aromacomponents and free amino acids in strawberry variety Chandlerduring ripening.J. Agric. Food Chem.1992, 40, 2232-2235.
(48) Miszczak, A.; Forney, C. F.; Prange, R. K. Development ofaroma volatiles and color during postharvest ripening of ‘Kent’strawberries.J. Am. Soc. Hortic. Sci.1995, 120, 650-655.
(49) Ulrich, D.; Eunert, S.; Hoberg, E.; Rapp, A. Strawberry aromaanalysis by solid-phase microextraction.Dtsch. Lebensm.-Rund-sch.1995, 91, 349-351.
(50) Ulrich, D.; Krumbein, A.; Rapp, A. Gas chromatographic analysisof aroma of strawberry, cherry, and tomato by solid-phasemicroextraction.Dtsch. Lebensm.-Rundsch.1997, 93, 3311-316.
(51) Forney, C. F.; Kalt, W.; McDonald, J. E.; Jordan, M. A. Changesin strawberry fruit quality during ripening on and off the plant.In Proceedings of the International PostharVest Science Confer-ence, PostharVest ’96; Acta Hort 464; Bieleski, R., Laing, W.,Clark, C., Eds.; ISHS: Leuven, Belgium, 1998; pp 506-506.
(52) Song, J.; Fan, L.; Beaudry, R. M. Application of solid-phasemicroextraction and gas chromatography/time-of-flight massspectrometry for rapid analysis of flavor volatiles in tomato andstrawberry fruits.J. Agric. Food Chem.1998, 46, 3721-3726.
(53) Holt, R. U. Development of a method for analysing volatileflavour components in strawberry using solid-phase microextraction and gas chromatography. InProceedings of the 4thInternational Strawberry Symposium; Acta Hort 567; Hietaranta,T., Linna, M.-M., Palonen, P., Parikka, P., Eds.; ISHS: Leuven,Belgium, 2002; pp 743-746.
(54) Sen, A.; Schieberle, P.; Grosch, W. Quantitative determinationof 2,5-dimethyl-4-hydroxy-3(2H)-furanone and its methyl etherusing a stable dilution assay.Lebensm. Wiss. Technol.1991, 24,365-369.
Received for review May 9, 2005. Revised manuscript received July21, 2005. Accepted September 7, 2005.
JF0510541
Flavor Volatiles Analysis by LLME J. Agric. Food Chem., Vol. 53, No. 23, 2005 8895