Page 1
1
Optimization of the extraction of chlorophylls in green beans 1
(Phaseolus vulgaris L.) by N,N-dimethylformamide using 2
response surface methodology 3
4
Catalina Cubas, M. Gloria Lobo, Mónica González* 5 Plant Physiology Laboratory, Department of Tropical Fruits, Instituto Canario de Investigaciones 6
Agrarias, Apdo. 60, 38200 La Laguna, Spain 7 8
Abstract 9
A method for extracting and determining chlorophyll pigments (chlorophyll a and b) in green 10
beans (Phaseolus vulgaris L.) was developed. The procedure was based on the solvent extraction of 11
pigments in vegetable samples using N,N-dimethylformamide as the extractant. Optimal conditions for 12
extraction were determined by experimental design using response surface methodology. Central 13
composite design “2n + star” was used in order to optimize the following solvent extraction parameters: 14
extraction time, homogenization time and number of extractions. The results suggest that the number of 15
extractions is statistically the most significant factor and that the optimum values for the variables are: 90 16
min (extraction time), 1 min (homogenization time) and 5 (number de extractions). This work confirms 17
the advantages of experimental design compared to traditional optimization strategies because it allows a 18
large number of factors to be screened simultaneously, provides less ambiguous data and helps to 19
visualize relationships between responses and factor levels. Pigments were determined using UV-Visible 20
spectrophotometry at 647 and 664 nm. The chlorophyll content was analyzed in three green bean 21
cultivars: “Donna”, “Negrital” and “Emerite”. 22
Keywords: Natural pigments; Food analysis; Solvent extraction; Experimental design; UV-Visible 23
spectrophotometry. 24
25
* Corresponding author. Tel.: +34-922-476310; fax: +34-922-476303. 26
E-mail address: [email protected] (Mónica González) 27
Page 2
2
1. Introduction 28
Multiple epidemiological studies have demonstrated a relationship between a 29
diet rich in vegetable and derivative products and the prevention of cardiovascular 30
illnesses and some types of cancer. This fact seems to be related with their chemical 31
composition (Lampe, 1999; Steinmetz & Potter, 1996). Green beans (Phaseolus 32
vulgaris L.) are one of the most widely consumed vegetables in Europe because of their 33
bright color, pleasant taste and low calories. The study of color-change from bright 34
green to olive brown during storage and processing is very important because color is 35
one of the deciding factors in whether or not a consumer acquires the product. In this 36
sense, one of the indicators of decreased quality in green beans is the loss of chlorophyll 37
pigments, because they can degrade to undesirable grey-brown compounds (Mangos & 38
Berger, 1997). 39
Chlorophylls are the most common green pigments found in plants. As an 40
integrated part of vegetable foodstuffs, chlorophylls have been a natural component of 41
the human diet throughout history (Seljasen et al., 1998). In vivo, these pigments play a 42
key role in photosynthesis (Schoefs, 2002). They have a complex four-ring structure, 43
and the center of the molecule are coordinated with a Mg2+-ion. A long hydrophobic 44
hydrocarbon tail (phytyl) is attached to the ring structure. Chlorophyll a has a methyl 45
group bound to ring II, while chlorophyll b has an aldehyde group in this position (Fig. 46
1) (Seljasen et al., 1998). Chlorophylls are susceptible to many degradation reactions 47
caused by weak acids, oxygen, light, temperature changes and/or enzymes. Replacement 48
of the central Mg2+-ion in chloropigments with hydrogen leads to pheophytins, which 49
are related to the color change from bright green to olive brown. Chlorophyllase 50
catalyzes the hydrolysis of the phytyl esters of chlorophylls. Its inhibition by low 51
Page 3
3
temperature extraction leads to less degradation of chlorophylls (Mangos & Berger, 52
1997). 53
Consumer demand of better quality vegetable products has led to an increasing 54
interest in developing accurate and specific analytical methods to analyze chlorophyll 55
content. Most of the analytical methods used to determine chlorophylls use liquid 56
chromatography (Darko et al., 2000; Monreal et al., 1999) or measure the 57
spectrophotometric response at different wavelengths and then solve equations to 58
determine the contents (Qudsieh et al., 2002; Zhuang et al., 1997). 59
To ensure that the chlorophyll analysis is effective, it is very important to 60
optimize the sample extraction when analyzing these pigments in complex samples such 61
as vegetables. It is essential to inactivate enzymes (such as chlorophyllase) which can 62
easily degrade chlorophylls during the extraction. Sodium (Monreal et al., 1999), 63
calcium (Bahçeci et al., 2005) or magnesium (Hegazi et al., 1998) carbonate has been 64
used for this purpose. Extraction methods may also differ between different vegetables 65
because of their diverse matrices (Bahçeci et al., 2005; Monreal et al., 1999; Zhuang et 66
al., 1997). For these reasons considerable caution should be exercised in the 67
employment of methods that have been developed for the analysis of specific plant 68
tissue types. A critical aspect of the analytical determination of chlorophyll pigments in 69
green beans that has not been studied in detail is how differences in vegetable matrices 70
effect the extraction of these pigments. There is evidence that chlorophylls are more 71
thoroughly extracted with methanol (Bahçeci et al., 2005; Wright & Shearer, 1984) or 72
dimethylsulfoxide (Shoaf & Lium, 1976). However, Mantoura & Llewellyn (1983) 73
found that methanol led to the formation of chlorophyll a derivative products, whereas 74
90% acetone did not (Monreal et al., 1999; Qudsieh et al., 2002). N,N-75
Dimethylformamide (N,N-DMF) is a very convenient solvent for chlorophyll extraction 76
Page 4
4
(Corcuff et al., 1996; Inskeep & Bloom, 1985; Zhuang et al., 1997) since the pigments 77
are stable in this solvent for up to 20 d when stored at 4ºC in the dark (Moran & Porath, 78
1980). Other variables that influence the chlorophyll extraction are extraction or 79
homogenization time and the number of extractions. Extraction times between 30 min 80
(Tan et al., 2000) and 24 h (Corcuff et al., 1996; Sibley et al., 1996) and 81
homogenization times between 1 and 3 min (Bahçeci et al., 2005; Cano et al., 1998; 82
Moran & Porath, 1980) have been used. To ensure complete extraction samples have 83
been extracted between 1 and 3 times (Bahçeci et al., 2005; Cano et al., 1998; Corcuff et 84
al., 1996). Experimental designs are used to identify influential factors, optimize 85
conditions and evaluate how those factors affect the samples being analyzed. In 86
traditional strategies only one variable is changed while all the others remain constant. 87
This approach requires a large number of experiments and does not allow the study of 88
changes in the response that may occur when two or more factors are modified 89
simultaneously. Experimental design is an alternative to this strategy. It allows a large 90
number of factors to be screened simultaneously and can provide less ambiguous data. 91
Furthermore, experimental designs combined with response surface methodology 92
(RSM) help to visualize relationships between responses and factor levels to locate the 93
region of highest response values (Montgomery, 1991). 94
The main objective of this study was to optimize the extraction of chlorophylls a 95
and b from green beans using solvent extraction by N,N-DMF before determining 96
chlorophylls via spectrophotometry. Central composite design was used to optimize 97
three variables (extraction time, homogenization time and number of extractions) in 98
order to determine an optimal set of operational conditions. 99
100
101
Page 5
5
2. Materials and methods 102
2.1. Plant material and chemicals 103
Green beans (Phaseolus vulgaris L., cvs. “Donna”, “Negrital” and “Emerite”) 104
were harvested from fields located in Arafo in southern Tenerife (Canary Islands, 105
Spain) in May of 2005. The pods were selected, eliminating those that showed 106
mechanical injuries and/or rotting. For chlorophyll determination, 3 kg of pods were 107
sliced, frozen in liquid nitrogen and stored at -80ºC until the analyses were carried out. 108
Chlorophyll a and chlorophyll b standards were supplied by Sigma (Madrid, 109
Spain). Stock standard solutions containing 0.2 mg/ml of chlorophyll a or chlorophyll b 110
were prepared in acetone and stored in glass stoppered bottles at -20ºC in the dark. 111
Solutions of variable concentrations were prepared by diluting the stock standard 112
solution in N,N-dimethylformamide (N,N-DMF). Acetone and N,N-DMF were 113
purchased from Panreac (Madrid, Spain). Sodium carbonate (Na2CO3), used to avoid 114
chlorophyll degradation, was obtained from Merck (Darmstadt, Germany). 115
116
2.2. Solvent extraction method and chlorophyll determination 117
Frozen pulverized green bean samples were accurately weighed at 2 g and mixed 118
with 3 ml of N,N-DMF (Sibley et al., 1996). Sodium carbonate (0.15 g) was added to 119
prevent the chlorophylls from degrading to pheophytins. The mixture was homogenized 120
in a Politron PT 6000 (Kinematica AG, Lucerne, Switzerland) high speed blender at 121
18000 g in ice and darkness (homogenization time varied depending on the particular 122
experiment; ranging between 1 and 20 min). Then pigments present in the sample were 123
extracted (extraction time varied depending on the particular experiment; ranging 124
between 1 and 90 min) in a water bath at 4ºC, darkness and under agitation in sealed 125
vessels. The sample was centrifuged at 9000 g (refrigerated at 4ºC) for 20 min in a 126
Page 6
6
Jouan CR 312 centrifuge (Thermo Electron Corporation, Madrid, Spain). Depending on 127
the experiment, this procedure was repeated (ranging between 1 and 5 times) and the 128
resulting supernatants were mixed together. Determination of pigments was done in 129
triplicate. 130
Spectrophotometric measurements of chlorophyll content were made on a 131
Shimadzu UV–visible 160A double-beam recording spectrophotometer (Kyoto, Japan) 132
equipped with a Hellma (Jamaica, USA) cell (path length 10-2 m). The slit width of the 133
monochromator was fixed at 2 nm. The absorbance was recorded in triplicate for each 134
sample at 647 and 664 nm simultaneously in order to determine chlorophyll a and b 135
content, which was expressed as mg/100 g fresh weight. 136
137
2.3. Experimental design 138
Green beans (Phaseolus vulgaris L., cv. “Donna”) were used to optimize 139
chlorophyll extraction. Statgraphics Plus version 4.1 (Statistical Graphics, Rockville, 140
USA) was employed to generate design and regression analysis and to obtain the plot. 141
The optimization procedure is divided into the following steps: (a) selection of 142
independent variables that affect the extraction of pigments, the level of these variables 143
and the response variable, (b) selection of the type of experimental design and (c) 144
mathematical solution of the second order equation that relates the response to the 145
independent variables. The entire experiment was executed in two phases using a 146
central composite design (CCD). The objective of the first phase was to evaluate the use 147
of sodium carbonate to inhibit the effect of chlorophyllase. In the second phase a CCD 148
“23 + star” was projected on a face-centered star design with two center points. The 149
variables (number of extractions, extraction time and homogenization time) were set at 150
Page 7
7
three separate coded levels. The unknown function was assumed to be approximated by 151
a second-order polynomial equation such as: 152
εββββ +⋅⋅+⋅+⋅+= ∑ ∑∑∑==
k
i i jjiijiii
k
iii xxxxy
1
2
10 153
(i < j) 154
where y is the response; β0 (center point of system), βi (coefficient of linear effects), βii 155
(coefficient of quadratic effects) and βij (coefficient of interactive effects) are the 156
different constant coefficients of the model; xi and xj are levels of independent variables; 157
and ε is the error of the model. 158
Grubbs’ test was applied to detect outliers in the data set (Miller & Miller, 159
2000). Analysis of variance was used to evaluate the effect of cultivar on chlorophyll 160
content. Fisher’s Least-Significant-Difference test (LSD), at the 5% significance level, 161
was applied to experimental results to assess intra-pair significant differences (Hsu, 162
1996). 163
164
3. Results and discussion 165
3.1. Spectrophotometric determination of chlorophylls a and b: analytical features 166
Chlorophyll determination was done using UV-visible spectrophotometry at two 167
characteristic wavelengths, 647 and 664 nm, which are the maximum absorption 168
wavelengths for chlorophyll b and chlorophyll a, respectively. Calibration graphs were 169
obtained by using multiple linear regression and constructed by plotting the signal 170
obtained for the two pigments (in absorbance units) against the analyte concentration at 171
seven concentration levels. Each concentration level was analyzed in triplicate. 172
According to this calibration graphs, the following formulas were obtained for 173
quantifying chlorophyll a and b: Chlorophyll a (mg/l) = 8.9 · Abs664 - 1.9 · Abs647 - 0.11 174
Page 8
8
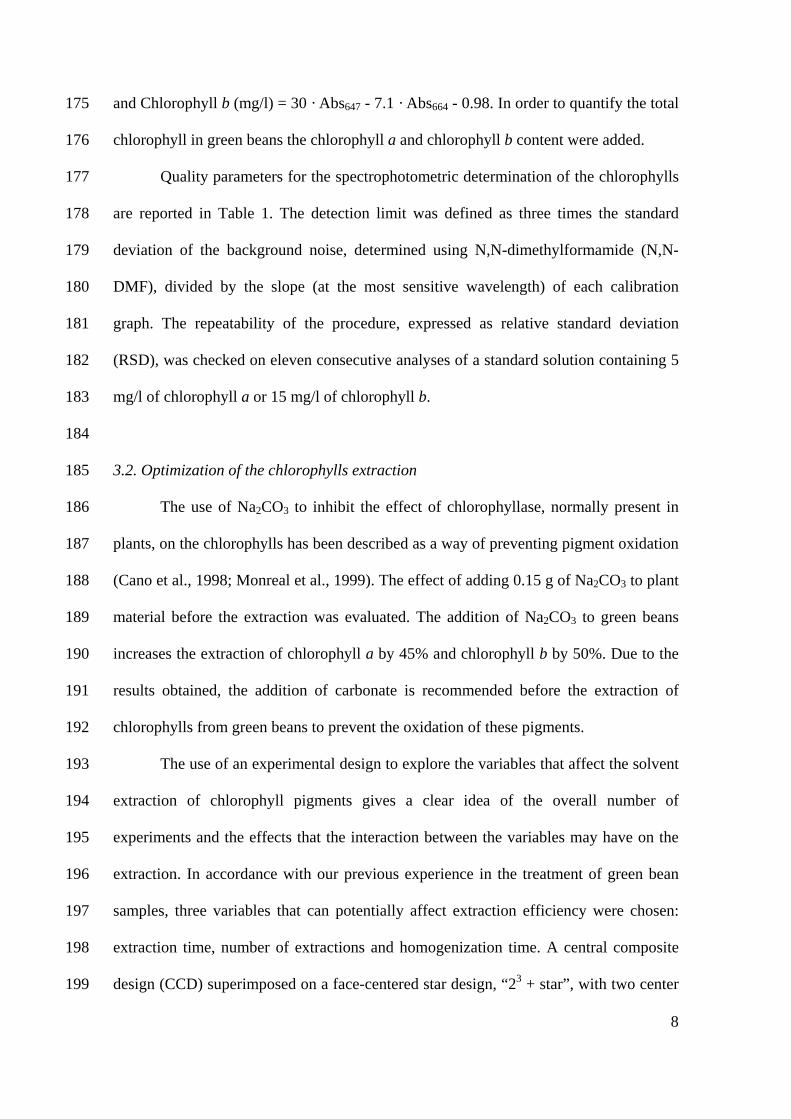
and Chlorophyll b (mg/l) = 30 · Abs647 - 7.1 · Abs664 - 0.98. In order to quantify the total 175
chlorophyll in green beans the chlorophyll a and chlorophyll b content were added. 176
Quality parameters for the spectrophotometric determination of the chlorophylls 177
are reported in Table 1. The detection limit was defined as three times the standard 178
deviation of the background noise, determined using N,N-dimethylformamide (N,N-179
DMF), divided by the slope (at the most sensitive wavelength) of each calibration 180
graph. The repeatability of the procedure, expressed as relative standard deviation 181
(RSD), was checked on eleven consecutive analyses of a standard solution containing 5 182
mg/l of chlorophyll a or 15 mg/l of chlorophyll b. 183
184
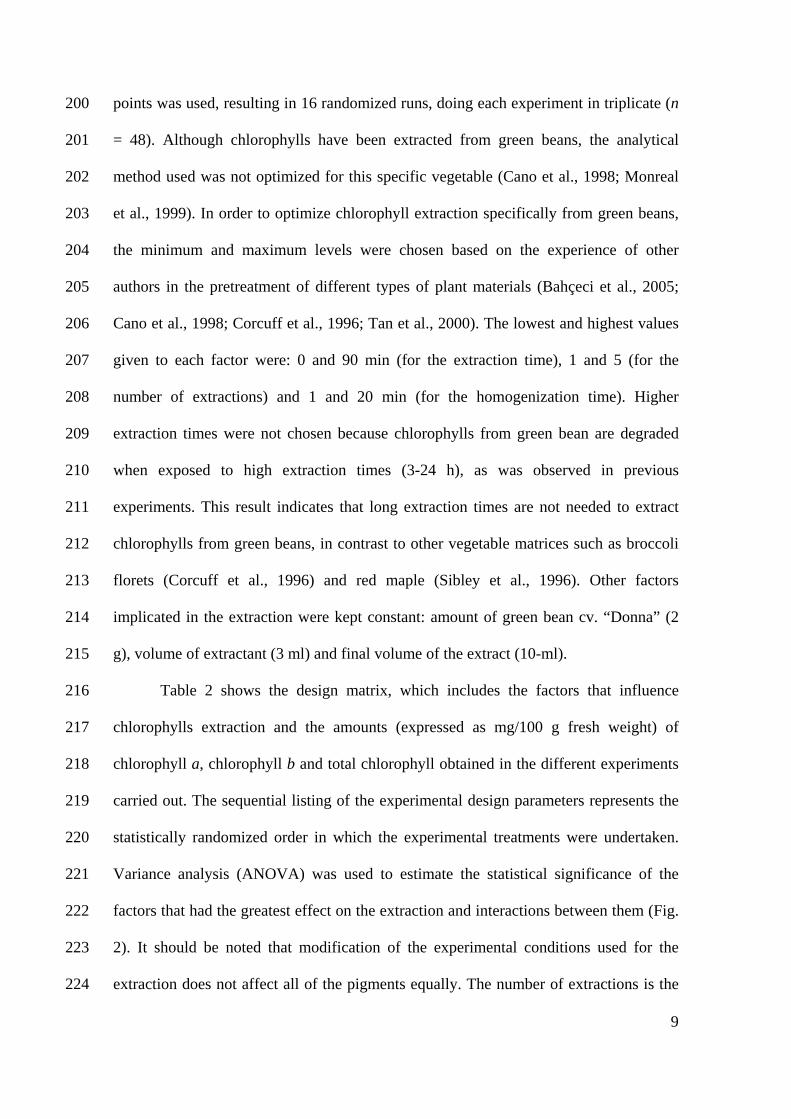
3.2. Optimization of the chlorophylls extraction 185
The use of Na2CO3 to inhibit the effect of chlorophyllase, normally present in 186
plants, on the chlorophylls has been described as a way of preventing pigment oxidation 187
(Cano et al., 1998; Monreal et al., 1999). The effect of adding 0.15 g of Na2CO3 to plant 188
material before the extraction was evaluated. The addition of Na2CO3 to green beans 189
increases the extraction of chlorophyll a by 45% and chlorophyll b by 50%. Due to the 190
results obtained, the addition of carbonate is recommended before the extraction of 191
chlorophylls from green beans to prevent the oxidation of these pigments. 192
The use of an experimental design to explore the variables that affect the solvent 193
extraction of chlorophyll pigments gives a clear idea of the overall number of 194
experiments and the effects that the interaction between the variables may have on the 195
extraction. In accordance with our previous experience in the treatment of green bean 196
samples, three variables that can potentially affect extraction efficiency were chosen: 197
extraction time, number of extractions and homogenization time. A central composite 198
design (CCD) superimposed on a face-centered star design, “23 + star”, with two center 199
Page 9
9
points was used, resulting in 16 randomized runs, doing each experiment in triplicate (n 200
= 48). Although chlorophylls have been extracted from green beans, the analytical 201
method used was not optimized for this specific vegetable (Cano et al., 1998; Monreal 202
et al., 1999). In order to optimize chlorophyll extraction specifically from green beans, 203
the minimum and maximum levels were chosen based on the experience of other 204
authors in the pretreatment of different types of plant materials (Bahçeci et al., 2005; 205
Cano et al., 1998; Corcuff et al., 1996; Tan et al., 2000). The lowest and highest values 206
given to each factor were: 0 and 90 min (for the extraction time), 1 and 5 (for the 207
number of extractions) and 1 and 20 min (for the homogenization time). Higher 208
extraction times were not chosen because chlorophylls from green bean are degraded 209
when exposed to high extraction times (3-24 h), as was observed in previous 210
experiments. This result indicates that long extraction times are not needed to extract 211
chlorophylls from green beans, in contrast to other vegetable matrices such as broccoli 212
florets (Corcuff et al., 1996) and red maple (Sibley et al., 1996). Other factors 213
implicated in the extraction were kept constant: amount of green bean cv. “Donna” (2 214
g), volume of extractant (3 ml) and final volume of the extract (10-ml). 215
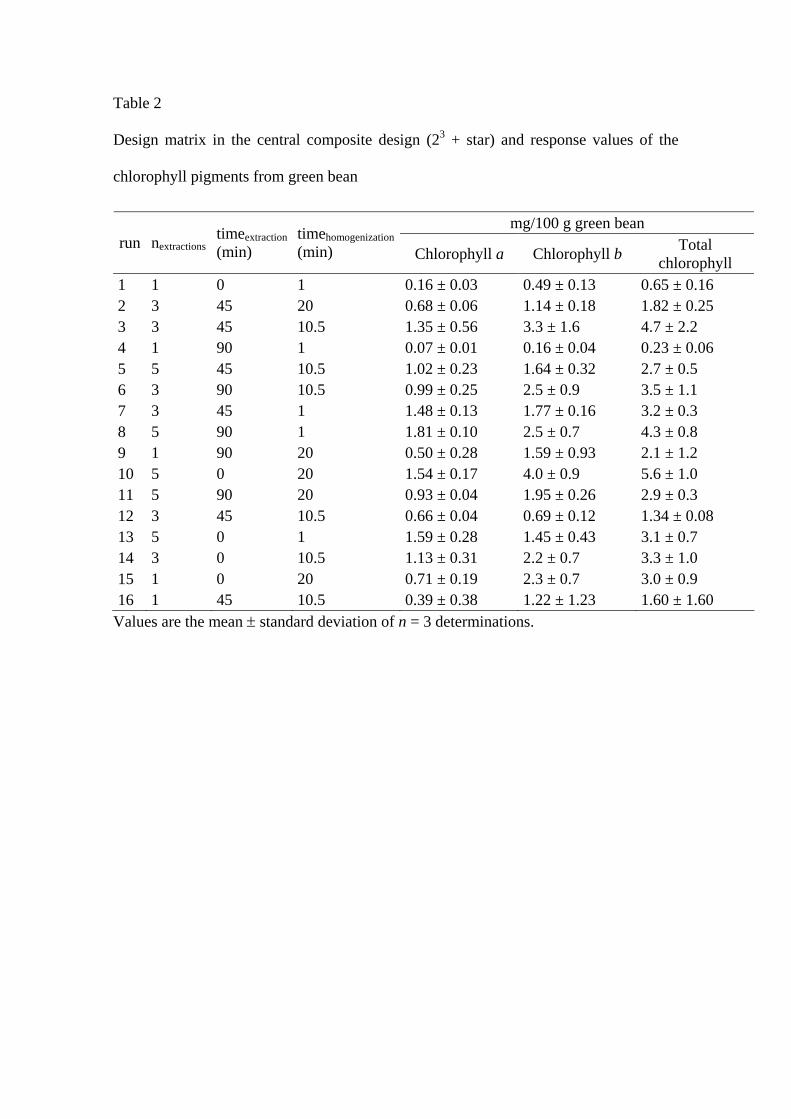
Table 2 shows the design matrix, which includes the factors that influence 216
chlorophylls extraction and the amounts (expressed as mg/100 g fresh weight) of 217
chlorophyll a, chlorophyll b and total chlorophyll obtained in the different experiments 218
carried out. The sequential listing of the experimental design parameters represents the 219
statistically randomized order in which the experimental treatments were undertaken. 220
Variance analysis (ANOVA) was used to estimate the statistical significance of the 221
factors that had the greatest effect on the extraction and interactions between them (Fig. 222
2). It should be noted that modification of the experimental conditions used for the 223
extraction does not affect all of the pigments equally. The number of extractions is the 224
Page 10
10
factor that has the greatest influence on the extraction of both types of chlorophylls. 225
Thus, when the number of extractions is increased the extraction efficiency increases as 226
well. The Pareto chart (Fig. 2a) for chlorophyll a shows that the interaction between the 227
number of extractions and the homogenization time has a significant influence on the 228
efficiency of the extraction. However, homogenization time and the interaction between 229
extraction time and homogenization time affect the extraction of chlorophyll b (Fig. 2b). 230
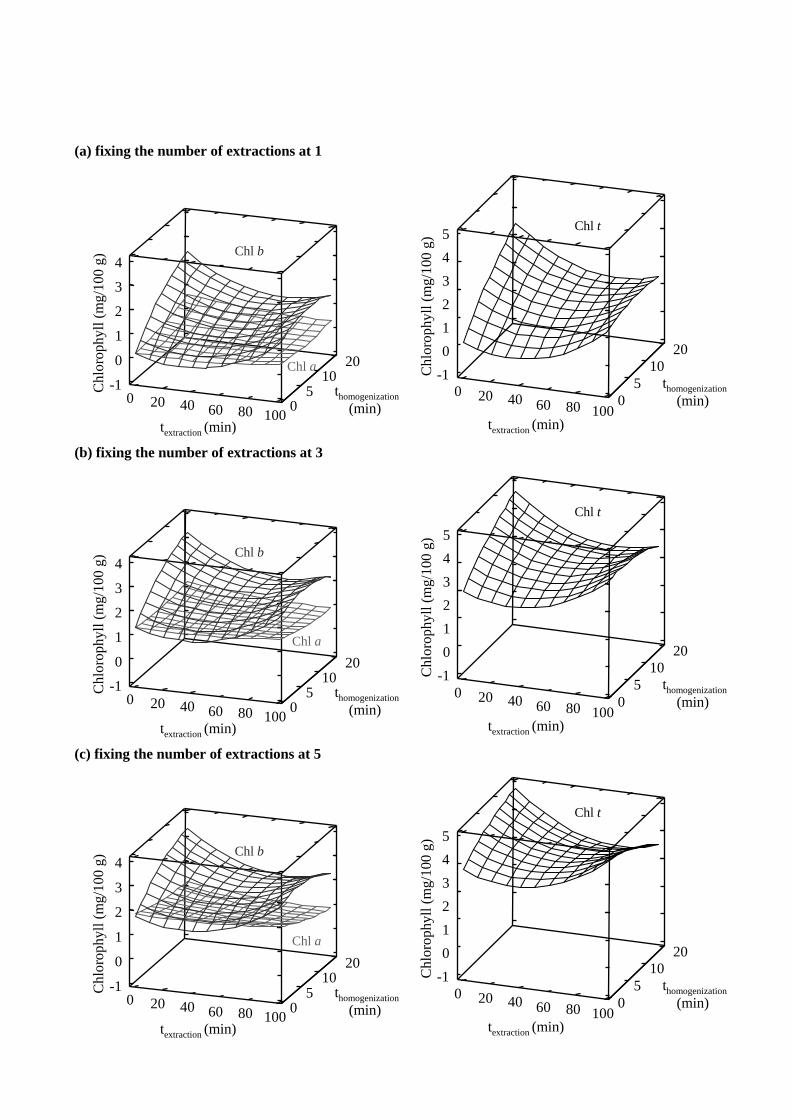
The response-surface graphs obtained using the experimental design are shown 231
in Fig. 3, Fig. 4 and Fig. 5. The number of extractions and homogenization time are 232
represented in Fig. 3. When the number of extractions increases the extraction of both 233
chlorophylls is higher. This effect is also noticed in Fig. 4 which represents extraction 234
time versus number of extractions. Both graphs show that the optimum number of 235
extractions is 5 for both pigments. In Fig. 5 extraction time versus homogenization time 236
is represented. It can be observed that the optimum extraction efficiency is reached at 237
high extraction times and low homogenization times for the extraction of chlorophyll a; 238
however, the highest extraction of chlorophyll b is obtained with low extraction times in 239
conjunction with high homogenization times (Fig. 4 and Fig. 5). When the 240
homogenization time is low, the highest extraction of chlorophyll b is obtained with 241
high extraction times. This can also be seen in the Pareto chart for chlorophyll b (Fig. 242
2b) which shows that the interaction between extraction time and homogenization time 243
increases the efficiency of the extraction of chlorophyll b as long as one factor is high 244
and the other is low. The decrease in extraction efficiency when extraction time is 245
increased might indicate a degradation of chlorophyll b over time. The degradation of 246
chlorophylls can be caused by various factors. Although these factors are assumed to be 247
mainly biotic, such as the action of enzymes, abiotic factors such as temperature, light 248
and oxygen are also likely to be involved (Kowalewska & Szymczak, 2001). The effect 249
Page 11
11
of the degradation of chlorophyll b in green bean extracts is more pronounced with long 250
homogenization times (which imply an aeration of the sample) than for short times. If it 251
is assumed that chlorophyllase was inhibited by Na2CO3 it can be supposed that oxygen 252
is involved in chlorophyll b degradation. Kowalewska & Szymczak (2001) and Schoefs 253
(2002) described how extracts containing chlorophylls react easily with oxygen upon 254
illumination resulting in the formation of activated oxygen species. 255
It can be concluded that in order to determine both chlorophylls in the same 256
extract a pragmatic approach must be used when selecting the extraction conditions. 257
Using 5 extractions, a homogenization time of 20 min and an extraction time of 0 min, a 258
recovery of 75% of chlorophyll a and of 100% of chlorophyll b are obtained. However, 259
using a homogenization time of 1 min and an extraction time of 90 min (and 5 260
extractions), the recovery for chlorophyll a is 100% and of 70% for chlorophyll b. 261
These last extraction conditions were selected as optimum because high homogenization 262
times could produce an aeration of the sample and mechanical injury in the high-speed 263
blender. For both chlorophylls 96% of the extraction takes place between the second 264
and the fifth extraction. The amount of chlorophyll recovered in each of these 265
extractions (2nd – 5th) was higher than 12%. The maximum recovery of chlorophyll a 266
and b takes place in the second (35 ± 2%) and fifth (38 ± 3%) extractions, respectively. 267
268
3.3. Analysis of green bean chlorophylls 269
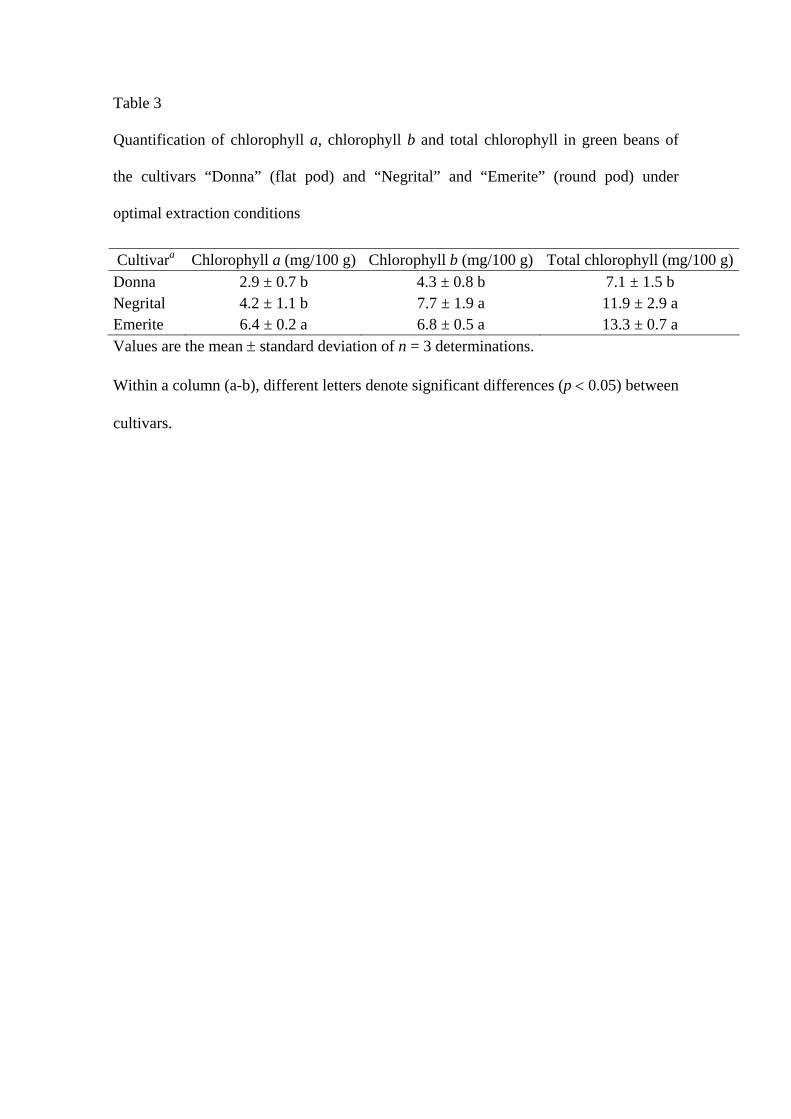
Considering that green bean cultivar influences chlorophyll content notably, 270
chlorophyll a and b and total chlorophyll were determined in three green bean cultivars. 271
Because different cultivars of green beans have similar matrices, the calibration graphs 272
obtained for quantifying chlorophylls and the extraction conditions selected as optimum 273
were used to determine the chlorophylls in the different cultivars (Table 3). 274
Page 12
12
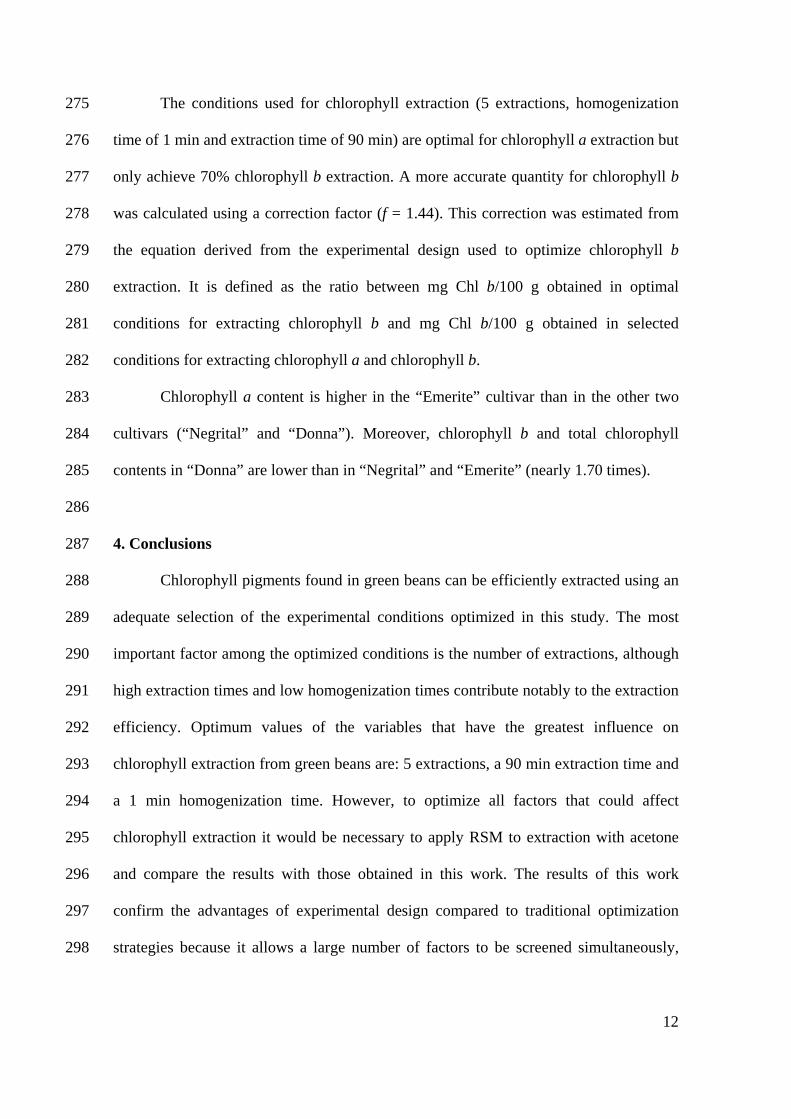
The conditions used for chlorophyll extraction (5 extractions, homogenization 275
time of 1 min and extraction time of 90 min) are optimal for chlorophyll a extraction but 276
only achieve 70% chlorophyll b extraction. A more accurate quantity for chlorophyll b 277
was calculated using a correction factor (f = 1.44). This correction was estimated from 278
the equation derived from the experimental design used to optimize chlorophyll b 279
extraction. It is defined as the ratio between mg Chl b/100 g obtained in optimal 280
conditions for extracting chlorophyll b and mg Chl b/100 g obtained in selected 281
conditions for extracting chlorophyll a and chlorophyll b. 282
Chlorophyll a content is higher in the “Emerite” cultivar than in the other two 283
cultivars (“Negrital” and “Donna”). Moreover, chlorophyll b and total chlorophyll 284
contents in “Donna” are lower than in “Negrital” and “Emerite” (nearly 1.70 times). 285
286
4. Conclusions 287
Chlorophyll pigments found in green beans can be efficiently extracted using an 288
adequate selection of the experimental conditions optimized in this study. The most 289
important factor among the optimized conditions is the number of extractions, although 290
high extraction times and low homogenization times contribute notably to the extraction 291
efficiency. Optimum values of the variables that have the greatest influence on 292
chlorophyll extraction from green beans are: 5 extractions, a 90 min extraction time and 293
a 1 min homogenization time. However, to optimize all factors that could affect 294
chlorophyll extraction it would be necessary to apply RSM to extraction with acetone 295
and compare the results with those obtained in this work. The results of this work 296
confirm the advantages of experimental design compared to traditional optimization 297
strategies because it allows a large number of factors to be screened simultaneously, 298
Page 13
13
provides less ambiguous data and helps to visualize relationships between responses and 299
factor levels. 300
301
Acknowledgements 302
C. Cubas wishes to thank Mercadona S.A. for the PhD grant that they awarded to 303
her. The authors gratefully thank Mercocanarias S.A and Finca Punta Gorda S.L. for 304
supplying them with the vegetable samples used in this study. M. Gonzalez would like 305
to thank INIA for awarding the contract within the framework of the “Recursos y 306
Tecnologías Agrarias del Plan Nacional de Investigación Científica, Desarrollo e 307
Innovación Tecnológica 2000-2003” strategic action. 308
Page 14
14
References 309
Bahçeci, K. S., Serpen, A., Gökmen, V. & Acar, J. (2005). Study of lipoxygenase and 310
peroxidase as indicator enzymes in green beans: change of enzyme activity, 311
ascorbic acid and chlorophylls during frozen storage. Journal of Food 312
Engineering, 66, 187-192. 313
Cano, M. P., Monreal, M., De Ancos, B. & Alique, R. (1998). Effects of oxygen levels 314
on pigment concentrations in cold-stored green beans (Phaseolus vulgaris L. cv. 315
Perona). Journal of Agricultural and Food Chemistry, 46, 4164-4170. 316
Corcuff, R., Arul, J., Hamza, F., Castaigne, F. & Makhlouf, J. (1996). Storage of 317
broccoli florets in ethanol vapor enriched atmospheres. Postharvest Biology and 318
Technology, 7, 219-229. 319
Darko, E., Schoefs, B. & Lemoine, Y. (2000). Improved liquid chromatographic method 320
for the analysis of photosynthetic pigments of higher plants. Journal of 321
Chromatography A, 876, 111-116. 322
Hegazi, M. M., Pérez-Ruzafa, A., Almela, L. & Candela, M. E. (1998). Separation and 323
identification of chlorophylls and carotenoids from Caulerpa prolifera, Jania 324
rubens and Padina pavonica by reversed-phase high-performance liquid 325
chromatography. Journal of Chromatography A, 829, 153-159. 326
Hsu, J. C. (1996). Multiple comparisons: theory and methods. London: Chapman & 327
Hall. 328
Inskeep, W. P. & Bloom, P. R. (1985). Extinction coefficients of chlorophyll a and b in 329
N,N-dimethylformamide and 80% acetone. Plant Physiology, 77, 483-485. 330
Kowalewska, G. & Szymczak, M. (2001). Influence of selected abiotic factors on the 331
decomposition of chlorophylls. Oceanologia, 43, 315-328. 332
Page 15
15
Lampe, J. W. (1999). Health effects of vegetables and fruit: assessing mechanisms of 333
action in human experimental studies. The American Journal of Clinical 334
Nutrition, 70, 475-490. 335
Mangos, T. J. & Berger, R. G. (1997). Determination of major chlorophyll degradation 336
products. Zeitschrift für Lebensmitteluntersuchung und -Forschung A, 204, 345-337
350. 338
Mantoura, R. F. C. & Llewellyn, C. A. (1983). The rapid determination of algal 339
chlorophyll and carotenoids pigments and their breakdown products in natural 340
waters by reverse-phase high performance liquid chromatography. Analytica 341
Chimica Acta, 151, 297-314. 342
Miller, J. N. & Miller, J. C. (2000). Statistics and chemometrics for analytical 343
chemistry. Essex: Pearson Education Ltd. 344
Monreal, M., De Ancos, B. & Cano, M. P. (1999). Influence of critical storage 345
temperatures in degradative pathways of pigments in green beans (Phaseolus 346
vulgaris cvs. Perona and Boby). Journal of Agricultural and Food Chemistry, 47, 347
19-24. 348
Montgomery, D. C. (1991). Design and Analysis of Experiments, (pp. 1-12, 175-228, 349
241-284, 467-510). New York: John Wiley & Sons, Inc. 350
Moran, R. & Porath, D. (1980). Chlorophyll determination in intact tissues using N,N-351
dimethylformamide. Plant Physiology, 65, 478-479 352
Qudsieh, H. Y. M., Yusof, S., Osman, A. & Rahman, R. A. (2002). Effect of maturity 353
on chlorophyll, tannin, color and polyphenol oxidase (PPO) activity of sugarcane 354
juice (Sacharum officinarum var. Yellow Cane). Journal of Agricultural and Food 355
Chemistry, 50, 1615-1618. 356
Page 16
16
Schoefs, B. (2002). Chlorophyll and carotenoid analysis in food products. Properties of 357
the pigments and methods of analysis. Trends in Food Science and Technology, 358
13, 361-371. 359
Seljasen, R., Skrede, G. & Hoftun, H. (1998). Chlorophylls, carotenoids and flavonoids: 360
vegetable constituents with a positive role in cancer, cardiovascular and viral 361
diseases. In S. G. Pandali, Recent Research and Developments in Nutrition 362
Research, vol. 2 (pp. 155-176). Trivandrum, India: Research Signpost. 363
Shoaf, W. T. & Lium, B. W. (1976). Improved extraction of chlorophyll a and b from 364
algae using dimethylsulfoxide. Limnology and Oceanography, 21, 926-928. 365
Sibley, J. L., Eakes, D. J., Gilliam, C. H., Keever, G. J., Dozier, W. A. & Himelrick, D. 366
G. (1996). Foliar SPAD-502 meter values, nitrogen levels, and extractable 367
chlorophyll for red maple selections. HortScience, 31, 468-470. 368
Steinmetz, K. A. & Potter, J. D. (1996). Vegetables, fruit and cancer prevention - A 369
review. Journal of the American Dietetic Association, 96, 1027-1039. 370
Tan, Y. X., Jiang, J. H., Wu, H. L., Cui, H. & Yu, R. Q. (2000). Resolution of kinetic 371
system of simultaneous degradations of chlorophyll a and b by PARAFAC. 372
Analytica Chimica Acta, 412, 195-202. 373
Wright, S. W. & Shearer, J. D. (1984). Rapid extraction and HPLC of chlorophylls and 374
carotenoids from marine phytoplankton. Journal of Chromatography, 294, 281-375
295. 376
Zhuang, H., Hildebrand, D. F. & Barth, M. M. (1997). Temperature influenced lipid 377
peroxidation and deterioration in broccoli buds during postharvest storage. 378
Postharvest Biology and Technology, 10, 49-58. 379
Page 17
17
Figure captions 380
381
Fig. 1. Chemical structure of chlorophyll a and chlorophyll b. 382
383
Fig. 2. Pareto charts for the standardized main effects in the central composite design 384
(23+ star) experiment for (a) chlorophyll a and (b) chlorophyll b, where the vertical line 385
indicates the statistical significance of the effects. 386
387
Fig. 3. Estimated response surfaces in the central composite design (23+ star) 388
experiment obtained by plotting the number of extractions and homogenization time for 389
chlorophyll a (Chl a), chlorophyll b (Chl b) and total chlorophyll (Chl t). 390
391
Fig. 4. Estimated response surfaces in the central composite design (23+ star) 392
experiment obtained by plotting extraction time and the number of extractions for 393
chlorophyll a (Chl a), chlorophyll b (Chl b) and total chlorophyll (Chl t). 394
395
Fig. 5. Estimated response surfaces in the central composite design (23+ star) 396
experiment obtained by plotting extraction time and homogenization time for 397
chlorophyll a (Chl a), chlorophyll b (Chl b) and total chlorophyll (Chl t). 398
Page 18
MgNH N
NHN+
CH3
CH3
CH3
O
OCH3
CH2
O
R2
R1
CH2CH3
OO R1
R2
Chlorophyll a
CH3
C20H39
Chlorophyll b
CHO
C20H39
Page 19
textraction · nextractions
Standardized effect
+-
0 2 4 6 8 10
textraction · nextractions
textraction
nextractions
thomogenization
nextractions · thomogenization
textraction · thomogenization
Standardized effect0 2 4 6 8 10
textraction
nextractions
thomogenization
nextractions · thomogenization
textraction · thomogenization
a
b
Chlorophyll b
Chlorophyll a
Page 20
(b) fixing extraction time at 45 min
Chl
orop
hyll
(mg/
100
g)
nextractions
0 1 3 4 52
thomogenization(min) 0
510
20
Chl t
-10123
54
(c) fixing extraction time at 90 min
Chl
orop
hyll
(mg/
100
g)
nextractions
0 1 3 4 52
thomogenization(min) 0
510
20
Chl t
-10123
54
(a) fixing extraction time at 0 min
Chl
orop
hyll
(mg/
100
g)nextractions
0 1 3 4 52
thomogenization(min) 0
510
20
Chl t
-10123
54
Chl
orop
hyll
(mg/
100
g)
-1
01
2
34
nextractions
0 1 3 4 52
thomogenization(min) 0
510
20Chl a
Chl b
Chl
orop
hyll
(mg/
100
g)
-1
0
1
2
3
4
nextractions
0 1 3 4 52
thomogenization(min) 0
510
20Chl a
Chl b
Chl
orop
hyll
(mg/
100
g)
-1
01
2
34
nextractions
0 1 3 4 52
thomogenization(min) 0
510
20Chl a
Chl b
Page 21
(a) fixing homogenization time at 1 min
(b) fixing homogenization time at 10.5 min
(c) fixing homogenization time at 20 min
textraction (min)
0 20 60 80 10040
nextractions0
12
34
5
Chl t
Chl
orop
hyll
(mg/
100
g)
-10123
54
textraction (min)
0 20 60 80 10040
nextractions0
12
34
5
Chl t
Chl
orop
hyll
(mg/
100
g)
-10123
54
textraction (min)
0 20 60 80 10040
nextractions0
12
34
5
Chl t
Chl
orop
hyll
(mg/
100
g)
-10123
54
textraction (min)
0 20 60 80 10040
nextractions0 1 2 3 4 5Chl a
Chl b
Chl
orop
hyll
(mg/
100
g)
-1
0
1
2
3
4
textraction (min)
0 20 60 80 10040
nextractions0 1 2 3 4 5Chl a
Chl b
Chl
orop
hyll
(mg/
100
g)
-1
01
2
3
4
textraction (min)
0 20 60 80 10040
nextractions0 1 2 3 4 5Chl a
Chl b
Chl
orop
hyll
(mg/
100
g)
-1
0
1
2
3
4
Page 22
(b) fixing the number of extractions at 3
textraction (min)
0 20 60 80 10040
thomogenization(min)
20
Chl t
Chl
orop
hyll
(mg/
100
g)
05
10-10123
54
(c) fixing the number of extractions at 5
textraction (min)
0 20 60 80 10040
thomogenization(min)
20
Chl t
Chl
orop
hyll
(mg/
100
g)
05
10-10123
54
(a) fixing the number of extractions at 1
-10123
54
textraction (min)
0 20 60 80 10040
thomogenization(min)
20
Chl t
Chl
orop
hyll
(mg/
100
g)
05
10
textraction (min)
0 20 60 80 10040
thomogenization(min)
20Chl a
Chl b
Chl
orop
hyll
(mg/
100
g)
-1
0
1
2
3
4
05
10
textraction (min)
0 20 60 80 10040
thomogenization(min)
20Chl a
Chl b
Chl
orop
hyll
(mg/
100
g)
-1
0
1
2
3
4
05
10
textraction (min)
0 20 60 80 10040
thomogenization(min)
20Chl a
Chl b
Chl
orop
hyll
(mg/
100
g)
-1
0
1
2
3
4
05
10
Page 23
Table 1
Quality parameters for the spectrophotometric determination of chlorophyll a and
chlorophyll b
Chlorophyll a Chlorophyll b
λ = 647 nm λ = 664 nm λ = 647 nm λ = 664 nm slopea (· 102) 2.8 ± 0.2 11.8 ± 0.8 3.5 ± 0.3 0.84 ± 0.07 intercepta (· 103) 3.2 ± 0.1 13.5 ± 0.5 3.4 ± 0.3 1.6 ± 0.1 r2 0.997 0.999 0.993 0.995 linear rangeb (mg/l) 0.35 - 10.0 1.00 - 35 detection limitb (mg/l) 0.07 0.23
RSD (%) 7.0 9.2 a Values are the mean ± standard deviation obtained by using seven concentration levels
(n = 3 determinations). b The linear range and detection limit correspond to the most
sensitive wavelength.
Page 24
Table 2
Design matrix in the central composite design (23 + star) and response values of the
chlorophyll pigments from green bean
mg/100 g green bean
run nextractions timeextraction (min)
timehomogenization (min) Chlorophyll a Chlorophyll b Total
chlorophyll 1 1 0 1 0.16 ± 0.03 0.49 ± 0.13 0.65 ± 0.16 2 3 45 20 0.68 ± 0.06 1.14 ± 0.18 1.82 ± 0.25 3 3 45 10.5 1.35 ± 0.56 3.3 ± 1.6 4.7 ± 2.2 4 1 90 1 0.07 ± 0.01 0.16 ± 0.04 0.23 ± 0.06 5 5 45 10.5 1.02 ± 0.23 1.64 ± 0.32 2.7 ± 0.5 6 3 90 10.5 0.99 ± 0.25 2.5 ± 0.9 3.5 ± 1.1 7 3 45 1 1.48 ± 0.13 1.77 ± 0.16 3.2 ± 0.3 8 5 90 1 1.81 ± 0.10 2.5 ± 0.7 4.3 ± 0.8 9 1 90 20 0.50 ± 0.28 1.59 ± 0.93 2.1 ± 1.2 10 5 0 20 1.54 ± 0.17 4.0 ± 0.9 5.6 ± 1.0 11 5 90 20 0.93 ± 0.04 1.95 ± 0.26 2.9 ± 0.3 12 3 45 10.5 0.66 ± 0.04 0.69 ± 0.12 1.34 ± 0.08 13 5 0 1 1.59 ± 0.28 1.45 ± 0.43 3.1 ± 0.7 14 3 0 10.5 1.13 ± 0.31 2.2 ± 0.7 3.3 ± 1.0 15 1 0 20 0.71 ± 0.19 2.3 ± 0.7 3.0 ± 0.9 16 1 45 10.5 0.39 ± 0.38 1.22 ± 1.23 1.60 ± 1.60
Values are the mean ± standard deviation of n = 3 determinations.
Page 25
Table 3
Quantification of chlorophyll a, chlorophyll b and total chlorophyll in green beans of
the cultivars “Donna” (flat pod) and “Negrital” and “Emerite” (round pod) under
optimal extraction conditions
Cultivara Chlorophyll a (mg/100 g) Chlorophyll b (mg/100 g) Total chlorophyll (mg/100 g)Donna 2.9 ± 0.7 b 4.3 ± 0.8 b 7.1 ± 1.5 b Negrital 4.2 ± 1.1 b 7.7 ± 1.9 a 11.9 ± 2.9 a Emerite 6.4 ± 0.2 a 6.8 ± 0.5 a 13.3 ± 0.7 a Values are the mean ± standard deviation of n = 3 determinations.
Within a column (a-b), different letters denote significant differences (p < 0.05) between
cultivars.