Page 1
DOI: 10.31534/engmod.2018.4.si.01g
Original scientific paper
Received: 10.09.2018.
ENGINEERING MODELLING 31 (2018) 4, 1-14 1
Optimization of the Front-end Logistics Routes of Agricultural Products Based on Network Platform
Tai Lingjuan, Li Linhong, Li Menghan
Faculty of Management and Economics, Kunming University of Science and Technology, Kunming, CHINA
SUMMARY
Aiming to promote the effective connection between the individual farmers and the modern “big
market” and improve the logistics efficiency of agricultural products, this paper offers a logistics
model for decentralized production to achieve organized information and large-scaled
transportation. Based on the in-depth analysis of the traditional agricultural product logistics
chain, this paper originates a network logistics model for agricultural products. It constructs a two-
stage framework (grouping first and then scheduling), analyzes the “First Mile” logistics routes,
and then uses the improved loop routes optimization algorithm to obtain the approximate optimal
solution to the model. Through example verification, it is found that the model can help improve
the efficiency of logistics distribution and save the logistics costs of small agricultural products
from fragmented land. Moreover, the results show that the agricultural product logistics method
based on overall transportation and information management is obviously superior to the
traditional logistics methods.
KEY WORDS: agricultural logistics; network platform; routes optimization.
1. INTRODUCTION
Agricultural products are not only one of the main income sources for rural residents but also
the necessities for urban and rural residents in China. Because of the regionality, vulnerability
and seasonality, agricultural products are highly dependent on the logistics efficiency. The
agricultural land is very fragmented in China, so the logistics of agricultural products is
characterized by wide and scattered distribution.
Land fragmentation refers to the disintegration of cultivated land, that is, a form of land
structure in which a farmer’s land is separated spatially. There is no scale production since the
land belonging to a single farmer is not interconnected and each farmer has a small average area
[1, 2]. Affected by various factors such as household contract responsibility system, landform,
and the traditional separation system in China, the fragmented pattern of agricultural land is
prominent in China [3]. Each household has a cultivated area of 0.50 hectares and 5.722 pieces
Page 2
T. Lingjuan. L. Linhong, L. Menghan: Optimization of the Front-end Logistics Routes of Agricultural Products Based on Network
Platform
2 ENGINEERING MODELLING 31 (2018) 4, 1-14
of land on average, so the average size of each piece of cultivated land is only 0.09 hectares in
China.
Such fragmentation of land has made the agriculture in China still dominated by the “small-scale
production and decentralized management” of small-scale farmers, and agricultural product
logistics is still relatively weak aspect of the agricultural development in China [4]. According to
the data, the logistics efficiency of agricultural products in China is far lower than that in
developed countries. In Europe and the United States, the logistics cost of agricultural products
is only about 10% of the total cost, and the loss rate is strictly kept below 5%. In China, however,
the logistics cost of agricultural products accounts for 60% of the total cost, and the loss rate in
the logistics links is as high as 30% [5].
Nevertheless, as a basic unit of agricultural economy in China, small-scale peasant production
will still remain the main form of agricultural production and trade in this country for a long
time. Therefore, this paper proposes the promotion of the effective connection between
individual farmers and the modern “big market” to settle the problem of high cost and low
efficiency of agricultural product logistics chain in China.
2. LITERATURE REVIEW
The studies on agricultural product logistics started very early in foreign countries and the
research results were more mature than those in the domestic market. In 1901, an American
scholar John Crowell first proposed the related research on agricultural product logistics in the
report of the Industrial Committee on the circulation of agricultural products, and discussed the
factors affecting the logistics costs of agricultural products [6]. At present, the integrated supply
chain management model has been widely used in some agriculturally developed countries such
as Britain, the United States, Canada and the Netherlands [7, 8]. Its main characteristic is that
the enterprises establish a dynamic and multidimensional cooperation platform in the
management process of the logistics chain, and carry out multi-directional and active exchanges
of information on the quality, performance, and price of their own products through the
platform, which can improve the flexibility of the entire agricultural product logistics system
[9, 10]. Due to the lack of cultivated land and the large population, the agricultural products in
South Korea and Taiwan are characterized by diversified production and varieties. Therefore,
the two regions have chosen the “common sales system” composed of farmer groups to
transport and sell agricultural products uniformly [11, 12]. To solve the contradiction between
scattered production and large circulation, Japan has established an agricultural association.
97% of the farmers have joined this association, and 90% of the agricultural products are sold
by agricultural cooperatives. The association constitutes the main organizer of the agricultural
product logistics and also undertakes the main tasks of logistics. It strengthens the circulation
of information through the establishment of “roadside stations” [13].
Due to the limitation of terrain conditions and the proportion of population over farmland area,
land fragmentation is still difficult to reduce in most areas of China, and this model still has
irreplaceable and supportive functions at present, so in the short run, this situation cannot be
changed [3]. The endowment of resources determines that China cannot follow the U.S. to solve
the problem of agricultural product logistics through large-scale production, and it cannot
establish a mature logistics organization mechanism like Japan’s within a short term, either.
However, through comparison and analysis, it is found that the scale of agricultural production
has no decisive influence on the logistics efficiency of agricultural products. In addition to the
Page 3
T. Lingjuan. L. Linhong, L. Menghan: Optimization of the Front-end Logistics Routes of Agricultural Products Based on Network
Platform
ENGINEERING MODELLING 31 (2018) 4, 1-14 3
advanced infrastructures and technologies of storage and transportation in developed countries
and regions, the organization and information of its logistics process are the main reasons for
its efficient logistics. Therefore, this paper puts forward the “network trading platform” and the
“transportation routes optimization” model, which focuses on optimizing the “first mile”
logistics routes of agricultural products and features the interactive mode of “production
decentralization - information organization - transportation scale”.
3. ANALYSIS AND OPTIMIZATION OF THE LOGISTICS OPERATION MODE OF
FRESH AGRICULTURAL PRODUCE
3.1 ANALYSIS OF THE TRADITIONAL AGRICULTURAL PRODUCT LOGISTICS MODEL
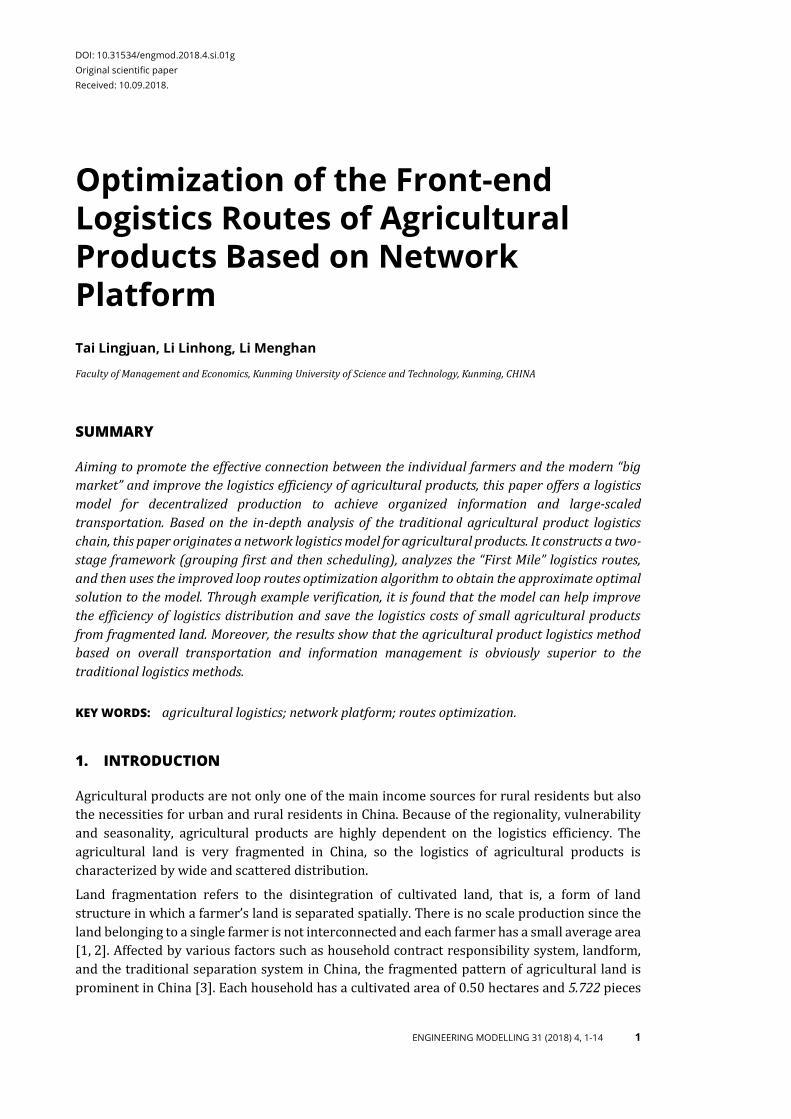
Structural analysis shows the shortcomings of the traditional agricultural product logistics
model, Figure 1.
Fig. 1 Current Agricultural Product Logistics Model in China
Agricultural product suppliers are individual farmers. They are characterized by small scale
planting, geographical dispersion, low level of technology and poor resistance against risks,
which make them unable to meet the bulk demand of the “big market”. They either choose the
“farmer-vendor” method to complete the first link of agricultural product circulation, or directly
become the main body of the market linkage.
Agricultural product sellers include agricultural product purchasers, bazaars, and
supermarkets. The purchasers of agricultural products are small in scale, shot of storage and
transportation equipment, and poor in quality control. Despite the large market, it is difficult for
these scattered traders to achieve systematic management and strict quality control. In contrast,
supermarkets have large scales, stable sources of customers, high level of informatization,
complete storage and transportation facilities as well as strict quality control and management
systems.
Distribution centres are the origin wholesale market and the wholesale market for retail outlets.
The origin wholesale market gathers a large number of individual agricultural products from
different origins. The goods have unclear information and varying quality. The information
Page 4
T. Lingjuan. L. Linhong, L. Menghan: Optimization of the Front-end Logistics Routes of Agricultural Products Based on Network
Platform
4 ENGINEERING MODELLING 31 (2018) 4, 1-14
barriers formed there hinder the circulation of agricultural product information. The same
problems also exist in the wholesale market for retail outlets.
Through the analysis of each link of the traditional agricultural product logistics model, the
problems are categorized as follows: (1) long logistics chain; (2) asymmetric information;
(3) low level of integration; (4) imbalance between the status of individual farmer households
and other market trading entities; (5) lack of special equipment by individual farmers.
3.2 CONSTRUCTION OF THE AGRICULTURAL PRODUCT NETWORK TRADING PLATFORM
Through the analysis of the traditional logistics model, considering its shortcomings, this paper
proposes the establishment of an e-business B2C network trading platform while maintaining
the state of land fragmentation, in order to achieve the following design objectives of the
agricultural product logistics system: (1) streamline the logistics chain and enhance the integrity
and systematization of the logistics chain; (2) improve the information level of the logistics
chain; (3) strengthen the quality and safety management of agricultural products; (4) optimize
the logistics routes and reduce the operating costs; (5) increase the revenue of each logistics
chain node; (6) integrate scattered farmers and strengthen the market access of farmers.
Considering the design objectives for the agricultural product logistics system, the optimized
agricultural product logistics model is established, as shown in Figure 2.
Fig. 2 Hypothetical agricultural product network logistics model
In this model, in order to gather scattered agricultural products, a village-level delivery station
is set within a certain radius area. Unlike the traditional farmer market, this delivery station is
responsible for pre-cooling, classification, processing, packing, transportation, collecting
information about demand and distribution from the first mile after the agricultural products
are harvested. It is located upstream from the circulation channel of agricultural products, and
is joined to the farmers in the places of origin, which strengthens their systematization and
makes the relationship between the farmers and the market closer. From the village delivery
station to the community pick-up points, scale economy can be realized through the overall
Page 5
T. Lingjuan. L. Linhong, L. Menghan: Optimization of the Front-end Logistics Routes of Agricultural Products Based on Network
Platform
ENGINEERING MODELLING 31 (2018) 4, 1-14 5
transportation. As daily consumer goods, agricultural products have stable demand in a short
term. Therefore, this model adopts a centralized distribution network to achieve their
distribution in the residential areas. In this distribution mode, all agricultural products are
stored in the warehouse of the community distribution centre, and scheduled in a centralized
manner through the network platform to the pick-up site in each residential area. This network
platform is a complete integrated information system used to achieve communication and
distribution connection between the community distribution centre and the pick-up sites,
whose service functions include collecting, analyzing, processing, and announcing of agricultural
product transactions and related product information, and providing corresponding
information feedbacks. Farmers can access virtual electronic malls and directly announce
product-related information through the information platform and find out the market
demands. Consumers can also learn agricultural product information through the platform and
place orders online or by phone. The community distribution centre sends the agricultural
products from the storage facility to the pick-up site according to the demands in the orders, and
the pick-up site matches each customer’s order through the network information system so that
consumers can pick up goods from there.
Compared with the traditional agricultural product logistics model, the new model has the
following advantages:
(1) The logistics chain is reduced. The distribution centres of agricultural products such as
origin and wholesale markets are removed, so there are fewer logistics links, which
eliminates the “information barrier” effect.
(2) Standardized distribution centres for agricultural products logistics are introduced, which
strengthen the integration capabilities of the logistics chain. Through the establishment of
standardized village dispatch sites, individual farmers are integrated into the agricultural
organization, which achieves the large-scale distribution of scattered production and
effectively stabilizes the supply and demand relationship of agricultural products.
(3) The information flow is centralized, which facilitates the transfer of information and the
promotion of technologies. Currently, the level of informatization is generally low in the
agricultural product industry. Online platforms can enable farmers to quickly increase their
information knowledge and skills, increase the smooth flow of agricultural product logistics
information and ease the imbalance between supply and demand.
(4) Storage and transportation costs are reduced. Agricultural products are transported
directly from the production site to the distribution centre. Such organized logistics leads
to the construction of an efficient storage and transportation system. At the same time, pick-
up sites are established on the basis of the existing facilities in each community, which can
also reduce storage and transportation costs.
4. “THE FIRST MILE” TRANSPORT ROUTE OPTIMIZATION MODEL
Agricultural products can only be preserved for a very short time, so fast and convenient
transportation is particularly important for reducing their loss and improving their trading
efficiency. Considering the small-scale production and numerous nodes of agricultural products,
a two-stage solution method is used, which groups the products first and then dispatches them,
to optimize the transportation distances between agricultural production sites and village
delivery station, and reduce logistics costs. First, the clustering method is used. Under certain
constraint conditions, the pick-up sites are zoned and integrated according to the relative
Page 6
T. Lingjuan. L. Linhong, L. Menghan: Optimization of the Front-end Logistics Routes of Agricultural Products Based on Network
Platform
6 ENGINEERING MODELLING 31 (2018) 4, 1-14
positions of the nodes so the routes to these sites can be optimized. To achieve this, the multi-
node vehicle routing problem is converted into a number of TSP problems. The improved loop
routes optimization algorithm is used to optimize the solution.
4.1. ZONING OF LOGISTICS PICK-UP SITES BASED ON K-MEANS CLUSTERING
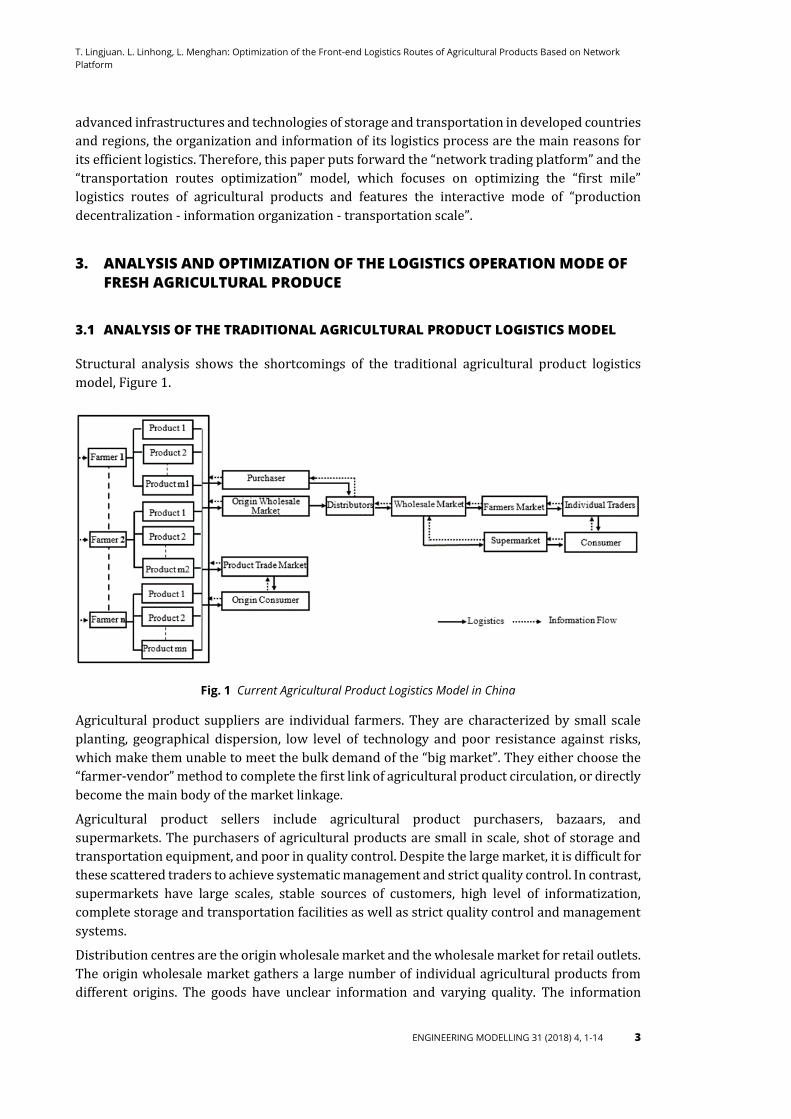
For the routing problem with obvious clustering characteristics of nodes distribution, the nodes
can be zoned to reduce the size of the problem, shorten the computation time and improve the
efficiency of decision-making. Here the clustering algorithm is used to cluster the pick-up sites
based on their geographical locations and with the “maximum vehicle load” as the constraint.
The concrete steps are as follows:
Step 1: Determine the initial cluster number k Q/q , where Q is the total amount of goods
to be transported during the transportation process, and q is the maximum load of each
vehicle.
Step 2: Determine the initial cluster centre. If the initial cluster number k mn , the nodes on
the map are divided into m rows and n columns by the equipartition method, and the initial
nodes in each area are the initial cluster centres.
Step 3: Cluster division. Calculate the distance between each non-centre node and each
cluster centre in the Geographic Information System to obtain the shortest distance, and
respectively, classify each non-centre node into the class with the nearest cluster centre
node.
Step 4: Determine the balance index. In this paper, the “vehicle maximum load” is the
constraint condition, so x
ii 1q q
is the equilibrium condition, in which qi is the total
amount of goods for each pick-up site, and x is the number of nodes in each cluster.
Step 5: Adjust the node set. Adjust the clusters formed in Step 3 according to the equilibrium
index. If x
ii 1q q
is true, the clustering ends. If it is not, there must be an overloaded
cluster of goods. Clusters that do not meet the constraints should be adjusted. Move the node
furthest from the centre point in the cluster and add it to another cluster and recalculatex
ii 1q
. Repeat step 5 until x
ii 1q q
in each cluster is true.
4.2. IMPROVED LOOP ROUTES OPTIMIZATION ALGORITHM
In this study, all nodes in the class are combined with P0 to form a closed loop after clustering. It
starts from P0 to each node and at last returns to P0, which is a typical TSP combination
optimization problem. The travelling salesman (TSP) problem, also known as the street vendor
problem, supposes a salesman has to visit a number of cities in a single closed tour, but he must
start and end the route in his home city and visit all other cities on the route exactly once [14].
Traditional methods generally cannot obtain the optimal solution to this kind of problem. This
paper proposes the use of the improved loop routes optimization algorithm to obtain the
approximate optimal solution. The basic idea of this algorithm is to find a Hamilton circle C first,
and then make appropriate modifications to C to obtain another Hamilton circle with a smaller
weight, and modify it repeatedly to obtain a better solution [15]. The concrete steps are as
follows:
Page 7
T. Lingjuan. L. Linhong, L. Menghan: Optimization of the Front-end Logistics Routes of Agricultural Products Based on Network
Platform
ENGINEERING MODELLING 31 (2018) 4, 1-14 7
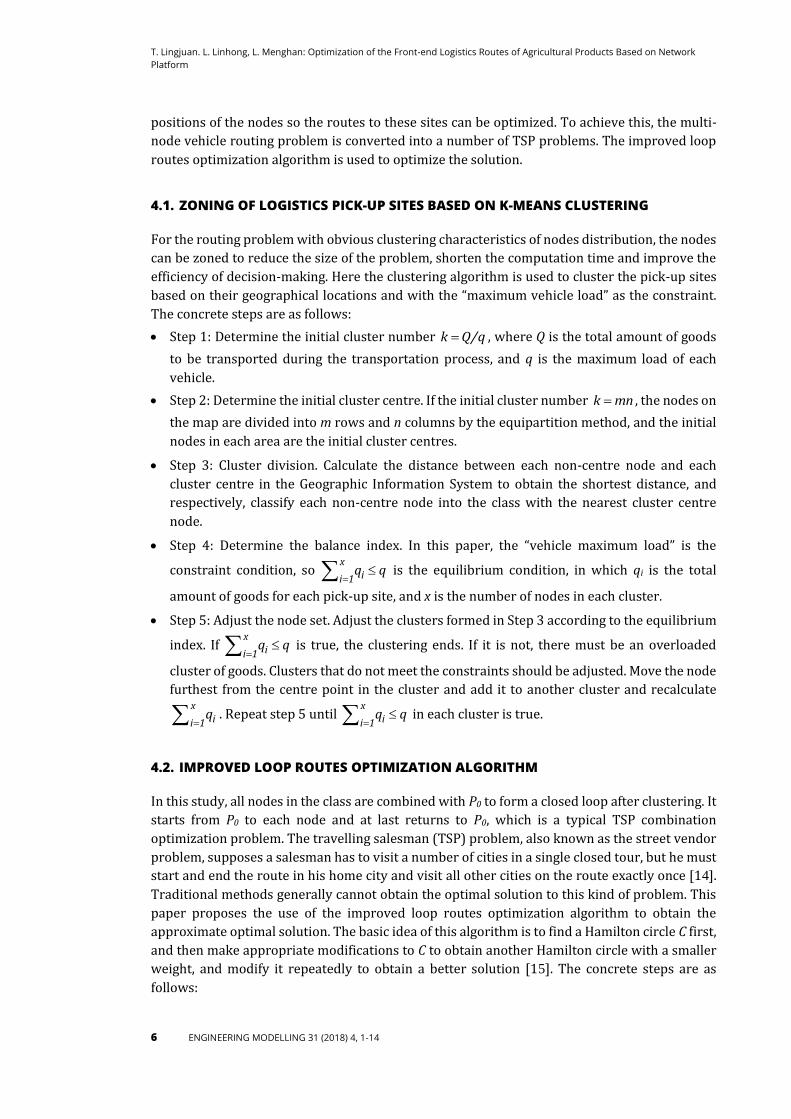
Step 1: Get the initial circle. Randomly select a point v1 as the starting point and find an
edge associated with it and having the smallest weight, which is denoted as v2; and in a
similar fashion, the Hamilton initial circle 1 2 n 1C v v ...v v is obtained by the nearest
neighbour method.
Step 2: Modify the initial Hamilton circle. Check the initial circle C. If there is i jv , v ,
i 1v and j 1v , ( i )j in C, make i j i 1 j 1 i i 1 j j 1w(v v ) w(v v ) w(v v ) w(v v ) ,
remove edges i i 1v v and jj 1v v from circle C, and add edge jiv v and edge i 1 j 1v v to
construct a new improved circle: 1 1 2 i j j 1 j 2 i 1 j 1 j 2 n 1C v v ...v v v v ...v v v ...v v .
Step 3: Replace C with C1 and go back to step 2. Repeat until it cannot be improved, and
finally obtain the approximate optimal circle Cn.
5. DEFINITION OF THE TRANSPORTATION COST MODEL
5.1. MODEL HYPOTHESES
(1) Vehicles are dispatched in a unified manner from the village delivery station, providing
transportation services for each production sites, and the location of every site is known.
(2) During the transportation, the carrying capacity of the vehicle, the unit transportation cost,
and the driving speed of the vehicle are certain.
(3) The total cargo weight picked at all sites does not exceed the maximum load of the vehicle.
(4) The total length of route for each transportation vehicle does not exceed its maximum
mileage.
(5) The agricultural products at each site are only loaded onto one vehicle, and each transport
vehicle can load agricultural products at multiple sites.
5.2. RELATED PARAMETERS AND VARIABLE DEFINITIONS
1C - Fixed costs, fixed service fees for vehicles, including driver’s salary
kf - The fixed cost of the vehicle k
2C - Variable costs, costs of vehicle maintenance and petrol
c - Unit distance transportation cost
ijd - Distance between the pick-up point i and j
1
0{k
ijx - Vehicle k travels from pick-up point i to j Vehicle k did not travel from pickup point i to j
1
0{k
ijy - Vehicle k picks up from pick-up point i to j Vehicle k is not picked up from pick-up point i to j
3C - Damage cost p - Unit price of agricultural products
js - Total amount of goods when vehicle arrived at j
1l - Unit time loss rate during transportation
2l - Unit time loss rate during loading and unloading
Page 8
T. Lingjuan. L. Linhong, L. Menghan: Optimization of the Front-end Logistics Routes of Agricultural Products Based on Network
Platform
8 ENGINEERING MODELLING 31 (2018) 4, 1-14
jq - Loading weight at point j
v - Handling efficiency
4C - Energy cost
1e - Unit time energy consumption during transportation
2e - Unit time energy consumption during loading
jt - Time when a vehicle arrives at the delivery point j
kijts - The time when vehicle k departs from point i to j
jq - Total amount of goods at point j
5.3. MODEL CONSTRAINTS
(1) Constraint on the number of the transport routes. The number of transport routes dose not
exceed the total number of the transport vehicles.
(2) Constraint on the maximum carrying capacity of the vehicle. The total weight of goods at
the pick-up sites does not exceed the maximum carrying capacity of the transport vehicle.
(3) Constraint on the vehicle transportation distance. The route distance of each vehicle is
shorter than its maximum mileage.
5.4. MODEL CONSTRUCTION
The “shortest route” can be calculated using the “transport route design model”. According to
the optimization goal, the total logistics cost model for agricultural products under the network
platform is established as follows:
Objective function:
m m n n m n m n2 j 2 jk k k k k k
ij ij ij 1 j ij j ij 1 j ij
k 1 k 1 i 0 j 0 k 1 j 1 k 1 j 1
l q e qMin f cd x p y l (t ts ) s y e (t ts )
v v
(1)
Constraint functions:
n mkij
j 1 k 1
y m, i 0
(2)
n
kj j
j 1
q y V , k 1,2,3 , ..., m
(3)
n nkij ij
i 1 j 1
x d L,k 1,2,3 ,m
(4)
mkj
k 1
y 1, j 1,1,3 , ...,n
(5)
Eq. (1) is an objective function of the transportation cost, including fixed cost, variable cost,
cargo damage cost, and energy consumption cost. The objective is to minimize them. In Eq. (1),
the first term is the fixed cost, which refers to the labour cost of transportation personnel and
Page 9
T. Lingjuan. L. Linhong, L. Menghan: Optimization of the Front-end Logistics Routes of Agricultural Products Based on Network
Platform
ENGINEERING MODELLING 31 (2018) 4, 1-14 9
the fixed usage fee of the vehicles, which is proportional to the number of vehicles used. The
formula is:
mk
1
k 1
C f
(6)
The second term represents the variable costs, including the maintenance cost of the
vehicles and the gasoline costs, which is proportional to the transportation distance of the
vehicles. The formula is:
m n nk
2 ij ij
k 1 i 0 j 0
C cd x
(7)
The third term indicates the loss cost of goods. The fresh agricultural products perish easily
during the process of transportation, loading and unloading. Therefore, the loss cost is divided
into the loss cost during transportation and that during loading and unloading. The calculation
formula is as follows:
m nj 2 jk k
3 ij j 1 j ij
k 1 j 1
q l qC p y s l (t ts )
v
(8)
The fourth term represents the cost of energy consumed to preserve fresh agricultural products
during transportation and loading on the vehicle cooled. Assuming that the energy costs of
transport vehicles are directly proportional to the transportation time and the number of pick-
up sites along the route, the formula is as follows:
m n2 jk k
4 ij 1 j j
k 1 j 1
e qC y e (t ts )
v
(9)
Eq. (2) is the constraint function of the logistic route, which indicates that the total number of
transport routes dose not exceed the total number of the transport vehicles.
Eq. (3) is the constraint function of the vehicle load, which indicates that the total cargo weight
at all pick-up sites along the transportation route should not be greater than the maximum
carrying capacity of the transport vehicle.
Eq. (4) is the constraint function of the vehicle mileage, which indicates that the length of the
transport routes should not be greater than the maximum mileage of the vehicle K during
transportation.
Eq. (5) indicates that each pick-up site is served by only one vehicle.
6. EXAMPLE ANALYSIS
6.1. EXAMPLE DESCRIPTION
The transportation of fresh agricultural produce in 19 villages scattered in a certain area of
Yunnan is taken as an example. The village level dispatch station provides transportation
services for each village. The transportation vehicles start from the village level dispatch station
to each node to load the goods. Finally, the goods are gathered at the village level dispatch station
and distributed with the help of the network platform. Therefore, the agricultural product
Page 10
T. Lingjuan. L. Linhong, L. Menghan: Optimization of the Front-end Logistics Routes of Agricultural Products Based on Network
Platform
10 ENGINEERING MODELLING 31 (2018) 4, 1-14
logistics optimization model in this area contains 20 location nodes, among which the village
level dispatch station is P0, and the other villages are P1, P2, P3... P19. The carrying weight of each
vehicle is 5 tons, and the average speed of the vehicle to the pick-up sites is 50 km/h. The fixed
transportation cost is 400 Yuan per vehicle, and the cost per unit distance of transportation is
3 Yuan/km. The unit price of agricultural products is 5000 Yuan per ton. The average loss rate
of agricultural products in the transportation and loading process is 1%, the energy
consumption rate in the transportation process is 10 Yuan/h, the energy consumption rate
during the loading and unloading process is 20 Yuan/h, and the loading and unloading efficiency
is 5 tons/h. The location coordinates of each node and the quantity of agricultural products
supplied are shown in Table 1.
Table 1 Locations of the Pick-up sites and Supply of Agricultural Products
Nodes
Location Supply
quantity
(kg)
Nodes
Location Supply
quantity
(kg) Latitude longitude Latitude longitude
P0 24°10'28.81" 102°37'36.69" 0 P 10 24° 7'49.61" 102°39'14.81" 700
P 1 24°11'10.69" 102°45'42.07" 500 P 11 24° 6'15.36" 102°40'26.63" 1000
P 2 24°10'24.69" 102°43'52.13" 900 P 12 24° 6'30.45" 102°41'53.50" 1100
P 3 24°10'36.70" 102°42'40.94" 400 P 13 24° 7'48.03" 102°43'12.67" 600
P 4 24°10'40.82" 102°41'38.87" 800 P 14 24° 8'37.78" 102°48'15.17" 800
P 5 24° 9'47.40" 102°43'9.82" 400 P 15 24° 8'34.29" 102°46'42.91" 1200
P 6 24° 8'51.29" 102°42'24.43" 900 P 16 24° 7'28.68" 102°46'15.49" 700
P 7 24° 9'6.27" 102°41'1.70" 500 P 17 24° 7'4.03" 102°46'45.06" 500
P 8 24° 9'28.47" 102°39'21.27" 900 P 18 24° 7'32.86" 102°47'21.29" 1100
P 9 24° 8'26.27" 102°40'7.38" 1200 P 19 24° 7'11.49" 102°48'38.24" 600
6.2. ZONING OF LOGISTICS PICK-UP SITES
The production nodes in the example can be clustered by the K-means clustering method,
described in Section 3.1. According to the total quantity of goods in all production places in Table
1 and the carrying capacity of the transport vehicle, the initial cluster number k=3 can be
obtained. Initially, the nodes in the study zone are divided into three zones M1, M2, M3 by the
method of equalization, and the nodes P9, P5 and P18 near the center of each zone are selected as
the initial cluster center nodes, as shown in Figure 3.
Fig. 3 Spatial Distribution of Agricultural Production Sites
Page 11
T. Lingjuan. L. Linhong, L. Menghan: Optimization of the Front-end Logistics Routes of Agricultural Products Based on Network
Platform
ENGINEERING MODELLING 31 (2018) 4, 1-14 11
The distance between each non-centre node and the above 3 initial cluster centre nodes is
calculated in the Geographic Information System, and then the nodes can be clustered. The
clustering information is as follows:
P1, P2, P3, P4, P5, P6 and P13 are classified into cluster I,
P7, P8, P9, P10, P11 and P12 are classified into cluster II and
P14, P15, P16, P17, P18 and P19 are classified into cluster III.
According to the actual situation, the vehicle load capacity of 5 tons, i.e. x
ii 1q 5
t , is used as
the constraint condition to test the clusters, and the results are as follows: t (tons)
In cluster I: iq 4.5 5 t t ,
In cluster II: iq 5.4 5 t t ,
In cluster III: iq 4.9 5 t t .
As can be seen, the nodes in cluster II do not conform to the constraint condition, so these nodes
should be clustered again. The final results are shown in Table 2.
Table 2 Cluster Grouping of Agricultural Production Sites
Clusters Nodes Supply quantity
Cluster I P1, P2, P3, P4, P5, P6, P7, P13 5.0 t
Cluster II P8, P9, P10, P11, P12 4.9 t
Cluster III P14, P15, P16, P17, P18, P19 4.9 t
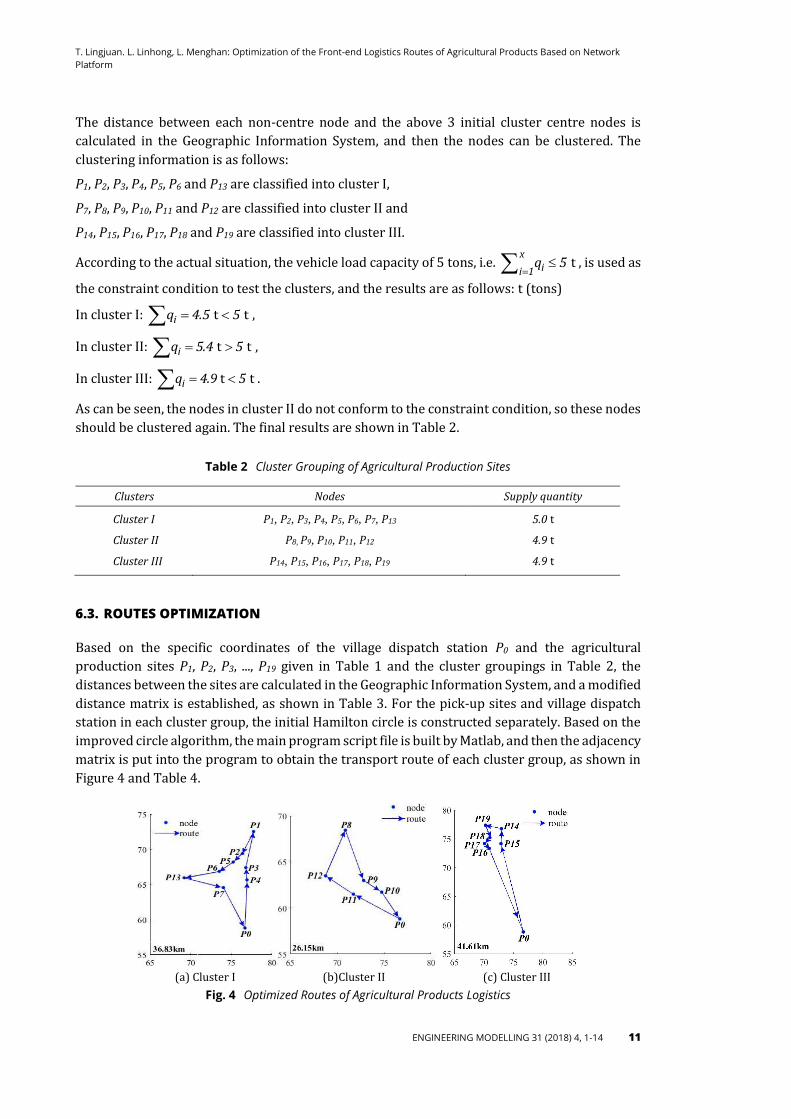
6.3. ROUTES OPTIMIZATION
Based on the specific coordinates of the village dispatch station P0 and the agricultural
production sites P1, P2, P3, ..., P19 given in Table 1 and the cluster groupings in Table 2, the
distances between the sites are calculated in the Geographic Information System, and a modified
distance matrix is established, as shown in Table 3. For the pick-up sites and village dispatch
station in each cluster group, the initial Hamilton circle is constructed separately. Based on the
improved circle algorithm, the main program script file is built by Matlab, and then the adjacency
matrix is put into the program to obtain the transport route of each cluster group, as shown in
Figure 4 and Table 4.
(a) Cluster I (b)Cluster II (c) Cluster III
Fig. 4 Optimized Routes of Agricultural Products Logistics
Page 12
T. Lingjuan. L. Linhong, L. Menghan: Optimization of the Front-end Logistics Routes of Agricultural Products Based on Network
Platform
12 ENGINEERING MODELLING 31 (2018) 4, 1-14
Table 3 Modified Distance Matrix
P0 P1 P2 P3 P4 P5 P6 P7 P8 P9 P10 P11 P12 P13 P14 P15 P16 P17 P18 P19
P0 0 ∞ ∞ ∞ ∞ ∞ ∞ ∞ ∞ ∞ ∞ ∞ ∞ ∞ ∞ ∞ ∞ ∞ ∞ ∞
P1 13.8 0 3.4 5.2 6.9 5.0 7.1 8.8 ∞ ∞ ∞ ∞ ∞ 7.6 ∞ ∞ ∞ ∞ ∞ ∞
P2 10.6 3.4 0 2.0 3.8 1.6 3.8 5.4 ∞ ∞ ∞ ∞ ∞ 4.9 ∞ ∞ ∞ ∞ ∞ ∞
P3 8.6 5.2 2.0 0 1.8 1.7 3.3 3.9 ∞ ∞ ∞ ∞ ∞ 5.3 ∞ ∞ ∞ ∞ ∞ ∞
P4 6.9 6.9 3.8 1.8 0 3.1 3.6 3.1 ∞ ∞ ∞ ∞ ∞ 5.9 ∞ ∞ ∞ ∞ ∞ ∞
P5 9.5 5.0 1.7 1.7 3.1 0 2.2 3.8 ∞ ∞ ∞ ∞ ∞ 3.7 ∞ ∞ ∞ ∞ ∞ ∞
P6 8.7 7.1 3.8 3.3 3.6 2.2 0 2.4 ∞ ∞ ∞ ∞ ∞ 2.4 ∞ ∞ ∞ ∞ ∞ ∞
P7 6.3 8.8 5.4 3.9 3.1 3.8 2.4 0 ∞ ∞ ∞ ∞ ∞ 4.4 ∞ ∞ ∞ ∞ ∞ ∞
P8 3.5 ∞ ∞ ∞ ∞ ∞ ∞ ∞ 0 2.3 3.1 6.2 6.9 ∞ ∞ ∞ ∞ ∞ ∞ ∞
P9 5.7 ∞ ∞ ∞ ∞ ∞ ∞ ∞ 2.3 0 1.9 4.1 4.7 ∞ ∞ ∞ ∞ ∞ ∞ ∞
P10 5.6 ∞ ∞ ∞ ∞ ∞ ∞ ∞ 3.1 1.9 0 3.5 5.1 ∞ ∞ ∞ ∞ ∞ ∞ ∞
P11 9.2 ∞ ∞ ∞ ∞ ∞ ∞ ∞ 6.2 4.1 3.5 0 2.5 ∞ ∞ ∞ ∞ ∞ ∞ ∞
P12 10.3 ∞ ∞ ∞ ∞ ∞ ∞ ∞ 6.9 4.7 5.1 2.5 0 ∞ ∞ ∞ ∞ ∞ ∞ ∞
P13 10.7 7.6 4.9 5.3 5.9 3.7 2.4 4.4 ∞ ∞ ∞ ∞ ∞ 0 ∞ ∞ ∞ ∞ ∞ ∞
P14 18.4 ∞ ∞ ∞ ∞ ∞ ∞ ∞ ∞ ∞ ∞ ∞ ∞ ∞ 0 2.6 4.0 3.9 2.5 2.8
P15 15.8 ∞ ∞ ∞ ∞ ∞ ∞ ∞ ∞ ∞ ∞ ∞ ∞ ∞ 2.6 0 2.2 2.9 2.2 4.1
P16 15.7 ∞ ∞ ∞ ∞ ∞ ∞ ∞ ∞ ∞ ∞ ∞ ∞ ∞ 4.0 2.2 0 1.1 1.9 4.1
P17 16.7 ∞ ∞ ∞ ∞ ∞ ∞ ∞ ∞ ∞ ∞ ∞ ∞ ∞ 3.9 2.9 1.1 0 1.4 3.2
P18 17.4 ∞ ∞ ∞ ∞ ∞ ∞ ∞ ∞ ∞ ∞ ∞ ∞ ∞ 2.5 2.2 1.9 1.4 0 2.3
P19 19.6 ∞ ∞ ∞ ∞ ∞ ∞ ∞ ∞ ∞ ∞ ∞ ∞ ∞ 2.8 4.1 4.1 3.2 2.3 0
Table 4 Transport Routes and Costs
Clusters Routes Routes length(km) Cost (Yuan)
I P0→P4→P3→P1→ P2→P5→P6→P13→P7→P0 36.83 775.84
II P0→P11→P12→P8→P9→P10→P0 26.15 707.08
III P0→P15→P14→P19→P18→P17→P16→P0 41.61 795.79
Therefore, the calculation results of the three routes obtained by the routes optimization
method are as follows: for cluster I, the route length is 36.83 km and the transportation cost
775.84 Yuan; for cluster II, the route length is 26.15 km and the transportation cost 707.08 Yuan;
and for cluster III, the route length is 41.61 km and the transportation cost 705.79 Yuan. The
total cost of transportation is 2278.71 Yuan.
In the traditional scattered transportation model, suppose that each village has one
transportation vehicle with a load capacity of 2 tons, that the fixed transportation cost is 200
Yuan per vehicle and that other conditions remain unchanged. Through calculation, it is found
that the total transportation distance is 213 km and that the total cost is 4464.86 Yuan. It is clear
that the cost of the traditional transport model is much higher than that of the route optimization
model model.
Through the two-stage method, the multi-node routing problem is transformed into several TSP
problems, which reduces the complexity of the whole problem. Considering the perishability of
agricultural products, it is necessary to arrange transportation routes reasonably, during
storage and preservation, and to divide logistics costs into four parts: fixed cost, variable cost,
damage cost, and energy consumption cost. Based on the hypotheses, a transport route
optimization model with minimum transport cost as the objective is established, and the
Page 13
T. Lingjuan. L. Linhong, L. Menghan: Optimization of the Front-end Logistics Routes of Agricultural Products Based on Network
Platform
ENGINEERING MODELLING 31 (2018) 4, 1-14 13
improved loop routes optimization algorithm is used to obtain an approximate optimal solution
for the model.
7. CONCLUSION
With the trend of economic globalization, the contradictions between the organized “big
market” and the decentralized individual farmers have become more prominent under the
background of fragmented land in China. Because of the large number of production sites and
the small scale of production, the “first mile” transportation has become a bottleneck preventing
farmers from increasing their income. After in-depth analysis of the agricultural product
logistics models in developed countries, and based on the characteristics of the agricultural
products logistics and the current situation of agricultural land utilization in China, this paper
optimizes the traditional logistics routes by constructing a network logistics model for
agricultural products to strengthen the organization, integration, information and scale of
logistics, reduce the logistics links and lower the costs of storage and transportation. In order to
achieve fast and efficient “first mile” transportation of agricultural products for individual
farmers, this paper provides a two-stage solution method, which carries out first grouping and
then dispatching, and transforms the complex multi-node routes problem into TSP problems.
After clustering, the pick-up sites are more closely conneected and the scope of pick-up is
clearer, which can effectively improve the “first mile” transportation efficiency, and promote the
interconnections between individual farmers and the “big market”. In the case analysis, the
improved loop routes optimization algorithm and the Matlab numerical calculation are used to
verify that this model can provide technical reference for the fresh agricultural product logistics
under the fragmented pattern of cultivated land in China.
8. ACKNOWLEDGMENTS
This work is supported by National Natural Science Foundation of China (No.71463032).
9. REFERENCE
[1] S. Burton, R. King, Land Fragmentation and Consolidation in Cyprus: A Descriptive
Evaluation, Agricultural Administration, Vol. 11, No. 3, pp. 183-200, 1982.
https://doi.org/10.1016/0309-586X (82)90115-7
[2] X.X. Shu, X.Q. Wang, Study on Land Fragmentation and Grain Production in the Farming
Sector, China Rural Survey, No. 3, pp. 22-28, 2002.
https://doi.org/10.3109/01443618109067435
[3] X.W. Wang, F. N. Zhong, Land Fragmentation and the Land Transfer Market. China Rural
Survey, No. 4, pp. 29-34, 2008.
[4] X.L. Shi, The Development Trend of Agricultural Products Logistics and the
Countermeasures, China Business and Market, Vol. 29, No. 7, pp. 25-29, 2015.
[5] L.F. Ding, The Integration of Agriculture, Logistics and Commerce: A Logistic Pattern of
Agricultural Products in the Context of Cloud Logistics, China Business and Market, No. 6,
41-45, 2014.
Page 14
T. Lingjuan. L. Linhong, L. Menghan: Optimization of the Front-end Logistics Routes of Agricultural Products Based on Network
Platform
14 ENGINEERING MODELLING 31 (2018) 4, 1-14
[6] G.F. Vaughn, Organized Speculation as an Institution: John Franklin Crowell and the U.S.
Industrial Commission Report on Distribution of Farm Products, Journal of Economic Issues,
Vol. 39, No. 1, pp. 221-233, 2005.
https://doi.org/10.1080/00213624.2005.11506787
[7] D.P. Cooper, M. Tracey, Supply chain integration via information technology: strategic
implications and future trends, International Journal of Integrated Supply Management, Vol.
1, No. 3, pp. 237-237, 2005. https://doi.org/10.1504/IJISM.2005.005949
[8] J. Olhager, D. Prajogo, Supply chain integration and performance: The effects of long-term
relationships, information technology and sharing, and logistics integration, International
Journal of Production Economics, Vol. 135, No. 1, pp. 514-522, 2012.
https://doi.org/10.1016/j.ijpe.2011.09.001
[9] A. Latini, C.A. Campiotti, E. Pietrantonio, Identifying Strategies for Energy Consumption
Reduction and Energy Efficiency Improvement in Fruit and Vegetable Producing
Cooperatives: A Case Study in the Frame of TESLA Project, Agriculture & Agricultural
Science Procedia, No. 8, pp. 657-663, 2016. https://doi.org/10.1016/j.aaspro.2016.02.088
[10] R. Narasimhan, S.W. Kim, Information System Utilization Strategy for Supply Chain
Integration, Journal of Business Logistics, Vol. 22, No. 2, pp. 51-75, 2011.
https://doi.org/10.1002/j.2158-1592. 2001.tb00003.x
[11] L. Burmeister, G. Ranis, M. Wang, Group Behavior and Development: A Comparison of
Farmers' Organisations in South Korea and Taiwan, Social Science Electronic Publishing, No.
92, pp. 349-353, 2001.
[12] X.H. Wang, Q.L. Zhang, Construction of Cold-Chain Logistics System for Fresh Agricultural
Products Based on the Internet of Things: Framework, Mechanism and Path, Journal of
Nanjing Agricultural University (Social Sciences Edition), No. 1, pp. 31-41, 2016.
[13] Y.Y. Mu, S. Kozo, Research on the circulation of fruits and vegetables and their winning rate
in Japan, World Agriculture, No. 2, 31-34, 2006.
https://doi.org/10.3969/j.issn.1002-4433.2006.02.012
[14] S.K. Hui, P.S. Fader, E.T. Bradlow, The Traveling Salesman Goes Shopping: The Systematic
Deviations of Grocery Paths from TSP Optimality, Marketing Science, Vol. 28, No. 3, pp. 566-
572, 2009. https://doi.org/10.1287/mksc.1080.0402
[15] S.K. Si, Z.L. Sun, X.J. Sun, Mathematical modeling algorithm and its application, Beijing:
National Defense Industry Press, pp. 37-71. 2015.