69
Optimization of the HARI stand-alone energy system with TRNSYS Individual Project Friday 22 nd September 2006 Arnaud ETE MSc in Energy System and the Environment

Optimization of the
HARI
stand-alone energy system
with TRNSYS
Individual Project
Friday 22
nd September 2006
Arnaud ETE
MSc in
Energy System and the Environment

2
Copyright Declaration
The copyright of this dissertation belongs to the author under the terms of the United Kingdom Copyright Acts as qualified by University of Strathclyde Regulation 3.49. Due acknowledgement must always be made of the use of any material contained in, or
derived from, this dissertation.

3
Abstract
The project aims to assess the viability of a stand-alone hydrogen-based energy system. This will
be achieved using software models that could be applied in the design of similar hydrogen and
renewables systems. The suitability of the selected tools for this tasks will also be assessed.
The assessment will be based around the case study of the Hydrogen and Renewables Integration
(HARI) project at West Beacon Farm in Leicestershire. This project investigates methods of
storing the energy generated by intermittent renewable sources using hydrogen. A hydrogen
system comprising an electrolyzer, a pressurised gas store and fuel cells has been added to an
existing renewable energy system which includes wind turbines, PV arrays and micro-hydro
generators to feed commercial and domestic loads on a local mini-grid. The local electricity
distribution network is centred around a 620V DC bus. The HARI project illustrates the concept
of “Hydrogen Economy” with the ultimate objective of achieving grid independence for West
Beacon Farm once become self-sufficient.
In this project the HARI system is modelled and simulated with the program TRNSYS,
developed by the University of Massachusetts, in parallel with another modeling and
optimization software (HOMER).
The specific objectives of the work are as follows.
The first objective was simply to evaluate the ability of TRNSYS to model the HARI system.
The second objective was to use HOMER and TRNSYS in parallel to compare the operation of
both programs and to optimize the size of the HARI system components and thereby improve its
performance.
Thirdly, a methodology was established from the modelling process.
This methodology was finally applied in a different context: the HARI system relocated into a
more Northerly climate (Glasgow); this was undertaken to determine the impact of weather
changes on the optimal configuration of the system.
The main outcome of the project was that the optimization process developed and applied to the
HARI system predicted the potential for a significant reduction in the size of the system
components, thereby reducing the system cost and improving its performance. The geographic
relocation of the project indicated that the optimization process was applicable on different
scenarios.

4
Table of contents
A. Introduction and objectives 8 1. Aims and objectives of the project ...................................................................................... 8
2. The Hydrogen Economy...................................................................................................... 9
B. Description of the HARI project 10 1. West Beacon Farm............................................................................................................. 10
2. The installed system at WBF............................................................................................. 11
a. Installed generators 11
b. Hydrogen system 12
c. Summary of HARY components and WBF layout 15
3. Electrolysis from renewables............................................................................................. 17
4. WBF infrastructure ............................................................................................................ 17
5. Components integration and electrical network at WBF................................................... 19
a. Central DC bus 20
b. Power-electronic converters 21
c. Power conditioning model in TRNSYS 22
6. System of control............................................................................................................... 23
a. Power supply control 23
b. Control parameters and description of the control strategy 24
c. Optimisation of the control strategy 27
7. The HARI project and the hydrogen economy.................................................................. 30
8. Conclusion: knowledge gained so far and further plans.................................................... 31
C. Simulation with TRNSYS 34 1. Definitions ......................................................................................................................... 34
a. What is TRNSYS 34
b. What is HYDROGEMS 34
2. HARI model: control strategy based on the SOC of the hydrogen store .......................... 35
a. The Master Controller 35
b. HARI system modelling 38
D. Simulation with HOMER and combined modelling 41 1. What is HOMER ............................................................................................................... 41
2. Control strategy in HOMER.............................................................................................. 41
3. HARI system modelling .................................................................................................... 42
4. Load and resource data ...................................................................................................... 43
5. Simulation of the HARI system by HOMER and TRNSYS............................................. 47
E. Methodology for the optimization process 50 1. Optimization process ......................................................................................................... 50
a. Methodology 50
b. HOMER optimal system 51
c. TRNSYS optimal system 52
d. Summary 52
2. Operation of the optimal systems found by HOMER and TRNSYS ................................ 52
3. Conclusion on the HARI optimal system .......................................................................... 57
4. Relocation of the model in Glasgow ................................................................................. 58
a. Glasgow weather data 58
b. Optimal system in Glasgow 60

5
c. Impact of the weather changes on the optimal system size 63
F. Conclusion 65 Acknowledgments ..................................................................................................................... 67
References ................................................................................................................................. 68

6
Table of figures and tables
Figure 1: Hydrogen used as a load-balancing mechanism [2]......................................................... 9
Figure 2: The installed system at West Beacon Farm [2].............................................................. 11
Figure 3: PV arrays at West Beacon Farm [4]............................................................................... 12
Figure 4: The electrolyzer used at WBF [2] .................................................................................. 13
Figure 5: The hydrogen store at WBF [2] ..................................................................................... 14
Figure 6: Intelligent Energy 2kW FC [1] ...................................................................................... 14
Figure 7: Plug Power Gencore® 5kW FC [1] ............................................................................... 14
Figure 8: The 2kW nickel sodium chloride Zebra battery [1] ....................................................... 15
Table 1: Summary of HARI sub-systems [1] ................................................................................ 15
Figure 9: Map of the HARI project site [1] ................................................................................... 16
Figure 10: View of the hydrogen building at WBF [1] ................................................................. 18
Figure 11: Layout of the WBF hydrogen building [1] .................................................................. 19
Figure 12: The West Beacon Farm stand-alone power supply [6] ................................................ 20
Figure 13: The bespoke DC/DC converters [6]............................................................................. 21
Figure 14: Two-transistor forward converter diagram [6]............................................................. 22
Figure 15: State of charge control [6]............................................................................................ 24
Figure 16: Control strategy for the electrolyzer and the FC based on the battery SOC [14] ....... 25
Figure 17: Cost of cycling energy [25].......................................................................................... 28
Figure 18: Costs of supplying energy in the discharge process [15]............................................. 29
Figure 19: The Hydrogen Economy model [2] ............................................................................. 31
Figure 20: HYDROGEMS components [10] ................................................................................ 35
Figure 21: Control strategy based on the SOC of the hydrogen store........................................... 36
Figure 22: HARI modeling with TRNSYS, including printers and plotters ................................. 38
Figure 23: HARI modeling with TRNSYS ................................................................................... 39
Figure 24: Alkaline electrolyzer model (EES executable developed by Øystein Ulleberg) ......... 40
Figure 25: Parameters of the electrolyzer required by TRNSYS .................................................. 40
Figure 26: Model of the HARI system with HOMER................................................................... 43
Figure 27: Copy of the TRNSYS model with HOMER................................................................ 43
Figure 28: Load data for HOMER and TRNSYS simulations ...................................................... 44
Figure 29: Solar data for HOMER and TRNSYS simulations...................................................... 45
Figure 30: The NCEP reanalysis data download page .................................................................. 46
Table 2: Reanalysis data used to define the wind resource at WBF.............................................. 46
Figure 31: Wind data for HOMER and TRNSYS simulations ..................................................... 47
Table 3: Comparison of HOMER and TRNSYS simulations for the HARI system..................... 48
Figure 32: SOC of the hydrogen store simulated by HOMER and TRNSYS............................... 49
Figure 33: Energy balance simulated by TRNSYS and HOMER................................................. 49
Figure 34: Methodology for the optimization process .................................................................. 51
Figure 35: Optimal system found by HOMER.............................................................................. 51
Table 4: Summary of HOMER and TRNSYS optimal systems.................................................... 52
Table 5: Operation of the optimal systems obtained with HOMER and TRNSYS ...................... 53
Figure 36: SOC of the H2 store for the optimal systems found by HOMER and TRNSYS......... 53
Figure 37 (a), (b) and (c): Energy balance in the optimal systems found by HOMER and
TRNSYS................................................................................................................................ 56
Figure 37 (d): Zoom of figure 36 (c) between days 250 and 350.................................................. 56

7
Figure 38: Correlation between the energy balances in the optimal systems found by HOMER
and TRNSYS ......................................................................................................................... 57
Table 6: Comparison between the actual and optimal HARI systems .......................................... 58
Figure 39: Glasgow solar data for HOMER and TRNSYS simulations ....................................... 59
Table 7: Reanalysis data used to define the wind resource in Glasgow........................................ 59
Figure 40: Glasgow wind data for HOMER and TRNSYS simulations ....................................... 60
Table 8: Summary of HOMER and TRNSYS optimal systems in Glasgow ................................ 61
Table 9: Comparison of the optimal systems in Glasgow obtained with HOMER and TRNSYS 61
Figure 41: SOC of the H2 store in the optimal systems found by HOMER and TRNSYS in
Glasgow ................................................................................................................................. 62
Figure 42: Energy balance in the optimal systems found by HOMER and TRNSYS in Glasgow62
Figure 43: Correlation between the energy balance in the optimal systems found by HOMER and
TRNSYS in Glasgow............................................................................................................. 63
Table 10: Comparison of the optimal systems found by TRNSYS in Loughborough and Glasgow
............................................................................................................................................... 63
Table 11: Comparison of performances of the optimal systems in Loughborough and Glasgow 64
Figure 44: Comparison of the SOC of the H2 store in Loughborough and Glasgow ................... 64

8
A. Introduction and objectives
1. Aims and objectives of the project
Stand-alone power systems are used by many communities around the world that have no access
to grid electricity. But whereas most of these stand-alone systems are still based on fossil fuel
power production, the use of renewable energy within these systems is growing as a consequence
of rising fuel prices and environmental concerns. The integration of wind and solar energy system
based on a long-term seasonal storage of hydrogen is considered as a promising solution to
overcome the limitations associated with the intermittency of renewable sources.
The Hydrogen and Renewables Integration (HARI) project at West Beacon Farm (WBF) in
Leicestershire is part of the research program at CREST (Centre for Renewable Energy Systems
Technology), at Loughborough University. This project aims at investigating methods of storing
the energy generated by intermittent renewable sources such as wind and solar energy. The
project, which was actually conceived with the ultimate objective of achieving grid independence
for WBF once become self-sufficient, constitutes the first illustration of the concept of
“Hydrogen Economy” in action within the UK.
But this hydrogen-based technology is far from being mature, with only a few examples
throughout the world. This is still an expensive technology and developing software models of
these stand-alone power systems is therefore essential to simplify the design of future similar
systems. The main objective of this project was therefore to model a stand-alone power system
(the HARI project, described later), optimize the size of its components and evaluate its
performances under different geographical and weather conditions.
More specifically, this report presents two models of the HARI system developed on the
TRNSYS and HOMER simulation platforms. The results of these models are analysed and
compared in order to estimate the accuracy of the simulations. Both models can then be used
complementarily using the strong points of each program to determine the optimal size of the
system. HOMER is used to find a first approximation of the optimal system, and TRNSYS is
then used to refine the previous results.
The specific objectives of the work are therefore to evaluate the ability of TRNSYS to model the
HARI system, to compare the operation of HOMER and TRNSYS, to establish a methodology
using both programs in parallel to optimize the size of the HARI system components and thereby
improve its performance, and finally to determine the impact of weather changes on the optimal
configuration of the system.
This report is organised in 6 parts. The next part describes the HARI project and the different
elements that compose the power system. A crucial aspect of this project, the control strategy
developed at WBF to control the HARI system, is part of this description. Parts C and D describe
the models developed with HOMER and TRNSYS. The methodology for the optimization
process and the results of the simulations are presented in part E. Finally, the effects of the
relocation of the HARI system in Glasgow precede the conclusion of this report.

9
2. The Hydrogen Economy
The term “Hydrogen Economy” has different definitions depending on people who use it, but in
its purest sense, it represents an energy systems relying exclusively on renewable energies for its
primary resource and hydrogen for energy storage.
All hazards of greenhouse gases are therefore eliminated in this system where all the primary
energy will come from renewables (and nuclear power potentially). But in a stand-alone
renewable energy system where the primary energy resource is totally dependent upon the
weather, the output of such a resource cannot be controlled and it is inevitable that the power
supply rarely matches the fluctuating demand of the system’s loads. Some form of balancing
mechanism is absolutely necessary, as well as some form of energy storage.
Batteries are able to compensate this mismatch over short periods, but they become expensive,
bulky and inefficient beyond a few days. Lead acid batteries for example suffer from self-
discharge, limited charge rates, high maintenance requirements and short lifetimes.
On the other hand, hydrogen offers long-term and large-scale capacity storage achievable at a
lower cost. At times of surplus of electricity production from the renewables, hydrogen can be
produced through electrolysis of water (electrical energy transformed into chemical energy) and
stored for later use. When there is a shortage of power from the renewable sources to power the
loads on the system, the stored hydrogen can be converted back to water via fuel cells, releasing
electricity to match the demand. The production and consumption of hydrogen are actually used
as a load balancing mechanism. Moreover, hydrogen presents both a means of storing grid power
and of providing transport fuel. Vehicles will then be able to run without emitting any hazardous
gas, while providing the performances we expect from conventional engines – something that
batteries have never been able to achieve. Combining the needs of balancing supply and demand
on the electricity grid with providing fuel for transportation, hydrogen produced from renewables
is the energy medium that can offer a pollution-free energy system for the future.
Figure 1: Hydrogen used as a load-balancing mechanism [2]

10
B. Description of the HARI project
The Hydrogen and Renewables Integration (HARI) project, joint winner of the “Non-profit
Organisations” category of the 2006 Eurosolar UK Awards, is a research initiative investigating a
stand-alone energy system that associates a complete renewable system and a hydrogen energy
storage system. It is part of the research program at CREST (Centre for Renewable Energy
Systems Technology), at Loughborough University. It constitutes the first large scale illustration
of the concept of “Hydrogen Economy” in action within the UK.
1. West Beacon Farm
West Beacon Farm (WBF) in Leicestershire is a family home that has been converted to
demonstrate an integrated sustainable energy generation network providing independence from
fossil fuels. More accurately, what is generally refered to as the West Beacon Farm (WBF)
system is, in fact, spread across two interconnected sites that are very close to each other: the
West Beacon Farm site itself and the Beacon Energy (BE) offices at Whittle Hill Farm. In 1969,
the land of West Beacon Farm was very bleak, with only few trees. The priority was therefore to
plant thousands of trees, which has enhanced the farm, enriched the biodiversity and at the same
time added to the capture of carbon dioxide in the atmosphere. When in the 1980’s the public
awareness was being raised and the UK’s increasing reliance on imported energy was also being
highlighted, it was decided to replace the oil fired boiler in the farmhouse with a ground source
heat pump system. A 4kW wind turbine and 3kW of photovoltaic arrays were installed shortly
after that to make the heat pump a self-sufficient system powered entirely by renewables. The site
has now become one of the world’s best examples of renewable energy in practice. The
technologies on site include:
- two 25kW two-bladed wind turbines (now 17 years old),
- a total of 13kWp of PV arrays spread across the two sites,
- 3.05 kW of micro-hydro generators,
- a hydrogen energy system,
- a water conservation system where rainwater is the only source,
- a sustainable transportation system with electric and hybrid cars.
Heating - The farm is heated by a Biklim TOTEM CHP. This propane fuelled CHP unit is
approximately 95% efficient and is rated to generate 15kW of electricity and 38kW of heat.
Although LPG is a fossil fuel, its combustion is cleaner than standard fuels, with relatively low
emissions of greenhouse gases. Gas from a biomass gassifier or hydrogen generated by an
electrolyzer could also be used to fuel the unit.
Additional heating is generated by a water sourced heat pump system using the water from the
lake of the farm. About 4.5 units of useful heat are produced for each unit of electricity consumed
by the heat pump and compressor. Since all the electricity required is produced by renewable
sources, this heat pump is one of the cleanest and most efficient home heating systems possible.
Water - West Beacon Farm is not connected to the mains water network. The only source of
water on the site is the rain. The rainwater is collected from the rooftop and filtered before being

11
stored in a 6,000 litre underground storage tank. It is then filtered three more times before being
stored in a second tank. At this stage it is suitable for all use except drinking. Drinking water
passes through a ultra-violet filter and then a purifier.
Transport - An electric car with a range of 120 miles and a top speed of 75mph was bought in
1997. A Toyota Prius hybrid was also bought in 2003. It combines a petrol engine with an
electric motor to produces 89% less CO2 emissions than a conventional car.
The next developments should be the integration of a small 2kW fuel cell into a vehicle and the
construction of a hydrogen refuelling station to service the vehicles.
2. The installed system at WBF
On figure 2 can be seen the HARI system existing at WBF. On the left part of the figure is
described the renewable system whereas the right part represents the recent hydrogen system.
Figure 2: The installed system at West Beacon Farm [2]
a. Installed generators
- Wind: Two Carter 25kW wind turbines constitute the main generators on the system and
supply the bulk of the energy. These are two-bladed stall-regulated machines with gearboxes and
squirrel-cage induction generators, designed for direct-on-line grid connection. The turbines
deliver some 3-phase 415V AC.

12
- Solar PV: There is a total of 13kWp PV power spread across the two sites. 6kW feeds
directly into the electrical system at WBF and 4kW at Beacon Energy. The PV system situated at
BE does not currently feed back into the main system at WBF, but its integration is part of the
work going on to upgrade the system's mini-grid. A third PV array at the WBF site does not feed
directly into the mini-grid, but drives a borehole pump that helps to fill an artificial lake.
The fixed array of photovoltaic panels connected to the electrical network comprises 3kWp of
monocrystalline modules and 3kWp of polycrystalline modules. The PV arrays deliver a 120V
Direct Current.
It can be added that the future installation of an integrated PV and Graetzel cell system that
combines solar electricity production and electrolysis in one device is investigated even if the
questions about this device are still numerous.
Figure 3: PV arrays at West Beacon Farm [4]
- Hydro: An 850W low-head (2m) cross-flow hydro turbine generating from a river that flows
through the grounds and a 2.2kW high-head (20m) Turgo hydro turbine running from water
flowing from a storage lake are installed. Therefore the total hydro capacity is 3.05kW.
- Combined Heat and Power unit: As mentioned above, a TOTEM combined heat and power
unit (CHP), based on a Fiat internal combustion engine generates 15kW electrical and 38kW
thermal energy. It currently runs on LPG but it is planned in the long-term to convert it to run on
hydrogen gas.
b. Hydrogen system
In the HARI project, hydrogen production, storage and usage facilities have been added to the
existing renewable energy system at West Beacon Farm to test the feasibility of a stand-alone
renewable energy system. The hydrogen system consists of a 36kW electrolyzer, a 2856Nm³
pressurized gas store and two fuel cells: a 5kW unit and a 2kW unit set up to provide Combined
Heat and Power (CHP) output.
It is also planned to include fuel cell vehicles on the site that will be fuelled by its green
hydrogen. This should extend the scheme beyond a simple electrical supply system by modeling
a complete hydrogen economy.
- Electrolyzer: The electrolyzer is a high-pressure (25bar) alkaline type manufactured by
Vandenborre Hydrogen Systems (VHS). It can produce up to 8 Nm3 of hydrogen gas per hour,
which requires a power of 36kW. The output of the electrolyzer can be controlled, providing a

13
corresponding variation in electricity consumption. However, in order to ensure the purity of the
hydrogen produced, the minimal production is 20% of the rated capacity.
Due to the very rapid variations of power coming from the wind turbines which threatens to
shorten considerably the electrolyzer’s lifetime (this will be detailed in the next section),
advanced batteries are used to provide short-term energy storage, smooth the short-term
fluctuations in electrical input and therefore minimise the cycling of the electrolyzer.
Figure 4: The electrolyzer used at WBF [2]
- Hydrogen storage facility: For the hydrogen storage,
the technology of metal hydride would be very attractive
for the HARI system, but pressurized storage of gaseous
hydrogen was the only commercially viable option at that
time. The hydrogen store consists of 48 mild steel
cylinders, each with a volumetric capacity of 0.475Nm³
and a wall thickness of 38mm for a weight of about one
ton. These cylinders would provide a total of 576Nm³ of
stored hydrogen at 25bar. But since the cylinders can
withstand a pressure of 137bar, a 4kW hydraulic
compressor (able to pump up to 11Nm3/h at a feed
pressure of 25bar with a ratio of 1:8) is used to raise the
hydrogen pressure, providing 2856Nm³ of hydrogen at
full capacity. This gives an equivalent storage capacity of
about 3800kWh when the hydrogen is converted back to
electricity, providing up to 3 weeks of cover without any
renewable energy input.
Avoiding leakage was one of the biggest challenges of running a hydrogen system. Besides
helium, hydrogen has the smallest molecular size of any element, which means that hydrogen
molecules can escape through the tiniest openings, where all other gases couldn’t pass. All leaks
have been eliminated at West Beacon Farm, which represents an outstanding performance.
The compressor used at WBF [1]

14
Eventually, it is planned that a metal hydride store will be tested at the site in collaboration with
the University of Birmingham.
Figure 5: The hydrogen store at WBF [2]
- Fuel cells: The fuel cells are both Proton Exchange Membrane (PEM) type. The first one is
manufactured by Intelligent Energy and is designed for CHP operation. It generates up to 2kW of
electricity at 24V DC, and 2kW of heat, and is connected to the heating system. This fuel cell is
also able to supply up to 4kW of electricity for short period (around 15 minutes).
The second fuel cell is a Plug Power unit supplied by SiGen. It can generate 5kW electrical
power at 48V DC, but doesn’t operate as a CHP device. There is also provision for a further fuel
cell unit to be added to the system.
Figure 6: Intelligent Energy 2kW FC [1] Figure 7: Plug Power Gencore® 5kW FC [1]

15
- Battery: The battery used at West Beacon Farm is a sodium nickel chloride (NaNiCl) type,
called the Zebra battery and developed by Beta Batteries. It replaced an old 120 kWh lead-acid
battery accumulator. Zebra batteries, which work at high temperatures (around 300°C), have an
energy density around 100Wh/kg (three times that of lead-acid batteries) and the whole capacity
range can be utilised. They can be directly connected to the DC bus with a standard industrial
drive. The battery voltage is 620V nominal and its nominal capacity is 20Ah.
Figure 8: The 2kW nickel sodium chloride Zebra battery [1]
c. Summary of HARY components and WBF layout
Table 1: Summary of HARI sub-systems [1]

16
Table 1 summarizes the main characteristics of the different components of the HARI system.
The total cost of the stand-alone energy system installed at West Beacon Farm can be evaluated
around £595,000. On the next figure is presented the layout of the HARI system at WBF:
Figure 9: Map of the HARI project site [1]

17
3. Electrolysis from renewables
Electrolyzers are considered as a mature technology when operated from a continuous steady-
state power supply. However, the work carried out at CREST has already shown that powering
them from intermittent energy sources such as renewables will require significant modifications
in order to improve their efficiency, durability and cost in this particular use. The intermittency of
the electrolyzer’s operation threatens to shorten considerably its lifetime (the number of ON/OFF
switching cycles for the electrolyzer is limited to 2500 before its performances start to degrade
substantially). We can note that whereas the electrolyzer was rated at 36kW when purchased, due
to the intermittency and variability of the renewable energy supply, it has already degraded and
now consumes more like 39kW (thankfully, this appears to have stabilised).
When the electrolyzer is switched off, hydrogen in the cathode causes the potential of the cell
stack to reverse, causing corrosion of the cell membranes and reducing lifetime of the
electrolyzer. This is the reason why a limit on the number of on/off cycles is defined by the
manufacturers. A minimum current is also imposed to maintain the hydrogen gas purity. Another
problem is the limited operational range of the electrolyzer (between 20 and 100% of rated
power). Indeed, this means that there would be peaks of surplus energy from renewables too big
to be absorbed by the electrolyzer and troughs where the surplus production is beneath the range.
It appears clearly that intermittency leads to a number of inefficiencies, which may be eliminated
or at least reduced significantly by modifying the design of the system and developing an
effective control strategy. Moreover, it appears that low pressure systems are preferable for a use
with renewables, since dynamic supply damages components and wastes energy in existing
pressurized electrolyzers.
As mentioned before, these operational constraints of the electrolyzer require some form of short-
term energy storage to smooth the short-term fluctuations in electrical input. As described in the
previous section, this has been achieved using a 2kW, high temperature Zebra battery. This
hybrid approach benefits of advantages of the two technologies with the batteries that provide an
efficient short-term and low-volume storage and the hydrogen providing long-term and bulk
storage. Optimisation of the technology for this type of application is still a major part of the
ongoing work initiated by this project. It is interesting to notice that 190 batteries such as the one
used would be necessary to replace the hydrogen storage, for a cost of £3.9M and a volume of
26.3m3.
4. WBF infrastructure
The technologies studied in the HARI project being intended to be applied in a domestic
environment, safety and aesthetic considerations are very important. A new building being
required to install the new components of the hydrogen system, it was particularly important to
avoid the construction of a building resembling to an industrial plant: this hydrogen building
needed to follow the style of the other existing buildings on the site.

18
Figure 10: View of the hydrogen building at WBF [1]
For safety considerations, the building has been divided into two zones: a safe zone and a
hazardous zone. The hazardous zone contains the electrolyzer, the fuel cells and the compressor
in three different rooms. An advanced ventilation system has also been installed to ensure that
any potential hydrogen leaks are managed safely.

19
Figure 11: Layout of the WBF hydrogen building [1]
(the pink shaded area is the hazardous zone and the white area is the safe zone)
5. Components integration and electrical network at WBF
The following figure shows an overview of the stand-alone power supply system being installed
at West Beacon Farm. The electrical network, which has evolved in a piecemeal fashion because
of the addition of various sustainable energy components over the years, makes the overall
system far from ideal and needs to be rationalised. The main part of this upgrade involves the
establishment of a 620Vnominal DC bus that will act as the backbone of the entire system where the
various generators, loads and storage system are interconnected. This will allow an easier
balancing of instantaneous electrical supply and demand between all the various energy
technologies involved and allow the deployment of relatively low cost standard industrial drives
to connect the various elements of the network. Indeed, in this new system, the rotating
generators, such as the wind turbines, are connected through standard industrial drives operating
in regenerative mode, whereas the DC devices (electrolyzer, fuel cell and PV arrays) use bespoke
DC/DC converters.

20
The system supplies single and three-phase power to a residential house and offices. The average
total load is about 4kW, divided into critical and deferrable loads. The main load is the heat
pump, which heats the house but the system is designed to make this a deferrable load.
Figure 12: The West Beacon Farm stand-alone power supply [6]
a. Central DC bus
The nominal voltage of the DC busbar is 620V. Indeed, standard 400V AC rectified to DC is
560V, which represents the minimum voltage at which the industrial drives will function
correctly. In order to allow some margin, the voltage 620V has been chosen. The electrical
system was designed around a central DC bus instead of the usual AC bus for the following
reasons:
- AC power supplied to the loads is separated from that of the generators, which allows the
power quality provided to the loads (voltage, frequency and purity of waveform) to be maintained
independently of the fluctuations of the available wind power, as long as the voltage of the DC
bus is kept within broad limits.
- The wind turbines can be operated at variable speed, resulting in a small increase in energy
capture despite the losses in the converters. Moreover, by absorbing the rapid variations in wind
power thanks to the inertia of the wind turbines, the power delivered to the DC bus is smoothed
and mechanical stresses on the turbine structure are reduced.
- The additional cost of the many power-electronic converters of the electrical network is rather
lower than firstly expected. Indeed, many electrical loads are already equipped with power-
electronic converters. They can therefore be run from DC with just little modifications. Many
modern wind turbines also use power-electronic converters and could easily be adapted to
generate DC. Similarly, electrolyzers, fuel cells or PV panels are commonly connected through
this type of converters.

21
- The AC/DC inverters shown on figure 12 are standard industrial drives available at low cost.
- No synchronous machine or diesel engine will be needed in the system.
- The connection of multiple drives onto a common DC bus is proven technique in industrial
applications.
But using a DC bus also presents some drawbacks, particularly for cost considerations because of
the relatively low use of DC systems compared to AC systems.
b. Power-electronic converters
AC/DC converters The AC/DC converters of the system are standard industrial drives widely used in industry. They
are reliable, efficient and very cost effective. As required for the generators, the power flow in the
transistor-bridge stage can be reversed.
The domestic and office loads (shown at the bottom left on figure 12) are also fed through
standard industrial drives configured to provide a constant 50Hz at 400/230V. The efficiency of
AC/DC converters usually lies around 90%.
DC/DC converters
The DC/DC converters that connect the electrolyzer, fuel cells and PV arrays to the DC bus are
necessary to operate each of these devices at the optimum points on their current-voltage
characteristic curves. All DC/DC converters installed at West Beacon Farm are actually
DC/AC/DC converters because of their higher efficiency.
Figure 13: The bespoke DC/DC converters [6]
The step-down DC/DC converter connecting the electrolyzer uses a standard industrial drive
which converts the 620V DC to a controlled three-phase AC voltage. A transformer then
increases the current, and lastly a diode bridge rectifier provides the DC to the electrolyzer stack.
The converters required for the fuel cells and PV arrays are more complex and had to be designed
especially for this system. A two-transistor forward converter topology was selected as a basic
building block as shown on the following diagram.

22
Figure 14: Two-transistor forward converter diagram [6]
Of course, inefficiencies are involved in converting the voltage levels of the different components
to that of the DC busbar. This can be divided in a standing load and a proportional efficiency.
c. Power conditioning model in TRNSYS
The power conditioning components used in TRNSYS can invert DC power to AC power,
transform AC to DC power or be used as DC/DC converters. Here is briefly described the
mathematical model of the power conditioner.
The power loss in a power conditioner is mainly dependent on the current running through it and
can be described as following:
2
loss 0 2
s iin out out out
out out
U RP P P P P P
U U= − = + +
where P0 is the power loss when there is a voltage through the conditioner (W), US is the set point
voltage (V), Ri is the internal resistance (Ω), Pout is the power output (W) and Uout is the voltage
output (V).
From the previous equation can be derived a relationship between the input power Pin and the
output power Pout, introducing the nominal (maximum) power Pnom of the conditioner:
2
0innom
nom nom nom nom
1 s out outi
out
P U P PPR P
P P U P P
= + + +
In TRNSYS, either the input power or the output power can be entered as an input depending on
the use of the power conditioner. For example, in the HARI system, the input is known for the
power conditioner placed before the electrolyzer whereas the output is known for the power
conditioner of the fuel cell.
The efficiency of the power conditioner can simply be calculated using the following expression:
out
in
P
Pη =
23
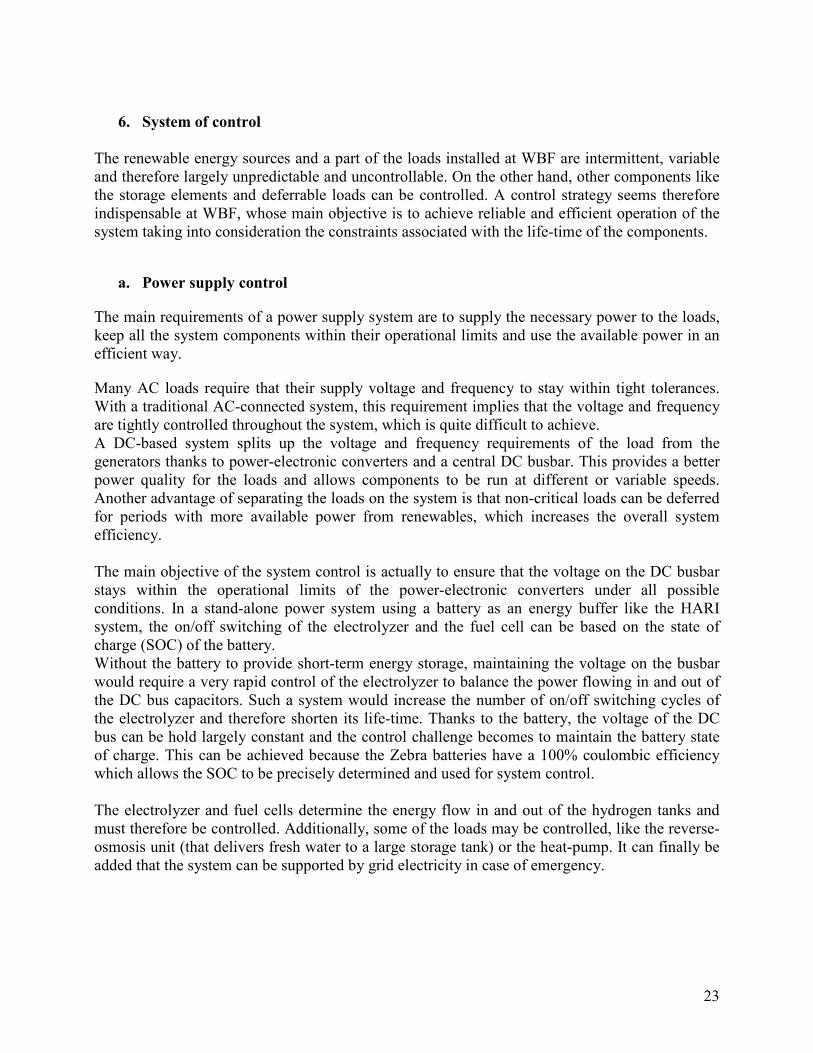
6. System of control
The renewable energy sources and a part of the loads installed at WBF are intermittent, variable
and therefore largely unpredictable and uncontrollable. On the other hand, other components like
the storage elements and deferrable loads can be controlled. A control strategy seems therefore
indispensable at WBF, whose main objective is to achieve reliable and efficient operation of the
system taking into consideration the constraints associated with the life-time of the components.
a. Power supply control
The main requirements of a power supply system are to supply the necessary power to the loads,
keep all the system components within their operational limits and use the available power in an
efficient way.
Many AC loads require that their supply voltage and frequency to stay within tight tolerances.
With a traditional AC-connected system, this requirement implies that the voltage and frequency
are tightly controlled throughout the system, which is quite difficult to achieve.
A DC-based system splits up the voltage and frequency requirements of the load from the
generators thanks to power-electronic converters and a central DC busbar. This provides a better
power quality for the loads and allows components to be run at different or variable speeds.
Another advantage of separating the loads on the system is that non-critical loads can be deferred
for periods with more available power from renewables, which increases the overall system
efficiency.
The main objective of the system control is actually to ensure that the voltage on the DC busbar
stays within the operational limits of the power-electronic converters under all possible
conditions. In a stand-alone power system using a battery as an energy buffer like the HARI
system, the on/off switching of the electrolyzer and the fuel cell can be based on the state of
charge (SOC) of the battery.
Without the battery to provide short-term energy storage, maintaining the voltage on the busbar
would require a very rapid control of the electrolyzer to balance the power flowing in and out of
the DC bus capacitors. Such a system would increase the number of on/off switching cycles of
the electrolyzer and therefore shorten its life-time. Thanks to the battery, the voltage of the DC
bus can be hold largely constant and the control challenge becomes to maintain the battery state
of charge. This can be achieved because the Zebra batteries have a 100% coulombic efficiency
which allows the SOC to be precisely determined and used for system control.
The electrolyzer and fuel cells determine the energy flow in and out of the hydrogen tanks and
must therefore be controlled. Additionally, some of the loads may be controlled, like the reverse-
osmosis unit (that delivers fresh water to a large storage tank) or the heat-pump. It can finally be
added that the system can be supported by grid electricity in case of emergency.
24
b. Control parameters and description of the control strategy
Whereas the Zebra battery will provide short-term smoothing to protect the electrolyzer, some
instantaneous control is now required to maintain the battery’s state of charge. Ideally, the battery
SOC should be kept high in order to provide a buffer to the system. However, some margin and
hysteresis consideration are necessary to take into account the response time of the electrolyzer.
As the SOC decreases, the fuel cells will operate. If the fuel cells cannot cope with the reduction
of the state of charge, some other generator must operate (a bio-diesel generator for example)
even if it would be better to minimise the operation of such a back-up.
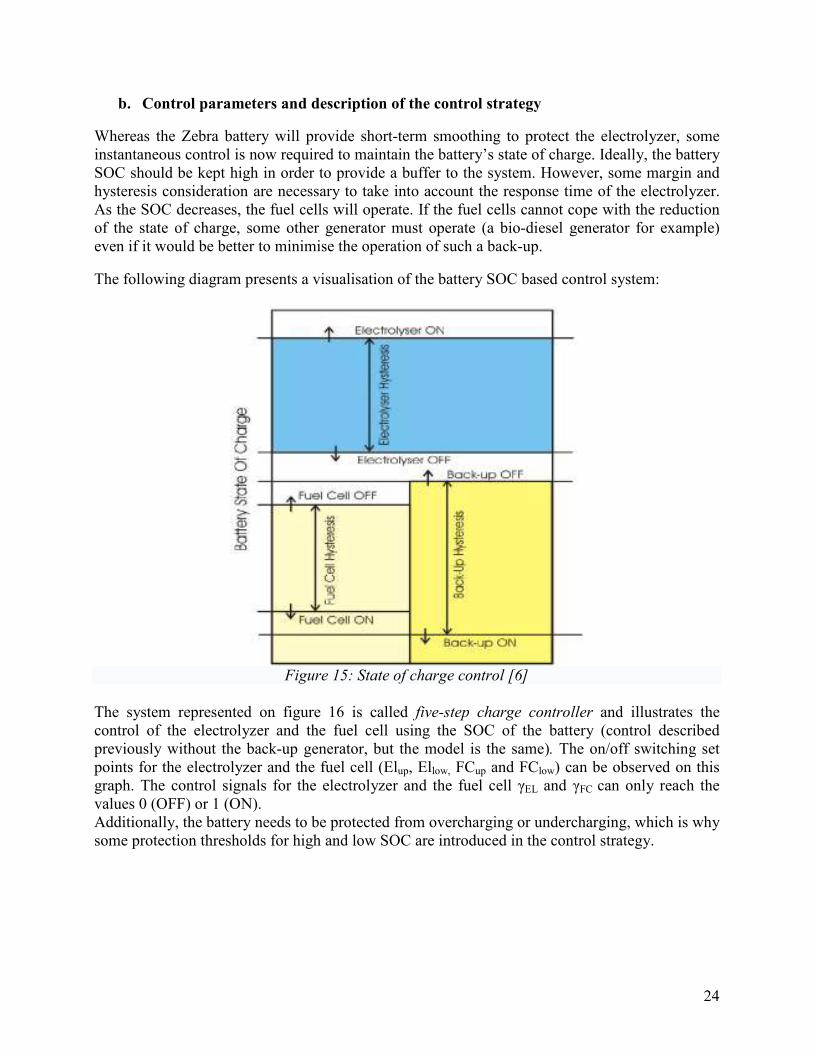
The following diagram presents a visualisation of the battery SOC based control system:
Figure 15: State of charge control [6]
The system represented on figure 16 is called five-step charge controller and illustrates the
control of the electrolyzer and the fuel cell using the SOC of the battery (control described
previously without the back-up generator, but the model is the same). The on/off switching set
points for the electrolyzer and the fuel cell (Elup, Ellow, FCup and FClow) can be observed on this
graph. The control signals for the electrolyzer and the fuel cell γEL and γFC can only reach the
values 0 (OFF) or 1 (ON).
Additionally, the battery needs to be protected from overcharging or undercharging, which is why
some protection thresholds for high and low SOC are introduced in the control strategy.

25
Figure 16: Control strategy for the electrolyzer and the FC based on the battery SOC [14]
The detailed control strategy of the HARI system is as following:
The control strategy relies entirely upon the SOC, measured as a percentage, of the battery. The
objective is to keep it floating at around 50%. When it falls to 30%, the 2kW fuel cell is switched
on to try to bring it back up to 50%, at which point it switches off. If it is not sufficient and the
SOC continues to fall, the 5kW fuel cell switches on (and the 2kW FC switches off) at 20%.
Again, this will switch off when the SOC% reaches 50%. If the 5kW fuel cell is unable to bring
the SOC back to 50% and it continues to fall down to a level of 10%, then the 2kW fuel cell
comes back on, giving a combined 7kW of power trying to recharge the battery. Both fuel cells
continue to run until 50% SOC is achieved, at which point they both switch off. In all these
cases, when switched on, the fuel cells will run at full power. The electrolyzer is switched on
when the SOC reaches 90%, operating at a level that is proportional to the SOC, and switches off
when it has brought the SOC down to 50%. Of course if the hydrogen store is full, the
electrolyzer cannot run. In the same way if the hydrogen store is empty (i.e. if only the cushion
gas is left), the fuel cells cannot run. In other cases, the hydrogen storage level is ignored.
This control strategy is represented on the following flowchart:

26
The H2 store is full ?
SOC reaches 90% ?
The electrolyser switches on and operates at a level proportional to
the SOC
SOC falls to 30% ?
The H2 store is empty ? The 2kW FC switches ON and runs at full power to try to bring the SOC
back up to 50%
SOC reaches 50% ? The 2kW FC switches OFF
SOC falls to 20% ?
The H2 store is empty ? The 5kW FC switches ON and runs at full power (and the 2kW FC
switches OFF)
Start
SOC reaches 50% ? The 5kW FC switches OFF
The H2 store is empty ?
SOC reaches 50% ?
The 2kW FC comes back ON and runs at full power, giving a combined
7kW of power
Both FC switch OFF
SOC falls to 10% ?
Yes
No
Yes
No
No
No
Yes
Yes
No
Yes
No
Yes
No
Yes

27
c. Optimisation of the control strategy
The choice of the optimal control strategy is a crucial element in the design of a stand-alone
power system [15]. Indeed, small changes made in the control strategy can significantly affect the
performance of the system. But it is a complicated task because of the significant number of
variables to consider.
HOMER (that will be presented in section D) is an optimisation model that uses relatively simple
strategies to obtain an optimal design of a renewable system by selecting the most appropriate
control strategy. The program HYDROGEMS, compatible with TRNSYS, can simulate
accurately hydrogen-based systems but is not an optimisation program. Finally, Hybrid2 is
another program applied to hydrogen-based systems that can generate many control strategies.
But it is a simulation program, not an optimisation tool. These different modelling tools use
hourly intervals for their calculations, assuming that all the involved variables are constant
throughout these intervals.
Control strategy of a stand-alone power system
The total net present cost of the system, which includes the investment costs and all future costs
during the lifetime of the system, is the parameter to minimize in the optimisation process. It is
therefore necessary to simulate the system throughout its lifetime.
As a basic control rule in a stand-alone power system, the energy produced by renewables must
be preferentially used to feed the loads. For every hour, if the renewable sources produce more
energy than is demanded, the surplus power (Pcharge) can be used to charge the batteries or to
produce H2 in the electrolyzer. This is the charge process. The decision to use the spare energy to
charge the batteries or to produce H2 depends on the value of Pcharge. If, on the contrary, the
renewable sources produce less energy than demanded, the deficit power (Pdischarge) should be
produced either by the battery, the CHP unit or the fuel cells. This process is called discharge. To
produce the cheapest energy, the costs of providing the required energy using each technology
must be evaluated.
Charge process
If an excess of energy is produced for one hour, this energy is used to charge the batteries and/or
to produce hydrogen in the electrolyzer before storing it in the hydrogen tank. Depending on
which of the two techniques has the lowest cost of cycling energy (i.e. the operating and
maintenance cost for one hour, including the depreciation and replacement costs), either the
batteries are charged as much as possible with the spare energy or the electrolyzer works at its
highest possible power.
The cost of cycling the energy corresponding to a certain power P (kW) through the batteries
during one hour can be calculated as (in £):
28
_
_ _ _
.1000 batcycling bat
N bat p DC cycles eq global bat
P CC
C N U N η=
where Cbat (£) is the battery bank acquisition cost, CN (Ah) is the nominal capacity of the battery,
Nbat_p is the number of batteries in parallel, UDC (V) is the DC bus voltage and Ncycles_eq is the
average of a battery lifetime in equivalent full cycles. Finally, ηglobal_bat is the overall efficiency of
the batteries. The O&M costs of the batteries are not considered in Ccycling_bat, since it is assumed
that they are fixed during the year and therefore do not depend on the performance of the
batteries.
The cost of cycling the energy corresponding to a certain power P (kW) during one hour, where
the energy is stored as hydrogen in the tank, later becoming fuel cell energy, is (in £):
& _ & _
_
( / ) ( / )Ely Ely O M Ely FC FC O M FC
cycling Ely FC
Ely FC
C Life C C Life CC
η η−
+ + +=
We can observe that Ccycling_Ely_FC, unlike Ccycling_bat, does not depend on the power since the
electrolyzer and the fuel cell lifetimes, LifeEly and LifeFC (h) have been considered independent of
the power, as well as CO&M_Ely and CO&M_FC, the O&M costs of the electrolyzer and the fuel cell
(£/h). CEly and CFC (£) are the electrolyzer and fuel cell acquisition costs. ηFC (kWhoutput/kgH2)
represents the amount of electrical energy output for each kg of H2 consumed in the fuel cell.
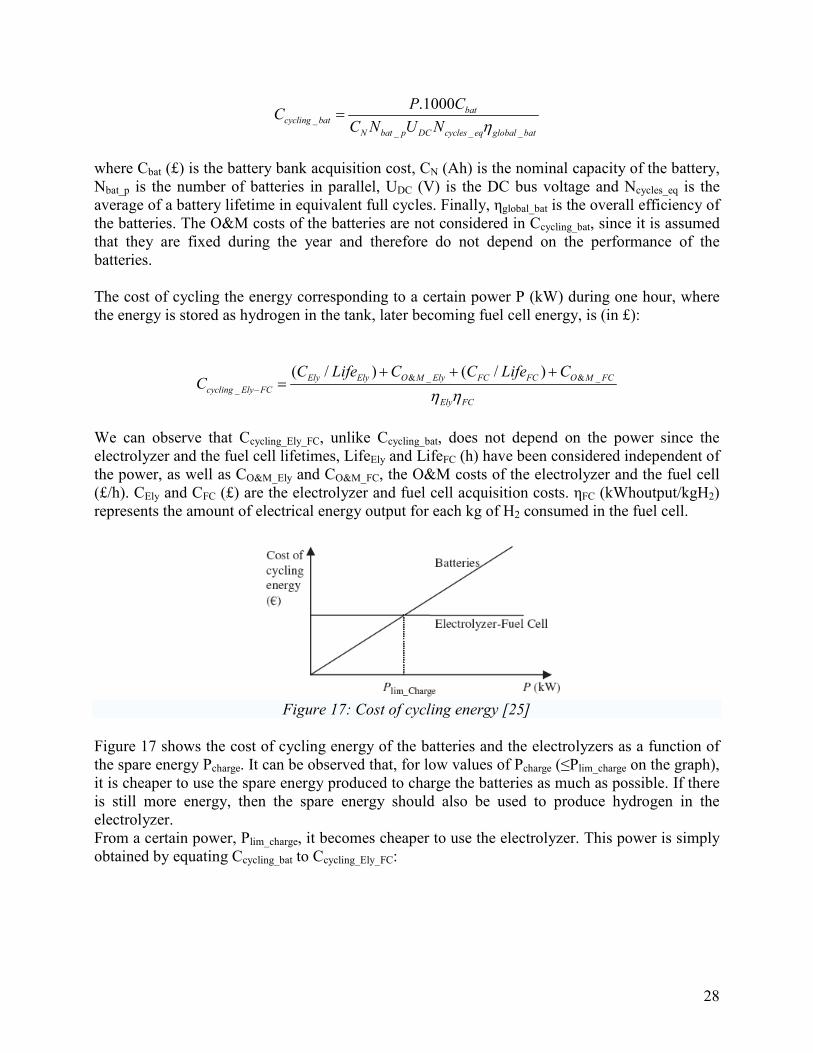
Figure 17: Cost of cycling energy [25]
Figure 17 shows the cost of cycling energy of the batteries and the electrolyzers as a function of
the spare energy Pcharge. It can be observed that, for low values of Pcharge (≤Plim_charge on the graph),
it is cheaper to use the spare energy produced to charge the batteries as much as possible. If there
is still more energy, then the spare energy should also be used to produce hydrogen in the
electrolyzer.
From a certain power, Plim_charge, it becomes cheaper to use the electrolyzer. This power is simply
obtained by equating Ccycling_bat to Ccycling_Ely_FC:

29
& _ & _
lim_charge
_ _ _
1000
Ely FCO M Ely O M FC
Ely FC
bat Ely FC
N bat p DC cycles eq global bat
C CC C
Life LifeP
C
C N U N
η η
η
+ + +
=
The strategy to optimize the charge process is as follows:
- If Pcharge≤ Plim_charge, then the batteries are charged as much as possible, and, if there is still
spare energy, it is used to produce H2 in the electrolyzer.
- If Pcharge> Plim_charge, then the hydrogen is produced in the electrolyzer at full power, and, if
there is still spare energy, it is used to charge the batteries.
- If the electrolyzer has a minimum power, Pmin_Ely, then Plim_charge = max (Plim_charge, Pmin_Ely).
a. Discharge process
In the case of lack of energy for one hour, the energy is obtained either from the batteries, the
CHP unit, or from the fuel cells, depending on the associated costs of each technique.
Figure 18: Costs of supplying energy in the discharge process [15]
Figure 18 shows the cost of supplying energy as a function of the deficit power. It appears that,
for powers between 0 and a certain value P1, supplying the required power through the batteries
is the optimal solution. From the value P1, it may become more economical to supply the power
with another component. This value of P1 is the minimum of the two values resulting from the
intersection of the cost function of supplying energy with batteries and the cost function of
supplying energy with the CHP and the fuel cells (see graph).
We call P1gen the power at which the cost of supplying energy with batteries equals the cost of
supplying energy with the CHP unit, and P1FC is the power at which the cost of supplying energy
with batteries equals the cost of supplying energy with the fuel cells.
If the value of P1gen (resp. P1FC) is negative, this means that it is always cheaper to supply energy
with the batteries than with the generator (resp. the fuel cell). It may also be possible that both
P1gen and P1FC have negative values, which means that the use of the batteries is always the
optimal solution.
A value P2, at which the energy produced by the component supplying power from P1 is not the
cheapest anymore, may also exist.

30
Consequently, the strategy that optimizes the discharge process is:
- If Pdischarge<P1, then the energy is supplied by the batteries.
- If P1≤Pdischarge≤P2, then the energy is supplied by the component with the lowest value of
P1 (either the CHP unit or the fuel cell).
- If Pdischarge>P2 then the energy is provided by the component with the highest value of P1.
- Once the component to supply the required energy is selected, it must be determined
whether it is able to provide all the energy required. If it is not the case, the remaining power
is provided by the component that can produce it at the lowest possible cost.
- If the second component necessary to supply the energy is not available, the third one is
used to supply the remaining energy.
7. The HARI project and the hydrogen economy
As defined before, “Hydrogen Economy” represents an energy systems relying exclusively on the
primary resource of renewables and hydrogen for energy storage.
The HARI project has highlighted a very important point: the efficiency of passing through the
cycle from electricity to hydrogen and back to electricity is very poor, around 16%. The
efficiency of the overall electrical and hydrogen energy system at West Beacon farm is 44%. This
difference can be explained by the fact that, wherever possible, the power generated by the
renewables is used directly as electricity in the loads, or stored briefly as electricity in the battery.
The option of converting the electricity produced to hydrogen for storage before reconverting it
back to electricity when needed must be only considered as a last resort. Wherever possible,
electricity must remain as electricity in the system until it reaches the end-point appliance.
Therefore, hydrogen should not be used for storage of electricity, except in particular situation
where there is no alternative (e.g. in remote, off grid applications). Instead hydrogen should
provide fuel and constitute, via electrolysis, a balancing mechanism between the supply and
demand on the utility grid.
In the ultimate hydrogen economy scheme, the only primary resource available is renewable
energy, even for transportation. In this scenario, the installed capacity of renewable energy
resource is largely enough to feed the electricity network alone. But this necessary installed
capacity increases substantially when it is question to feed the whole energy system (comprising
transportation and others). At West Beacon Farm, though not eliminated all periods of supply
shortfall are substantially reduced in frequency and duration. The need to store electricity is
therefore limited and the energy that was converted to hydrogen can most of the time be used as
fuel without being reconverted back to electricity (see next figure). Electrolysis as fuel
production becomes then a load management tool for a more efficient use of renewable energy.

31
Figure 19: The Hydrogen Economy model [2]
Even if such a scenario is still a long way off and this technology requires many years of
development, it is already evident that a hydrogen distribution grid is not intended to replace the
current electrical distribution grid. Indeed the electricity grid, whose majority of the electrical
infrastructure is already in place (even if some reinforcement will be required), is an efficient
method of transporting energy. Moreover, no extensive hydrogen pipeline network exists and the
existing natural gas network would need considerable modifications to be used with hydrogen.
While electricity is an excellent means for the spatial displacement of energy, hydrogen is a good
means of achieving its temporal displacement. The advantages and complementarities of these
two energy vectors should therefore be exploited appropriately in the future energy system.
Actually, hydrogen pipelines seem only adapted where a very large-scale storage of hydrogen is
needed.
8. Conclusion: knowledge gained so far and further plans
Energy storage based on converting electricity to hydrogen gas and back to electricity is a
possible answer to the problem of intermittency within stand-alone renewable energy systems.
The hydrogen energy storage system installed at West Beacon Farm as part of the HARI project
has been designed to provide a long-term energy storage in order to cope with the difficultly to
match energy supply and demand on the site using exclusively renewables as primary energy
resource. At times of excess renewable energy, the electrolyzer is used as a controllable load by
which the excess energy is converted into hydrogen. When there is insufficient renewable energy
to meet the demand, fuel cells are used to produce electricity. As there are no standing losses in
the hydrogen storage tank, it can be used as a long-term inter-seasonal store of energy. This
hydrogen system was successfully integrated into an existing renewable energy system and
software models of the overall system have been developed and verified against real-world
operation data.

32
However, some problems still need to be investigated and future improvements on the system are
expected in the long-term. For example, the lifetime of the electrolyzer could be significantly
limited because of the repetition of on/off switching cycles due to the intermittency of the
renewables production and the operational limits of the electrolyzer. Some batteries are therefore
still required to provide short-term storage but it is planned to develop an electrolyzer adapted to
the dynamic supply from intermittent power sources in order to improve its efficiency, reliability
and cost.
In order to create a real stand-alone renewable energy system, it is also planned to convert the
existing wind turbines so that they can operate independently of the utility grid. Under normal
circumstances, wind turbines need a grid connection to activate and control their induction
generators but turbines at West Beacon farm need to run autonomously, which can be achieved
using power electronics. After the modifications on the electrical mini-grid, the whole system can
operate independently of the utility grid. This tested concept could then be widely applied to
stand-alone energy systems.
The HARI project has also provided some useful information on the safety aspect. Indeed, safety
has a crucial importance in this project since a major incident would have disastrous
consequences for the reputation of this emerging technology at this critical time. Moreover, this
technology being planned to be used in a domestic environment, safety issues become even more
relevant. The use of hazardous materials like hydrogen or potassium hydroxide (use in the
electrolyzer and very corrosive to the skin and the eyes) has been closely investigated. Full
chemical resistant overalls, hoods, boots and gloves are obviously required, and it appeared that
specific alkali-resistant breathing masks would be necessary because some symptoms of throat
irritation, intense headaches and tiredness have occurred amongst some members of the project
team.
But the major issue is the efficiency of the overall system. On this point, the HARI project clearly
highlights the limitations of the concept of “hydrogen economy” and of using hydrogen for
energy storage. The cycle going from electricity to hydrogen and back to electricity again is
largely wasteful (because of significant losses in the electrolyzer and fuel cells) with an
efficiency around 16% and must therefore be used only as a last resort. Using the electricity
directly (without passing through the hydrogen energy system) wherever possible, the efficiency
of the electrical and hydrogen system reaches 44%. It is therefore important that only the excess
energy goes through the store. Wherever possible, energy produced from renewables must remain
as electricity and be used directly but sometimes converting this energy to hydrogen may be
inevitable. Once converted to hydrogen, energy should only be used as fuel for transportation and
remote or portable power generation.
Improving the system design, the energy management and the control strategy for the installation
may provide the solution. Indeed, the system is currently designed for a maximum robustness and
reliability but it can be largely improved on the efficiency point of view. The new DC bus based
electrical network which includes detailed measurements of energy flows around the system
should improve this efficiency. Thermal management will also be necessary in the optimisation
of the system, as by-product heat can be captured and used to reduce the heat losses or for
cooling requirements.

33
The electricity grid will obviously remain the main method of transmission and distribution, since
a hydrogen pipeline network seems quite unrealistic. It is then possible to exploit the strengths
and complementarities of electricity, which is an excellent means for the spatial displacement of
energy, and hydrogen, which is a good means for its temporal displacement.
Of course, even if these results are not reassuring, the HARI project doesn’t suggest that the
hydrogen economy is not a practical solution for the future energy system, but it warns that
searching for a practical large-scale, long-term energy store will be very challenging and
expensive. In a world where the primary energy resources are only renewables (no fossil fuel
available), the installed capacity of renewables will have to be much greater than normally
considered for the generation of grid electricity, having also to fulfil the requirements of portable
power and all forms of transport.
Rupert Gammon, Bryte Energy director, says: “The HARI project has provided us with an
unrivalled opportunity to gain knowledge through the direct experience of designing, installing
and operating a complete, zero-carbon energy system on a day-to-day, real-world basis. It has
given us unique insights into matters such as the powering of electrolyzers with intermittent and
dynamic supplies and in discovering what strategies will and will not work in the
implementation of a future hydrogen economy”. In a long-term future, whole national and
international energy networks may operate on this hybrid (electricity and hydrogen) principle
even if integrating so many elements presents many technical challenges. That’s why the HARI
project provides vital experience to initiate the creation of such sustainable energy systems for
the future. The ultimate goal of the project is to build software models that could be very helpful
in the design of similar hydrogen and renewables systems.

34
C. Simulation with TRNSYS
1. Definitions
a. What is TRNSYS
TRNSYS is a TRaNsient SYstems Simulation program with a modular structure. TRNSYS
allows the user to specify the components that constitute a specific system and the manner in
which they are connected. The program can recognize the system organisation and simulate its
operation. The TRNSYS library includes many of the components commonly used in thermal and
electrical energy systems, as well as component routines to manage the integration of weather
data or other time-dependent forcing functions and output of simulation results. The modular
nature of TRNSYS gives the program a large flexibility, and makes it possible to add
mathematical models not included in the standard TRNSYS library.
TRNSYS (original version in 1975) has become a reference program for researchers and
engineers around the world thanks to its great capacities for the detailed analysis of any system
whose behaviour is dependent on the passage of time. TRNSYS is particularly suited for the
analysis of solar systems (solar thermal and photovoltaic systems), low energy buildings and
HVAC systems, renewable energy systems, cogeneration or fuel cells. (Source: TRNSYS website http://sel.me.wisc.edu/trnsys)
b. What is HYDROGEMS
HYDROGEMS is a series of HYDROGen Energy ModelS designed for the simulation of
integrated renewable and hydrogen energy systems. The HYDROGEMS library includes
component subroutines for PV arrays, wind energy conversion systems (WECS), diesel engine
generator systems (DEGS), advanced alkaline water electrolysis, high-pressure hydrogen gas
storage, metal hydride (MH) storage, proton exchange membrane fuel cells (PEMFC), alkaline
fuel cells (AFC), compressors, power conditioning equipment, and logical control functions.
Seven years of modeling and simulation work on stand-alone power systems undertaken at the
Institute for Energy Technology have been necessary to develop HYDROGEMS. The models
have been tested and verified against numerous renewable and hydrogen installations around the
world.
The compatibility between HYDROGEMS and TRNSYS makes it possible to integrate the
HYDROGEMS component models with the standard library of thermal and electrical
components of TRNSYS. The major HYDROGEMS components (PV, WECS, electrolyzer, and
fuel cells) are also available as external functions for EES, an engineering equation solver, which
has built-in functions for thermodynamic and transport properties of many substances, including
steam, air, air-water vapour mixtures, refrigerants, cryogenic fluids and hydrocarbons. This
characteristic makes HYDROGEMS particularly useful for system design or redesign and the
optimisation of control strategies for integrated renewable and hydrogen energy systems. (Source: HYDROGEMS user guide, Institute for Energy Technology)

35
Figure 20: HYDROGEMS components [10]
A description of the mathematical models defining the different elements of the HYDROGEMS
library can be found in the HYDROGEMS User Guide [10]. In this guide are described the
parameters and inputs necessary for each model, as well as the outputs available after the
simulation.
2. HARI model: control strategy based on the SOC of the hydrogen store
a. The Master Controller
As mentioned before, the HARI system control is based on the state of charge of the battery.
However, such a control being very complex to simulate with TRNSYS since such a controller
doesn’t exist in TRNSYS library yet, an approximation of the system was developed basing the
control strategy on the state of charge of the hydrogen store (see figure 21). This can be achieved
using the Master Level Controller (type 105 in the library of TRNSYS) which is designed to
control a stand-alone power system including wind turbines (or another source of renewable
power), an electrolyzer, a fuel cell, a hydrogen storage device and diesel engine generator sets (or
another auxiliary power source that consists of multiple units).

36
Figure 21: Control strategy based on the SOC of the hydrogen store
In this project, the parameters ELup, ELlow, FCup, and FClow have been respectively fixed at 100, 90, 10
and 0%.
In this section is described the mathematical model of the Master Controller:
The decisions of the controller are based on the mini-grid busbar power balance, assuming that
the minimum number of DEGS is operating and that the fuel cell and electrolyzer are idling:
PWECS (W) is the power generated by the wind turbine (or another renewable energy device)
PDEGS,max (W) is the rated power generated by one DEGS
PDEGS,set (W) is the power setpoint for each DEGS
NDEGS is the number of DEGS operating at fixed power
NDEGS,min is the minimum number of DEGS operating at any time
NDEGS,max is the maximum number of DEGS operating at any time
PFC,min (W) is the minimum (idling) Power of the Fuel Cell
PFC,max (W) is the rated power of the Fuel Cell
PFC,set (W) is the power setpoint for the Fuel Cell
PEly,min (W) is the minimum (idling) power of the Electrolyzer
PEly,max (W) is the rated power of the Electrolyzer
PEly,set (W) is the power setpoint for the Electrolyzer
PLoad (W) is the power to the load
Pdump (W) is the dumped power
Pbusbar (W) is the power balance on the mini-grid bus bar
SOC is the State Of Charge of the energy storage
ELlow is the SOC for which the Electrolyzer is switched ON
ELup is the SOC for which the Electrolyzer is switched OFF
FClow is the SOC for which the Fuel Cell is switched OFF
FCup is the SOC for which the Fuel Cell is switched ON
37
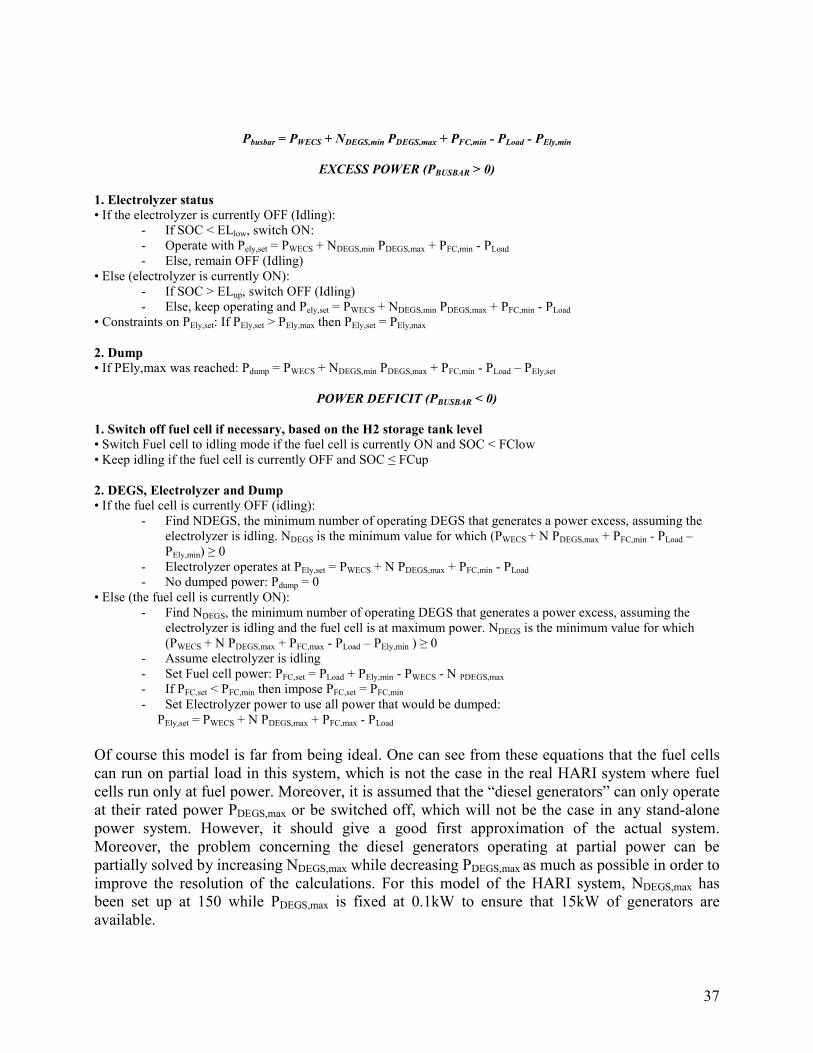
Pbusbar = PWECS + NDEGS,min PDEGS,max + PFC,min - PLoad - PEly,min
EXCESS POWER (PBUSBAR > 0)
1. Electrolyzer status
• If the electrolyzer is currently OFF (Idling):
- If SOC < ELlow, switch ON:
- Operate with Pely,set = PWECS + NDEGS,min PDEGS,max + PFC,min - PLoad
- Else, remain OFF (Idling)
• Else (electrolyzer is currently ON):
- If SOC > ELup, switch OFF (Idling)
- Else, keep operating and Pely,set = PWECS + NDEGS,min PDEGS,max + PFC,min - PLoad
• Constraints on PEly,set: If PEly,set > PEly,max then PEly,set = PEly,max
2. Dump
• If PEly,max was reached: Pdump = PWECS + NDEGS,min PDEGS,max + PFC,min - PLoad – PEly,set
POWER DEFICIT (PBUSBAR < 0)
1. Switch off fuel cell if necessary, based on the H2 storage tank level
• Switch Fuel cell to idling mode if the fuel cell is currently ON and SOC < FClow
• Keep idling if the fuel cell is currently OFF and SOC ≤ FCup
2. DEGS, Electrolyzer and Dump
• If the fuel cell is currently OFF (idling):
- Find NDEGS, the minimum number of operating DEGS that generates a power excess, assuming the
electrolyzer is idling. NDEGS is the minimum value for which (PWECS + N PDEGS,max + PFC,min - PLoad –
PEly,min) ≥ 0
- Electrolyzer operates at PEly,set = PWECS + N PDEGS,max + PFC,min - PLoad
- No dumped power: Pdump = 0
• Else (the fuel cell is currently ON):
- Find NDEGS, the minimum number of operating DEGS that generates a power excess, assuming the
electrolyzer is idling and the fuel cell is at maximum power. NDEGS is the minimum value for which
(PWECS + N PDEGS,max + PFC,max - PLoad – PEly,min ) ≥ 0
- Assume electrolyzer is idling
- Set Fuel cell power: PFC,set = PLoad + PEly,min - PWECS - N PDEGS,max
- If PFC,set < PFC,min then impose PFC,set = PFC,min
- Set Electrolyzer power to use all power that would be dumped:
PEly,set = PWECS + N PDEGS,max + PFC,max - PLoad
Of course this model is far from being ideal. One can see from these equations that the fuel cells
can run on partial load in this system, which is not the case in the real HARI system where fuel
cells run only at fuel power. Moreover, it is assumed that the “diesel generators” can only operate
at their rated power PDEGS,max or be switched off, which will not be the case in any stand-alone
power system. However, it should give a good first approximation of the actual system.
Moreover, the problem concerning the diesel generators operating at partial power can be
partially solved by increasing NDEGS,max while decreasing PDEGS,max as much as possible in order to
improve the resolution of the calculations. For this model of the HARI system, NDEGS,max has
been set up at 150 while PDEGS,max is fixed at 0.1kW to ensure that 15kW of generators are
available.

38
The main difference between the control strategy in TRNSYS and HOMER is that HOMER
cannot base its control strategy on the SOC of the hydrogen tank. The set points presented on
figure 21 don’t exist in HOMER. In HOMER, the electrolyzer operates whenever the surplus
electricity exceeds its minimum load point and there is headroom in the hydrogen storage tank.
The fuel cell operation is governed by need, fuel supply, schedule, and its cost relative to the
other dispatchable power sources. All these differences make difficult the comparison between
HOMER and TRNSYS
b. HARI system modelling
Figure 22: HARI modeling with TRNSYS, including printers and plotters
Figure 22 represents the whole modelling of the HARI system, comprising the system
components, as well as the printers and plotters used for the analysis. Figure 23 represents only
the HARI system components and will be easier to present in this report.
The TRNSYS system includes a data file (wind speed, solar radiation and load data every hour),
the two 25kW Carter wind turbines, 6kW of PV arrays, a Master Controller, the hydrogen system
(an electrolyzer of 38kW, 22.8m3
of hydrogen storage facility, 7kW of fuel cells and the
corresponding power conditioning devices), 15 kW of diesel engines (running with Liquid
Petroleum Gas) and different calculators required for the modeling of the system. The main

39
difference between the real HARI system and this model is (except the absence of the battery
bank and the control strategy associated) that this model includes only one fuel cell of 7kW
instead of two fuel cells of 2 and 5kW. This is simply due to the fact that the Master Controller
used in TRNSYS is designed to control only one fuel cell at the time.
Figure 23: HARI modeling with TRNSYS
Most of the parameters necessary to build this model were provided by Rupert Gammon, like the
power curve and characteristics of the Carter wind turbines or some features of the PV arrays and
the electrolyzer. However, a few parameters were still missing for confidentiality or availability
reasons. Some default values have then been used once their impact on the simulation results
have been tested, notably for the PV arrays or the fuel cells. For the electrolyzer, an Engineering
Equation Solver (EES) executable has been created by Øystein Ulleberg during the workshop at
IFE in Norway. This executable (see figure 24) allows to obtain the external parameters required
by TRNSYS (figure 25) for an alkaline electrolyzer similar to the one of the HARI system.
All the load and resource (solar and wind) data used in this model are the ones used and defined
in the HOMER simulation. These input data will be presented in details in the next section
dedicated to HOMER.

40
Figure 24: Alkaline electrolyzer model (EES executable developed by Øystein Ulleberg)
Figure 25: Parameters of the electrolyzer required by TRNSYS

41
D. Simulation with HOMER and combined modelling
1. What is HOMER
The Hybrid Optimization Model for Electric Renewables (HOMER) software is a computer
model that simplifies the design of both off-grid and grid-connected power systems for remote,
stand-alone, and distributed generation applications. HOMER performs three tasks: simulation,
optimization and sensitivity analysis. This package allows to evaluate the economic and technical
feasibility of a large number of technology options and to take into account the variations in
technology costs and energy resource availability. HOMER’s library includes both conventional
and renewable energy technologies: PV array, wind turbine, run-of-river hydro-turbine, various
generators, electrolyzer, battery bank or hydrogen storage tank.
In its simulation process, HOMER models the performance of a particular system configuration
each hour of the year in order to determine its technical feasibility and life-cycle cost. To achieve
this, HOMER simulates the operation of the system by making energy balance calculations for
each of the 8,760 hours of the year. For each hour, the electric and thermal demands in the hour
are compared to the energy that the system can supply in that hour, and calculates the flows of
energy to and from each component of the system. For systems that include batteries or fuel-
powered generators, HOMER also decides for each hour how to operate the generators and
whether to charge or discharge the batteries.
In its optimization process, HOMER simulates all the different possible system configurations,
discards the infeasible ones that do not satisfy the defined constraints, displays a list of the
feasible ones by ranking them according to their life-cycle cost and finds the one that satisfies the
technical constraints at the lowest cost. The optimization process is particularly useful to
determine the optimal size and quantity of each component of the system.
In order to limit the input complexity and to allow fast enough computation to make the
optimization process practical, HOMER’s simulation logic is less detailed than other modelling
tools like TRNSYS for example. (Source: http://www.nrel.gov/homer)
2. Control strategy in HOMER
Systems containing a battery bank and one or more generators require a dispatch strategy that
defines the rules governing the charge of the battery. But the choice of the control strategy is
definitively the weak point of HOMER. It offers only two control strategies, cycle charging and
load following. The optimal strategy depends on the sizes of the generators and battery, the price
of fuel, the O&M costs of the components or the amount of renewable power in the system.
Under the load following strategy, whenever it is needed the generators produce just enough
power to meet the demand. Load following is generally preferable in systems with a lot of
renewable power, when the available power sometimes exceeds the load, like it is the case in the
HARI project.
42
Under the cycle charging strategy, whenever a generator is needed, it operates at full capacity and
the surplus power is used to charge the battery. A set point state of charge can also be applied: the
generators will not stop charging the battery until it reaches the specified state of charge. Cycle
charging tends to be optimal in systems with little renewable power.
Each hour, HOMER looks at the available generators and chooses to operate the one that can
produce the required amount of power and operating reserve most cheaply. The cost per kWh of
a generator involves fuel, O&M, and replacement costs. It is also important to know that
HOMER considers a generator "available" only if there is sufficient fuel for it to operate at full
power for one hour. This point becomes particularly relevant in the case of fuel cell consuming
stored hydrogen produced by an electrolyzer, since it might be a meaningful constraint quite
often when the quantity of stored hydrogen is insufficient to allow the fuel cell to operate at full
power.
Another simulation program, Hybrid2 developed by NREL and the University of Massachusetts,
performs a more accurate simulation and offers more possibilities to control the system than
HOMER, but it does not provide any optimization or sensitivity analysis. It may therefore be
interesting to use HOMER to design an approximately optimal system, and then use Hybrid2 to
refine the system design and investigate its performance in more details. It is that idea that has
been applied in this project by using HOMER in the first place before using TRNSYS (instead of
Hybrid2) for a more accurate simulation.
3. HARI system modelling
Figure 26 represents the model of the HARI system with HOMER. But as it was explained in the
last part concerning the TRNSYS simulation, the model developed with TRNSYS is slightly
different than the real HARI system in order to make it simpler and adapted to the control
strategy available in TRNSYS library: there is no battery bank and only one fuel cell of 7kW
instead of two fuel cells of 2 and 5kW.
One of the objectives of this project being to compare the results of the simulations with HOMER
and TRNSYS, it is therefore important to build a model in HOMER copying the TRNSYS one.
Figure 27 represents a copy of the TRNSYS model developed with HOMER.

43
Figure 26: Model of the HARI system with
HOMER
Figure 27: Copy of the TRNSYS model with
HOMER
4. Load and resource data
To simulate a system for one year, HOMER and TRNSYS require some hourly load, solar and
wind data of the site. This data allows HOMER to calculate the energy needed and the resource
available for every time-step of the simulation.
− The primary load used for both HOMER and TRNSYS simulations has been created using a
generic remote load existing in HOMER sample files and scaling it to 4kW, the average load at
West Beacon Farm. As presented on figure 28, this load can be summarized by an hourly load
data, an hourly and daily noise, as well as an annual average and an annual peak power. An
hourly-based time series for the whole year is synthesized by HOMER from these specific values.

44
Figure 28: Load data for HOMER and TRNSYS simulations
− The solar data used in both simulations is also generated through HOMER. Once the
geographical coordinates (longitude and latitude) of the site have been entered, it is possible to
obtain the solar data of the area via Internet by registering freely to the NASA website. The
coordinates of Loughborough can simply be determined using Google Earth: 52°46’N, 1°16’W.
From monthly average, HOMER synthesizes an hourly-based time series of solar data - the
format required by both simulations.

45
Figure 29: Solar data for HOMER and TRNSYS simulations
− The wind data used for this project are Reanalysis data that are totally freely available on
Internet through the NCEP website at http://nomad3.ncep.noaa.gov/cgi-
bin/pdisp_6p_r2.sh?ctlfile=wind.ctl&povlp=ovlp&ptype=ts&dir=.
The Reanalysis Project is a joint project between the National Centre for Environmental
Prediction (NCEP) and the National Centre for Atmospheric Research (NCAR). This project
provides long-term wind data collected since 1948. The original objective of the Reanalysis
project was to provide valuable long-term information about the weather in order to correlate
current measurements and to improve the forecasting of the climate evolution, even if techniques
have largely changed during the last 60 years. This project uses a global data assimilation system,
along with observations from the land, sea (from ships and marine buoys), aircraft, satellite and
other data to produce global fields of various meteorological parameters. The quality of the data
is controlled and assimilated by the data assimilation system which has been kept unchanged over
the project period. To increase the reliability of the wind data, the reanalysis also uses delayed
observations and the database is periodically updated as new processing and modeling techniques
become available.
The reanalysis project is particularly useful when we want to evaluate the wind resource on a
particular site. Wind data are collected every 6 hours, so four times a day.

46
Using the algorithm created during the group project of my MSc in Energy Systems and the
Environment at the University of Strathclyde (http://www.esru.strath.ac.uk/EandE/Web_sites/05-
06/wind_resource/index.html for more information), it is possible to obtain the wind speed at the
site every 6 hours.
Figure 30: The NCEP reanalysis data download page
For the present project, the monthly average wind speeds of the last 6 years of reanalysis data
have been considered to estimate the wind resource at WBF.
2000 2001 2002 2003 2004 2005 Average
January 9.68427 9.01661 10.22065 10.99371 10.56403 13.39250 10.65
February 11.01295 7.29170 12.54598 8.55875 10.13446 9.30027 9.81
March 8.81403 7.57306 8.16581 7.81556 8.79847 8.46476 8.27
April 5.94433 7.49342 7.89058 7.95183 6.79125 7.26458 7.22
May 6.28960 6.07677 8.29363 7.99073 5.20847 7.96968 6.97
June 6.20450 6.24542 7.25550 6.03117 7.30950 5.86375 6.48
July 4.67790 5.71532 5.67056 6.47427 5.98806 5.64218 5.69
August 5.37403 5.58685 4.63234 5.40323 6.55734 6.37621 5.66
September 6.54500 8.35142 5.87083 5.25825 10.02817 7.28033 7.22
October 8.82597 9.45685 8.16661 8.95992 9.63621 7.97403 8.84
November 9.57317 8.80425 8.62792 9.19508 8.52742 9.19517 8.99
December 9.57597 9.60065 8.87960 9.48194 8.97056 8.81806 9.22
Table 2: Reanalysis data used to define the wind resource at WBF (Reanalysis data provided by the NOAA-CIRES ESRL/PSD Climate Diagnostics branch, Boulder,
Colorado, USA, from their website at http://www.cdc.noaa.gov)

47
The data are collected at an altitude of 110m, and the altitude of the site being about 50m
(determined with Google Earth), the anemometer height must be defined as 60m.
As for the solar data, HOMER synthesizes an hourly-based time series of wind speeds from the
reanalysis monthly average.
Figure 31: Wind data for HOMER and TRNSYS simulations
5. Simulation of the HARI system by HOMER and TRNSYS
HOMER and TRNSYS follow two totally different philosophies. While HOMER requires very
few details about the components and bases its calculations on economic considerations,
TRNSYS allows to detail the characteristics of each component of the system, as well as the
characteristics of the control strategy. It can therefore be expected that the two models will give
significantly different results.
Comparing the energy production or consumption of each component over the year of simulation
seems to be the most convenient way to compare the models. The state of charge of the hydrogen
store and the energy balance in the system can also be compared. This can be achieved by using
directly the outputs of the simulations after processing them for comparison in an Excel sheet.

48
TRNSYS HOMER Difference between TRNSYS and HOMER
in % in % in %
Annual electrical energy production (in kWh)
PV arrays 6287 3.7 6263 3.8 +0
Wind turbines 150363 89.4 149612 91.0 +0
CHP 125 0.1 1774 1.1 +1324
FC 11410 6.8 6771 4.1 -41
Total production 168185 164420 -2
Annual electric loads served (in kWh)
AC load served 35040 23.2 35040 55.9 =
Electrolyzer load served 115707 76.8 27634 44.1 -76
Total load served 150747 62674 -58
Average SOC of the H2 storage (in %) 0.96 0.97 +1
Energy balance 17438 101746
Table 3: Comparison of HOMER and TRNSYS simulations for the HARI system
These results perfectly illustrate the difference between TRNSYS and HOMER.
Except for the AC load that is of course identical for both simulations and the energy production
of the PV arrays and the wind turbines that are similar because the weather data and the power
curve of the turbine are identical, one can observe on table 3 that the operation of the fuel cell,
CHP unit and electrolyzer are totally incomparable. HOMER uses less often the fuel cell than
TRNSYS (-41%) but uses considerably more the CHP unit than TRNSYS (+1,324%). The same
phenomena can be observed with the electrolyzer since HOMER uses it 76% less than TRNSYS.
Figure 32 shows a fairly similar SOC of the hydrogen tank in both simulations whereas figure 33
illustrates all the difference between the two programs by revealing that the energy balances in
the systems are absolutely incomparable. We can clearly conclude here that it is impossible to
compare both programs using these results.

49
SOC H2 STORAGE
0
0.2
0.4
0.6
0.8
1
0 1000 2000 3000 4000 5000 6000 7000 8000
Hour
SOC
TRNSYS
HOMER
Figure 32: SOC of the hydrogen store simulated by HOMER and TRNSYS
Energy balance
0
200
400
600
800
1000
1200
Day
kWh/day
TRNSYS
HOMER
Figure 33: Energy balance simulated by TRNSYS and HOMER
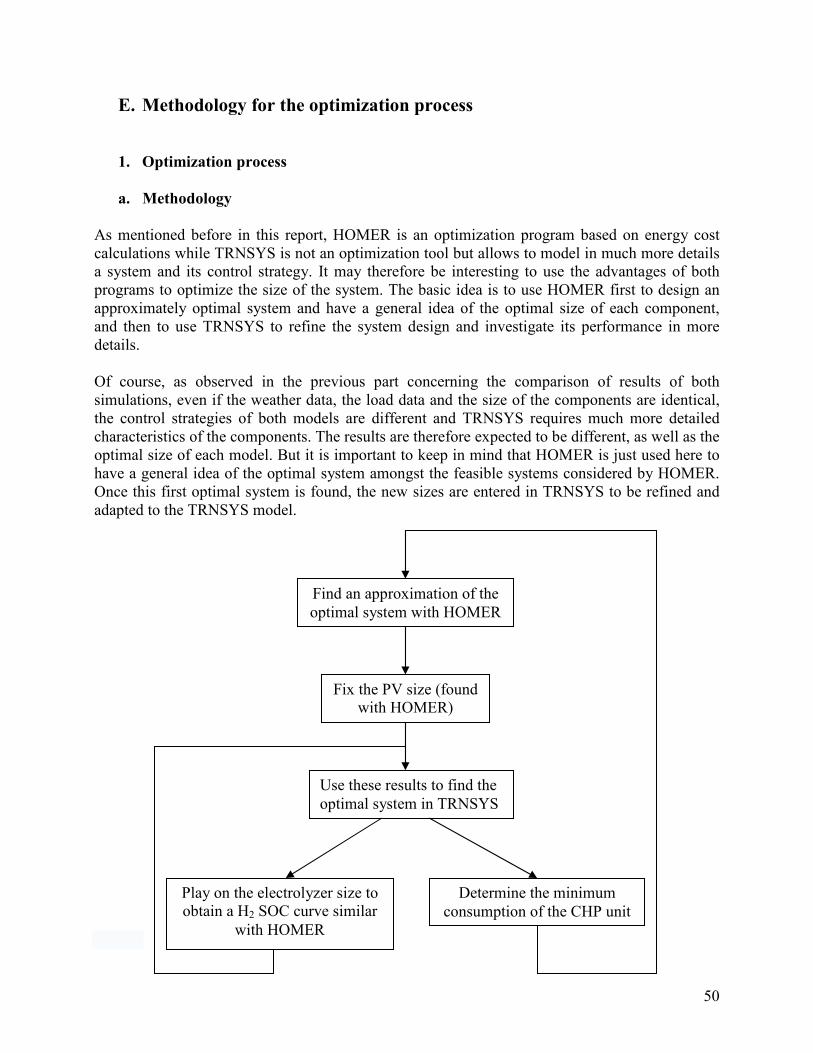
50
E. Methodology for the optimization process
1. Optimization process
a. Methodology
As mentioned before in this report, HOMER is an optimization program based on energy cost
calculations while TRNSYS is not an optimization tool but allows to model in much more details
a system and its control strategy. It may therefore be interesting to use the advantages of both
programs to optimize the size of the system. The basic idea is to use HOMER first to design an
approximately optimal system and have a general idea of the optimal size of each component,
and then to use TRNSYS to refine the system design and investigate its performance in more
details.
Of course, as observed in the previous part concerning the comparison of results of both
simulations, even if the weather data, the load data and the size of the components are identical,
the control strategies of both models are different and TRNSYS requires much more detailed
characteristics of the components. The results are therefore expected to be different, as well as the
optimal size of each model. But it is important to keep in mind that HOMER is just used here to
have a general idea of the optimal system amongst the feasible systems considered by HOMER.
Once this first optimal system is found, the new sizes are entered in TRNSYS to be refined and
adapted to the TRNSYS model.
Find an approximation of the
optimal system with HOMER
Fix the PV size (found
with HOMER)
Use these results to find the
optimal system in TRNSYS
Play on the electrolyzer size to
obtain a H2 SOC curve similar
with HOMER
Determine the minimum
consumption of the CHP unit

51
Figure 34: Methodology for the optimization process
b. HOMER optimal system
The optimal system proposed by HOMER and represented on figure 35 has been obtained step by
step, first investigating a large range of values, then reducing the range progressively until these
results. It includes 12kW of PV arrays, 2 wind turbines, 1kW of CHP, a 10kW fuel cell, a 6kW
electrolyzer and 46kg of stored hydrogen, corresponding to 511Nm3 of hydrogen.
To obtain this optimal system, a few assumptions and restrictions have been made. Firstly, the
two 25kW Carter wind turbines have not been modified, and the number of wind turbines in the
system has been fixed at 2. Moreover, willing to keep all the different components within the
system, the minimum power of each component is limited at 1kW. Finally, in order to favour the
use of renewables over the use of the CHP unit, the CHP size has been limited to 1kW to match
its energy production with the one suggested by the simulation with TRNSYS (see table 5). This
last point perfectly illustrates the necessity to use both programs in parallel and not independently
one after the other.
Figure 35: Optimal system found by HOMER

52
It is also important to notice that this optimal system has been obtained with particular capital,
replacement, operation and maintenance costs for each component. HOMER basing its
optimization process on costs calculations, it is obvious that changes in these costs would
generate different results and therefore a different optimal system. However, these costs seem
quite logical and in accordance with the prices of the market.
c. TRNSYS optimal system
The optimal system obtained with TRNSYS includes 12kW of PV arrays, 2 wind turbines, 3kW
of CHP, a 9kW fuel cell, a 9kW electrolyzer and 3.9m3 of H2 stored at 137bar, corresponding to
about 488Nm3 of hydrogen.
This optimal sizing has been obtained step by step by modifying gradually the size of the
different elements with the objectives to minimize their size for cost interests, to reduce as far as
possible the use of the diesel generators, and in a second time to maximize the average SOC of
the H2 storage. Like in HOMER optimization process, the number of 25kW Carter wind turbines
has been fixed at 2. Finally, the PV size has been fixed to 12kW, as found by HOMER.
d. Summary
The following table shows a summary of the optimal system proposed by HOMER and TRNSYS
with the size of the different elements of the system. The two systems are fairly similar except for
the electrolyzer which is bigger in TRNSYS.
HOMER optimal system TRNSYS optimal system
PV arrays (in kW) 12 12
Number of wind turbines 2 2
CHP (in kW) 1 3
Converter (in kW) 9 -
Fuel cell (in kW) 10 9
Electrolyzer (in kW) 6 9
H2 storage (in Nm3) 511 488
Table 4: Summary of HOMER and TRNSYS optimal systems
2. Operation of the optimal systems found by HOMER and TRNSYS
It is possible to compare the optimal systems proposed by HOMER and TRNSYS exactly in the
same way than described in section D.5.

53
TRNSYS HOMER Difference between TRNSYS and HOMER
in % in % in %
Annual electrical energy production (in kWh)
PV arrays 12519 7.2 12525 7.4 +0
Wind turbines 150363 86.0 149612 88.2 +0
CHP 18 0.0 21 0.0 +21
FC 12012 6.9 7512 4.4 -37
Total production 174911 169670 -3
Annual electric loads served (in kWh)
AC load served 35040 41.8 35040 59.8 =
Electrolyzer load served 48884 58.2 23583 40.2 -52
Total load served 83924 58623 -30
Average SOC of the H2 storage (in %) 0.8 0.8 +0
Energy balance 90987 111047
Table 5: Operation of the optimal systems obtained with HOMER and TRNSYS
As it was the case in section D.5, the results presented in the table above are considerably
different. It is first interesting to notice that even if HOMER has a smaller available CHP unit
than TRNSYS, both use it to produce about the same quantity of energy (18 and 21 kWh). The
production of the fuel cell is way lower in HOMER (-37%), as well as the electrolyzer
consumption (-52%), which explains why the total energy balance is larger in HOMER.
SOC H2 STORAGE
0
0.2
0.4
0.6
0.8
1
0 2000 4000 6000 8000
Hour
SOC
TRNSYS
HOMER
Figure 36: SOC of the H2 store for the optimal systems found by HOMER and TRNSYS
Figure 36 presents an important point of this comparison between the two models. The curves
presented here are nearly identical, which means that the SOC of the hydrogen storage over the
year is closely resembling in both simulations with very similar fluctuations. We clearly observe
the same basic shape with a high level during winter and spring despite a few drops, a major drop
between the hours 4000 and 6000 and finally a quick increase after the summer period. These

54
fluctuations can simply be explained by the intermittent renewable resource that is largely
inferior during summer than during the rest of the year (the solar resource is superior but cannot
compensate the drop of wind speeds, see section D.4). Whereas the hydrogen level is kept high
until hour 4000 thanks to the large amount of renewable power, the fuel cell is intensively used
during the summer period to compensate the lack of renewable power which causes the drop of
the hydrogen level. After this period, the renewable power available increases back and the
hydrogen level can progressively reach higher values.

55
Energy balance TRNSYS
0
200
400
600
800
1000
1200
Day
kWh/day
(a)
Energy balance HOMER
0
200
400
600
800
1000
1200
Day
kWh/day
(b)

56
Energy balance
0
200
400
600
800
1000
1200
0 50 100 150 200 250 300 350Day
kWh/day
TRNSYS
HOMER
(c)
Figure 37 (a), (b) and (c): Energy balance in the optimal systems found by HOMER and TRNSYS
Energy balance
0
200
400
600
800
1000
1200
250 260 270 280 290 300 310 320 330 340 350Day
kWh/day
TRNSYS
HOMER
Figure 37 (d): Zoom of figure 36 (c) between days 250 and 350

57
Another very interesting aspect of this comparison is the energy balance in the system
represented on figure 37 (four graphs above). Here one can see that the energy balance in the
system follows the same trend in both optimal systems by HOMER and TRNSYS with exactly
the same fluctuations. This impression is confirmed by figure 38 that presents the correlation
between energy balances in both optimal systems. The R2
value which is very close to 1 (R2 =
0.9787) indicates that the correlation between the two energy balances is nearly perfect.
Figure 38 also indicates that the energy balance (= energy production - energy consumption) is
about 15% superior in HOMER which can be simply explained by the results in table 5: even if it
produces about 4,500kWh less with the fuel cells, HOMER consumes considerably less energy
through it electrolyzer (about 30,000kWh less). This difference explains the larger energy
balance in HOMER.
However, the very high level of correlation between the two curves proves that HOMER and
TRNSYS globally operate in the same way, though not in the same proportion. This is an
important output of this analysis.
Correlation energy balance y = 1.1528x + 16.874
R2 = 0.9787
0
200
400
600
800
1000
1200
0 200 400 600 800 1000 1200
Energy balance in TRNSYS (kWh)
Energy balance in HOMER
(kWh)
Figure 38: Correlation between the energy balances in the optimal systems found by HOMER
and TRNSYS
3. Conclusion on the HARI optimal system
The optimal system for the HARI system calculated by TRNSYS for these particular load and
weather data includes 12kW of PV arrays, 2 wind turbines, 3kW of CHP, a 9kW fuel cell, a 9kW
electrolyzer and 3.9m3 of H2 stored at 137bar. This new system is globally way smaller than the
actual system, notably for the electrolyzer and the hydrogen storage. This optimal system has
been build with the major objective to reduce the size of the components and to reduce the use of
the CHP unit. Of course, all thermal advantages of the CHP have not been taken into
consideration in this study, since it was only considered as a diesel generator running on LPG.
The CHP in the actual system has without any doubt many advantages but it was only seen as a
fossil fuel consumer to eliminate in this study.
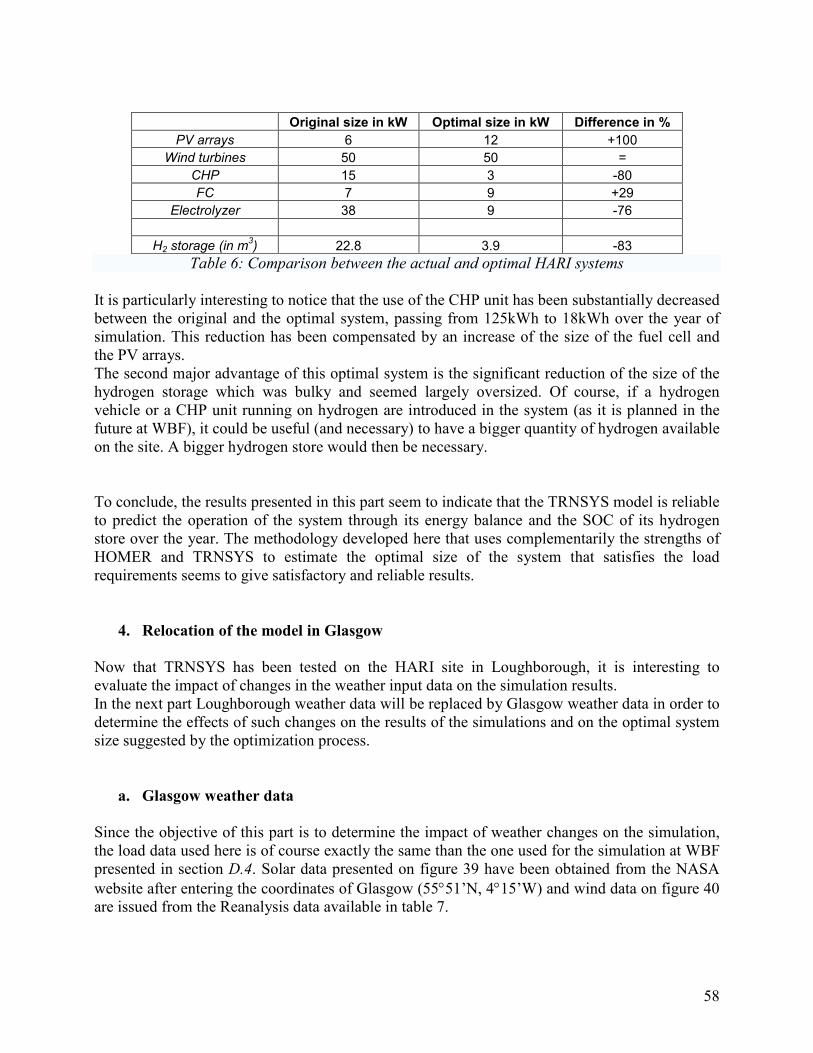
58
Original size in kW Optimal size in kW Difference in %
PV arrays 6 12 +100
Wind turbines 50 50 =
CHP 15 3 -80
FC 7 9 +29
Electrolyzer 38 9 -76
H2 storage (in m3) 22.8 3.9 -83
Table 6: Comparison between the actual and optimal HARI systems
It is particularly interesting to notice that the use of the CHP unit has been substantially decreased
between the original and the optimal system, passing from 125kWh to 18kWh over the year of
simulation. This reduction has been compensated by an increase of the size of the fuel cell and
the PV arrays.
The second major advantage of this optimal system is the significant reduction of the size of the
hydrogen storage which was bulky and seemed largely oversized. Of course, if a hydrogen
vehicle or a CHP unit running on hydrogen are introduced in the system (as it is planned in the
future at WBF), it could be useful (and necessary) to have a bigger quantity of hydrogen available
on the site. A bigger hydrogen store would then be necessary.
To conclude, the results presented in this part seem to indicate that the TRNSYS model is reliable
to predict the operation of the system through its energy balance and the SOC of its hydrogen
store over the year. The methodology developed here that uses complementarily the strengths of
HOMER and TRNSYS to estimate the optimal size of the system that satisfies the load
requirements seems to give satisfactory and reliable results.
4. Relocation of the model in Glasgow
Now that TRNSYS has been tested on the HARI site in Loughborough, it is interesting to
evaluate the impact of changes in the weather input data on the simulation results.
In the next part Loughborough weather data will be replaced by Glasgow weather data in order to
determine the effects of such changes on the results of the simulations and on the optimal system
size suggested by the optimization process.
a. Glasgow weather data
Since the objective of this part is to determine the impact of weather changes on the simulation,
the load data used here is of course exactly the same than the one used for the simulation at WBF
presented in section D.4. Solar data presented on figure 39 have been obtained from the NASA
website after entering the coordinates of Glasgow (55°51’N, 4°15’W) and wind data on figure 40
are issued from the Reanalysis data available in table 7.

59
Figure 39: Glasgow solar data for HOMER and TRNSYS simulations
2000 2001 2002 2003 2004 2005 Average
January 11.39863 9.01645 12.35258 11.51661 10.53363 14.26097 11.51
February 12.53750 8.58536 12.55705 10.32714 9.81768 10.26223 10.68
March 9.14194 7.98863 9.92242 8.30863 9.56363 9.59903 9.09
April 6.97642 7.46442 7.52408 7.50858 8.86058 9.07367 7.9
May 5.44395 5.06911 7.96153 8.45839 6.46331 7.60548 6.83
June 6.68900 7.04100 8.82942 7.76983 8.48083 6.41675 7.54
July 4.54694 6.93226 5.33290 7.23694 7.30661 5.92363 6.21
August 5.13911 6.22742 5.40089 6.40161 6.99016 7.45298 6.27
September 6.81817 8.45683 5.86125 7.24858 10.51650 9.10633 8
October 9.07097 10.85113 8.27468 8.89218 8.73895 10.03363 9.31
November 9.15842 10.16017 10.39667 10.39792 9.90908 10.82950 10.14
December 9.10073 9.54952 8.19403 9.73121 11.87500 9.67548 9.69
Table 7: Reanalysis data used to define the wind resource in Glasgow

60
Figure 40: Glasgow wind data for HOMER and TRNSYS simulations
When comparing these data with the ones of Loughborough, it is noticeable that the solar
resource is similar at both sites (though slightly higher in Loughborough) whereas the wind
resource is around 10% higher in Glasgow, which should have an impact on the optimal size of
the system.
b. Optimal system in Glasgow
The methodology used here is exactly the same than the one used in Loughborough for the
optimisation of the HARI system. The size of PV arrays has been determined by HOMER
whereas the size of the CHP unit has not been modified. Then, the size of the fuel cell, the
electrolyzer and the hydrogen store have been optimised with TRNSYS.

61
HOMER optimal system TRNSYS optimal system
PV arrays (in kW) 10 10
Number of wind turbines 2 2
CHP (in kW) 1 3
Converter (in kW) 9 -
Fuel cell (in kW) 10 9
Electrolyzer (in kW) 5 7.5
H2 storage (in Nm3) 388 (35kg) 376 (3m
3 at 137b)
Table 8: Summary of HOMER and TRNSYS optimal systems in Glasgow
As it was the case in Loughborough, one can observe that the major difference between these two
solutions is the size of the electrolyzer, this one being bigger in TRNSYS. Otherwise, the fuel cell
and the hydrogen tank have still similar sizes.
TRNSYS HOMER Difference between TRNSYS and HOMER
in % in % in %
Annual electrical energy production (in kWh)
PV arrays 11059 5.6 11041 5.7 +0
Wind turbines 176134 88.7 175254 90.9 +0
CHP 14 0.0 17 0.0 +23
FC 11431 5.8 6543 3.4 -43
Total production 198638 192855 -3
Annual electric loads served (in kWh)
AC load served 35040 43.8 35040 63.2 =
Electrolyzer load served 44897 56.2 20391 36.8 -55
Total load served 79937 55431 -31
Average SOC of the H2 storage (in %) 0.81 0.83 +2
Energy balance 118701 137424
Table 9: Comparison of the optimal systems in Glasgow obtained with HOMER and TRNSYS
The results presented in table 9 and in the figures 41, 42 and 43 perfectly confirm the results
obtained at Loughborough. The use by HOMER of the fuel cell and the electrolyzer is smaller
than in TRNSYS, with respectively -43 and -55%. The SOC of the hydrogen tank is still very
similar in both simulations and the correlation between the two energy balances is still excellent
(R2=0.9865). One can also see that the energy balance is still substantially higher in HOMER
(about +12%) for the same reasons than mentioned in the previous part.
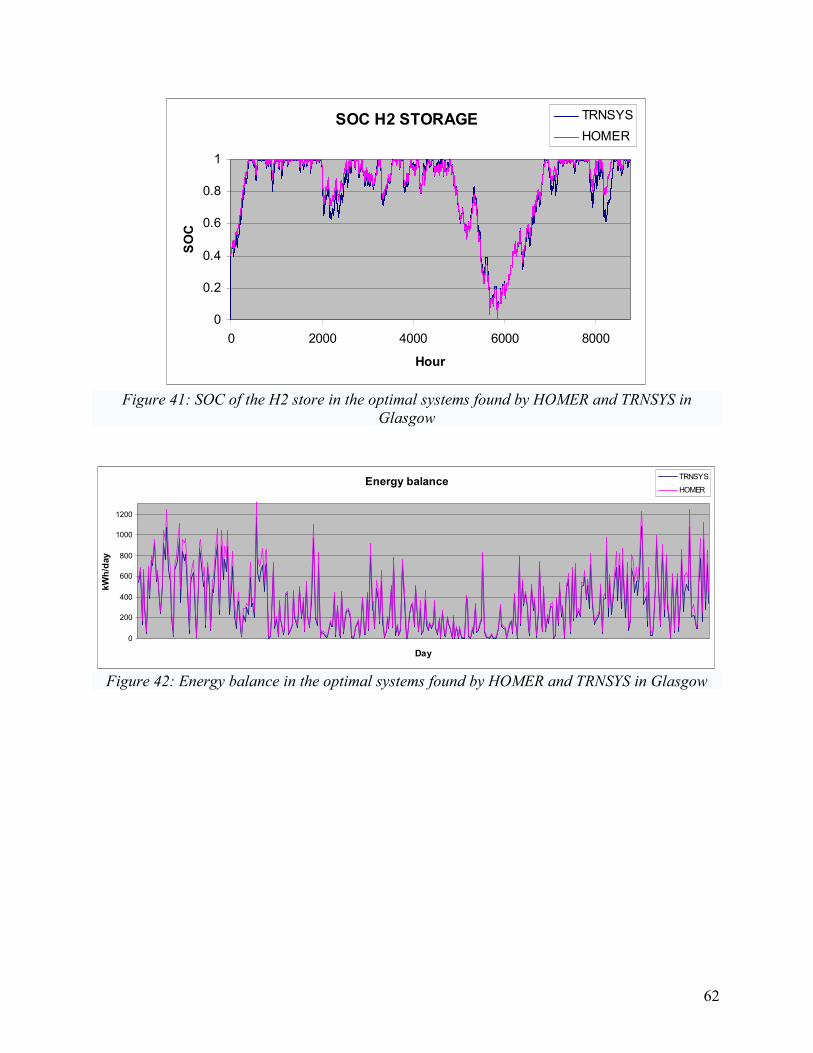
62
SOC H2 STORAGE
0
0.2
0.4
0.6
0.8
1
0 2000 4000 6000 8000
Hour
SOC
TRNSYS
HOMER
Figure 41: SOC of the H2 store in the optimal systems found by HOMER and TRNSYS in
Glasgow
Energy balance
0
200
400
600
800
1000
1200
Day
kWh/day
TRNSYS
HOMER
Figure 42: Energy balance in the optimal systems found by HOMER and TRNSYS in Glasgow

63
Correlation energy balance y = 1.1191x + 12.551
R2 = 0.9865
0
200
400
600
800
1000
1200
0 200 400 600 800 1000 1200
Energy balance in TRNSYS (kWh)
Energy balance in HOMER
(kWh)
Figure 43: Correlation between the energy balance in the optimal systems found by HOMER and
TRNSYS in Glasgow
c. Impact of the weather changes on the optimal system size
The real interest of transposing the models in Glasgow is to compare the optimal systems
proposed by TRNSYS in the two places.
TRNSYS optimal in
Loughborough
TRNSYS optimal in
Glasgow
PV arrays (in kW) 12 10
Number of wind turbines 2 2
CHP (in kW) 3 3
Fuel cell (in kW) 9 9
Electrolyzer (in kW) 9 7.5
H2 storage (in m3) at 137b 3.9 3
Table 10: Comparison of the optimal systems found by TRNSYS in Loughborough and Glasgow
Logically, since the wind speeds are higher in Glasgow, the system requires less solar power to
provide the necessary amount of renewable energy. The loss of PV power is easily compensated
by the extra wind power.
Since the CHP unit and the fuel cell are identical on both sites, the major differences between the
optimal systems in Loughborough and Glasgow are the sizes of the electrolyzer and the hydrogen
storage necessary, which are both smaller in Glasgow by respectively 17 and 23 %.
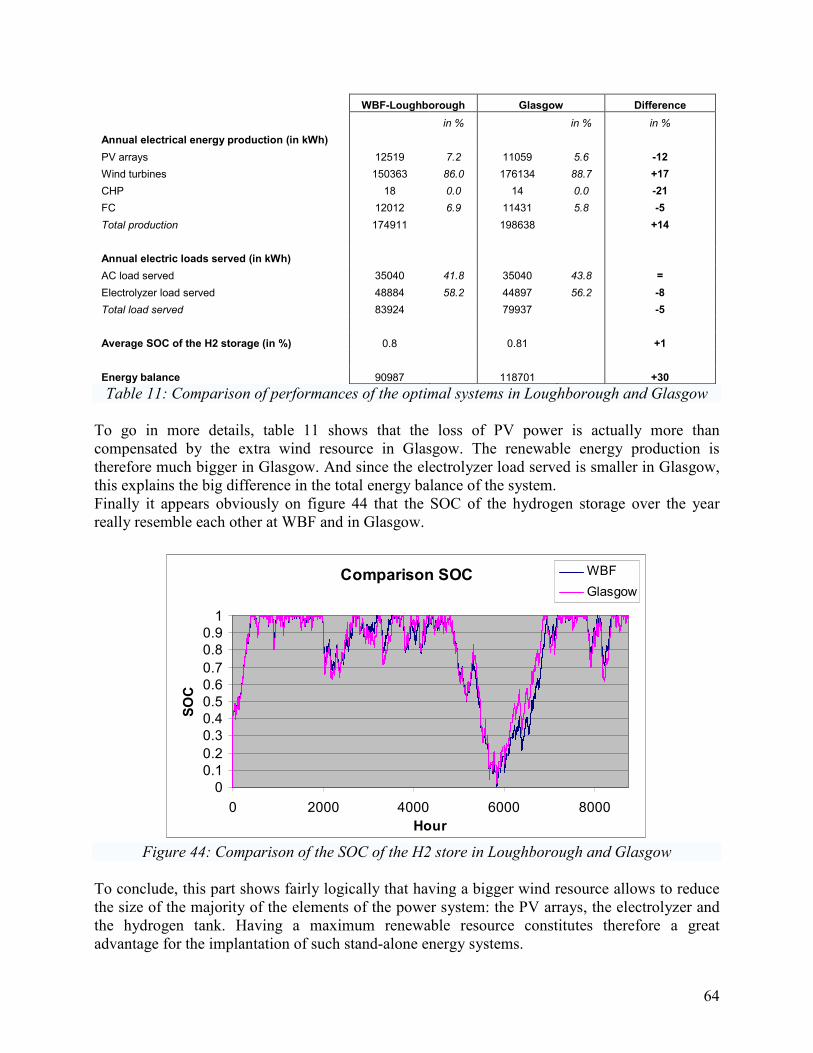
64
WBF-Loughborough Glasgow Difference
in % in % in %
Annual electrical energy production (in kWh)
PV arrays 12519 7.2 11059 5.6 -12
Wind turbines 150363 86.0 176134 88.7 +17
CHP 18 0.0 14 0.0 -21
FC 12012 6.9 11431 5.8 -5
Total production 174911 198638 +14
Annual electric loads served (in kWh)
AC load served 35040 41.8 35040 43.8 =
Electrolyzer load served 48884 58.2 44897 56.2 -8
Total load served 83924 79937 -5
Average SOC of the H2 storage (in %) 0.8 0.81 +1
Energy balance 90987 118701 +30
Table 11: Comparison of performances of the optimal systems in Loughborough and Glasgow
To go in more details, table 11 shows that the loss of PV power is actually more than
compensated by the extra wind resource in Glasgow. The renewable energy production is
therefore much bigger in Glasgow. And since the electrolyzer load served is smaller in Glasgow,
this explains the big difference in the total energy balance of the system.
Finally it appears obviously on figure 44 that the SOC of the hydrogen storage over the year
really resemble each other at WBF and in Glasgow.
Comparison SOC
0
0.1
0.2
0.3
0.4
0.5
0.6
0.7
0.8
0.9
1
0 2000 4000 6000 8000
Hour
SOC
WBF
Glasgow
Figure 44: Comparison of the SOC of the H2 store in Loughborough and Glasgow
To conclude, this part shows fairly logically that having a bigger wind resource allows to reduce
the size of the majority of the elements of the power system: the PV arrays, the electrolyzer and
the hydrogen tank. Having a maximum renewable resource constitutes therefore a great
advantage for the implantation of such stand-alone energy systems.

65
F. Conclusion
Because storing energy from renewables using a hydrogen system is still an expensive and
immature technology, developing computer programs that can model such hybrid systems is
absolutely essential for the future of this technology.
In this context, this project aimed at simulating the HARI system with the TRaNsient SYstems
Simulation program TRNSYS. The first objective was of course to assess the ability of TRNSYS
to simulate any stand-alone power system without major difficulties. Once the model developed,
TRNSYS has been used in parallel with HOMER (another modeling and optimization program)
to determine the optimal size of the system to satisfy the load requirements at West Beacon Farm.
Finally, Loughborough wind and solar data have been replaced by Glasgow data in order to
assess the impact of weather changes on the optimal configuration of the system.
The main findings from this project was that there were some limitations in the capabilities of the
tools studied. However, despite these limitations the use of modelling programs seems to be an
efficient and reliable way to determine the optimal size of a renewable-hydrogen system and its
performances. A particular methodology, which uses the TRNSYS and HOMER modelling tools
in parallel has been established.
The specific conclusions are as follows.
- Developing a model of the HARI system with TRNSYS was not a simple task. The study
highlighted an important weakness of the current version of TRNSYS. There is only one
controller available in TRNSYS library to control the system. Even if this controller can provide
interesting results in many cases, it is absolutely essential in the future to be able to choose a
control strategy amongst others. Selecting the most appropriate strategy must be part of the whole
system optimization process since, as shown in this study, a change in the control strategy can
have major effects on the operation of the system.
- The limitations on the controller available in TRNSYS library obliged to adapt and transform
the HARI system, and notably to change significantly its control strategy. The actual HARI
system is controlled through the state of charge of its battery. However, the only controller
currently available in TRNSYS controls the system through the state of charge of the hydrogen
store, and can only control one fuel cell at the time. The original HARI system has therefore been
transformed to satisfy these new specifications. These limitations on the control strategy in
TRNSYS appear clearly as an important drawback of the program at the moment. Nevertheless,
controlling such a system through the state of charge of the hydrogen store is also a feasible
solution that was worth testing.
- Weather and load data were not directly obtained from measurement at WBF because of the
difficulty to obtain the necessary data in the format required by HOMER and TRNSYS for one
whole year. While the load data has been obtained from a sample remote load distribution scaled
at 4kW, the raw solar data of the site comes from the NASA website and the raw wind data is
reanalysis data generated by the NCEP reanalysis program. HOMER is then able to generate
from these raw data hourly-based data compatible with the format required by both programs. Of
course these data cannot be as accurate as direct measurements but this collection method allows

66
to test the model at any site on Earth without requiring any measurement campaign. The
necessary data can be easily collected and used immediately, which represents an enormous
advantage.
- HOMER and TRNSYS simulate totally differently the real HARI system. The production or
consumption of each component, as well as the hydrogen SOC over the year or the energy
balance in the system are absolutely incomparable. It is therefore impossible to conclude on the
performances of the actual HARI system with these results. However, it appears clearly that this
is caused by the major differences in the control strategies in HOMER and TRNSYS. Whereas
the system is ruled by some energy flow calculations in TRNSYS, HOMER bases its operation
on costs calculations since it aims at producing the required energy most cheaply. simply selects
each hour the available generators that can produce the required amount of power as cheaply as
possible.
- A methodology using TRNSYS and HOMER in parallel has been established to optimize the
size of the stand-alone power system. HOMER being an optimization tool based on costs
considerations and TRNSYS being more detailed on the technical aspect (but it is not an
optimization tool), it is interesting to use the strengths of both programs. In the methodology,
HOMER is used first to design an approximately optimal system, and then TRNSYS is used to
refine the system design and investigate its performance in more details.
This optimization process provides very interesting results. Indeed, while the sizes of the optimal
system found by each program fairly resemble, the hydrogen SOC and the energy balance
simulated by both models are very similar. Despite control strategies still different (which still
explains the different operations of the different elements) and an energy balance about 15%
superior in HOMER, the correlation is nearly perfect between both simulations, indicating some
identical fluctuations of the energy balance.
- The HARI optimal system found by TRNSYS includes 12kW of PV arrays, 2 wind turbines,
3kW of CHP, a 9kW fuel cell, a 9kW electrolyzer and 3.9m3 of H2 stored at 137bar, which is
considerably smaller than the system existing at the moment at WBF. The size of the hydrogen
store has notably been reduced by 83% in comparison with the original HARI system. The use of
the CHP unit has also been nearly eliminated in the new system, even if it is important to know
that all thermal aspects have been neglected in this study.
- The virtual relocation of the HARI system in Glasgow also provides some interesting results.
With a similar solar resource but a wind resource about 10% superior to Loughborough, the
conditions in Glasgow allow to push even further the reduction of size of the optimal system,
which highlights the importance of selecting carefully the appropriate data of the site.
To summarize, developing new controllers compatible with TRNSYS is absolutely necessary for
a potential further use of TRNSYS to model and design stand-alone power systems. This should
be one of the objectives of the Knowledge Transfer Partnership (KTP) I will undertake for the
next two years at SgurrEnergy.

67
Acknowledgments
I would like to thank Rupert Gammon for his help and time for providing me some very useful
documents and information about the HARI project. I would also like to thank Doctor Nick Kelly
for his implication in the project, notably to obtain an evaluation version of TRNSYS for the
duration of the project. I would also like to thank SgurrEnergy that allowed me and Geoff
Hoffheinz to follow a TRNSYS and HYDROGEMS one-week training program in Norway in
order to become familiar with the use of the program. Finally, I would like to thank Øystein
Ulleberg and Andreas Rinnan from IFE for their precious help during and after this TRNSYS
workshop.

68
References
- [1] Hydrogen And Renewables Integration (HARI) project. Rupert Gammon, Amitava
Roy, John Barton, Matthew Little. CREST (Centre for Renewable Energy Systems Technology),
Loughborough University, UK. March 2006.
- [2] The HARI project, presentation by Rupert Gammon, H2NET Summer Conference,
RAL. 14 July 2004.
- [3] The Hydrogen Economy Comes to the UK. Fuel cell today. Rupert Gammon, Centre for
Renewable Energy Systems Technology (CREST), Loughborough University. June 2004.
- [4] West Beacon Farm. http://www.beaconenergy.co.uk.
- [5] Hydrogen energy storage. http://www.beaconenergy.co.uk.
- [6] Electrical integration of renewable energy into stand-alone power supplies
incorporating hydrogen storage. Matthew Little, Murray Thomson and David Infield. CREST
(Centre for Renewable Energy Systems Technology), Department of Electronic and Electrical
Engineering, Loughborough University, Loughborough, UK.
- [7] Control of a DC-interconnected renewable-energy-based stand-alone power supply.
Matthew Little, Murray Thomson and David Infield. CREST (Centre for Renewable Energy
Systems Technology), Loughborough University.
- [8] Stand-alone renewable energy system based on hydrogen production. Tapan K. Bose,
Kodjo Agbossou, Mohan Kolhe, Jean Hamelin. Institut de recherche sur l’hydrogène, Université
du Québec à Trois-Rivières, Canada.
- [9] Implementation of hydrogen storage on the wind-powered islanded grid on the Isle
of Muck. Catrina McAlister. University of Strathclyde.
- [10] HYDROGEMS User Guide.
- [11] Techno-economic analysis of the integration of hydrogen energy technologies in
renewable energy-based stand-alone power systems. E.I. Zoulias, N. Lymberopoulos. Centre
for Renewable Energy Sources (CRES). 2005.
- [12] Unit sizing and cost analysis of stand-alone hybrid wind/PV/fuel cell power
generation systems. D.B. Nelson, M.H. Nehrir, C. Wang. Electrical & Computer Engineering
Department, Montana State University. 2005.
- [13] Mathematical Reference of TRNSYS 16, TRNSYS documentation.
- [14] Stand-alone power systems for the future: optimal design, operation & control of
solar-hydrogen energy systems. PhD dissertation, Øystein Ulleberg.1998.

69
- [15] Optimisation of control strategies for stand-alone renewable energy systems with
hydrogen storage. Rodolfo Dufo-Lopez, José L. Bernal-Agustin, Javier Contreras. University of
Zaragoza. 2006.
- [16] Micropower system modeling with HOMER. Tom Lambert. Mistaya Engineering Inc.


