OPTIMIZATION OF THE MEMBRANE ELECTRODE ASSEMBLY (MEA) FABRICATION FACTORS BY DESIGN OF EXPERIMENT (DOE) METHOD U.A. Hasran 1 , S.K. Kamarudin 1,2 , W.R.W. Daud 1 , B.Y. Majlis 3 , A.B. Mohamad 2 , A.A.H. Kadhum 2 , M.M. Ahmad 4 1 Fuel Cell Institute, Universiti Kebangsaan Malaysia, Malaysia 2 Department of Chemical And Process Engineering, Universiti Kebangsaan Malaysia, Malaysia 3 Institute of Microengineering and Nanoelectronics, Universiti Kebangsaan Malaysia, Malaysia 4 School of Bioprocess Engineering, Universiti Malaysia Perlis, Malaysia email: [email protected]
Transcript
OPTIMIZATION OF THE MEMBRANE ELECTRODE ASSEMBLY (MEA) FABRICATION FACTORS BY DESIGN
The current method typically used to optimize the critical hotpressing process for the fabrication of MEA is time-consuming,costly and only capable of estimating the importance of eachinput parameter/factor but not the interactions between themon the chosen response.
OBJECTIVES
� To investigate the effect each hot pressing factor has on theMEA fabrication by observing the performance� To observe the interactions between the input factors on thechosen response� To optimize the hot pressing process
METHODOLOGY
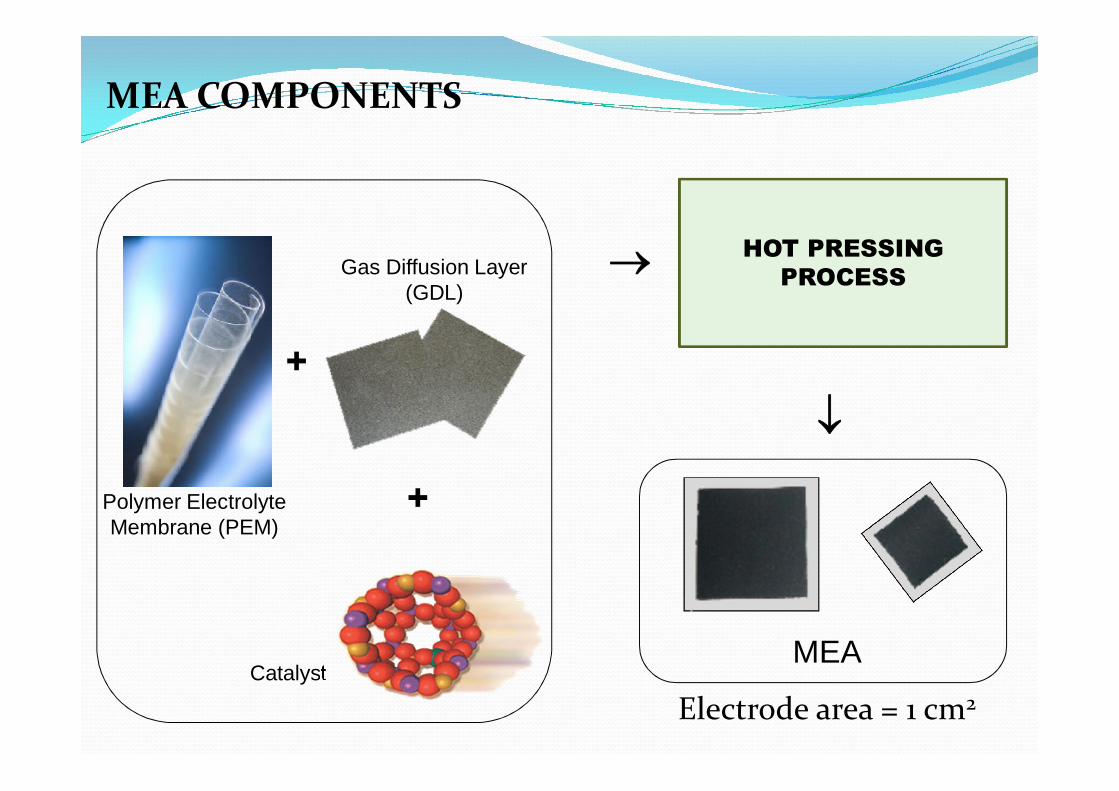
� Fabrication of the MEA components
� Hot pressing process
� Pre-treatment of the MEA
� Performance testing with the One-Factor-At-a-Time (OFAT)
method to obtain the levels of the hot pressing factors in this study
� Performance testing with the Design of Experiment (DOE)
method to optimize the hot pressing factors
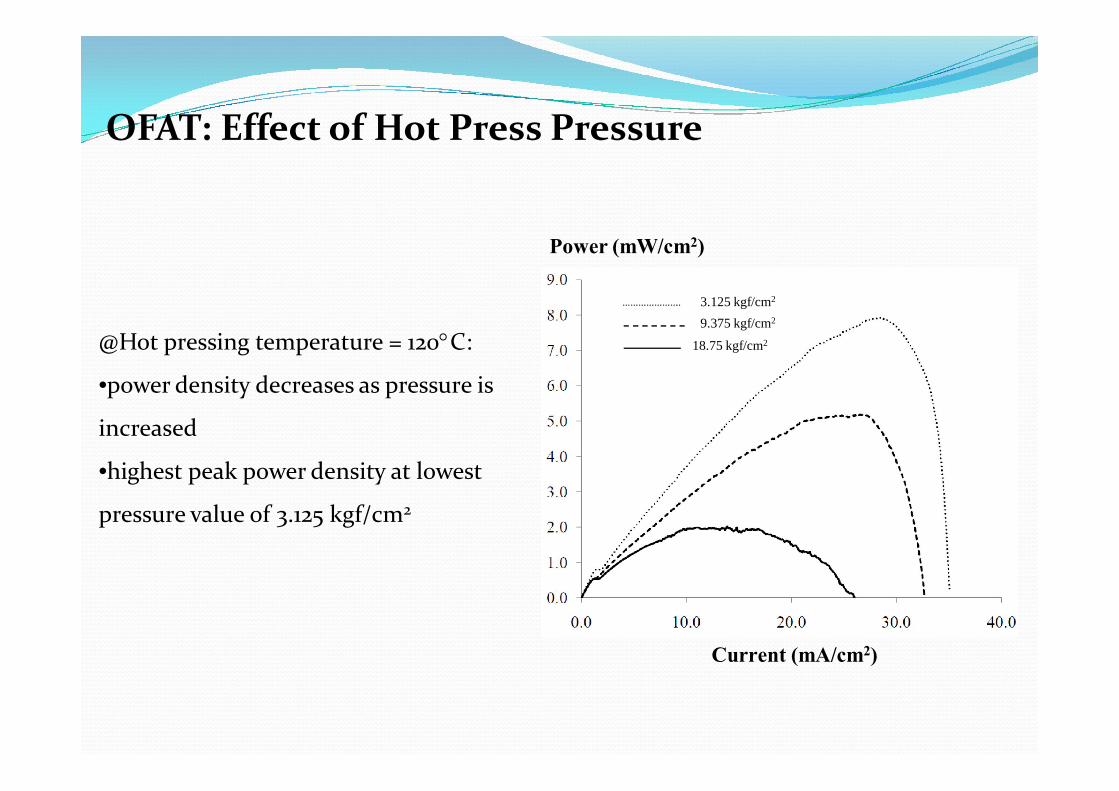
OFAT: Effect of Hot Press Pressure
3.125 kgf/cm2
9.375 kgf/cm2
18.75 kgf/cm2
Power (mW/cm2)
Current (mA/cm2)
@Hot pressing temperature = 120C:
•power density decreases as pressure is
increased
•highest peak power density at lowest
pressure value of 3.125 kgf/cm2
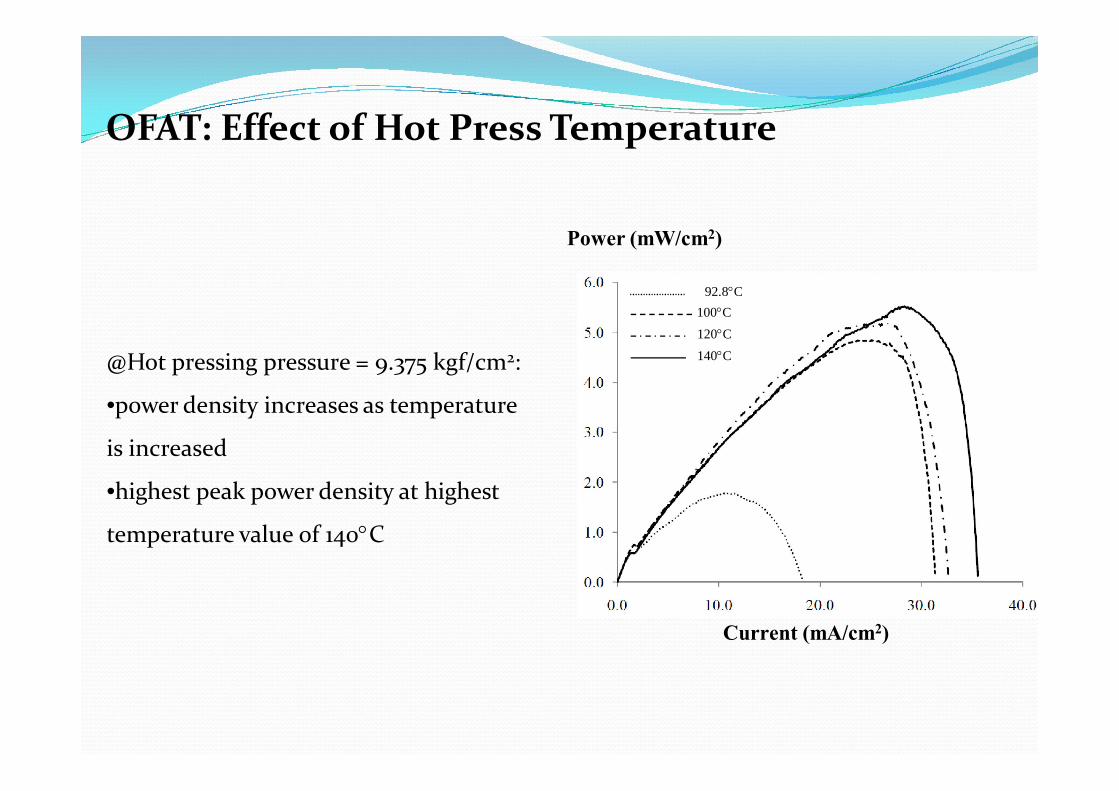
@Hot pressing pressure = 9.375 kgf/cm2:
•power density increases as temperature
is increased
•highest peak power density at highest
temperature value of 140C
92.8C
100C
120C
Power (mW/cm2)
Current (mA/cm2)
140C
OFAT: Effect of Hot Press Temperature
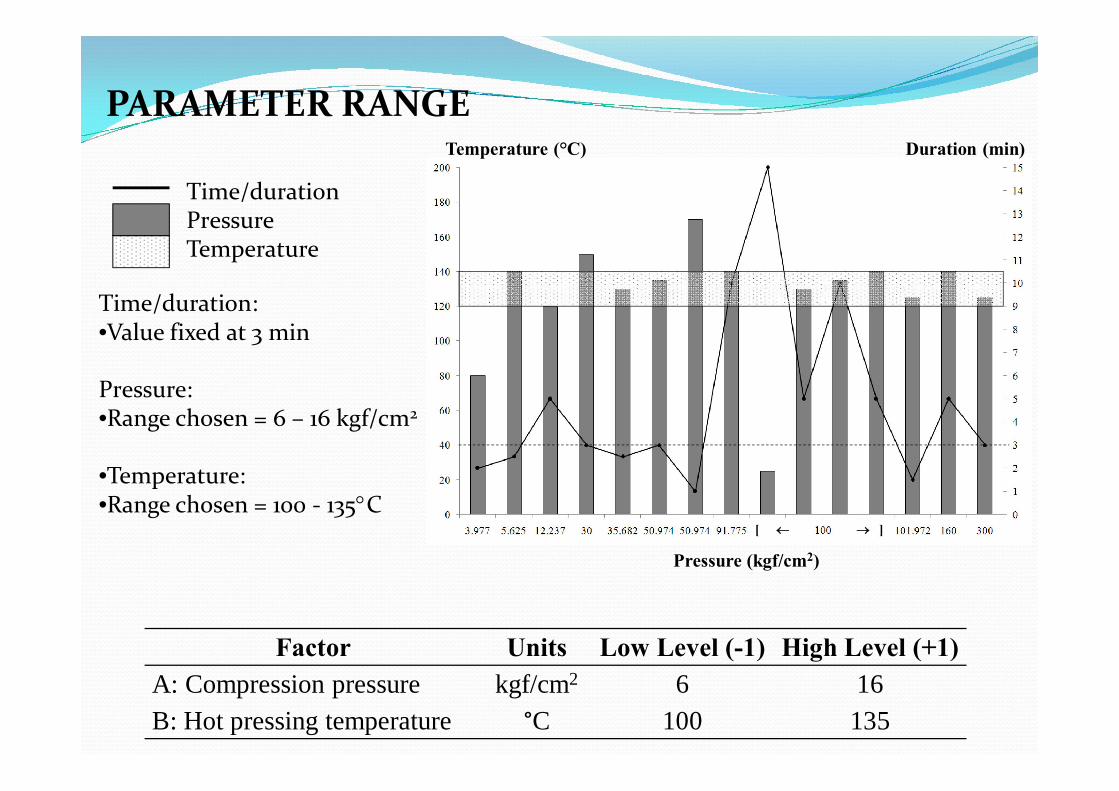
PARAMETER RANGE
Pressure (kgf/cm2)
[ ]
Temperature (°C) Duration (min)
Time/duration: •Value fixed at 3 min
Pressure: •Range chosen = 6 – 16 kgf/cm2
•Temperature: •Range chosen = 100 - 135C
Time/durationPressureTemperature
Factor Units Low Level (-1) High Level (+1)
A: Compression pressure kgf/cm2 6 16B: Hot pressing temperature °C 100 135
DOE METHOD
� Software Design-Expert 8.0.7.1
� Response surface methodology (RSM):
•objective: optimizing the response variable(s)
•regression analysis used for modeling and analysis of problems
� Central Composite Design (CCD):
•to study the correlation between the factors and the response
•designed to estimate the coefficients of a quadratic model
•no need for detailed reaction mechanism
•blocking effect was of no interest in this work
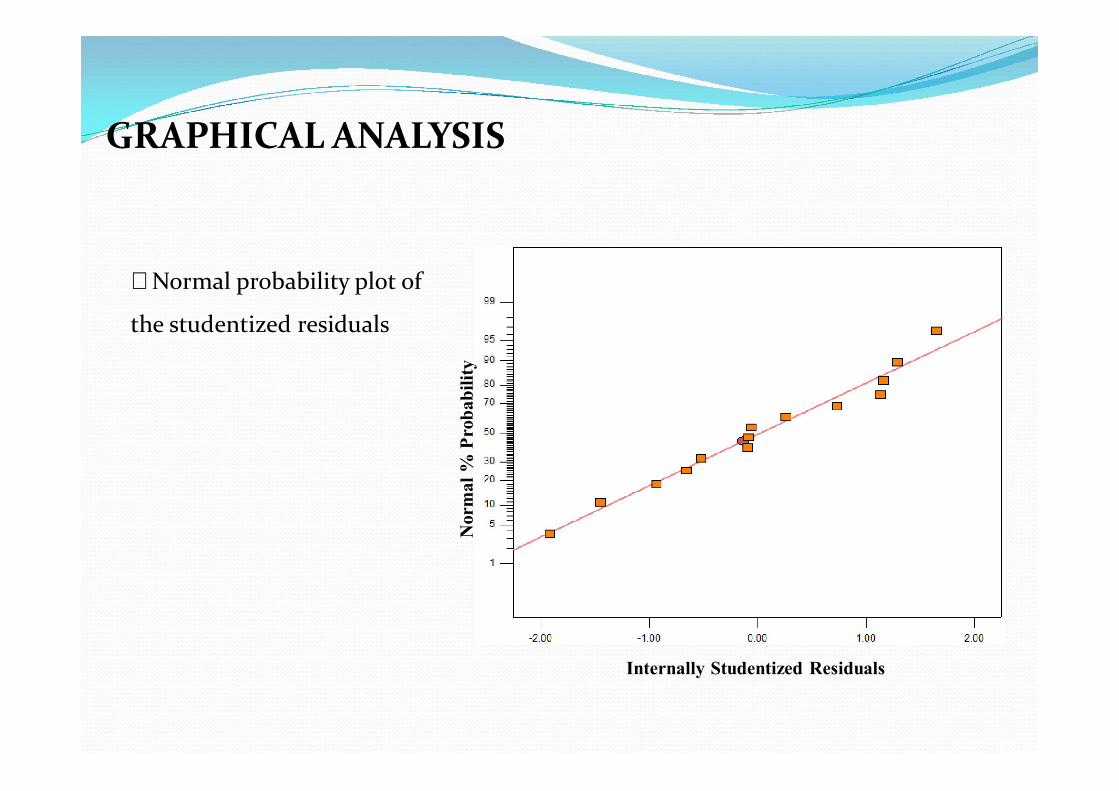
� Normal probability plot of
the studentized residuals
Nor
mal
% P
rob
abil
ity
Internally Studentized Residuals
GRAPHICAL ANALYSIS
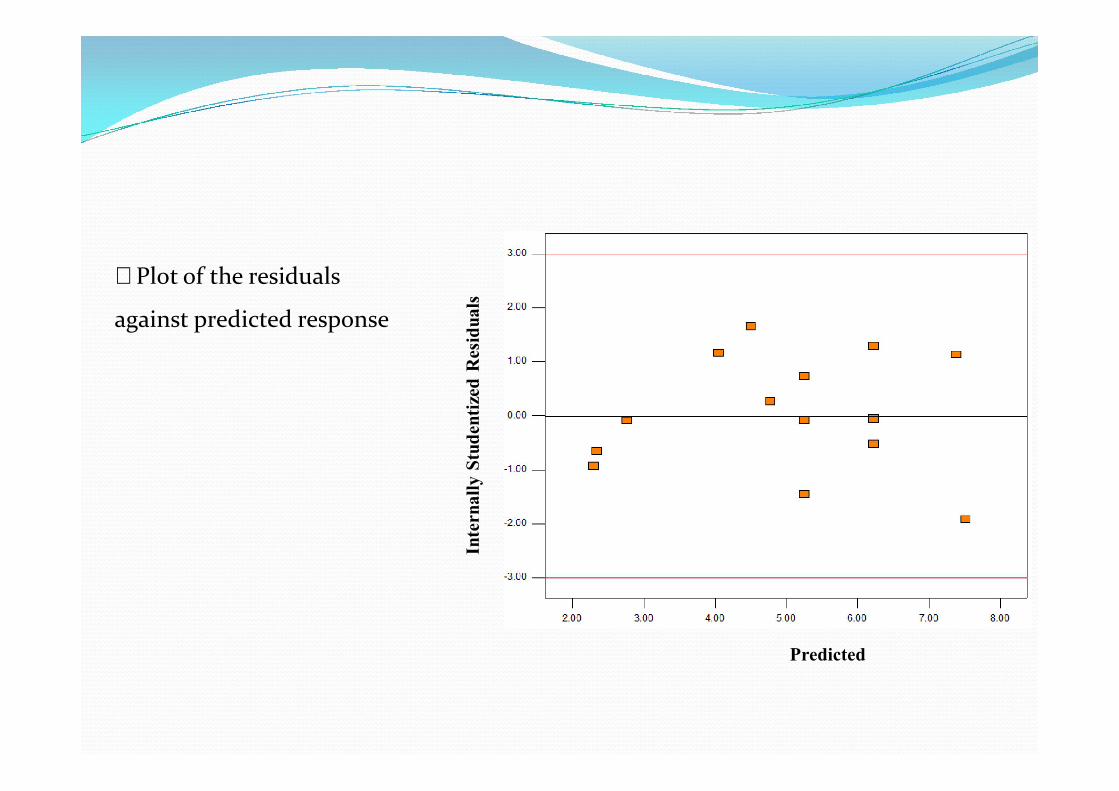
� Plot of the residuals
against predicted response
Inte
rnal
ly S
tud
enti
zed
Res
idu
als
Predicted
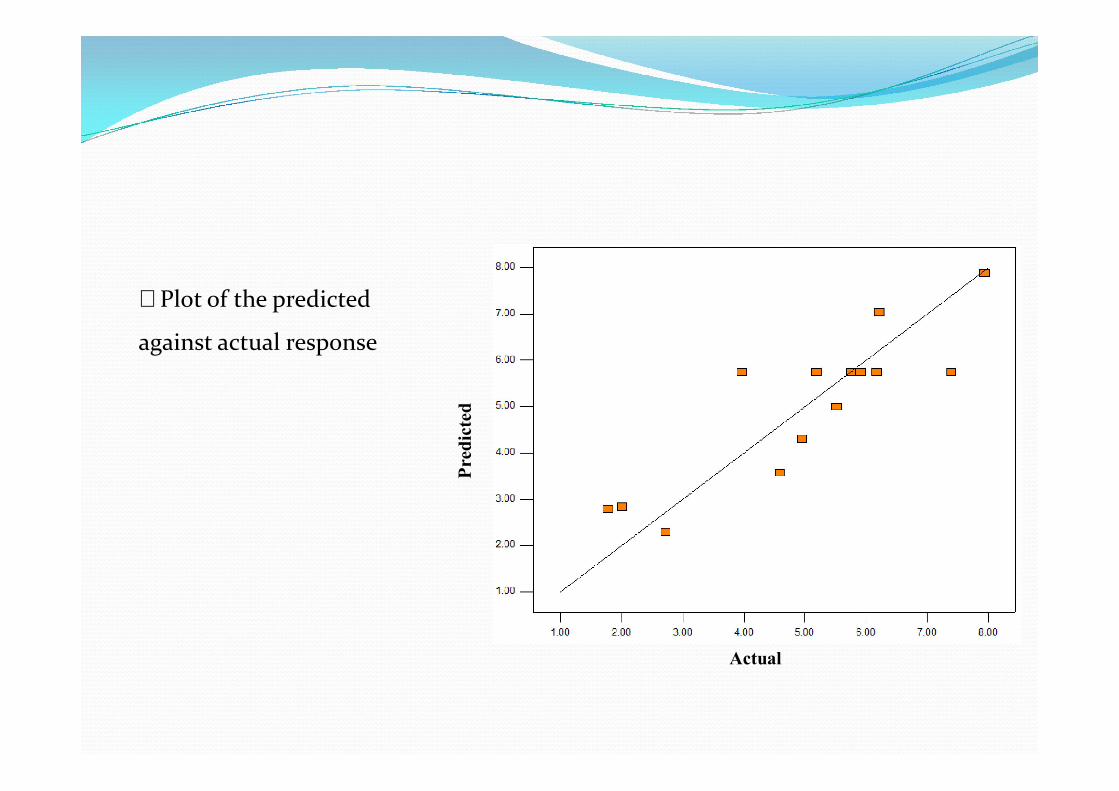
� Plot of the predicted
against actual response
Pre
dic
ted
Actual
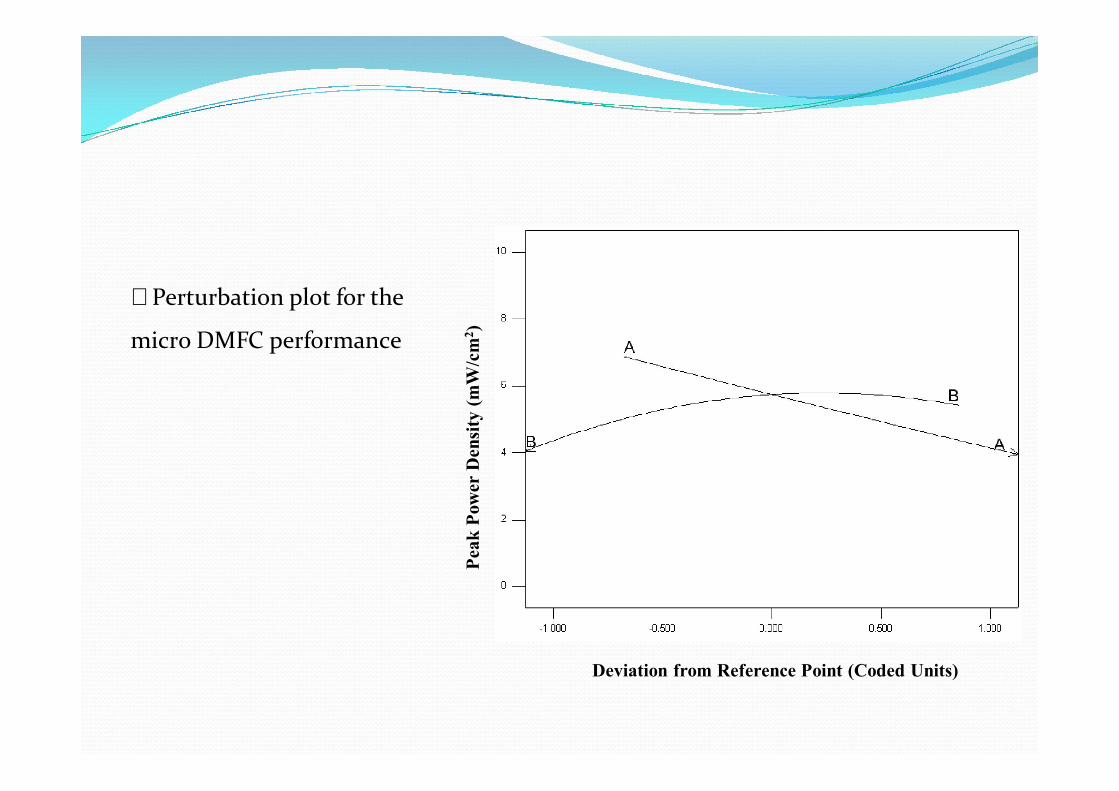
� Perturbation plot for the
micro DMFC performance
Pea
k P
ower
Den
sity
(m
W/c
m2)
Deviation from Reference Point (Coded Units)
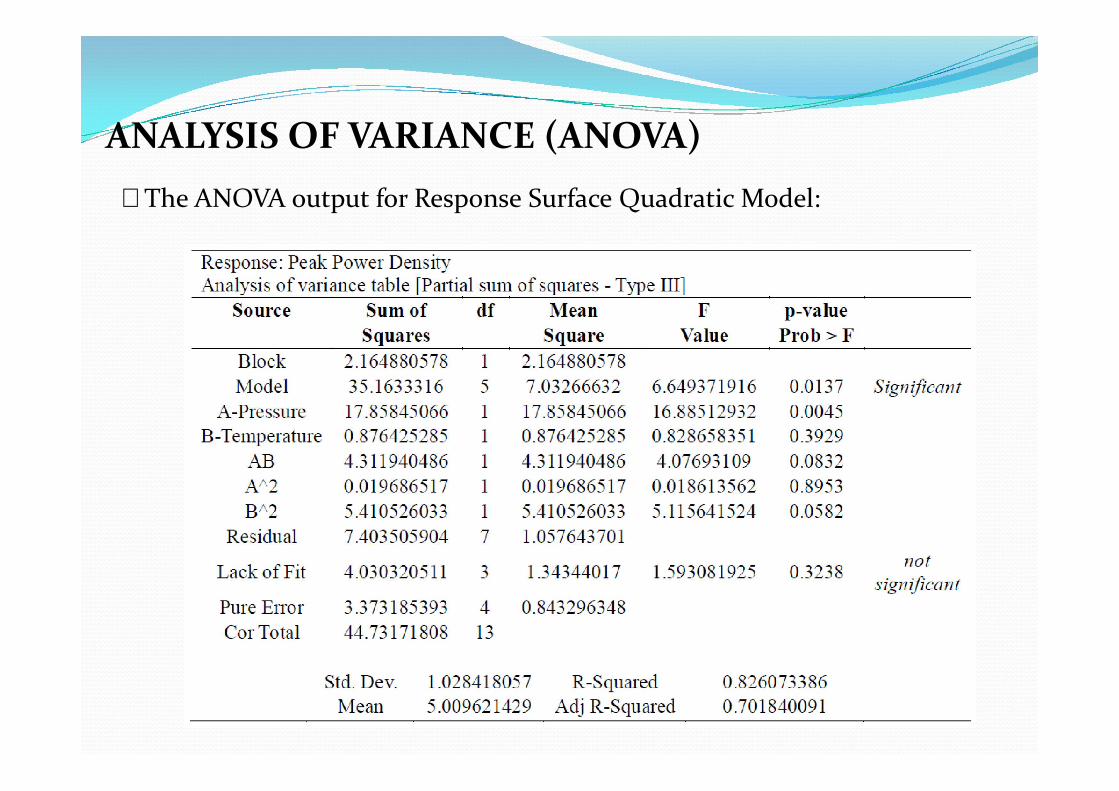
ANALYSIS OF VARIANCE (ANOVA)
� The ANOVA output for Response Surface Quadratic Model:
� The coefficients of the model for the response show that:
•negative effect implies that A should be minimized
•positive effect implies that B should be maximized
•excessive increase is less desirable for temperature compared to pressure
A: Pressure ResidualsB: Temperature
Pea
k P
ower
Den
sity
(m
W/c
m2)
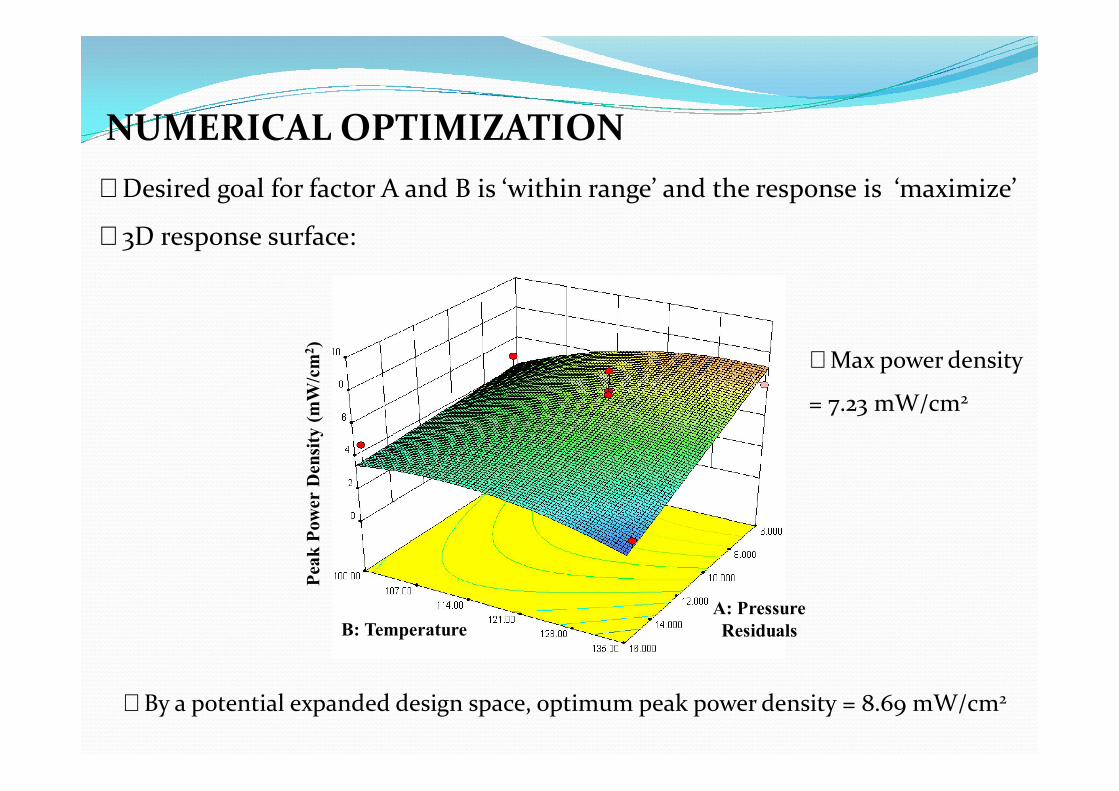
NUMERICAL OPTIMIZATION
� Desired goal for factor A and B is ‘within range’ and the response is ‘maximize’
� 3D response surface:
� By a potential expanded design space, optimum peak power density = 8.69 mW/cm2
� Max power density
= 7.23 mW/cm2
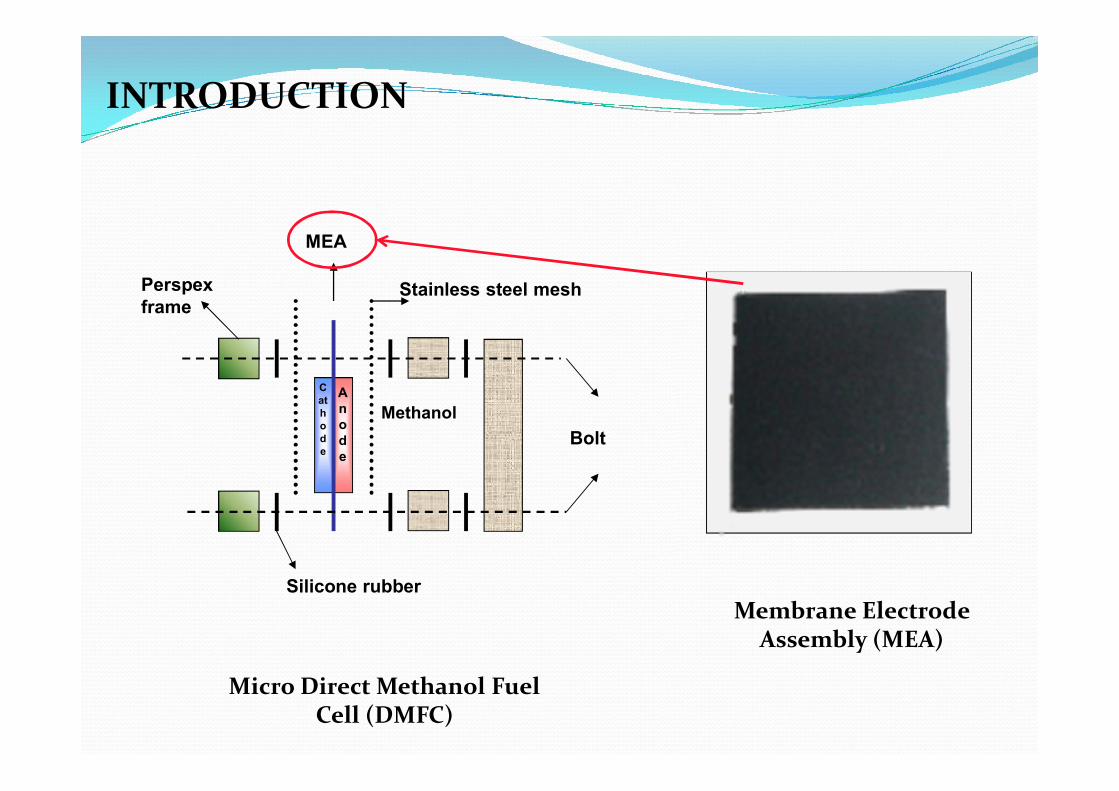
� Porous media:•electrodes - the gas diffusion layer and the catalyst layer.•PEM
� Over-pressure: •considerable decrease in size or collapse•transport of reactants suffers
•therefore, excessive hot press pressure may result in decreasing fuel cell performance
THE EFFECT OF HOT PRESS PRESSURE
� Glass transition temperature (Tg) for Nafion 117:•132C just before hot-pressing•99C when fully hydrated
� @ temperatures below Tg:•rigidity during hot-pressing•an increase in ohmic loss and a decrease in long-term stability
� @ temperatures above Tg:•softened during hot-pressing •however, it will undergo a micro-structural change and an irreversible water uptake loss at temperatures much higher than Tg
THE EFFECT OF HOT PRESS TEMPERATURE
� OFAT method: changes in compression pressure have a bigger effect on
the electrodes whereas varying the compression temperature affects the
PEM more
� DOE method: the optimum hot pressing factors expected to deliver the
maximum response were predicted using the RSM with central composite
design.
� The model chosen from the ANOVA analysis to predict the desired
response is the Quadratic model.
� The predicted net peak of 7.23 mW/cm2 was obtained from the studied
design space and an optimum performance of 8.69 mW/cm2 was obtained
from the potential expanded design space.
CONCLUSIONS
� Apply the optimum hot press settings in an active micro DMFC system
� Study more input factors with more than one response