+ All Categories
Home > Documents > Optimization of the ultrafiltration in diafiltration mode ...

Optimization of the ultrafiltration in diafiltration mode ...

Date post: 26-Mar-2022
Category:
Upload: others
View: 2 times
Download: 0 times
Share this document with a friend
10
1 Optimization of the ultrafiltration in diafiltration mode to reduce the lactose content of protein concentrates Sofia Ramos Cabral [email protected] Instituto Superior Técnico, Lisbon, Portugal December 2015 Abstract The main objective of this work is the separation and permeation of lactose present in whey previously concentrated by reverse osmosis, to be able to do beverage fortification trials in the future, with purified protein concentrates. By the resistance model, it was found that the reversible resistance, which is associated with the concentration polarization and the material deposition on the membrane surface that is not chemically bonded to the membrane itself, is the one with the biggest contribution to the total resistance. The process of fractionation by ultrafiltration of whey pre-concentrated by reverse osmosis was studied, measured in terms of permeation flow and apparent rejections. Rejections of 0.89 of protein and 0.55 of lactose were obtained. A process of ultrafiltration in diafiltration mode was developed to obtain the protein fraction in the concentrated and the fraction rich in lactose in the permeate. Both the influences of the added amount of diavolume and of the frequency of diavolumes addition were studied, in order to compare the productivities obtained in terms of permeation flows and apparent rejection coefficients. In the UF in DF mode tests, the water addition allowed the permeation flow to increase and enhance the solutes passage which, according to the MWCO, should not be retained, in this case, to promote the lactose permeation. Keywords: Whey pre-concentrated by reverse osmosis, Ultrafiltration/Diafiltration, Lactose, Protein, Rejection 1. Introduction The whey is an aqueous portion that separates from the clot during the conventional production of cheese or casein manufacture [1]. This by-product of the dairy industry has a high nutritional value, given by the presence of proteins with high essential amino acid content and relevant functional properties [2]. According to the literature, the whey can be classified as sweet or acid and its composition depends on
Transcript

1

Optimization of the ultrafiltration in diafiltration mode to reduce the lactose

content of protein concentrates

Sofia Ramos Cabral

[email protected]

Instituto Superior Técnico, Lisbon, Portugal

December 2015

Abstract

The main objective of this work is the separation and permeation of lactose present in whey previously

concentrated by reverse osmosis, to be able to do beverage fortification trials in the future, with purified

protein concentrates.

By the resistance model, it was found that the reversible resistance, which is associated with the

concentration polarization and the material deposition on the membrane surface that is not chemically

bonded to the membrane itself, is the one with the biggest contribution to the total resistance.

The process of fractionation by ultrafiltration of whey pre-concentrated by reverse osmosis was studied,

measured in terms of permeation flow and apparent rejections. Rejections of 0.89 of protein and 0.55 of

lactose were obtained.

A process of ultrafiltration in diafiltration mode was developed to obtain the protein fraction in the

concentrated and the fraction rich in lactose in the permeate. Both the influences of the added amount of

diavolume and of the frequency of diavolumes addition were studied, in order to compare the

productivities obtained in terms of permeation flows and apparent rejection coefficients. In the UF in DF

mode tests, the water addition allowed the permeation flow to increase and enhance the solutes passage

which, according to the MWCO, should not be retained, in this case, to promote the lactose permeation.

Keywords: Whey pre-concentrated by reverse osmosis, Ultrafiltration/Diafiltration, Lactose, Protein,

Rejection

1. Introduction

The whey is an aqueous portion that

separates from the clot during the conventional

production of cheese or casein manufacture [1].

This by-product of the dairy industry has a high

nutritional value, given by the presence of

proteins with high essential amino acid content

and relevant functional properties [2]. According

to the literature, the whey can be classified as

sweet or acid and its composition depends on

2

the type and method of manufacturing the

cheese. These two types of whey are defined by

reference to their final pH: acid whey has a pH ≤

5.1 while the sweet whey has a pH ≥ 5.6 [3]. The

typical composition of the sweet and acid whey

is in Table 1.

Table 1 – Composition of sweet and acid bovine

whey [4]

Parameter Acid Whey (%m/m)

Sweet Whey (%m/m)

Total solids 6,5 6,4

Water 93,5 93,7

Fat content 0,1 0,5

Protein 0,8 0,8

Lactose 4,9 4,9

Ash 0,8 0,5

Due to the high organic load of the whey, it

cannot be directly deposited on the soil or in

water curses and, therefore, its reuse eliminates

the environmental problem caused by the

disposal of this effluent [5]. Thus, it can be

inferred that not rational utilization of this by-

product is an anti-environmental practice and

consequently anti-economic.

The need to solve the problem of

environmental impact, caused by the production

of high volumes of this product, and the

recognition of the nutritional value of whey

made, from the sixties, new horizons for

enhancement of this product open, with the

development of membrane technologies. In fact,

since that time, appeared a wide variety of new

products extensively used by various industries,

including the food industry.

In the food industry, whey can be used in its

liquid form, protein concentrated, lactose

concentrated or powdered. Approximately 50%

of the world production of whey is treated and

added to various food products, of which 45% is

used in liquid form, 30% in the form of whey

powder, 15% as concentrated lactose and 10%

as concentrated protein [6].

It is estimated that European production of

whey, in 2013, was of 43 million tons [7]. On

average, for the production of one kilogram of

cheese ten liters of milk are required, with nine

liters of whey recovering [5]. Thus, it is assumed

that the generation of whey resulting from

cheeses produced in Portugal is relevant. About

0.11 million tons in 2013 [7].

The works studying the production of whey

derivative are crucial in order to explore new

capabilities of using it, while reducing their

environmental impact.

2. Experimental section

2.1 Materials

Whey. The whey used, previously

concentrated by reverse osmosis, was donated

by Queijo Saloio (Ponte de Rol, Torres Vedras,

Portugal). This raw material comes from a

cheese mix manufacture (milk from goat, cow

and sheep). It was added an aqueous solution of

hydrogen peroxide, commercially known as

oxygenated water, to the whey for preserving it

[8]. Subsequently, the raw material was cooled

at 4 ºC, in a refrigeration chamber.

Membranes. Commercial ultrafiltration

membranes GR95PP, supplied by Alfa Laval

Denmark, were tested. These membranes were

characterized in terms of pure water hydraulic

permeability, 𝐿!, in terms of apparent rejections

of reference solutes and in terms of molecular

weight cutoff (MWCO). The apparent rejection

coefficient, 𝑓, is defined as 𝑓 = (𝐶! − 𝐶!)/𝐶!,

where 𝐶! and 𝐶! are the feed and the permeate

concentrations, respectively. The 𝐿! is the value

3

of the slope of the linear variation of pure water

flux vs the transmembrane pressure. The

MWCO calculation is based on the results of

permeation experiments of solutions of

reference solutes (polyethylenoglycols of 1, 4,

and 6 kDa) with a concentration of 500 mg/L.

The MWCO is obtained by the intersection of the

curve of log (𝑓/(1 − 𝑓)) vs the solute molecular

weight with the 91% rejection line that

corresponds to a value of log (𝑓/(1 − 𝑓)) of 1.

The solute concentrations are determined

through total organic concentration (TOC)

measurements. The information related to the

characterization of the membrane is shown in

Table 2.

Table 2 - Characteristics of GR95PP membranes Membrane Gr95PP Material Polyethersulphone

𝐿! (𝐿/(ℎ ∙𝑚! ∙ 𝑏𝑎𝑟)) 1,21

MWCO (kDa) 7,5

Rejections (𝑓) to reference solutes, % NaCl 13 CaCl2 0,47

Na2SO4 70 Lactose 18

2.2 Procedure

Permeation Experiments. Lab-Unit M20,

represented in Figure 1, was used in the

permeation experiments with the membrane

GR95PP with a surface area of 0.072 m2. In

order to eliminate fluctuations and assure

reproducibility in the permeation essays, the

membranes were subjected to compaction

through permeation of pure water at a pressure

20% higher than the maximum operating

pressure to be used and for a period of 3 hours

[9].

Figure 1 - Plate and frame DSS Lab-Unit M20

The permeation of reference solutions

(polyethylenoglycols) for the membrane

characterization was performed at a

transmembrane pressure of 4 bar and using the

maximum circulation flow.

To evaluate the influence of the pressure in

the permeation flux, an experimental trial was

conducted at different pressures (1 - 40 bar). In

this trial, both the permeate and the retentate

were maintained in complete recirculation.

The permeation experiment of whey pre-

concentrated by reverse osmosis in

concentration mode was performed at the

transmembrane pressure of 12 bar. The

volumetric concentration factor, VCF, is defined

as the ratio of the initial volume to the final

volume of whey in the feed tank. The VCF was

varied from 1 up to 2.

The permeation experiments of whey pre-

concentrated by reverse osmosis in UF/DF

mode were performed at the transmembrane

pressure of 12 bar. The volumetric concentration

factor, VCF, is now defined as the initial volume

of the feed plus the accumulated volumes of DF

water added, divided by the final volume of whey

in the feed tank.

In all the permeation experiments the

stabilization time for each run was 30 minutes.

This corresponds to the time needed to achieve

a stable concentration in the permeate.

1 – Feed tank

2 –Valve

3 – Filter

4 – High pressure pump

5 – Valve for recirculation control

6 – Heat exchanger

7 – Manometer

8 – Membrane module

9 – Permeate outlet

10 – Pressure control

4

Membrane Cleaning. Membrane cleaning

followed the permeation experiments, in total

recirculation mode. This was performed with

deionized water at 40 oC for at least 2 hours. In

the case of that being ineffective (i.e., 8 hours

after washing) an alkaline cleaning with Ultrasil

10, 0,1% for 15 minutes at 40 oC, would take

place. The fluxes were compared with those

measured before the experimental runs and the

cleaning efficiency was assessed.

2.3 Analytical Methods

The physicochemical characterization of the

whey samples, the concentrated and the

permeated obtained from the UF and UF / DF,

was based on the Portuguese standards for

milk, since there are no specific standards for

the characterization of whey.

About the samples, the following

determinations were made: pH (Metrohm pH

meter); total solids, according to NP – 475

(1983) procedure; fat content in the whey was

determined using Geber’s butyrometric

determination, according to NP – 469 (1983)

procedure; protein by the Kjeldahl method,

according to NP – 1986 (1991) procedure; ash

content according to NP – 477 (1983) and

lactose through the balance:

𝐿𝑎𝑐𝑡𝑜𝑠𝑒 = 𝑇𝑜𝑡𝑎𝑙 𝑠𝑜𝑙𝑖𝑑𝑠 − 𝐴𝑠ℎ − 𝑃𝑟𝑜𝑡𝑒𝑖𝑛 − 𝐹𝑎𝑡 𝑐𝑜𝑛𝑡𝑒𝑛𝑡

(1)

3. Theory

3.1 The resistance in series model [10,11]

The variation of the ultrafiltration permeation

flux, 𝐽, as a function of the transmembrane

pressure is then given by:

𝐽 =∆𝑃𝜇 ∙ 𝑅!

(2)

where 𝜇 is the dynamic viscosity of the

permeate and 𝑅! is the total resistance. It is

considered that the total resistance results from

the intrinsic resistance of the membrane itself

(𝑅!), the reversible fouling resistance (𝑅!"#) and

the resistance to irreversible fouling (𝑅!""#$) Eq.

(3).

𝑅! = 𝑅! + 𝑅!"# + 𝑅!""#$ (3)

The membrane resistance corresponds to

the resistance the membrane offers to the

passage of pure water:

𝐽! =𝐿!𝜇!

∙ ∆𝑃 = ∆𝑃

𝜇! ∙ 𝑅!

(4)

where 𝜇! corresponds to the viscosity of

pure water at 25 °C. The viscosity of the water

considered in the calculations was 1,003 x 10-3

Pa.s [12].

The total resistance, 𝑅!, is obtained from the

permeation flow of the whey:

𝐽! = ∆𝑃

𝜇! ∙ 𝑅! (5)

where 𝜇! corresponds to the permeate

viscosity, which was taken as equal to the

viscosity of water at 25 °C.

The resistance to the reversible fouling is due

to the concentration polarization and to the

accumulation of solutes on the membrane

surface that are not chemically bound to it. The

resistance to the irreversible fouling is caused by

compounds absorbed on the surface or within

the pores of the membrane lying chemically

bound to it.

At the end of whey ultrafiltration trial water is

circulated at room temperature tangentially to

the membrane at a low pressure (approximately

1 bar) and a maximum circulation flow. After

5

washing, the permeation flux, 𝐽!∗, is determined

using pure water.

𝐽!∗ =∆𝑃

𝜇! ∙ 𝑅!∗ (6)

where 𝑅!∗ is the total resistance after

washing and corresponds to:

𝑅!∗ = 𝑅! + 𝑅!""#$ (7)

The value of the reversible resistance, 𝑅!"#,

is obtained by the difference between total

resistance, 𝑅! and the sum of 𝑅! with 𝑅!""#$.

3.2 Sizing equations in batch mode [13]

The variation of feed volume, 𝑉, over time, 𝑡,

is due to the permeate outlet, 𝐽, through the

permeation area, 𝐴, which is described by:

−𝑑𝑉𝑑𝑡

= 𝐽 ∙ 𝐴 (8)

The balance to the solute leads to the

following equation:

−𝑑 𝑉𝐶!𝑑𝑡

= 𝐽 ∙ 𝐴 ∙ 𝐶! (9)

where 𝐶! and 𝐶! are the solute concentration in

the concentrated and in the permeate,

respectively. In pressure driven membrane

processes is reasonable to assume that the

rejection coefficient, 𝑓, is independent from the

concentration factor. Assuming this hypothesis

and taking into account the previously presented

equations one can obtain:

𝑉𝑑𝐶!𝑑𝑉

= 𝑓 ∙ 𝐶! (10)

The separation and integration between

𝑉 = 𝑉! and 𝑉 = 𝑉! from Eq. (10) leads to the

following expression:

𝐶! = 𝐶! ∙

𝑉!𝑉!

!

(11)

That can also be described by:

𝐶! = 𝐶! ∙ 𝐹𝐶𝑉 ! (12)

where 𝐶! is the solute concentration in the

feed, 𝑉! is the initial volume of the feed and 𝑉! is

the concentrate final volume.

4. Results and discussion 4.1 Characterization of whey pre-

concentrated by osmosis

The whey concentrated by reverse osmosis

is sweet (pH close to 6.0) for what its

composition should be compared with the sweet

bovine whey, showed in Table 1.

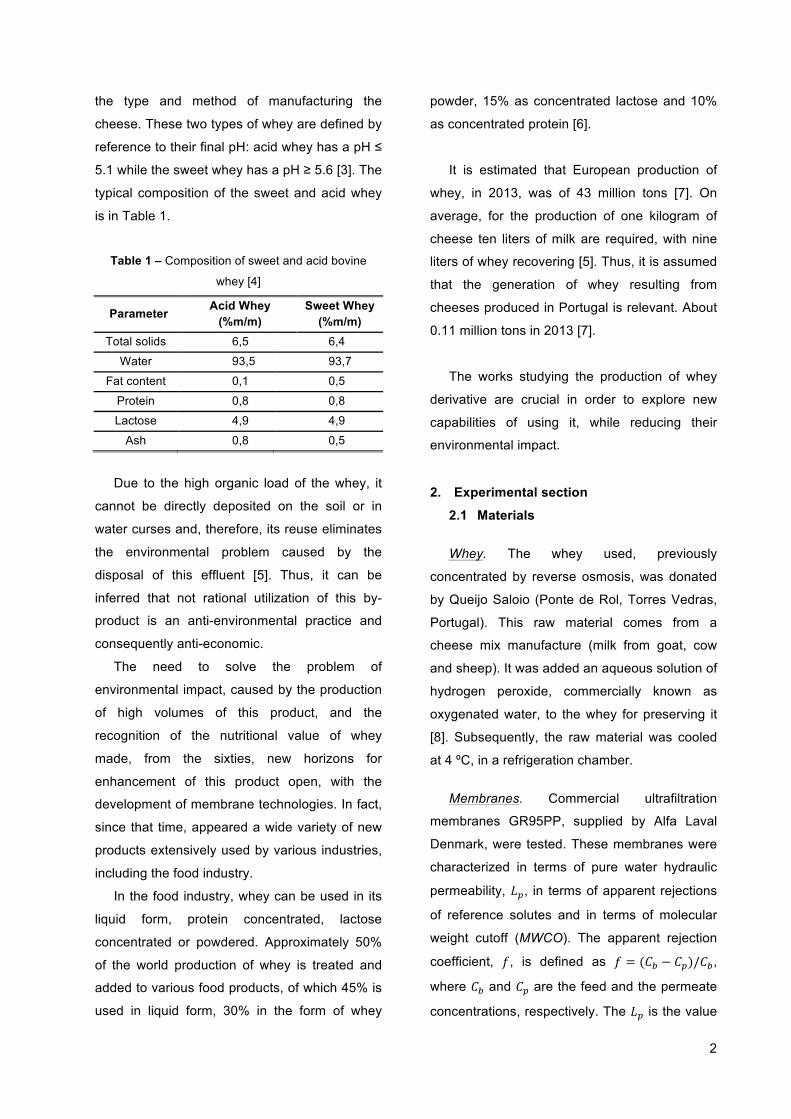
Table 3 – Typical composition of whey pre-concentrated by reverse osmosis

Parameter Content pH 6,07

Total solids (g/100g) 16,72 Fat content (g/100g) 0,30

Protein (g/100g) 2,00 Lactose (g/100g) 13,08

Ash (g/100g) 1,34

The whey concentrated by reverse osmosis

is richer in total solids (16,72 g/100g) when

compared to the bovine whey (6,4 g/100g),

mainly because of its richness in crude protein

(2,00 g/100g compared to 0,8 g/100g sweet

bovine whey) and lactose. The lactose content

obtained for this whey, 13,08 g/100g, is much

higher than the typical value of 4,9 g/100g,

present in the literature. These results can be

6

explained by the fact that the reverse osmosis

process allows only the passage of water and

certain salts. When the OI process, the whey

constituents such as lactose, protein and fat are

rejected, making the whey more concentrated,

this being the most obvious effect from the

results obtained. Alongside this, the fact that this whey is not

only from cow's milk, but a mixture of cow, goat

and sheep is another reason that explains the

big difference between the typical values of

bovine whey and the ones presented. These

differences may still be related or with the

composition of the original milk and/or with the

processes of making cheese, from which the

whey resulted.

4.2 Experiments in total recirculation

mode

In order to study the influence of the

transmembrane pressure on the permeation

fluxes of UF of whey pre-concentrated by

reverse osmosis, experiments in total

recirculation mode were carried out at the

maximum recirculation speed.

Figure 2 displays the variation of permeation

fluxes with transmembrane pressure. It is found

that the permeation flow increases with the

applied transmembrane pressure and that the

relationship between the permeation flow of the

whey and the transmembrane pressure is linear

up to 10-12 bar. From this value and up to 30

bar there is a deviation to the linearity. From 30

bar, it reaches a limit of 8,79 𝐿/(ℎ.𝑚!).

It is observed that the whey permeation flows

are always lower, in the examined pressure

range, and deviate increasingly from the

corresponding pure water flows as the pressure

increases, indicating that there are resistances

to the mass transfer beyond the intrinsic

resistance of the membrane, which is 2,97 x

1014 m-1. The deviation to the pure water

permeation flow is a result of the resistance to

the reversible resistance (4,27 x 10¹⁴ m-1), which

is due to concentration polarization and

accumulation of solutes on the membrane

surface that are not chemically bonded to it, and

the irreversible resistance (3,18 x 10¹³ m-1),

which corresponds to the adsorption of

compounds on the surface or within the

membrane pores and that are chemically

bounded to its material.

Figure 2 –Variation of permeation flux of whey pre-concentrated by reverse osmosis (Jp) and pure water (Jw) with transmembrane pressure. Installation Lab-Unit M20- Membrane: GR95PP; Membrane surface area: 0,072 m2;

Temperature: 25 oC; Maximum circulation speed

Jp = 0,48 ∆P R² = 0,96

Jp = 8,79

0,00

1,00

2,00

3,00

4,00

5,00

6,00

7,00

8,00

9,00

10,00

0,00

1,00

2,00

3,00

4,00

5,00

6,00

7,00

8,00

9,00

10,00

0 5 10 15 20 25 30 35 40 45

Jw (L

/(h.m

^2))

Jp (L

/(h.m

^2))

∆P (bar)

Whey Pure water

7

4.3 Experiments in concentration mode

The evaluation of the permeation flux in

concentration mode at the pressure of 12 bar is

displayed in Figure 3. For this test 5L of whey

pre-concentrated by reverse osmosis are used,

concentrating to a FCV of 2,00.

Figure 3 –Variation of permeation flux of whey pre-concentrated by reverse osmosis (Jp) with volumetric

concentration factor (VCF). Installation Lab-Unit M20- Membrane: GR95PP;

Membrane surface area: 0,072 m2; Pressure: 12 bar; Temperature: 25 oC; Maximum circulation speed

There was a decrease in permeation flux with

increasing FCV, which stabilizes at a constant

value (2,34 L/(h.m2)) starting at a volumetric

concentration factor of around 1,50. This

permeation flows decrease with the

concentration factor in volume is a characteristic

of tests in concentration mode and is a

consequence of the phenomena of

concentration polarization and/or fouling of the

membranes, which intensity increases with the

concentration.

The protein and lactose apparent rejection

coefficient, for the concentration factor of 2,00,

was 89% and 55%, respectively. These values

indicate that the membrane has a high selective

capacity for the protein, occurring almost

complete retention, and that lactose is

incorporated in the solution as the

concentrations of the other increases during the

test.

4.4 Experiments in diafiltration mode

Preliminary assessment of diafiltration

During the test 20% of pure water was

added, in relation to the volume observed in the

feed tank, when a decrease of 16% and 4% of

the permeation flow was observed, which

correspond to a FCV of 1,05 and 1,25,

respectively. Figure 4 represents the evolution of

the permeation flow and the feed volume with

time.

Figure 4 – Variation of permeation flux of whey pre-concentrated by reverse osmosis (Jp) and the feed

volume with time. Installation Lab-Unit M20- Membrane: GR95PP;

Membrane surface area: 0,072 m2; Pressure: 12 bar; Temperature: 25 oC; maximum circulation speed

The dilution of whey causes an increase of

the permeation flow in the first instant of the

concentration step. During the test it is found

that the flow decreases sharply to a low

volumetric concentration factor. The variation of

Jp = -13,38 FCV + 16,72 R² = 0,86

Jp = 2,34

2,20

2,40

2,60

2,80

3,00

3,20

3,40

3,60

1,00 1,20 1,40 1,60 1,80 2,00

Jp (L

/(h.m

^2))

FCV

1,00 1,05 2,10

VCF

Jp = -3,30 t + 5,20 R² = 0,84

Jp = 3,98

3,00

3,50

4,00

4,50

5,00

5,50

6,00

6,50

7,00

7,50

3,80

4,00

4,20

4,40

4,60

4,80

5,00

5,20

5,40

5,60

0,00 2,00 4,00 6,00 8,00 Fe

ed v

olum

e (L

)

Jp (L

/(h.m

^2))

Time (h)

Permeate flux Feed volume

1,25

8

the whey permeation flux over time shows an

asymptotic linear behaviour until 0,236 h where

𝐽! = −3,30 ∙ 𝑡 + 5,20. Although the water

additions do not allow the recovery of the flux

initially obtained, these successive water

additions allow the flow to not decrease

significantly during the test.

The variation of the apparent rejection

coefficients of lactose and protein with the

volumetric concentration factor (VCF) is shown

in Table 4.

Table 4 – Variation of the apparent rejection ratio of lactose and protein

VCF Lactose (%) Protein (%) 1,05 33 74

1,25 29 89

2,10 16 80

The results indicate that the rejection to

lactose tends to decrease with the concentration

factor. It can be concluded that the diafiltration

increased lactose permeation, reducing the

retention of this solute without compromising the

selectivity of protein by the membrane.

Optimization of UF/DF

ü Influence of the quantity of added

diavolume

Initially the pre-dilution of the whey pre-

concentrated by reverse osmosis was done, by

adding 40% of pure water relative to the volume

present in the feed tank. During the test 40% of

pure water was added for a 16% decrease of the

permeation flow, which corresponds to a FCV of

1,25 (Figure 5).

Figure 5 shows that the permeation flow

variation of whey over time has a linear

asymptotic behaviour until 0,233h, where

𝐽! = −1,40 ∙ 𝑡 + 4,17. It is observed that, for the

same time interval, the slope of 𝐽! of this test as

a function of time is less than the slope

observed for the linear relationship of the

preliminary evaluation test of the UF/DF. When

compared to the initial flow obtained in the

preliminary evaluation test of UF/DF, the initial

permeation flow obtained from this test is lower.

This is related to the composition of the whey

used in these two tests. The variation in the

apparent rejection coefficients of the lactose and

protein as a volumetric concentration factor

(VCF) is shown in Table 5.

Table 5 – Variation of the apparent rejection ratio of lactose and protein

VCF Lactose (%) Protein (%) 1,25 18 56

1,55 11 73

It was concluded that adding a larger quantity

of pure water causes a decrease in the protein

apparent rejection, when compared with the

preliminary UF/DF test, which translates into a

loss of this macromolecule to the permeate.

9

Figures 5 e 6 - Variation of permeation flux of whey pre-concentrated by reverse osmosis (Jp) and the feed volume

with time. Influence of the quantity of added diavolume (left) and Influence of the volume adding rate of the diavolume (right)

Installation Lab-Unit M20- Membrane: GR95PP; Membrane surface area: 0,072 m2; Pressure: 12 bar; Temperature: 25 oC; maximum circulation speed

ü Influence of the volume adding rate of

the diavolume

Initially the dilution of the whey pre-

concentrated by reverse osmosis was done, by

adding 20% of pure water relative to the volume

present in the feed tank. During the test, 20% of

pure water relative to the volume observed in

the feed tank was added 10, 20, 30 and 40

minutes after the beginning of the test (Figure

6). Successive additions of water in a short

period of time, not only interrupt the decrease of

permeation flow but also promote its increase.

The variation of the whey permeation flow over

time shows a linear asymptotic behavior until

0,210h, where 𝐽! = −1,07 ∙ 𝑡 + 4,39. It is

concluded that the decrease of permeation flow

in this test is significantly lower than the

decrease observed in the UF/DF preliminary

evaluation test, for a similar time interval. When

compared to the initial flow obtained in the

UF/DF preliminary evaluation test, the initial

permeation flow obtained in this test is lower.

This is related to the composition of the whey

used in these two tests.

The apparent rejection coefficients variation

of the lactose and protein as a volumetric

concentration factor (VCF) is shown in Table 6.

Table 6 – Variation of the apparent rejection ratio of lactose and protein

VCF Lactose (%) Protein (%) 1,07 34 70

1,09 23 88

1,12 18 90

1,14 17 95

1,32 18 98

It is verified that the rejection coefficient to

the protein rises as lactose rejection decreases

with increasing FCV. Successive additions of

pure water, in short time intervals, allow to get

1,00 1,25 1,55

VCF 1,12 1,00 1,07 1,09 1,14 1,32

VCF

Jp = -1,40 t + 4,17 R² = 0,97

Jp = 3,60

4,00

4,50

5,00

5,50

6,00

6,50

7,00

7,50

8,00

8,50

3,20

3,40

3,60

3,80

4,00

4,20

4,40

4,60

0,00 1,00 2,00 3,00 4,00 5,00 6,00

Feed

vol

ume

(L)

Jp (L

/(h.m

^2))

Time (h)

Permeate flux Feed volume

Jp = -1,07 t + 4,39 R² = 1,00

Jp = 4,48

2,00

2,50

3,00

3,50

4,00

4,50

5,00

5,50

6,00

6,50

4,00

4,20

4,40

4,60

4,80

5,00

0,00 0,30 0,60 0,90 1,20 1,50 1,80

Feed

vol

ume

(L)

Jp (L

/(h.m

^2))

Time (h)

Permeate flux Feed volume

10

high protein rejections and increasing, which

indicates that the retention to this solute is

almost total.

5. Conclusions

Throughout this work a process of

ultrafiltration in diafiltration mode was developed

and optimized to obtain the protein fraction in

the concentrated and the permeate fraction rich

in lactose in the permeated. In these tests, it

was found that the addition of pure water

increased the permeation flow and enhanced

the passage of solutes, which, according to the

MWCO, should not be retained, or by other

words, promote the lactose permeation.

It was found that the total resistance to mass

transfer is 7,55 x10¹⁴ m-1 for the whey pre-

concentrated by reverse osmosis, coming the

largest contribution to this resistance from the

reversible resistance (4,27 x10¹⁴ m-1).

Acknowledgements I would like to thank my thesis supervisors,

Profª. Maria Norberta de Pinho and Prof. Pedro

Louro, for all their knowledge and support.

I also thank my family and friends for always

supporting me.

References [1] Mizubuti, Ivone Yurika. 1994. «Soro de leite:

composição, processamento e utilização na alimentação.» Semina: Ci. Agr., Londrina 15 (1): 80–94.

[2] de Wit, J.N. 1998. «Nutritional and functional characteristics of whey proteins in food products.» Journal of Dairy Science 81 (3). Elsevier: 597–608.

[3] Gallardo-Escamilla, F J, a L Kelly, e C M Delahunty. 2005. «Sensory characteristics and related volatile flavor compound profiles of different types of whey.» Journal of Dairy Science 88 (8). Elsevier: 2689–99.

[4] Božanić, Rajka, Irena Barukčić, e Katarina Lisak. 2014. «Possibilities of whey utilisation.» Journal of Nutrition and Food Sciences 2 (7): 1–7.

[5] Barbosa, A. S.;, E. R.; Florentino, e I. M. Florêncio. 2010. «Utilização do soro como substrato para produção de aguardente: estudo cinético da produção de etanol.» Revista Verde De Agroecologia E Desenvolvimento Sustentável 5 (1): 7–25.

[6] González Siso, M. I. 1996. «The biotechnological utilization of cheese whey: a review.» Bioresource Technology 57 (1): 1–11.

[7] Observatory, Milk Market. 2014. «Annual production series of dairy products», n. October.

[8] Campbell, R E, E J Kang, E Bastian, e M a Drake. 2012. «The use of lactoperoxidase for the bleaching of fluid whey.» Journal of dairy science 95 (6). Elsevier: 2882–90.

[9] Costa, A. & Pinho, N. (2002). The role of membrane morphology on ultrafiltration for natural organic matter removel. Desalination, 145, 299-304.

[10] Cheryan, Munir. 1998. Ultrafiltration and Microfiltration Handbook. 2.a ed. USA: CRC Press.

[11] Habert, A. C., Piacsek, C. B. e Nobrega, R. 2006. Processos de Separação por Membranas. Editado por COPPE/UFRJ. Rio de Janeiro.

[12] Rezzadori, K. et al., Determinação das resistências ao fluxo de permeado na concentração de polissacarídeos de Agaricus subrufescens, UFSC, COBEQ, Buzios RJ.

[13] de Pinho, M., Integração de operações de membranas me processos químicos- Dimensionamento e optimização de equipamentos. Lisboa, 2012.


Recommended