Optimize GlassFish Performance in a Production Environment Performance White Paper February 2009 Abstract Sun GlassFish Application Server v2 is a high performance application server. This white paper will provide some guidance on how to tune the application server and is intended to be used as an introductory step to achieving better performance for your application. Eleven tuning parameters will be described with some general recommendations. These recommendations can be used to optimize the performance of the application server. These recommendations are followed by data from a benchmarking exercise that demonstrates the effectiveness of the tuning changes.
Transcript
Optimize GlassFish Performance in a Production EnvironmentPerformance White PaperFebruary 2009
Abstract
Sun GlassFish Application Server v2 is a high performance application server. This white paper will
provide some guidance on how to tune the application server and is intended to be used as an
introductory step to achieving better performance for your application. Eleven tuning parameters will
be described with some general recommendations. These recommendations can be used to optimize
the performance of the application server. These recommendations are followed by data from a
benchmarking exercise that demonstrates the effectiveness of the tuning changes.
Table of ContentsTip 1: Java Version....................................................................................................................................................... 4
Tip 2: JVM Mode...........................................................................................................................................................4
Tip 3: Java Heap Size...................................................................................................................................................4
Tip 4: Tune Java Garbage Collection............................................................................................................................5
Tip 5: HTTP acceptor threads....................................................................................................................................... 5
Tip 6: HTTP request processing threads.......................................................................................................................5
Tip 7: Keep Alive subsystem......................................................................................................................................... 6
Tip 8: HTTP File Cache.................................................................................................................................................6
Tip 9: Default-web.xml.................................................................................................................................................. 7
Tip 10: JDBC Tuning.....................................................................................................................................................8
Tip 11: Disable Access Logging.................................................................................................................................... 9
Specific Tuning for CoolThreadsTM Technology on Systems with UltraSPARCR T1/T2 ProcessorsSystem Specific
Tip 5 - HTTP Acceptor Threads...................................................................................................................................14
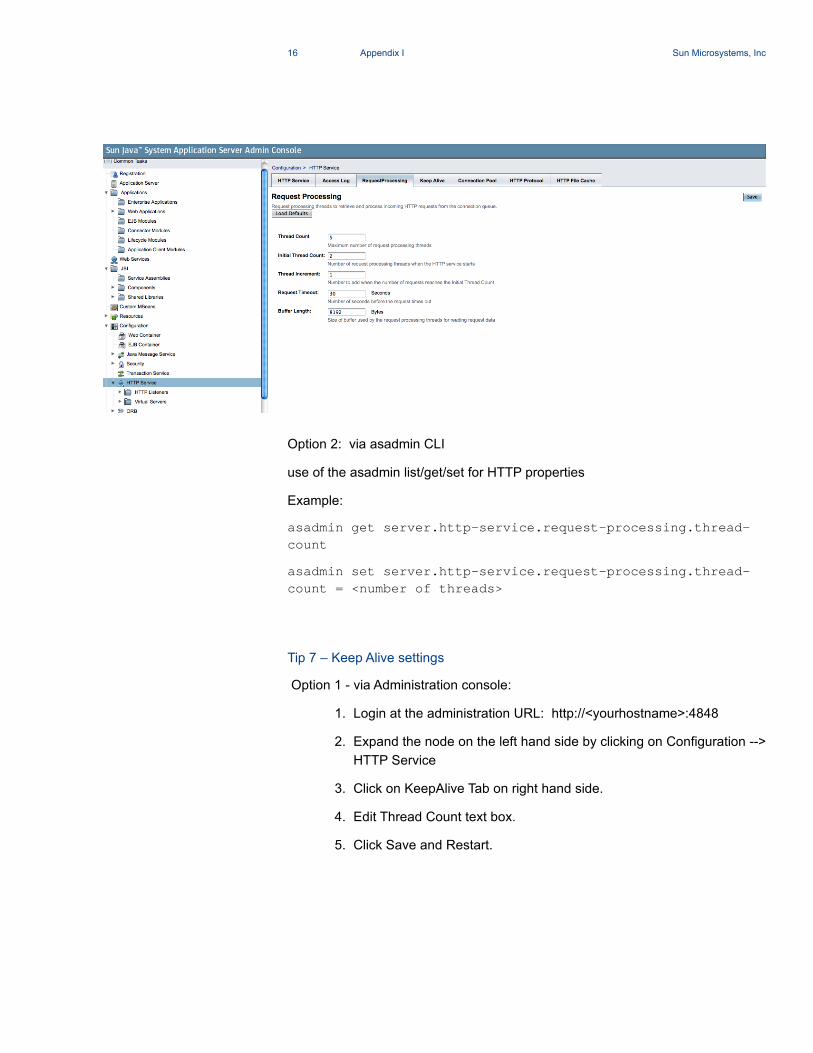
Tip 6 - HTTP Request Processing Threads................................................................................................................. 16
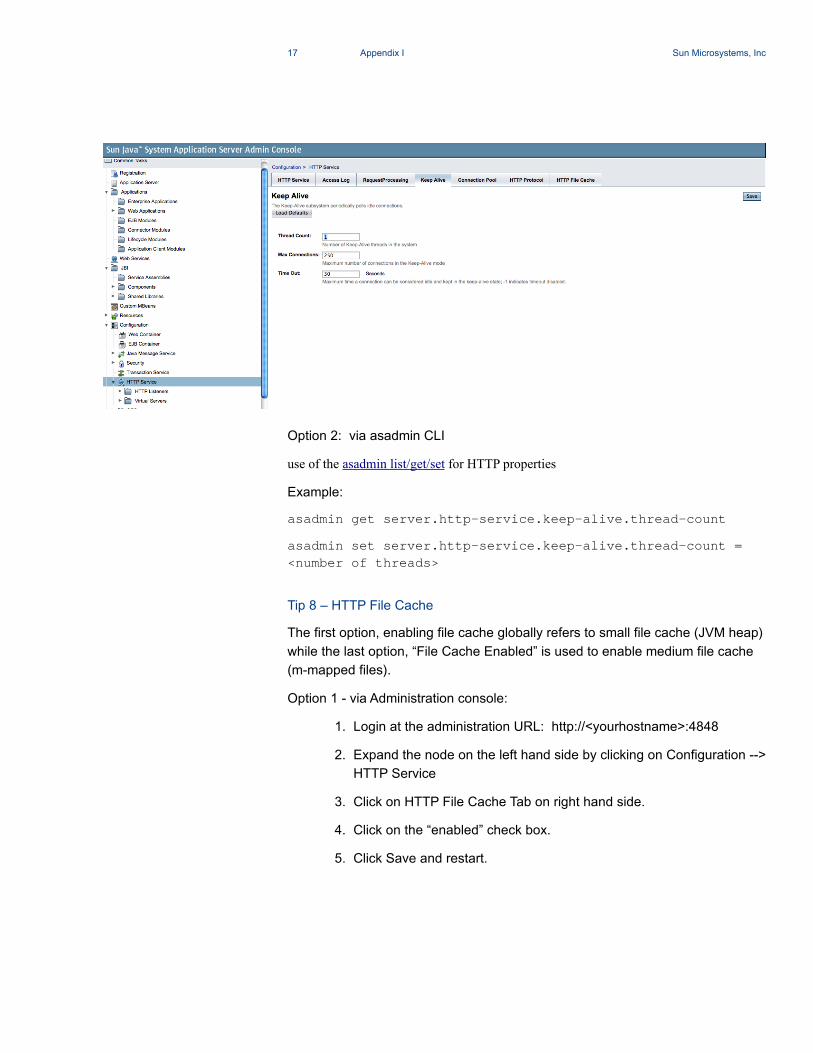
Tip 7 – Keep Alive settings...........................................................................................................................................17
Tip 8 – HTTP File Cache..............................................................................................................................................18
Tip 9 – Edit the default-web.xml...................................................................................................................................21
Tip 10 – JDBC Tuning..................................................................................................................................................21
Tip 11 – Disable Access Logging................................................................................................................................. 22
Tip for CoolThreads UltraSPARC T1/T2 Tuning...........................................................................................................23
Use libumem................................................................................................................................................................23
Use of FX scheduling class..........................................................................................................................................23
6. GlassFish Administration Guide 7. http://faban.sunsource.net/ 8. Tuning Garbage Collection with the 5.0 Java[tm] Virtual Machine 9. Ergonomics in the 5.0 Java[tm] Virtual Machine
Acknowledgments
Madhu Konda, Scott Oaks, Binu John, Suveen Nadipalli and Deep Singh for reviewing this white paper and the Java Performance Team for the contribution to the content.
Note – A third option is available for most of these tips although it is not a recommended. You can edit the domain.xml directly via your favorite text editor found in $GLASSFISH_HOME/domains/domain1/config where $GLASSFISH_HOME is the directory where you installed GlassFish. Proceed with caution as GlassFish may not start if your domain.xml is malformed.
Tip 1 - Changing Java version
To change Java version, edit the $GLASSFISH_HOME/config/asenv.conf.
Change the property called “AS_JAVA” to point to the desired Java version.
Tips 2-4 - Editing/Adding JVM options
To apply JVM options, you can use the following options:
Option 1: via Administration console:
1. Use the web browser URL: http:<yourhostname>:4848 (the default
admin port)
2. Login with administrator user and password (default
admin/adminadmin)
3. Click on Application Server node on the left hand side, JVM settings
tab on the right hand side, then JVM options.
4. Edit the desired JVM option (or add New) in the textbox.
5. Click Save on the right hand side
14 Appendix I Sun Microsystems, Inc
6. Restart GlassFish.
Option 2: asadmin CLI command
You can also use the CLI asadmin command to list, delete or create new
With your favorite text editor , edit the default-web.xml found in the directory
$GLASSFISH_HOME/domains/domain1/config.
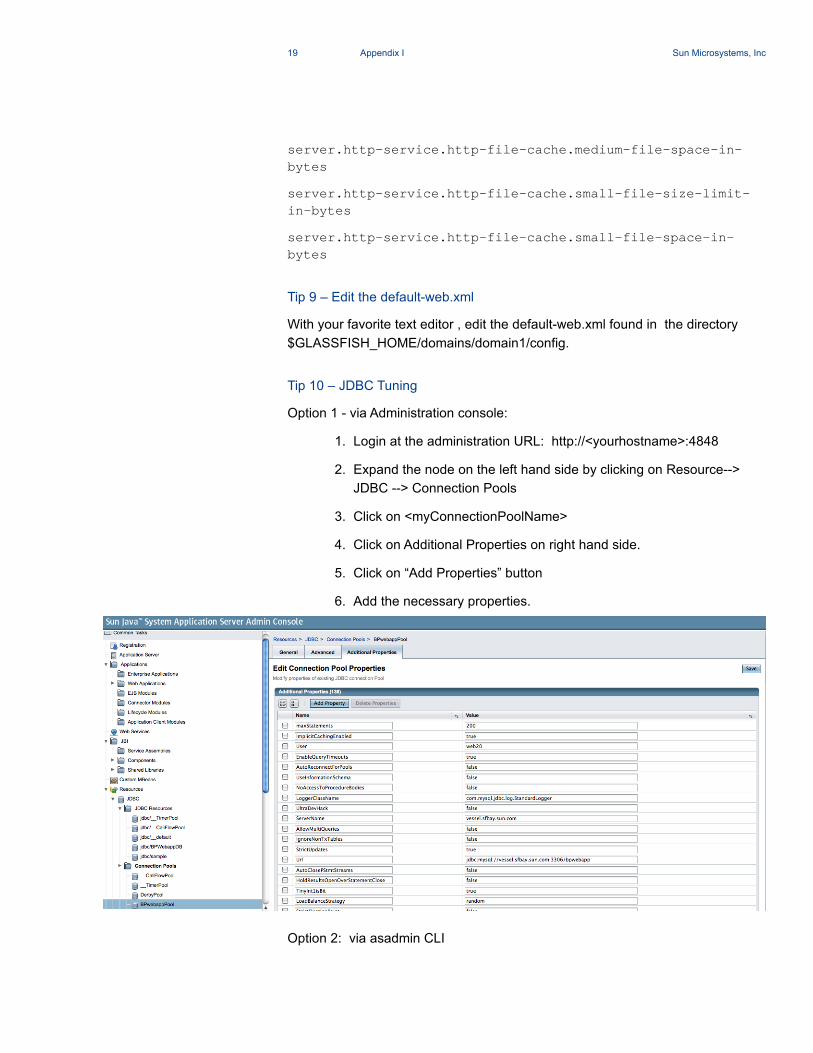
Tip 10 – JDBC Tuning
Option 1 - via Administration console:
1. Login at the administration URL: http://<yourhostname>:4848
2. Expand the node on the left hand side by clicking on Resource-->
JDBC --> Connection Pools
3. Click on <myConnectionPoolName>
4. Click on Additional Properties on right hand side.
5. Click on “Add Properties” button
6. Add the necessary properties.
Option 2: via asadmin CLI
20 Appendix I Sun Microsystems, Inc
use of the asadmin list/get/set for HTTP properties
Example:
asadmin set server.resources.jdbc-connection-pool.<mypoolname>.property.maxStatements=200
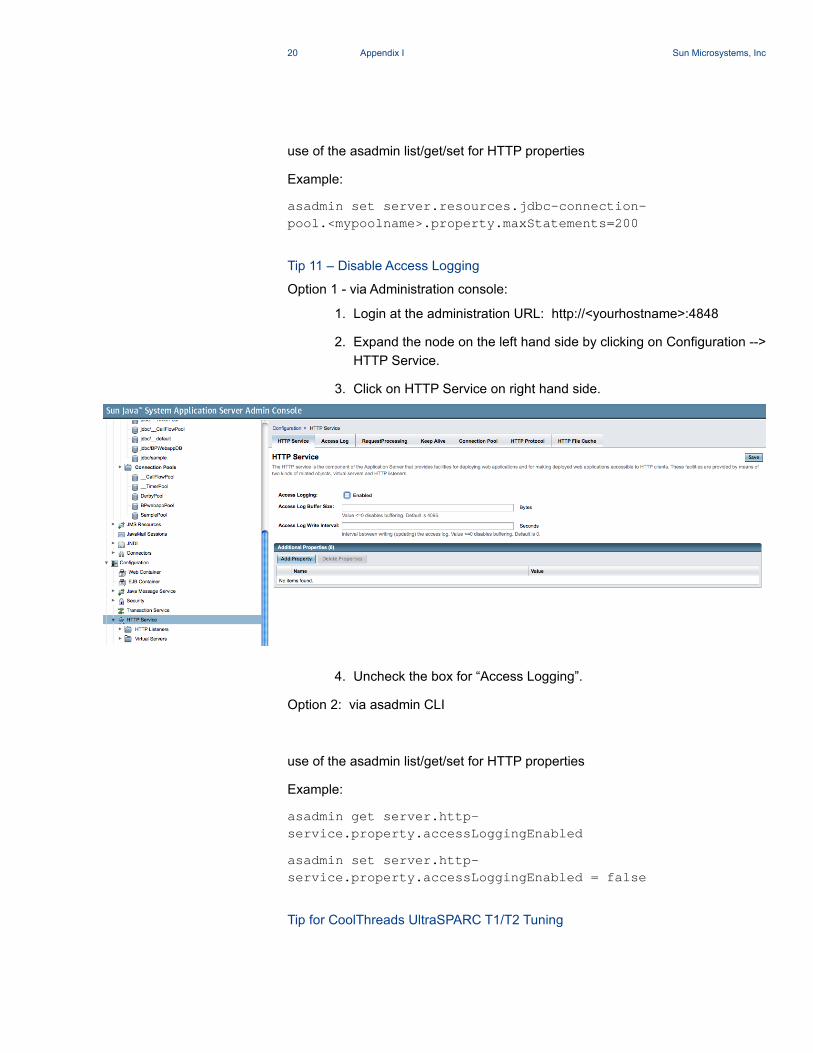
Tip 11 – Disable Access Logging
Option 1 - via Administration console:
1. Login at the administration URL: http://<yourhostname>:4848
2. Expand the node on the left hand side by clicking on Configuration -->
HTTP Service.
3. Click on HTTP Service on right hand side.
4. Uncheck the box for “Access Logging”.
Option 2: via asadmin CLI
use of the asadmin list/get/set for HTTP properties
Example:
asadmin get server.http-service.property.accessLoggingEnabled
asadmin set server.http-service.property.accessLoggingEnabled = false
Tip for CoolThreads UltraSPARC T1/T2 Tuning
21 Appendix I Sun Microsystems, Inc
Rotating access log
Separate the access logs, transaction logs and imq files onto as many disks as possible. If you have two disks, put the XA transaction logs (instance_directory/logs/tx) on one disk and the imq files (instance_directory/imq/instances/imqbroker/fs350) on another. If you have more disks, put the imqbroker txn file on a separate disk.
If you run multiple instances of the application server, move the logs for each instance onto separate disks as much as possible.
Mount the disk with these options: nologging,directio,noatime.
If the disks become a bottleneck, consider using an external disk with write cache.
Use libumem
To configure the GlassFish application server, see below:
For csh:env LD_PRELOAD=/usr/lib/libumem.so asadmin start-domain [arguments]
Use of FX scheduling class
On systems with UltraSPARC T1 processors, it is recommended to put the application server into the FX scheduling class. This standard feature of the Solaris OS is relevant on this platform because the default time quanta for scheduling doesn't match with the time quanta for processing a web request. By putting the application server in FX class, a simple web request is more likely to be processed within a single dispatch as it will not be preempted by a different thread, causing an increase in throughput.
1.Find the process ID of the GlassFish process:
ps -ef | grep appserv
2.Find the process ID of the MQ Broker daemon: ps -ef | grep mqbrokerd
3.For each process ID, execute:
/usr/bin/priocntl -s -c FX -m 59 -p 59 -i <process id of appserver>
Network Configuration
If you are using more than one network interface, then you will need to make sure that all the network interrupts are not going to the same core. Use the following script to enable interrupts on one strand and disable interrupts on the remaining three strands of a core. You can verify the processor state change with the prsinfo command.
Ex : psrinfo output before running the script
22 Appendix I Sun Microsystems, Inc
# psrinfo | more
0 on-line since 01/10/2008 15:06:01
1 on-line since 01/13/2008 13:50:00
2 on-line since 01/13/2008 13:50:00
3 on-line since 01/13/2008 13:50:00
.................
psrinfo output after running the script
0 on-line since 01/10/2008 15:06:01
1 no-intr since 01/13/2008 13:55:16
2 no-intr since 01/13/2008 13:55:16
3 no-intr since 01/13/2008 13:55:16
Table 6. Network interrupt script:
allpsr=`/usr/sbin/psrinfo | grep -v off-line | awk '{ print $1 }'` set $allpsr numpsr=$# while [ $numpsr -gt 0 ]; do shift numpsr=`expr $numpsr - 1` tmp=1 while [ $tmp -ne 4 ]; do /usr/sbin/psradm -i $1 shift numpsr=`expr $numpsr - 1` tmp=`expr $tmp + 1` done done