Page 1
Graduate Theses and Dissertations Iowa State University Capstones, Theses andDissertations
2017
Optimizing co-products production in dry-grindcorn fermentationLei FangIowa State University
Follow this and additional works at: https://lib.dr.iastate.edu/etd
Part of the Agriculture Commons, and the Food Science Commons
This Dissertation is brought to you for free and open access by the Iowa State University Capstones, Theses and Dissertations at Iowa State UniversityDigital Repository. It has been accepted for inclusion in Graduate Theses and Dissertations by an authorized administrator of Iowa State UniversityDigital Repository. For more information, please contact [email protected] .
Recommended CitationFang, Lei, "Optimizing co-products production in dry-grind corn fermentation" (2017). Graduate Theses and Dissertations. 15301.https://lib.dr.iastate.edu/etd/15301
Page 2
Optimizing co-products production in dry-grind corn fermentation
by
Lei Fang
A dissertation submitted to the graduate faculty
in partial fulfillment of the requirements for the degree of
DOCTOR OF PHILOSOPHY
Major: Food Science and Technology
Program of Study Committee:
Buddhi Lamsal, Co-major Professor
Tong Wang, Co-major Professor
Joey Talbert
Nuria Acevedo
Kurt Rosentrater
The student author and the program of study committee are solely responsible for the content of
this dissertation. The Graduate College will ensure this dissertation is globally accessible and
will not permit alterations after a degree is conferred.
Iowa State University
Ames, Iowa
2017
Copyright © Lei Fang, 2017. All rights reserved
Page 3
ii
TABLE OF CONTENTS
ACKNOWLEDGMENTS ............................................................................................................. iii
ABBREVIATIONS ....................................................................................................................... iv
ABSTRACT .................................................................................................................................... v
CHARPTER 1. GENERAL INTRODUCTION ............................................................................. 1
1 Dry-grind ethanol process ................................................................................................. 1
2 Distillers corn oil (DCO) .................................................................................................. 4
3 Dried distillers grain with solubles (DDGS) ..................................................................... 8
4 Objectives ....................................................................................................................... 10
References: ............................................................................................................................ 11
CHAPTER 2. SYNERGISTIC EFFECT OF SURFACTANTS AND SILICA
NANOPARTICLES ON OIL RECOVERY FROM CONDENSED CORN DISTILLERS
SOLUBLES (CCDS) .................................................................................................................... 13
Abstract: ................................................................................................................................ 14
1 Introduction ........................................................................................................................ 15
2 Materials and Methods ....................................................................................................... 17
3 Results and Discussion ...................................................................................................... 20
4 Conclusion ......................................................................................................................... 27
5 Acknowledgment ............................................................................................................... 27
References: ............................................................................................................................ 28
Tables and Figures ................................................................................................................ 30
CHAPTER 3. USE OF SURFACTANT AND HYDROLYZING ENZYMES IN DRY-GRIND
CORN PROCESSING IMPROVES ETHANOL YIELD AND DISTILLERS CORN OIL
RECOVERY ................................................................................................................................. 37
Abstract: ................................................................................................................................ 38
1 Introduction ........................................................................................................................ 40
2 Materials and Methods ....................................................................................................... 42
3 Results and Discussion ...................................................................................................... 46
4 Conclusion ......................................................................................................................... 53
5 Acknowledgment ............................................................................................................... 53
References: ............................................................................................................................ 54
Tables and Figures ................................................................................................................ 56
CHAPTER 4. EFFECTS OF USING HYDROLYZING ENZYMES DURING
FERMENTATION ON CHARACTERISTICS OF DRY DISTILLERS GRAIN WITH
SOLUBLES (DDGS) .................................................................................................................... 62
Abstract: ................................................................................................................................ 63
1 Introduction ........................................................................................................................ 64
2 Materials and Methods ....................................................................................................... 66
3 Results and Discussion ...................................................................................................... 71
4 Conclusion ......................................................................................................................... 78
5 Acknowledgment ............................................................................................................... 78
References: ............................................................................................................................ 79
Tables and Figures ................................................................................................................ 81
CHAPTER 5. GENERAL CONCLUSION .................................................................................. 86
Page 4
iii
ACKNOWLEDGMENTS
I would like to thank my major professors, Drs. Buddhi Lamsal and Tong Wang, and my
committee members, Drs. Joey Talbert, Nuria Acevedo, and Kurt Rosentrater, for their guidance
and support throughout the course of this research.
In addition, I would also like to thank my family, friends, colleagues, the department
faculty and staff for making my time at Iowa State University a wonderful experience. I want to
also offer my appreciation to ISU Fermentation Institute and Bioeconomy Institute, who
provided funding for my research, without your support, this thesis would not have been
possible.
Page 5
iv
ABBREVIATIONS
CCDS Condensed Corn Distillers Solubles
C500 Dry-grind ethanol process of using 500 ppm Tween® 80 in corn slurry
DCO Distillers Corn Oil
DDGS Dried Distillers Grain with Solubles
F500 Dry-grind ethanol process of using 500 ppm Tween® 80 in corn slurry and
Fermgen enzyme in fermentation step
FAA Free Amino Acid
HLB Hydrophilic-Lipophilic-Balance
ISU Iowa State University
NSPs Non-Starch Polysaccharides
PC Pectinase and Cellulase mix
PC500 Dry-grind ethanol process of using 500 ppm Tween® 80 in corn slurry and
pectinase and cellulase enzymes in fermentation step
WHC Water Holding Capacity
Page 6
v
ABSTRACT
To improve the profitability of the industry, ethanol plants are capturing the values of
coproducts, including distillers corn oil (DCO) and dry distillers grain with solubles (DDGS).
Current oil recovery method can only recover 40% of oil contained in corn, which needs to be
improved along with DDGS quality. This study explores the use of surfactants and hydrolyzing
enzymes to improve oil recovery and DDGS quality. Our research has shown that the use of non-
ionic surfactants in dry-grind ethanol process affected oil partition in thin stillage and improved
final oil yield. The surfactant replaced protein from the emulsion interface and formed an un-
stable oil-in-water emulsion, and silica nano-particle enhanced the demulsification by using
surfactant. Surfactants also significantly improved the oil partition in thin stillage by washing the
adhering oil from wet cake surface into liquid phase. The synergistic effect between hydrolyzing
enzyme and surfactant was observed on oil recovery from condensed corn distillers solubles
(CCDS). Using protease, cellulase and pectinase enzymes hydrolyzed the non-fermentable
components (protein and non-starch polysaccharides) and improved ethanol production yield and
increased oil partition in thin stillage. The use of protease enzyme decreased oil recovery from
CCDS and this reduction can be overcome by using surfactant during fermentation step. The
enzyme treatments also have significant effects on DDGS properties, especially on the
digestibility. Protease enzyme treated DDGS had low protein content and protein digestibility.
Whereas, pectinase and cellulase treated DDGS was easy to digest and provided higher amount
of required amino acids compared to other treatments. Overall, the methods for improving DCO
recovery were successfully developed and the effects of hydrolyzing enzymes on DDGS quality
were also determined. The results of this research point to novel ways to modify production
strategies for ethanol plants to enhance profitability.
Page 7
1
CHARPTER 1. GENERAL INTRODUCTION
1 Dry-grind ethanol process
The proportion of the US corn harvest used as the feed stock for fuel ethanol has reached to 35% in
2015, and is expected to maintain stable in the next decade by USDA Agricultural projections to 2024. To
produce corn-based fuel ethanol in United States, two methods are widely used, dry-grind and wet mill,
and dry-grind production accounts for about 90% of the total production of 2015. In 2015, 4.6 billion
bushels of corn was used for fuel ethanol production in dry-grind ethanol process, and only 0.5 billion
bushels of corn was used in wet mill fermentation reported by Grain Crushings and Co-Products
Production 2015 Summary. In this dissertation, we only discuss the dry-grind corn ethanol process.
The conventional dry-grind ethanol process includes five basic steps, which are grinding, cooking,
liquefaction, saccharification and fermentation (Figure 1). The hammer mill or roller mill is used to do the
grinding, the grinding helps to break the tough outer shells of the corn and increase the availability of the
starch. Once the corn is broken, it is mixed with water for the corn slurry of 30% solid content. The corn
slurry goes through cooking and liquefaction. The cooking step gelatinized corn starch and forms a
viscous suspension at temperature above 100°C following by liquefaction, in which α-amylase hydrolyzes
long chains of starch into smaller chains and reduce viscosity at lower temperature (80- 90°C). After
liquefaction, saccharification is needed to further hydrolysis to glucose at 30°C by gluco-amylase for
fermentation. The chemical reaction of fermentation by yeast is where one mole of glucose yields 2 moles
of ethanol and 2 moles of carbon dioxide. The common yeast to use is saccharomyces cerevisiae, which is
a unicellular fungus. The fermentation takes place in tank at 30-32°C for 2-3 days in a batch process
(Bothast and Schlicher, 2004). Supplemental nitrogen/ or protease is added for N requirement of yeast.
Page 8
2
Also, it is possible to do saccharification and fermentation in one step, which is called simultaneous
saccharification and fermentation. Both gluco-amylase and yeast are added into fermentation tank. As the
glucose is formed, it is fermented, which reduces enzyme product inhibition. It lowers initial glucose
concentrations, lowers contamination risk, lowers energy requirements, and produces higher yields of
ethanol. Because the simultaneous saccharification and fermentation is done in one unit, it can also
improve capital costs and save residence time.
Dry-grind corn ethanol industry was very profitable in the past. However, due to the sharp decline in
crude oil price, the profits from corn ethanol in 2015 fell sharply (Irwin and Good, 2015; Wisner, 2015).
Since the ethanol plants are still in the low margin time for ethanol, the additional revenue from co-
products are becoming more important for plants to survive. Two main co-products are produced from
this process, including distillers corn oil (DCO) and dried distillers grain with solubles (DDGS).
Page 9
3
Figure 1. Process diagram of the conventional dry-grind ethanol process
Page 10
4
2 Distillers corn oil (DCO)
DCO is an excellent feed stock for biodiesel plants and energy source in animal feed. The production
of DCO has increased over the years especially since 2008 (Jayasinghe, 2015). In 2015, 1.4 million tons
of DCO was produced from dry-grind plants in United States (Grain Crushings and Co-Products
Production 2015 Summary), and the main markets for the DCO are biodiesel plants and the animal feed
industries. Until today, the DCO already becomes the second most popular feedstock choice in the
biodiesel industry, surpassing the usage of canola oil and following the soybean oil. The DCO revenue
has been key in times of very low margin periods for ethanol plants, most recently seen when crude oil
price crashed from early 2015 to present.
To extract DCO with low cost, DCO is currently only extracted from the thin stillage stream. As
described in U. S. patent 7601858 (Cantrell and Winsness, 2009), after distillation and decanting (Figure
1), thin stillage is further evaporated into condensed corn distillers solubles (CCDS) with 60~85%
moisture content, and the DCO is extracted from the CCDS by a disk stack centrifuge. Theoretically, there
are two ways to improve the DCO final yield, 1) improving oil recovery rate from CCDS; and 2)
increasing oil partitioning in thin stillage (Wang, 2008)
2.1 DCO extraction from CCDS
The DCO yield from centrifugation alone has not been satisfactory, because DCO presents in
different forms in CCDS, including oil-in-water emulsion, surface adhering oil, oil in oil bodies and oil in
unbroken cells (Majoni and Wang, 2010). In this case, other treatments on CCDS before centrifugal
separation may be beneficial to achieve higher oil yield.
To get a higher oil yield, some efforts have been applied, including physical, chemical and enzymatic
treatments on CCDS. Corn protein had very important role on stabilizing oil in CCDS. Enzyme treatments
have been tested on CCDS for improving oil recovery, and an increase of 45% more oil recovery from
Page 11
5
CCDS was observed when a protease was added in CCDS (Majoni et al. 2010b). Moreover, Majoni et al.
(2010a) reported a sharp increase of oil recovery from CCDS when temperature was increased to 60°C,
and no more increase was found when temperature was higher than 60°C. This observation indicated that
a partition of oil is present in protein stabilized oil-in-water emulsion. In addition, the co-extraction for
DCO and zein protein significantly increased oil recovery from 68% to 89%, which further proved the
function of corn protein on oil stabilization in CCDS (Majoni et al., 2010a).
Many other methods were tested to improve oil recovery from CCDS, including adjusting pH and
churning (Majoni et al., 2010 a). However, many of these treatments are non-practical for industry-level
processing, since potential time and money cost could be high for doing these treatments on CCDS. To
date, the acceptable method for ethanol plants to improve oil recovery is adding chemical aids into CCDS
before centrifugation. Numbers of chemical aids have been designed for oil recovery from CCDS
including FoodPro SA9843 corn oil yield improver (General Electric, Trevose, PA, USA), PTV M-5309
corn oil extraction aid (Ashland Chemical, Covington, KY, USA), Ashland DPI-428 (Ashland Hercules
Water Technologies, Wilmington, DE, USA), and Hydri-Maize Demulsifier 300 (Hydrite Chemical Co.,
Waterloo, IA, USA). However, detailed composition of commercial aid packages and mechanism of
action are lacking.
To extract more oil from CCDS, it is necessary to understand the mechanism of increasing oil
recovery by using oil extraction aids. Since protein plays a critical role on stabilizing oil in CCDS, one
way to eliminate the function of protein as a stabilizer is to replace it by surfactant, which is the theory of
protein-surfactant competition. Wilde et al. (2004) summarized that surfactants, which have lower
molecular weight, are more surface active than proteins and will compete for a position on interfacial
surface with protein. However, a high concentration of protein on the interfacial surface contributes to a
strong interaction among protein molecules, and this interaction affects the stability of protein stabilized
Page 12
6
emulsion (Mackie et al., 1999). High concentration of protein on emulsion interface forms a viscoelastic
layer, and this layer is much stronger than the surfactant layer. When the surfactant replaces the position
of protein, the viscoelastic layer can be interrupted and make the emulsion unstable. This theory has been
utilized in a few studies of aqueous extraction processing to improve vegetable oil recovery. Campbell
and Glatz (2009) observed a significantly higher soybean oil yield when sodium dodecyl sulfate (SDS)
was applied by disrupting a viscoelastic protein film at oil droplet interface. Zhang and Wang (2016)
significantly improved peanut oil yield from 50% to 76% by adding Tween 20 into peanut paste and they
proposed that Tween 20 competed with peanut protein on emulsion interface and make the emulsion
unstable.
Solid particles have been mentioned by Sheppard et al. (2012) to be a functional enhancer in
commercial oil extraction aid. Solid particles can be used in emulsification or demulsification in oil-in-
water emulsion (Binks, 2002), and the synergistic effect of using mixtures of surfactants and particles on
emulsification stability draw attentions (Nesterenko et al., 2014). Solid particles are usually used as
enhancer in anti-foaming package. In de-foaming, mixture of solid particles and hydrophobic oil has
higher penetration ability on interface than using them alone (Koczo et al., 1994). When solid particle and
hydrophobic oil penetrate the interface, an unstable oil-bridge can be formed in the interface, which
makes the interface unstable and eventually break (Denkov, 1999). Since the de-foaming and
demulsification share similar mechanism, the method of de-foaming by using solid particles could be
applied on demulsification.
2.2 DCO partition in thin stillage
After decanting, there is still a large portion of oil staying in the wet cake. In this case, methods of
breaking cell structure might be efficient to improve oil partition in thin stillage. Wang et al. (2008)
examined the effects of corn grinding methods on oil distribution in thin stillage, and found the flaked and
Page 13
7
then extruded corn meal released the highest amount of free oil which was 25% compared to 7% for the
average of other treatments.
Enzyme hydrolysis might be a more efficient way to improve oil partition without any changes on
current plant design compared to mechanical treatments; it has been applied on dry-grind ethanol plants
mainly for improving ethanol yield, but increasing DCO recovery has also been claimed. For example,
FermgenTM (Dupont) is an acid proteolytic enzyme which can randomly hydrolyze corn protein to
enhance yeast efficiency in dry-grind fermentation; OlexaTM (Novozymes) is an acid proteolytic enzyme
which targets on oleosin protein and helps to extract more DCO; AvantecTM, which is a protease involved
enzymatic product from Novozymes, claims for higher ethanol yield and oil recovery yield. The benefits
of enzyme hydrolysis on oil partitioning have been corroborated by the scientific literatures.
Luanthongkam et al. (2015) reported an increase of oil partition in thin stillage from 32% to 78% when
protease, phytase and non-starch hydrolyzing enzyme were used during fermentation. Yao et al. (2014)
observed significantly higher oil partition (60%) in thin stillage when a blend of polysaccharide
hydrolyzing enzymes was used, compared to 56% in the control. Wang et al. (2009) used protease and
cellulase during fermentation and 70% oil partition in thin stillage was achieved, compared with 50% in
the control. However, high oil partition in thin stillage can’t be translated to high oil recovery from
CCDS. No reports were found on how enzyme hydrolysis of non-fermentable matters affects oil recovery
from CCDS.
Moreover, part of the corn oil presents in surface adhering oil during fermentation (Majoni and
Wang, 2010), and the surface adhering oil is highly likely to stay with wet cake after decanting step. In
this case, surfactant can be used as detergent to move this part of oil from solid surface to liquid phase.
Combining the effects of surfactant on emulsion stability in CCDS and washing out adhering oil on
wet cake surface, surfactant might be an appropriate choice to improve both oil partition and oil recovery.
Page 14
8
3 Dried distillers grain with solubles (DDGS)
DDGS is another valuable co-product from dry-grind ethanol process, and it is an excellent and low
cost alternative feed ingredient. The high energy, protein, and phosphorus contents of DDGS provide
excellent animal health and food product quality. Due to these characteristics, DDGS becomes one of the
most popular feed ingredient to use in animal feeds around the world to partially replace some of the
expensive ingredient, such as whole corn, soybean meal and phosphorus ingredients.
3.1 DDGS production
The conventional procedure of making DDGS is shown in Figure 1. After distillation, the whole
stillage is decanted into thin stillage and wet cake. Thin stillage is further concentrated into CCDS, and
DCO might be recovered as a co-product from it. The CCDS still contains high moisture (65~70%) and
solids with high nutritional value, such as yeast cells and very small corn particles. In this case, CCDS is
mixed with wet cake, and even DDGS from previous batches, to reduce the moisture content in the
mixture before going to rotary drum drier. The final DDGS product generally contains approximately
10% of moisture, 12% of crude fat, 30% of crude protein and 40% of fiber. Due to the yeast fermentation
which converts starch into ethanol, the starch concentration of DDGS (5%) is significantly lower than that
of corn (63.4%), and other compositions become relatively high, including protein is concentrated about
3.6 times; fat, 3.4 times; ash, 3.3 times; and fibers, 2.9 times (Liu, 2009).
Ethanol producers often add hydrolyzing enzymes during fermentation to improve ethanol yield, and
these enzymes function on hydrolyzing non-fermentable matters, including protein and cell wall
components, to make starch more available and enhance yeast efficiency. Most of the non-fermentable
matters in corn finally go into the DDGS after the processing, and effects of enzyme hydrolysis on DDGS
quality are not clear.
Page 15
9
3.2 DDGS digestibility
The concentration of gross energy in DDGS is greater than in corn. The average gross energy in 10
samples of DDGS was measured by Pedersen et al. (2006), which was 5434 kcal per kg dry matter. This
value is greater than that in corn (4496 kcal per kg dry matter). However, the digestibility of energy in
DDGS is lower than that in corn, which makes DDGS having similar digestible and metabolizable energy
to corn. The low digestibility of energy in DDGS is the result of the high fiber content and low fiber
digestibility (Stein, 2006). DDGS is a diet with high fiber content. For mono-gastric animals, the major
concern for high fiber diet is the association between high fiber content and decreased nutrient utilization
and low net energy values (Noblet and Le Goff, 2001). Dietary fiber is edible but resistant to digestion
and absorption in the gastrointestinal tract of mammalians. Moreover, these carbohydrates are not only in-
digestible to gastrointestinal tract enzymes, but they also reduce digestibility of nutrients, such as crude
protein, lipid, and starch (Gutierrez et al., 2014; Zhang et al., 2013).
Non-starch polysaccharides (NSPs) hydrolyzing enzymes, including glucanase, cellulases,
hemicellulases and pectinase, have been successfully used in mono-gastric diets to degrade certain cereal
components in order to improve the nutritional value of feed. The presence of high levels of NSPs results
in poor feed conversion rate, slow weight gain, and sticky droppings by yound animals. Addition of
enzyme during feed production was found to markedly improve the digestion and absorpion of feed
components as well as weight gain (Cowan, 1996; Hesselman et al., 1982; Rexen, 1981; Walsh et al.,
1993). Omogbenigun et al. (2004) supplemented an enzyme cocktail (cellulase, galactanase, mannase, and
pectinase) to a wheat-based diet fed in 6 kg pigs and observed an improvement in growth rate and feed
efficiency. Kim et al. (2003) utilized a carbohydrase enzyme mixture (α-1,6-galactosidase and β-1,4
mannanase) in corn-soybean meal based diets fed to nursery pigs and reported an improvement in feed
efficiency in two trials. Enzyme treatment on DDGS was only reported by Vries et al. (2013), who
Page 16
10
confirmed the function of cell wall degrading enzyme on DDGS when the DDGS was treated directly by
the enzyme. They observed improved protein digestibility of DDGS in an in vitro model of pig.
Furthermore, cell wall degrading enzymes have potential use in dry-grind ethanol process. In a U.S.
patent, Abbas and Bao (2016) have proposed to use cellulolytic enzyme in dry-grind ethanol process for
high ethanol yield. Using cell wall degrading enzymes during fermentation might be able to produce easy-
to-digest DDGS and lead to high ethanol yield.
Moreover, acid-stable protease is widely used in dry-grind ethanol plants and commercially available
on the market, such as FermgenTM and others which described in the previous paragraph. However, no
research has been done on the effects of proteolysis during fermentation on the properties of DDGS. Due
to the low margin of ethanol, revenue of DDGS becomes more important than before. Ethanol producers,
who understand the effects of processing methods on the DDGS characteristics, could have more
advantages on quality control and pricing to this co-product.
4 Objectives
Therefore, the objectives of this research are 1) to investigate the effects of surfactant based chemical
aids on DCO recovery from CCDS, 2) to design new methods, including using surfactant and enzyme, for
improving oil partition in thin stillage and oil recovery from CCDS, and 3) to identify the effects of
enzyme hydrolysis during fermentation on DDGS characteristics.
Page 17
11
References:
Abbas, C., Bao, W., 2016. Cellulolytic enzyme enhancement of dry-grind corn processing and ethanol
production. U. S. Patent 9, 416, 377 B2.
Belyea, R. L., Rausch, K. D., Tumbleson, M. E. 2004. Composition of corn and distillers dried grains with
solubles from dry-grind ethanol processing. Bioresource Technol. 94, 293-298.
Belyea, R. L., Rausch, K. D., Clevenger, T. E., Singh, V., Johnston, D. B., Tumbleson, M. E., 2010.
Sources of variation in composition of DDGS. Anim. Feed Sci. Technol. 159, 122-130.
Binks, B. P., 2002. Particles as surfactants- similarities and differences. Current Opinion. Colloid
Interface Sci. 7, 21-41.
Bothast, R. J., Schlicher, M. A., 2004. Biotechnological processes for conversion of corn into ethanol.
Appl. Microbiol. Biotechnol. 67:19-25.
Cantrell, D. F., Winsness, D. J. 2009. Method of processing ethanol byproducts and related subsystems.
U. S. Patent 7, 601, 858 B2.
Campbell, K., Glatz, C., 2009. Mechanisms of aqueous extraction of soybean oil. J. Agric. Food Chem.
57, 10904-10912.
Cowan, W. D., 1996. Animal feed. In: Godfrey T, West S, editors. Industrial Enzymology. 2nd ed.
London; Macmillan Press, pp. 360–71.
Denkov, N. D., 1999. Mechanisms of action of mixed solid-liquid antifoams. 2. stability of oil bridges in
foam films. Langmuir. 15, 8530-8542.
Grain Crushings and Co-Products Production 2015 Summary – National Agricultural Statistics Service.
http://usda.mannlib.cornell.edu/usda/current/GrnCrushAnn/GrnCrushAnn-03-01-2016.pdf
Gutierrez, N.A., Serao, N.V.L., Derr, B.J., Zijlstra, R.T., Patience, J.F., 2014. Relationships among dietary
fiber components and the digestibility of energy, dietary fiber, and amino acids and energy content
of nine corn coproducts fed to growing pigs. J. Anim. Sci. 92, 4505-4517.
Hesselman, K., Elwinger, K., Thomke, S., 1982. Influence of increasing levels of b-glucanase on the
productive value of barley diets for broiler chickens. Animal Feed Sci. Technol. 7, 1–8.
Irwin, S., Good, D., 2015. Ethanol production profits: The risk from lower prices of distillers grains.
http://farmdocdaily.illinois.edu/2015/03/ethanol-production-profits-risk-of-distillers-grains.html
(October 13, 2015).
Jayasinghe, S. Distillers corn oil market: Oligopsony. 2015. http://www.decision-
innovation.com/blog/disinsights/distillers-corn-oil-market-oligopsony/. Accessed 30 December
2016.
Kim, S. W., Knabe, D. A., Hong, K. J., Easter, R. A., 2003. Use of carbohydrases in corn-soybean meal-
based nursery diets. J. Anim. Sci. 81, 2496-2504.
Koczo, K., Koczone J. K., Wasan, D. T., 1994. Mechanisms for antifoaming action in aqueous systems by
hydrophobic particles and insoluble liquids. J. Colloid Interface Sci. 166, 225-238.
Liu, K. S. 2009. Effects of particle size distribution, compositional and color properties of ground corn on
quality of distillers dried grains with solubles (DDGS). Bioresour. Technol. 100, 4433-4440.
Luangthongkam, P., Fang, L., Noomhorm, A., Lamsal, B., 2015. Addition of cellulolytic enzymes and
phytase for improving ethanol fermentation performance and oil recovery in corn dry-grind process.
Ind. Crop. Prod. 77, 803-808.
Majoni, S., Wang, T. 2010 a. Characterization of oil precipitate and oil extracted from condensed corn
distillers soluble. J. AM. Oil Chem. Soc. 87, 193-199.
Majoni, S., Wang, T., Johnson, L. A., 2010 b. Enzyme treatments to enhance oil recovery from condensed
corn distillers solubles. J. Am. Oil Chem. Soc. 88, 523-532.
Page 18
12
Nesterenko, A., Drelich, A., Lu, H., Clausse, D., Pezron, I., 2014. Influence of a mixed particle/surfactant
emulsifier system on water-in-oil emulsion stability. Colloids and Surfaces A. Physicochem. Eng.
Aspects. 14, 49-57.
Noblet, J., Le Goff, G.I., 2001. Effect of dietary fibre on the energy value of feeds for pigs. Anim. Feed
Sci. Technol. 90, 35-52.
Omogbenigun, F. O., Nyachoti, C. M., Slominski, B. A., 2004. Dietary supplementation with
multienzyme preparations improves nutrient utilization and growth performance in weaned pigs. J.
Anim. Sci. 82, 1063-1061.
Pedersen, C., Boersma, M. G., Stein, H. H., 2007. Digestibility of energy and phosphorus in 10 samples of
distillers dried grain with solubles fed to growing pigs. J. Anim., Sci. 85, 1168-1176.
Scheimann, D. W., Kowalski, A. S., 2009. Method of dewatering thin stillage processing streams. U. S.
Patent 7, 497, 955.
Sheppard, P. W., Pankonen, M., Gross, J. T., 2012. Chemical additives and use thereof in stillage
processing operations. U. S. Patent, 2012/0245370.
Stein, H., 2006. DDGS: energy and nutrient content and digestibility. Midwest Swine Nutrition
Conference (2006), 58-65.
USDA Agricultural Projections to 2024 – Interagency Agricultural Projections Committee.
https://www.usda.gov/oce/commodity/projections/USDA_Agricultural_Projections_to_2024.pdf
Vries, S.D., Pustjens, A.M., Kabel, M.A., Salazar-Villanea, S., Hendriks, W.H., Gerrits, W.J.J., 2013.
Processing technologies and cell wall degrading enzymes to improve nutritional value of dried
distillers grain with solubles for animal feed: an in vitro digestion study. J. Agric. Food Chem. 61,
8821-8828.
Walsh, G.A., Power, R. F., Headon, D. R., 1993. Enzymes in animal feed industry. Trends Biotechnol, 11,
424–30
Wang, T., 2008. Recovering oil from corn ethanol fermentation by-products. Lipid Technol. 20, 203-207.
Wang, H., Wang, T., Johnson, L. A., Pomettolll, A. L., 2008. Effect of the corn breaking method on oil
distribution between stillage phases of dry-grind corn ethanol production. J. Agric. Food Chem. 56,
9975-9980.
Wang, H., Wang, T., Johnson, L. A. 2009. Effect of low-shear extrusion on corn fermentation and oil
partition. J. Agric, Food Chem. 57, 2302-2307.
Wisner, R. 2015. Impact of low ethanol prices on the corn market.
http://www.agmrc.org/renewable_energy/energy/impact-of-low-ethanol-prices-on-the-corn-market/
(October 13, 2015)
Yao, L., Luangthongkam, P., Wang, T., Lamsal, B., Fei, T., Wang, H., Johnson, L.A., Dasari, M., 2014.
Improved corn ethanol fermentation and oil distribution by using polysaccharide hydrolyzing
enzymes. J. Bioprocess Eng. Biorefinery. 3, 323-331.
Zhang, S, Wang, T., 2016. Destabilization of emulsion formed during aqueous extraction of peanut oil:
synergistic effect of Tween 20 and pH. J. Am. Oil Chem. Soc. 93, 1551-1561.
Zhang, W., Li, D., Liu, L., Zhang, J., Duan, Q., Yang, W., Zhang, L., 2013. The effects of dietary fiber
level on nutrient digestibility in growing pigs. J. Anim. Sci. Biotechnol. 4, 1-7.
Page 19
13
CHAPTER 2. SYNERGISTIC EFFECT OF SURFACTANTS AND SILICA NANOPARTICLES
ON OIL RECOVERY FROM CONDENSED CORN DISTILLERS SOLUBLES (CCDS)
Published at Industrial Crops and Products
Lei Fang, Tong Wang*, and Buddhi Lamsal
Food Science and Human Nutrition Department
Iowa State University
Ames, Iowa, USA, 50011
*corresponding author:
Tong Wang, Professor
2312 Food Sciences Building
Ames, IA 50011
Tel: 515-294-5448
Email: [email protected]
Page 20
14
Abstract:
Most of the oil in condensed corn distillers solubles (CCDS) is in an emulsified form and centrifugation
alone is not sufficient to recover the oil in high yield. The synergistic effect between non-ionic surfactants
(Tween® 80 and Span® 80) and silica nanoparticles (hydrophilic and hydrophobic) on oil recovery was
investigated using 3 batches of commercial CCDS. The use of surfactant mixture with Hydrophilic-
Lipophilic-Balance (HLB) value of 9.7 led to the highest oil recovery. Tween® 80/silica and surfactant
mixture (HLB 9.7)/silica recovered 5 ~ 10 % more oil compared with the control groups. However,
Span® 80/silica was not effective. Surfactant mixture/silica made the oil recovery by centrifugation more
efficient by destabilizing oil-in-water emulsion and washing out free oil droplets. The distribution of
different types of oil was significantly affected by centrifugation conditions, heating, shaking, and
surfactant and silica addition. About 20% of total oil remained in the unbroken cells or germ pieces in
CCDS, which is unrecoverable without additional treatment.
Keywords: Condensed corn distillers solubles (CCDS), oil distribution, oil recovery, silica nanoparticle,
Span® 80, synergistic effect, Tween® 80.
Highlights:
The use of Tween® 80/Span® 80 mixture led to highest oil recovery at ratio 1:1, w:w;
Synergistic effect between surfactant and silica nanoparticles was demonstrated;
CCDS properties contributed to the oil recovery performance;
Processing treatments, including centrifuge, heating, shaking and demulsifier addition, significantly
affected distribution of different types of oil in CCDS.
Page 21
15
1 Introduction
Condensed corn distiller solubles (CCDS) is produced by evaporating thin stillage in the dry-grind
corn ethanol fermentation process. It typically contains 65% moisture, 14% protein and 20% oil on a dry
weight basis (Majoni et al., 2011). The oil recovery from corn fermentation has seen an impressive growth
in recent years due to the thriving ethanol process and the need from biofuel industry to increase revenue.
Distillers corn oil usage had 62% growth for biodiesel in 2013 and 105% growth in 2012 compared to the
previous years (Scott et al., 2014).
Dried distillers grain with solubles (DDGS) is used as animal feed which is a dried blend of CCDS
and wet cake from decanting operation. However, it has been reported that the high residual oil in DDGS
may interfere with milk production in dairy cattle and lead to undesirably soft pork belly in swine (Wang
et al., 2009). In this case, recovery of the oil from CCDS is desirable for dry-grind fermentation industry
to make a low fat content DDGS. The recovered oil can be either adding back to DDGS for animal having
specific energy requirement or making biofuel. That will make the dry-grind fermentation product more
flexible to be used and more profitable for the producers.
CCDS is a viscous mixture which contains protein, lipid, fine fiber and residual starch (Kim et al,
2007). There are four possible forms of oil in the CCDS based on preliminary study and understanding
(Majoni et al., 2011): (1) protein and phospholipid stabilized oil-in-water emulsion, (2) small oil droplets
that are bound to hydrophobic particles or surface, (3) oil bodies in the unbroken corn particles, and (4) oil
bodies released from broken cells. Centrifugation is a common means to separate oil from CCDS in corn
fermentation industry (Moreau et al., 2012), but the complex interaction of oil with other components
makes this method inefficient in recovering the total oil. Thus, several types of chemical demulsifying
aids are currently used in corn-based ethanol plants. Chemical aid is easy to use and relatively effective in
improving oil recovery from CCDS. A number of demulsifiers have been designed for oil recovery from
Page 22
16
corn stillages, including FoodPro SA9843 corn oil yield improver (General Electric, Trevose, PA, USA),
PTV M-5309 corn oil extraction aid (Ashland Chemical, Covington, KY, USA), Ashland DPI-428
(Ashland Hercules Water Technologies, Wilmington, DE, USA), and Hydri-Maize Demulsifier 300
(Hydrite Chemical Co., Waterloo, IA, USA). Such additives include alcohol-based compounds (Gallop et
al., 2012), polymeric materials (Scheimann et al., 2009), and surfactants (Sheppard et al., 2012). Addition
of solid particles as an optional aid was mentioned in an US patent 20120245370 (Sheppard et al., 2012).
However, detailed composition of commercial demulsifier packages and mechanism of action are lacking.
Solid particles can be used as a demulsifying agent, but it has a different mechanism of action than
that of surfactants. Theoretically, the solid particles can be partially wetted by both phases in an emulsion
and the preferred emulsion type is determined by the wet preference for hydrophilic or hydrophobic phase
(Binks, 2002). The contact angle of the solid particle on emulsion interface is equivalent to HLB value of
surfactant. Different from surfactants, which stabilize emulsions by reducing the oil-water interfacial
tension, the solid particles affect the stability by providing a steric barrier at the interface and changing the
rheological properties of the emulsions and interfaces (Binks, 2002). The use of mixtures of surfactants
and particles for demulsification has attracted attention for possible synergistic interactions (Nesterenko et
al., 2014). By adsorbing onto solid surface, surfactant molecules can transform a hydrophilic surface to a
hydrophobic one and vice versa, or a charged surface to an uncharged one (Kwok et al., 1993).
Studies examining the interactive effect of surfactants and particles on emulsion stability in food and
petroleum applications have been reported (Binks and Rodrigues, 2007; Tambe and Sharma, 1993;
Drelich et al., 2010). However, no research has been seen to investigate the interactive behavior between
surfactants and solid particles when they are blended together as an enhanced demulsifier, and the
demulsification behaviors of this mixture has not been systematically studied yet.
Page 23
17
The objectives of this research were to understand the synergistic effect between surfactants
(Tween® 80 and Span® 80) and silica nanoparticle (hydrophilic and hydrophobic) on corn oil recovery
from CCDS, and to investigate the distribution of different types of oil in CCDS as affected by oil
recovery treatments.
2 Materials and Methods
2.1 Condensed Corn Distillers Solubles (CCDS)
Three batches of CCDS were obtained from LincolnWay Energy (Nevada, IA) at three different times
within a year, and they were stored in a walk-in refrigerator at 4°C and used as quickly as we could.
Small amount of sodium azide was added to prevent mold and bacteria growth. These three batches of
CCDS contains 65-73% moisture, 15-22% fat and 18-22% protein (dry weight basis).
2.2 Chemicals and Other Materials
A hydrophilic non-porous silica nanoparticle, 6808NM, and a hydrophobic silica nanoparticle,
6864HN were purchased from SkySpring Nanomaterials Inc (Houston, TX, USA). The hydrophilic
nanoparticle 6808NM has 20 nm particles size and unmodified natural surface. The hydrophobic silica
nanoparticles 6864 HN has 10-20 nm particle size and has chemically treated super-hydrophobic surface.
Hexanes, Span® 80 (sorbitan monooleate), Tween® 80 (polysorbate 80), hydrochloride acid, sucrose,
sodium chloride and 100% pure cotton cheesecloth were purchased from Fisher Scientific (Fairlawn, NJ,
USA).
2.3 CCDS characterization
Total oil content, solid content and particle size distribution were measured for the 3 batches of
CCDS. Total oil content was determined by acid hydrolysis method (AOAC, 1992), and it was used as the
base to calculate oil recovery. Solid content was determined by weight difference after oven-drying at
105°C for 5 h. The particle size distribution profiles of the 3 batches CCDS were determined by using a
Page 24
18
Mastersizer-2000 particle size analyzer (Malvern Instruments Ltd, Worcestershire, UK) with a wet
module (Hydro 2000). The CCDS sample was diluted with DI water to an obscuration range of 11-14% as
recommended by the manufacturer.
2.4 Effect of surfactant HLB on oil recovery from CCDS
Surfactants with different HLB values were obtained by mixing Span® 80 and Tween® 80 at
following ratios by weight: Span® 80 to Tween® 80 ratio of 1:0, 4:1, 2:1, 1:1, 1:2, 1:4, and 0:1. The HLB
value of the blend was calculated by using the following equation:
HLBa × Ra + HLBb × Rb = HLBt (ICI American, 1984),
Where “a” is surfactant a; “b” is surfactant b; R is ratio by weight of surfactant a or surfactant b; and t is
combined surfactant mixture.
The HLB values of resulting surfactant mixtures are shown in Table 1. Surfactant mixture of 0.04 g
was mixed with 40 g of CCDS (equivalent to 1000 ppm) in a 250-mL centrifuge bottle. This application
level was chosen based on the suggested dosage of commercial demulsifiers at 500-1500 ppm in CCDS.
All samples were placed in a shaking water bath (Model R-76, New Brunswick Scientific Co. Inc., NJ,
USA) at 80-85°C for 10 min with 100 rpm shaking speed. Immediately following heating and shaking
treatment, oil separation was completed by using a Centra MP4 centrifuge (International Equipment
Company, Needham Heights, MA, USA) at 3000 xg for 10 min. The top free oil was transferred by
washing the top surface of liquid with hexane (5 times of washing of top layer using 20, 20, 10, 10, 5 mL
hexanes at each time). Removal of solvent was completed using an air stream at 90°C. Residual solvent
was removed by using an isotemp oven (Fisher scientific, Fairlawn, NJ, USA) at 110°C for 1.5 h. The
weight of the oil was determined gravimetrically. Two replicates were applied for each of the three
batches of CCDS.
Page 25
19
2.5 Synergistic effect between surfactants and silica nanoparticles on oil recovery from CCDS
Surfactants, including Tween® 80, Span® 80 and Tween® 80/Span® 80 mixture at 1:1 ratio (M),
were mixed with hydrophilic silica nanoparticles, or hydrophobic silica nanoparticles at 2.5, 5, 7.5, 10,
12.5% w/w of silica concentration in surfactant. The nanoparticles were dispersed in surfactant by using
sonication at 30% power (Misonix Sonicator 3000, Farmingdale, NY) for 15 min and followed by mixing
with magnetic stirrer overnight. Then, 0.04 g mixture of silica and surfactant was added into 40 g CCDS
in 250-mL centrifuge bottle to give 1000 ppm concentration. All samples were placed in a shaking water
bath, at 80-85°C for 10 min with 100 rpm shaking speed. The oil separation procedure was the same as
section 2.4.
2.6 Effects of treatments on distribution of different types of oil in CCDS
The CCDS samples were treated by different treatments (Table 2), including different centrifuge
force (3000 xg and 4000 xg), heating (85°C) and shaking (100 rpm), and demulsifier (Tween® 80/Span®
80 mixture at 1:1 ratio with 2.5% hydrophilic silica). The effects of these treatments on the distribution of
different types of oil in CCDS were evaluated with the following method.
The method for separating different types of oil in CCDS was adapted based on Kapchie and others’
work (Kapchie et al., 2008). CCDS of 10 g was mixed with 7 mL NaCl-sucrose solution (1M NaCl and
0.8M sucrose) in a 50-mL centrifuge tube. The mixture was shaken gently by hand for 15 s and was
centrifuged at 4000 xg for 30 min to separate the different types of oil as illustrated in Figure 1. Four
layers were formed after centrifugation, including free oil, oil body, oil-in-water emulsion and solid
residue, and the free oil in this section was the same with “total oil recovery” in other sections. The top
free oil was removed by hexane washing (4 times with 5 mL for each time). Following hexane washing,
the oil body (fat pad) and oil-in-water emulsion was filtered by using 4 layers cheesecloth. The residue on
cheesecloth was oil body which was transferred into a 250-mL Erlenmeyer flask together with one layer
Page 26
20
of cheesecloth. The liquid fraction was oil-in-water emulsion and remained in a 250-mL Erlenmeyer
flask. The solid residue in centrifuge tube was transferred into a 250-mL Erlenmeyer flask with water.
The total oil content in oil body, oil-in-water emulsion and solid residue were determined by the acid
hydrolysis procedure (AOAC, 1992). The amount of oil in free oil layer was measured gravimetrically
after removing solvent.
2.7 Statistical Analysis
Significant differences among treatments were tested by using the statistical analysis software IBM
SPSS statistics 19 (Armonk, NC, USA) and One-way analysis of variance (ANOVA). The Least
significant differences (LSD) were calculated at P = 0.05.
3 Results and Discussion
3.1 CCDS characteristics
For the different batches of CCDS, solid content ranged from 27 to 30%, total oil contents ranged
from 17 to 24% on dry weight basis as shown in Table 3. Particle size distributions of the 3 batches CCDS
are shown in Table 5. The third batch of CCDS had significantly smaller particle size and more particles
distributed under small particle size than the first and second batches of CCDS. The second batch CCDS
had no significant difference from the first batch CCDS. However, a numerically smaller particle size of
second batch CCDS was found comparing with that of the first batch.
3.2 Effect of CCDS characteristics on oil recovery
No relationship was found between total oil content and oil recovery in these three batches of CCDS
(Table 3). The third batch of CCDS had the lowest oil content but the highest oil recovery. The first batch
had similar total oil content but significantly lower oil recovery compared to the second batch.
Page 27
21
However, oil recovery may relate to the average particle size and particle size distribution in CCDS.
The first batch of CCDS had a larger average particle size and followed by the second batch of CCDS,
and the third batch of CCDS had the smallest particle size. Unlike the demonstrated effect of corn meal
particle size on corn fermentation and oil recovery, for which the smaller meal size did not help oil
recovery from fermentation beer (Wang et al., 2009), the smaller particle size of the CCDS related to
higher amount of oil recovered. Part of corn oil and oil body in CCDS was trapped in unbroken germ
cells, and attached to broken cell wall or corn protein complex (Majoni et al., 2011). When the particle
size was reduced, the size of these complexes may have been reduced and released the trapped oil.
3.3 Effect of surfactant HLB on oil recovery from CCDS
The optimal HLB value for demulsifying CCDS was investigated. Non-ionic surfactants, Tween® 80
and Span® 80 used in various ratios gave a set of different HLB values of the resulting surfactant
mixtures. The HLB value had significant effect on oil recovery from CCDS as shown in Figure 2. In first
batch of CCDS, the oil recovery was increased when the HLB value was increased from 4.3 to 9.7 and
decreased when HLB was higher than 9.7. A similar trend was found in the second batch of CCDS but not
in the third batch. The third batch of CCDS had significantly higher oil recovery (72%) than the first
(55%) and the second (65%) batches of CCDS when no surfactant was added, which may weaken the
effect of surfactant due to less extra recoverable oil in CCDS. Rondon et al (2006) reported an observation
in a demulsifying water-in-oil emulsion study, and indicated that the optimum demulsifier formulation
was the surfactant mixture having the same affinity for both hydrophilic and hydrophobic phases. Our
HLB of 9.7 being the best agreed with this observation.
The HLB value is an empirical scale which intends to describe the balance of the hydrophilic and
lipophilic groups of a surfactant (Rondon et al., 2006). Based on emulsifier’s performances in making
emulsion, it is widely accepted that HLB < 8 indicates a hydrophobic compound that results in a water-in-
Page 28
22
oil emulsion. On the other hand, if a surfactant’s HLB is greater than 12, it is a hydrophilic surfactant and
will best form an oil-in-water emulsion. Moreover, a systematic research by Boyd et al (1972) indicated
that there is a minimum HLB for stability of oil-in-water emulsions, which is about 10. In our system,
protein is the major stabilizer for oil-in-water emulsion in corn fermentation co-product, CCDS.
Surfactant is very surface active and can replace a portion of protein on the emulsion interface (Wilde et
al., 2004). However, surfactant with HLB 9.7 is not a good emulsion stabilizer, instead, it breaks the
emulsion and release the oil after replacing a portion of protein on the emulsion interface. The finding
from this optimization experiment provides new information to the industry in modifying their current use
of Tween® 80 demulsifier, i.e., to make it more hydrophobic for achieving the best oil recovery.
3.4 Synergistic effect between surfactant and silica nanoparticle on oil recovery from CCDS
Commercial demulsifying agents may contain hydrophobic solid particles, such as hydrophobic silica
and wax particles, probably due to the synergistic effect between them (Sheppard et al., 2012). However,
no evidence has been shown that hydrophilic silica cannot work when mixed with surfactant. Therefore,
we conducted a systematic study to investigate the interaction between surfactant and silica nanoparticles
for their effect on oil extraction.
As shown in Figure 3, Tween® 80 had significantly synergistic effect with both hydrophilic and
hydrophobic silica in oil recovery. However, this effect was influenced by CCDS characteristics. The oil
recovery was significantly improved when Tween® 80 and silica (of both hydrophilic and hydrophobic)
mixture was added in the first and the second batch of CCDS. No effects of silica concentrations were
found when Tween® 80 mixed with hydrophilic or hydrophobic silica was used for the third batch CCDS.
Due to the high oil recovery in the control of the third batch of CCDS, only a numerical but not significant
increase was found.
Page 29
23
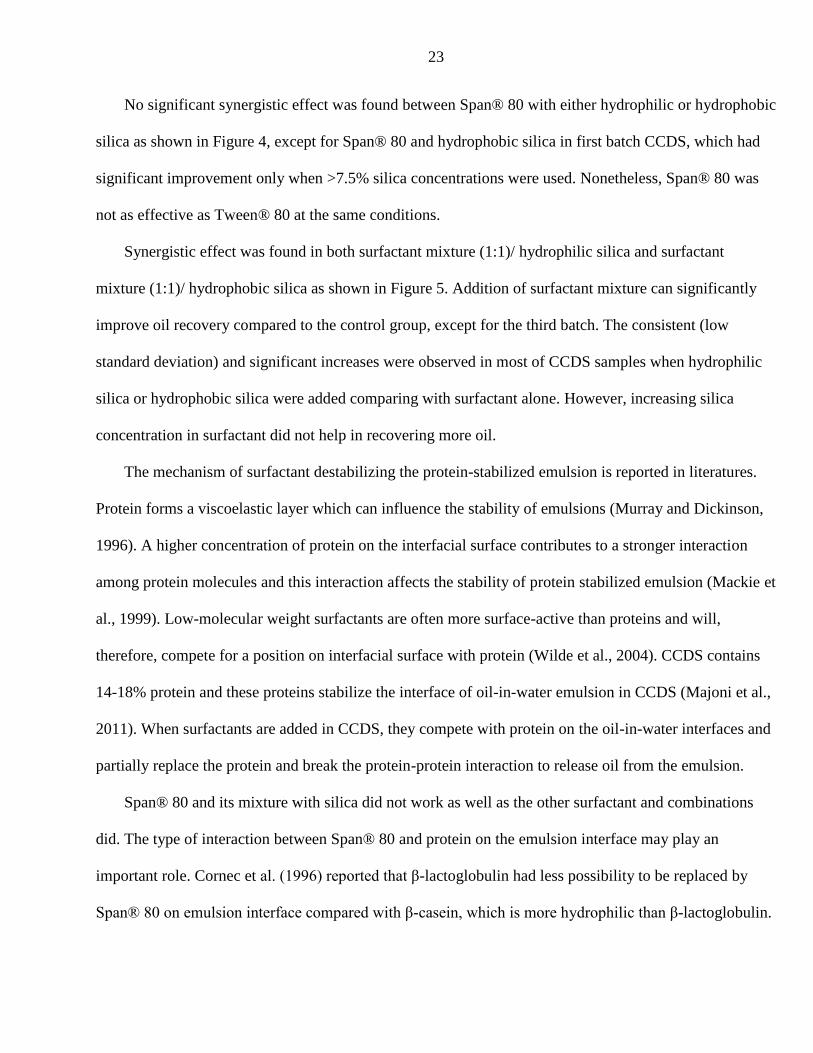
No significant synergistic effect was found between Span® 80 with either hydrophilic or hydrophobic
silica as shown in Figure 4, except for Span® 80 and hydrophobic silica in first batch CCDS, which had
significant improvement only when >7.5% silica concentrations were used. Nonetheless, Span® 80 was
not as effective as Tween® 80 at the same conditions.
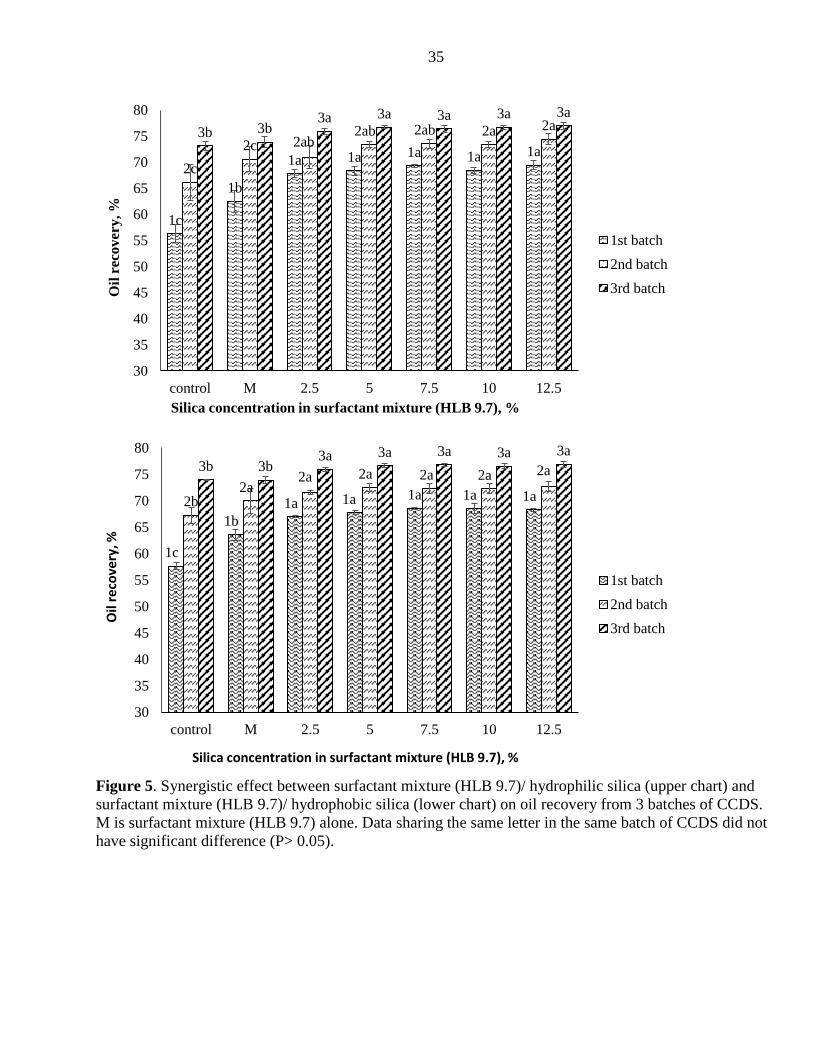
Synergistic effect was found in both surfactant mixture (1:1)/ hydrophilic silica and surfactant
mixture (1:1)/ hydrophobic silica as shown in Figure 5. Addition of surfactant mixture can significantly
improve oil recovery compared to the control group, except for the third batch. The consistent (low
standard deviation) and significant increases were observed in most of CCDS samples when hydrophilic
silica or hydrophobic silica were added comparing with surfactant alone. However, increasing silica
concentration in surfactant did not help in recovering more oil.
The mechanism of surfactant destabilizing the protein-stabilized emulsion is reported in literatures.
Protein forms a viscoelastic layer which can influence the stability of emulsions (Murray and Dickinson,
1996). A higher concentration of protein on the interfacial surface contributes to a stronger interaction
among protein molecules and this interaction affects the stability of protein stabilized emulsion (Mackie et
al., 1999). Low-molecular weight surfactants are often more surface-active than proteins and will,
therefore, compete for a position on interfacial surface with protein (Wilde et al., 2004). CCDS contains
14-18% protein and these proteins stabilize the interface of oil-in-water emulsion in CCDS (Majoni et al.,
2011). When surfactants are added in CCDS, they compete with protein on the oil-in-water interfaces and
partially replace the protein and break the protein-protein interaction to release oil from the emulsion.
Span® 80 and its mixture with silica did not work as well as the other surfactant and combinations
did. The type of interaction between Span® 80 and protein on the emulsion interface may play an
important role. Cornec et al. (1996) reported that β-lactoglobulin had less possibility to be replaced by
Span® 80 on emulsion interface compared with β-casein, which is more hydrophilic than β-lactoglobulin.
Page 30
24
Moreover, protein on interface was easier to be displaced by surfactant with large hydrophilic head group,
such as Tween 20 (Cornec et al., 1996). Corn zein protein is a hydrophobic protein (Argos et al., 1982),
and it comprises 45-50% of the protein in corn (Shukla and Cheryan, 2001). Span® 80 may tend to adsorb
on the hydrophobic zein protein but not replace it. More hydrophilic surfactant is needed to replace
hydrophobic proteins more efficiently as discussed by Cornec et al. (1996).
Silica nanoparticle addition significantly improved oil recovery comparing with Tween® 80 and
surfactant mixture alone. That may be attributed to the similar function of hydrophobic oil and solid
particle in anti-foaming action. In an anti-foaming research, Koczo et al. (1994) suggested that solid
particle or hydrophobic oil alone has much lower penetration ability on emulsion interface than a mixture
of these two. Denkov (1999) also suggested an “oil bridge model” to explain the hydrophobic oil and
silica combination on anti-foaming. The silica particle can increase the penetration depth of hydrophobic
oil in the lenses and the formed oil bridge is unstable which makes the foam break. Foam is air-in-water
system which is very similar to oil-in-water emulsion, and the surfactant/silica combination may play a
similar role in breaking oil-in-water emulsion. With the presence of silica nanoparticle, surfactant may
penetrate the interface and replacing protein more efficiently. When the surfactant replaces the position of
a protein on the interface, a “surfactant bridge” which is similar to “oil bridge” in anti-foaming may be
formed. This surfactant bridge with the particles imbedded in is unstable which would break the emulsion.
However, results from this study seemingly will not explain why the same surfactant mixture had
synergistic effect with both hydrophobic and hydrophilic silica, and thus led to similar oil recovery
improvements when used in CCDS. Our speculation is that since the surfactant mixture is 1:1 ratio of the
highly hydrophobic and highly hydrophilic compounds, such a mixture would work well with either
hydrophobic or hydrophilic particles. The interactions would be similar, only that an opposite orientation
Page 31
25
or arrangement of molecules or particles on the interface would occur. Further study is needed to explain
this phenomenon.
It’s worth mentioning that we also tested our Tween® 80 combined with 5% hydrophilic silica
nanoparticles in comparison to one of the commercial products, a demulsifier package (the name cannot
be revealed) mentioned in the introduction section. Both of the agents were used in 1000 ppm
concentration in CCDS. The oil recovery from these two treatments are statistically the same, and they
were much higher than the two controls, which were CCDS alone and with Tween® 80 addition alone.
3.5 Effects of treatments on distribution of different types of oil in CCDS
Results presented in above sections and that obtained during preliminary experiments indicated that
oil in CCDS cannot be recovered fully, i.e., 100%. Depending on the batch of CCDS, about 25- 35% of
total oil was not extracted. Therefore, we wanted to investigate the forms of oil present in CCDS and how
our treatments affect the distribution of various forms of oil.
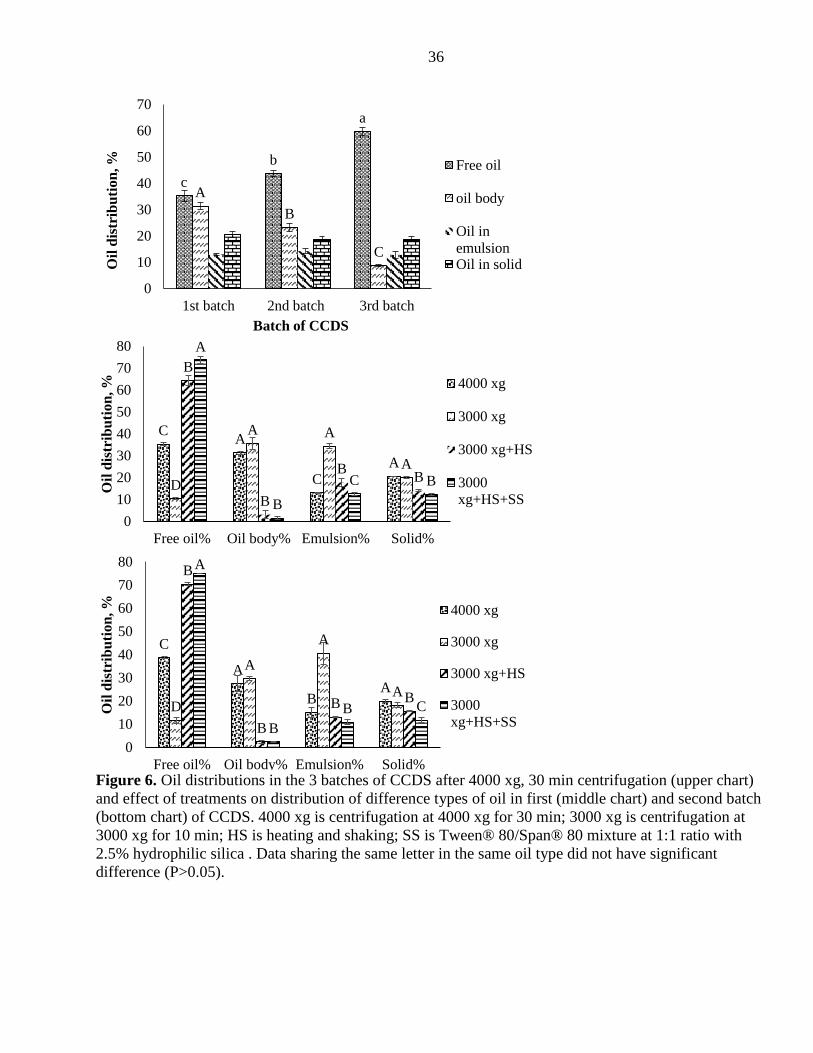
The three batches of CCDS had significantly different amount of free oil and oil-body distribution,
but they had similar oil-in-water emulsion and oil-in-solid distribution when they were treated at same
condition without the use of surfactant and silica, as shown in Figure 6. The third batch of CCDS had the
highest free oil content and lowest oil body content, and the first batch of CCDS had the lowest free oil
content and highest oil body content. This result paralleled with oil recovery in control groups of three
batches of CCDS, which had the highest oil recovery in the third batch and the lowest in the first batch.
Moreover, particle size distribution may also relate to the free oil and oil body proportion change among
batches of CCDS.
Different treatments, including temperature, shaking, surfactant and silica addition and centrifugation
condition, had significant effect on oil distribution in CCDS as shown in Figure 6. The first and second
batch of CCDS were chosen for this experiment due to its appropriate oil body and free oil content. When
Page 32
26
there was no heating and shaking and surfactant and silica applied, increasing centrifuge condition from
3000 xg, 10 min to 4000 xg, 30 min significantly improved free oil recovery and decreased oil-in-water
emulsion, but no significant difference was found in oil body and oil in solid content. When 83°C
heating with 100 rpm shaking for 10 min was applied before 3000 xg and 10 min centrifugation, free oil
content was significantly improved, and other three types of oil contents were significantly decreased
comparing with 3000 xg and 10 min centrifugation alone. This indicates heating is very effective in
breaking the emulsion and oil body. When surfactant mixture (1:1, w: w, HLB 9.7) was added during
heating and shaking, the free oil recovery was significantly increased again and oil content in emulsion
and solid were further decreased. This indicates surfactant and silica is effective in improving free oil
recovery.
Higher centrifugation force and longer centrifugation time can break the oil-in-water emulsion in
CCDS at room temperature, but they can’t affect oil body stability due to the special structure of oil body
which is stabilized by phospholipid layer and protein (Iwanaga et al., 2007). However, the oil body in
CCDS became extremely unstable after heating and shaking treatment. The treatment conditions for
CCDS in ethanol plants, including 80~85°C temperature, pump transferring, blending and centrifugation
of CCDS, may be already sufficient for breaking oil body. It is non-necessary to add any extra additives
or steps in current dry-grind corn ethanol fermentation procedure for breaking oil body. Surfactant and
silica mixture addition further improved oil recovery by breaking residual emulsion and washing out
small oil droplets which are attached on the surface of cell debris. Moreover, we found there was still 25~
35% corn oil in CCDS that cannot be recovered in this work, and this part of oil may be trapped in a
protein and unbroken cell complex which was not accessible to the surfactant and silica particles. Further
study should be conducted to focus on this part of trapped oil in corn fermentation.
Page 33
27
It should be noted that the free oil recovery of 70.4% from treatments 3000 xg centrifugation plus
heating and shaking, and that of 75.1% from 3000 xg centrifugation plus heating and shaking, and
surfactant and silica use, were higher than oil recovery from same treatments in synergistic study of this
report. This may be caused by the effect of storage on CCDS stability. The heterogeneous CCDS is a
dynamic system, and precaution has to be made to prevent system destabilization. In our study, a
complete set of treatments was applied to the same CCDS, so that proper conclusion on treatment effect
can be drawn.
4 Conclusion
The optimal HLB value for demulsifying CCDS was about 9.7. Tween® 80 and surfactant mixture
(HLB of 9.7) had synergistic effect with both hydrophilic and hydrophobic silica nanoparticles, and they
significantly improved oil recovery. However, Span® 80 did not show these effects. Different treatments,
including heating and shaking, surfactant and silica addition and centrifugation condition, had significant
effect on distribution of different types of oil in CCDS. Comparing with conventional centrifugation
method to recover oil, the use of surfactant and silica particle combination led to 5~10% more extracted
oil depending on CCDS conditions. Although the synergistic effect between surfactant and silica
nanoparticle was investigated for oil recovery from CCDS, this technology will have potential to be
applied to other systems where there is a need to break oil-in-water or water-in-oil emulsions.
5 Acknowledgment
The authors would like to thank the ISU Fermentation Institute and Bioeconomy Institute for funding
and supporting this research.
Page 34
28
References:
AOAC, 1992. Official Methods of Analysis, 15th ed.: Association of Official Analytical Chemists:
Washington, DC.
Argos, P., Pedersen, K., Marks, M. D., Larkins, B. A., 1982. A structural model for maize zein proteins. J.
Biol. Chem. 257, 9984-9990.
Binks, B. P., 2002. Particles as surfactants- similarities and differences. Current Opinion. Colloid
Interface Sci. 7, 21-41.
Binks, B.P., Rodrigues, J. A., 2007. Synergistic interaction in emulsions stabilized by a mixture of silica
nanoparticles and cationic surfactant. Langmuir. 23, 3626-3636.
Boyd, J., Parkinson, C., Sherman, P., 1972. Factors affecting emulsion stability, and the HLB concept. J.
Colloid Interface Sci. 41, 359-370.
Cornec, M., Mackie, A. R., Wilde, P. J., Clark, D. C., 1996. Competitive adsorption of β-lactoglobulin
and β-casein with Span® 80 at the oil-water interface and the effects on emulsion behaviour.
Colloids Surfaces. 114, 237-244.
Denkov, N. D., 1999. Mechanisms of action of mixed solid-liquid antifoams. 2. stability of oil bridges in
foam films. Langmuir. 15, 8530-8542.
Drelich, A., Gomez, F., Clausse, D., Pezron, I., 2010. Evolution of water-in-oil emulsions stabilized with
solid particles influence of added emulsifier. J. Colloid Interface Sci. 352, 128-135
Gallop, C. C., Cooper, T., Dieker, K. A., 2012. Bio-Oil recovery methods. U. S. Patent 8,192,627, Jun 5.
ICI American, 1984. The HLB system, a time-saving guide to emulsifier selection; ICI American, Inc:
Wilmington. pp 3.
Iwanaga, D., Gray, D. A., Fisk, I. D., Decker, E. A., Weiss, J., Mcclements, D. J., 2007. Extraction and
characterization of oil bodies from soy beans: A natural source of pre-emulsified soybean oil. J.
Agric. Food Chem. 55, 8711-8716.
Kapchie, V. N., Wei, D., Hauck, C., Murphy, P. A., 2008. Enzyme-assisted aqueous extraction of
oleosomes from soybeans (glycine max). J. Agric. Food Chem. 56, 1766-1771.
Kim, Y., Mosier, N.S., Hendrickson, R., Ezeji, T. Blaschek, H., Dien, B., Cotta, M., Dale, B., Ladisch,
M.R., 2007. Composition of corn dry-grind ethanol by-products: DDGS, wet cake, and thin
stillage. Bioresource Technol. 99, 5165-5176.
Koczo, K., Koczone J. K., Wasan, D. T., 1994. Mechanisms for antifoaming action in aqueous systems by
hydrophobic particles and insoluble liquids. J. Colloid Interface Sci. 166, 225-238.
Kwok, W., Nasr-EI-Din, H. A., Hayes, R. E., Sethi, D., 1993. Static and dynamic adsorption of a non-
ionic surfactant on Berea sandstone. Colloids and surface A. Physicochem Eng. Aspects. 78, 193-
209.
Mackie, A. R., Husband, F. A., Holt, C., Wilde, P., 1999. Adsorption of β-Lactoglobulin variants A and B
to the air–water interface. Food Sci. Tech. 34, 509-516.
Majoni, S., Wang, T., Johnson, L. A., 2011. Physical and chemical processes to enhance oil recovery from
condensed corn distillers solubles. J. Am. Oil Chem. Soc. 88, 425-434.
Moreau, R.A., Johnston, D.B., Haas, M.J, Hicks, K.B. 2012. Aqueous extraction of corn oil after
fermentation in the dry-grindethanol process. In: Farr, W., Proctor, A., editors. Green Oil
Processing. Urbana, IL: AOCS Press. p. 53-70.
Murray, B. S., Dickinson, E., 1996. Interfacial rheology and the dynamic properties of adsorbed films of
food proteins and surfactants. Food Sci. Technol. International. 2, 131-137.
Page 35
29
Nesterenko, A., Drelich, A., Lu, H., Clausse, D., Pezron, I., 2014. Influence of a mixed particle/surfactant
emulsifier system on water-in-oil emulsion stability. Colloids and Surfaces A. Physicochem. Eng.
Aspects. 14, 49-57.
Rondon, M., Bouriat, P., Lachaise, J., 2006. Breaking of water-in-crude oil emulsion. 1. Physicochemical
phenomenology of demulsifier acion. Energy Fuels. 20, 1600-1604.
Scheimann, D. W., Kowalski, A. S., 2009. Method of dewatering thin stillage processing streams. U. S.
Patent 7, 497, 955.
Scott, D., Weber A. A., 2014. True Masterpiece: Feedstock Diversity and Biodisel's Carbon Story.
Biodisel Magazine. 11, 7-7.
Sheppard, P. W., Pankonen, M., Gross, J. T., 2012. Chemical additives and use thereof in stillage
processing operations. U. S. Patent, 2012/0245370.
Shukla, R., Cheryan, M., 2001. Zein: the industrial protein from corn. Industrial Crops Products. 13, 171-
192.
Tambe, D.E., Sharma, M. M., 1993. Factors controlling the stability of colloid-stabilized emulsions. J.
Colloid Interface Sci. 157, 244-253.
Wang, H., Wang, T., Pometto III, A. L., Johnson, L. A., 2009. A Laboratory decanting procedure to
simulate whole stillage separation in dry-grind corn ethanol process. J. Am. Oil Chem. Soc. 86,
1241-1250.
Wilde, P., Mackie, A., Husband, F., Gunning, P., Morris, V., 2004. Proteins and emulsifiers at liquid
interfaces. Colloid Interface Sci. 108-109, 63-71.
Page 36
30
Tables and Figures
Table 1. HLB values of surfactant mixtures used in this study
Surfactants (w: w) HLB value
Span® 80, 100% 4.3
Span® 80: Tween® 80 (4:1) 6.4
Span® 80: Tween® 80 (2:1) 7.8
Span® 80: Tween® 80 (1:1) 9.7
Span® 80: Tween® 80 (1:2) 11.3
Span® 80: Tween® 80 (1:4) 12.9
Tween® 80, 100% 15.0
HLB values of Span® 80 and Tween® 80 were provided by producer; HLB value of surfactant mixtures
were calculated by the equation in Section 2.4.
Table 2. Conditions used to study effects of processing on distribution CCDS oil
Treatment Heating and shaking Demulsifier Centrifugation condition
4000 xg No No 4000 xg, 30 min
3000 xg No No 3000 xg, 10 min
3000 xg+ HS Yes No 3000 xg, 10 min
3000 xg + HS + D Yes Yes 3000 xg, 10 min
HS: Heating and Shaking; D: Mixture of Span 80 and Tween 80 at ratio by weight 1:1, with 2.5%
hydrophilic silica addition
Page 37
31
Table 3. CCDS characteristics and oil recovery
CCDS Total solid
content
Total oil
content (dry
weight
basis)
Particle size distribution Oil
recovery D(0.1) D(0.5) D(0.9) Volume
weighed
mean
1st batch 28.38 ±
0.97 A
22.06 ±
0.88 A 4.28 ±
0.05
B
22.26
± 0.65
AB
420.97
±
38.45
A
119.07
± 8.16
A
56.27 ±
1.40 C
2nd batch 26.88 ±
0.38 B
23.51 ±
0.63 A 4.20 ±
0.04
C
23.19
± 0.74
A
388.41
±
39.73
A
114.03
± 8.47
A
66.17 ±
3.04 B
3rd batch 29.51 ±
0.87 A
17.38 ±
0.25 B 4.72 ±
0.06
A
21.55
± 0.63
B
296.12
±
50.13
B
92.95 ±
8.94 B
73.12 ±
0.71 A
Data sharing the same letter in the same column did not have significant difference (P>0.05). D (0.1) is
the diameter where 10% of the distribution is below; D (0.5) is the diameter where 50% of the distribution
is below; D (0.9) is the diameter where 90% of the distribution is below. Oil recovery data in this table
was collected from no surfactant and silica added group.
Page 38
32
Figure 1. Separation of different types of oil after centrifugation
Figure 2. Effect of surfactant HLB value on oil recovery from the 3 batches of CCDS. Data sharing the
same letter in the same batch of CCDS did not have significant difference (P> 0.05).
1c 1c
1bc
1b
1a
1b
1bc
1c
2c 2bc
2ab 2ab 2a 2a2ab
2c
3b
3a3ab
3a 3ab 3ab 3a
3ab
50
55
60
65
70
75
80
control 4.3 6.4 7.8 9.7 11.3 12.9 15
Oil
rec
over
y, %
HLB value of surfactant mixture
1st batch
2nd batch
3rd batch
Free oil
layer Oil body
Oil-in-water emulsion
Oil in solid
residue
Page 39
33
Figure 3. Synergistic effect of Tween® 80/ hydrophilic silica (upper chart) and Tween® 80/hydrophobic
silica (lower chart) on oil recovery from the 3 batches of CCDS. T is Tween® 80 alone. Data sharing the
same letter in the same batch of CCDS did not have significant difference (P> 0.05).
1b 1b
1a
1a 1a 1a1a2b
2c
2a 2a2a 2a 2a
3c3b 3b 3bc 3bc 3bc 3a
30
35
40
45
50
55
60
65
70
75
80
control T 2.5 5 7.5 10 12.5
Oil
rec
ov
ery
, %
Silica concentration in Tween 80, %
1st batch
2nd batch
3rd batch
1c1c
1bc
1ab1ab
1a 1a2bc
2c
2bc 2ab2ab
2a 2a3b
3ab3a 3a 3a
3ab 3a
30
35
40
45
50
55
60
65
70
75
80
control T 2.5 5 7.5 10 12.5
Oil
rec
over
y, %
Silica concentration in Tween 80, %
1st batch
2nd batch
3rd batch
Page 40
34
Figure 4. Synergistic effect of Span® 80/ hydrophilic silica (upper chart) and Span® 80/ hydrophobic
silica (lower chart) on oil recovery from 3 batches of CCDS. S is Span® 80 alone. Data sharing the same
letter in the same batch of CCDS did not have significant difference (P> 0.05).
30
35
40
45
50
55
60
65
70
75
80
control S 2.5 5 7.5 10 12.5
Oil
rec
ov
ery
, %
Silica concentration in Span 80, %
1st batch
2nd batch
3rd batch
1d 1cd
1bc 1ab 1ab
1a 1a
30
35
40
45
50
55
60
65
70
75
80
control S 2.5 5 7.5 10 12.5
Oil
rec
over
y, %
Silica concentration in Span 80, %
1st batch
2nd batch
3rd batch
Page 41
35
Figure 5. Synergistic effect between surfactant mixture (HLB 9.7)/ hydrophilic silica (upper chart) and
surfactant mixture (HLB 9.7)/ hydrophobic silica (lower chart) on oil recovery from 3 batches of CCDS.
M is surfactant mixture (HLB 9.7) alone. Data sharing the same letter in the same batch of CCDS did not
have significant difference (P> 0.05).
1c
1b
1a 1a 1a 1a 1a
2c
2c 2ab2ab 2ab 2a 2a
3b 3b3a 3a 3a 3a 3a
30
35
40
45
50
55
60
65
70
75
80
control M 2.5 5 7.5 10 12.5
Oil
rec
ov
ery
, %
Silica concentration in surfactant mixture (HLB 9.7), %
1st batch
2nd batch
3rd batch
1c
1b
1a 1a 1a 1a 1a2b2a
2a 2a 2a 2a 2a3b 3b3a 3a 3a 3a 3a
30
35
40
45
50
55
60
65
70
75
80
control M 2.5 5 7.5 10 12.5
Oil
reco
very
, %
Silica concentration in surfactant mixture (HLB 9.7), %
1st batch
2nd batch
3rd batch
Page 42
36
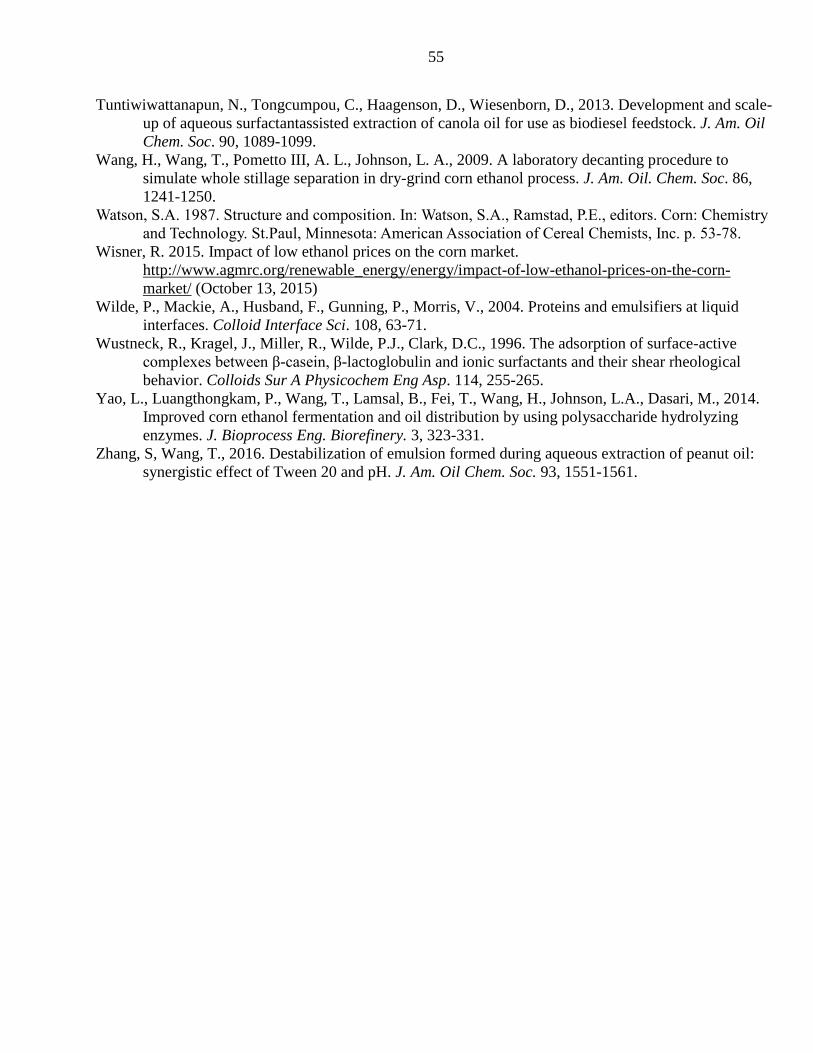
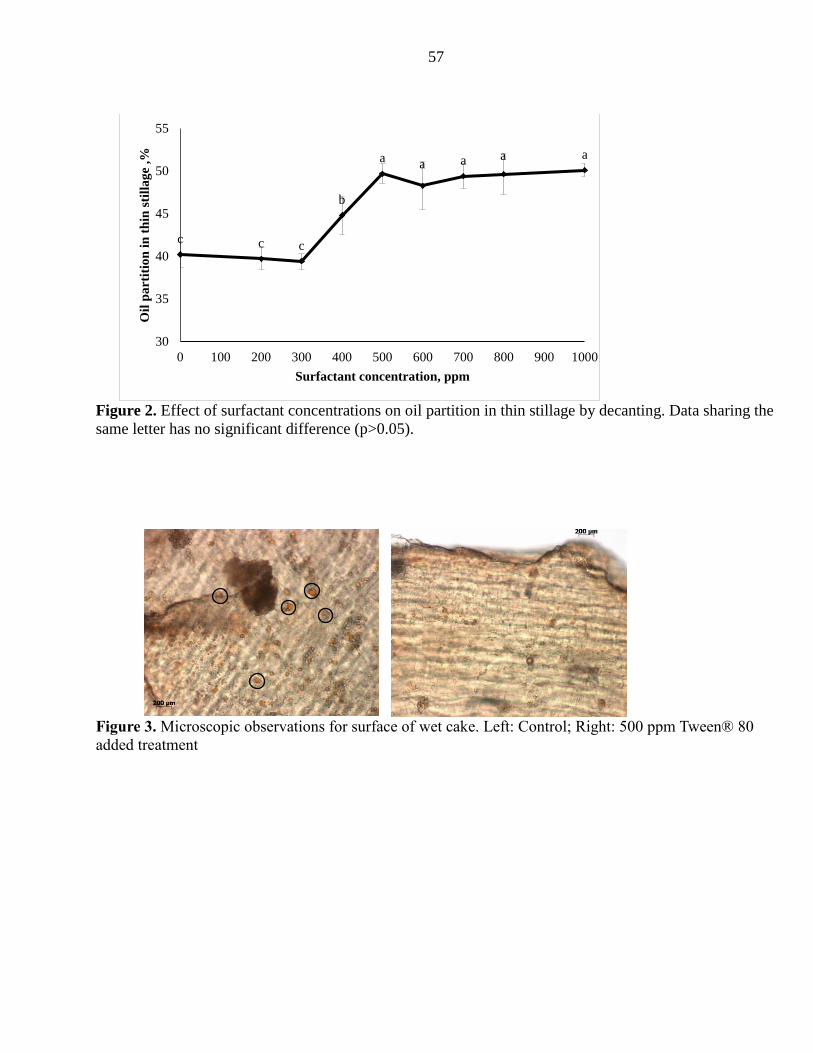
Figure 6. Oil distributions in the 3 batches of CCDS after 4000 xg, 30 min centrifugation (upper chart)
and effect of treatments on distribution of difference types of oil in first (middle chart) and second batch
(bottom chart) of CCDS. 4000 xg is centrifugation at 4000 xg for 30 min; 3000 xg is centrifugation at
3000 xg for 10 min; HS is heating and shaking; SS is Tween® 80/Span® 80 mixture at 1:1 ratio with
2.5% hydrophilic silica . Data sharing the same letter in the same oil type did not have significant
difference (P>0.05).
c
b
a
A
B
C
0
10
20
30
40
50
60
70
1st batch 2nd batch 3rd batch
Oil
dis
trib
uti
on
, %
Batch of CCDS
Free oil
oil body
Oil in
emulsionOil in solid
CA
CA
D
A A
A
B
B
BB
A
B
C B
0
10
20
30
40
50
60
70
80
Free oil% Oil body% Emulsion% Solid%
Oil
dis
trib
uti
on
, % 4000 xg
3000 xg
3000 xg+HS
3000
xg+HS+SS
C
A
BA
D
A
A
A
B
B
B B
A
B
B C
0
10
20
30
40
50
60
70
80
Free oil% Oil body% Emulsion% Solid%
Oil
dis
trib
uti
on
, % 4000 xg
3000 xg
3000 xg+HS
3000
xg+HS+SS
Page 43
37
CHAPTER 3. USE OF SURFACTANT AND HYDROLYZING ENZYMES IN DRY-GRIND
CORN PROCESSING IMPROVES ETHANOL YIELD AND DISTILLERS CORN OIL
RECOVERY
A paper to be submitted to
Industrial Crops and Products
Lei Fang, Buddhi Lamsal*, Tong Wang*
Food Science and Human Nutrition Department
Iowa State University
Ames, Iowa, USA, 50011
*corresponding authors:
Buddhi Lamsal, Associate Professor
2312 Food Sciences Building
Ames, IA 50010
Tel: 515-294-8681
Email: [email protected]
Tong Wang, Professor
2312 Food Sciences Building
Ames, IA 50011
Tel: 515-294-5448
Email: [email protected]
Page 44
38
Abstract:
Distillers corn oil (DCO) is a valuable co-product of dry-grind corn ethanol process and can be used in
animal feed and for bio-fuel production. DCO can be in different forms in the fermentation matrix,
including oil adhering to solid surfaces such as cell wall and protein matrix and oil contained in unbroken
cells, which was difficult to partition to thin stillage by decanting. Effects of using surfactant (Tween®
80) and hydrolyzing enzymes during fermentation on DCO partition after decanting and DCO recovery
from condensed corn distillers with solubles (CCDS) were investigated. There was about 8~10% DCO
adhered to wet cake solids in whole stillage produced by conventional procedure, and this part of DCO
partitioned to thin stillage when 500 ppm of Tween® 80 was added in corn slurry. Enzymes reduced the
particle size of wet cake and released more DCO from wet cake to thin stillage. However, the use of
protease reduced oil recovery (4.0% versus 7.9% and 17.9%, protease versus control and non-starch
polysaccharides hydrolyzing enzymes) by producing partially hydrolyzed protein, which may have
worked as emulsifier. Moreover, a synergistic effect between the use of enzymes and Tween® 80 was
found on DCO partition in thin stillage and recovery from CCDS.
Keywords: dry-grind ethanol process, distillers corn oil (DCO), ethanol, oil partition, oil recovery,
Tween® 80, hydrolyzing enzyme.
Page 45
39
Highlights:
The use of Tween® 80 at the concentration of 500 ppm in corn slurry led to highest oil partition in
thin stillage;
The use of hydrolyzing enzymes during fermentation tended to move more oil from wet cake to thin
stillage;
The synergistic effect between surfactant and hydrolyzing enzyme on oil recovery from CCDS was
demonstrated;
The use of Tween® 80 had no negative effect on ethanol production.
Page 46
40
1 Introduction
Dry-grind ethanol industry has become the second largest corn user in the United States, producing
90% of the ethanol in U.S. in 2015. This industry was very profitable in the past. However, due to the
sharp decline in crude oil price, the price of dry-grind corn ethanol fell sharply from $2.18 per gallon in
December 2014 to $1.25 per gallon in February 2015 (Irwin and Good, 2015; Wisner, 2015). The
additional revenue streams from co-products of the dry-grind ethanol process are becoming more
important. One such co-product is the distillers corn oil (DCO), which is the oil recovered from post-
fermentation streams. The revenue from DCO has become more and more important for U.S. ethanol
plants, particularly in the low margin times (Jayasinghe, 2015).
The most widely used method for DCO recovery in dry-grind ethanol process is separating the oil
from the condensed corn distillers solubles (CCDS) by centrifuge (Moreau et al., 2012). The oil recovery
procedure was described in a U.S. patent 7601858. In brief, after collecting ethanol by distillation (Figure
1), the ethanol-removed whole stillage is separated by decanting into thin stillage and wet cake. In
general, 40~60% of total oil in corn whole kernel is left in wet cake and the rest goes to thin stillage after
decanting. The thin stillage is further evaporated to produce CCDS with 60~85% moisture content, and
the DCO is extracted from the CCDS by using a disk stack centrifuge (Cantrell and Winsness, 2009).
Many efforts have been made to improve the DCO recovery from CCDS. Centrifugation coupled with oil
recovery aid is easy to use and relatively effective in improving oil recovery from the CCDS. A number of
commercial oil recovery aids have been designed for large-scale process, including FoodPro SA9843 corn
oil yield improver (General Electric, Trevose, PA, USA), PTV M-5309 corn oil extraction aid (Ashland
Chemical, Covington, KY, USA), Ashland DPI-428 (Ashland Hercules Water Technologies, Wilmington,
DE, USA), and Hydri-Maize Demulsifier 300 (Hydrite Chemical Co., Waterloo, IA, USA). However,
Page 47
41
these products are designed for oil recovery from CCDS only, and do not affect the partitioning of oil
during decanting and oil from wet cake.
DCO is present in several different forms during the dry-grind ethanol process, including the oil
adhering to surface of wet cake solids, like cell wall and protein matrix (Majoni et al., 2011). Based on
our preliminary experiments, about 8~10% w/w of total corn oil was adhered to solid wet cake particles,
which did not partition to thin stillage fraction by decanting. The oil adhering to the wet cake surface is
very similar to the oil stain on a fabric surface of clothes. Surfactants as cleaning agents work by reducing
the surface tension and removing the oil as micelles. In our previous study on the distribution of different
types of oil in CCDS, the use of surfactant mix resulted in a higher recovery of oil partially coming from
surface adhering oil (Fang et al., 2015). This gives the basis for our hypothesis that the cleaning function
of surfactants could be applied in dry-grind ethanol process to partition the oil from wet cake to the thin
stillage.
Surfactants have been applied in aqueous extraction processing to improve vegetable oil recovery.
Sodium dodecyl sulfate was used to improve recovery of soybean oil (Campbell and Glatz, 2009) and
canola oil (Tuntiwiwattanapun et al., 2013) by extracting the oil trapped in disrupted cellular matrix. The
extended-surfactants, which is a recently developed new class of surfactants that works by significantly
reducing the interfacial tension, extracted 93-95% of total oil from the insufficiently ground peanut and
canola seeds (Do and Sabatini, 2010). However, due to the safety issue of sodium dodecyl sulfate and
extended-surfactants, they are not allowed for human or animal consumption. To date, only a few reports
on destabilization of oil-in-water emulsion by using food-grade-surfactants are available. Fang et al.
(2015) attempted to improve oil recovery from CCDS by using Tween® 80-Span® 80-silica nanoparticle
mixture. Zhang and Wang (2016) used Tween® 20 to improve peanut oil recovery. Both works explained
the improved oil recovery as the result of unstable emulsion formation by surfactant-protein competition
Page 48
42
on the emulsion interface. Thus, we believed that using surfactant at the beginning of dry-grind ethanol
process could not only improve oil partition in thin stillage but also increase the oil recovery from CCDS
by demulsification.
There is a large portion of oil (40~60% of total oil in corn) remaining in intact cells and
protein/polysaccharide matrices of wet cake solids; enzyme hydrolysis of the solids might be an efficient
way to release this part of the oil. Luangthongkam et al. (2015) reported that using a combination of
cellulolytic enzymes, protease, and phytase during fermentation led to a higher oil partition in thin
stillage. However, no research has been reported to confirm if hydrolyzing the non-fermentable
components during fermentation step can improve oil recovery from CCDS. Therefore, the objectives of
this research were 1) to determine the optimum level and best processing stage to add the surfactant
(Tween® 80) and 2) to investigate the synergistic effects of surfactant and hydrolyzing enzymes
(protease, cellulase, and pectinase) on ethanol production and oil recovery.
2 Materials and Methods
2.1 Materials
Ground whole corn meal (average particle size of 0.44 mm), α-amylase (Novozymes, Franklinton,
NC), glucoamylase (liquid, Spirizyme Excel XHS, Novozymes, Franklinton, NC), dry yeast
(Saccharomyces cerevisiae; commercial grade currently being used in the ethanol plant) and antibacterial
chlorine dioxide (commercial grade) were donated by Lincolnway Energy LLC, Ames, IA. Cellulase
(75,000 CU/g) and pectinase (3500 ENDO-PG/g) were provided by Bio-Cat (Troy, VA). In this study,
pectinase and cellulase were used as a mix (PC) with ratio 1:1 (w: w). FermgenTM (Acid protease, liquid,
activity 1,000 SAP units/g) was provided by DuPont Industrial Biosciences (Palo Alto, CA). The other
chemicals, including Tween® 80 (polysorbate 80), hydrochloride acid, petroleum ether, and ethyl ether
were purchased from Fisher Scientific (Fairlawn, NJ, USA).
Page 49
43
2.2 Corn fermentation
The procedure of lab-scale fermentation is shown in Figure 2. The liquefaction and simultaneous
saccharification and fermentation of the corn slurry were performed in 250-mL round bottom flasks with
Tornado IS6 Overhead Stirring System (Radleys Discovery Technologies, Shire Hill, Saffron Walden,
UK) equipped with an anchored stirring shaft. Ground corn was mixed with cold DI water (or Tween® 80
water solution) at a 1:2 ratio, w: w.. The total amount of slurry was maintained at 225-230 g. α-Amylase
(0.15 mL) was added to the slurry and mixed at 81°C for 3h. After that, the flasks were cooled to 30°C in
an ice bath, and the pH of the cooled slurry was adjusted to 4.0 with 3 M sulfuric acid. Chlorine dioxide
(0.021 mL), ammonium sulfate (0.065 mL of 0.2 g/g water), gluco-amylase (0.15 mL) and dry yeast (0.15
g) were added. Fermentation was carried out at 30°C for 64 h with continuous stirring (190 rpm). During
fermentation, ethanol production was estimated by mass loss according to the following equation (Wang
et al., 2009).
Ethanol yield (g 100⁄ g dry corn ) = 100 ×46×(𝑔 𝑜𝑓 𝑚𝑎𝑠𝑠 𝑙𝑜𝑠𝑠)
44×(𝑔 𝑜𝑓 𝑑𝑟𝑦 𝑐𝑜𝑟𝑛)
Where 46 and 44 are molecular weights of ethanol and CO2, respectively.
For the experiments of adding hydrolyzing enzymes during fermentation, 0.375 mL of Fermgen or
0.3 g of PC was added before starting the fermentation. For experiments of adding Tween® 80 in
fermentation, Tween® 80 water solutions of 200, 300, 400, 500, 600, 700, 800, 1000 ppm were prepared
and ground corn meal was mixed with Tween® 80 solutions instead of DI water.
2.3 Post-fermentation processing
The rotary evaporation (Rotavapor R-210 and Vacuum Pump V-700, Buchi, Switzerland) at 82 °C for
10 min was used to simulate the industrial distillation step. After the distillation, water was added to make
up for the weight loss during rotary evaporation, giving the stillage a final solids content of 13% w/w. The
whole stillage was subjected to decanting following a procedure that simulates the industrial decanting
Page 50
44
process (Wang et al., 2009) to obtain the thin stillage and wet cake fractions. The wet yields, solid content
and oil content of thin stillage and wet cake were measured. CCDS was made by condensing thin stillage
with rotary evaporation at 75°C for 30 min. The solid content of CCDS was adjusted to 28% with water.
All CCDS samples were stored at 4°C until use.
2.4 Oil recovery from CCDS
Oil recovery from CCDS was simulated by using the method of Fang et al. (2015). To compare the
effect of surfactant addition, 2300 ppm Tween® 80 was added in CCDS before heating and shaking. In
brief, 40g of CCDS in a 250-mL centrifuge bottle was heated at 80-85°C for 10 min at 100 rpm shaking in
a shaker water bath (Model R-76, New Brunswick Scientific Co. Inc., NJ, USA). Immediately following
heating and shaking, oil was separated using a Centra MP4 centrifuge (International Equipment Company,
Needham Heights, MA, USA) at 3000 xg for 10 min. The oil layer was collected by washing the oil on
the top layer with hexanes (5 washes with 20, 20, 10, 10, and 5 mL respectively). The solvent was
removed by evaporation then by vacuum drying. The weight of the oil was determined gravimetrically.
2.5 Surfactant recyclability with backset
Thin stillage sample was collected from corn fermentation with 500 ppm Tween® 80 as described in
Section 2.2 and was used as backset to replace part of the incoming water and made the 150 g total
volume liquid in the new batch of fermentation. Batches of fermentation were performed with corn
slurries prepared with 100% DI water (Treatment 1), 100% fresh made 500 ppm Tween® 80 (Treatment
2), 50% fresh made 500 ppm Tween® 80 solution + 50% backset (Treatment 3), and 50% fresh made
1000 ppm Tween® 80 solution + 50% backset (Treatment 4). The thin stillage decanted from
fermentation as backset was collected as described in Section 2.3.
2.6 Analytical methods
Page 51
45
The adhering oil droplets on wet cake surface were observed using a light microscope (BX40,
Olympus Corporation, Tokyo, Japan) after staining in Sudan IV ethanol solution.
The water holding capacity of wet cake was measured to figure out the reason for the low solid
content in thin stillage resulted by using surfactant. Wet cake samples were dried overnight at 105 °C. The
water holding capacity (WHC) was analyzed by soaking 250 mg of dried wet cake in 10 mL of water for
24 h at room temperature. Samples were centrifuged at room temperature at 5000 xg for 20 min, and
inverted and subsequently drained for 15 min. WHC was calculated as the amount of water retained per
gram of dry material.
The solid content was determined by weight difference after oven-drying at 105°C for 5 h. Total oil
content was determined by acid hydrolysis method (AOAC Official Method 922.06).
2.7 Calculations
The calculations of wet yield of thin stillage, solid distribution in thin stillage, oil partition in thin
stillage, and oil recovery from CCDS are described as below:
Wet yield of thin stillage, % = 100% ×𝑔 𝑜𝑓 𝑡ℎ𝑖𝑛 𝑠𝑡𝑖𝑙𝑙𝑎𝑔𝑒
𝑔 𝑜𝑓 𝑤ℎ𝑜𝑙𝑒 𝑠𝑡𝑖𝑙𝑙𝑎𝑔𝑒, 𝑏𝑒𝑓𝑜𝑟𝑒 𝑑𝑒𝑐𝑎𝑛𝑡𝑖𝑛𝑔
Solid partition in thin stillage, %
= 100% ×𝑔 𝑜𝑓 𝑑𝑟𝑦 𝑠𝑜𝑙𝑖𝑑𝑠 𝑖𝑛 𝑡ℎ𝑖𝑛 𝑠𝑡𝑖𝑙𝑙𝑎𝑔𝑒
𝑔 𝑜𝑓 𝑑𝑟𝑦 𝑠𝑜𝑙𝑖𝑑𝑠 𝑖𝑛 𝑤ℎ𝑜𝑙𝑒 𝑠𝑡𝑖𝑙𝑙𝑎𝑔𝑒, 𝑏𝑒𝑓𝑜𝑟𝑒 𝑑𝑎𝑐𝑎𝑛𝑡𝑖𝑛𝑔
Oil partition in thin stillage, % = 100% ×𝑔 𝑜𝑓 𝑜𝑖𝑙 𝑖𝑛 𝑡ℎ𝑖𝑛 𝑠𝑡𝑖𝑙𝑙𝑎𝑔𝑒
𝑔 𝑜𝑓 𝑜𝑖𝑙 𝑖𝑛 𝑤ℎ𝑜𝑙𝑒 𝑠𝑡𝑖𝑙𝑙𝑎𝑔𝑒, 𝑏𝑒𝑓𝑜𝑟𝑒 𝑑𝑒𝑐𝑎𝑛𝑡𝑖𝑛𝑔
Page 52
46
Oil recovery from CCDS, % = 100% ×𝑔 𝑜𝑓 𝑓𝑟𝑒𝑒 𝑜𝑖𝑙
𝑔 𝑜𝑓 𝑡𝑜𝑡𝑎𝑙 𝑜𝑖𝑙 𝑖𝑛 𝑡ℎ𝑖𝑐𝑘 𝑠𝑡𝑖𝑙𝑙𝑎𝑔𝑒
2.8 Statistical analysis
All the treatments and analysis were triplicated. The data were analyzed by using SAS (Version 9.4,
SAS Institute Inc. Cary, NC) to test treatment difference at 95% significant level.
3 Results and Discussion
3.1 Oil partition in thin stillage as affected by adding surfactant in corn slurry
The optimal Tween® 80 concentration for increasing oil partition in thin stillage was investigated.
The concentration of Tween® 80 in corn slurry had a significant effect on oil partition in thin stillage after
decanting. As shown in Figure 2, the oil partition in thin stillage was at 40% of total corn oil for surfactant
concentrations below 300 ppm, but the partition significantly improved to 50% when the Tween® 80
concentration was increased to 500 ppm. However, no more improvement was seen over 500 ppm. Since
surfactant cannot release the oil from the unbroken cells, the extra oil partitioned in the thin stillage
should be coming from the adhered oil on the wet cake surface. This hypothesis is supported by
microscopic observations in Figure 3, in which Sudan IV stained oil droplets can be seen in wet cake
surface of the control, but hardly seen in 500 ppm Tween® 80 treated samples.
The adhering oil on the surface of wet cake is very similar to oily dirt on surface of clothes.
Surfactant works as detergent to move adhering oil into water during washing. The lipophilic ends of the
surfactant molecules attach themselves to the oily dirt, and the hydrophilic heads attach to the water. With
continuous whirling, the oily dirt is pulled away from the surface. In the fermentation tank, Tween® 80
worked as a detergent, the adhering oil droplets were moved into the aqueous phase from the surface of
the wet cake with the help of continuous mixing in the process.
Page 53
47
3.2 Ethanol production rate and yield as affected by using enzyme and surfactant
There was no adverse effect of adding Tween® 80 in corn slurry on ethanol yield and production rate.
When only Tween® 80 was added to fermentation (C500), a significant increase in ethanol yield (from
28.13 in the control to 30.71 g/100 g dry corn in C500) was observed (Table 1). The maximum ethanol
production rate of C500 was similar with the control, but a higher average ethanol production rate was
observed (Figure 4). The mechanism behind this finding was not clear. However, similar results were
reported in studies of cellulosic ethanol production when non-ionic surfactants were added, for the
purpose of reducing enzyme-substrate interaction (Alkasrawi et al., 2003). They reported that surfactant
adsorption onto lignin prevented unproductive binding of enzymes to lignin. Park et al. (1992) also
concluded that surfactants help the enzyme to desorb from the binding site on the substrate surface after
the completion of saccharification at that site. Though, the dry-grind ethanol process has a different
circumstance from cellulosic ethanol process, the high fiber content in dry-grind ethanol process might
have similar side-effects on enzyme activity as by cellulosic matters. In this study, the non-ionic
surfactant may have the same mechanism to improve saccharification efficiency in dry-grind ethanol
process.
When only Fermgen (mainly a protease enzyme) was used during fermentation (Table 1 and Figure
5), both ethanol production rate and yield increased significantly compared to the control. The increased
ethanol production rate suggested that fermentation time could be reduced to approximately 40 h from 65
h. These findings agreed with the results reported in literature in which protease was shown to increase
ethanol production rate and decrease supplemental N requirements (Johnston and McAloon, 2014).
Protease enzyme hydrolyzed corn protein and increased the concentration of free amino acid and peptides
which can be used as N source for yeast. Moreover, protein matrix embeds corn starch in corn endosperm
Page 54
48
(Watson, 1987) and can be broken by a protease to make starch more available for producing ethanol
(Lamsal and Johnson, 2012).
When only the mixture of pectinase and cellulase was added (PC in Table 1 and Figure 6), ethanol
production rate and final yield were significantly increased compared to the control. However, its effect
was less significant than using Fermgen. The mechanism of using PC to improve ethanol production rate
and final yield is different from using protease enzyme. PC hydrolyzed non-starch polysaccharides and
produced fermentable monosaccharides for yeast. However, products of PC hydrolysis cannot stimulate
the activity of yeast as the products of protease hydrolysis.
When both Tween® 80 and PC were used, the ethanol production yield of using PC500 (34.98 g
ethanol per 100 g dry corn) was not significantly different with PC alone (34.52 g ethanol per 100 g dry
corn). Similar pattern was observed when Fermgen and Tween® 80 were used, in which using Fermgen
(35.19 g ethanol per 100 g dry corn) had no significant different compared to F500 (35.25 g ethanol per
100 g dry corn). Improvement in ethanol yield by using Tween® 80 was not observed when enzymes
were added during fermentation. As we speculated in the previous section, non-ionic surfactant may
improve ethanol yield by affecting enzyme-substrate interaction. The enzyme hydrolysis reduces the
particle size and makes the substrate more available to saccharification enzyme, and this effect might have
made Tween® 80 unnecessary in this step to further reduce enzyme-substrate interaction.
3.3 Thin stillage yield, and solid and oil partitions in thin stillage as affected by enzyme and
surfactant treatments
The composition and properties of thin stillage are very important for the performance of piping,
centrifuge efficiency, oil recovery and energy cost in ethanol plant. The wet yield of thin stillage was
significantly improved in Fermgen treatment (85.9%) and PC treatment (87.1%) compared to the control
(79.3%). Whereas, PC treatment had similar solid content (7.2%) and Fermgen treatment had lower solid
Page 55
49
content (6.8%) compared to the control (7.2%). Similar results were observed by Yao et al. (2014) and
Luangthongkam et al. (2015) when fiber hydrolyzing enzymes were used in fermentation. Likely, the
hydrolysis action of the enzymes reduced the water holding capacity of insolubles in the wet cake by
interrupting the large protein matrix and cell wall network. In addition, the enzyme actions might have
reduced the particle size of the solid substrates. Both functions of the enzymes resulted in more liquid and
finer solids partition in thin stillage, which contributed to the high thin stillage yield and solid partition in
thin stillage from the PC and Fermgen treated process.
A significant reduction of solid content in thin stillage was observed when Tween® 80 was added in
corn slurry, which are 7.2% versus 6.8% (Control versus C500), 6.8% versus 6.6% (Fermgen versus
F500), and 7.2% versus 6.9% (PC versus PC500) in Table 2. Lower solid content in thin stillage is
preferable in ethanol plants, due to low energy cost in piping and less fouling of evaporators. To further
understand the reason for this observation, we tested the WHC of the dried wet cake for Tween® 80
solution and water. The dried wet cake can hold more DI water (4.39 ± 0.17 g water/g dried wet cake)
than Tween® 80 solution (3.87 ± 0.02 g solution/ g dried wet cake). This may be explained by the
reduced capillarity of solution due to the action of surfactant, which make the liquid separation easier
from the dried wet cake by centrifugation.
Enzymes and Tween® 80 treatments significantly increased oil partition in thin stillage. Since more
oil is in thin stillage, more oil can potentially be extracted. Table 2 shows that using hydrolyzing enzymes
significantly increased oil partition in thin stillage from 40.8% (Control) to 52.6% (Fermgen) and 52.3%
(PC). Comparing with using enzyme alone, Tween® 80 further improved the oil partition in thin stillage,
which were 40.8% versus 49.3% (Control versus C500), 52.6% versus 58.5% (Fermgen versus F500), and
52.3% versus 54.9% (PC versus PC500). Before decanting, the oil maybe present in different forms and a
large proportion of oil remains in unbroken cells and large matrix, like protein and cell wall components.
Page 56
50
This part of oil can be released by enzyme hydrolyzing the solids or large particles. These findings agreed
with the reported observations in literatures (Luangthongkam et al., 2015; Yao et al., 2014), which shown
an improved oil partition in thin stillage by adding NSPs hydrolyzing enzymes during fermentation.
Different from the action of enzymes, the use of surfactant improved the oil partition in a different way,
i.e. washing the adhering oil from wet cake surface into the aqueous phase. However, when hydrolyzing
enzymes were added, the improvement of oil partitioning in thin stillage by adding surfactant in corn
slurry was reduced comparing with non-enzyme treatments, which partitioned 8.5% more of total corn oil
from the control to C500, 5.9% from Fermgen to F500, and 2.6% from PC to PC500. The use of
hydrolyzing enzymes weakened the function of surfactant, probably due to the enzymatic hydrolysis of
protein and cell wall that freed the adhering oil into thin stillage. This hypothesis is supported by the
parallel improvements in solid partition and oil partition when enzymes were used (Table 2).
3.4 Oil recovery from CCDS as affected by surfactant and enzyme
The use of hydrolyzing enzymes significantly improved oil content in CCDS, as shown in Table 3.
When Tween® 80 was used, the significant oil content increase was found in the control (6.8% versus
9.3%, Control versus C500), whereas, only numerical but not significant improvements were observed on
Fermgen and PC treatment.
In the lab-scale experiment of oil recovery from CCDS, the use of PC in fermentation significantly
improved oil recovery from 7.9% (control) to 17.4% (PC) when Tween® 80 was not added (Table 4). A
similar finding has been reported by Yao et al. (2014) who found an increased free oil recovery from thin
stillage after polysaccharide hydrolyzing enzyme treatment in fermentation. As expected, because of the
polysaccharides being partially broken by the PC enzymes, the trapped oil would be released and present
in the form of free oil. However, a significantly lower oil recovery was found when Fermgen was added
in fermentation. The partial hydrolysis of protein maybe the reason for this observation. It has been
Page 57
51
reported that the emulsification ability of rice protein (Paraman et al., 2007), soy protein isolate (Kim et
al., 1990) and pea protein isolate (Barac et al., 2011) can be enhanced by partial enzyme hydrolysis. The
duration of proteolytic treatment and enzyme type played very important roles in the properties of enzyme
modified proteins. In this study, the protease hydrolyzed corn protein may have worked as a good
emulsifier to stabilize oil-in-water emulsion.
When Tween® 80 was added in corn slurry, the significant improvement in oil recovery from CCDS
was found in all treatments comparing with the non-surfactant treatments (Table 4). Especially for the
Fermgen treatment, adding surfactant in the process significantly improved oil recovery from 4.0%
(Fermgen) to 24.9% (F500) without significant change in oil content of CCDS (Table 3).
Similarly, when Tween® 80 was added in CCDS directly, the significant improvement of oil
recovery was found in all treatments comparing with non-surfactant treatments (Table 4). Protein is a
major stabilizer for oil-in-water emulsion in CCDS. The oil recovery improvement of adding Tween® 80
in CCDS has been explained as a result of surfactant and protein competition which formed an unstable
emulsion (Fang et al., 2015), when proteins were replaced by surfactants. However, these improvements
were significantly lower than when surfactant added in corn slurry.
The enhanced oil recovery from CCDS by adding surfactant in corn slurry is explained with two
proposed mechanisms 1) more available oil is present in CCDS, and 2) formation of more unstable
emulsion. In the first explanation, surface adhering oil could have been moved from wet cake surfaces
during 64 h of fermentation into the aqueous phase (Figure 1) and partitioned in thin stillage after
decanting. This part of oil was present in thin stillage as suspended oil droplet (free or in emulsion) and
can be recovered by centrifugation. In explanation for the second mechanism, when surfactant was
introduced to corn slurry or CCDS, a protein-surfactant co-stabilized emulsion was formed (Figure 5). A
higher concentration of protein on interfacial surfaces contributes to a stronger interaction among protein
Page 58
52
molecules and this interaction stabilizes the protein enabled emulsion (Mackie et al., 1999). When
Tween® 80 was added in CCDS, Tween® 80 competed and replaced protein from the interface of
emulsion. Although surfactants like Tween® 80 can stabilize oil-in-water emulsions, they are not as
strong as protein-protein interactions (Wilde et al., 2004). In this case, this emulsion has lower stability
than protein stabilized emulsion (Wustneck et al., 1996). Zhang and Wang (2016) reported that the
replacement between surfactant and protein was not be an instant process. Thus, after dispersing the
Tween® 80 into CCDS by heating and shaking for 10 min in lab-scale experiment, only a relatively small
proportion of protein-surfactant co-stabilized emulsion was formed, and this contributed to the improved
oil recovery from CCDS. However, the oil-in-water emulsion was not fully formed yet in corn slurry.
Thus, more Tween® 80 are involved in co-stabilizing oil-in-water emulsion with protein during
fermentation. After 64 h of fermentation with desirable temperature and mechanical mixing, a relatively
large proportion of protein-surfactant co-stabilized emulsion was formed. This emulsion was not stable,
thus it contributed to a significantly higher oil recovery from CCDS after centrifugation (Table 4). These
findings agreed with the observations from Zhang and Wang (2016), who also suggested adding Tween®
20 at the initial stage of aqueous extraction of peanut oil. Based on the current observations and previous
reports, the secondary mechanism might have the primary contribution to improved oil recovery.
3.5 Tween® 80 recyclability in backset
The 50% of water (w/w) was replaced by Tween® 80 containing thin stillage (backset) for making
new batch of corn slurry. Based on the experiment design, Treatment 3 had 250 to 500 ppm Tween® 80
and Treatment 4 had 500~750 ppm Tween® 80, depending on the concentration of active Tween® 80 in
thin stillage backset. As shown in Table 5, Treatment 4 had significantly higher oil partition than
Treatment 3, and the improvement (45.9 to 53.8%) was very similar to that between non-surfactant
fermentation (Treatment 1, no backset) and 500 ppm surfactant fermentation (Treatment 2, no backset)
Page 59
53
(40.8 to 49.6%). This observation indicated that the Tween® 80 in thin stillage backset cannot make the
concentration of active Tween® 80 to 500 ppm in Treatment 3, and the final concentration of Tween® 80
in Treatment 3 might be even lower than 300 ppm based on the oil partition trend in Figure 1. The
recycled Tween® 80 in thin stillage backset may have lost its function as detergent. Since the effects of
Tween® 80 on oil partition and oil recovery were observed, we believe that Tween® 80 was still in the
thin stillage with entire molecular structure, and most of Tween® 80 molecules were located on the
interface of oil-in-water emulsion in the backset and no free Tween® 80 worked as detergent to wash
adhering oil in next batch of fermentation.
4 Conclusion
The large portion of oil stayed in the wet cake should be moved to thin stillage and to be recovered by
centrifugation. Tween® 80 and hydrolyzing enzymes have shown to have the potential to increase DCO
yield. Oil partition in thin stillage and the oil recovery from CCDS were also significantly improved
without any negative effects on ethanol production. An additional benefit of using hydrolyzing enzymes
and surfactant during fermentation is that the application of these technologies would not require any
change in the design of a current ethanol plant. However, scale-up experiments are needed to further
confirm the effectiveness on commercial scale. Moreover, research on the recyclability of the surfactant is
needed to reduce process cost and study of treatment effects on quality of DDGS is needed.
5 Acknowledgment
The authors would like to thank the ISU Fermentation Institute and Bioeconomy Institute for funding
and supporting this research, and Bio-Cat and DuPont Industrial Biosciences companies for providing
enzyme samples.
Page 60
54
References:
Alkasrawi, M., Eriksson, T., Borjesson, J., Wingren, A., Galbe, M., Tjerneld, F., Zacchi, G., 2003. The
effect of Tween-20 on simultaneous saccharification and fermentation of softwood to ethanol.
Enzyme Microb. Technol. 33, 71-78.
AOAC, 1992. Official Methods of Analysis, 15th ed.: Association of Official Analytical Chemists:
Washington, DC.
Barac, M., Cabrilo., S., Pesic, M., Stanojevic, S., Pavlicevic, M., Macej, O., Ristic, N., 2011. Functional
properties of pea (pisum sativum L.) protein isolates modified with chymosin. Int. J. Mol. Sci. 12,
8372-8387.
Cantrell, D. F., Winsness, D. J. 2009. Method of processing ethanol byproducts and related subsystems.
U. S. Patent 7, 601, 858 B2.
Campbell, K. and Glatz, C., 2009. Mechanisms of aqueous extraction of soybean oil. J. Agric. Food
Chem. 57, 10904-10912.
Do, L., Sabatini, D., 2010. Aqueous extended-surfactant based method for vegetable oil extraction: proof
of concept. J. Am. Oil Chem. Soc. 87, 1211-1220.
Fang, L., Wang, T., Lamsal, B., 2015. Synergistic effect of surfactants and silica nanoparticles on oil
recovery from condensed corn distillers solubles (CCDS). Ind. Crop. Prod. 77, 553-559.
Irwin, S., Good, D., 2015. Ethanol production profits: The risk from lower prices of distillers grains.
http://farmdocdaily.illinois.edu/2015/03/ethanol-production-profits-risk-of-distillers-grains.html
(October 13, 2015).
Jayasinghe, S., 2015. Distillers corn oil market:Oligopsony. http://decision-
innovation.typepad.com/solutions/2015/02/distillers-corn-oil-market-oligopsony.html (October 13,
2015).
Johnston, D.B., McAloon, A.J., 2014. Protease increases fermentation rate and ethanol yield in dry-grind
ethanol production. Bioresource Techno. 154, 18-25.
Kim, S. Y., Park, P. S., Rhee, K. C., 1990. Functional properties of proteolytic enzyme modified soy
protein isolate. J. Agric. Food Chem. 38, 651-656.
Lamsal, B. P. and Johnson, L. A. 2012. Flaking as a corn preparation technique for dry-grind ethanol
production using raw starch hydrolysis. J. Cereal Sci. 56, 253-259.
Luangthongkam, P., Fang, L., Noomhorm, A., Lamsal, B., 2015. Addition of cellulolytic enzymes and
phytase for improving ethanol fermentation performance and oil recovery in corn dry-grind
process. Ind. Crop. Prod. 77, 803-808.
Majoni, S., Wang, T., Johnson, L. A., 2011. Physical and chemical processes to enhance oil recovery from
condensed corn distillers solubles. J. Am. Oil Chem. Soc. 88, 425-434.
Mackie, A. R., Husband, F. A., Holt, C., Wilde, P., 1999. Adsorption of β-Lactoglobulin variants A and B
to the air–water interface. Food Sci. Tech. 34, 509-516.
Moreau, R.A., Johnston, D.B., Haas, M.J, Hicks, K.B., 2012. Aqueous extraction of corn oil after
fermentation in the dry-grind ethanol process. In: Farr, W., Proctor, A., editors. Green Oil
Processing. Urbana, IL: AOCS Press. p. 53-70.
Paraman, I., Hettiarachchy, N. S., Schaefer, C., Beck, M.I., 2007. Hydrophobicity, solubility, and
emulsifying properties of enzyme-modified rice endosperm protein. Cereal Chem. 84, 343-349.
Park, J.W., Takahata, Y., Kajiuchi, T., Akehata, T., 1992. Effects of nonionic surfactant on enzymatic-
hydrolysis of used newspaper. Biotechnol. Bioeng. 39, 117-120.
Page 61
55
Tuntiwiwattanapun, N., Tongcumpou, C., Haagenson, D., Wiesenborn, D., 2013. Development and scale-
up of aqueous surfactantassisted extraction of canola oil for use as biodiesel feedstock. J. Am. Oil
Chem. Soc. 90, 1089-1099.
Wang, H., Wang, T., Pometto III, A. L., Johnson, L. A., 2009. A laboratory decanting procedure to
simulate whole stillage separation in dry-grind corn ethanol process. J. Am. Oil. Chem. Soc. 86,
1241-1250.
Watson, S.A. 1987. Structure and composition. In: Watson, S.A., Ramstad, P.E., editors. Corn: Chemistry
and Technology. St.Paul, Minnesota: American Association of Cereal Chemists, Inc. p. 53-78.
Wisner, R. 2015. Impact of low ethanol prices on the corn market.
http://www.agmrc.org/renewable_energy/energy/impact-of-low-ethanol-prices-on-the-corn-
market/ (October 13, 2015)
Wilde, P., Mackie, A., Husband, F., Gunning, P., Morris, V., 2004. Proteins and emulsifiers at liquid
interfaces. Colloid Interface Sci. 108, 63-71.
Wustneck, R., Kragel, J., Miller, R., Wilde, P.J., Clark, D.C., 1996. The adsorption of surface-active
complexes between β-casein, β-lactoglobulin and ionic surfactants and their shear rheological
behavior. Colloids Sur A Physicochem Eng Asp. 114, 255-265.
Yao, L., Luangthongkam, P., Wang, T., Lamsal, B., Fei, T., Wang, H., Johnson, L.A., Dasari, M., 2014.
Improved corn ethanol fermentation and oil distribution by using polysaccharide hydrolyzing
enzymes. J. Bioprocess Eng. Biorefinery. 3, 323-331.
Zhang, S, Wang, T., 2016. Destabilization of emulsion formed during aqueous extraction of peanut oil:
synergistic effect of Tween 20 and pH. J. Am. Oil Chem. Soc. 93, 1551-1561.
Page 62
56
Tables and Figures
Figure 1. Lab scale dry-grind ethanol process
Backset, 50%
thin stillage
CCDS, centrifuged at 3000 xg for 10 min Distillers corn oil
Wet Cake Thin Stillage
Evaporation at 80 °C for 30 min with rotary evaporation
Decanting
Ground Corn + Water (or surfactant solution), 1:2, w:w
Liquefaction at 80 °C for 3 h
Simultaneous saccharification and fermentation at 30 °C for 64 h Hydrolyzing Enzyme
Distillation at 80°C for 10 min by rotary evaporation
Page 63
57
Figure 2. Effect of surfactant concentrations on oil partition in thin stillage by decanting. Data sharing the
same letter has no significant difference (p>0.05).
Figure 3. Microscopic observations for surface of wet cake. Left: Control; Right: 500 ppm Tween® 80
added treatment
c c c
b
aa a a a
30
35
40
45
50
55
0 100 200 300 400 500 600 700 800 900 1000
Oil
pa
rtit
ion
in
th
in s
till
ag
e ,%
Surfactant concentration, ppm
Page 64
58
Figure 4. Effect of Tween® 80 addition on fermentation rate and ethanol yield. C500: 500 ppm
Tween® 80 added in fermentation step of control group
Figure 5. Effect of protease and Tween® 80 addition on ethanol production rate and ethanol yield.
Fermgen: 0.5% of dry corn weight protease was added; F500: 0.5% of dry corn weight protease
and 500 ppm Tween® 80 were added
0
5
10
15
20
25
30
35
0 5 10 15 20 25 30 35 40 45 50 55 60 65
g o
f et
ha
no
l p
er 1
00
g d
ry c
orn
Fermentation time, h
Control
C500
0
5
10
15
20
25
30
35
40
0 5 10 15 20 25 30 35 40 45 50 55 60
g e
tha
no
l p
er 1
00
g d
ry c
orn
Fermentation time, h
Control
Fermgen
F500
Page 65
59
Figure 6. Effect of pectinase-cellulase (PC) and Tween® 80 addition on ethanol production rate
and ethanol yield. C: control; PC: 0.2% of dry corn weight pectinase and 0.2% of dry corn weight
cellulase were added; PC500: 0.2% of dry corn weight pectinase, 0.2% of dry corn weight
cellulase and 500 ppm Tween® 80were added
0
5
10
15
20
25
30
35
40
0 5 10 15 20 25 30 35 40 45 50 55 60 65
g e
tha
no
l p
er 1
00
g d
ry c
orn
Fermentation time, h
PC
PC500
C
Oi
l Oi
l
Oi
l
Protein
Tween® 80
Figure 7. The formation of unstable emulsion in different condition
+ = Tween® 80 adding in
CCDS
= Oi
l
+ + Tween® 80 adding in corn
slurry
Page 66
60
Table 1. Effect of Tween® 80 and hydrolyzing enzymes in dry-grind fermentation on ethanol
production.
Treatment Maximum ethanol
yield, g/100 g dry
corn at 64 h
Maximum ethanol
production rate, g/100
g dry corn/ h
Control 28.13 ± 0.43 c 0.67 ± 0.11 d
500 ppm Tween® 80 (C500) 30.71 ± 0.61b 0.67 ± 0.04 d
Pectinase and Cellulase (PC) 34.52 ± 1.54 a 1.04 ± 0.05 c
500 ppm +Pectinase and Cellulase
(PC500)
34.98 ± 0.25 a 1.05 ± 0.10 c
Fermgen 35.19 ± 0.61 a 2.63 ± 0.20 a
500 ppm + Fermgen (500F) 35.25 ± 0.15 a 2.31 ± 0.13 b
Data sharing the same letter in the same column have no significant different (p>0.05).
Table 2. Thin stillage production, solid and oil partition after decanting
Thin stillage
wet yield, %
Solid content in
thin stillage, %
Solid partition
in thin
stillage, %
Oil partition in
thin stillage, %
Control 80.9±0.5 c 7.2±0.3 a 41.0±1.6 c 40.8±0.6 e
500 ppm Tween® 80 (C500) 79.3±1.2 c 6.8±0.2 b 36.02±1.8 d 49.3±0.7 d
Fermgen 85.9±1.3 b 6.8±0.1 b 47.1±2.1 b 52.6±0.1 c
500 ppm + Fermgen (500F) 86.2±0.5 b 6.6±0.09 c 47.9±1.5 b 58.5±1.8 a
Pectinase and Cellulase (PC) 87.1±0.3 a 7.2±0.1 a 52.2±1.0 a 52.3±1.6 c
500 ppm +Pectinase and
Cellulase (PC500)
87.8±0.5 a 6.9±0.3 b 53.1±0.06 a 54.9±1.3 b
Data sharing the same letter in the same column has no significant different (p>0.05).
Page 67
61
Table 3. Total oil content in CCDS, % dry basis
Oil content in CCDS, db%
Control 6.8±0.3 d
500 ppm Tween® 80 (C500) 9.3±0.9 c
Fermgen 13.3±0.1 a
500 ppm + Fermgen (500F) 13.8±0.1 a
Pectinase and Cellulase (PC) 10.7±0.3 b
500 ppm +Pectinase and Cellulase
(PC500)
11.5±0.3 b
Data sharing the same letter in the same column have no significant different (p>0.05).
Table 4. Oil recovery from CCDS
Non-surfactant, %
Surfactant added in corn
slurry, %
Surfactant added
in CCDS, %
Control 7.9±0.7 Cb 31.8±0.9 Aa 11.0±0.9 Bb
Fermgen 4.0±3.8 Cc 24.9±5.9 Ab 9.3±0.4 Bc
PC 17.4±1.7 Ca 24.5±1.8 Ab 19.3±0.9 Ba
C: Control; PC: Pectinase/Cellulase added. Data sharing the same lower-case letter on the same
column have no significant different (p>0.05). Data sharing the same upper-case letter on the same
row have no significant different (p>0.05).
Table 5. Tween® 80 recycling stability in thin stillage backset
Oil distribution in thin stillage, %
Treatment 1: Corn + 100% water 40.8 ± 0.6 b
Treatment 2: Corn + 100% 500ppm 49.6 ± 0.7 a
Treament 3: Corn + 50% 500ppm +
50% B
45.9 ± 1.1 b
Treament 4: Corn + 50% 1000ppm +
50% B
53.8 ± 0.9 a
500ppm: 500 ppm Tween® 80 water solution; 1000 ppm: 1000 ppm Tween® 80water solution; B:
Backset from 500 ppm Tween® 80 treated fermentation. Data sharing the same letter in the same
column have no significant different (p>0.05).
Page 68
62
CHAPTER 4. EFFECTS OF USING HYDROLYZING ENZYMES DURING FERMENTATION
ON CHARACTERISTICS OF DRY DISTILLERS GRAIN WITH SOLUBLES (DDGS)
A paper to be submitted to
Industrial Crops and Products
Lei Fang, Buddhi Lamsal*, Tong Wang*
Food Science and Human Nutrition Department
Iowa State University
Ames, Iowa, USA, 50011
*corresponding authors:
Buddhi Lamsal, Associate Professor
2312 Food Sciences Building
Ames, IA 50010
Tel: 515-294-8681
Email: [email protected]
Tong Wang, Professor
2312 Food Sciences Building
Ames, IA 50011
Tel: 515-294-5448
Email: [email protected]
Page 69
63
Abstract:
Currently, various hydrolyzing enzymes are used in dry-grind ethanol process to improve ethanol and/ or
corn oil yields, but their effects on characteristics of dried distillers grain with solubles (DDGS) are not
thoroughly understood. In this study, the effects of using acid-stable protease, pectinase and cellulase
enzymes during fermentation step on chemical and physical characteristics of DDGS were evaluated.
Effect on DDGS digestibility was tested using an in vitro pig digestion model. The use of protease
increased fiber content (36.12%) and lowered protein digestibility (64%) of DDGS compared to the
control (22.41% and 69%, respectively). The use of pectinase and cellulase also increased fiber content of
DDGS (28.95%) but they significantly improved protein content (26.81%) and protein digestibility (73%)
compared to other treatments. DDGS tended to have a darker color when hydrolyzing enzymes were used.
Therefore, the use of enzymes had significant altered composition and characteristics of DDGS. Pectinase
and cellulase mix is an effective combination to produce high quality DDGS without undesirable effects
on ethanol production.
Keywords: dry distillers grain with solubles (DDGS), in vitro digestion, proximate composition, amino
acid profile, digestibility, color, water holding capacity.
Highlights:
The significant effects of using hydrolyzing enzymes during fermentation on DDGS properties were
observed.
Using protease enzyme reduced protein content and increased fiber content of DDGS.
Using pectinase and cellulase made DDGS darker but increased digestibility of DDGS to pig.
Page 70
64
1 Introduction
Since 2007, 97.1% of total DDGS production has come from dry-grind ethanol plant with the
remaining 2.9% from beverage distillers (Batres-Marquez, 2016). In general, about 17 pounds of DDGS
are produced from one bushel undergoing dry-grind ethanol process. In 2014/15 about 36 million metric
tons (MMT) of DDGS were produced by U.S. ethanol plants, with the largest proportion (72%) consumed
by the U.S. domestic livestock and poultry sectors (Batres-Marquez, 2016); the beef and dairy industries
utilized 85% of DDGS in domestic market (Wisner, 2015).
DDGS has become the most economical and widely available alternative feed ingredient in U.S.
swine diets. Its high energy, protein and lysine content along with its relatively high concentration of
phosphorus and phosphorus digestibility, make it an excellent partial replacement for corn, soybean meal
and inorganic phosphate in swine diets. It was reported by Whitney et al. (2006) that feeding 30% DDGS
in swine finishing diets did not have any detrimental effects on pork muscle quality. Shurson and others
(2004) reported a satisfactory growth performance when feeding up to 25% DDGS in nursery diets.
However, feeding higher levels of DDGS to swine has created some challenges due to the variation in
nutrition content and value, and the digestibility among various sources of DDGS. Especially when the
diet is designed based on protein content, these variations have unpredictable effects on swine growth
performance and pork quality.
There could be many causes to the variations in the DDGS quality. Some of them have been
identified as the proportions of syrup and wet cake during mixing and drying, varying raw material
composition (Belyea et al., 2010) and processing methods (Liu, 2009). Ethanol plants are constantly
improving process technologies to increase profit. However, the effect of such variations on DDGS
quality has not been reported.
Page 71
65
One of the widely applied technologies in ethanol plants is the use of hydrolyzing enzymes during
fermentation. These enzymes are used to improve ethanol production and corn oil recovery, and some
commercial enzyme products are available on the market. For example, FermgenTM (Dupont) is an acid
proteolytic enzyme, which can randomly hydrolyze corn protein to enhance yeast efficiency; OlexaTM
(Novozymes) is an acid proteolytic enzyme, which targets oleosin protein that stabilizes oil body and
helps to extract more oil; AvantecTM (Novozymes) is an enzymes cocktail, which claims to have higher
ethanol yields and oil recovery yield. A few studies have been reported in literature to investigate the
effects of hydrolyzing enzymes on fermentation performances, mainly on ethanol yield. Johnston and
McAloon (2014) used acid-stable protease in fermentation step and found an increase of ethanol
production rate. Non-starch polysaccharides (NSPs) hydrolyzing enzymes improved ethanol production
by producing more of fermentable sugar and making the starch more available (Yao et al., 2014;
Luangthongkam et al., 2015; Klosowski et al., 2010).
The protease and NSPs hydrolyzing enzymes could hydrolyze the non-fermentable matters during
dry-grind ethanol process. These interactions will affect the resulting DDGS composition. NSPs
hydrolyzing enzymes could degrade cell wall components and change the relative contents of other
components. Protease could reduce the protein content but increase free amino acid content, and relatively
increase fiber content. Thus, we hypothesized that the enzyme treatments in fermentation step of dry-
grind ethanol process could significantly affect DDGS characteristics, including digestibility. The
objectives of the study were 1) to determine the effects of using hydrolyzing enzymes during fermentation
on DDGS composition and physical properties and 2) to identify the effects of enzyme hydrolysis during
fermentation on DDGS digestibility by an in vitro pig digestion model.
Page 72
66
2 Materials and Methods
2.1 Materials
Fermgen is an acid-stable protease from Trichoderma reesei with activity 1000 SAP units/g and
provided by DuPont Industrial Biosciences (Palo Alto, CA). Cellulase (activity 75000 CU/g) and
pectinase (activity 3500 ENDO-PG/g) were provided by Bio-Cat Biotechnology Company (Troy, VA).
Ground corn, α-amylase, gluco-amylase and chlorine dioxide were provided by local dry-grind ethanol
plant (Lincolnway Energy, LLC, Nevada, Iowa). Porcine pepsin (P-7000), pancreatin solution (Grade IV)
and amyloglucosidase (amyloglucosidase from Aspergillus niger; 120 U/g) were bought from Sigma
Aldrich (Saint Louis, MO, USA). Other chemicals, including hydrochloride acid, sulfuric acid, sodium
hydroxide, phosphate buffer, were bought from Fisher Scientific (Fairlawn, NJ, USA).
2.2 Dry-grind ethanol process and preparation of DDGS samples
The liquefaction and simultaneous saccharification and fermentation of the corn slurry were
performed using a 250-mL Tornado IS6 Overhead Stirring System (Radleys Discovery Technologies,
Shire Hill, Saffron Walden, UK) equipped with an anchored stirring shaft. Ground corn was mixed with
cold DI water at a 1:2 ratio in 250-mL round-bottom flasks. The total amount of slurry was maintained at
225 – 230 g. α-Amylase (0.15 mL) was added to the slurry, and the slurry was mixed and heated at 80°C
for 3 h. After that, the flasks were cooled to 30°C in an ice bath. The pH of the cooled slurry was adjusted
to 4.0 with 3 M sulfuric acid. Chlorine dioxide (0.021 mL), ammonium sulfate (0.065 mL of 0.2 g/g
water), gluco-amylase (0.15 mL) and dry yeast (0.15 g) were added. Fermentation was carried out at
30 °C for 64 h with continuous stirring at 190 rpm. For the treatment of adding hydrolyzing enzymes in
fermentation step, 0.375 ml of protease or 0.3 g mixture of Pectinase and cellulase (PC, 1:1, w:w) was
added before starting fermentation.
Page 73
67
2.3 DDGS production
After fermentation, the whole beer went through rotary evaporation at 80 °C for 10 mins to produce
whole stillage and ethanol. Whole stillage was further separated into thin stillage and wet cake by a lab-
scale decanting device (Wang et al., 2009). DDGS was made by drying the mixture of 100% wet cake and
50% thin stillage from the same batch of fermentation at 50 °C for 72 h in the forced air oven.
2.4 Proximate composition analyses for DDGS
Contents of crude fat, ash, and crude protein were measured by Eurofins Scientific Company (Des
Moines, IA). Fiber profile was analyzed by a science laboratory in Department of Agronomy, Iowa State
University. AOAC standard methods were followed for all of these tests.
2.5 Free and total amino acid in DDGS
Free amino acids (FAA) of DDGS were quantified by using a Phenomenex EZ:faast kit™. FAA
extract for the EZ: faast analysis was prepared according to Hacham et al. (2002) with modifications. To a
1.5 mL micro centrifuge tube, freeze-dried DDGS (200 mg), norvaline (internal standard: 150 µL of 0.2
mM/mL) and 500 µL of solvent mixture (DI water: chloroform: methanol in 3:5:12, v/v) were added and
vortex mixed. The mixture was centrifuged (3000 g for 10 min) and the supernatant was collected in a
new tube. The solid precipitate was extracted a second time using a fresh batch of same solvent mixture,
and the supernatants from the two extractions were combined. To the tube containing supernatants, 350
µL of chloroform and 450 µL of DI water were added, vortexed and centrifuged (3000 xg for 10 min).
The upper water – methanol phase was pipetted into a new tube and 100 µL of sample was prepared by
using FAA analysis Phenomenex EZ: faast kit™ for GC analysis. One µL of the derivitized sample was
injected into Phenomx CGO-7169 ZB-AAA capillary column (10 m – 0.25 mm ID). The gas
chromatograph (6890N, Agilent Technologies Inc., Agilent Technologies, Inc., Wilmington, DE) had
helium as a carrier gas with a linear flow rate of 68 cm3/s. The GC was equipped with an FID detector,
Page 74
68
which was maintained at 250 °C. A split injector was used at a temperature of 250 °C, with split ratio of
15:1. Initial column temperature was 110 °C which was raised immediately after injection to 320 °C at a
rate of 30 °C/min. For the MS detector (5973, Agilent Technologies Inc., Agilent Technologies, Inc.,
Wilmington, DE), the ion source was operated at 240 °C with electron multiplier voltage at 1647 VDC.
For total amino acid analysis, Gas-phase hydrolysis of the freeze-dried DDGS samples was
performed in a Pico-tag Waters workstation (Waters Cooperation, Milford, MA). Dried solids (20 mg)
were carefully weighed into pyrolyzed (550 °C for 3 h) glass tubes. Before adding the sample, norvaline
(internal standard: 250 µL of 0.2 mM) was fixed in the tubes by drying in a Speed Vac concentrator
(Savant SVC-100H, Farmingdale, NY). The tubes with test samples were placed in the reaction vessel and
HCl (350 µL of 6 N) and phenol (15 µL) were added to the bottom of the reaction vessel. The reaction
vessel was then capped (with an open valve) and placed on a pico-tag workstation (in a hood) to create an
inert atmosphere in the vessel by alternately subjecting to vacuum and nitrogen (four times). The reaction
vessel valve was then closed, removed from the pico-tag work station and placed in the heater at 150 °C
for 65 min. The reaction vessel was carefully removed from the heater, the vacuum was released, and the
tubes were transferred to a new reaction vessel and vacuumed until all the acid was evaporated (10 min).
EDTA of 25 µL (1 µL of 20% EDTA solution in 9 µL of DI water) was then added to the gas-phase
hydrolyzed sample in the tube. The gas-phase hydrolyzed DDGS was analyzed following the same
procedure used for the FAA analysis.
The same total amino acid quantification procedure was used for the solid residue after in vitro
digestion. Then, the total amino acid in DDGS minus the total amino acid in the solid residue was the
digestible amino acid. The procedure of in vitro digestion is described in the Section 2.7.
2.6 Energy content of DDGS
Gross energy was estimated based on compositional profile by the following equation:
Page 75
69
Gross energy, kcal/kg = 4553 + (45.6 × 𝐶𝑟𝑢𝑑𝑒 𝑓𝑎𝑡%) (𝐾𝑒𝑟𝑟 𝑒𝑡 𝑎𝑙. , 2013)
2.7 In vitro digestion model
Enzymatic digestion in the stomach and small intestine was simulated using a modified method
described by Boisen (1991) and Anguita et al (2006). Briefly, 10 g of sample was mixed with phosphate
buffer (250 mL, 0.1 M, pH 6.0) and HCl solution (30 mL, 0.2 M), and the pH was adjusted to 2.0 using 1
M HCl or 1 M NaOH. Porcine pepsin (1 mg/ml) was added, and samples were incubated for 4 h at 40 °C.
Afterthat, phosphate buffer (100 mL, 0.2 M, pH 6.8) and NaOH solution (40 mL, 0.6 M) were added, and
the pH was adjusted to 6.8. Pancreatin solution (10 mL) and amyloglucosidase (55 mg) were added, and
samples were incubated for 3.5 h at 40 °C. After pepsin digestion, the mixture was centrifuged (15 min at
room temperature and 3000 xg) and decanted into supernatant and residue. The supernatant and residue
were freeze-dried. Supernatant was boiled for 30 min before freeze drying.
Since nutrients in supernatant were recognized as digestible nutrients for pig. Four related nutritional
characters were derived, which were dry matter digestibility, protein digestibility, digestible amino acid
content, and amino acid digestibility. Digestible amino acid content was determined by measuring the
amino acid profile in supernatant. These parameters were calculated using following equations, which
were adjusted from Vries et al. (2013):
Dry matter digestibility, %
=𝐷𝑟𝑦 𝑚𝑎𝑡𝑡𝑒𝑟 𝑐𝑜𝑛𝑡𝑒𝑛𝑡 𝑖𝑛 𝑠𝑢𝑝𝑒𝑟𝑛𝑎𝑡𝑎𝑛𝑡 𝑎𝑓𝑡𝑒𝑟 𝑖𝑛 𝑣𝑖𝑡𝑟𝑜 𝑑𝑖𝑔𝑒𝑠𝑡𝑖𝑜𝑛, 𝑔
𝐷𝑟𝑦 𝑚𝑎𝑡𝑡𝑒𝑟 𝑐𝑜𝑛𝑡𝑒𝑛𝑡 𝑖𝑛 𝐷𝐷𝐺𝑆 𝑏𝑒𝑓𝑜𝑟𝑒 𝑖𝑛 𝑣𝑖𝑡𝑟𝑜 𝑑𝑖𝑔𝑒𝑠𝑡𝑖𝑜𝑛, 𝑔× 100%
Protein digestibility, % =𝑃𝑟𝑜𝑡𝑒𝑖𝑛 𝑐𝑜𝑛𝑡𝑒𝑛𝑡 𝑖𝑛 𝑠𝑢𝑝𝑒𝑟𝑛𝑎𝑡𝑎𝑛𝑡 𝑎𝑓𝑡𝑒𝑟 𝑖𝑛 𝑣𝑖𝑡𝑟𝑜 𝑑𝑖𝑔𝑒𝑠𝑡𝑖𝑜𝑛, 𝑔
𝑃𝑟𝑜𝑡𝑒𝑖𝑛 𝑐𝑜𝑛𝑡𝑒𝑛𝑡 𝑖𝑛 𝐷𝐷𝐺𝑆 𝑏𝑒𝑓𝑜𝑟𝑒 𝑖𝑛 𝑣𝑖𝑡𝑟𝑜 𝑑𝑖𝑔𝑒𝑠𝑡𝑖𝑜𝑛, 𝑔 × 100%
Page 76
70
Digestible amino acid content, mg/g (lysine as example)
= 𝐿𝑦𝑠𝑖𝑛𝑒 𝑐𝑜𝑛𝑡𝑒𝑛𝑡 𝑖𝑛 𝐷𝐷𝐺𝑆, 𝑚𝑔/𝑔
−𝐿𝑦𝑠𝑖𝑛𝑒 𝑐𝑜𝑛𝑡𝑒𝑛𝑡 𝑖𝑛 𝑟𝑒𝑠𝑖𝑑𝑢𝑒 𝑎𝑓𝑡𝑒𝑟 𝑖𝑛 𝑣𝑖𝑡𝑟𝑜 𝑑𝑖𝑔𝑒𝑠𝑡𝑖𝑜𝑛, 𝑚𝑔
𝑊𝑒𝑖𝑔ℎ𝑡 𝑜𝑓 𝐷𝐷𝐺𝑆 𝑏𝑒𝑓𝑜𝑟𝑒 𝑖𝑛 𝑣𝑖𝑡𝑟𝑜 𝑑𝑖𝑔𝑒𝑠𝑡𝑖𝑜𝑛, 𝑔
Amino acid digestibility, % (lysine as example)
=𝐷𝑖𝑔𝑒𝑠𝑡𝑖𝑏𝑙𝑒 𝐿𝑦𝑠𝑖𝑛𝑒 𝑐𝑜𝑛𝑡𝑒𝑛𝑡 𝑎𝑓𝑡𝑒𝑟 𝑖𝑛 𝑣𝑖𝑡𝑟𝑜 𝑑𝑖𝑔𝑒𝑠𝑡𝑖𝑜𝑛, 𝑚𝑔
𝑇𝑜𝑡𝑎𝑙 𝐿𝑦𝑠𝑖𝑛𝑒 𝑐𝑜𝑛𝑡𝑒𝑛𝑡 𝑖𝑛 𝐷𝐷𝐺𝑆 𝑏𝑒𝑓𝑜𝑟𝑒 𝑖𝑛 𝑣𝑖𝑡𝑟𝑜 𝑑𝑖𝑔𝑒𝑠𝑡𝑖𝑜𝑛, 𝑚𝑔× 100%
2.8 Surface color measurement
A Minolta colorimeter (Model CR-300) was used to measure surface colors of DDGS. The colors
were expressed in L* a* b* color space, in which L* indicates lightness, a* is redness, and b* is
yellowness.
2.9 Water holding capacity of DDGS
Water holding capacity (WHC) was determined by soaking 250 mg of dried material in 10 mL of
water for 24 h at room temperature. Samples were centrifuged in room temperature at 5000 xg for 20 min,
and subsequently the tube was inverted and drained for 15 min. Water holding capacity was calculated as
the weighed quantity of water retained per gram of dry material (Pustjens et al., 2012).
2.10 Statistical analysis
All the DDGS samples were produced from three separate batches of fermentation. For each batch of
fermentation, three different types of DDGS were produced, including control, Fermgen, and pectinase
and cellulase DDGS. All the analyses were duplicated on sample. The data were analyzed using SAS
(Version 9.4, SAS Institute Inc. Cary, NC) to test treatment difference at 95% significant level.
Page 77
71
3 Results and Discussion
3.1 Chemical and physical characteristics
3.1.1 Effect of using enzymes on composition of DDGS
The compositions of DDGS are given in Table 1. Dietary fibers accounted for the largest proportion
in all DDGS samples. The Fermgen DDGS had the highest content of NDF (36.12%) and ADF (9.26%),
and the pectinase and cellulase (PC) DDGS had significant higher fiber content than that in control
DDGS. The remaining dry matters include crude fat, crude protein and ash. The control DDGS had
significantly lower crude fat content (8.55%) than Fermgen (10.84%) and PC (10.70%) DDGS. The PC
DDGS had the highest crude protein content (26.81%) compared with the control (22.41%) and Fermgen
(23.40%) DDGS. The ash contents in Fermgen (3.61%) and pectinase and cellulase (3.50%) DDGS were
significantly higher than that in control DDGS (2.96%). Ethanol yield had significant effects on
compositions, since the efficiency of converting starch to ethanol directly relates to starch residue in
DDGS. The ethanol yield in the control was 28 g ethanol/100 g dry corn, which was significantly lower
than Fermgen (35 g ethanol/100 g dry corn) and PC (34 g ethanol/100 g dry corn) treated fermentation.
The low fermentation efficiency in the control left more unconverted starch in DDGS, which reduced the
relative proportion of other DDGS components comparing with enzymes treated DDGS.
Moreover, DDGS dry matter yields significantly reduced when enzymes were used: from 11.53 g/100
g dry corn in control to 9.25 g/100 g dry corn for Fermgen DDGS and 9.01 g/100 g dry corn for PC
DDGS. There were two factors, fermentation efficiency/starch residue and particle size reduction, which
contribute to the lower DDGS yield in enzyme treated DDGS. Enzyme hydrolysis reduced the particle
size of non-fermentable matters, and these hydrolyzed matters went to the thin stillage by decanting,
which resulted in higher solid partition in thin stillage than that in the control. Since only part of the thin
Page 78
72
stillage (50%) stream was mixed with wet cake for making DDGS, using hydrolyzing enzymes during
fermentation reduced the DDGS yields.
Fermgen DDGS had a similar crude protein content (23.40%) compared to the control (22.41%),
whereas, a lower starch residue in Fermgen DDGS was expected because of the higher ethanol yield. The
functions of using hydrolyzing enzymes for non-starch matters in dry-grind ethanol process have been
reported by several studies. These included improving ethanol yield, affecting efficiency of decanting and
increasing oil partition in thin stillage (Johnston and McAloon, 2014; Yao et al., 2014; Sekhon et al.,
2015; Luangthongkam et al., 2015). Fermgen is an acid-stable protease, which hydrolyzes corn protein to
produce free amino acid and short-chain peptides for yeast. The breakdown amino acids and peptides may
not be fully used by yeast, and moved to thin stillage by decanting. In this study, only 50% of thin stillage
was mixed with wet cake to produce DDGS, which meant that a high amount of amino acids were lost in
thin stillage and led to a low protein content in Fermgen DDGS when low starch residue in Fermgen
DDGS was expected. However, corn fibers in Fermgen treated ethanol process still remained unmodified,
and accumulated in wet cake after decanting, which contributed to the highest fiber content in Fermgen
DDGS.
Pectinase and cellulase (PC) significantly affected the compositions of DDGS. Even though, the
lower starch residue relatively increased the proportion of other components, which gave PC DDGS a
significantly higher fiber content (28.95%) and protein content (26.81%) compared to the control (23.39%
and 22.41%, respectively, Table 1). The fiber content of PC DDGS was still, however, significantly lower
than Fermgen DDGS. PC can hydrolyze pectin and cellulose, which are the major cell wall components.
Pectinase not only hydrolyzes pectic substance, but also has been reported to improve cellulose and
hemicellulose hydrolysis. Because pectic substance sterically covered cellulose and hemicellulose,
breaking down the barrier can significantly improve hydrolyzing cellulose and hemicellulose (Ben-
Page 79
73
Shalom, 2006). The use of PC enzymes hydrolyzed the cell wall components to produce some
fermentable monosaccharide and make the corn starch available, thus PC enzymes improved the ethanol
yield in fermentation. The hydrolysis of cell wall also resulted in smaller fragments that may have been
moved to thin stillage after decanting. When making DDGS, only part of the fibers in thin stillage were
added back to DDGS that resulted in lower fiber content in PC DDGS than Fermgen DDGS.
3.1.2 Gross energy content of DDGS
The gross energy value was estimated by using an equation reported by Kerr et al. (2013), which was
based on the crude fat content for mono-gastric animals. As shown in Table 1, Enzyme treated DDGS had
significantly higher energy contents, which were 5027 (Fermgen) and 5020 (PC) kcal/kg DDGS
compared to the control DDGS (4922 kcal/kg DDGS). Enzyme hydrolysis significantly increased the
relative content of crude fat by decreasing the contents of other components, i.e. starch and fibers.
Metabolizable energy and digestible energy were not calculated, due to the difficulty in estimating
digestibility with the complex composition profiles of DDGS in the current study. The energy and nutrient
contents in DDGS are more variable than in corn and soybean meal, because of the variation of DDGS
components from different sources. Moreover, the effects of enzyme hydrolysis on properties of corn
protein and fibers were largely unknown. Methods for estimating energy content can quickly become
outdated due to evolving production technologies being implemented in ethanol plants. This created
significant challenges for determining relative economic value and establishing accurate nutrient value
when formulating swine diets (Urriola et al., 2014).
3.1.3 Effects of enzyme hydrolysis on amino acid profile of DDGS
PC DDGS had the higher contents for most of amino acids than the control and Fermgen DDGS
(Table 2). The amino acids of greatest practical importance in swine diet formulation are lysine,
tryptophan, threonine and methionine, and lysine is generally the first limiting amino acid in most of diets
Page 80
74
(Lammers et al., 2007). In current study, PC DDGS had the highest contents for these four amino acids,
whereas, Fermgen DDGS had very similar contents of these four amino acids compared to the control.
The crude protein content maybe the major factor for the variation of amino acid content in DDGS. For
the same protein content, the total amino acid content of Fermgen DDGS was similar to that of the
control. However, the lysine concentration was very similar in control (7.31 mg/g dry matter), Fermgen
(7.41 mg/g dry mater) and PC (7.61 mg/g dry matter) DDGS. Although the crude protein content in
Fermgen DDGS was similar to the control DDGS, there was significantly higher free amino acid content
in Fermgen DDGS (6.57 mg/g dry matter) than that in the control (1.13 mg/g dry matter) and PC (0.93
mg/g dry matter) DDGS, as shown in Table 2. It could be explained by the protease enzyme hydrolysis,
which produced free amino acids during fermentation and these free amino acids went to DDGS within
thin stillage as backset.
The value of total amino acid content is much lower than the value of crude protein content for all
three treatments. The sources of the variation could be due to measuring method, instrument and
chemicals (Badawy et al., 2008). Crude protein is not a true measure of amino acid content of a feed, but
it is a measure of the amount of total nitrogen present in a particular sample (Lammers et al., 2007). Total
nitrogen determination by the Dumas combustion method includes all inorganic and organic nitrogen.
Nonetheless, the proportions of total amino acid content to crude protein content are very similar in these
three DDGS samples, which was 79%. It is more meaningful to compare the contents of amino acids
among three DDGS samples than crude proteins.
3.2 Surface color and water holding capacity of DDGS
Enzyme hydrolysis had significant effect on color of DDGS. As shown in Table 3, enzyme hydrolysis
had no effect on redness (a*) and yellowness (b*), whereas, significant differences were found in
lightness (L*), which were 45.65 (Control), 33.94 (Fermgen), and 37.51 (PC). Using hydrolyzing
Page 81
75
enzymes made DDGS visibly darker than control, and Fermgen DDGS was even darker than PC DDGS.
The main reason for this is attributed in literature to enhanced Maillard reactions during producing
DDGS. Ames (1990) summarized that pentose sugars reacted more readily than hexoses which were more
reactive than disaccharides. Baxter (2006) reported that tryptophan, histidine and lysine were vulnerable
to Maillard process comparing with other free amino acids. The addition of pectinase hydrolyzed pectin
and released pentose sugars, such as xylose and arabinose. In addition, the use of Fermgen significantly
increased the free amino acid content comparing to the control and PC treatment. Enzyme hydrolysis
provided more substrates to Maillard reaction, and the protease had more significant effect than the
pectinase and cellulase due to release of more free amino groups during hydrolysis.
Water holding capacity is very important for effective digestion to occur in the animal (Ngoc et al.,
2012). Kyriazakis and Emmans (1995) summarized that the water holding capacity could be an
appropriate measure to predict the maximum feed intake capacity of pigs, and they found that diets with
higher water holding capacities decreased feed intake by the pig. The feed with higher water holding
capacity can hold more water and has a larger volume than the one with lower capacities. Thus, the higher
water holding capacity feed could make the animal satiated with smaller amount of feed, and less
nutrients can be digested before the animal stopping eating. Pectinase and cellulase DDGS had the lowest
water holding capacity value (3.29 g water/g dry matter) compared to the control (3.70 g water/g dry
matter) and Fermgen (4.18 g water/g dry matter) DDGS. Polysaccharides were the major components in
DDGS and had high water holding capacity. The Fermgen DDGS had highest water holding capacity due
to the highest fiber content (Table 1). The PC DDGS had higher fiber content but lower WHC compared
to the control group. This observation could be explained by the function of pectinase and cellulose,
which broke the cell wall structure and decreased its ability to hold water.
Page 82
76
3.3 Protein and dry matter digestion affected by enzyme treatment
The protein digestibility and the dry matter digestibility of DDGS are shown in Figure 1 and Figure 2.
The dry matter digestibility of control (46%) and PC DDGS (45%) were significantly higher than
Fermgen DDGS (31%). Moreover, Fermgen DDGS had significnatly lower protein digestibility, because
only 63% of total protein in DDGS was solublilized and partitioned in supernatant after in vitro digestion,
compared to the control (69%) and PC (73%) DDGS.
There are many factors that affect the digestibility of nutrients in feed, but the most possible reason in
the current study was the compositional profile of DDGS, especially the dietary fibers which affect the
digestibility of other components. The major concern when including fiber in diet for mono-gastric animal
is that a high fiber content can decrease nutrient utilization and lower net energy values (Noblet and Le
Goff, 2001). However, these carbohydrates are not only indigestible to gastrointestinal tract enzymes, but
also reduce enzyme efficiency on digesting other nutrients, such as crude protein, lipid, and starch
(Gutierrez et al., 2014; Zhang et al., 2013). In this case, the high fiber content in Fermgen DDGS
significanlty reduced the digestibility of other nutritional components in the DDGS, especially for crude
protein and essential amino acids.
PC DDGS had higher fiber content, but its protein digestibility was also higher compared to the
control. PC DDGS had darker color but higher protein digestibility than the control. It has been reported
that the L* was significantly correlated with digestibility of lysine and other amino acids. Cromwell et al.
(1993) reported that lysine concentrations tended to be the highest in the lightest colored DDGS sources.
Ergul et al. (2003) shown that L* was significantly correlated with digestibility of lysine and other amino
acids in a poultry study. Similarly, studies with pigs showed lower amino acid digestibility in DDGS
sources that had lower L* values compared with higher L* values (Whitney et al., 2000; Fastinger and
Mahan, 2006). In the current study, the results of Fermgen DDGS agreed with those reports. However, the
Page 83
77
results from PC DDGS did not. PC DDGS had significantly higher protein digestibility (Figure 1), amino
acid digestibility (Table 4) and slightly higher lysine content (Table 2), but with significantly darker color
than the control. That could be a result of the changings in corn cell wall structure that occur during the
PC enzymes hydrolyzing, as illustrated by Yu and Nuez-Ortin (2010) that the high fraction of protein is
associated with cell wall material in DDGS. The benefit of using pectinase and cellulase enzyme on
DDGS digestibility has also been confirmed by Vries and others (2013), who reported the increased
protein digestibility in DDGS when cell wall degrading enzyme was blended with DDGS. They explained
that protein associated with cell wall material was released more easily after enzyme treatment.
3.4 Amino acid digestibility affected by enzyme treatment
The effects of enzyme hydrolysis on amino acid digestibilities are shown in Table 4. Fermgen DDGS
had the lowest digestibility and PC DDGS had the highest digestibility for almost all amino acids. The
average digestibility for all amino acids were 59.2% (control), 43.9% (Fermgen) and 70.0% (PC) in these
three treatments. For the specific amino acids with critical functions in pig diet, Fermgen DDGS had the
lowest digestibility for lysine, tryptophan, threonine and methionine, especially lysine which only had
digestibility of 30.9% compared to the control (50.3%) and PC (52.3%) DDGS. Fermgen DDGS had the
similar crude potein content and total amino acid content to the control DDGS but significantly lower
amino acid digestibility than the control. It could be explained by the same reason as its low crude protein
digestibility in Section 3.3, that the high fiber content in Fermgen DDGS limited its protein digestibility
for pigs. Thererfore, PC DDGS might be an excellent choice for pig diet, because it can be a better source
for required amino acids than the Fermgen DDGS.
3.5 Compositional variations between current study and other works
Some variations were found between the compositions of DDGS in current study and the profiles of
general DDGS on the market, such as crude fat content (generally 10~12% versus 8~10% in this study)
Page 84
78
and crude protein content (generally >30% versus 22-27% in this study). Wider variations among DDGS
products from different sources are very common. In the current study, the DDGS for enzyme treatments
was produced from only one batch of fermentation without backset recycling; the ratio of mixing syrup
and wet cake might be significant different from that of conventional ethanol plants. Thus, the
compositions of DDGS from the current study can only be compared to the treatments in the same study
instead of with the results of other studies with industry-scale DDGS.
4 Conclusion
The use of hydrolyzing enzymes during fermentation had significant effects on the chemical, physical
and nutritional characteristics of DDGS. Under the similar processing conditions, acid-stable protease
(Fermgen) increased the fiber contents and reduced protein and dry matter digestibility to pig; pectinase
and cellulase increased both protein and fiber contents, and had higher protein and dry matter digestibility
to pig. Pectinase and cellulase mix could be an excellent choice for ethanol plants to improve not only
ethanol yield, but also DDGS quality. However, the use of hydrolyzing enzymes could give darker color
to DDGS, which might affect its market price. Dry-grind ethanol processors need to evaluate the effects
of enzymes on products quality, and carefully control process conditions for increasing quality and profit.
5 Acknowledgment
The authors would like to thank the ISU Fermentation Institute and Bioeconomy Institute for funding
and supporting this research, and Bio-Cat and DuPont Industrial Biosciences companies for providing
enzyme samples.
Page 85
79
References:
Ames, J.M., 1990. Control of the maillard reaction in food systems. Trends Food Sci. Technol. 1, 150-
154.
Anguita, M., Gasa, J., Matin-Orue, S. M., Perez, J. F., 2006. Study of the effect of technological processes
on starch hydrolysis, non-starch polysaccharides solubilization and physicochemical properties of
different ingredients using a two-step in vitro system. Animal Feed Sci. Tech. 129, 99-115.
AOAC, 2005. Official Methods of Analysis. AOAC, Arlington, VA.
Badawy, A. A., Morgan, C. J., Turner, J. A., 2008. Application of the Phenomenex EZ: fasst amino acid
analysis kit for rapid gas-chromatographic determination of concentrations of plasma tryptophan
and its brain uptake competitors. Amino Acids. 34, 587-596.
Baxter, J.H., 2006. Free amino acid stability in reducing sugar systems. J. Food Sci. 60, 405-408.
Batres-Marquez, P., 2016. U.S. DDGS exports. http://www.decision-innovation.com/blog/disinsights/us-
ddgs-exports/ (Accessed on January 10th, 2017)
Belyea, R.L., Rausch, K.D., Clevenger, T.E., Singh, V., Johnston, D.B., Tumbleson, M.E., 2010. Sources
of variation in composition of DDGS. Animal Feed Sci. Techonl. 159, 122-130.
Boisen, S., 1991. A model for feed evaluation based on in vitro digestible dry matter and protein. In:
Fuller, M.F. (Editor), In Vitro Digestion for Pigs and Poultry. CABI international, United Kingdom,
pp. 135-145.
Ben-Shalom, N., 2006. Hindrance of hemicellulose and cellulose hydrolysis by pectic substances. J. Food
Sci., 51, 720-721.
Cromwell, G.L., Herkelman, K.L., Stahly, T.S., 1993. Physical, chemical, and nutritional characteristics
of distillers dried grains with solubles for chicks and pigs. J. Anim. Sci. 71, 679-686.
Ergul, T., Martinez-Amezcua, C., Parsons, C., Walters, B., Brannon, J., Noll, S.L., 2003. Amino acid
digestibility in corn distillers dried grains with solubles. Poultry Sci. 82, 70.
Fastinger, N.D., Mahan, D.C., 2006. Determination of the ileal AA and energy digestibilities of corn
distillers dried grains with solubles using grower-finisher pigs. J. Anim. Sci. 84, 1722-1728.
Gutierrez, N.A., Serao, N.V.L., Derr, B.J., Zijlstra, R.T., Patience, J.F., 2014. Relationships among dietary
fiber components and the digestibility of energy, dietary fiber, and amino acids and energy content
of nine corn coproducts fed to growing pigs. J. Anim. Sci. 92, 4505-4517.
Hacham, Y., Schuster, G., Amir, R., 2002. The N-terminal region of Arabidopsis cystathionine gamma-
synthase plays an important regulatory role in methionine metabolism. Plant Physiol. 128, 454-462.
Johnston, D.B., McAloon, A.J., 2014. Protease increases fermentation rate and ethanol yield in dry-grind
ethanol production. Bioresource Techno. 154, 18-25.
Kerr, B.J., Dozier, W.A., Shurson, G.C., 2013. Effects of reduced-oil corn distillers dried grains with
solubles composition on digestible and metabolizable energy value and prediction in growing pigs.
J. Anim. Sci. 91, 3231–3243.
Klosowski, G., Mikulski, D., Czuprynski, B., Kotarska, K., 2010. Characterisation of fermentation of
high-gravity maize mashes with the application of pullulanase, proteolytic enzymes and enzymes
degrading non-starch polysaccharides. J. Biosci. Bioeng. 109, 466-471.
Kyriazakis, I., Emmans, G. C., 1995. The voluntary feed intake of pigs given feeds based on wheat bran,
dried citrus pulp and grass meal, in relation to measurements of feed bulk. Br. J. Nutr. 73, 191-207.
Lammers, P. J., Stender, D. R., Honeyman, M. S., 2007. Nutrients for pigs. IPIC NPP310. Available at:
https://www.ipic.iastate.edu/publications/310.nutrients.pdf. (Accessed on February 5th, 2017)
Liu, K. S. 2009. Effects of particle size distribution, compositional and color properties of ground corn on
quality of distillers dried grains with solubles (DDGS). Bioresour. Technol. 100, 4433-4440.
Page 86
80
Luangthongkam, P., Fang, L., Noomhorm, A., Lamsal, B., 2015. Addition of cellulolytic enzymes and
phytase for improving ethanol fermentation performance and oil recovery in corn dry-grind process.
Ind. Crop. Prod. 77, 803-808.
Ngoc, T.T.B., Len, N.T., Lindberg, J.E., 2012. Chemical characterization and water holding capacity of
fibre-rich feedstuffs used for pigs in Vietnam. Asian-Ausralas J. Anim. Sci. 25, 861-868.
Noblet, J., Le Goff, G.I., 2001. Effect of dietary fibre on the energy value of feeds for pigs. Anim. Feed
Sci. Technol. 90, 35-52.
Pustjens, A. M., Vries, S. D., Gerrits, W. J. J., Kabel, M., A., Schols, H. A., Gruppen, H., 2012. Residual
carbohydrates from in vitro digested processed rapeseed (Brassica napus) meal. J. Agric. Food
Chem. 60, 8257-8263.
Sekhon, J.K., Jung, S., Wang, T., Rosentrater, K., Johnson, L.A., 2015. Effect of co-products of enzyme-
assisted aqueous extraction of soybeans on ethanol production in dry-grind corn fermentation.
Bioresource Technol. 192, 451-460.
Shurson, G., Spiehs, M., Whitney, M., 2004. The use of maize distillers dried grains with solubles in pig
diets. Pig News Information. 25, 75-83.
Urriola, P. E., Li, M., Kerr, B. J., Shurson, G. C., 2014. Evaluation of prediction equations to estimate
gross, digestible, and metabolizable energy content of maize dried distillers grains with solubles
(DDGS) for swine based on chemical composition. Anim. Feed Sci. Technol. 198, 196-202.
Vries, S.D., Pustjens, A.M., Kabel, M.A., Salazar-Villanea, S., Hendriks, W.H., Gerrits, W.J.J., 2013.
Processing technologies and cell wall degrading enzymes to improve nutritional value of dried
distillers grain with solubles for animal feed: an in vitro digestion study. J. Agric. Food Chem. 61,
8821-8828.
Wang, H., Wang, T., Pometto III, A. L., Johnson, L. A., 2009. A laboratory decanting procedure to
simulate whole stillage separation in dry-grind corn ethanol process. J. Am. Oil Chem. Soc. 86,
1241-1250.
Whitney, M.H., Shurson, G.C., Johnston, L.J., Wulf, D.M., Shanks, B.C., 2006. Growth performance and
carcass characteristics of grower-finisher pigs fed high-quality corn distillers dried grain with
solubles originating from a modern Midwestern ethanol plant. J. Anim. Sci. 84, 3356-3363.
Whitney, M.H., Spiehs, M.J., Shurson, G.C., and Baidoo, S.K., 2000. Apparent ileal amino acid
digestibility of corn distiller’s dried grains with solubles produced by new ethanol plants in
Minnesota and South Dakota. J. Anim. Sci. 78, 108 (Suppl. 1).
Wisner, R., 2015. Estimated U.S. Dried Distillers Grains with Solubles (DDGS) Production & Use.
http://www.extension.iastate.edu/agdm/crops/outlook/dgsbalancesheet.pdf (Accessed on February
2nd, 2017)
Yao, L., Luangthongkam, P., Wang, T., Lamsal, B., Fei, T., Wang, H., Johnson, L.A., Dasari, M., 2014.
Improved corn ethanol fermentation and oil distribution by using polysaccharide hydrolyzing
enzymes. J. Bioprocess Eng. Biorefinery. 3, 323-331.
Yu, P., Nuez-Ortin, W. G., 2010. Relationship of protein molecular structure to metabolizable proteins in
different types of dried distillers grains with solubles: a novel approach. Br. J. Nutr. 104, 1429-
1437.
Zhang, W., Li, D., Liu, L., Zhang, J., Duan, Q., Yang, W., Zhang, L., 2013. The effects of dietary fiber
level on nutrient digestibility in growing pigs. J. Anim. Sci. Biotechnol. 4, 1-7.
Page 87
81
Tables and Figures
Figure 1. Crude protein digestibility of DDGS affected by enzyme treatment
Figure 2. Dry matter digestibility of DDGS affected by enzyme treatment
69 6473
0
10
20
30
40
50
60
70
80
90
100
Control Fermgen Pectinase and
cellulase
Pro
tein
dis
trib
uti
on
, %
Treatments
Supernatant
Residual solids
4631
45
0
10
20
30
40
50
60
70
80
90
100
Control Fermgen Pectinase and
cellulase
Dry
matt
er d
istr
ibu
tion
, %
Treatments
Supernatant
Residual solids
Page 88
82
Table 1. Chemical composition and energy content of DDGS produced by using different enzymes
Control Fermgen Pectinase and Cellulase
(PC)
DDGS dry yield,
g/100 g dry corn 11.53±0.23 a
9.25±0.33 b 9.01±0.35 b
Ash, % 2.96±0.14 b 3.61±0.13 a 3.50±0.02 a
Crude Fat, % 8.55±0.68 b 10.84±0.33 a 10.70±0.06 a
NDF, % 23.39±1.83 c 36.12±1.27 a 28.95±0.65 b
ADF, % 5.68±0.28 c 9.26±0.39 a 7.46±0.37 b
ADL, % 0.45±0.07 b 0.75±0.19 a 0.8±0.18 a
Crude Protein, % 22.41±0.88 b 23.40±0.32 b 26.81±0.28 a
Gross Eenergy,
kcal/kg
4922±9 b 5027±10 a 5020±14 a
NDF: Neutral detergent fiber; ADF: Acid detergent fiber; ADL: Acid detergent lignin. The values sharing
the same letter in the same row have no significant different (p>0.05).
Page 89
83
Table 2. Total and free amino acids of DDGS as affected by enzyme treatments
Control Fermgen
Pectinase and cellulase
(PC)
Essential amino acid, mg/g dry matter
Valine 10.23 9.64 11.78
Leucine 27.25 26.29 31.14
Allo-isoleucine 0.00 0.34 0.00
Isoleucine 8.92 8.43 10.87
Threonine 7.61 7.79 9.34
Methionine 3.94 4.09 4.94
Phenylalanine 11.16 11.03 11.91
Lysine 7.31 7.41 7.61
Histidine 8.63 8.04 9.17
Tryptophan 0.26 0.17 0.38
Non-essential amino acid, mg/g dry matter
Alanine 5.51 5.91 5.86
Sarcosin 0.15 0.39 0.23
Glycine 9.54 9.14 10.21
α-Aminobutyric
acid 0.12 0.12 0.11
β-Alanin 0.38 0.00 0.00
Serine 11.40 11.51 12.49
Proline 12.05 12.29 15.02
Aspargine 0.36 0.35 0.38
Aspartic acid 13.93 13.98 15.28
4-Hydroxyproline 2.06 2.24 3.69
Glutamic acid 33.11 33.50 38.29
α-Aminoadipic
acid 0.90 1.30 0.90
Glycine-Proline 3.00 2.41 3.16
Ornithine 3.60 3.42 3.52
Glutamine 0.53 0.70 0.56
Tyrosine 4.82 4.88 6.62
Total amino acid 186.76 b 184.38 b 213.46 a
Total free amino
acid 1.13 b 6.57 a 0.93 b
The values sharing the same lower-case in the same row have no significant different (p>0.05).
Page 90
84
Table 3. Color and water holding capacity of DDGS from different enzyme treatments
L* a* b*
Water holding capacity
g water/ g dry DDGS
Control 45.65±1.59 a 7.55±0.62 a 30.96±1.45 a 3.70±0.09 b
Fermgen 33.94±0.67 c 7.68±0.40 a 29.36±0.77 a 4.18±0.2 a
Pectinase and cellulase (PC) 37.51±0.45 b 7.91±0.06 a 30.38±0.43 a 3.29±0.07 c
L*: lightness; a*: redness; b*: yellowness. The values sharing the same letter in the same column have no
significant different (p>0.05).
Page 91
85
Table 4. Digestible amino acid content and amino acid digestibility of DDGS
Digestible amino acid content,
mg/g dry matter DDGS
Amino acid digestibility, %
Essential amino acid
Control Fermgen
Pectinase
and
cellulase
Control
Fermgen
Pectinase
and
cellulase
Valine 5.38 2.85 8.00 52.6 29.6 67.9
Leucine 16.37 10.59 22.97 60.1 40.3 73.8
Isoleucine 5.99 3.38 7.96 67.2 40.1 73.8
Threonine 4.08 2.40 6.53 53.6 30.8 69.9
Methionine 2.88 2.53 3.89 73.1 61.9 78.7
Phenylalanine 6.67 4.62 8.41 59.8 41.9 70.6
Lysine 3.68 2.29 3.98 50.3 30.9 52.3
Histidine 4.52 2.86 4.53 52.4 35.6 49.4
Tryptophan 0.19 0.11 0.37 73.1 64.7 97.4
Non-Essential amino acid
Alanine 3.45 2.28 4.30 62.6 38.6 73.4
Sarcosin 0.04 0.23 0.10 26.7 59.0 43.5
Glycine 4.94 2.76 6.51 51.8 30.2 63.8
α-Aminobutyric
acid 0.06 0.05 0.05
50.0
41.7
45.5
Serine 6.28 4.11 9.00 55.1 35.7 72.1
Proline 6.37 5.33 10.58 52.9 43.4 70.4
Aspargine 0.15 0.07 0.30 41.7 20.0 78.9
Aspartic acid 8.09 4.89 10.37 58.1 35.0 67.9
4-Hydroxyproline 1.28 1.20 3.34 62.1 53.6 90.5
Glutamic acid 19.35 12.63 26.14 58.4 37.7 68.3
α-Aminoadipic
acid 0.60 0.72 0.64
66.7
55.4
71.1
Glycine-Proline 2.22 1.29 2.48 74.0 53.5 78.5
Ornithine 2.97 1.57 2.91 82.5 45.9 82.7
Glutamine 0.33 0.48 0.36 62.3 68.6 64.3
Tyrosine 3.59 2.86 5.04 74.5 58.6 76.1
Page 92
86
CHAPTER 5. GENERAL CONCLUSION
Surfactants and hydrolyzing enzymes have been used during dry-grind ethanol process to improve
production yields and quality of co-products. Their effects on the process were measured and
documented.
Using non-ionic surfactants can increase DCO yield in two ways including increasing oil partition in
thin stillage and improving oil recovery from CCDS. To increase oil partition in thin stillage, surfactant
worked as detergent to move surface adhering oil to liquid phase. To increase oil recovery from CCDS,
surfactant formed an unstable emulsion in CCDS. Silica nano-particles can be used as an oil recovery
enhancer when added into CCDS with surfactant together. Using surfactant had no negative effects on
ethanol production.
The use of hydrolyzing enzymes, i.e., protease, pectinase, and cellulase enzymes, significantly
increased oil partition in thin stillage and improved ethanol production. However, the use of protease
enzyme reduced oil recovery from CCDS, probably due to producing partially hydrolyzed protein as
emulsifier, and this reduction can be overcome by using surfactant. The synergistic effect between
surfactant and hydrolyzing enzymes can significantly improve DCO yield of dry-grind ethanol process.
Using hydrolyzing enzymes during fermentation significantly affected composition and digestibility
DDGS. The use of protease enzyme during fermentation increased fiber content, and reduced protein
content and protein digestibility. Though the use of pectinase and cellulase enzyme during fermentation
had a dark color, this treatment increased protein content and digestibility, and provided higher amount of
required amino acids than other treatments. Comparing with the protease enzyme, which is currently used
in ethanol plants, pectinase and cellulase mix might be a better choice when high quality DDGS is needed.
Page 93
87
Both surfactant and hydrolyzing enzymes are good options for ethanol producers to improve
production and quality of co-products without any change in the current plant design. Further studies are
needed to confirm these observations in scaled-up operations.