3/21/2014 1 Optimizing Ion Chromatography for MSD hyphenation Presented by Jay Gandhi, PhD Metrohm USA 1 What we will cover today • Basics of Ion Chromatography • Hyphenated Techniques • ICMS • ICMSMS • Case Study of USEPA Method for PerChlorate • IC-ICPMS • Case Study of USEPA SW846 Method 6800 • Summary 2 Introduction into IC What is Ion Chromatography? • Analytical method to determine ions or polar substances • Liquid mixture of substances as input • Separation of chemically similar substances in one run • Components are separated by a stationary and a mobile phase • Different mechanisms are known: ion exchange chromatography ion pair chromatography ion exclusion chromatography • Independent determinations for anions and cations • Concentration range: ppt, ppb, ppm, %
Transcript
3/21/2014
1
Optimizing Ion Chromatography for MSD hyphenation
Presented byJay Gandhi, PhD
Metrohm USA
1
What we will cover today
• Basics of Ion Chromatography• Hyphenated Techniques
• ICMS• ICMSMS
• Case Study of USEPA Method for PerChlorate
• IC-ICPMS• Case Study of USEPA SW846Method 6800
• Summary
2
Introduction into ICWhat is Ion Chromatography?
• Analytical method to determine ions or polar substances• Liquid mixture of substances as input• Separation of chemically similar substances in one run• Components are separated by a stationary and a mobilephase• Different mechanisms are known:
ion exchange chromatographyion pair chromatography ion exclusion chromatography
• Independent determinations for anions and cations• Concentration range: ppt, ppb, ppm, %
3/21/2014
2
Method distinction based on the polarities of the stationary and mobile phases
Group 1 – Traditional Thin Layer + HPLC1. normal phase : less polar mobile phase
(e.g. n-hexane ) than stationary phase (e.g. SiO2)
2. reversed phase : more polar mobile phase (e.g. methanol/water) than stationary phase (e.g. C18)
Group 2 – Ion Chromatography4. ion exchange chromatography3. ion pair chromatography5. Ion exclusion chromatography
General Chromatography
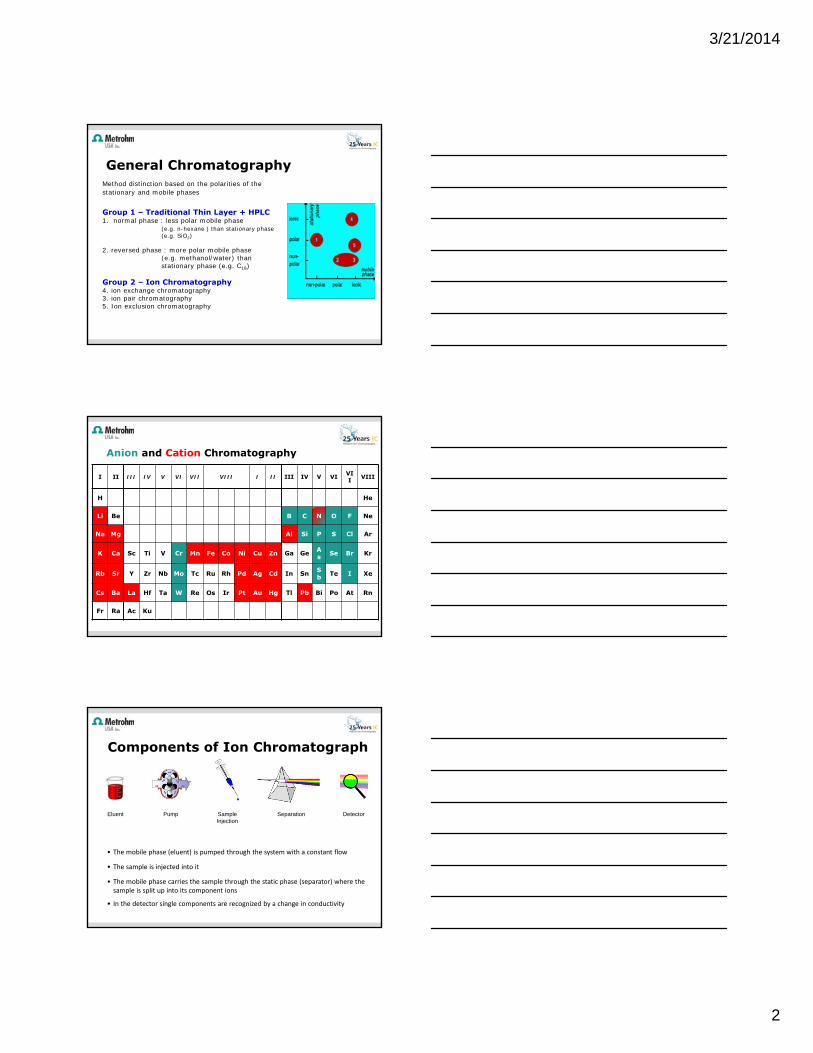
Anion and Cation Chromatography
I II III IV V VI VII VIII I II III IV V VI VII VIII
H He
Li Be B C N O F Ne
Na Mg Al Si P S Cl Ar
K Ca Sc Ti V Cr Mn Fe Co Ni Cu Zn Ga Ge As Se Br Kr
Rb Sr Y Zr Nb Mo Tc Ru Rh Pd Ag Cd In Sn Sb Te I Xe
Cs Ba La Hf Ta W Re Os Ir Pt Au Hg Tl Pb Bi Po At Rn
Fr Ra Ac Ku
PumpEluent DetectorSample Injection
Separation
• The mobile phase (eluent) is pumped through the system with a constant flow
• The sample is injected into it
• The mobile phase carries the sample through the static phase (separator) where the sample is split up into its component ions
• In the detector single components are recognized by a change in conductivity
Components of Ion Chromatograph
3/21/2014
3
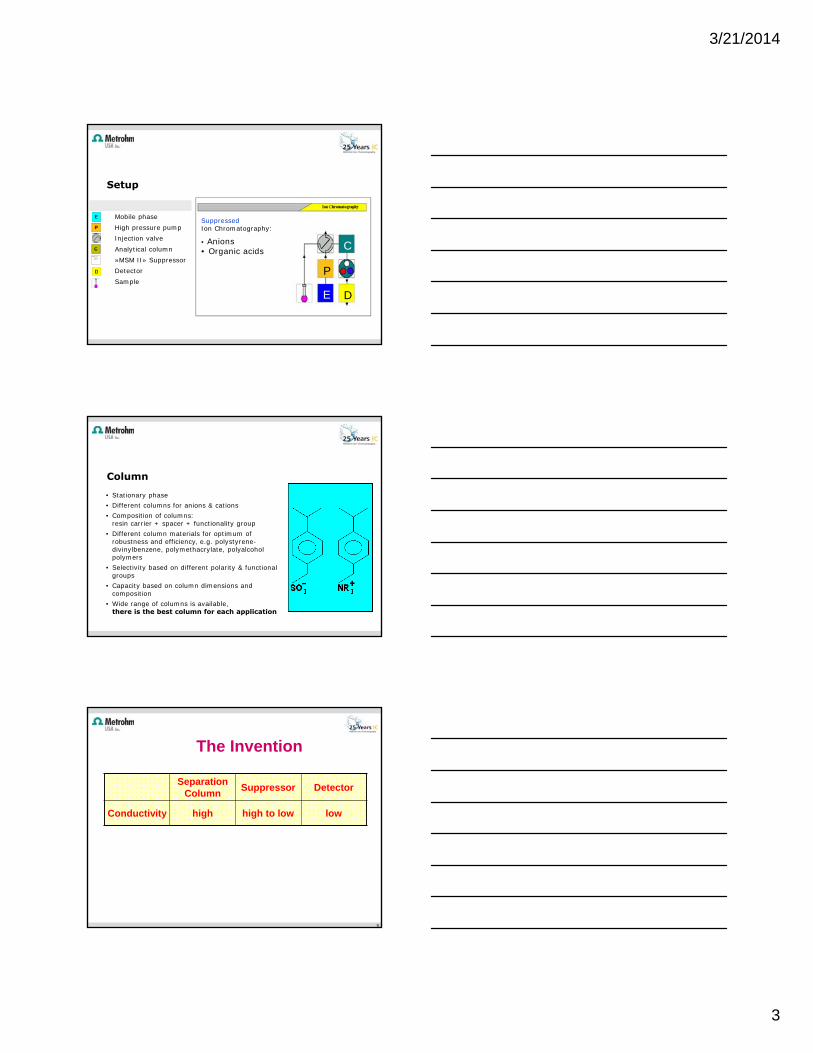
Setup
C
Mobile phaseHigh pressure pumpInjection valveAnalytical column»MSM II» SuppressorDetectorSample
E
P
C
D
Suppressed Ion Chromatography:
• Anions• Organic acids
This image cannot currently be displayed.
Column
• Stationary phase• Different columns for anions & cations• Composition of columns:
resin carrier + spacer + functionality group• Different column materials for optimum of
robustness and efficiency, e.g. polystyrene-divinylbenzene, polymethacrylate, polyalcohol polymers
• Selectivity based on different polarity & functional groups
• Capacity based on column dimensions and composition
• Wide range of columns is available, there is the best column for each application
The Invention
Separation Column
Suppressor Detector
Conductivity high high to low low
9
3/21/2014
4
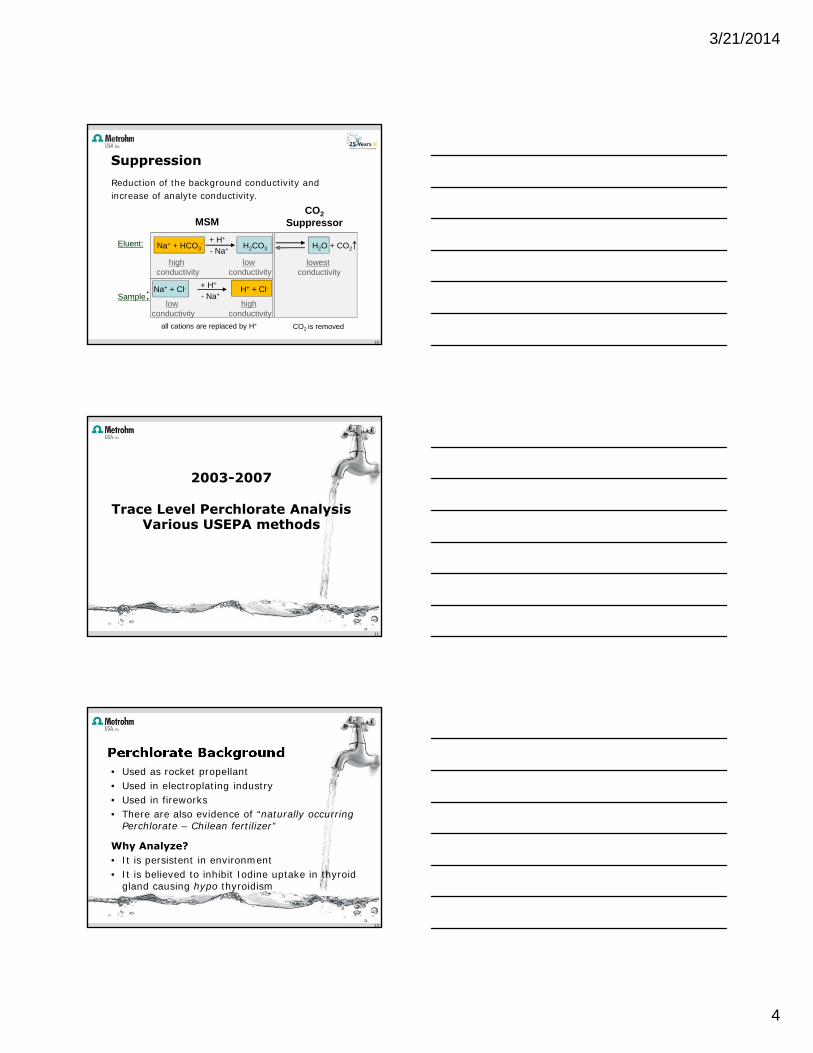
Suppression
Eluent:
- Na+
+ H+
Sample:
all cations are replaced by H+
MSMCO2
Suppressor
CO2 is removed
Reduction of the background conductivity andincrease of analyte conductivity.
highconductivity
- Na+
+ H+
lowconductivity
highconductivity
lowconductivity
Na+ + Cl- H+ + Cl-
lowestconductivity
Na+ + HCO3- H2CO3 H2O + CO2
10
11
2003-2007
Trace Level Perchlorate Analysis Various USEPA methods
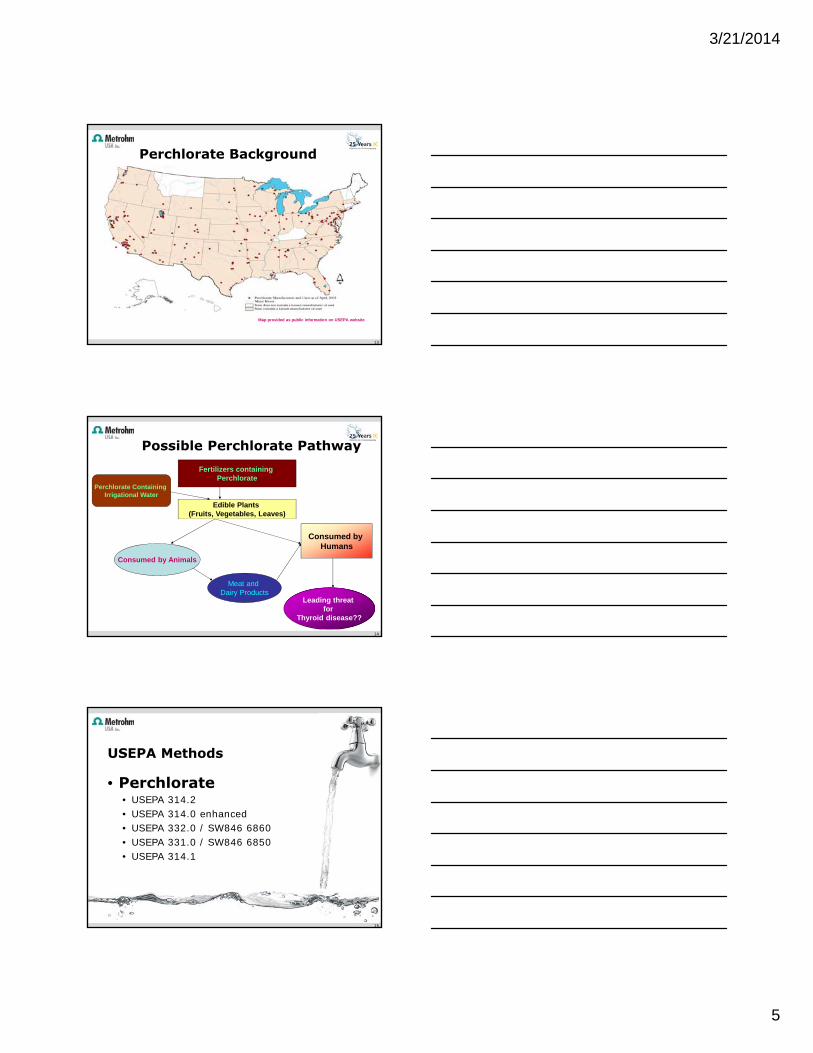
Perchlorate Background
12
• Used as rocket propellant• Used in electroplating industry• Used in fireworks• There are also evidence of “naturally occurring
Perchlorate – Chilean fertilizer”
Why Analyze?• It is persistent in environment• It is believed to inhibit Iodine uptake in thyroid
gland causing hypo thyroidism
3/21/2014
5
Perchlorate Background
Map provided as public information on USEPA website
13
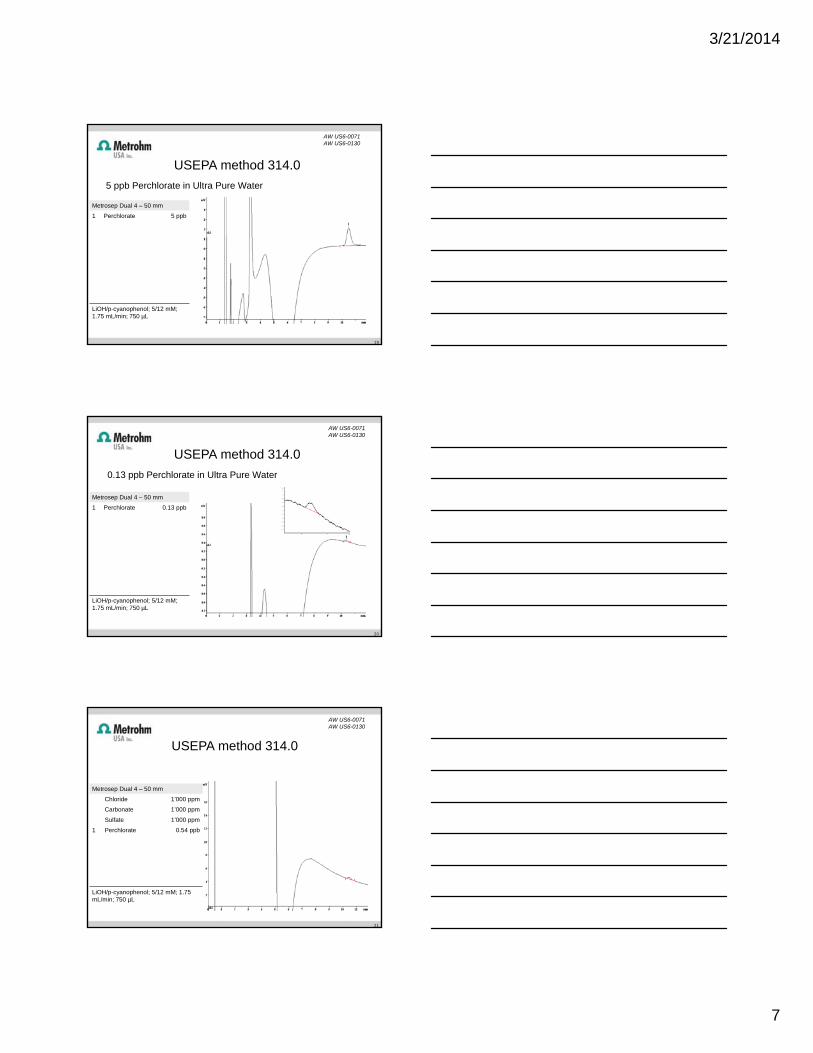
Possible Perchlorate PathwayFertilizers containing
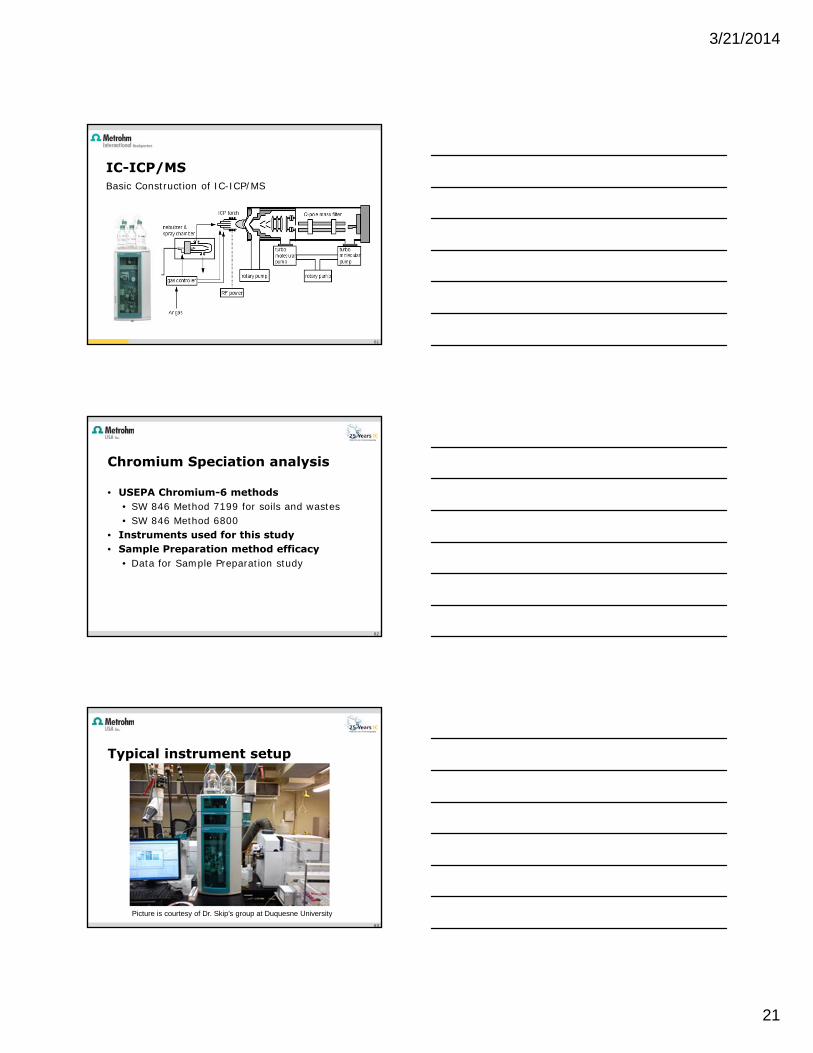
• USEPA Chromium-6 methods• SW 846 Method 7199 for soils and wastes• SW 846 Method 6800
• Instruments used for this study• Sample Preparation method efficacy
• Data for Sample Preparation study
62
Typical instrument setup
63
Picture is courtesy of Dr. Skip’s group at Duquesne University
3/21/2014
22
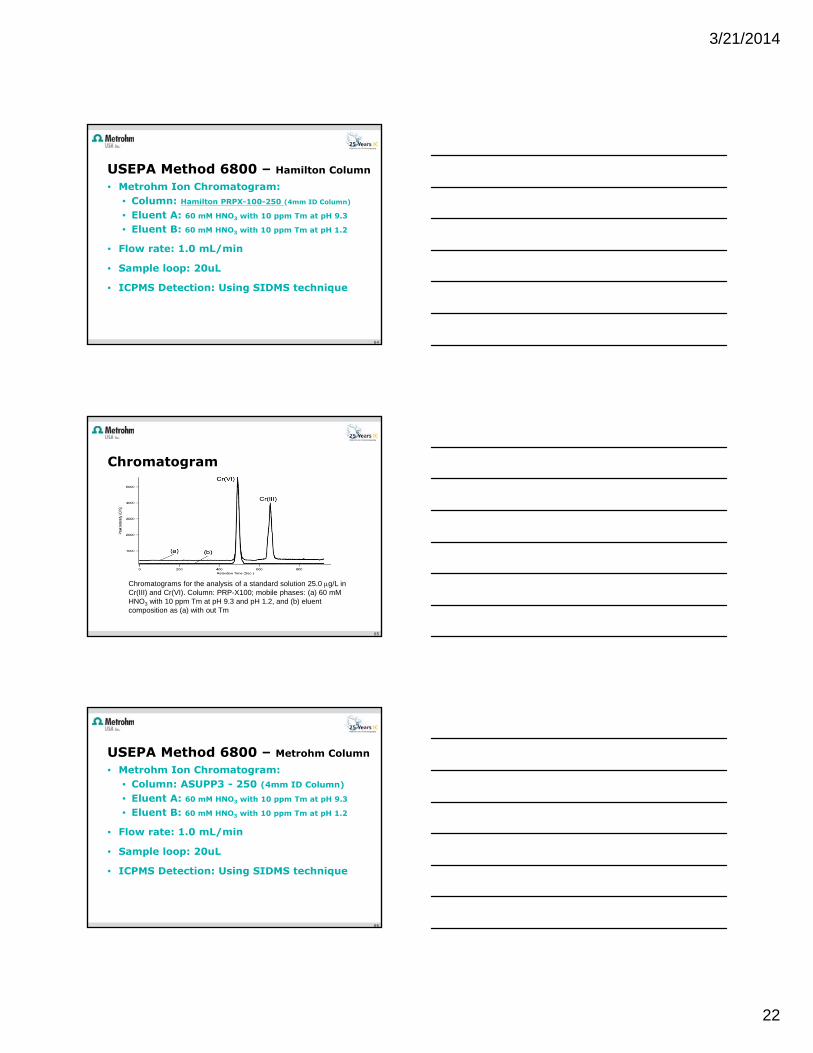
USEPA Method 6800 – Hamilton Column• Metrohm Ion Chromatogram:
• Column: Hamilton PRPX-100-250 (4mm ID Column)
• Eluent A: 60 mM HNO3 with 10 ppm Tm at pH 9.3
• Eluent B: 60 mM HNO3 with 10 ppm Tm at pH 1.2
• Flow rate: 1.0 mL/min
• Sample loop: 20uL
• ICPMS Detection: Using SIDMS technique
64
Chromatogram
65
Chromatograms for the analysis of a standard solution 25.0 g/L in Cr(III) and Cr(VI). Column: PRP-X100; mobile phases: (a) 60 mM HNO3 with 10 ppm Tm at pH 9.3 and pH 1.2, and (b) eluent composition as (a) with out Tm
USEPA Method 6800 – Metrohm Column• Metrohm Ion Chromatogram:
• Column: ASUPP3 - 250 (4mm ID Column)
• Eluent A: 60 mM HNO3 with 10 ppm Tm at pH 9.3
• Eluent B: 60 mM HNO3 with 10 ppm Tm at pH 1.2
• Flow rate: 1.0 mL/min
• Sample loop: 20uL
• ICPMS Detection: Using SIDMS technique
66
3/21/2014
23
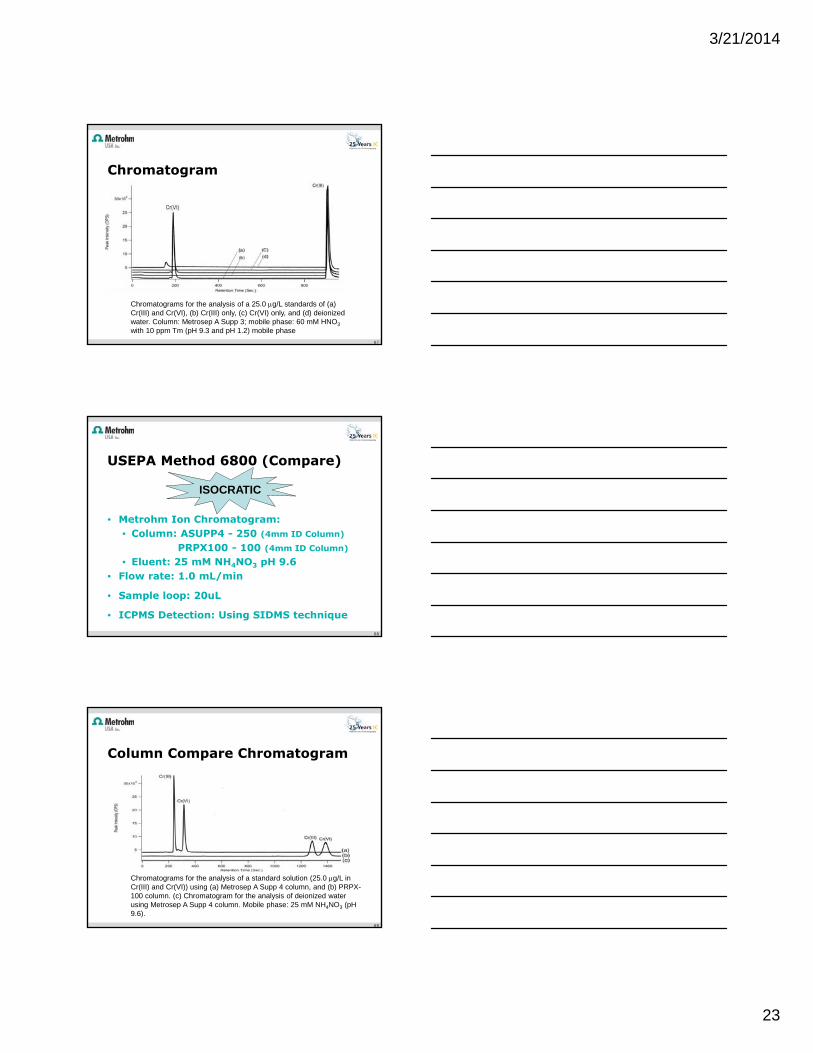
Chromatogram
67
Chromatograms for the analysis of a 25.0 g/L standards of (a) Cr(III) and Cr(VI), (b) Cr(III) only, (c) Cr(VI) only, and (d) deionized water. Column: Metrosep A Supp 3; mobile phase: 60 mM HNO3
with 10 ppm Tm (pH 9.3 and pH 1.2) mobile phase
USEPA Method 6800 (Compare)
• Metrohm Ion Chromatogram:• Column: ASUPP4 - 250 (4mm ID Column)
PRPX100 - 100 (4mm ID Column)• Eluent: 25 mM NH4NO3 pH 9.6
• Flow rate: 1.0 mL/min
• Sample loop: 20uL
• ICPMS Detection: Using SIDMS technique
68
ISOCRATIC
Column Compare Chromatogram
69
Chromatograms for the analysis of a standard solution (25.0 g/L in Cr(III) and Cr(VI)) using (a) Metrosep A Supp 4 column, and (b) PRPX-100 column. (c) Chromatogram for the analysis of deionized water using Metrosep A Supp 4 column. Mobile phase: 25 mM NH4NO3 (pH 9.6).


![1 3 4 Reference: ZDHC wastewater guidelines, Pg. 9 ......2370-65-7 76057-124] 877-11-2 RepŒti 2B: 8260B, Dich ISO losn usEPA ISO 1 USEPA USEPA 1 "4 g. usEPA usEPA usEPA usEPA usEPA](https://static.documents.pub/doc/80x56/610e853285f7f7713133afc2/1-3-4-reference-zdhc-wastewater-guidelines-pg-9-2370-65-7-76057-124.jpg)


