Optimizing Model: Insemination, Replacement, Seasonal Production, and Cash Flow’ ABSTRACT Dynamic programming to solve the Markov decision process problem of op timal insemination and replacement deci- sions was adapted to address large dairy herd management decision problems in the US. Expected net present values of cow states (151,200) were used to deter- mine the optimal policy. States were specified by class of parity (n = 12), production level (n = 15), month of calv- ing (n = 12), month of lactation (n = 16), and days open (n = 7). Methodology optimized decisions based on net present value of an individual cow and all replacements over a 20-yr decision hori- zon. Length of decision horizon was cho- sen to ensure that optimal policies were determined for an infinite planning hori- zon. Optimization took 286 s of central processing unit time. The final probability transition matrix was determined, in part, by the optimal policy. It was estimated iteratively to determine postoptimization steady state herd structure, milk production, replace- ment, feed inputs and costs, and resulting cash flow on a calendar month and an- nual basis if optimal policies were imple mented Implementation of the model in- cluded seasonal effects on lactation M. A. D~LORENZO,~ T. H. SPREEN,~ G. R. BRYAN: and D. K. BEEDE2 University of Florida Gainesville 326114701 JAM. VAN ARENDONK Deparbnent of Animal Breeding Wagenlngen Agricultural University The Netherlands Received June 3, 1991. Accepted October 7,1991. lmorida ~gricaltmal Experiment station ~~mnal Se 2Dairy science Department %bod ad Resoarce Economics Lkpartment. ries Nmk R-01629. curve shapes, estrus detection rates, pregnancy rates, milk prices, replace- ment costs, cull prices, and genetic prog- ress. Other inputs included calf values, values of dietary TDN and CP per kilo- gram, and discount rate. Stochastic e l e m a t s included Conception (and, thus, subsequent freshening), cow mi& pro- duction level within herd, and survival. Validation of optimized solutions was by separate simulation model, which imple mated policies on a simulated herd and also described herd dynamics during transition to optimized structure. (Key words: optimization, insemination, replacement, dynamic programming) Abbreviation key: DP = dynamic program- ming. INTRODUCTION Trapp and Walker (14) argued that there has been little work published on the economics of production responses in the US agricultural literature since the 1950s and 1960s because of a prefemnce for the single equation production function among agricultural economists. They suggest that production eumomics should in- corporate biophysical modeling to provide the realism and flexibility required to apply pro- duction economic theory at the farm level. They describe agricultural decision problems as typically dynamic, recursive, and stochastic and best represesned by a system of simulta- neous equations. Data and knowledge typically are imperfect, decisions are timedependent, and a flexible set of plans is necessary to manage the system adequately. Researchers in production agriculture have published detailed simulation models, often 1992 J Dairy Sci 75:885-8% 885
Transcript
Optimizing Model: Insemination, Replacement, Seasonal Production, and Cash Flow’
ABSTRACT
Dynamic programming to solve the Markov decision process problem of op timal insemination and replacement deci- sions was adapted to address large dairy herd management decision problems in the US. Expected net present values of cow states (151,200) were used to deter- mine the optimal policy. States were specified by class of parity (n = 12), production level (n = 15), month of calv- ing (n = 12), month of lactation (n = 16), and days open (n = 7). Methodology optimized decisions based on net present value of an individual cow and all replacements over a 20-yr decision hori- zon. Length of decision horizon was cho- sen to ensure that optimal policies were determined for an infinite planning hori- zon. Optimization took 286 s of central processing unit time.
The final probability transition matrix was determined, in part, by the optimal policy. It was estimated iteratively to determine postoptimization steady state herd structure, milk production, replace- ment, feed inputs and costs, and resulting cash flow on a calendar month and an- nual basis if optimal policies were imple mented Implementation of the model in- cluded seasonal effects on lactation
M. A. D~LORENZO,~ T. H. SPREEN,~ G. R. BRYAN: and D. K. BEEDE2 University of Florida
Gainesville 326114701
JAM. VAN ARENDONK Deparbnent of Animal Breeding
Wagenlngen Agricultural University The Netherlands
Received June 3, 1991. Accepted October 7,1991. lmorida ~gricaltmal Experiment station ~ ~ m n a l Se
2Dairy science Department %bod a d Resoarce Economics Lkpartment.
ries N m k R-01629.
curve shapes, estrus detection rates, pregnancy rates, milk prices, replace- ment costs, cull prices, and genetic prog- ress. Other inputs included calf values, values of dietary TDN and CP per kilo- gram, and discount rate. Stochastic e l e mats included Conception (and, thus, subsequent freshening), cow mi& pro- duction level within herd, and survival. Validation of optimized solutions was by separate simulation model, which imple mated policies on a simulated herd and also described herd dynamics during transition to optimized structure. (Key words: optimization, insemination, replacement, dynamic programming)
Abbreviation key: DP = dynamic program- ming.
INTRODUCTION
Trapp and Walker (14) argued that there has been little work published on the economics of production responses in the US agricultural literature since the 1950s and 1960s because of a prefemnce for the single equation production function among agricultural economists. They suggest that production eumomics should in- corporate biophysical modeling to provide the realism and flexibility required to apply pro- duction economic theory at the farm level. They describe agricultural decision problems as typically dynamic, recursive, and stochastic and best represesned by a system of simulta- neous equations. Data and knowledge typically are imperfect, decisions are timedependent, and a flexible set of plans is necessary to manage the system adequately.
Researchers in production agriculture have published detailed simulation models, often
1992 J Dairy Sci 75:885-8% 885
8 86 DeLoRENzo ET AL.
capturing a high degree of biological realism. Trapp and Walker (14) note that, although these models may provide a production re- sponse surface required for all production eco- nomics research, optimizing analysis of deci- sion alternatives remains a distant goal. Thus, for all their effort and cost, simulations often remain little more than computerized budget- ing processes. Although optimization is a stan- dard tool of economists, its use has been frus- trated because the biological models appear to be so detailed that general recommendations cannot be made, and traditional optimization techniques may not be directly applicable. Zil- berman (20) suggested that, given good physi- cal models, dynamic control models have PO- tential application. Trapp and Walker (14) argued that it is the integration of physical simulation systems with optimizing manage ment control systems that will lead production economics into useful new areas.
The inherent biological cycles of reproduc- tion and lactation make dairy cow management decisions dynamic, recursive, and stochastic. Decisions are timedependent. In multiperiod optimization problems, dynamic programming @P) has the advantage of determining optimal decisions without requiring exhaustive enumeration of all sequences of production possibilities. Burt (3) suggested that the greatest obstacles to implementation of DP are conceptualization difficulties. Formulating an applied problem as a DP model does not al- ways yield the most intuitive and direct description, even though it is computationally the most efficient. Each problem requires its own mathematical formulation, often using considerable ingenuity, unlike techniques such as linear programming and least squares, for which standard mathematical formulations (4) and general purpose computer software exist.
Within the context of DP, Bellman’s princi- ple of optimality (1) states, informally, that the value of a decision is determined properly by also considering the values of the future alter- natives made possible by the current decision. This definition of optimality has important im- plications in decision making because it re moves much of the arbitrary calculation asso- ciated with numerous future possibilities when trying to evaluate present alternatives that is so typical of computerized budgeting. The dehni- tion means that knowing the future s t r m of
Journal of Dairy Science Vol. 75, No. 3, 1992
optimal decisions is reQuired to choose the optimal present decision. This definition is particularly useful in processes for which a decision situation recurs regularly through time, such as whether to cull or to inseminate dairy cattle.
Management control of the dairy cow herd occurs, among other decisions, through repro- duction and replacement decisions. Thus, op timizing cow production activities requires op- timizing reproduction and replacement decisions. Van Arendonk (15) explained the proper replacement criteria, based on economic theory under the requirement of immediate replacement upon culling. Immediate replace- ment was assumed necessary to minimize ked asset costs per unit of production; other- wise, income could be increased by simply increasing cow numbers (scale). Dynamic pro- gramming was used to extend marginal net revenue comparisons, which assume that all replacements are identical, to the more realistic assumption of continuous genetic improve- ment, seasonal variation in revenues and costs, and seasanal variation and repeatability of traits. The ultimate purpose was to be able to provide culling and insemination guides that were consistent with economic theory and to represent variation adequately among cows, across seasons, and across herds (18).
In the few studies in which DP has been applied to the US dajr industry, seasonality of inputs and performance was not considered (8, 10,12), or time of replacement within a lacta- tion was not determined (12). Seasonality of production performance, input costs, and milk prices is well known. Van Arendonk (16) found that seasonality had large effects on optimal policy, using performance characteris- tics of The Netherlands. Boichard (2) included seasonality in a DP model to investigate the economic value of conception rate under French conditions.
Further, changing culling and insemination policies will alter freshening patterns and flow of animals in and out of the herd. This changes the pattern of milk production, feed require- ments, replacement needs, and resulting cash flow across months. Determination of steady state conditions that account for these factors should be made after implementing individual cow policies that are deemed optimal.
Verification of models always should be a concern. Application of numerical solutions to
0-G MODEL 887
real complex stochastic processes requires cau- tion and testing with empirical data. This has not been reported in the literature. Simulation is one way to test the effect of implementing optimal solutions to management problems. Van Arendonk (17) used simulation to inves- tigate economic performance of cows, corres- ponding to optimal insemination and replace ment policies determined from DP. Detailed simulation can also be used to measure effects of nonoptimal policies, although it cannot prove discovery of the optimal solution. It can verify correct implementation of computer code in complex programs and numerically intensive computing.
One purpose of this study was to document modification and implementation of Van Aren- donk's DP approach to optimizing insemina- tion and replacement decisions for a specifk region incorporating seasonality. Other pur- poses were to illustrate how simulation can be used to verify the implementation of optimiza- tion and to document techniques that use the optimal insemination and culling policies to generate postoptimization steady state herd structures, animal turnover, and cash flows. Analysis of these policies and herd characteris- tics can assist in solving more general manage ment problems using economic criteria. These models currently are being used in research and consultation with large commercial dairies. Data gathered in these experiments will allow verification of models.
MATERIALS AND METHODS
Because the consideration of a specific im- plementation of DP such as that of Van Aren- donk and Dijkhuizen (19) does not necessarily elucidate the structure of all applications, it is useful to indicate the general nature of DP problems. A deterministic DP problem with discounting can be written as
where Vt(x3 is the maximum net present value of a series of decisions (6); xt is a vector of state variables that define the state of the sys- tem at stage t; dt is the decision variable,
indicating the decision made at stage t; r&) is the return (net revenue) function for being in state xt at stage t; and a is the discount factor 1/(1 + i) where i is the appropriate interest rate. The subscript, t, on d,, denoting stage, is an abbreviation for xt. Equation [l] indicates that decisions are chosen to maximize the net pres- ent value of a series of stage returns. Upon optimization, there is an optimal decision for each state. Equation [2] indicates that the next state depends on $e current state and decision. The transformation function f() may incor- porate stochastic elements, and, when this is true, the last term in Pqmtion [2] is replaced
stochastic elements. In this case, the stochastic DP problem optimiz,es expected returns, which always will be lower than the optimized returns from the analogous deterministic prob- lem, and the optimal decisions will be differ- ent.
The calculation of the value of the objective function proceeds recursively over a sequence of decisions ha.., 1, giving
by -wt+lcf(xt, 4, Et))). The 9 are the
v() = recursive objective function, and
where n is the decision horizon. If d;, . . .d; is a sequence of decisions that maximizes v(), then
[41
or maximized over d m ..., 1
Thus, the problem is solved by the method of successive approximations (9, sometimes re- ferred to as value iteration (6). An alternative approach uses policy iteration (6), and a modi- fied version of it using a hierarchical Markov process was used by Kristensen (7).
The replacement and insemination decision problem as OriginaUy formulated by Van Aren-
Journal of Dairy Science Vol. 75, No. 3, 19%
888 DeLoRENzo ET AL.
donk and Dijkhuizen (19) is in a class of DP problems called infinite stage with discounting (6). The problems have the property that as n+ and t+l, Vt(xJ+Vt+l(xt+l). The impli- cation is that there is no real planning horizon per se, and so the term decision horizon is used for n. In practice, Vt(x&+Vt+l(xt+l) asymptot- ically at a rate depending on a.
Cow Process. In application to dairy cows, we specified the defining characteristics (state variables, XJ of a cow at each stage (t). The biological model for the insemination and replacement decision problem contained five state variables including classes of 12 parities, 15 production levels, 12 mo of calving, 16 mo of lactation, and 7 d open. Details were same as in Van Arendonk (16).
We write the state vector for stage t as
xt
where
i = j = k = 1 =
m =
parity, i = 1, ..., 12 days open class, j = 1, ..., 7; month of lactation, k = 1, ..., 16; production level, 1 = 1, ..., 15; and month fresh, m = 1 ,..., 12.
As the process proceeds from one stage to the next (t+t+l), cows move from one state to another. Clearly, a l l states are not accessible from all others. Another feature of the cow process is that as t = l+n, states may appear in the sequence more than once because of replacement. Because insemination and replacement decisions are considered, there are three possible values for 4; thus,
1 keep, or 4 = keep and inseminate, or [ replace
where keep means do not replace. All deci- sions are not admissible for all states. Volun- tary replacement was limited to 23 mo of lactation, and insemination was limited to 3 through 8 mo of lactation in the work reported here.
The next state of the cow depends on the current state, the value of d, the probability of conception if inseminated, the probability of survival to the next stage, and the probability
of transition to a different production level if starting a new lactation. Including these stochastic elements, we can specify the trans- formation function f(') in Equation [2] as
where
p(xJ = probability of being in state x at stage t;
C*J = 1; x1
p(jt I xbl, 4-1) = probability of concep- tion, i.e., probability of transition to days open class j given current state xt-l and decision 4-1;
p(lt I xt-l, $1) = probability of transi- tion to production level 1 given current state xt-l and decision
p(it, I xcl, 4-1) = probability of sur- vival to parity i, month of lactation k given current state xel and decision d,l.
del; and
The objective function vl(x1, dl ,...., dd) then is formulated in terms of expected stage returns by expanding quation [3] to include the trans- formation probabilities. Equation [3] becomes
Expected state returns are computed over all possible states in which each possible state is weighted by its probability. Because, at time t, f ( ) depends only on xt, 4 and the p(.), the process is a Markov process. This property allows a solution to the problem to be calcu- lated by DP using backward induction.
The time step is 1 mo so that stages of the process can be thought of as sequential calen- dar months. There are 151,200 unique states as just defined. For each state, milk production,
JonmaI of Dairy Science Vol. 75, No. 3, 1992
OPTMIZING MODEL 889
feed quirements, gross income, total costs, and net revenues are computed. These net revenues are the stage returns r&, dJ in Equa- tion [l]. Thus, each state has physical inputs, physical outputs, costs, revenues, and net revenues assigned to it. These attributes can be thought to apply to a cow in each state. They can be s- . in various ways. For in- stance, the net revenue from a lactation can be computed for a given parity, season (month) of calving, and days open class, and, thus, ex- pected net cash flows for cows in different states can be generated (18).
Optimization. Once values for each state are computed, the recursive calculations in Equa- tion [5] determine the optimal sequence of states from any current state. Backward induc- tion is used by retreating from decision hori- zon stage n to stage 1, the initial decision state. Van Arendonk and Dijkhuizen (19) described the insemination and replacement decisions in separate equations, but the calculation is actu- ally of the general form of Equation [6]. Com- putations were done on an IBM 3090 model 400 ww hC.9 b o n k , Ny).
Validity of the optimization is predicated on the fact that the objective function in Equation [6] is additive and that the process has the Markovian propexty (5). The principle of opti- mality (1) requires that the decisions at any stage be determined by knowing what value accrues to current decision alternatives and that the accrued value be based on the optimal policy followed at each future state throughout the decision horizon. Backward recursive com- puting strategy ensures that the principle is satisfied. It is important to realize that a se quence of decisions is optimized and that the value accluing to the optimal decision at time t depends on all (lr up to 4.
The length of the decision horizon was chosen so that optimal policies were deter- mined before stage 1 was reached in the calcu- lation. Hillier and Lieberman (5) point out that there is no procedure to choose the proper value of n to ensure that optimal policies are found, but optimal policies will be found for “sufficiently large’’ n, suggesting that policies will converge before Vl(x1). Upon implemen- tation in the research reported here, n = 240 based on observing policy change as a function of n, but a more formal study of the practical choice on n will be reported in a fume paper.
Smith (12) chose n on similar criteria, also assuming that the decision vector was station- ary. Van Arendonk and Dijkhuizen (19) found that optimal replacement policy did not change when the decision horizon was changed from 20 to 15 yr when using a model without seasonal variation in performance and prices.
However, when considering economic values, the magnitude of Vl(x1) in Equation [4] depends on the magnitude of n if a is close to 1, which it normally is. If n is extremely large, Vl(x1) + Vz(xZ), but this does not occur in practical calculation. Rogers et al. (10) re- ported results of optimization in terms of an annuity for n periods corresponding to the optimized net present value Vl(x,), and Van Arendonk (15, 16) and Van Arendonk and Dijkhuizen (19) computed measures of profita- bility based on Vl(x1). To the extent that n is chosen smaller than the value to meet the infinite stage criteaia Vt(xJ + Vt+l(xt+l), the magnitude of the annuities depends on choice of n, and thus these reported net retums are somewhat arbitrary. Van Arendonk and Dijk- huizen (19) reported that average monthly in- come per cow did depend on choice of n. In the work reported here, n was temporarily set to 252 (decision horizon 21 yr) to determine the effect on Vl(x1).
Steady Stare. when the optimal replacement and insemination policies at stage 1 were de- termined, a probability transition matrix. P, conditional on optimal policies, was construct- ed. Each element of P, p(xu, x,), contained the probability of a cow moving from state xu to another state, x,. It combined insemination and culling decisions, survival probabilities, con- ception and estrus detection rates, and a repeat- ability model for production level changes from one parity to the next.
Because P is a probability transition matrix, we defined the postoptimization process at steady state w, where w, = Pkwo, and wo is a vector repmenring the starting distribution of cows in states and k such that pk = Pk+’. This is equivalent to w, = Pw, where w, is the eigenvector of P corresponding to h = 1 in the equation Pw = hw. We h o w h = 1 is always an eigenvalue because rows of P - I sum to zero and P - I is singular (13).
Considering the size of P (151,200 x 151,200), w, was approximated by iteration. A starting distribution of heifer freshenings
Journal of Dairy Science Vol. 75. No. 3. 1992
890 DeLoRENzo ET AL.
TABLE! 1. Exogenously specified herd characteristics used as inputs to dynamic programming model for Calculatbg optimal insemination and replacement policies.
Rodaction Economic
Production level for
24 Lactation curves
MiIk price (monthly)
Beef salvage price
calf valucs Cost of dietary CP Cost of dietary TDN
a fat, and protein
12 mo of Freshening
Milk fat d m d (monthly)
% t y l d 2 2 Replacanent cost (monthly)
of lactation % Fat and protein by month
Eptrus detection rate Conception rate (monthly) Interest rate Involuntary loss by parity and month of lactation Genetic progress per year Protein and energy requkments for mik, maintenance, growth, and gestation Body weight by parity Calf mortality by parity Calf birth weight by parity
rascellaneolls operating costs
across months was chosen, and resulting cow distribution through states was calculated. This process was repeated until the heifer freshen- ing distribution was equal to that generated by P. It usually took four or five iterations for the process to converge. This was accomplished by constructing a matrix of probabilities, P* = ( p i ~ ~ r ~ ~ } , with subscripts as defined previous- ly, of reaching each state (state probabilities) conditional on a starting heifer distribution. These state probabilities were computed easily from optimal insemination and replacement policies, conception and estrus detection rates, involuntary culling rates, transition probabili- ties between production levels of sequential lactations, and heifer production level proba- bilities. The starting heifer distribution used was 8.33% of the heifers freshening each month (uniform). At each iteration, a new heifer distribution was determined from the pattern of involuntary and voluntary r e p b ment.
Once the steady state distribution was com- puted, the resulting milk production, feed re quirements, replacement requirements, income, costs, and net revenues were computed by weighting each value by its probability of oc- currence. These values were computed, undis- counted, per cow per month and per year. This characterizes the physical production and ece nomic responses achieved by optimal insemi- nation and culling policies by the herd at postoptimization steady state.
Simulation. To test optimal strategies com- puted from DP techniques, a simulation was
Journal of Dairy Science Vol. 75, No. 3, 1992
written that could implement the optimal strat- egies or use alternative insemination and cull- ing policies. This program simulated a herd of cows, implementing the stochastic elements by sampling the appropriate distributions. Inputs, including optimal policies, were taken directly from the DP application so that calculations from the optimization could be verified, as well as to ascertain the effects of policies that were apparently not optimal. Any policy dif- ferent from those specified by the DP optimi- zation was considered not to be optimal. Dif- fering from simulation, the DP optimization is probabilistic and does not actually simulate a cow or herd but calculates the expected aver- age net returns from the state probabilities. To minimize sampling variation associated with the simulation, the simulated herd (lo00 cows) was run for 20 yr with the optimized policies. Starting distribution was steady state, as speci- fied by the DP. Results were averaged over the 20 yr for comparison with results from the DP calculations. These were undiscounted net revenues per cow per month and year and other values as reported for the steady state herd distribution based on the DP.
Exogenous Inpurs. Exogenously supplied inputs are listed in Table 1. Herd charactens- tics are unique to each individual dairy, and subsequent optimized solutions are conditional on these inputs and, therefore, are unique also. These characteristics contain the biological responses and efficiencies of individual pro- duction systems and, thus, are properties of the cattle, management, and physical resources.
OPIZMIZING MODEL 891
TABLE 2. Percentage of total miIk production for each month and total milk production (kilograms) by month of freshening.
Lactation Month of fresheninn 1 mo 2 mo 3 mo 4 mo 5 mo 6 mo 7 mo 8 mo 9 mo 10 mo Total
Furthermore, herd specific prices and costs place the production variables in specific con- texts.
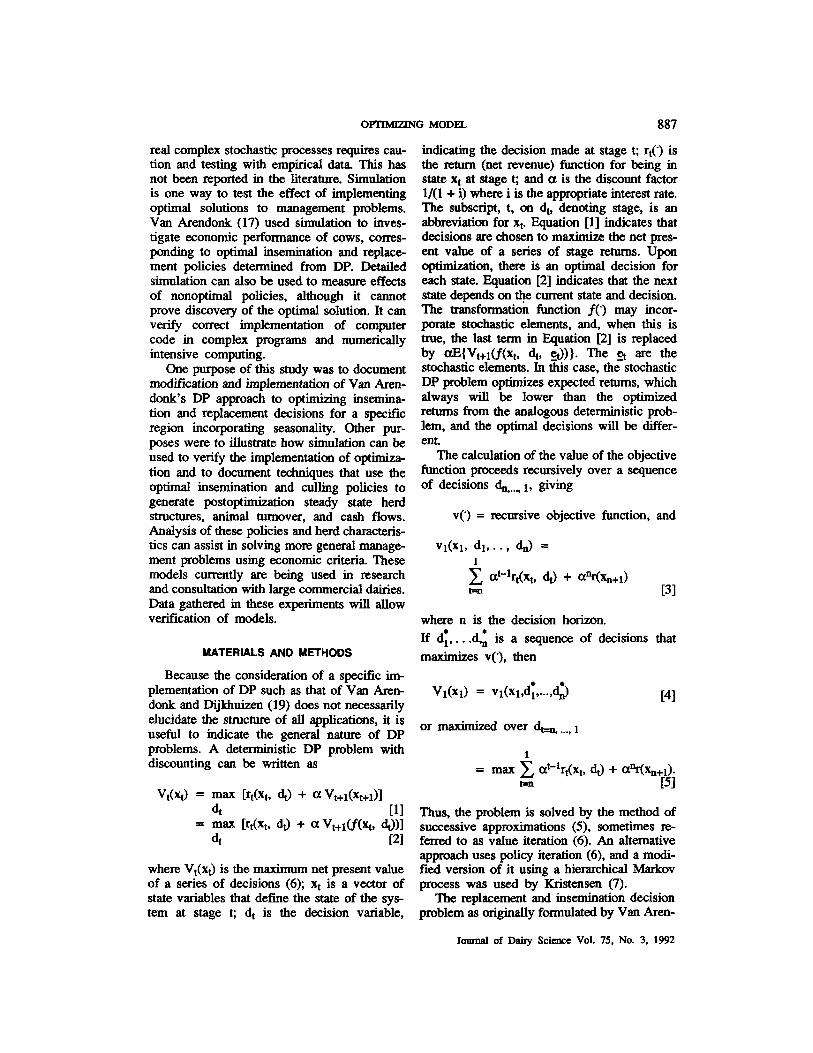
Biological Model. Herd mean 305d mature equivalent milk production and fat percentage for this experiment were 6960 kg and 3.4%. Protein percentage was set at 3.3% but did not enter calculations because the pricing system used in Florida does not include a protein differential. Twenty-four lactation curves were estimated from Florida DHI data using 92,263 305-d twice daily mature equivalent Holstein dairy cow lactation fecoTds from 1977 to 1983. Separate curves were estimated for primipa- rous and multiparous cows and for each calen- dar month of freshening. The mathematical model was a linear fifthader polynomial with days open in contrast to the familiar nonlinear model used by Van Arendonk and Dijkhuizen (19). Environmental effects on lactation m e shapes were important to capture because they were not modeled separately. Estimated coeffi- cients are given in Appendices 1 and 2. Per-
centage of lactation milk production by month and total milk production for primiparous and multiparous animals open 90 d are in Table 2. These values were used directly in computing stage retums rdx,). Month of lactation effects for fat were the same as those of Van Aren- donk and Dijkhuizen (19).
Estrus detection and conception rates were required to calculate the expected success of insemination, given the decision to try to in- seminate a cow. Estrus detection rate was set at 40%. and seasonal conception rates were estimated from DHI data (Table 3). Semen and insemination costs are not included, so calcu- lated returns from insemination would need to cover these costs for insemination to be profit- able.
Dietary nutrient requirements were calcu- lated as energy and protein requirements speci- fied by the National Research Council (9) ac- cording to body weight, milk and fat production, growth, and gestation. Body weights were fixed within a lactation in this
Journal of Dairy Science Vol. 75. No. 3. 1992
892 DeulRwzo ET AL.
TABLE 3. Exogmmsly specifiad monthly mi& price,' replacement cost, and probsbility of conuption by month for dynmic programming &I. ~ ~~
Replacanent, $ per cow Robability of CODEeption 20 20 20 .29 .40 .42
'For milk at 3.5% milk fat.
study because limited information was avail- able regarding body weight flux over the course of lactation at differing levels of milk production. Body weights for parities 1,2, and 3 and greater were set at 454,522, and 591 kg. Feed wastage was assumed to be 5%. Other inputs or parameters not mentioned were same as those in Van h n d o n k (16).
Economic Variables. Costs per kilogram of dietary TDN and CP were estimated by com- puting the cost per kilogram of various typical rations fed to Holstein cattle in commercial dairies in Florida. Ration cost was regressed on TDN and CP content to estimate the cost of providing TDN and CP from a feed eaterprise using energy and protein costs as proxies for total ration cost. The TDN was vdued at 13.2$/kg and CP at 26.5 e/@. Current mdies are investigating how sensitive these prices are to milk produdon level and commodity mar- ket prices. Net pay price for milk by month is in Table
3. Prices were determined from the three milk marketing regions in Florida for the 3 yr, 1983 to 1985 (4). The average price was $.192kg of carrier and $3.34/kg of fat. The fat differential was $.353 and did not vary across months. Protein was given no value, which correctly represents the Florida dajr industry situation.
Average replacement heifer price was $1OOO, and a seasonal price index (11) was used to adjust the average price (Table 3b The immediate replacement criteria require that enough replacements always be available. All calves were assumed sold at birth for $50. The intereat rate minus inflation for discounting
future values was taken at 4%. Cull (beef) price was $.95/kg, and miscellaneous operating costs were set at $48jmo per cow. All cows leaving the herd by voluntary or involuntary culling generated salvage value according to weight and cull price.
RESULTS AND DECUSSION
The optimization was run for 240 stages. Each of the 151,200 states was evaluated at each stage. Calculations took 286 s of central processing unit time. The dif€erence, V&) - Vt+l(X,l), continued to decrease until t = 1. but, because it was not zero, it cannot be p v e n that optimal policies were obtained. In fact, differences between VdxJ were not con- stant either. When n was equal to 252, the V,(x,) were 5% larger, indicating strong de- pendence on choice of n. However, diffemces in policies, herd structure, and other summary statistics could not be detected in the final stages of the calculation.
The Vl(xl) at ikshening for fitst parity, average production cows for the 12 mo of freshening are given in Table 4. These are the net present values of the expted net revenues from first parity cows, and from their replace- ments, calving in each of the 12 mo. These values are unique to the specific inputs used. They are also the opportunity cost of replace- mats for each state when it was optimal not to replace. As explained, their absolute magni- tude depends on n. Rogers et al. (lo), Van Arendonk (15, 16). and Van Arendonk and Dijkhuizen (19) reported discounted net revenues as annuities or some other function of
Jonrnal of Dairy Scicac-e Vol. 75, No. 3, 1992
OpIlMIzLNG MODEL 893
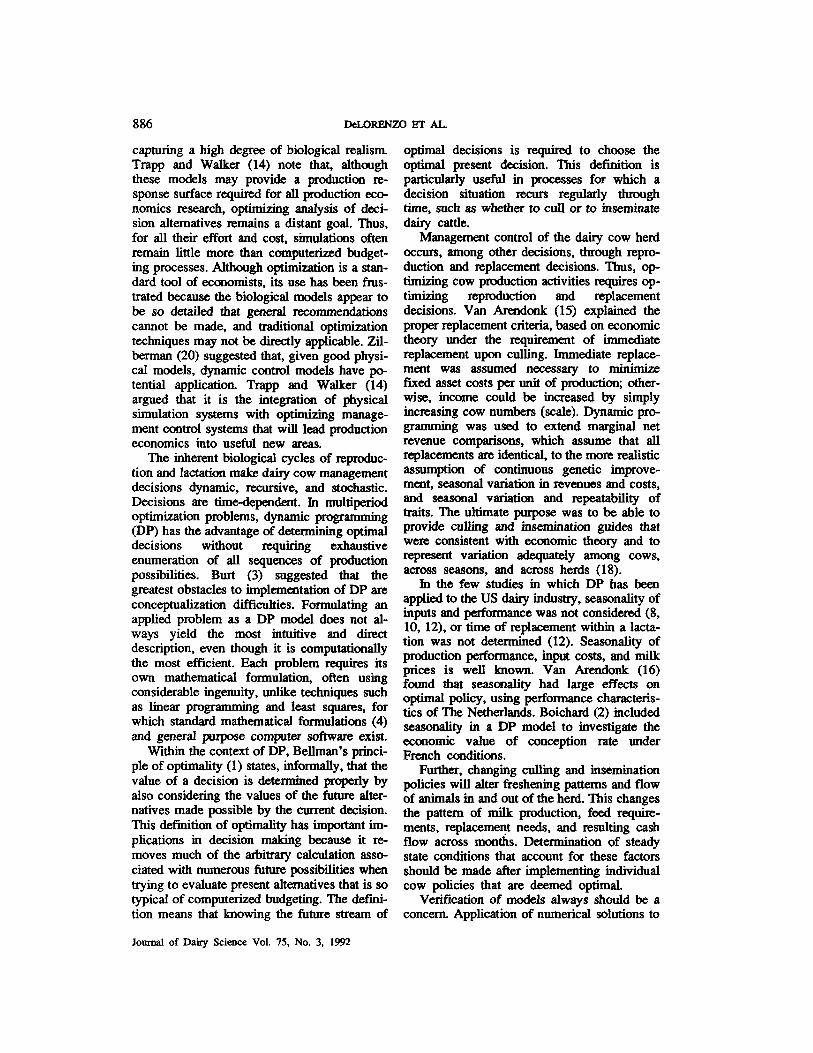
TABLE 4. Heifex fnshening distriition at various iterations of postoptimizatiOn steady slate calculations.
Iteration Jan Feb Mar Apr May Inn Id Aug Sep Oct Nov Dec
'Net present value of heifer and its replacanents by month of calving.
Vl(xl), but, in each case, they may also de pend on the decision horizon if the Vt(xJ do not change at a constant rate.
Table 4 indicates that, for the inputs used, the net present value from a first parity cow and her future replacements was highest for cows calving in December and least for those calving in February. Seasonal effects on lacta- tional production, conception rate, and milk price have real effects on profit maximizing strategies and likely render general mmmen- dations about production practices meaningless for economic decision making.
Following the optimal policy for each state, the postoptimization steady state herd distribu- tion was calculated. Table 4 shows the replace ment freshening distribution across months ex- pressed as a percentage of all bhening replacements in a year. Apparent convergence occurred quickly, and this may be a property of the strong seasonal effects. A large percent- age of replacement immediately occurs in Sep tember and October. Furthennm, we have not been able to prove that results such as those in Table 4 are truly steady state or that with different inputs that convergence would OCCUT as quickly. For most scenarios, convergence occurs in 5 to 6 iterations. There were scenar- ios in which the replacement freshening distri- bution continued to change beyond 50 itera- tions.
Monthly milk production per cow was com- puted for a herd following the economicaly
optimal breeding and culling policies realized from postoptimization steady state conditions (Figure 1). Highest production per cow oc- curred in February, and lowest in August, with a 46% change in productian between these months. The timing of this pattern is similar to that of over- and underproduction of milk produd in Florida relative to use in Florida. Seasonal effects on conception rates and lacta- tional performance are the main factors deter- mining this seasonal praduction pattern Removing misonah 'ty for each effect one at a time was performed to test the behavior of the model to the sources of seasonal variation in results. Seasonality of conception rate and lac- tatimal performance were about equal. Using constant conception rate, there was a 25% variation in production across months, where- as, with no seasonal effects on lactational per- formance, there sti l l remained a 30% variation across months. Results of testing optimal policies by simu-
lation resulted in close agreement between postopthimtion steady state calculations and a simulated cow herd subjected to the optimal policies (Figme 2). The expected monthly net revenues from the DP postoptimiZation steady state for a herd shown in Figure 2 are com- puted as thc weighted average of state retums, weighting by the pmbability that a cow wil l be in each state for each of the 12 mo. Monthly net revenues from simulation are those realized from applying the optimal policies to a simu-
Jonmal of Dairy Science Vol. 75, No. 3, 1992
-1 I
Month
Figure 1. Postoptimization steady sta!e monthly milk production per cow for a herd following opthnal breed@ and culling policies.
Bo Expected = Simulation 70 w
B Z 3 %
20 10 0
Jan Feb Mar Apr May Jun’ Jul Aug Sep Oct Nov Dec -104
Month
FigatC 2. Expected monthly net revenues per cow from dynamic programmiq postoptimization steady State and monthly net rcvermes from dmnlation.
lated herd. The steady state calculations lead to extremely small probabilities of occurrenw for some of the 151,200 possible states. Even with a simulated lo00 cow herd, many of these states rarely, if ever, contained a cow. There fore, for numerical comparison, probabilities ( P * { p ~ ~ ~ } ) below .000123 calculated from the DP model were set to zero, and the remain- ing probabilities were normalized so that they summed to 1 for comparison with a simulated herd. All nonoptimal policies that were tried resulted in lower or nearly identical net revenues as predicted from the optimization. Some slightly higher net revenues resulted from the simulation, but this would be expect- ed. As a stochastic problem, DP seeks the optimized expected, or long run average, net retum. Simulation can also be used to ascertain the value of implementing the optimal rather than nonoptimal policies, but that study will be reported elsewhere.
Simulation has special usefulness on large dairies with lo00 or more cows. Management actions can be thought of as controlling the flow of animals in and out of the herd, with resulting production patterns, calving patterns, and replacement needs. With these large num- bers of animals, one can expezt sampling vari- ation on individual cows to be relatively unim- portant. Cows generally are managed in groups, and predicting the performance of these groups is useful. With this in mind, the simulation could be used to characterize how the implementation of optimal policies would affect a herd during transition from a nonop- timal to optimal herd structure. During this transition, cash flows, net revenues, and herd structure can be d e m i
CONCLUSIONS
A DP strategy from Van Arendonk (16) was modified and adapted to the US and, in partic- ular, to Florida conditions on an IBM 3090 under CMS operating system and later moved to an IBM RT/PC under AK operating sys- tem. The procedure optimized insemination and culling decisions for a particular set of inputs. The procedure evaluated alternatives based on their expected net present values, A backward recursive computing strategy calcu- lated values of altemative states from the re- mainder of the decision horizon. The expected net present value for a cow’s state included future productive life span, insemination and replacement at profit maximizing times, and the expected net present value of the produc- tive life span of all replacements. Furthermore, optimized herd structure, freshening patterns, voluntary culling, monthly milk production and income, feed inputs and costs, and replace- ments and costs for a herd at steady state can be calculated from the inputs and probability transition matrix resulting from the dynamic optimization.
The procedure can accept individual herd production and financial data to tailor compu- tations to specific applications. Although DHI data can be used, they are not required. Inputs can be modified from database values to run the optimization in “what if” mode. A separate simulation was written to test calculated op- timal policies, describe transition to steady state herd structure after implementation of optimal policies, and test effects of other nonoptimal policies. The techniques reported here potentially are useful for a wide variety of
Journal of Dairy Science Vol. 75, No. 3. 1992
0-G MODEL 895
decision problems. They have been used to estimate seasonal price premiums required for supply response by Florida dairy producers (4). They also are being tested currently on a num- ber of commercial dairies.
REFERENCES 1 Bellman, R. 1957. Dynamic programmiOg. Princeton
Univ. Press, Princeton. NJ. 2 Boichard, D. 1990. Estimation of the economic valw
of conception rate in dairy cattle. Livest. Rod. Sci. X187.
3 Burt, 0. R. 1982. Dynamic propmmhg has its day arrived? West. J. Agric. Econ. 7381.
4Ga0, X., T. H. Spreen, and M. A. DeLorenzo. 1989.
Florida dairy producers. Am. J. Agric. Econ. 71:1360. 5 Hillier, F. S., and G. J. Lieberman. 1974. Opaatioos
research. 2nd ed. Holden-Day, Inc., San prancisco, CA.
BKennedy, J.O.S. 1986. Dynamic propmming appli- cations to agriculture and natural resources. Elsevier, Appl. Sci. Publ., New Yo&, NY.
7Kristensen, A. R. 1987. Optimal replacement and ranking of dairy cows determined by a hierarchic Markov process. Livest. Prod. Sci. 16131.
8 McArthur, A.T.G. 1973. Application of dynamic pm- Bramming tothe cullingdecision m dairy cattle. Proc. NZ. SOC. Anim. Rod. 33:141.
9Nalional Research Council. 1978. Nutrient require ments of dairy Cattle. 5th ed. Natl. Acad. Sci., Wash-
lORogers, G. W., JAM. Van Arendonk, and B. T.
s-nal price premiums mQ rcgpanse by
illgtw Dc.
McDaniel. 1988. Influence of production and prices on optimal culling rated and aauualizcd net revenue. J. Dairy Sci. 71:3453.
11 Simpson, J.. and R Alderman. 1985. Seasonality of PLOrida feeder cattle prices. Florida Coop. &t. Sen. Bull. No. 214, Inst, F4-d Agric. Sci., Univ. morida, G a i n d e .
12 Smith, B. J. 1973. Dynamic Programmn of the dairy cow replaccmeat problem. Am. J. Agnc. Ecoa 55: 100.
13 Stzing, C. 1980. Linear algebra and its applications. 2nd ed. Academic Ress, New Yo& NY.
14Trapp, J. N., and 0. L. Walker. 1985. Biological simulation and its role in economic analysis. Page 13 in Simulation of beef cattle prodaction systems and its use in economic aualysis. T. H. Sprecn and D. H. Langhlin, ed. Westview Press, Boulder, Co.
15 Van Arcndonk, JA.M. 1984. Studies on the replace- ment policies in dairy cattle I. Evaluation of tech- niques to - the optimam time for replacanent and to rank cows on future profitability. 2. Tien. Zoechtungsbiol. 101:330.
l6Van Arcndonk, JAM. 1986. Studies on the replace- ment policies in dairy cattle IV. Intluence of seasonal variation in performame and prices. Livest. Rod. Sci 1415.
17 Van ArcndonL, JAM. 1987. Contribution of variables to the optimal policy for insemination and replace- ment of dairy cows. J. Anim. Breed. Genet. 1M35.
18 Van h d o n k , JAM. 1988. Management @des for insCminaton and replacement decisions. J. Dairy Sci. 71:1050.
l9Van M o n k , J.A.M., and A. A. mj-. 1985.
Influence of variation m reproduction and production. Livest. prod Sci. 13333.
mzilbnman, D. 1982. Tht use and potential of optimal control models m agricultmal economics. West. J.
studies on tht Itplacamnt policies in dairy cattle m.
Agric. Econ. 73%.
APPENDIX
Appendix 1. Lactation m e coefficients for iifth-order polymmial in DIM for tirst parity Holstein cows, 36 mo of age and d e r at freshening, to predict daily praduction (kilograms).