37
Oracle Performance Optimizing A Practitioner's Guide to Optimizing Response Time Cary Millsap with Jeff Holt

OraclePerformance
Optimizing
A Practitioner's Guide to Optimizing Response Time
Cary Millsapwith Jeff Holt

This is the Title of the Book, eMatter EditionCopyright © 2004 O’Reilly & Associates, Inc. All rights reserved.
73
Chapter 5 CHAPTER 5
Interpreting Extended SQL Trace Data
To succeed, a performance analyst must understand the language in which a systemcommunicates information about its performance. Unfortunately, for over a decade,the domain of Oracle time statistics has been one of the most misunderstood areas ofthe Oracle kernel. To understand the response time instrumentation that the Oraclekernel provides, you must understand how the Oracle kernel interacts with its hostoperating system. It is this operating system that allocates resources to the Oraclekernel process itself, and it is the operating system that actually supplies the timingstatistics that Oracle uses to describe its own performance.
Trace File Walk-ThroughI believe that the best way to begin the study of Oracle operational data is with a tourof Oracle’s extended SQL trace output. SQL trace output is unsurpassed as an educa-tional and diagnostic aid, because it presents a linear sequential recorded history ofwhat the Oracle kernel does in response to an application’s demands upon thedatabase.
The SQL trace feature has been a part of the Oracle kernel since Version 6, whichshould be older than any version of Oracle that you are currently running. In 1992,with the release of the kernel Version 7.0.12, Oracle Corporation significantlyenhanced the value of SQL trace data by adding information about the durations ofnon–CPU-consuming instructions that the Oracle kernel executes.
Let’s begin our study with the “Hello, world” of Oracle response time data.Example 5-1 shows one of the simplest SQL*Plus sessions you can run. The sessionactivates the extended SQL trace mechanism for itself. It then queries the string“Hello, world; today is sysdate” from the database and exits.
Example 5-1. Input for a SQL*Plus session that generates extended SQL trace data for a simplequery
alter session set max_dump_file_size=unlimited;alter session set timed_statistics=true;
optoraclep-veritas-feb2004-lc

This is the Title of the Book, eMatter EditionCopyright © 2004 O’Reilly & Associates, Inc. All rights reserved.
74 | Chapter 5: Interpreting Extended SQL Trace Data
The trace file shown in Example 5-2 reveals the sequence of actions the Oracle ker-nel performed on behalf of this session. If you’ve learned to view SQL trace data onlythrough the lens of Oracle’s tkprof, then you’re in for a treat. By upgrading yourunderstanding of extended SQL trace data in the raw, you’ll earn the ability to diag-nose more classes of performance problem than can be detected with tkprof alone.After becoming fluent with raw trace data, many analysts are surprised by how manydeficiencies they find in tkprof.
alter session set events '10046 trace name context forever, level 12';select 'Hello, world; today is '||sysdate from dual;exit;
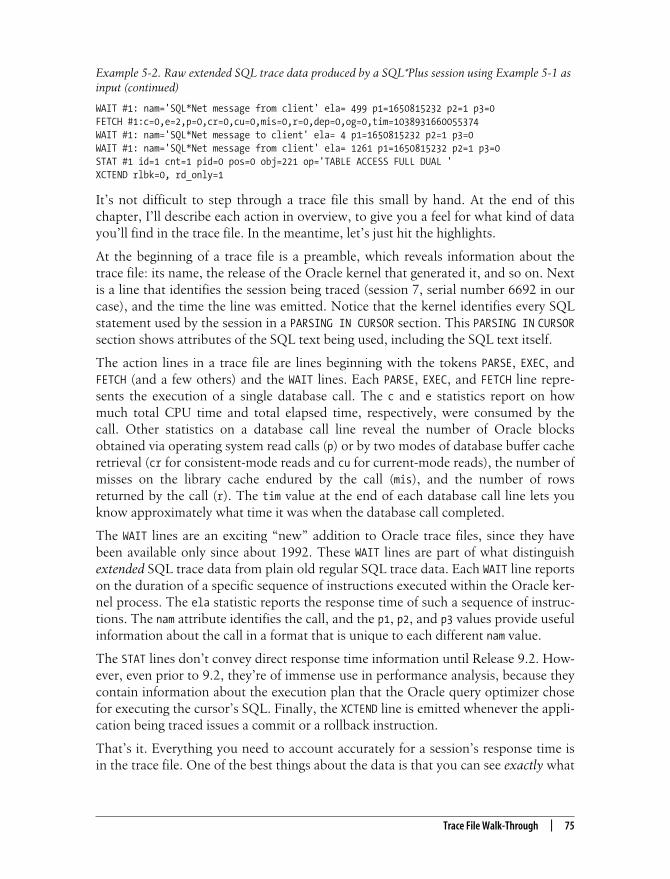
Example 5-2. Raw extended SQL trace data produced by a SQL*Plus session using Example 5-1 asinput
/u01/oradata/admin/V901/udump/ora_9178.trcOracle9i Enterprise Edition Release 9.0.1.0.0 - ProductionWith the Partitioning optionJServer Release 9.0.1.0.0 - ProductionORACLE_HOME = /u01/oradata/app/9.0.1System name: LinuxNode name: researchRelease: 2.4.4-4GBVersion: #1 Fri May 18 14:11:12 GMT 2001Machine: i686Instance name: V901Redo thread mounted by this instance: 1Oracle process number: 9Unix process pid: 9178, image: oracle@research (TNS V1-V3)
*** SESSION ID:(7.6692) 2002-12-03 10:07:40.051APPNAME mod='SQL*Plus' mh=3669949024 act='' ah=4029777240= = = = = = = = = = = = = = = = = = = = =PARSING IN CURSOR #1 len=69 dep=0 uid=5 oct=42 lid=5 tim=1038931660052098 hv=1509700594ad='50d6d560'alter session set events '10046 trace name context forever, level 12'END OF STMTEXEC #1:c=0,e=1,p=0,cr=0,cu=0,mis=0,r=0,dep=0,og=4,tim=1038931660051673WAIT #1: nam='SQL*Net message to client' ela= 5 p1=1650815232 p2=1 p3=0WAIT #1: nam='SQL*Net message from client' ela= 1262 p1=1650815232 p2=1 p3=0= = = = = = = = = = = = = = = = = = = = =PARSING IN CURSOR #1 len=51 dep=0 uid=5 oct=3 lid=5 tim=1038931660054075 hv=1716247018ad='50c551f8'select 'Hello, world; today is '||sysdate from dualEND OF STMTPARSE #1:c=0,e=214,p=0,cr=0,cu=0,mis=0,r=0,dep=0,og=4,tim=1038931660054053BINDS #1:EXEC #1:c=0,e=124,p=0,cr=0,cu=0,mis=0,r=0,dep=0,og=4,tim=1038931660054311WAIT #1: nam='SQL*Net message to client' ela= 5 p1=1650815232 p2=1 p3=0FETCH #1:c=0,e=177,p=0,cr=1,cu=2,mis=0,r=1,dep=0,og=4,tim=1038931660054596
Example 5-1. Input for a SQL*Plus session that generates extended SQL trace data for a simple query(continued)
This is the Title of the Book, eMatter EditionCopyright © 2004 O’Reilly & Associates, Inc. All rights reserved.
Trace File Walk-Through | 75
It’s not difficult to step through a trace file this small by hand. At the end of thischapter, I’ll describe each action in overview, to give you a feel for what kind of datayou’ll find in the trace file. In the meantime, let’s just hit the highlights.
At the beginning of a trace file is a preamble, which reveals information about thetrace file: its name, the release of the Oracle kernel that generated it, and so on. Nextis a line that identifies the session being traced (session 7, serial number 6692 in ourcase), and the time the line was emitted. Notice that the kernel identifies every SQLstatement used by the session in a PARSING IN CURSOR section. This PARSING IN CURSORsection shows attributes of the SQL text being used, including the SQL text itself.
The action lines in a trace file are lines beginning with the tokens PARSE, EXEC, andFETCH (and a few others) and the WAIT lines. Each PARSE, EXEC, and FETCH line repre-sents the execution of a single database call. The c and e statistics report on howmuch total CPU time and total elapsed time, respectively, were consumed by thecall. Other statistics on a database call line reveal the number of Oracle blocksobtained via operating system read calls (p) or by two modes of database buffer cacheretrieval (cr for consistent-mode reads and cu for current-mode reads), the number ofmisses on the library cache endured by the call (mis), and the number of rowsreturned by the call (r). The tim value at the end of each database call line lets youknow approximately what time it was when the database call completed.
The WAIT lines are an exciting “new” addition to Oracle trace files, since they havebeen available only since about 1992. These WAIT lines are part of what distinguishextended SQL trace data from plain old regular SQL trace data. Each WAIT line reportson the duration of a specific sequence of instructions executed within the Oracle ker-nel process. The ela statistic reports the response time of such a sequence of instruc-tions. The nam attribute identifies the call, and the p1, p2, and p3 values provide usefulinformation about the call in a format that is unique to each different nam value.
The STAT lines don’t convey direct response time information until Release 9.2. How-ever, even prior to 9.2, they’re of immense use in performance analysis, because theycontain information about the execution plan that the Oracle query optimizer chosefor executing the cursor’s SQL. Finally, the XCTEND line is emitted whenever the appli-cation being traced issues a commit or a rollback instruction.
That’s it. Everything you need to account accurately for a session’s response time isin the trace file. One of the best things about the data is that you can see exactly what
WAIT #1: nam='SQL*Net message from client' ela= 499 p1=1650815232 p2=1 p3=0FETCH #1:c=0,e=2,p=0,cr=0,cu=0,mis=0,r=0,dep=0,og=0,tim=1038931660055374WAIT #1: nam='SQL*Net message to client' ela= 4 p1=1650815232 p2=1 p3=0WAIT #1: nam='SQL*Net message from client' ela= 1261 p1=1650815232 p2=1 p3=0STAT #1 id=1 cnt=1 pid=0 pos=0 obj=221 op='TABLE ACCESS FULL DUAL 'XCTEND rlbk=0, rd_only=1
Example 5-2. Raw extended SQL trace data produced by a SQL*Plus session using Example 5-1 asinput (continued)

This is the Title of the Book, eMatter EditionCopyright © 2004 O’Reilly & Associates, Inc. All rights reserved.
76 | Chapter 5: Interpreting Extended SQL Trace Data
a session did during the course of its execution. You don’t have to try to extrapolatedetails from an average, like assessing V$ data forces you to do. All the details are laidout in front of you in chronological order,* and they’re stored in an easy-to-parseASCII format.
Extended SQL Trace Data ReferenceOne of the reasons for Oracle Corporation’s enormous success in the high-performancedatabase market is the easy accessibility of detailed response time data. Beginning withextended SQL trace files and extending throughout several fixed views, the Oracle kernelprovides you all the detail you need in order to know why an application has consumedexactly the response time that it did. The only thing that might be missing is whether youunderstand how to exploit all that detail. Filling this gap is the mission of my work in thisbook.
Trace File Element DefinitionsSeveral good sources exist to describe the format of each trace file line [OracleMetaLink note 39817.1; Kyte (2001) 464–475; Morle (2000) 133–142]. However,none goes far enough to enable full accounting of session response time. Fullresponse time accounting is the goal that you will achieve with the book you arereading now. The following sections describe the meaning of each of the perfor-mance-related statistics reported in Oracle’s extended SQL trace data.
Cursor numbers
Each line emitted to a trace file corresponds to one “action” executed by the Oraclekernel program. Each line uses the string #ID to identify a cursor upon which the ker-nel performed the action. For example, the following line shows a fetch executedupon cursor #1:
FETCH #1:c=0,e=177,p=0,cr=1,cu=2,mis=0,r=1,dep=0,og=4,tim=1038931660054596
The cursor numbers are relevant only within the scope of the trace file. Furthermore,the Oracle kernel makes a cursor number available for reuse within a trace file whena cursor is closed. Hence, trace file lines containing references to a given cursor num-ber do not all necessarily refer to the same cursor. Fortunately, a given trace file con-tains a time-ordered record of every cursor creation; each PARSING IN CURSOR tokenindicates a cursor birth (or rebirth). For example, the following are two PARSING INCURSOR lines from the trace file in Example 5-2:
= = = = = = = = = = = = = = = = = = = = =PARSING IN CURSOR #1 len=69 dep=0 uid=5 oct=42 lid=5 tim=1038931660052098hv=1509700594 ad='50d6d560'
* There are a few inconsequential exceptions to strict chronological ordering, which you shall see shortly.
This is the Title of the Book, eMatter EditionCopyright © 2004 O’Reilly & Associates, Inc. All rights reserved.
Extended SQL Trace Data Reference | 77
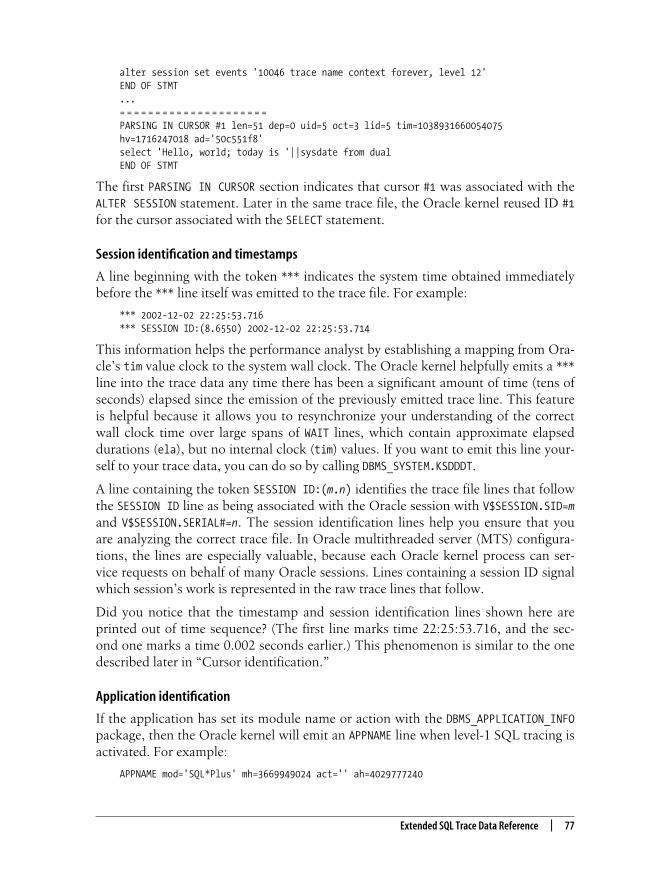
alter session set events '10046 trace name context forever, level 12'END OF STMT...= = = = = = = = = = = = = = = = = = = = =PARSING IN CURSOR #1 len=51 dep=0 uid=5 oct=3 lid=5 tim=1038931660054075hv=1716247018 ad='50c551f8'select 'Hello, world; today is '||sysdate from dualEND OF STMT
The first PARSING IN CURSOR section indicates that cursor #1 was associated with theALTER SESSION statement. Later in the same trace file, the Oracle kernel reused ID #1for the cursor associated with the SELECT statement.
Session identification and timestamps
A line beginning with the token *** indicates the system time obtained immediatelybefore the *** line itself was emitted to the trace file. For example:
*** 2002-12-02 22:25:53.716*** SESSION ID:(8.6550) 2002-12-02 22:25:53.714
This information helps the performance analyst by establishing a mapping from Ora-cle’s tim value clock to the system wall clock. The Oracle kernel helpfully emits a ***line into the trace data any time there has been a significant amount of time (tens ofseconds) elapsed since the emission of the previously emitted trace line. This featureis helpful because it allows you to resynchronize your understanding of the correctwall clock time over large spans of WAIT lines, which contain approximate elapseddurations (ela), but no internal clock (tim) values. If you want to emit this line your-self to your trace data, you can do so by calling DBMS_SYSTEM.KSDDDT.
A line containing the token SESSION ID:(m.n) identifies the trace file lines that followthe SESSION ID line as being associated with the Oracle session with V$SESSION.SID=mand V$SESSION.SERIAL#=n. The session identification lines help you ensure that youare analyzing the correct trace file. In Oracle multithreaded server (MTS) configura-tions, the lines are especially valuable, because each Oracle kernel process can ser-vice requests on behalf of many Oracle sessions. Lines containing a session ID signalwhich session’s work is represented in the raw trace lines that follow.
Did you notice that the timestamp and session identification lines shown here areprinted out of time sequence? (The first line marks time 22:25:53.716, and the sec-ond one marks a time 0.002 seconds earlier.) This phenomenon is similar to the onedescribed later in “Cursor identification.”
Application identification
If the application has set its module name or action with the DBMS_APPLICATION_INFOpackage, then the Oracle kernel will emit an APPNAME line when level-1 SQL tracing isactivated. For example:
APPNAME mod='SQL*Plus' mh=3669949024 act='' ah=4029777240
This is the Title of the Book, eMatter EditionCopyright © 2004 O’Reilly & Associates, Inc. All rights reserved.
78 | Chapter 5: Interpreting Extended SQL Trace Data
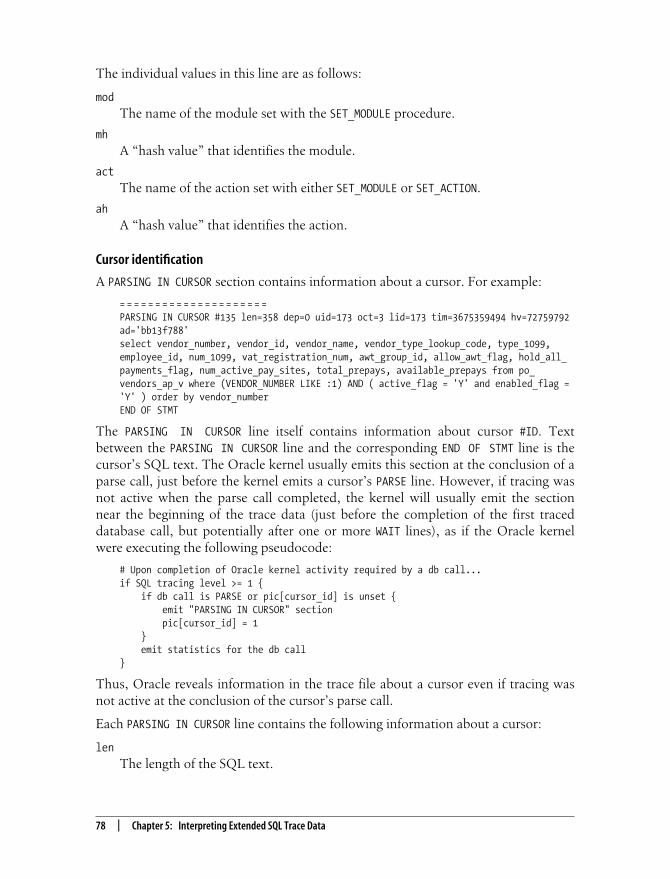
The individual values in this line are as follows:
modThe name of the module set with the SET_MODULE procedure.
mhA “hash value” that identifies the module.
actThe name of the action set with either SET_MODULE or SET_ACTION.
ahA “hash value” that identifies the action.
Cursor identification
A PARSING IN CURSOR section contains information about a cursor. For example:
= = = = = = = = = = = = = = = = = = = = =PARSING IN CURSOR #135 len=358 dep=0 uid=173 oct=3 lid=173 tim=3675359494 hv=72759792ad='bb13f788'select vendor_number, vendor_id, vendor_name, vendor_type_lookup_code, type_1099,employee_id, num_1099, vat_registration_num, awt_group_id, allow_awt_flag, hold_all_payments_flag, num_active_pay_sites, total_prepays, available_prepays from po_vendors_ap_v where (VENDOR_NUMBER LIKE :1) AND ( active_flag = 'Y' and enabled_flag ='Y' ) order by vendor_numberEND OF STMT
The PARSING IN CURSOR line itself contains information about cursor #ID. Textbetween the PARSING IN CURSOR line and the corresponding END OF STMT line is thecursor’s SQL text. The Oracle kernel usually emits this section at the conclusion of aparse call, just before the kernel emits a cursor’s PARSE line. However, if tracing wasnot active when the parse call completed, the kernel will usually emit the sectionnear the beginning of the trace data (just before the completion of the first traceddatabase call, but potentially after one or more WAIT lines), as if the Oracle kernelwere executing the following pseudocode:
# Upon completion of Oracle kernel activity required by a db call...if SQL tracing level >= 1 { if db call is PARSE or pic[cursor_id] is unset { emit "PARSING IN CURSOR" section pic[cursor_id] = 1 } emit statistics for the db call}
Thus, Oracle reveals information in the trace file about a cursor even if tracing wasnot active at the conclusion of the cursor’s parse call.
Each PARSING IN CURSOR line contains the following information about a cursor:
lenThe length of the SQL text.
This is the Title of the Book, eMatter EditionCopyright © 2004 O’Reilly & Associates, Inc. All rights reserved.
Extended SQL Trace Data Reference | 79
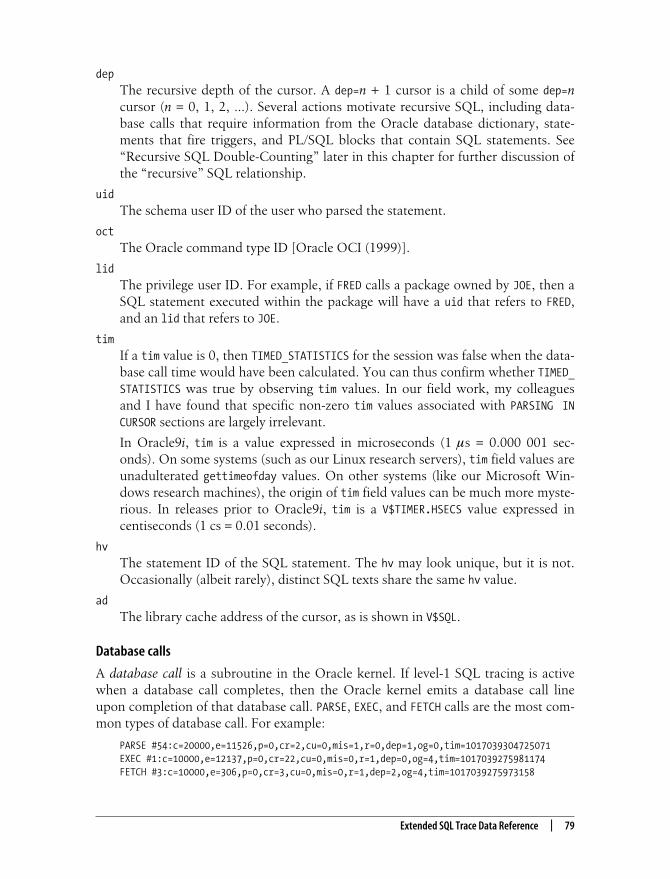
depThe recursive depth of the cursor. A dep=n + 1 cursor is a child of some dep=ncursor (n = 0, 1, 2, …). Several actions motivate recursive SQL, including data-base calls that require information from the Oracle database dictionary, state-ments that fire triggers, and PL/SQL blocks that contain SQL statements. See“Recursive SQL Double-Counting” later in this chapter for further discussion ofthe “recursive” SQL relationship.
uidThe schema user ID of the user who parsed the statement.
octThe Oracle command type ID [Oracle OCI (1999)].
lidThe privilege user ID. For example, if FRED calls a package owned by JOE, then aSQL statement executed within the package will have a uid that refers to FRED,and an lid that refers to JOE.
timIf a tim value is 0, then TIMED_STATISTICS for the session was false when the data-base call time would have been calculated. You can thus confirm whether TIMED_STATISTICS was true by observing tim values. In our field work, my colleaguesand I have found that specific non-zero tim values associated with PARSING INCURSOR sections are largely irrelevant.
In Oracle9i, tim is a value expressed in microseconds (1 µs = 0.000 001 sec-onds). On some systems (such as our Linux research servers), tim field values areunadulterated gettimeofday values. On other systems (like our Microsoft Win-dows research machines), the origin of tim field values can be much more myste-rious. In releases prior to Oracle9i, tim is a V$TIMER.HSECS value expressed incentiseconds (1 cs = 0.01 seconds).
hvThe statement ID of the SQL statement. The hv may look unique, but it is not.Occasionally (albeit rarely), distinct SQL texts share the same hv value.
adThe library cache address of the cursor, as is shown in V$SQL.
Database calls
A database call is a subroutine in the Oracle kernel. If level-1 SQL tracing is activewhen a database call completes, then the Oracle kernel emits a database call lineupon completion of that database call. PARSE, EXEC, and FETCH calls are the most com-mon types of database call. For example:
PARSE #54:c=20000,e=11526,p=0,cr=2,cu=0,mis=1,r=0,dep=1,og=0,tim=1017039304725071EXEC #1:c=10000,e=12137,p=0,cr=22,cu=0,mis=0,r=1,dep=0,og=4,tim=1017039275981174FETCH #3:c=10000,e=306,p=0,cr=3,cu=0,mis=0,r=1,dep=2,og=4,tim=1017039275973158

This is the Title of the Book, eMatter EditionCopyright © 2004 O’Reilly & Associates, Inc. All rights reserved.
80 | Chapter 5: Interpreting Extended SQL Trace Data
Other database call types (for example, ERROR, UNMAP, and SORT UNMAP) are explainedin Oracle MetaLink note 39817.1. Each database call line contains the followingstatistics:
cThe total CPU time consumed by the Oracle process during the call. Oracle9iexpresses c in microseconds (1 µs = 0.000 001 seconds). Prior kernel versionsexpress c in centiseconds (1 cs = 0.01 seconds).
eThe amount of wall time that elapsed during the call. Oracle9i expresses e inmicroseconds (1 µs = 0.000 001 seconds). Prior kernel versions express e in cen-tiseconds (1 cs = 0.01 seconds).
pThe number of Oracle database blocks obtained by the call via operating systemdisk read calls. The name p is supposed to be mnemonic for the word “physi-cal,” but note that not every so-called Oracle “physical” read visits a physicaldisk device. Many such reads are serviced from various caches between the Ora-cle kernel and the physical disk.
crThe number of Oracle database blocks obtained by the call in consistent modefrom the Oracle database buffer cache. A read executed in consistent mode canmotivate additional consistent mode reads from undo blocks, which are storedin rollback segments.
cuThe number of Oracle database blocks obtained by the call in current mode fromthe Oracle database buffer cache. A read executed in current mode is simply aread of the current content of a block.
misThe number of library cache misses encountered during the call. Each librarycache miss motivates a hard parse operation.
rThe number of rows returned by the call.
depThe recursive depth of the cursor. A dep=n + 1 cursor is a child of some dep=ncursor (n = 0, 1, 2, …). See the “Cursor identification” section earlier in thischapter for more details.
ogThe optimizer goal in effect during the call. Oracle uses the values shown inTable 5-1.
timSee the “Cursor identification” section listed previously for details.
This is the Title of the Book, eMatter EditionCopyright © 2004 O’Reilly & Associates, Inc. All rights reserved.
Extended SQL Trace Data Reference | 81
Note that the Oracle kernel does not emit a database call line into the trace file untilthe action has completed. Thus, an extraordinarily long database operation mightcause the Oracle kernel to work for several hours without emitting anything to thetrace file. Poorly optimized SQL can produce EXEC calls (for updates or deletes) orFETCH calls (for selects) that consume CPU capacity for several days at a time.
Wait events
An Oracle wait event is a sequence of Oracle kernel instructions that is wrapped withspecial timing instrumentation. If level-8 or level-12 SQL tracing is active when await event completes, then the Oracle kernel emits a WAIT line upon completion ofthat event. For example:
WAIT #1: nam='SQL*Net message to client' ela= 40 p1=1650815232 p2=1 p3=0WAIT #1: nam='SQL*Net message from client' ela= 1709 p1=1650815232 p2=1 p3=0WAIT #34: nam='db file sequential read' ela= 14118 p1=52 p2=2755 p3=1WAIT #44: nam='latch free' ela= 1327989 p1=-1721538020 p2=87 p3=13
Each WAIT line contains the following statistics about work executed during theevent:
namThe name assigned by an Oracle kernel developer to reveal which part of theOracle kernel code is responsible for this portion of your response time.
elaThe elapsed duration of the named event’s execution. Oracle9i expresses ela inmicroseconds (1 µs = 0.000 001 seconds). Prior kernel versions express ela incentiseconds (1 cs = 0.01 seconds).
p1, p2, p3The meanings of these parameters vary by nam. A complete catalog of parameterdescriptions for each event type is available by running the following SQL:
select name, parameter1, parameter2, parameter3from v$event_name order by name
Note that WAIT lines appear in the trace data before the database call that motivatedthem. This occurs because the Oracle kernel emits lines into the trace file as eventscomplete. Thus, if a fetch call requires three OS read calls, the three waits for theread calls will appear in the trace file before Oracle emits the information about thecompleted fetch call.
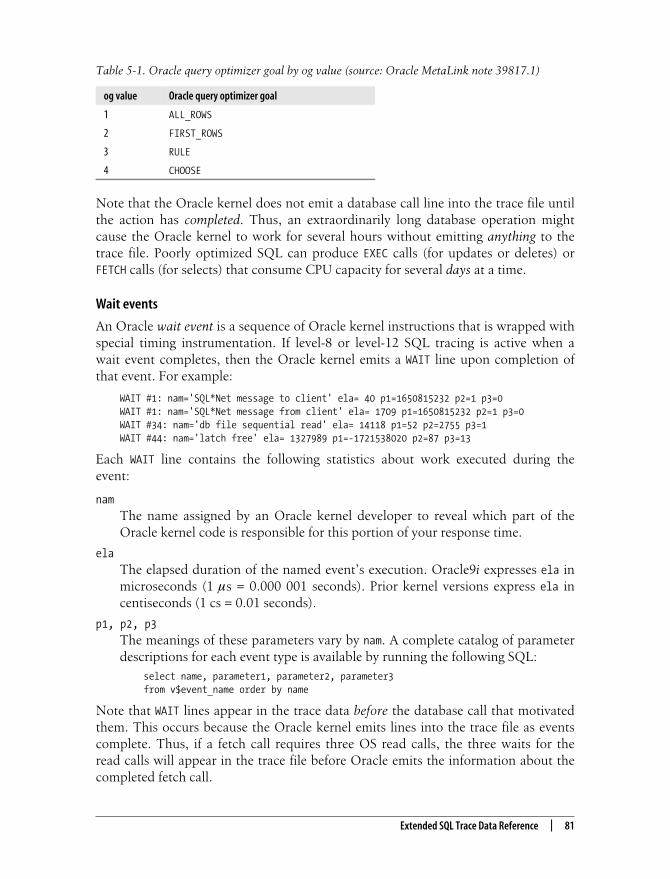
Table 5-1. Oracle query optimizer goal by og value (source: Oracle MetaLink note 39817.1)
og value Oracle query optimizer goal
1 ALL_ROWS
2 FIRST_ROWS
3 RULE
4 CHOOSE
This is the Title of the Book, eMatter EditionCopyright © 2004 O’Reilly & Associates, Inc. All rights reserved.
82 | Chapter 5: Interpreting Extended SQL Trace Data
The WAIT lines in SQL trace data are one interface to the new Oracle feature intro-duced in 1992 that has been so important in revolutionizing the ease with which wecan diagnose and repair performance problems today.
Bind variables
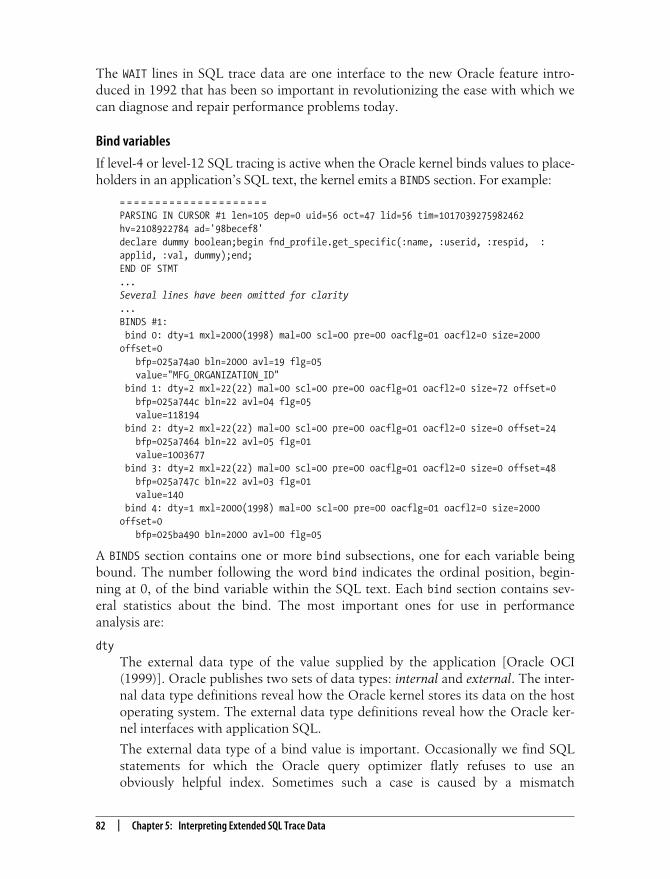
If level-4 or level-12 SQL tracing is active when the Oracle kernel binds values to place-holders in an application’s SQL text, the kernel emits a BINDS section. For example:
= = = = = = = = = = = = = = = = = = = = =PARSING IN CURSOR #1 len=105 dep=0 uid=56 oct=47 lid=56 tim=1017039275982462hv=2108922784 ad='98becef8'declare dummy boolean;begin fnd_profile.get_specific(:name, :userid, :respid, :applid, :val, dummy);end;END OF STMT...Several lines have been omitted for clarity...BINDS #1: bind 0: dty=1 mxl=2000(1998) mal=00 scl=00 pre=00 oacflg=01 oacfl2=0 size=2000offset=0 bfp=025a74a0 bln=2000 avl=19 flg=05 value="MFG_ORGANIZATION_ID" bind 1: dty=2 mxl=22(22) mal=00 scl=00 pre=00 oacflg=01 oacfl2=0 size=72 offset=0 bfp=025a744c bln=22 avl=04 flg=05 value=118194 bind 2: dty=2 mxl=22(22) mal=00 scl=00 pre=00 oacflg=01 oacfl2=0 size=0 offset=24 bfp=025a7464 bln=22 avl=05 flg=01 value=1003677 bind 3: dty=2 mxl=22(22) mal=00 scl=00 pre=00 oacflg=01 oacfl2=0 size=0 offset=48 bfp=025a747c bln=22 avl=03 flg=01 value=140 bind 4: dty=1 mxl=2000(1998) mal=00 scl=00 pre=00 oacflg=01 oacfl2=0 size=2000offset=0 bfp=025ba490 bln=2000 avl=00 flg=05
A BINDS section contains one or more bind subsections, one for each variable beingbound. The number following the word bind indicates the ordinal position, begin-ning at 0, of the bind variable within the SQL text. Each bind section contains sev-eral statistics about the bind. The most important ones for use in performanceanalysis are:
dtyThe external data type of the value supplied by the application [Oracle OCI(1999)]. Oracle publishes two sets of data types: internal and external. The inter-nal data type definitions reveal how the Oracle kernel stores its data on the hostoperating system. The external data type definitions reveal how the Oracle ker-nel interfaces with application SQL.
The external data type of a bind value is important. Occasionally we find SQLstatements for which the Oracle query optimizer flatly refuses to use anobviously helpful index. Sometimes such a case is caused by a mismatch

This is the Title of the Book, eMatter EditionCopyright © 2004 O’Reilly & Associates, Inc. All rights reserved.
Extended SQL Trace Data Reference | 83
between the column type and the value type, which can force an implicit typecoercion function to be executed upon the column, which prevents the opti-mizer from choosing that index.
avlThe length, in bytes, of the bind value.
valueThe value that is bound into the statement execution. The Oracle kernel some-times truncates values that it emits into the trace file. You can determine exactlywhen this has happened by simple inspection; truncation has occurred any timethe avl value is larger than the length of the value field.
Row source operations
If level-1 SQL tracing is active when a cursor is closed, then the Oracle kernel emits oneSTAT line for each row source operation in the cursor’s execution plan. For example:
STAT #1 id=1 cnt=55 pid=0 pos=1 obj=0 op='SORT UNIQUE (cr=39741 r=133 w=0time=1643800 us)'STAT #1 id=2 cnt=23395 pid=1 pos=1 obj=0 op='VIEW (cr=39741 r=133 w=0 time=1614067us)'STAT #1 id=3 cnt=23395 pid=2 pos=1 obj=0 op='SORT UNIQUE (cr=39741 r=133 w=0time=1600554 us)'STAT #1 id=4 cnt=23395 pid=3 pos=1 obj=0 op='UNION-ALL (cr=39741 r=133 w=0time=1385984 us)'
If a trace file does not contain the STAT lines you were hoping to find, it is becausetracing was deactivated before the cursor closed. The STAT lines will of course beabsent any time you trace a well-designed persistent service that neither terminatesnor closes its cursors more than once every several weeks.
Each STAT line contains the following statistics about the cursor’s execution plan:
idThe unique ID of the row source operation within the STAT line set.
cntNumber of rows returned by this row source operation.
pidID of this operation’s parent operation.
posThe best we can determine, an arbitrary number. It might seem that this valuemight define the “position” of a row source operation within a set of operationsbelonging to a single parent, but it appears that sibling row source operations areordered in increasing ID order.
objObject ID of the row source operation, if the operation executes upon a “baseobject.” A row source operation such as NESTED LOOPS, which itself does not
This is the Title of the Book, eMatter EditionCopyright © 2004 O’Reilly & Associates, Inc. All rights reserved.
84 | Chapter 5: Interpreting Extended SQL Trace Data
access a base object, will report obj=0. (The NESTED LOOPS operation’s children doaccess base objects, but the NESTED LOOPS row source operation itself does not.)
opThe name of the row source operation. Beginning with Oracle Release 9.2.0.2.0,the kernel emits additional information into the STAT lines [Rivenes (2003)]. Thenew information reveals several useful statistics for each row source operation,including:
crNumber of consistent-mode reads.
rNumber of Oracle blocks read with OS read calls.
wNumber of Oracle blocks written with OS write calls.
timeThe elapsed duration, expressed in microseconds (us).
The statistics for a parent row source operation include a roll-up of the statisticsfor its children.
Oracle’s tkprof utility produces erroneous results in more cases thanyou might have imagined, especially in STAT line processing. Oracle’stkprof has an exceptional reputation for reliability, but I’m convincedthat one reason the tool maintains this reputation is that people sim-ply never bother to double-check its output. To confirm or refutewhether tkprof is giving correct output is impossible to do withoutstudying raw trace data. Most people are reluctant to do this. I hopethis book helps encourage you to make the effort.
Transaction end markers
If level-1 SQL tracing is active when a commit or rollback occurs, then the Oraclekernel emits an XCTEND line upon completion of the call. For example:
XCTEND rlbk=0, rd_only=0
Each XCTEND line contains the following statistics about work executed during thecommit or rollback:
rlbkTrue (1) if and only if the transaction was rolled back.
rd_onlyTrue (1) if and only if the transaction changed no data in the database.
Notice that the XCTEND marker has no cursor ID reference. This is because there is aone-to-many relationship between a transaction and the cursors that participate inthe transaction.
This is the Title of the Book, eMatter EditionCopyright © 2004 O’Reilly & Associates, Inc. All rights reserved.
Extended SQL Trace Data Reference | 85
Reference summary
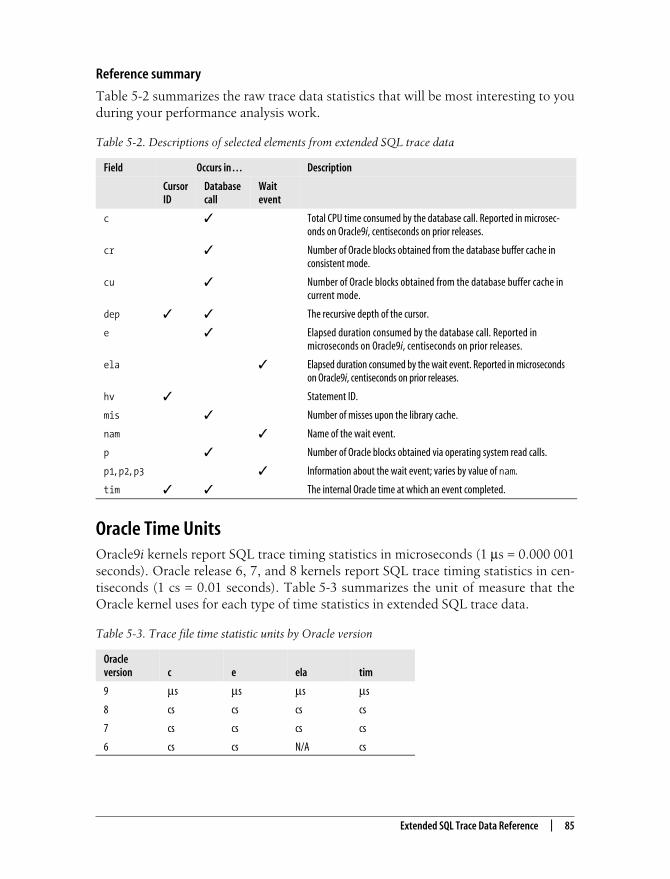
Table 5-2 summarizes the raw trace data statistics that will be most interesting to youduring your performance analysis work.
Oracle Time UnitsOracle9i kernels report SQL trace timing statistics in microseconds (1 µs = 0.000 001seconds). Oracle release 6, 7, and 8 kernels report SQL trace timing statistics in cen-tiseconds (1 cs = 0.01 seconds). Table 5-3 summarizes the unit of measure that theOracle kernel uses for each type of time statistics in extended SQL trace data.
Table 5-2. Descriptions of selected elements from extended SQL trace data
Field Occurs in . . . Description
CursorID
Databasecall
Waitevent
c � Total CPU time consumed by the database call. Reported in microsec-onds on Oracle9i, centiseconds on prior releases.
cr � Number of Oracle blocks obtained from the database buffer cache inconsistent mode.
cu � Number of Oracle blocks obtained from the database buffer cache incurrent mode.
dep � � The recursive depth of the cursor.
e � Elapsed duration consumed by the database call. Reported inmicroseconds on Oracle9i, centiseconds on prior releases.
ela � Elapsed duration consumed by the wait event. Reported in microsecondson Oracle9i, centiseconds on prior releases.
hv � Statement ID.
mis � Number of misses upon the library cache.
nam � Name of the wait event.
p � Number of Oracle blocks obtained via operating system read calls.
p1, p2, p3 � Information about the wait event; varies by value of nam.
tim � � The internal Oracle time at which an event completed.
Table 5-3. Trace file time statistic units by Oracle version
Oracleversion c e ela tim
9 µs µs µs µs
8 cs cs cs cs
7 cs cs cs cs
6 cs cs N/A cs
This is the Title of the Book, eMatter EditionCopyright © 2004 O’Reilly & Associates, Inc. All rights reserved.
86 | Chapter 5: Interpreting Extended SQL Trace Data
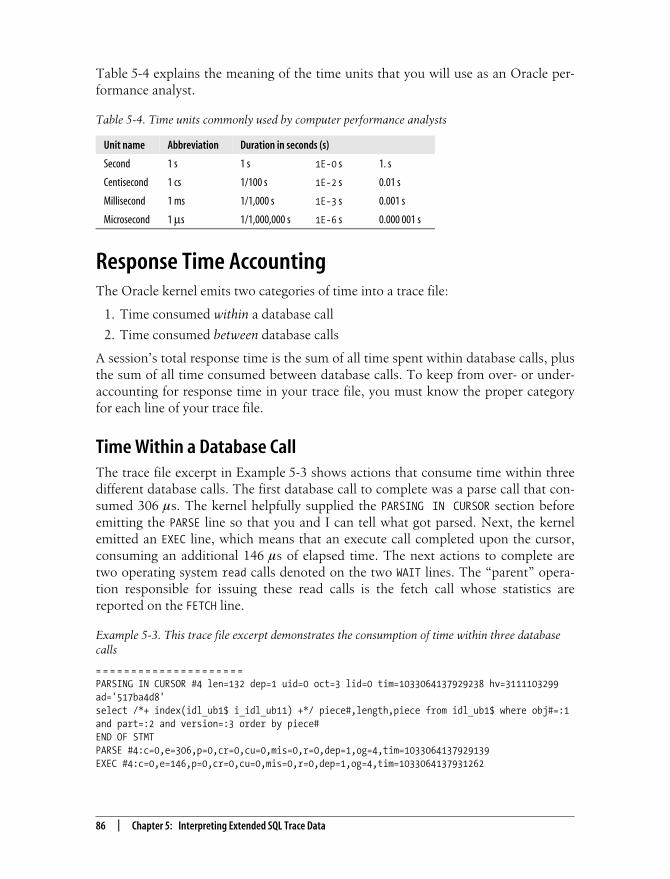
Table 5-4 explains the meaning of the time units that you will use as an Oracle per-formance analyst.
Response Time AccountingThe Oracle kernel emits two categories of time into a trace file:
1. Time consumed within a database call
2. Time consumed between database calls
A session’s total response time is the sum of all time spent within database calls, plusthe sum of all time consumed between database calls. To keep from over- or under-accounting for response time in your trace file, you must know the proper categoryfor each line of your trace file.
Time Within a Database CallThe trace file excerpt in Example 5-3 shows actions that consume time within threedifferent database calls. The first database call to complete was a parse call that con-sumed 306 µs. The kernel helpfully supplied the PARSING IN CURSOR section beforeemitting the PARSE line so that you and I can tell what got parsed. Next, the kernelemitted an EXEC line, which means that an execute call completed upon the cursor,consuming an additional 146 µs of elapsed time. The next actions to complete aretwo operating system read calls denoted on the two WAIT lines. The “parent” opera-tion responsible for issuing these read calls is the fetch call whose statistics arereported on the FETCH line.
Table 5-4. Time units commonly used by computer performance analysts
Unit name Abbreviation Duration in seconds (s)
Second 1 s 1 s 1E-0 s 1. s
Centisecond 1 cs 1/100 s 1E-2 s 0.01 s
Millisecond 1 ms 1/1,000 s 1E-3 s 0.001 s
Microsecond 1 µs 1/1,000,000 s 1E-6 s 0.000 001 s
Example 5-3. This trace file excerpt demonstrates the consumption of time within three databasecalls
= = = = = = = = = = = = = = = = = = = = =PARSING IN CURSOR #4 len=132 dep=1 uid=0 oct=3 lid=0 tim=1033064137929238 hv=3111103299ad='517ba4d8'select /*+ index(idl_ub1$ i_idl_ub11) +*/ piece#,length,piece from idl_ub1$ where obj#=:1and part=:2 and version=:3 order by piece#END OF STMTPARSE #4:c=0,e=306,p=0,cr=0,cu=0,mis=0,r=0,dep=1,og=4,tim=1033064137929139EXEC #4:c=0,e=146,p=0,cr=0,cu=0,mis=0,r=0,dep=1,og=4,tim=1033064137931262
This is the Title of the Book, eMatter EditionCopyright © 2004 O’Reilly & Associates, Inc. All rights reserved.
Response Time Accounting | 87
The lines for the read calls occur in the trace data before the line for the fetch thatmotivated them because the Oracle kernel emits the statistics for an action upon thataction’s completion. The Oracle kernel instructions that produced these trace lineslooked something like this:
fetch IDL_UBL$ query execute some of the instructions necessary for the IDL_UBL$ fetch perform a single-block I/O call upon file 1, block 53903 emit �"WAIT #4: nam='db file sequential read' ela=13060 ..." execute some more fetch instructions perform a single-block I/O call upon file 1, block 4726 emit �"WAIT #4: nam='db file sequential read' ela=6978 ..." execute the remainder of the fetch instructions emit �"FETCH #4:c=0,e=21340,..."close the cursoretc.
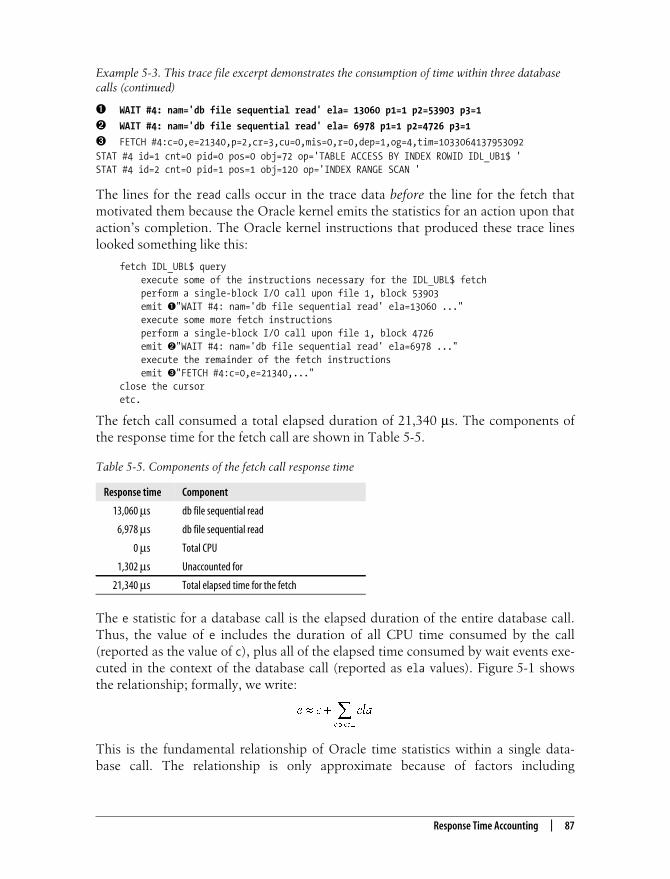
The fetch call consumed a total elapsed duration of 21,340 µs. The components ofthe response time for the fetch call are shown in Table 5-5.
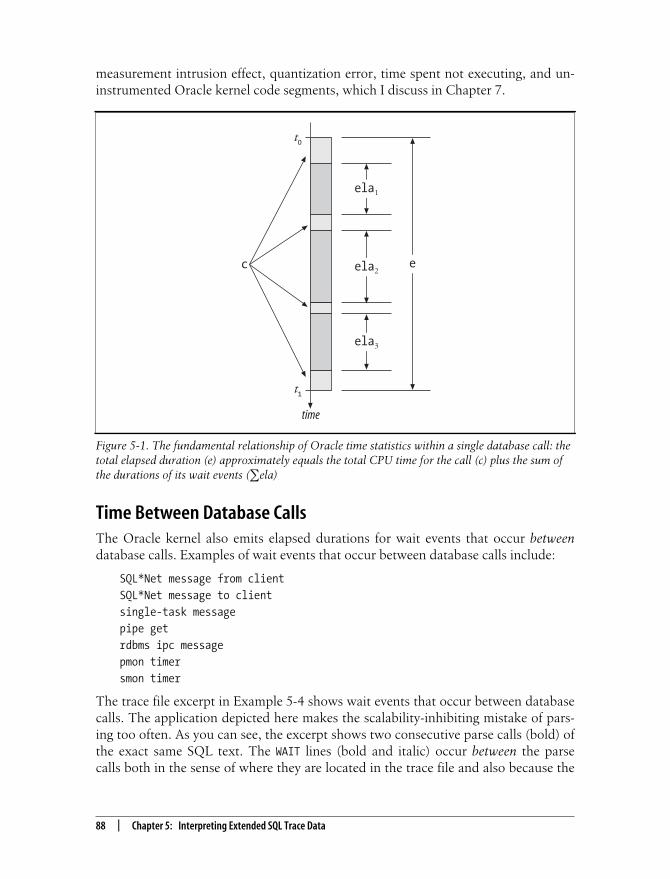
The e statistic for a database call is the elapsed duration of the entire database call.Thus, the value of e includes the duration of all CPU time consumed by the call(reported as the value of c), plus all of the elapsed time consumed by wait events exe-cuted in the context of the database call (reported as ela values). Figure 5-1 showsthe relationship; formally, we write:
This is the fundamental relationship of Oracle time statistics within a single data-base call. The relationship is only approximate because of factors including
� WAIT #4: nam='db file sequential read' ela= 13060 p1=1 p2=53903 p3=1
� WAIT #4: nam='db file sequential read' ela= 6978 p1=1 p2=4726 p3=1
� FETCH #4:c=0,e=21340,p=2,cr=3,cu=0,mis=0,r=0,dep=1,og=4,tim=1033064137953092STAT #4 id=1 cnt=0 pid=0 pos=0 obj=72 op='TABLE ACCESS BY INDEX ROWID IDL_UB1$ 'STAT #4 id=2 cnt=0 pid=1 pos=1 obj=120 op='INDEX RANGE SCAN '
Table 5-5. Components of the fetch call response time
Response time Component
13,060 µs db file sequential read
6,978 µs db file sequential read
0 µs Total CPU
1,302 µs Unaccounted for
21,340 µs Total elapsed time for the fetch
Example 5-3. This trace file excerpt demonstrates the consumption of time within three databasecalls (continued)
This is the Title of the Book, eMatter EditionCopyright © 2004 O’Reilly & Associates, Inc. All rights reserved.
88 | Chapter 5: Interpreting Extended SQL Trace Data
measurement intrusion effect, quantization error, time spent not executing, and un-instrumented Oracle kernel code segments, which I discuss in Chapter 7.
Time Between Database CallsThe Oracle kernel also emits elapsed durations for wait events that occur betweendatabase calls. Examples of wait events that occur between database calls include:
SQL*Net message from clientSQL*Net message to clientsingle-task messagepipe getrdbms ipc messagepmon timersmon timer
The trace file excerpt in Example 5-4 shows wait events that occur between databasecalls. The application depicted here makes the scalability-inhibiting mistake of pars-ing too often. As you can see, the excerpt shows two consecutive parse calls (bold) ofthe exact same SQL text. The WAIT lines (bold and italic) occur between the parsecalls both in the sense of where they are located in the trace file and also because the
Figure 5-1. The fundamental relationship of Oracle time statistics within a single database call: thetotal elapsed duration (e) approximately equals the total CPU time for the call (c) plus the sum ofthe durations of its wait events (∑ela)
time
t0
t1
e
ela1
ela2
ela3
c
This is the Title of the Book, eMatter EditionCopyright © 2004 O’Reilly & Associates, Inc. All rights reserved.
Response Time Accounting | 89
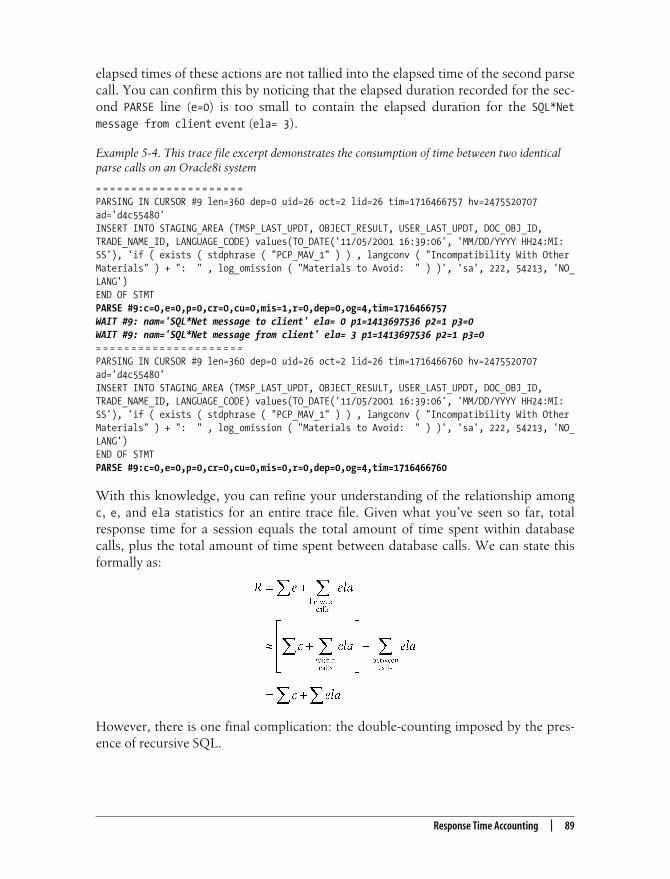
elapsed times of these actions are not tallied into the elapsed time of the second parsecall. You can confirm this by noticing that the elapsed duration recorded for the sec-ond PARSE line (e=0) is too small to contain the elapsed duration for the SQL*Netmessage from client event (ela= 3).
With this knowledge, you can refine your understanding of the relationship amongc, e, and ela statistics for an entire trace file. Given what you’ve seen so far, totalresponse time for a session equals the total amount of time spent within databasecalls, plus the total amount of time spent between database calls. We can state thisformally as:
However, there is one final complication: the double-counting imposed by the pres-ence of recursive SQL.
Example 5-4. This trace file excerpt demonstrates the consumption of time between two identicalparse calls on an Oracle8i system
= = = = = = = = = = = = = = = = = = = = =PARSING IN CURSOR #9 len=360 dep=0 uid=26 oct=2 lid=26 tim=1716466757 hv=2475520707ad='d4c55480'INSERT INTO STAGING_AREA (TMSP_LAST_UPDT, OBJECT_RESULT, USER_LAST_UPDT, DOC_OBJ_ID,TRADE_NAME_ID, LANGUAGE_CODE) values(TO_DATE('11/05/2001 16:39:06', 'MM/DD/YYYY HH24:MI:SS'), 'if ( exists ( stdphrase ( "PCP_MAV_1" ) ) , langconv ( "Incompatibility With OtherMaterials" ) + ": " , log_omission ( "Materials to Avoid: " ) )', 'sa', 222, 54213, 'NO_LANG')END OF STMTPARSE #9:c=0,e=0,p=0,cr=0,cu=0,mis=1,r=0,dep=0,og=4,tim=1716466757WAIT #9: nam='SQL*Net message to client' ela= 0 p1=1413697536 p2=1 p3=0WAIT #9: nam='SQL*Net message from client' ela= 3 p1=1413697536 p2=1 p3=0= = = = = = = = = = = = = = = = = = = = =PARSING IN CURSOR #9 len=360 dep=0 uid=26 oct=2 lid=26 tim=1716466760 hv=2475520707ad='d4c55480'INSERT INTO STAGING_AREA (TMSP_LAST_UPDT, OBJECT_RESULT, USER_LAST_UPDT, DOC_OBJ_ID,TRADE_NAME_ID, LANGUAGE_CODE) values(TO_DATE('11/05/2001 16:39:06', 'MM/DD/YYYY HH24:MI:SS'), 'if ( exists ( stdphrase ( "PCP_MAV_1" ) ) , langconv ( "Incompatibility With OtherMaterials" ) + ": " , log_omission ( "Materials to Avoid: " ) )', 'sa', 222, 54213, 'NO_LANG')END OF STMTPARSE #9:c=0,e=0,p=0,cr=0,cu=0,mis=0,r=0,dep=0,og=4,tim=1716466760

This is the Title of the Book, eMatter EditionCopyright © 2004 O’Reilly & Associates, Inc. All rights reserved.
90 | Chapter 5: Interpreting Extended SQL Trace Data
Recursive SQL Double-CountingRecursive SQL is the SQL associated with any database call that has a dep value thatis greater than zero. A dep=n + 1 database call (for n = 0, 1, 2, …) can be regarded as achild of some dep=n database call. Application sessions routinely produce compli-cated enough trace data to produce a whole forest of relationships among SQL state-ments that act as each other’s parents, children, siblings, and so on. Each SQL tracefile contains enough information to enable you to determine the exact parent-childrelationships among database calls. To account for a session’s response time with-out double-counting some statistics, you must understand how to determine therecursive relationships among database calls.
Parent-child relationships
The term recursive denotes the Oracle kernel’s execution of database calls within thecontext of other database calls. Activities that inspire recursive SQL include execu-tion of DDL statements, execution of PL/SQL blocks with DML statements withinthem, database call actions with triggers on them, and all sorts of routine applica-tion DML statements that motivate data dictionary access. Any database call that canexecute another database call can motivate recursive SQL.
Example 5-5 is a trace file excerpt that contains evidence of recursive SQL in action.In this excerpt, you can see information about a new cursor labeled #2, which is asso-ciated with the following SQL text:
select text from view$ where rowid=:1
This SQL text appears nowhere within the source of the application that was traced.This SQL was motivated by the parse of a query from the DBA_OBJECTS view.
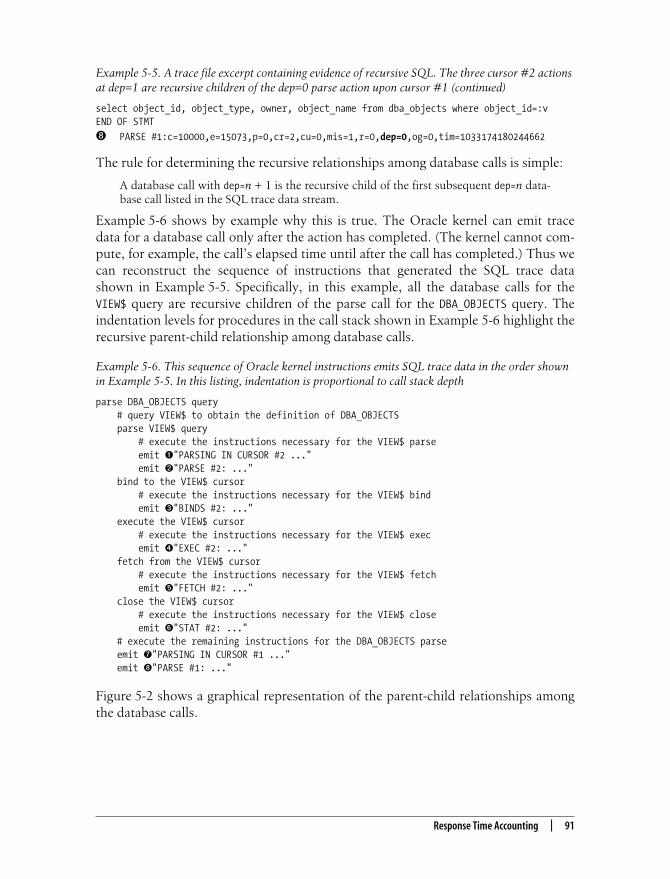
Example 5-5. A trace file excerpt containing evidence of recursive SQL. The three cursor #2 actionsat dep=1 are recursive children of the dep=0 parse action upon cursor #1
= = = = = = = = = = = = = = = = = = = = =
� PARSING IN CURSOR #2 len=37 dep=1 uid=0 oct=3 lid=0 tim=1033174180230513hv=1966425544 ad='514bb478'select text from view$ where rowid=:1END OF STMT
� PARSE #2:c=0,e=107,p=0,cr=0,cu=0,mis=0,r=0,dep=1,og=4,tim=1033174180230481
� BINDS #2: bind 0: dty=11 mxl=16(16) mal=00 scl=00 pre=00 oacflg=18 oacfl2=1 size=16 offset=0 bfp=0a22c34c bln=16 avl=16 flg=05 value=00000AB8.0000.0001
� EXEC #2:c=0,e=176,p=0,cr=0,cu=0,mis=0,r=0,dep=1,og=4,tim=1033174180230878
� FETCH #2:c=0,e=89,p=0,cr=2,cu=0,mis=0,r=1,dep=1,og=4,tim=1033174180231021
� STAT #2 id=1 cnt=1 pid=0 pos=0 obj=62 op='TABLE ACCESS BY USER ROWID VIEW$ '= = = = = = = = = = = = = = = = = = = = =
� PARSING IN CURSOR #1 len=85 dep=0 uid=5 oct=3 lid=5 tim=1033174180244680hv=1205236555 ad='50cafbec'
This is the Title of the Book, eMatter EditionCopyright © 2004 O’Reilly & Associates, Inc. All rights reserved.
Response Time Accounting | 91
The rule for determining the recursive relationships among database calls is simple:
A database call with dep=n + 1 is the recursive child of the first subsequent dep=n data-base call listed in the SQL trace data stream.
Example 5-6 shows by example why this is true. The Oracle kernel can emit tracedata for a database call only after the action has completed. (The kernel cannot com-pute, for example, the call’s elapsed time until after the call has completed.) Thus wecan reconstruct the sequence of instructions that generated the SQL trace datashown in Example 5-5. Specifically, in this example, all the database calls for theVIEW$ query are recursive children of the parse call for the DBA_OBJECTS query. Theindentation levels for procedures in the call stack shown in Example 5-6 highlight therecursive parent-child relationship among database calls.
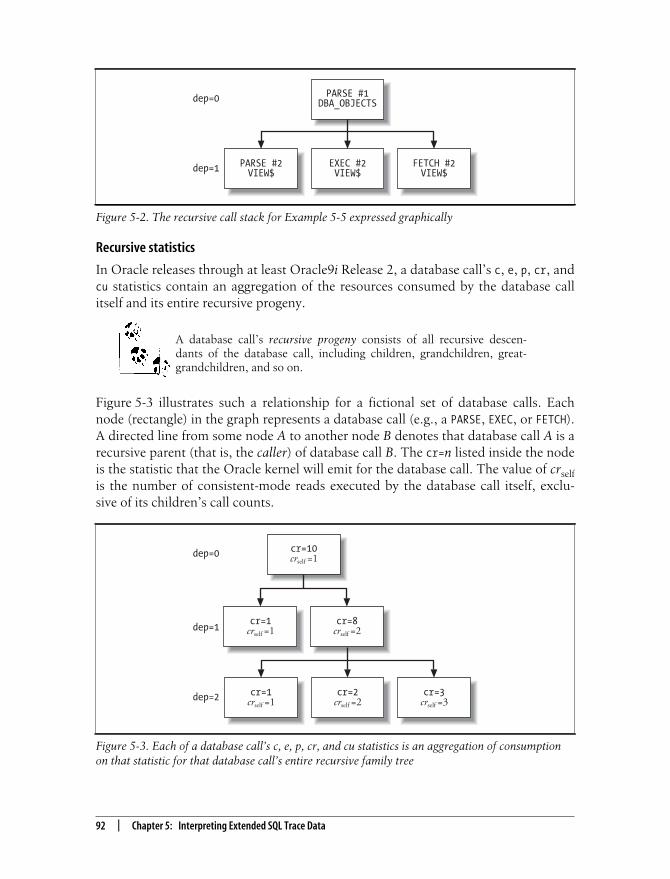
Figure 5-2 shows a graphical representation of the parent-child relationships amongthe database calls.
select object_id, object_type, owner, object_name from dba_objects where object_id=:vEND OF STMT
PARSE #1:c=10000,e=15073,p=0,cr=2,cu=0,mis=1,r=0,dep=0,og=0,tim=1033174180244662
Example 5-6. This sequence of Oracle kernel instructions emits SQL trace data in the order shownin Example 5-5. In this listing, indentation is proportional to call stack depth
parse DBA_OBJECTS query # query VIEW$ to obtain the definition of DBA_OBJECTS parse VIEW$ query # execute the instructions necessary for the VIEW$ parse emit �"PARSING IN CURSOR #2 ..." emit �"PARSE #2: ..." bind to the VIEW$ cursor # execute the instructions necessary for the VIEW$ bind emit �"BINDS #2: ..." execute the VIEW$ cursor # execute the instructions necessary for the VIEW$ exec emit �"EXEC #2: ..." fetch from the VIEW$ cursor # execute the instructions necessary for the VIEW$ fetch emit �"FETCH #2: ..." close the VIEW$ cursor # execute the instructions necessary for the VIEW$ close emit �"STAT #2: ..." # execute the remaining instructions for the DBA_OBJECTS parse emit �"PARSING IN CURSOR #1 ..." emit "PARSE #1: ..."
Example 5-5. A trace file excerpt containing evidence of recursive SQL. The three cursor #2 actionsat dep=1 are recursive children of the dep=0 parse action upon cursor #1 (continued)
This is the Title of the Book, eMatter EditionCopyright © 2004 O’Reilly & Associates, Inc. All rights reserved.
92 | Chapter 5: Interpreting Extended SQL Trace Data
Recursive statistics
In Oracle releases through at least Oracle9i Release 2, a database call’s c, e, p, cr, andcu statistics contain an aggregation of the resources consumed by the database callitself and its entire recursive progeny.
A database call’s recursive progeny consists of all recursive descen-dants of the database call, including children, grandchildren, great-grandchildren, and so on.
Figure 5-3 illustrates such a relationship for a fictional set of database calls. Eachnode (rectangle) in the graph represents a database call (e.g., a PARSE, EXEC, or FETCH).A directed line from some node A to another node B denotes that database call A is arecursive parent (that is, the caller) of database call B. The cr=n listed inside the nodeis the statistic that the Oracle kernel will emit for the database call. The value of crselfis the number of consistent-mode reads executed by the database call itself, exclu-sive of its children’s call counts.
Figure 5-2. The recursive call stack for Example 5-5 expressed graphically
Figure 5-3. Each of a database call’s c, e, p, cr, and cu statistics is an aggregation of consumptionon that statistic for that database call’s entire recursive family tree
PARSE #1DBA_OBJECTS
PARSE #2VIEW$
EXEC #2VIEW$
FETCH #2VIEW$
dep=0
dep=1
cr=1crself =1
cr=2crself =2
cr=3crself =3
dep=1
dep=2
cr=1crself =1
cr=8crself =2
cr=10crself =1dep=0

This is the Title of the Book, eMatter EditionCopyright © 2004 O’Reilly & Associates, Inc. All rights reserved.
Response Time Accounting | 93
The kernel emits only the progeny-inclusive statistics, but from these statistics youcan derive the progeny-exclusive statistics shown inside the nodes. For example, ifthe numbers inside the nodes in Figure 5-3 had been omitted, it would be easy to fillthem in. Each node’s value is simply the statistic value for that node minus the sumof the statistic values reported for that node’s direct descendants. The value of anode at dep=k is thus the cr value reported for that database call minus the sum ofthe cr values of its dep=k + 1 descendants. Or, to generalize, we can say that thequantity s of a resource consumed by a database call at dep=k is:
where si is the value of a statistic in the set {c, e, p, cr, cu} reported by the Oraclekernel at recursive depth i.
You can use this technique easily enough on real trace data. Again consider the data-base calls described in Example 5-5. Figure 5-4 illustrates the progeny-inclusiveelapsed time value for each database call (denoted e) and the progeny-exclusiveelapsed time contribution for each database call (denoted eself).
Table 5-6 shows all the progeny-exclusive statistics associated with each databasecall in Example 5-5. The progeny-exclusive contribution to elapsed time for the PARSE#1 database call, for example, is:
Figure 5-4. The recursive call stack for Example 5-5 expressed graphically
PARSE #1DBA_OBJECTSe=15073
eself =14,701
PARSE #2VIEW$e=107
eself =107
EXEC #2VIEW$e=176
eself =176
FETCH #2VIEW$e=89
eself =89
dep=0
dep=1
This is the Title of the Book, eMatter EditionCopyright © 2004 O’Reilly & Associates, Inc. All rights reserved.
94 | Chapter 5: Interpreting Extended SQL Trace Data
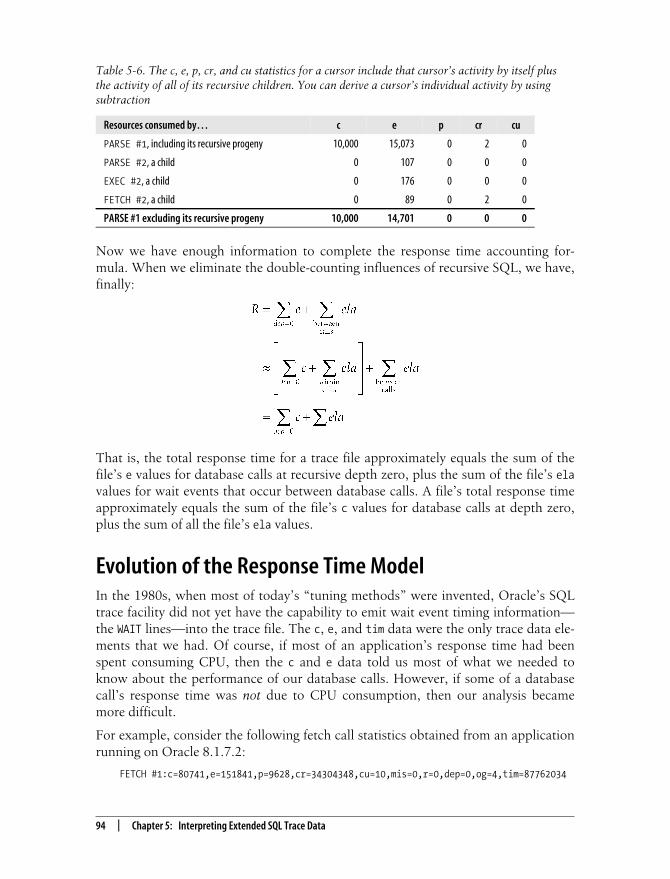
Now we have enough information to complete the response time accounting for-mula. When we eliminate the double-counting influences of recursive SQL, we have,finally:
That is, the total response time for a trace file approximately equals the sum of thefile’s e values for database calls at recursive depth zero, plus the sum of the file’s elavalues for wait events that occur between database calls. A file’s total response timeapproximately equals the sum of the file’s c values for database calls at depth zero,plus the sum of all the file’s ela values.
Evolution of the Response Time ModelIn the 1980s, when most of today’s “tuning methods” were invented, Oracle’s SQLtrace facility did not yet have the capability to emit wait event timing information—the WAIT lines—into the trace file. The c, e, and tim data were the only trace data ele-ments that we had. Of course, if most of an application’s response time had beenspent consuming CPU, then the c and e data told us most of what we needed toknow about the performance of our database calls. However, if some of a databasecall’s response time was not due to CPU consumption, then our analysis becamemore difficult.
For example, consider the following fetch call statistics obtained from an applicationrunning on Oracle 8.1.7.2:
FETCH #1:c=80741,e=151841,p=9628,cr=34304348,cu=10,mis=0,r=0,dep=0,og=4,tim=87762034
Table 5-6. The c, e, p, cr, and cu statistics for a cursor include that cursor’s activity by itself plusthe activity of all of its recursive children. You can derive a cursor’s individual activity by usingsubtraction
Resources consumed by… c e p cr cu
PARSE #1, including its recursive progeny 10,000 15,073 0 2 0
PARSE #2, a child 0 107 0 0 0
EXEC #2, a child 0 176 0 0 0
FETCH #2, a child 0 89 0 2 0
PARSE #1 excluding its recursive progeny 10,000 14,701 0 0 0
This is the Title of the Book, eMatter EditionCopyright © 2004 O’Reilly & Associates, Inc. All rights reserved.
Evolution of the Response Time Model | 95
This fetch call consumed 1,518.41 seconds of elapsed time, only 807.41 of which wasspent on the CPU. Where did the other 711.00 seconds of response time go? Was itlatch contention? Enqueue waits? Long disk queues? Excessive paging? We simplycannot know by looking at this FETCH line. Its statistics contain insufficient informa-tion to determine where the unaccounted-for 711 seconds of elapsed time went. Cer-tainly, a large p value is a clue that some of the unaccounted-for e time might havebeen consumed by OS read calls, but there are roughly 200 different wait events thatOracle could have executed during those 711 seconds. From viewing only the fetchstatistics shown here, we cannot know how the 711 seconds were consumed.
In 1992 with the release of kernel Version 7.0.12, Oracle Corporation published anelegant solution to this problem. The new mechanism that Oracle provided was sim-ply to instrument several events executed by the Oracle kernel that consume elapsedtime but not CPU capacity. The value of the so-called wait data is absolutely extraor-dinary. It helps to fill in the time gap between e and c. Anjo Kolk and Shari Yamagu-chi were the first to document the use of “wait data” in the document that becamethe landmark YAPP Method [Kolk and Yamaguchi (1999)].
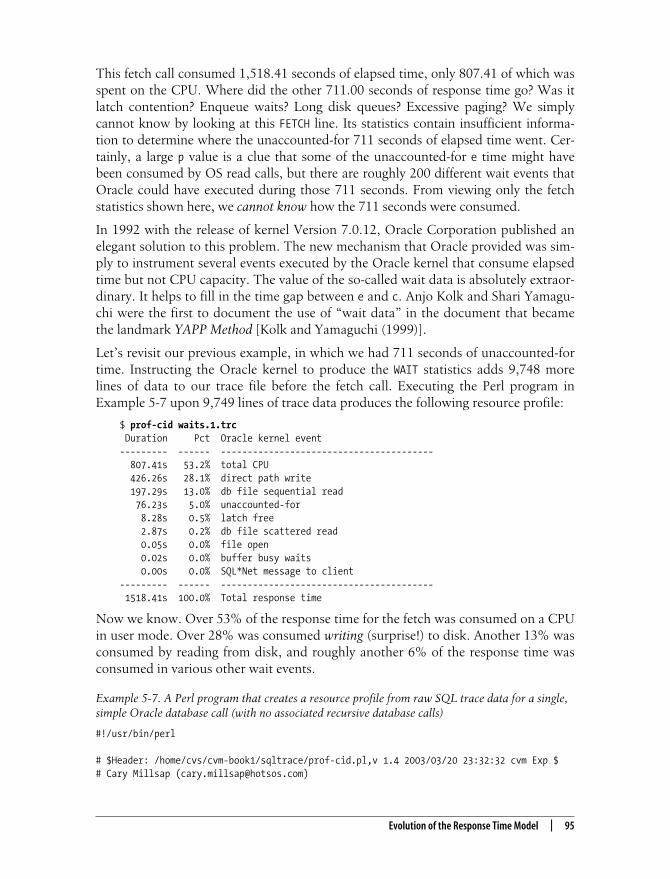
Let’s revisit our previous example, in which we had 711 seconds of unaccounted-fortime. Instructing the Oracle kernel to produce the WAIT statistics adds 9,748 morelines of data to our trace file before the fetch call. Executing the Perl program inExample 5-7 upon 9,749 lines of trace data produces the following resource profile:
$ prof-cid waits.1.trc Duration Pct Oracle kernel event--------- ------ ---------------------------------------- 807.41s 53.2% total CPU 426.26s 28.1% direct path write 197.29s 13.0% db file sequential read 76.23s 5.0% unaccounted-for 8.28s 0.5% latch free 2.87s 0.2% db file scattered read 0.05s 0.0% file open 0.02s 0.0% buffer busy waits 0.00s 0.0% SQL*Net message to client--------- ------ ---------------------------------------- 1518.41s 100.0% Total response time
Now we know. Over 53% of the response time for the fetch was consumed on a CPUin user mode. Over 28% was consumed writing (surprise!) to disk. Another 13% wasconsumed by reading from disk, and roughly another 6% of the response time wasconsumed in various other wait events.
Example 5-7. A Perl program that creates a resource profile from raw SQL trace data for a single,simple Oracle database call (with no associated recursive database calls)
#!/usr/bin/perl
# $Header: /home/cvs/cvm-book1/sqltrace/prof-cid.pl,v 1.4 2003/03/20 23:32:32 cvm Exp $# Cary Millsap ([email protected])

This is the Title of the Book, eMatter EditionCopyright © 2004 O’Reilly & Associates, Inc. All rights reserved.
96 | Chapter 5: Interpreting Extended SQL Trace Data
Note the row labeled “unaccounted-for” in our resource profile. Consider how it wascomputed. The total elapsed time—in fact the response time—for the fetch call issimply the value of e for the fetch. The raw trace data account for this response timein two ways:
# Copyright (c) 1999-2003 by Hotsos Enterprises, Ltd. All rights reserved.
# Create a resource profile for a single database call.# Usage: $0 file.trc
# Requires input of Oracle extended SQL trace data (level 8 or level 12)# that has been pre-filtered to contain only a single database call (that# is, a single PARSE, EXEC, FETCH, UNMAP, or SORT UNMAP with no recursive# children) and the WAIT lines associated with that db call. Example input# file content:## WAIT #2: nam='db file sequential read' ela= 0 p1=2 p2=3240 p3=1# WAIT #2: nam='db file sequential read' ela= 0 p1=2 p2=3239 p3=1# FETCH #2:c=213,e=998,p=2039,cr=100550,cu=5,mis=0,r=0,dep=0,og=4,tim=85264276
use strict;use warnings;my $cid; # cursor idmy %ela; # $ela{event} contains sum of ela statistics for eventmy $sum_ela = 0; # sum of all ela times across eventsmy $r = 0; # response time for database callmy $action = "(?:PARSE|EXEC|FETCH|UNMAP|SORT UNMAP)";while (<>) { if (/^WAIT #(\d+): nam='([^']*)' ela=\s*(\d+)/i) { $ela{$2} += $3; $sum_ela += $3; } elsif (/^$action #(\d+):c=(\d+),e=(\d+)/i) { $ela{"total CPU"} += $2; $r = $3; } if (!defined $cid) { $cid = $1; } else { die "can't mix data across cursor ids $cid and $1" if $1 != $cid; }}$ela{"unaccounted-for"} = $r - ($ela{"total CPU"} + $sum_ela);printf "%9s %6s %-40s\n", "Duration", "Pct", "Oracle kernel event";printf "%8s- %5s- %-40s\n", "-"x8, "-"x5, "-"x40;printf "%8.2fs %5.1f%% %-40s\n", $ela{$_}/100, $ela{$_}/$r*100, $_ for sort { $ela{$b}<=> $ela{$a} } keys %ela;printf "%8s- %5s- %-40s\n", "-"x8, "-"x5, "-"x40;printf "%8.2fs %5.1f%% %-40s\n", $r/100, 100, "Total response time";
Example 5-7. A Perl program that creates a resource profile from raw SQL trace data for a single,simple Oracle database call (with no associated recursive database calls) (continued)

This is the Title of the Book, eMatter EditionCopyright © 2004 O’Reilly & Associates, Inc. All rights reserved.
Evolution of the Response Time Model | 97
• The total CPU time component of the fetch call’s response time is recorded asthe c statistic on the FETCH line itself.
• The system-call time components of the response time are recorded as ela statis-tics on all of the WAIT lines associated with the fetch.
The “unaccounted-for” duration is thus the leftover amount ∆ (delta) expressed inthe following formula:
How Oracle response time accounting has evolved since Oracle Version 6 is an inter-esting story. In Version 6, Oracle’s SQL trace facility printed database call responsetimes (e) and CPU consumptions (c) to the trace file, but that was the only responsetime data that the Oracle kernel published. The first Oracle response time model wassimple. It was “response time equals CPU consumption plus some unidentified otherstuff,” or:
e = c + ∆
This model is effective when ∆ is small, but it is not reliable for diagnosing manytypes of response time problems that occur when ∆ is large. In the Version 6 days,most analysts were taught to assume that large values of ∆ were attributable to timeconsumed by operating system read calls. This assumption is often incorrect (as wasthe case in the resource profile shown previously), but it has helped analysts solvemany application performance problems. One reason for the model’s success in spiteof its over-simplicity is that so many Oracle application problems are caused by fetchcalls that access the database buffer cache excessively. These cases create small ∆ val-ues for which the e = c + ∆ model works just fine.
Oracle kernel developers were among the first to encounter the most serious inade-quacies of the model. The range of potential root causes for large ∆ values was solarge that some important high-end response time problems simply could not besolved without more operational data. Oracle’s extended SQL trace data, introducedto the general market in 1992 with release 7.0.12, is an elegant solution to the prob-lem. Extended SQL trace data include those WAIT lines that tell us how much time theOracle kernel spends “waiting” for the execution of key events. The new, signifi-cantly improved response time model made possible by the new extended SQL tracefeature of Oracle release 7.0.12 is the one that we use today:
As it happens, extended SQL trace data provide significantly more diagnostic powerthan most analysts have ever believed. Of the few analysts who even realize that thegap ∆ exists, some deem the existence of the gap a deficiency of extended SQL tracedata that renders the data unreliable. On the contrary, as you shall see, there is good

This is the Title of the Book, eMatter EditionCopyright © 2004 O’Reilly & Associates, Inc. All rights reserved.
98 | Chapter 5: Interpreting Extended SQL Trace Data
information buried in the value of ∆. There are several contributory causes of non-zero ∆ values, as I explain in Chapter 7. Understanding these causes helps youexploit the full diagnostic power of Oracle’s extended SQL trace data.
Walking the ClockAs you try to extract response time information from raw trace data, you’ll need tobe able to interpret the time sequence of events using a process we call “walking theclock.” Walking the clock requires a few pieces of knowledge about how the Oraclekernel manages time data:
• The value of a line’s tim field is the approximate time at which the action repre-sented by that line completed.
• A database call’s e field value contains the total elapsed time consumed by thataction. This value includes both the CPU time consumed by the action (thevalue of the c field) and the time consumed by events executed during the courseof the action (the sum of the appropriate ela field values).
• Recursive SQL causes double-counting. That is, the value of a database call’s efield when dep=n + 1 is already included in the subsequent e value for whichdep=n.
• Don’t expect perfection from clock walks. Off-by-one errors are common inOracle8i trace files. Errors of seemingly much greater magnitude are common inOracle9i trace files; however, with the microsecond timing resolution ofOracle9i, the errors are smaller than they look.
Oracle Release 8 and PriorHere is an example of some trace data that will demonstrate how to walk the clockthrough trace files emitted by Oracle8i and prior kernels:
EXEC #13:c=0,e=0,p=0,cr=0,cu=0,mis=0,r=0,dep=2,og=3,tim=198360834FETCH #13:c=0,e=0,p=0,cr=3,cu=0,mis=0,r=1,dep=2,og=3,tim=198360834EXEC #12:c=2,e=4,p=0,cr=27,cu=0,mis=0,r=0,dep=1,og=4,tim=198360837FETCH #12:c=2,e=10,p=10,cr=19,cu=4,mis=0,r=1,dep=1,og=4,tim=198360847
Table 5-7 shows the associated clock-walk.
Table 5-7. Walking the tim clock for Oracle8i database calls
Line (k) e Predicted timk = timk–1+ ek Actual timk Error
1 0 198360834
2 0 198360834 + 0 = 198360834 198360834 0
3 4 198360834 + 4 = 198360838 198360837 1
4 10 198360837 + 10 = 198360847 198360847 0

This is the Title of the Book, eMatter EditionCopyright © 2004 O’Reilly & Associates, Inc. All rights reserved.
Walking the Clock | 99
Occasionally, there’ll be an off-by-one error such as the one that distinguishes thepredicted tim value in line 3 from the actual tim value found there. Don’t let a ±1-cserror disturb you. Oracle8i kernels round their time values to the nearest centisec-ond, so what appeared to be the addition of …834 + 4 might actually have been theaddition of …833.7048 + 3.5827, which after rounding would have produced theobserved value of …837.
The following Oracle8i trace file excerpt contains database calls and wait events:
PARSE #494:c=4,e=5,p=11,cr=88,cu=0,mis=1,r=0,dep=2,og=0,tim=3864619462WAIT #494: nam='latch free' ela= 2 p1=-2147434220 p2=95 p3=0WAIT #494: nam='latch free' ela= 2 p1=-2147434220 p2=95 p3=1EXEC #494:c=0,e=4,p=0,cr=0,cu=0,mis=0,r=0,dep=2,og=4,tim=3864619466FETCH #494:c=0,e=0,p=0,cr=2,cu=0,mis=0,r=1,dep=2,og=4,tim=3864619466
Table 5-8 shows the clock-walk of these lines. In the walk for this excerpt, noticethat I’ve assigned k labels only to database call lines (not the WAIT lines). It’s okay totrack the anticipated progress of the tim clock during wait events, but remember thatthe e value in a database call already includes the time recorded in ela values for waitevents motivated by the database call. Therefore, the basis for predicting a timk valuefor a database call is always the timk–1 from the prior database call line.
Now for a tricky excerpt to make sure that you’re paying attention. Can you explainwhy the actual tim value of 198360796 in the EXEC #8 line is so different from thevalue you might have expected, 198360795 + 19 = 198360814?
EXEC #9:c=0,e=0,p=0,cr=0,cu=0,mis=0,r=0,dep=2,og=3,tim=198360795FETCH #9:c=0,e=0,p=0,cr=3,cu=0,mis=0,r=1,dep=2,og=3,tim=198360795EXEC #9:c=0,e=0,p=0,cr=0,cu=0,mis=0,r=0,dep=2,og=3,tim=198360795FETCH #9:c=0,e=0,p=0,cr=3,cu=0,mis=0,r=1,dep=2,og=3,tim=198360795EXEC #8:c=4,e=19,p=16,cr=162,cu=0,mis=0,r=0,dep=1,og=4,tim=198360796FETCH #8:c=0,e=5,p=4,cr=4,cu=0,mis=0,r=1,dep=1,og=4,tim=198360801FETCH #8:c=0,e=0,p=0,cr=0,cu=0,mis=0,r=0,dep=1,og=0,tim=198360801FETCH #7:c=0,e=0,p=0,cr=2,cu=0,mis=0,r=1,dep=1,og=4,tim=198360801EXEC #8:c=0,e=0,p=0,cr=0,cu=0,mis=0,r=0,dep=1,og=4,tim=198360801
The answer is that the EXEC #8 database call is the dep=1 recursive parent of each ofthe dep=2 actions shown here on cursor #9. Therefore, the e=19 field contains all ofthe cursor #9 e values shown here plus some other time-consuming activities that
Table 5-8. Walking the tim clock for Oracle8i database calls and wait events
Line (k) e Predicted timk = timk–1 + ek Actual timk Error
1 5 3864619462
2 3864619462 + 2 = 3864619464
2 3864619464 + 2 = 3864619466
2 4 3864619462 + 4 = 3864619466 3864619466 0
3 0 3864619466 + 0 = 3864619466 3864619466 0
This is the Title of the Book, eMatter EditionCopyright © 2004 O’Reilly & Associates, Inc. All rights reserved.
100 | Chapter 5: Interpreting Extended SQL Trace Data
are not shown here. The EXEC #8 action probably began very near tim 198360796 –19 = 198369777. Between tim values …777 and …796, lots of dep=2 actions tookplace, each consuming time while the tim clock advanced. But remember, thesedep=2 actions all took place during the single EXEC #8 action.
Oracle Release 9The microsecond output resolution of time statistics in Oracle9i is a helpful enhance-ment. The first thing you’ll notice about SQL trace data when you upgrade toOracle9i is that the microsecond resolution feature provides real data for cases inwhich Oracle8i would have emitted lots of zero values.
However, do not hesitate to use extended SQL trace data with Version8 or even Version 7 systems. The optimization method described in thisbook does work reliably for diagnostic data expressed in centiseconds.In the vast majority of real-life performance improvement projects, themicrosecond output resolution of Oracle9i is merely a luxury.
The new resolution has allowed us to see a little more clearly into the Oracle ker-nel’s behavior. This section describes a few cases in which we’ve been able to learnmore as a result of the Oracle kernel’s improved output resolution.
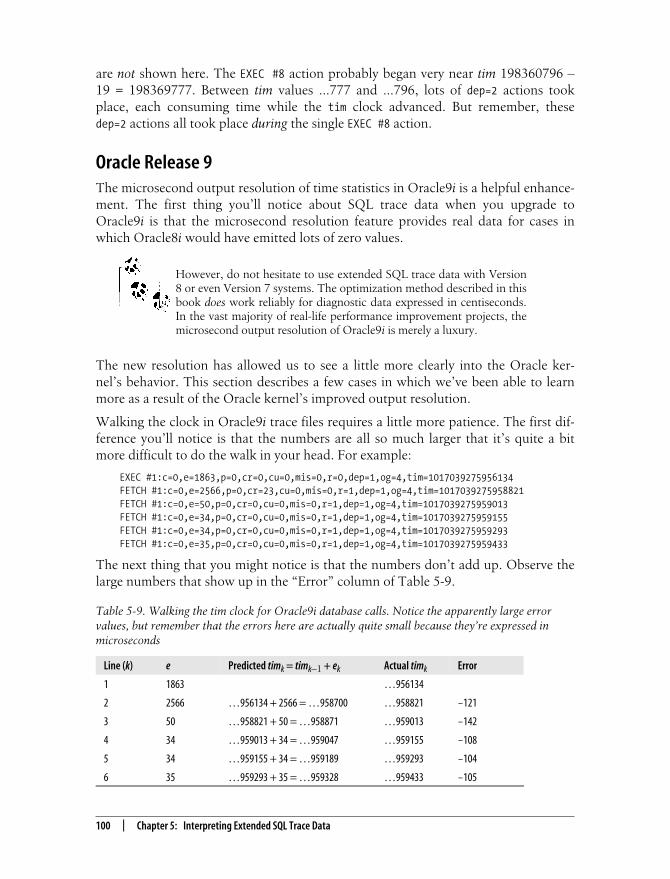
Walking the clock in Oracle9i trace files requires a little more patience. The first dif-ference you’ll notice is that the numbers are all so much larger that it’s quite a bitmore difficult to do the walk in your head. For example:
EXEC #1:c=0,e=1863,p=0,cr=0,cu=0,mis=0,r=0,dep=1,og=4,tim=1017039275956134FETCH #1:c=0,e=2566,p=0,cr=23,cu=0,mis=0,r=1,dep=1,og=4,tim=1017039275958821FETCH #1:c=0,e=50,p=0,cr=0,cu=0,mis=0,r=1,dep=1,og=4,tim=1017039275959013FETCH #1:c=0,e=34,p=0,cr=0,cu=0,mis=0,r=1,dep=1,og=4,tim=1017039275959155FETCH #1:c=0,e=34,p=0,cr=0,cu=0,mis=0,r=1,dep=1,og=4,tim=1017039275959293FETCH #1:c=0,e=35,p=0,cr=0,cu=0,mis=0,r=1,dep=1,og=4,tim=1017039275959433
The next thing that you might notice is that the numbers don’t add up. Observe thelarge numbers that show up in the “Error” column of Table 5-9.
Table 5-9. Walking the tim clock for Oracle9i database calls. Notice the apparently large errorvalues, but remember that the errors here are actually quite small because they’re expressed inmicroseconds
Line (k) e Predicted timk = timk–1 + ek Actual timk Error
1 1863 …956134
2 2566 …956134 + 2566 = …958700 …958821 –121
3 50 …958821 + 50 = …958871 …959013 –142
4 34 …959013 + 34 = …959047 …959155 –108
5 34 …959155 + 34 = …959189 …959293 –104
6 35 …959293 + 35 = …959328 …959433 –105
This is the Title of the Book, eMatter EditionCopyright © 2004 O’Reilly & Associates, Inc. All rights reserved.
Walking the Clock | 101
The sensation produced by these large error values is quite horrific until you realizethat the errors are expressed in microseconds. Small time gap errors like this havealways been present in Oracle diagnostic data. They were usually invisible whenmeasured with centisecond resolution. When we view microsecond timing data, theimpact of another type of response time measurement error becomes apparent: thecalls to gettimeofday and getrusage consume elapsed time that the calls themselvesdo not measure (see the Chapter 7 discussion of the measurement intrusion effect).
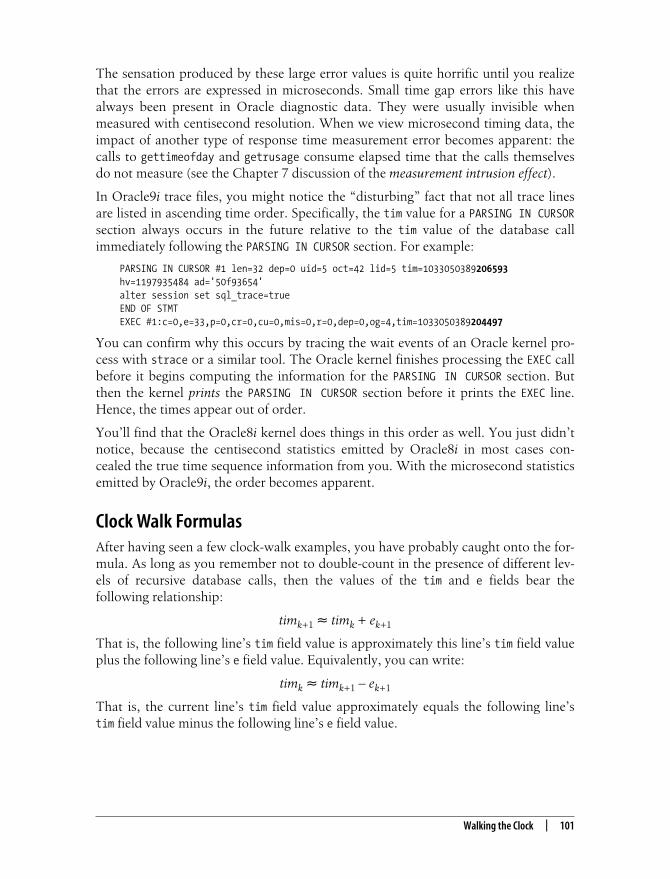
In Oracle9i trace files, you might notice the “disturbing” fact that not all trace linesare listed in ascending time order. Specifically, the tim value for a PARSING IN CURSORsection always occurs in the future relative to the tim value of the database callimmediately following the PARSING IN CURSOR section. For example:
PARSING IN CURSOR #1 len=32 dep=0 uid=5 oct=42 lid=5 tim=1033050389206593hv=1197935484 ad='50f93654'alter session set sql_trace=trueEND OF STMTEXEC #1:c=0,e=33,p=0,cr=0,cu=0,mis=0,r=0,dep=0,og=4,tim=1033050389204497
You can confirm why this occurs by tracing the wait events of an Oracle kernel pro-cess with strace or a similar tool. The Oracle kernel finishes processing the EXEC callbefore it begins computing the information for the PARSING IN CURSOR section. Butthen the kernel prints the PARSING IN CURSOR section before it prints the EXEC line.Hence, the times appear out of order.
You’ll find that the Oracle8i kernel does things in this order as well. You just didn’tnotice, because the centisecond statistics emitted by Oracle8i in most cases con-cealed the true time sequence information from you. With the microsecond statisticsemitted by Oracle9i, the order becomes apparent.
Clock Walk FormulasAfter having seen a few clock-walk examples, you have probably caught onto the for-mula. As long as you remember not to double-count in the presence of different lev-els of recursive database calls, then the values of the tim and e fields bear thefollowing relationship:
timk+1 ≈ timk + ek+1
That is, the following line’s tim field value is approximately this line’s tim field valueplus the following line’s e field value. Equivalently, you can write:
timk ≈ timk+1 – ek+1
That is, the current line’s tim field value approximately equals the following line’stim field value minus the following line’s e field value.

This is the Title of the Book, eMatter EditionCopyright © 2004 O’Reilly & Associates, Inc. All rights reserved.
102 | Chapter 5: Interpreting Extended SQL Trace Data
Of course, a WAIT line has no tim field, so if you want to estimate what a WAIT line’stim value would be, you have to estimate it by walking the clock forward from themost recently available tim value, using the relationship:
timk+1 ≈ timk + elak+1
These formulas will come in handy when you learn how to correct for data collec-tion error in Chapter 7.
Forward AttributionWhen you identify a time-consuming wait event in an Oracle extended SQL tracefile, your next task will be to determine which application action you might modifyto reduce the time consumption. Doing this with extended SQL trace data is straight-forward. You should attribute each WAIT #n duration to the first database call for cur-sor #n that follows the WAIT line in the trace file. I call this method forwardattribution. Forward attribution helps you accurately identify which application SQLis responsible for motivating the wait time. Perhaps remarkably, forward attributionworks both for events that are executed within database calls and for events that areexecuted between database calls.
Forward Attribution for Within-Call EventsFor events executed within database calls, the reason for forward attribution is easyto understand. Because lines are written to the trace file as their correspondingactions complete, the wait events executed by a given database call appear in thetrace stream before the call’s trace file line. The following excerpt (snipped fromExample 5-3) shows how the Oracle kernel emits within-call event lines:
= = = = = = = = = = = = = = = = = = = = =PARSING IN CURSOR #4 len=132 dep=1 uid=0 oct=3 lid=0 tim=1033064137929238hv=3111103299 ad='517ba4d8'select /*+ index(idl_ub1$ i_idl_ub11) +*/ piece#,length,piece from idl_ub1$ whereobj#=:1 and part=:2 and version=:3 order by piece#END OF STMTPARSE #4:c=0,e=306,p=0,cr=0,cu=0,mis=0,r=0,dep=1,og=4,tim=1033064137929139EXEC #4:c=0,e=146,p=0,cr=0,cu=0,mis=0,r=0,dep=1,og=4,tim=1033064137931262
� WAIT #4: nam='db file sequential read' ela= 13060 p1=1 p2=53903 p3=1
� WAIT #4: nam='db file sequential read' ela= 6978 p1=1 p2=4726 p3=1
� FETCH #4:c=0,e=21340,p=2,cr=3,cu=0,mis=0,r=0,dep=1,og=4,tim=1033064137953092
In this example, the db file sequential read events on lines � and � were exe-cuted within the context of the FETCH depicted on line �.
This is the Title of the Book, eMatter EditionCopyright © 2004 O’Reilly & Associates, Inc. All rights reserved.
Forward Attribution | 103
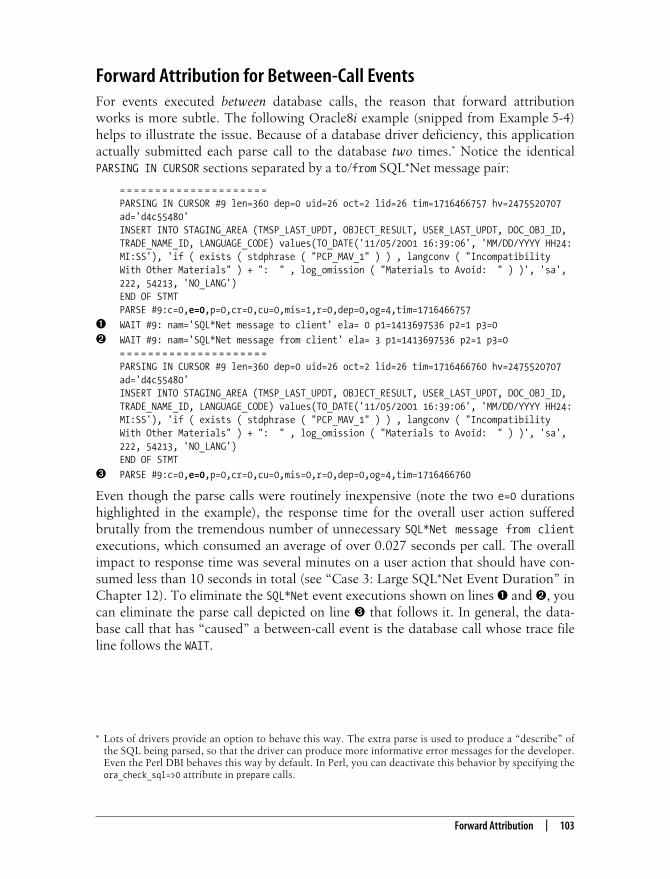
Forward Attribution for Between-Call EventsFor events executed between database calls, the reason that forward attributionworks is more subtle. The following Oracle8i example (snipped from Example 5-4)helps to illustrate the issue. Because of a database driver deficiency, this applicationactually submitted each parse call to the database two times.* Notice the identicalPARSING IN CURSOR sections separated by a to/from SQL*Net message pair:
= = = = = = = = = = = = = = = = = = = = =PARSING IN CURSOR #9 len=360 dep=0 uid=26 oct=2 lid=26 tim=1716466757 hv=2475520707ad='d4c55480'INSERT INTO STAGING_AREA (TMSP_LAST_UPDT, OBJECT_RESULT, USER_LAST_UPDT, DOC_OBJ_ID,TRADE_NAME_ID, LANGUAGE_CODE) values(TO_DATE('11/05/2001 16:39:06', 'MM/DD/YYYY HH24:MI:SS'), 'if ( exists ( stdphrase ( "PCP_MAV_1" ) ) , langconv ( "IncompatibilityWith Other Materials" ) + ": " , log_omission ( "Materials to Avoid: " ) )', 'sa',222, 54213, 'NO_LANG')END OF STMTPARSE #9:c=0,e=0,p=0,cr=0,cu=0,mis=1,r=0,dep=0,og=4,tim=1716466757
� WAIT #9: nam='SQL*Net message to client' ela= 0 p1=1413697536 p2=1 p3=0
� WAIT #9: nam='SQL*Net message from client' ela= 3 p1=1413697536 p2=1 p3=0= = = = = = = = = = = = = = = = = = = = =PARSING IN CURSOR #9 len=360 dep=0 uid=26 oct=2 lid=26 tim=1716466760 hv=2475520707ad='d4c55480'INSERT INTO STAGING_AREA (TMSP_LAST_UPDT, OBJECT_RESULT, USER_LAST_UPDT, DOC_OBJ_ID,TRADE_NAME_ID, LANGUAGE_CODE) values(TO_DATE('11/05/2001 16:39:06', 'MM/DD/YYYY HH24:MI:SS'), 'if ( exists ( stdphrase ( "PCP_MAV_1" ) ) , langconv ( "IncompatibilityWith Other Materials" ) + ": " , log_omission ( "Materials to Avoid: " ) )', 'sa',222, 54213, 'NO_LANG')END OF STMT
� PARSE #9:c=0,e=0,p=0,cr=0,cu=0,mis=0,r=0,dep=0,og=4,tim=1716466760
Even though the parse calls were routinely inexpensive (note the two e=0 durationshighlighted in the example), the response time for the overall user action sufferedbrutally from the tremendous number of unnecessary SQL*Net message from clientexecutions, which consumed an average of over 0.027 seconds per call. The overallimpact to response time was several minutes on a user action that should have con-sumed less than 10 seconds in total (see “Case 3: Large SQL*Net Event Duration” inChapter 12). To eliminate the SQL*Net event executions shown on lines � and �, youcan eliminate the parse call depicted on line � that follows it. In general, the data-base call that has “caused” a between-call event is the database call whose trace fileline follows the WAIT.
* Lots of drivers provide an option to behave this way. The extra parse is used to produce a “describe” ofthe SQL being parsed, so that the driver can produce more informative error messages for the developer.Even the Perl DBI behaves this way by default. In Perl, you can deactivate this behavior by specifying theora_check_sql=>0 attribute in prepare calls.
This is the Title of the Book, eMatter EditionCopyright © 2004 O’Reilly & Associates, Inc. All rights reserved.
104 | Chapter 5: Interpreting Extended SQL Trace Data
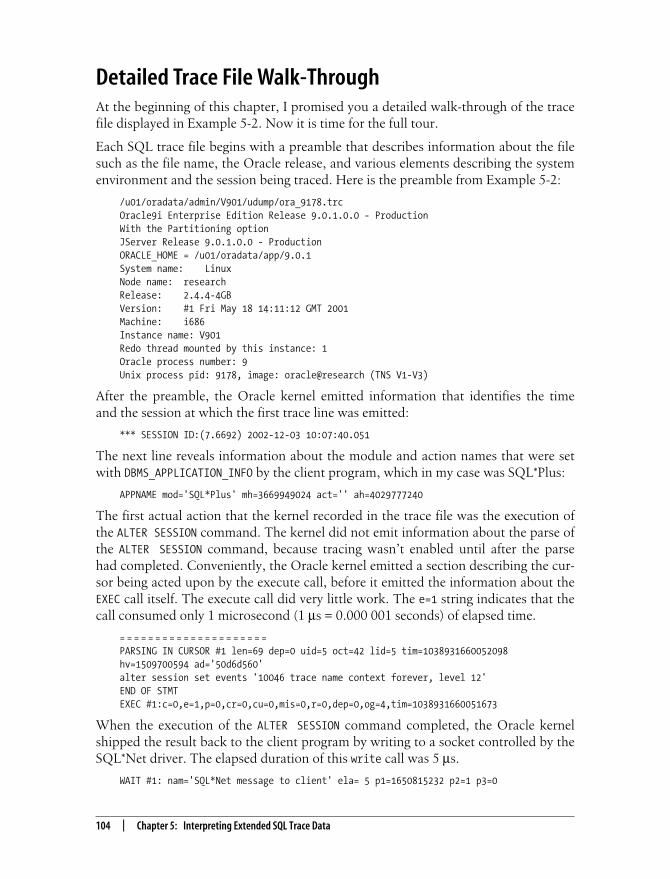
Detailed Trace File Walk-ThroughAt the beginning of this chapter, I promised you a detailed walk-through of the tracefile displayed in Example 5-2. Now it is time for the full tour.
Each SQL trace file begins with a preamble that describes information about the filesuch as the file name, the Oracle release, and various elements describing the systemenvironment and the session being traced. Here is the preamble from Example 5-2:
/u01/oradata/admin/V901/udump/ora_9178.trcOracle9i Enterprise Edition Release 9.0.1.0.0 - ProductionWith the Partitioning optionJServer Release 9.0.1.0.0 - ProductionORACLE_HOME = /u01/oradata/app/9.0.1System name: LinuxNode name: researchRelease: 2.4.4-4GBVersion: #1 Fri May 18 14:11:12 GMT 2001Machine: i686Instance name: V901Redo thread mounted by this instance: 1Oracle process number: 9Unix process pid: 9178, image: oracle@research (TNS V1-V3)
After the preamble, the Oracle kernel emitted information that identifies the timeand the session at which the first trace line was emitted:
*** SESSION ID:(7.6692) 2002-12-03 10:07:40.051
The next line reveals information about the module and action names that were setwith DBMS_APPLICATION_INFO by the client program, which in my case was SQL*Plus:
APPNAME mod='SQL*Plus' mh=3669949024 act='' ah=4029777240
The first actual action that the kernel recorded in the trace file was the execution ofthe ALTER SESSION command. The kernel did not emit information about the parse ofthe ALTER SESSION command, because tracing wasn’t enabled until after the parsehad completed. Conveniently, the Oracle kernel emitted a section describing the cur-sor being acted upon by the execute call, before it emitted the information about theEXEC call itself. The execute call did very little work. The e=1 string indicates that thecall consumed only 1 microsecond (1 µs = 0.000 001 seconds) of elapsed time.
= = = = = = = = = = = = = = = = = = = = =PARSING IN CURSOR #1 len=69 dep=0 uid=5 oct=42 lid=5 tim=1038931660052098hv=1509700594 ad='50d6d560'alter session set events '10046 trace name context forever, level 12'END OF STMTEXEC #1:c=0,e=1,p=0,cr=0,cu=0,mis=0,r=0,dep=0,og=4,tim=1038931660051673
When the execution of the ALTER SESSION command completed, the Oracle kernelshipped the result back to the client program by writing to a socket controlled by theSQL*Net driver. The elapsed duration of this write call was 5 µs.
WAIT #1: nam='SQL*Net message to client' ela= 5 p1=1650815232 p2=1 p3=0

This is the Title of the Book, eMatter EditionCopyright © 2004 O’Reilly & Associates, Inc. All rights reserved.
Detailed Trace File Walk-Through | 105
Upon completing the write call, the Oracle kernel issued a read upon the samesocket (note that the p1 values for both the write and the read are the same), and thekernel awaited the next request from its client program. Approximately 1,262 µsafter issuing the read call, the read call returned with another request for the kernel.
WAIT #1: nam='SQL*Net message from client' ela= 1262 p1=1650815232 p2=1 p3=0
The request received by the read of the socket was in fact the instruction to parse my“Hello, world” query. Note that before printing the PARSE statistics, the kernel help-fully emitted a section beginning with a sequence of “=” characters and ending withthe string END OF STMT that describes the cursor being parsed. The parse call itselfconsumed 214 µs of elapsed time.
= = = = = = = = = = = = = = = = = = = = =PARSING IN CURSOR #1 len=51 dep=0 uid=5 oct=3 lid=5 tim=1038931660054075hv=1716247018 ad='50c551f8'select 'Hello, world; today is '||sysdate from dualEND OF STMTPARSE #1:c=0,e=214,p=0,cr=0,cu=0,mis=0,r=0,dep=0,og=4,tim=1038931660054053
The next database call is EXEC, which denotes the execution of the cursor that thekernel had parsed. Immediately preceding the EXEC line is an empty BINDS section,which indicates that although the SQL*Plus program requested a bind operation,there was nothing in the statement for the kernel to bind. Total elapsed time for theexecution: 124 µs.
BINDS #1:EXEC #1:c=0,e=124,p=0,cr=0,cu=0,mis=0,r=0,dep=0,og=4,tim=1038931660054311
At the conclusion of the EXEC call, the kernel shipped a result back to the client pro-gram (that is, the SQL*Plus program). The write to the socket consumed 5 µs ofelapsed time.
WAIT #1: nam='SQL*Net message to client' ela= 5 p1=1650815232 p2=1 p3=0
Immediately following the write to the socket, the kernel’s next action was a fetchoperation. The FETCH statistics show an elapsed duration of 177 µs to return one row(r=1), which required three reads of the database buffer cache, one in consistentmode (cr=1) and two in current mode (cu=2).
FETCH #1:c=0,e=177,p=0,cr=1,cu=2,mis=0,r=1,dep=0,og=4,tim=1038931660054596
The next database call recorded in the trace file is another fetch, which took placeafter a 499-µs read from the SQL*Net socket. The fetch returned no rows and con-sumed only 2 µs of elapsed time.
WAIT #1: nam='SQL*Net message from client' ela= 499 p1=1650815232 p2=1 p3=0FETCH #1:c=0,e=2,p=0,cr=0,cu=0,mis=0,r=0,dep=0,og=0,tim=1038931660055374
Next, the kernel shipped a result back to the client in a socket write operation thatconsumed 4 µs of elapsed time.
WAIT #1: nam='SQL*Net message to client' ela= 4 p1=1650815232 p2=1 p3=0
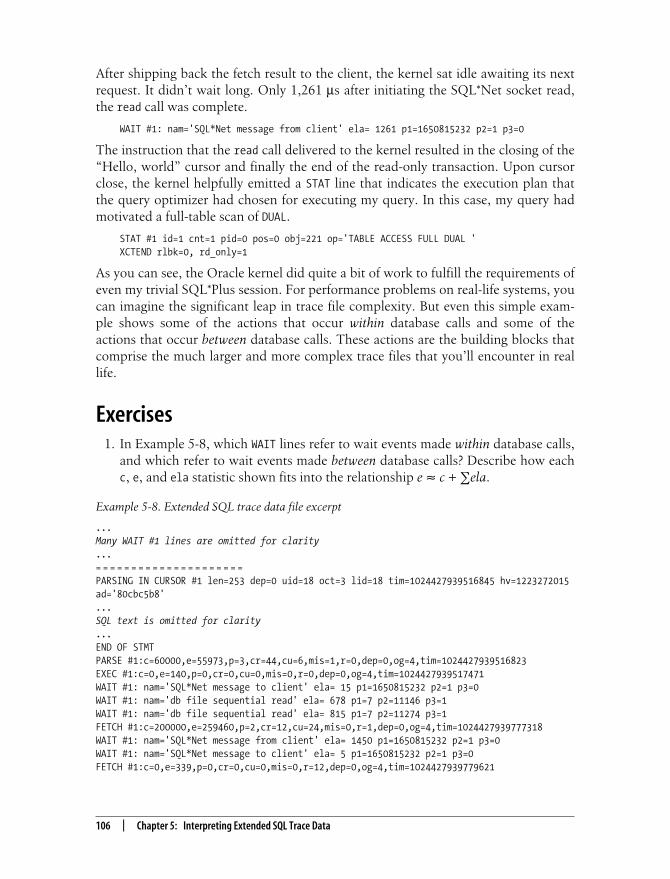
This is the Title of the Book, eMatter EditionCopyright © 2004 O’Reilly & Associates, Inc. All rights reserved.
106 | Chapter 5: Interpreting Extended SQL Trace Data
After shipping back the fetch result to the client, the kernel sat idle awaiting its nextrequest. It didn’t wait long. Only 1,261 µs after initiating the SQL*Net socket read,the read call was complete.
WAIT #1: nam='SQL*Net message from client' ela= 1261 p1=1650815232 p2=1 p3=0
The instruction that the read call delivered to the kernel resulted in the closing of the“Hello, world” cursor and finally the end of the read-only transaction. Upon cursorclose, the kernel helpfully emitted a STAT line that indicates the execution plan thatthe query optimizer had chosen for executing my query. In this case, my query hadmotivated a full-table scan of DUAL.
STAT #1 id=1 cnt=1 pid=0 pos=0 obj=221 op='TABLE ACCESS FULL DUAL 'XCTEND rlbk=0, rd_only=1
As you can see, the Oracle kernel did quite a bit of work to fulfill the requirements ofeven my trivial SQL*Plus session. For performance problems on real-life systems, youcan imagine the significant leap in trace file complexity. But even this simple exam-ple shows some of the actions that occur within database calls and some of theactions that occur between database calls. These actions are the building blocks thatcomprise the much larger and more complex trace files that you’ll encounter in reallife.
Exercises1. In Example 5-8, which WAIT lines refer to wait events made within database calls,
and which refer to wait events made between database calls? Describe how eachc, e, and ela statistic shown fits into the relationship e ≈ c + ∑ela.
Example 5-8. Extended SQL trace data file excerpt
...Many WAIT #1 lines are omitted for clarity...= = = = = = = = = = = = = = = = = = = = =PARSING IN CURSOR #1 len=253 dep=0 uid=18 oct=3 lid=18 tim=1024427939516845 hv=1223272015ad='80cbc5b8'...SQL text is omitted for clarity...END OF STMTPARSE #1:c=60000,e=55973,p=3,cr=44,cu=6,mis=1,r=0,dep=0,og=4,tim=1024427939516823EXEC #1:c=0,e=140,p=0,cr=0,cu=0,mis=0,r=0,dep=0,og=4,tim=1024427939517471WAIT #1: nam='SQL*Net message to client' ela= 15 p1=1650815232 p2=1 p3=0WAIT #1: nam='db file sequential read' ela= 678 p1=7 p2=11146 p3=1WAIT #1: nam='db file sequential read' ela= 815 p1=7 p2=11274 p3=1FETCH #1:c=200000,e=259460,p=2,cr=12,cu=24,mis=0,r=1,dep=0,og=4,tim=1024427939777318WAIT #1: nam='SQL*Net message from client' ela= 1450 p1=1650815232 p2=1 p3=0WAIT #1: nam='SQL*Net message to client' ela= 5 p1=1650815232 p2=1 p3=0FETCH #1:c=0,e=339,p=0,cr=0,cu=0,mis=0,r=12,dep=0,og=4,tim=1024427939779621

This is the Title of the Book, eMatter EditionCopyright © 2004 O’Reilly & Associates, Inc. All rights reserved.
Exercises | 107
2. For Example 5-9, construct a graph like the one shown in Figure 5-3 that illus-trates the recursive relationships among database calls. Compute the contribu-tion to e of each database call. What type of application would perform theactions shown here?
WAIT #1: nam='SQL*Net message from client' ela= 7828 p1=1650815232 p2=1 p3=0...STAT lines are omitted for clarity
...= = = = = = = = = = = = = = = = = = = = =PARSING IN CURSOR #1 len=55 dep=0 uid=18 oct=42 lid=18 tim=1024427939789693 hv=3381932903ad='80c9e33c'alter session set events '10046 trace name context off'END OF STMTPARSE #1:c=0,e=810,p=0,cr=0,cu=0,mis=1,r=0,dep=0,og=4,tim=1024427939789677
Example 5-9. SQL trace file exhibiting recursive SQL behavior (level-1 output is shown to reduceclutter for the exercise)
/u01/oradata/admin/V901/udump/ora_23317_recursive.trc
*** TRACE DUMP CONTINUED FROM FILE ***
Oracle9i Enterprise Edition Release 9.0.1.0.0 - ProductionWith the Partitioning optionJServer Release 9.0.1.0.0 - ProductionORACLE_HOME = /u01/oradata/app/9.0.1System name: LinuxNode name: researchRelease: 2.4.4-4GBVersion: #1 Fri May 18 14:11:12 GMT 2001Machine: i686Instance name: V901Redo thread mounted by this instance: 1Oracle process number: 9Unix process pid: 23317, image: oracle@research (TNS V1-V3)
*** 2003-05-18 11:14:59.469*** SESSION ID:(8.1578) 2003-05-18 11:14:59.469APPNAME mod='SQL*Plus' mh=3669949024 act='' ah=4029777240= = = = = = = = = = = = = = = = = = = = =PARSING IN CURSOR #1 len=68 dep=0 uid=5 oct=42 lid=5 tim=1053274499469370 hv=1635464953ad='51f65c00'alter session set events '10046 trace name context forever, level 1'END OF STMTEXEC #1:c=0,e=1,p=0,cr=0,cu=0,mis=0,r=0,dep=0,og=3,tim=1053274499469133= = = = = = = = = = = = = = = = = = = = =PARSING IN CURSOR #2 len=175 dep=1 uid=0 oct=3 lid=0 tim=1053274499471797 hv=1491008679ad='52107fa8'
Example 5-8. Extended SQL trace data file excerpt (continued)
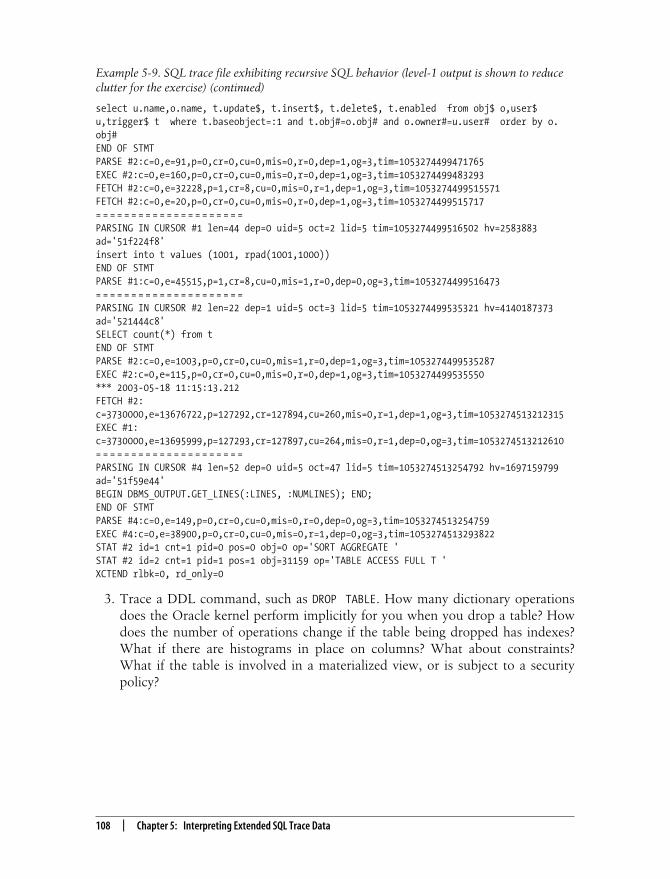
This is the Title of the Book, eMatter EditionCopyright © 2004 O’Reilly & Associates, Inc. All rights reserved.
108 | Chapter 5: Interpreting Extended SQL Trace Data
3. Trace a DDL command, such as DROP TABLE. How many dictionary operationsdoes the Oracle kernel perform implicitly for you when you drop a table? Howdoes the number of operations change if the table being dropped has indexes?What if there are histograms in place on columns? What about constraints?What if the table is involved in a materialized view, or is subject to a securitypolicy?
select u.name,o.name, t.update$, t.insert$, t.delete$, t.enabled from obj$ o,user$u,trigger$ t where t.baseobject=:1 and t.obj#=o.obj# and o.owner#=u.user# order by o.obj#END OF STMTPARSE #2:c=0,e=91,p=0,cr=0,cu=0,mis=0,r=0,dep=1,og=3,tim=1053274499471765EXEC #2:c=0,e=160,p=0,cr=0,cu=0,mis=0,r=0,dep=1,og=3,tim=1053274499483293FETCH #2:c=0,e=32228,p=1,cr=8,cu=0,mis=0,r=1,dep=1,og=3,tim=1053274499515571FETCH #2:c=0,e=20,p=0,cr=0,cu=0,mis=0,r=0,dep=1,og=3,tim=1053274499515717= = = = = = = = = = = = = = = = = = = = =PARSING IN CURSOR #1 len=44 dep=0 uid=5 oct=2 lid=5 tim=1053274499516502 hv=2583883ad='51f224f8'insert into t values (1001, rpad(1001,1000))END OF STMTPARSE #1:c=0,e=45515,p=1,cr=8,cu=0,mis=1,r=0,dep=0,og=3,tim=1053274499516473= = = = = = = = = = = = = = = = = = = = =PARSING IN CURSOR #2 len=22 dep=1 uid=5 oct=3 lid=5 tim=1053274499535321 hv=4140187373ad='521444c8'SELECT count(*) from tEND OF STMTPARSE #2:c=0,e=1003,p=0,cr=0,cu=0,mis=1,r=0,dep=1,og=3,tim=1053274499535287EXEC #2:c=0,e=115,p=0,cr=0,cu=0,mis=0,r=0,dep=1,og=3,tim=1053274499535550*** 2003-05-18 11:15:13.212FETCH #2:c=3730000,e=13676722,p=127292,cr=127894,cu=260,mis=0,r=1,dep=1,og=3,tim=1053274513212315EXEC #1:c=3730000,e=13695999,p=127293,cr=127897,cu=264,mis=0,r=1,dep=0,og=3,tim=1053274513212610= = = = = = = = = = = = = = = = = = = = =PARSING IN CURSOR #4 len=52 dep=0 uid=5 oct=47 lid=5 tim=1053274513254792 hv=1697159799ad='51f59e44'BEGIN DBMS_OUTPUT.GET_LINES(:LINES, :NUMLINES); END;END OF STMTPARSE #4:c=0,e=149,p=0,cr=0,cu=0,mis=0,r=0,dep=0,og=3,tim=1053274513254759EXEC #4:c=0,e=38900,p=0,cr=0,cu=0,mis=0,r=1,dep=0,og=3,tim=1053274513293822STAT #2 id=1 cnt=1 pid=0 pos=0 obj=0 op='SORT AGGREGATE 'STAT #2 id=2 cnt=1 pid=1 pos=1 obj=31159 op='TABLE ACCESS FULL T 'XCTEND rlbk=0, rd_only=0
Example 5-9. SQL trace file exhibiting recursive SQL behavior (level-1 output is shown to reduceclutter for the exercise) (continued)


