+ All Categories
Home > Documents > Optimizing Sample Preservation for...

Optimizing Sample Preservation for...

Date post: 20-Apr-2018
Category:
Upload: phungcong
View: 221 times
Download: 1 times
Share this document with a friend
26
Optimizing Sample Preservation for Hexavalent Preservation for Hexavalent Chromium Analyses in Waters Jane Timm, James Lovick Jr, Raymond Siery, and Yongtao Li and Yongtao Li Underwriters Laboratories 2011 NEMC, Bellevue, Washington © 2011 Underwriters Laboratories Inc.
Transcript

Optimizing Sample Preservation for HexavalentPreservation for Hexavalent Chromium Analyses in Waters

Jane Timm, James Lovick Jr, Raymond Siery, and Yongtao Liand Yongtao Li

Underwriters LaboratoriesU de te s abo ato es

2011 NEMC, Bellevue, Washington

© 2011 Underwriters Laboratories Inc.

Presentation Outline

IntroductionBackground informationBackground information

Regulatory update

Common analytical methodsCommon analytical methods

EPA Method 218.6 InstrumentationOptimization & PerformanceSample results

ConclusionsConclusions

2

Background Information

• Chromium (Cr) is found naturally in rocks, plants, soil and volcanic dust, humans, and animals. Trivalent chromium Cr(III) is an essential nutrient for the bodyCr(III) is an essential nutrient for the body.

• Water sources can be affected by hexavalent chromium Cr(VI) naturally or through contamination from industrialCr(VI) naturally, or through contamination from industrial centers, landfills, and improper discharge of industrial processing streams.

• Cr(VI) can be removed using a handful of proven treatment techniques, e.g. anion exchange, membrane filtration (nanofiltration and reverse osmosis) reduction-filtration (nanofiltration and reverse osmosis), reduction-coagulation and precipitation, adsorption, etc.

3

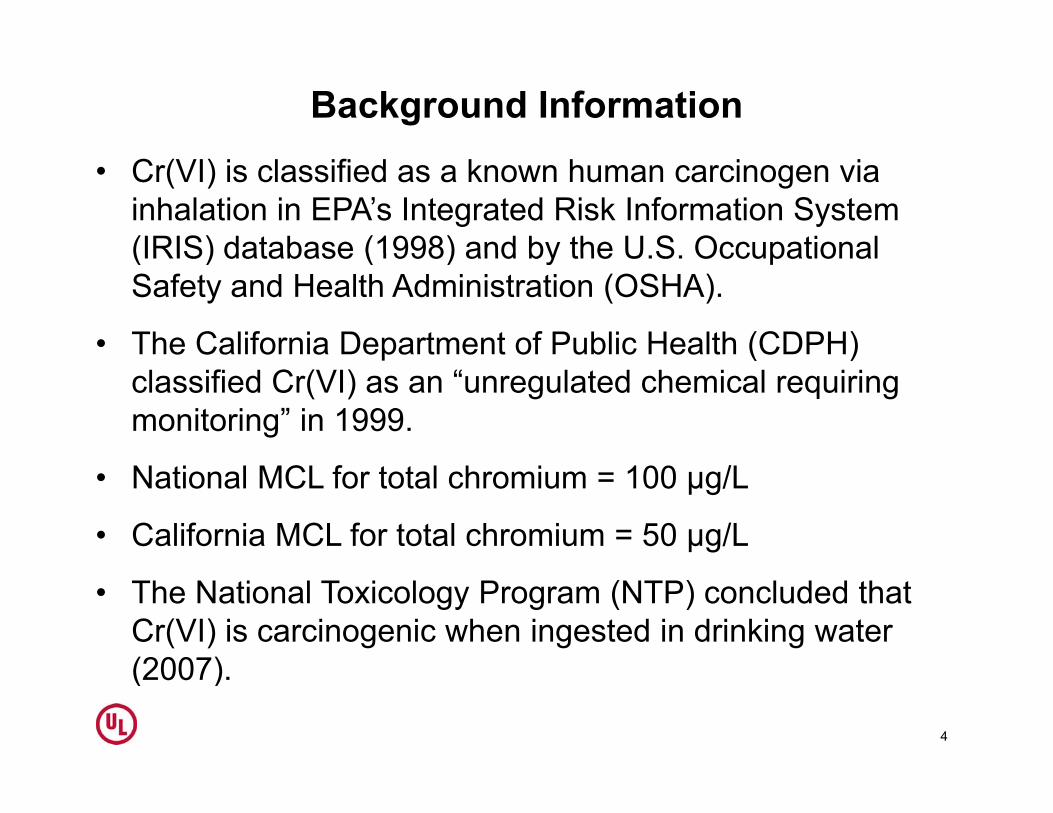
Background Information• Cr(VI) is classified as a known human carcinogen via

inhalation in EPA’s Integrated Risk Information System (IRIS) database (1998) and by the U S Occupational(IRIS) database (1998) and by the U.S. Occupational Safety and Health Administration (OSHA).

• The California Department of Public Health (CDPH) p ( )classified Cr(VI) as an “unregulated chemical requiring monitoring” in 1999.

• National MCL for total chromium = 100 µg/L

• California MCL for total chromium = 50 µg/L

• The National Toxicology Program (NTP) concluded that Cr(VI) is carcinogenic when ingested in drinking water (2007)(2007).

4

Regulatory UpdateC f Off f• The California Office of Environmental Health Hazard

Assessment (OEHHA) established a Public Health Goal of 0.02 µg/L Cr(VI) in drinking water (2010).µg ( ) g ( )

• Environmental Working Group reported that 31 out of 35 cities evidenced detectible levels of Cr(VI), with samples from 25 cities exhibiting levels of Cr(VI) >0.06 µg/L.

• USEPA released a draft risk assessment of Cr(VI) and t t d th t it i lik l t h i t dstated that it is likely to cause cancer when ingested over

a lifetime (IRIS, 9/2010).

• USEPA will release the final version of its “Toxicological• USEPA will release the final version of its Toxicological Review of Hexavalent Chromium” in the Summer of 2011, and to determine if additional standards and testing requirements are appropriate.

5

Regulatory Update

• USEPA released a Guidance for Public Water Systems on Enhanced Monitoring for Chromium-6 (Hexavalent Chromium) in Drinking Water (01/2011)Chromium) in Drinking Water (01/2011)− EPA Method 218.6

Buffered samples pH = 9 0 9 5− Buffered samples, pH = 9.0 – 9.5

− 5 days of holding time

• USEPA has proposed changes to its Unregulated• USEPA has proposed changes to its Unregulated Contaminant Monitoring Regulation 3 (UCMR 3), which will likely include total Cr and Cr(VI).

• Finally, it is likely that USEPA will tighten drinking water standards to address the health risks posed by Cr(VI) in th f tthe near future.

6

Common Analytical Techniques and Methods

Total Cr GFAASICP-MS

EPA Methods 218.2 and 200.9EPA Method 200.8

ICP-AES EPA Method 200.7Dissolved Cr(VI) IC-PCR-UV/Vis EPA Method 218.6

Dionex Application Update144Dionex Application Update144 SM 3500-Cr CASTM D5257-11

Cr(III) and Cr(VI) speciation

IC-PCR-UV/VisLC-ICP-MSIC-ICP-MS

Dionex Application Update 165

IC ICP MSPre-concentration- Sol-gel

7

- SPE cartridges

EPA Method 218.6 InstrumentationDionex ICS 5000Dionex ICS 5000

ICS-5000 SP single pump

AS-DV autosampler

ICS Series VWD variable wavelength detector (UV/Vis)

DC ICS 5000 d l CD dDC ICS-5000 dual CD and ECD

PC 10 pneumatic postPC-10 pneumatic post-column reagent delivery system

8

EPA Method 218.6 ConditionsAnalytical column Dionex IonPac AS7 (4x 250 mm)

Guard column Dionex IonPac NG1 (4 x 50 mm)

Eluent 250 mM (NH ) SO and 100 mM NH OHEluent 250 mM (NH4)2SO4 and 100 mM NH4OHEluent flowrate = 1.0 mL/minBack pressure = 1200-1300 psiSample loop = 1 mL

PCR 2 mM 1,5-diphenylcarbohydrazide, 10% (V/V) methanol, and 1N H2SO4PCR fowrate = 0.33 mL/minPCR coil = 1 mLPCR coil temperature = 30 °C

Absorbance detection 535 nmAbsorbance detection 535 nm

Noise Auto zero

Run time 10 min

9

Sample pH buffer 2.5M (NH4)2SO4 and 1M NH4OH (pH = 9.0-9.7)

Cr(VI) Method Sensitivity

Spiking Conc. MDL

( /L)

Spiking Conc. LCMRL DL Critical

Level(µg/L)

(µg/L)(µg/L) (µg/L) (µg/L) (µg/L)

0 01 0 006 0 01 0 06 0 027 0 009 0 00640.01 0.006 0.01-0.06 0.027 0.009 0.0064

0 02 0 0030.02 0.003

0.02 0.015

0.02 0.016

10

Cr(VI) Method Accuracy and Precision (n = 4)

MatrixSpiking Conc.

Mean Recovery RSD

(%)(µg/L) (%) (%)

DI Water 1 0 99 0 6DI Water 1.0 99 0.6

Chlorinated DW 1.0 103 0.7Chlorinated DW 1.0 103 0.7

Chlorinated SW 1.0 103 0.9

Chlorinated GW 1.0 101 1.0

11

Water Matrix Characterization

Parameter Drinking Water Surface Water Groundwater

Cr (VI) 0.02 µg/L 0.05 µg/L < 0.02 µg/L

Total Cr 0.17 µg/L 0.21 µg/L < 0.1 µg/L

Nitrate < 0.1 mg N/L 2.5 mg N/L < 0.1 mg N/L

Nitrite < 0 1 mg N/L < 0 1 mg N/L < 0 1 mg N/LNitrite < 0.1 mg N/L < 0.1 mg N/L < 0.1 mg N/L

Ammonia < 0.1 mg N/L < 0.1 mg N/L < 0.1 mg N/L

Total cyanide < 0.02 mg/L < 0.02 mg/L < 0.02 mg/L

Total phosphate < 0.05 mg P/L 0.11 mg P/L < 0.05 mg P/L

TOC 0.5 mg/L 5.8 mg/L < 0.5 mg/L

Turbidity 0 23 NTU 11 9 NTU 0 05 NTUTurbidity 0.23 NTU 11.9 NTU 0.05 NTU

Conductivity 955 umhos/cm 531 umhos/cm 532 umhos/cm

Heterotrophic plate < 2 MPN/mL > 738 MPN/mL 40 MPN/mL

12

count (HPC)

Effects of Holding Time and TemperatureBuffered DW SW and GW (Cl2 ≈ 0 2 ppm)Buffered DW, SW, and GW (Cl2 ≈ 0.2 ppm)

2.5 110

2.4

DW-4C-2ppb Cr (VI)DW-20C-2ppb Cr (VI)SW-4C-2ppb Cr (VI)SW-20C-2ppb Cr (VI)GW-4C-2ppb Cr (VI)GW-20C-2ppb Cr (VI) 105

2 2

2.3

100

2.1

2.2

95DW-4C-2ppb Cr (VI)DW-20C-2ppb Cr (VI)SW-4C-2ppb Cr (VI)SW-20C-2ppb Cr (VI)

20 5 10 15 20 25 30

Holding Time (Days)

900 5 10 15 20 25 30

GW-4C-2ppb Cr (VI)GW-20C-2ppb Cr (VI)

H ldi Ti (D )

13

Holding Time (Days) Holding Time (Days)

Effects of Holding Time and TemperatureBuffered DW SW and GW (Cl2 ≈ 0 2 ppm)Buffered DW, SW, and GW (Cl2 ≈ 0.2 ppm)

3.5DW-4C-20ppb Cr (III)-2ppb Cr (VI)

1DW-4C-20ppb Cr (III)

3

DW 4C 20ppb Cr (III) 2ppb Cr (VI)DW-20C-20ppb Cr (III)-2ppb Cr (VI)SW-4C-20ppb Cr (III)-2ppb Cr (VI)SW-20C-20ppb Cr (III)-2ppb Cr (VI)GW-4C-20ppb Cr (III)-2ppb Cr (VI)GW-20C-20ppb Cr (III)-2ppb Cr (VI)

0.8

DW-20C-20ppb Cr (III)SW-4C-20ppb Cr (III)SW-20C-20ppb Cr (III)GW-4C-20ppb Cr (III)GW-20C-20ppb Cr (III)

0.4

0.6

2.5

0.2

20 5 10 15 20 25 30

Holding Time (Days)

00 5 10 15 20 25 30

Holding Time (Days)

14

Cr(III) Speciation as a Function of pH Ionic strength of ~0 01 M and Cr(III) = 1 0 mg/LIonic strength of 0.01 M and Cr(III) = 1.0 mg/L

(Source: visual MINTEQ program)

15

Cr(VI) Speciation as a Function of pH Ionic strength of ~0 01 M and Cr(VI) = 1 0 mg/LIonic strength of 0.01 M and Cr(VI) = 1.0 mg/L

(Source: visual MINTEQ program)

16

Formal Reduction Potential pH = 9 0 9 5pH = 9.0 - 9.5

Cl ↑ + 2e 2Cl- E0’ ≈ 1 36VCl2↑ + 2e 2Cl- E0 ≈ 1.36V

O2↑ + 4H+ + 4e 2H2O E0’ ≈ 0 2VO2↑ 4H 4e 2H2O E 0.2V

CrO42- + 8H+ + 3e Cr3+ + 4H2O E0’ ≈ - 0.2V4 2

Cr(OH) → CrO 2-Cr(OH)3 → CrO4

17

Effects of Chlorine, Cr(III), and Temperature24 hrs of chlorination buffered prior to analysis24 hrs of chlorination, buffered prior to analysis

1000.2 ppm Cl2, 4C 0.2 ppm Cl2, 20C

80

2 ppm Cl2, 4C4 ppm Cl2, 4C

2 ppm Cl2, 20C4 ppm Cl2, 20C

60

20

40

0

20

18

25 50 75 100

Cr (III) Concentration (ug/L)

Effects of Chlorine, Cr(III), and pH Buffer

1000.25 ppm Cl2, BDI0.5 ppm CL2, BDI0.75 ppm Cl2, BDI

0.25 ppm Cl2, NBDI0.5 ppm Cl2, NBDI0.75 ppm Cl2, NBDI

60

80pp ,

1 ppm Cl2, BDIpp ,

1 ppm Cl2, NBDI

40

60

20

40

02 5 5 7 5 10

19

2.5 5 7.5 10

Cr (III) Concentration (ug/L)

Effects of Chlorine, Cr(III), and pH Buffer

100.25 ppm Cl2, BDI0.5 ppm CL2, BDI

0.75 ppm Cl2, BDI1 ppm Cl2, BDI

8

6

2

4

0

2

20

02.5 5 7.5 10

Cr (III) Concentration (ug/L)

Effects of Chlorine and pH BufferAverage conversion rate of Cr(III) (0 25 5 7 5 10 ppb)Average conversion rate of Cr(III) (0.25, 5, 7.5, 10 ppb)

70

BDI Water NBDI Water

50

60

54

62

4045

20

30

18

0

10

0.9 1.2 6.9 8.4

18

21

00.25 0.5 0.75 1

Chlorine Concentration (mg/L)

Effects of Chlorine and pH Buffer (n=4)Cl2 = 1 ppm pH buffered >12 hrsCl2 = 1 ppm, pH buffered, >12 hrs

Cr(III) = 10 ppb, Cr(VI) = 1 ppb, >6 hrs at ambient temperature8

6

7 pH = 8.6

4

5pH = 9.0

pH = 9.3

pH = 9.6

2

3

4pH = 9.4

0

1

2

22

010 25 50 75 100

Concentration of Ammonium Hydroxide (mM)Concentration of Ammonium Hydroxide (mM)

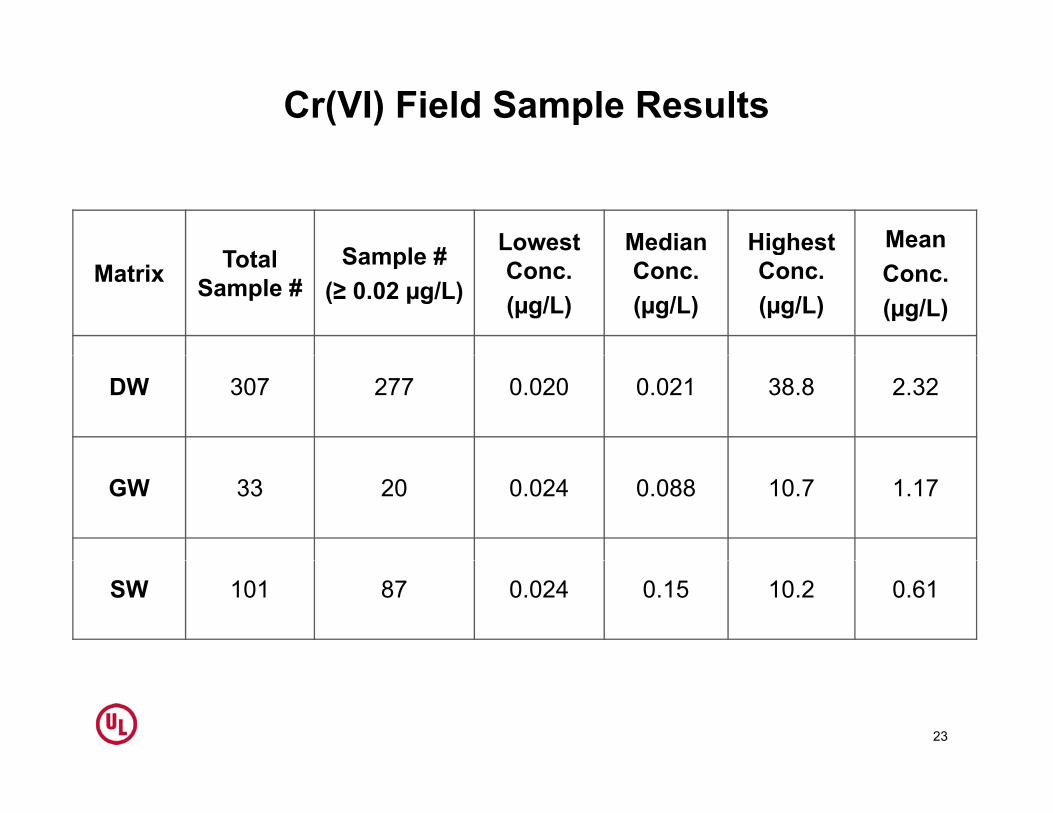
Cr(VI) Field Sample Results

T t l Sample # Lowest Median Highest Mean Matrix Total

Sample #Sample #

(≥ 0.02 µg/L)Conc.(µg/L)

Conc.(µg/L)

gConc.(µg/L)

Conc.(µg/L)

DW 307 277 0.020 0.021 38.8 2.32

GW 33 20 0.024 0.088 10.7 1.17

SW 101 87 0.024 0.15 10.2 0.61

23

Conclusions• EPA Method 218.6 is applicable for analyzing Cr(VI) with

an MRL of 0.02-0.03 µg/L.

• EPA Method 218.6 can provide good accuracy (±10% recovery) and precision (≤20% RSD).

The presence of Cr(III) may affect sample results• The presence of Cr(III) may affect sample results.

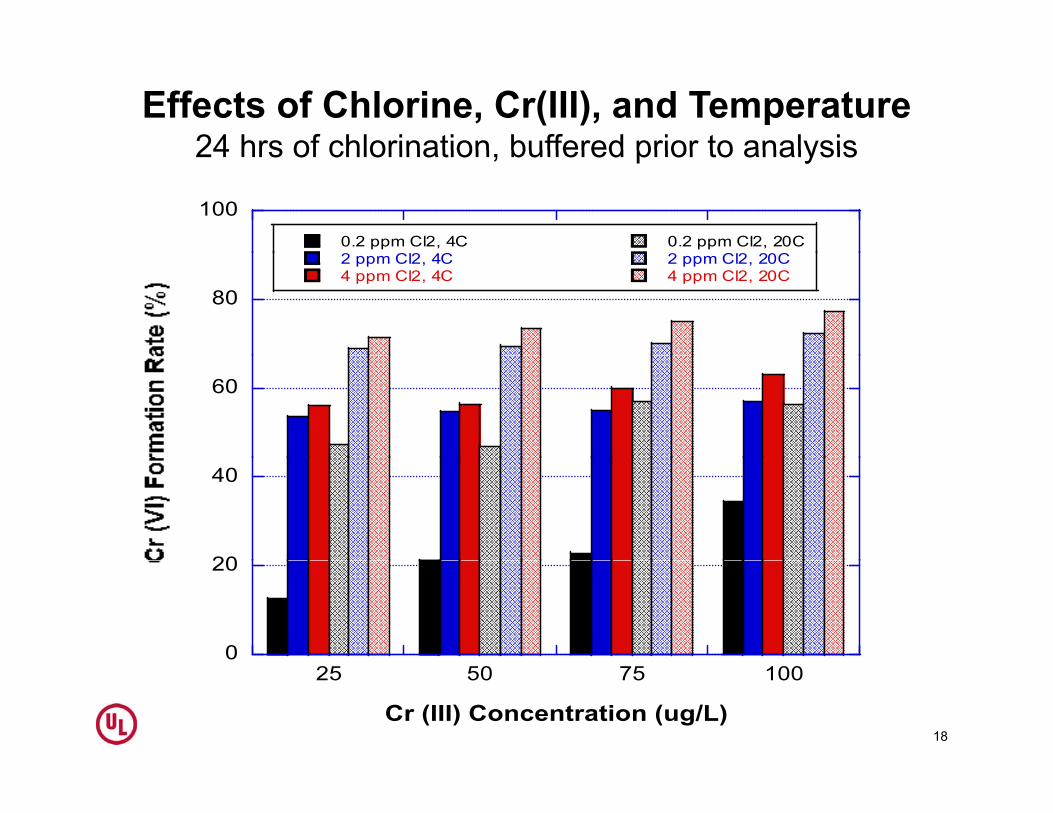
• Cr(III)-to-Cr(VI) conversion is dependent on total Cr(III), Cl and NH OH concentrations temperature andCl2 and NH4OH concentrations, temperature, and holding time.

• When Cl2 concentrations varied from 0.25 mg/L to 1When Cl2 concentrations varied from 0.25 mg/L to 1 mg/L, Cr(III)-to-Cr(VI) conversion rates were 18% to 62% for non-buffered samples and 0.9% to 8.4% for buffered samplessamples.

24

Conclusions• The use of (NH4)2SO4−NH4OH buffer to adjust sample

pH to 9.0-9.5 cannot completely stop the oxidation of Cr(III) Cr(VI) formation rates were generally less thanCr(III). Cr(VI) formation rates were generally less than 10%.

• General recommendations for Cr(VI) control in drinking ( ) gwater include:

−Remove Cr(III) before disinfection.

−Use alternative disinfection techniques, such as chloramination instead of chlorination.

−For a chlorination system, consider to reduce Cl2doses.

25

THANK YOU!

Dr. Yongtao Li

[email protected]

1-574-472-55621 574 472 5562

Underwriters Laboratories


Recommended