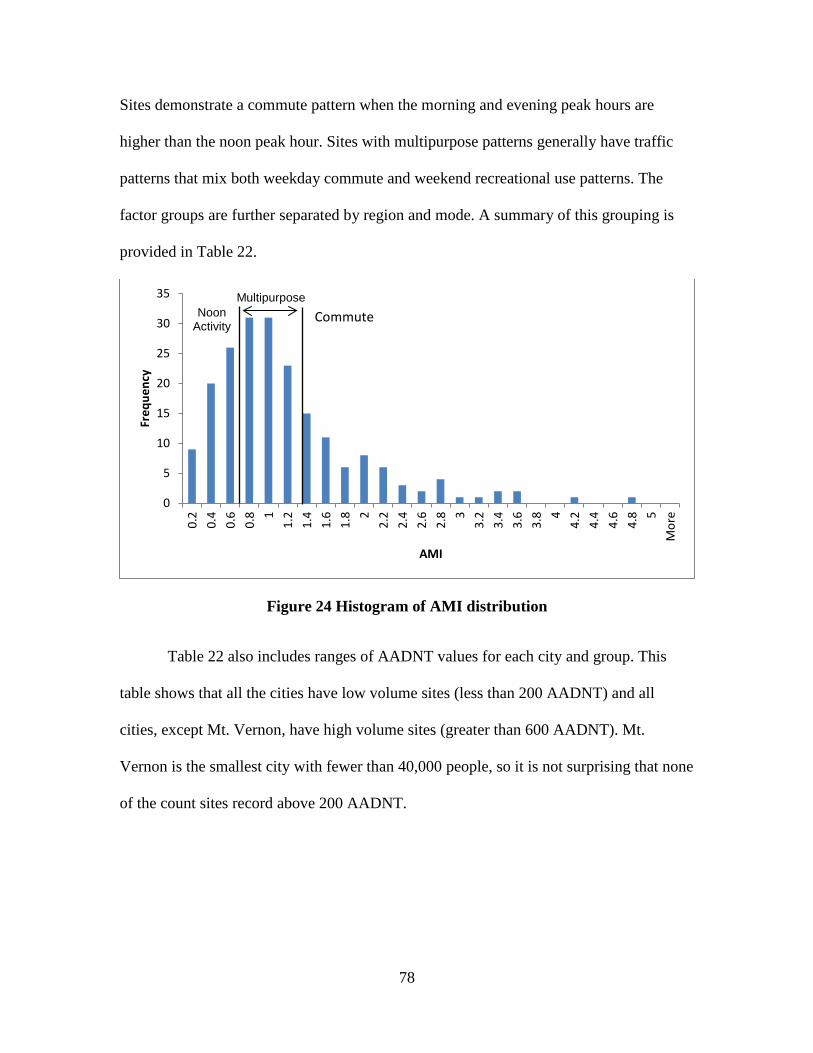
Office of Research & Library Services WSDOT Research Report Opmizing Short Duraon Bicycle and Pedestrian Counng in Washington State WA-RD 875.2 December 2017 18-02-0107 Krista Nordback Dylan Johnstone Sirisha Kothuri
Transcript
Office of Research & Library ServicesWSDOT Research Report
Optimizing Short Duration Bicycle and Pedestrian Counting in Washington State
WA-RD 875.2 December 2017
18-02-0107
Krista Nordback Dylan Johnstone Sirisha Kothuri
Research Report
WA-RD 875.2
Optimizing Short Duration Bicycle and Pedestrian Counting in Washington State
by Krista Nordback, Ph.D., P.E.
Highway Safety Research Center University of North Carolina
Dylan Johnstone Transportation Research and Education
Center (TREC) Portland State University
Sirisha Kothuri Department of Civil and Environmental
Engineering Portland State University
Transportation Research and Education Center (TREC) Portland State University
P.O. Box 751 Portland, OR 97207-0751
Washington State Department of Transportation Technical Monitor
Jon Peterson Research Manager, Olympia, Washington
Prepared for
The State of Washington Department of Transportation
Roger Millar, Secretary
December 2017
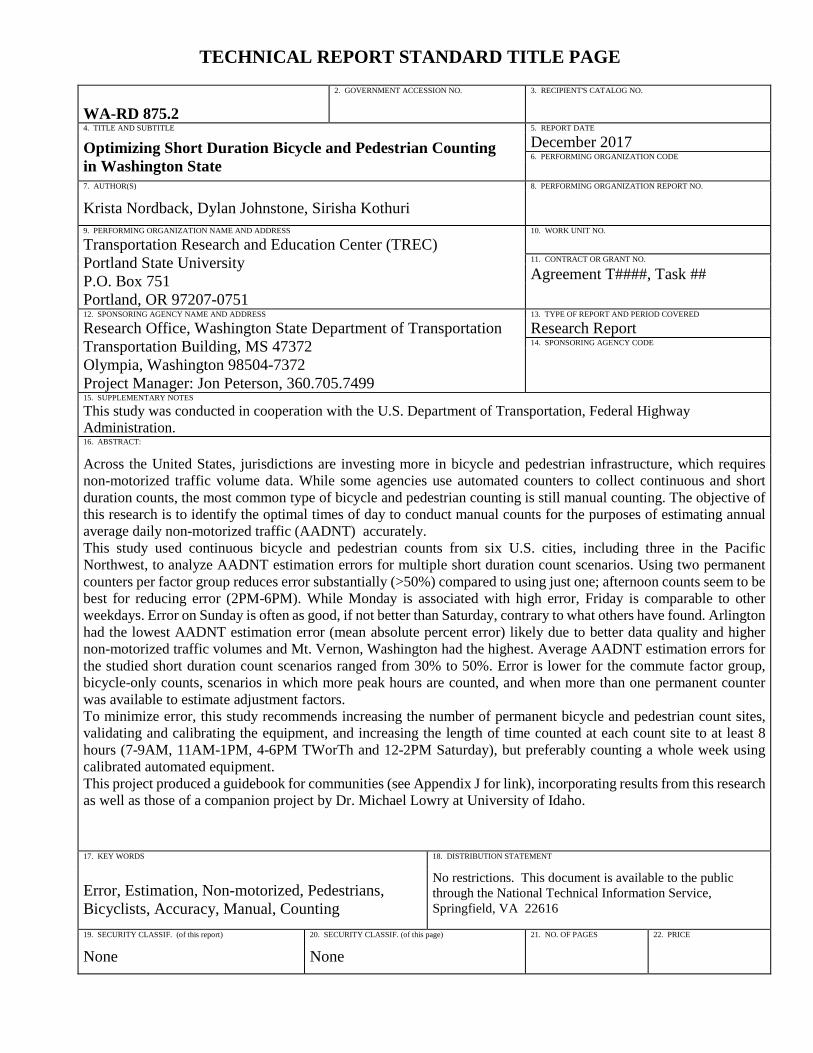
TECHNICAL REPORT STANDARD TITLE PAGE
2. GOVERNMENT ACCESSION NO. 3. RECIPIENT'S CATALOG NO.
WA-RD 875.2 4. TITLE AND SUBTITLE 5. REPORT DATE
Optimizing Short Duration Bicycle and Pedestrian Counting in Washington State
Krista Nordback, Dylan Johnstone, Sirisha Kothuri 9. PERFORMING ORGANIZATION NAME AND ADDRESS 10. WORK UNIT NO.
Transportation Research and Education Center (TREC) Portland State University P.O. Box 751 Portland, OR 97207-0751
11. CONTRACT OR GRANT NO.
Agreement T####, Task ##
12. SPONSORING AGENCY NAME AND ADDRESS 13. TYPE OF REPORT AND PERIOD COVERED
Research Office, Washington State Department of Transportation Transportation Building, MS 47372 Olympia, Washington 98504-7372
Project Manager: Jon Peterson, 360.705.7499
Research Report 14. SPONSORING AGENCY CODE
15. SUPPLEMENTARY NOTES
This study was conducted in cooperation with the U.S. Department of Transportation, Federal Highway Administration. 16. ABSTRACT: Across the United States, jurisdictions are investing more in bicycle and pedestrian infrastructure, which requires non-motorized traffic volume data. While some agencies use automated counters to collect continuous and short duration counts, the most common type of bicycle and pedestrian counting is still manual counting. The objective of this research is to identify the optimal times of day to conduct manual counts for the purposes of estimating annual average daily non-motorized traffic (AADNT) accurately. This study used continuous bicycle and pedestrian counts from six U.S. cities, including three in the Pacific Northwest, to analyze AADNT estimation errors for multiple short duration count scenarios. Using two permanent counters per factor group reduces error substantially (>50%) compared to using just one; afternoon counts seem to be best for reducing error (2PM-6PM). While Monday is associated with high error, Friday is comparable to other weekdays. Error on Sunday is often as good, if not better than Saturday, contrary to what others have found. Arlington had the lowest AADNT estimation error (mean absolute percent error) likely due to better data quality and higher non-motorized traffic volumes and Mt. Vernon, Washington had the highest. Average AADNT estimation errors for the studied short duration count scenarios ranged from 30% to 50%. Error is lower for the commute factor group, bicycle-only counts, scenarios in which more peak hours are counted, and when more than one permanent counter was available to estimate adjustment factors. To minimize error, this study recommends increasing the number of permanent bicycle and pedestrian count sites, validating and calibrating the equipment, and increasing the length of time counted at each count site to at least 8 hours (7-9AM, 11AM-1PM, 4-6PM TWorTh and 12-2PM Saturday), but preferably counting a whole week using calibrated automated equipment. This project produced a guidebook for communities (see Appendix J for link), incorporating results from this research as well as those of a companion project by Dr. Michael Lowry at University of Idaho.
programs, which are often collected at intersections, are by far the most common.
NCHRP 797 reports that of those agencies surveyed who count pedestrians, 93% do so
manually and of those who count bicycles, 87% do so manually (Ryus et al. 2014). For
3
this reason, optimizing and providing specific guidance for such programs is needed and
would lead to higher quality data.
The objective of this research is to improve bicycle and pedestrian manual count
data quality for the purposes of estimating AADNT. Manual counts are by far the most
commonly collected type of non-motorized traffic counts and can provide data on gender
and helmet use which cannot be collected otherwise (Ryus et al. 2014). If manual counts
are collected, when, how often, and how long should they be collected? These questions
will be addressed in this study.
This report provides a review of the literature on bicycle and pedestrian short
duration counting and techniques for estimating AADNT. Next, a description of the data
used and its quality is detailed. This is followed by a description of the analysis
conducted to identify optimal manual count strategies for reducing AADNT estimation
error. The report concludes with discussion of the findings and recommendations for
WSDOT’s count program. The recommendations are detailed in a guidebook included in
Appendix J.
4
REVIEW OF PREVIOUS WORK
COUNTING METHODS
There are two primary methods for collecting non-motorized traffic count data:
manual and automated. The TMG lists three methods of counting non-motorized traffic:
“1 = Human observation (manual)
2 = Portable traffic recording device
3 = Permanent, continuous count station (CCS)”
We discuss the TMG’s category 1 as “manual” counts below, and the TMG’s
category 2 and 3 as “automated” counts below.
Manual
Manual counts are collected by human beings either in the field or through
reviewing video recordings at screenline, intersection, or midblock locations. In the field,
these counts may be collected by hand by drawing lines on a paper schematic of a count
location, by using a smartphone with a counting application, using a handheld electronic
count board, or by various other methods. Additionally, manual counts may be used to
validate counts from automated technologies.
5
Automated
Automated counts continuously record traffic flow using counting devices (i.e.,
Automated Traffic Recorder (ATR) or Portable Traffic Recorder (PTR)) or computer
automated video image processing for the purposes of counting (Figure 1). Counts are
either collected by timestamp or in discrete time bins (e.g., 15 minutes, hour of the
day)(Lindsey et al. 2014; FHWA 2013)1. Automated counts may be taken by permanent
or portable/temporary counters.
Source: Alta Planning + Design, “Innovation in Bicycle and Pedestrian Counts: A Review of Emerging Technology,” 2016.
1 TMG, Section 1.2.2
Figure 1 Automated counter technologies commonly used to count pedestrians and bicyclists.
6
Temporary
A temporary counter is an automated counting device that is installed at a
site to collect short duration counts. For example, pneumatic tubes or temporary
inductive loops (e.g., Eco-Counter’s Easy Zelt) may be used as temporary counters.
Permanent
A permanent counter is an automated counting device that is installed with
the intent to keep at that count location indefinitely. It is important to note that while
all permanent counters collect data continuously, not all continuous counters are
permanent. For instance, researchers may collect continuous data from a site for a
number of years before uninstalling the counting device when the project ends or
funding runs out.
COUNT TYPES
Even with efforts on the local, state, and federal levels to establish guidelines for
non-motorized traffic monitoring, the terms commonly used in these programs have yet to
be standardized (Lindsey et al. 2014). For the purposes of this report, the authors adopt the
following definitions for bicycle and pedestrian count types using guidance from the
Traffic Monitoring Guide (TMG).
Short Duration (< 1 year)
Lindsey et al. (2014) found that short duration counts are conducted in a specific
geographic study area for less than one year either using manual or automated technologies
7
in order to cost-effectively increase the number of count locations. Short duration counts
usually range from 1 day to 1 month, but may also be 2 hour counts during peak periods
(e.g., NBPDP counts)(Lindsey et al. 2014).
Manual counts are conducted by individuals, often an agency staff member,
volunteer, or intern (Nordback et al. 2015). Due to limited data collection resources, these
counts are generally taken once or twice a year over a very short duration (e.g., 2 hour)
during peak hours at designated locations. The TMG recognizes that using short duration
manual counts may also be due to the perceived difficulty of using automated technologies
and the desire to collect data on gender and helmet use (FHWA 2013)2.
Temporary automated counts are another type of short duration count, but are
distinct from manual counts because they are collected by machine (i.e., Portable Traffic
Recorder or PTR) and generally have a longer duration (e.g., several hours to multiple
weeks)(FHWA 2013)3. This provides valuable count data for studying hourly, daily, and
monthly traffic patterns, which would not be possible with manual counts alone (Nordback
et al. 2015).
Short (manual or temporary automated, < 24 hours)
“Short” counts are short duration counts, either manual or temporary
automated, taken for less than 24 consecutive hours. These counts are advantageous
for collecting data from a greater variety of count sites within a large geographic
extent. By increasing the number of counts at different locations within the
2 TMG, Section 4.1
3 TMG, Section 4.2
8
network, researchers and practitioners are better able to understand spatial patterns
across different geographies. The common use of volunteers for counting allows
jurisdictions to collect large spatially diverse counts with little cost.
Mid-Length (temporary, automated, 24-hours to 1 month)
“Mid-length” counts are short duration counts lasting from 24-hours to 1
month collected continuously using temporary automated counters. These counts
are typically taken from multiple locations in the network to compare and better
understand what patterns are occurring at different short count sites. They are also
useful in developing daily and weekly patterns.
Continuous (permanent, automated, 12+ months)
Continuous counts are collected 24 hours per day, 7 days per week by automated
counters with the goal of collecting data for 365 days per year. Automated counters are
often permanently installed at a location to capture continuous counts (Nordback et al.
2015). For motor vehicle count sites, (FHWA 2013) continuous count sites and permanent
count sites are synonymous, but for non-motorized traffic continuous sites are usually, but
not always, meant to be maintained permanently (Lindsey et al. 2015). In the TMG, a
Continuous Count Station (CCS) may collect data for either all days of the year or for at
least a seasonal collection (FHWA 2013)4. In some places, stations may be removed due
to weather (e.g., snow) or road closures. Occasionally, gaps in the data may occur due to
4 TMG, Section 1.2.2
9
special events detours, construction, and equipment failure (FHWA 2013)5. Researchers
use continuous counts to analyze travel patterns by purpose, develop temporal adjustment
factors, and estimate traffic volumes or annual average daily traffic for pedestrians and
bicycles (AADNT) (Appendix A).
Seasonal (temporary automated, 1 month to 11 months)
“Seasonal” counts are continuous counts that range from 1 month to 11
months in length that gather data for at least one full season. These counts are
collected using temporary automated counters such as passive infrared counters,
for example. These are common in places where seasonal use due to weather or
recreational travel patterns makes counts very low during off-season. For example,
in places with snowy winters, such as in some mountain areas, jurisdictions may
desire to protect their equipment from snow damage and remove it before winter
sets in and covers bicycling trails with snow.
For the focus of this study, seasonal counts are not particularly useful for
AADNT estimation, although can be used for seasonal AADNT estimation. Mid-
length counts are sufficient for developing daily and weekly factors and continuous
data for one full year are required for developing monthly factors. However,
seasonal counts are good for seasonal annual daily traffic (SADT) computation and
may be useful for recreational travel where bicycle and pedestrian use is completely
or almost completely during a known season.
5 TMG, Section 1.2.4
10
ERROR AND ACCURACY
Count Types
The TMG acknowledges that the technologies used for counting pedestrians and
bicyclists are constantly evolving and the error rates associated with these technologies are
not well known (FHWA 2013)6. Although it is not extensively discussed in this report, site
selection may also factor into error rates. Selection criteria focuses on locations with the
highest usage levels (i.e., times with lowest variability) or strategic locations of facility
improvement, which may lead to bias estimates of overall usage.
Below is a discussion of error and accuracy associated with short duration and
continuous count types.
Short Duration
Short duration manual and automated counts are affected by bias from seasonal and
weekly variation, weather, and events (Ryus et al. 2014, FHWA 2013). Thus, determining
when to conduct short duration counts is an important initial step in collecting reliable data,
especially for 2-3 hour manual counts. These manual counts can be taken during the
traditional peak hours in the morning or evening, off-peak hours, or during site-specific
peak hours.
The TMG suggests a minimum of 7 days for automated counts and 4-6 hours for
manual counts coinciding with the heaviest use (i.e., morning/evening for commute trips
6 TMG, Section 4.1
11
and mid-day for weekend/recreational trips)7. The TMG also suggests that 12 hour short-
duration counts are preferable when resources are available, which allow for time-of-day
use profiles to be calculated. If only manual counts are possible, the TMG encourages
agencies to count at fewer locations for longer periods. Recent research confirms this
guidance by demonstrating that average absolute percent error (AAPE) also known as the
mean absolute percent error (MAPE) in AADNT estimation decreases as count duration
increases (Voyt 2015, Nordback et al. 2013, El Esawey 2014, Budowski 2015, Figliozzi et
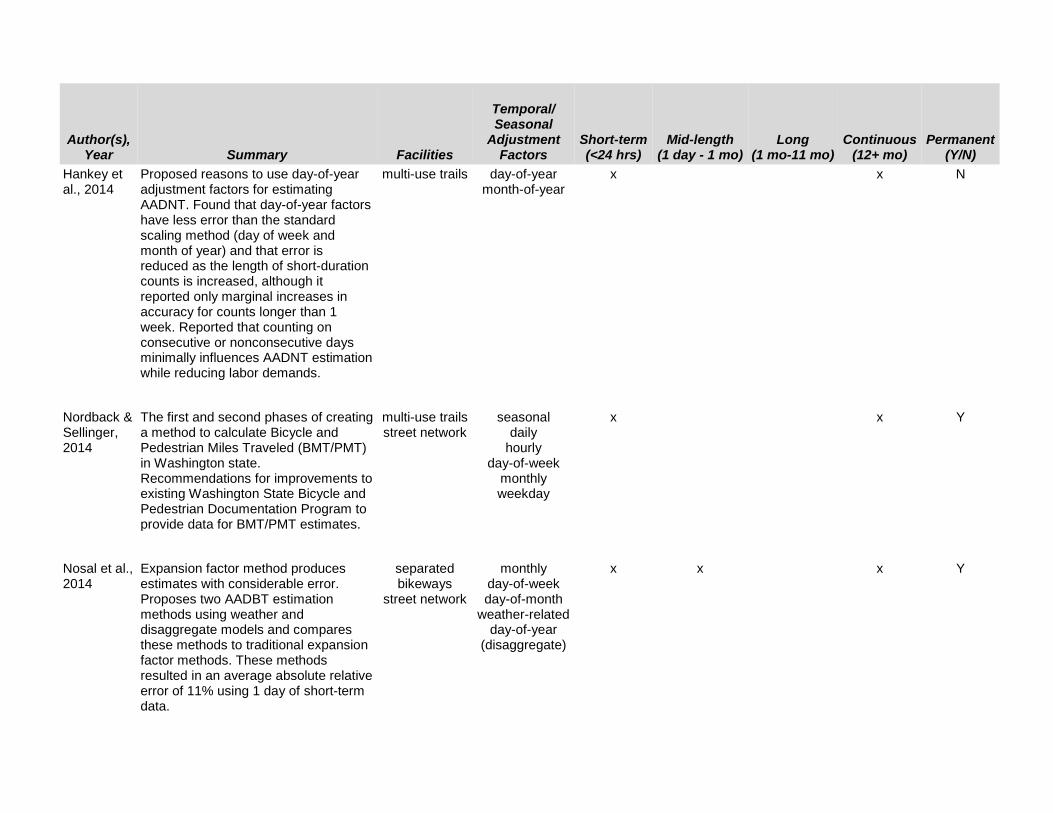
al. 2014, Nordback & Sellinger 2014, El Esawey et al. 2013, Hankey et al. 2014).
Alternatively, the National Bicycle and Pedestrian Documentation Project
(NBPDP) recommends short duration counts be taken a Tuesday, Wednesday, or Thursday
during the traditional evening peak period (i.e., 5-7PM) for weekday counts and on
Saturdays from noon to 2:00pm for weekend counts. The NBPDP encourages conducting
these counts during a designated week in mid-May and mid-September. The NBPDP also
suggests counting multi-hour periods between 1-3 times at every location on sequential
days and weeks, depending on the approximate levels of use. Areas with high volumes
(i.e., over 100 people/hour during mid-day periods) can typically be counted once for a
weekday and weekend day, except when there is unusual activity or nearby land use (i.e.,
special events, irregular activity at sports facilities, etc.).
Additionally, recent research has explored estimation error for counting on
different days of the week and different months or seasons. However, there is an apparent
lack of research on estimation error for time-of-day. The estimation error associated with
this day-of-year factoring method is also detailed in the discussion below.
7 TMG, Section 4.5.3
12
Nordback et al. (2013) provided estimates of error for various short duration count
scenarios and offered recommendations for when and how long to count bicyclists for the
most cost-effective accuracy in estimating annual average daily bicycle traffic (AADBT).
The study found that counting during seasons with higher bicycle volumes and less
variability result in better accuracy (e.g., May to October) (Nordback et al. 2013, Voyt
2015, El Esawey 2014). This period will vary with climate and location, but can be
identified given one year of continuous count data. Nordback et al. found that to keep
AADBT estimation error below 30% on average at least one week of count data was needed
(Figure 2). The week of data also allows data users to accurately choose the correct peak
periods and determine which travel patterns are common at the site in order to select
appropriate daily and monthly adjustment factors. If collecting continuous count data for
one week is not possible, conducting 12-hour counts on Tuesday, Wednesday, or Thursday
provides sufficient information for indicating weekday traffic patterns and determining
factor groups (commute vs non-commute patterns) within 30-46% MAPE. However,
Nordback et al. also found that the season in which the short duration counts are collected
can have a substantial impact on the accuracy. Even when only three peak hour counts were
collected, error could be reduced to as little as 16% MAPE during the month of July. For
this reason, further investigation into when short duration counts should be collected is
warranted.
13
Figure 2 Error estimation as count duration increases. Source: Nordback et al. 2013
Hankey et al. (2014) found that estimation error decreases as count duration
increases, although only marginal gains in accuracy occur for counts longer than one week
(Figure 3 and 4). In this Minneapolis study, the lowest error for AADNT estimation was
found during summer months (or April through October). When using day-of-year factors,
counting on consecutive days versus non-consecutive days results in minimal impact on
estimation, although counting on consecutive days may help to reduce labor requirements
(Figure 3). Additionally, this study found that day-of-year scaling factors have smaller
error than day-of-week and month-of-year factors (Figure 4).
14
Figure 3 Mean Absolute AADNT estimation error and person-hours required to relocated monitors for each short-duration count scenario (bars = standard error).
Source: Hankey et al. 2014
15
Figure 4 Mean absolute AADNT estimating error using standard (black dashed line) and new (red solid line) scaling methods (number of counters needed to complete design scenario (7-month sampling campaign) is denoted in staircase-shaped plot).
Source: Hankey et al. 2014
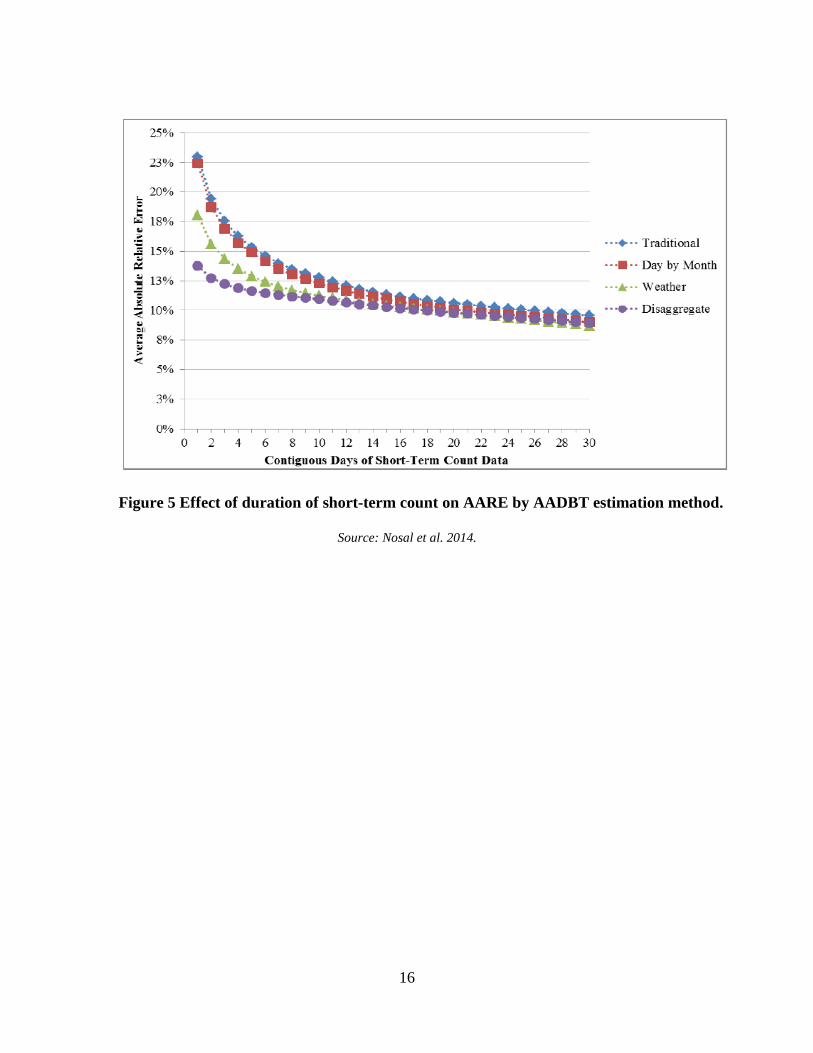
Nosal et al. (2014) found that disaggregate factors (i.e., day-of-year factors) had
lowest estimation error (11% AAPE for weekdays) in comparison to the AASHTO method
(traditional expansion factoring method), day-of-month method, and weather-based
method using data from Montreal (Figure 5). This study determined that error and accuracy
does not vary widely across different weekdays. It also found that Thursdays consistently
produced the lowest AAPE, although the researchers concluded that this finding may only
be applicable to conditions in Montreal or to the specific set of counters (Figure 5). Further,
more accurate AADBT estimates were calculated using counts from summer months,
which reinforces previous research and common data collection methods (Figure 6).
16
Source: Nosal et al. 2014.
Figure 5 Effect of duration of short-term count on AARE by AADBT estimation method.
17
Figure 6 Effect of time of short-term count on AAPE value, by AADBT estimation method: (a) day of week and (b) month.
Source: Nosal et al. 2014.
El Esawey (2016) supported that day-of-year factors were best suited for AADT
estimation (17.5% MAPE). The study used data from Vancouver, British Columbia, and
found that using count data from weekdays were better for estimation accuracy than
weekends (e.g., average MAPE of 13.1% on weekdays vs 28.6% on weekends).
El Esawey (2014) used 2010 data and found that the lowest estimation error for
estimating AADBT was an average MAPE of 4% when applying monthly and daily factors
to 24-hour short duration counts. Applying the same 2010 data to estimate AADBT values
for 2009 and 2011 shows the temporal transferability of monthly factors (MAPE 15% and
18
12%, respectively). The study found that summer months consistently provided lowest
error (May-August), with the lowest MAPE of 7% in June. Further, MAPE estimated using
AADBTs were relatively low when daily bicycle volume data from weekdays were used
from July or August. The study recommends that Tuesday through Friday data in July or
August be collected for estimation.
El Esawey et al. (2013) found that MAPE for estimating monthly average daily
bicyclists was relatively low for weekdays (specifically Tuesdays and Wednesdays) (Table
1) and could be as low as 6-8% for Mondays through Thursdays in August. The study
found the lowest MAPE in June, July, August (lowest was 10-16% in August) and highest
MAPE in October, November, and December.
Table 1 MAPE Error for Each Day of Week
Source: El Esawey et al. 2013
Figliozzi et al. (2014) determined from a year of continuous data from Portland,
Oregon that days in the middle of the week (Tuesday-Friday) resulted in the lowest MAPE
(14-16%) (Table 2). This data was taken from the Hawthorne Bridge, which demonstrates
a commuter pattern to and from downtown Portland. Sundays and Mondays show a high
19
MAPE (≈25%), which is attributed to differences in traffic volumes on weekends and
several holidays that fall on Mondays.
Table 2 MAPE by Day of Week
Source: Figliozzi et al. 2014
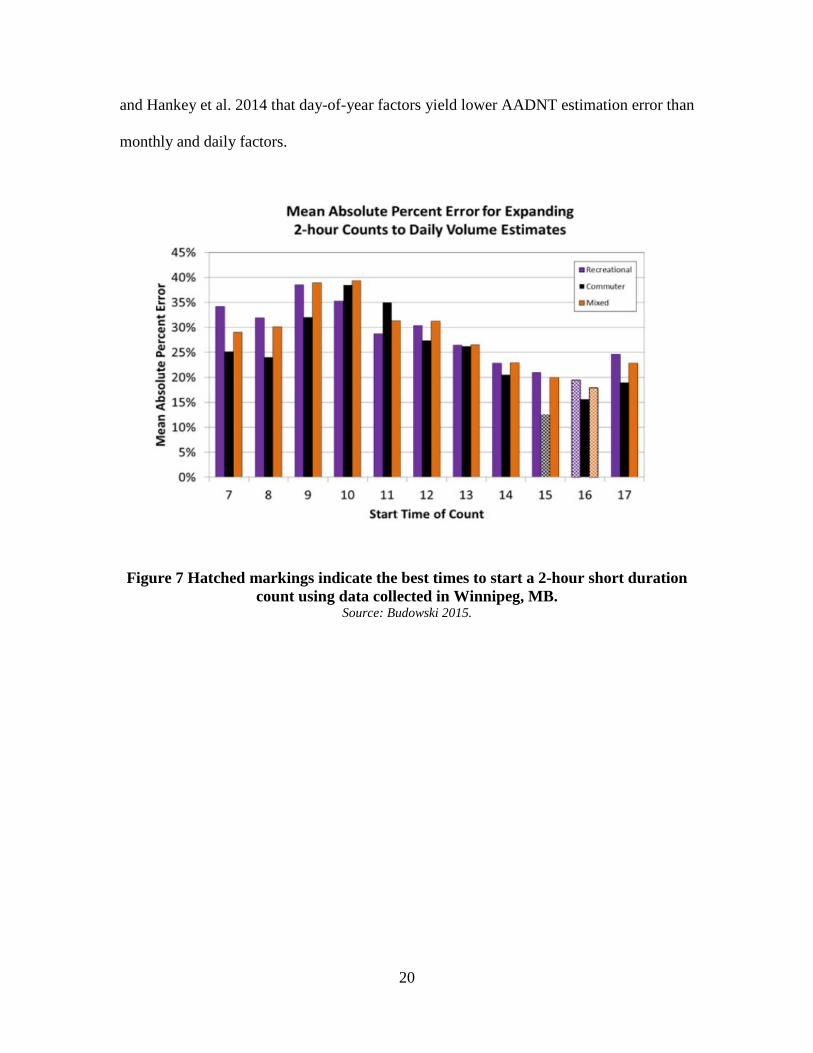
Budowski (2015) found that using 2-hour count durations to estimate AADBT in
Winnipeg resulted in 12-23% MAPE, and that the improvement in error for using 3- or 4-
hour counts did not warrant the use of additional resources. This study determined that the
best time of day to conduct short duration counts was influenced by the observed traffic
pattern (e.g., commuter, post-secondary commuter, recreational, mixed). For segments
classified as commuter, the best time was from 3-5PM, 4-6PM for recreational and mixed
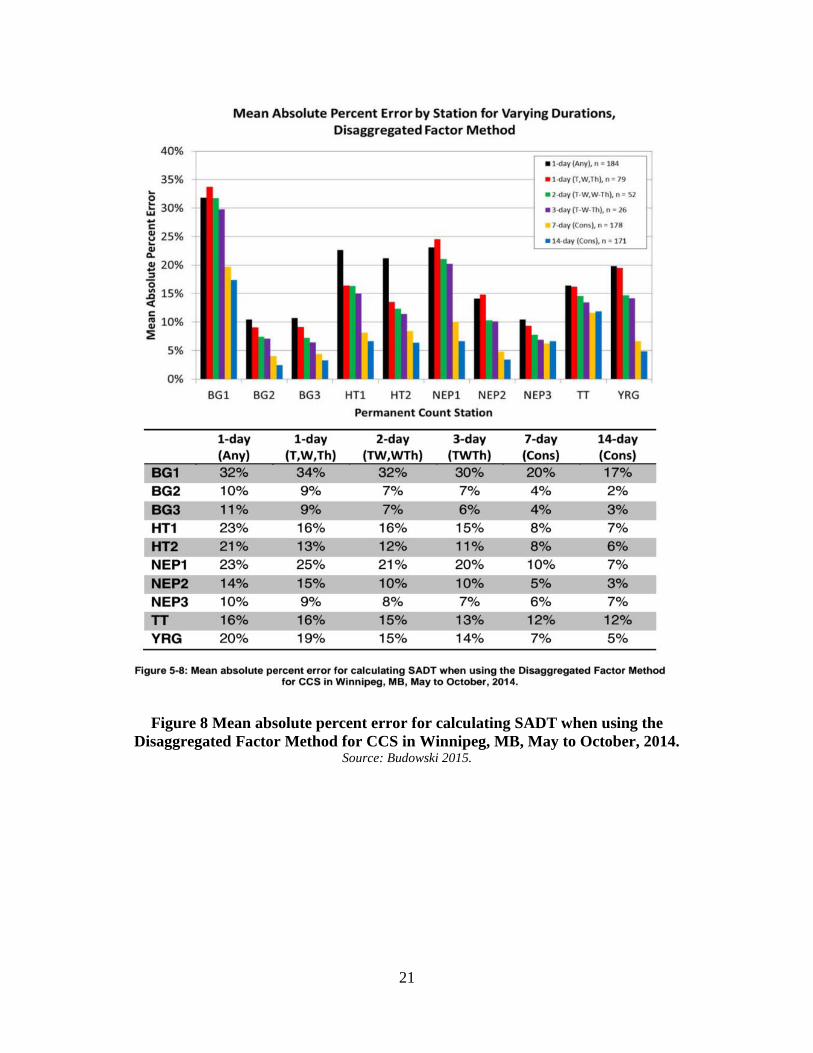
travel patterns (Figure 7). The study also confirmed the findings from Nordback et al.
(2013) that one week of counts is optimal for short duration counts (7 of 8 study sites with
<10% MAPE) (Figure 8). In addition, the study confirmed the findings of Nosal et al. 2014
20
and Hankey et al. 2014 that day-of-year factors yield lower AADNT estimation error than
monthly and daily factors.
Figure 7 Hatched markings indicate the best times to start a 2-hour short duration count using data collected in Winnipeg, MB.
Source: Budowski 2015.
21
Figure 8 Mean absolute percent error for calculating SADT when using the Disaggregated Factor Method for CCS in Winnipeg, MB, May to October, 2014.
Source: Budowski 2015.
22
Continuous
In contrast to short duration counts, continuous counts are collected year-round and
are thus not affected by seasonality, unusual weather patterns, or special events. Although
automated counts (temporary or permanent) are not affected by human bias, they may have
significant biases due to occlusion, improper installation, and other systematic errors in
relation to the site, traffic flow, and specific technology used (Ryus et al. 2014).
Data gaps may occur due to reconstruction, road closures, or equipment
malfunction (Voyt 2015). A jurisdiction must establish a guideline for how much missing
data compromises the data quality where it cannot be used without acceptable error (e.g.,
data is required from all 12 months to avoid seasonal biases). It is common practice to
accept less than a year of daily volumes in calculating daily and monthly factors under the
assumption that the equivalent of one month of missing data will not affect the true value
of AADBT (El Esawey 2014).
Counting Methods
Manual
While manual counts tend to be more reliable than automated counts, they do not
come without inaccuracies (Greene-Roesel et al. 2008). Since manual counts are often
taken by volunteers, they may be subject to counter bias. This bias can be reduced through
training of counters and careful monitoring of data sheets to identify incomplete data or
potential errors due to misunderstanding instructions or fatigue (Jones et al. 2010). Another
method to improve accuracy of manual counts is to reduce the number of characteristics
being recorded by the observer (Diogenes et al. 2007, Greene-Roesel et al. 2008).
23
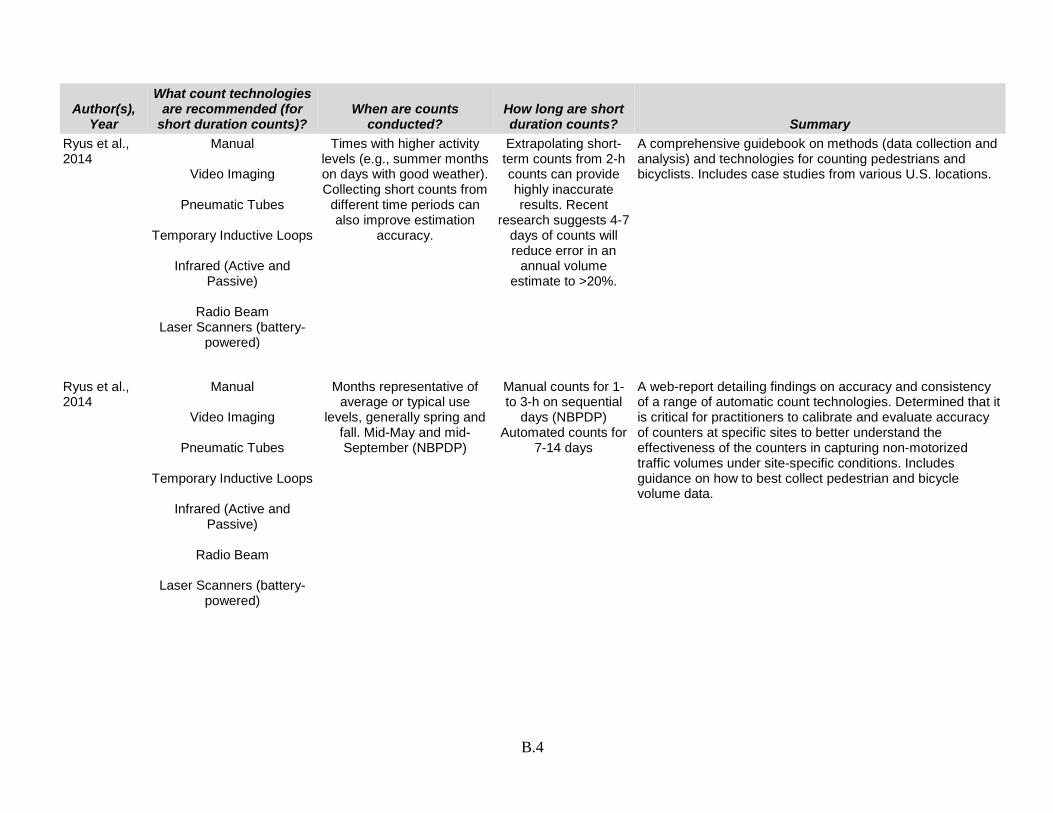
Ryus et al. (2014, 67-68) conducted a thorough literature review of pedestrian and
bicycle data collection methods and technologies. In this review, the authors reported that
accuracy for manual counts is highly dependent on the data collection behavior, which
improves with training and decreases with count duration. Manual counts through
smartphone applications have yet to be rigorously tested for accuracy. Manual counts using
counting devices have different accuracy concerns depending on the different counters.
Diogenes et al. (2007) found that while video technology may be the most accurate
manual count method, it is also the most expensive method given the need for specific
technology and time to manually code each hour of video.
Automated
Research on accuracy and error estimation of various automated technologies are
reviewed in recent research by Ryus et al. (2014), Hyde-Wright et al. (2014), Brosnan et
al. (2015), Griffin et al. (2014), Nordback et al. (2013), Nosal et al. (2014), Hankey et al.
(2014), and Hjelkrem & Giaever (2009).
Visual recognition software is an emerging automated technology that may be
promising in the future, although more research is needed to investigate error and accuracy.
Again, this type of video technology is expensive. While it is generally possible to calibrate
the technology to accurately count bicycles and pedestrians at a specific site, some have
found it difficult to move and re-calibrate equipment at multiple count locations.
Turner and Lasley (2013) discussed quality assurance principles and applications
for reviewing counts from automated counters, including three key principles:
1. Quality assurance begins before you start collecting data
2. “Acceptable” data quality is determined by its use
24
3. Different data quality measures quantify different quality dimensions
The researchers recommended the creation of uniform accuracy evaluation
procedures for pedestrian and bicycle counters and the adaptation of automated validity
criteria that is specific to non-motorized traffic (similar to that already present in motorized
traffic databases). Additionally, targeted visual review by trained staff is very valuable in
assessing the quality of suspect data that might have passed through the automated quality
checks unnoticed.
SHORT DURATION COUNT TYPES
Manual counting programs, which are often collected at intersections, are by far the
most common. NCHRP 797 reports that of those agencies surveyed who count pedestrians,
93% do so manually and of those who count bicycles, 87% do so manually (Ryus et al.
2014). For this reason, optimizing and providing specific guidance for such programs is
needed and would lead to higher quality data.
For motor vehicles short duration counts are collected on Tuesday, Wednesday, and
Thursdays for 48 hours (FHWA 2013). Previous studies have found that 1 week of short
duration bicycle counts is a good time frame for counting bicycling because there is not
much reduction in error for longer count periods and having at least a week allows data
users to see the travel patterns by day of week and by hour of the day (Nordback et al.
2013, Nosal et al. 2014, Hankey et al. 2014). While Nordback identified that AADBT
estimation error could be lower than 20% with only three hours of count data if the data
was collected in a month with low variability and high volume, further research is needed
25
to understand if that applies to other data sets and to investigate which hours are most
advantageous for reducing AADBT estimation for which travel patterns. Further, what are
the most accurate months and days on which to count? How can a manual count program
minimize AADNT estimation error and how much error is expected even with the optimal
approach? These questions are addressed in this study.
State of the Practice
To better understand the state of practice for bike and pedestrian counting, the
research team conducted a review of practice literature for guidance and interviewed
practitioners in communities throughout Washington State and Portland. For the
interviews, the extent of bike and pedestrian counting programs ranged from limited and
short-term to extensive, continuous counting.
Practice Guidance
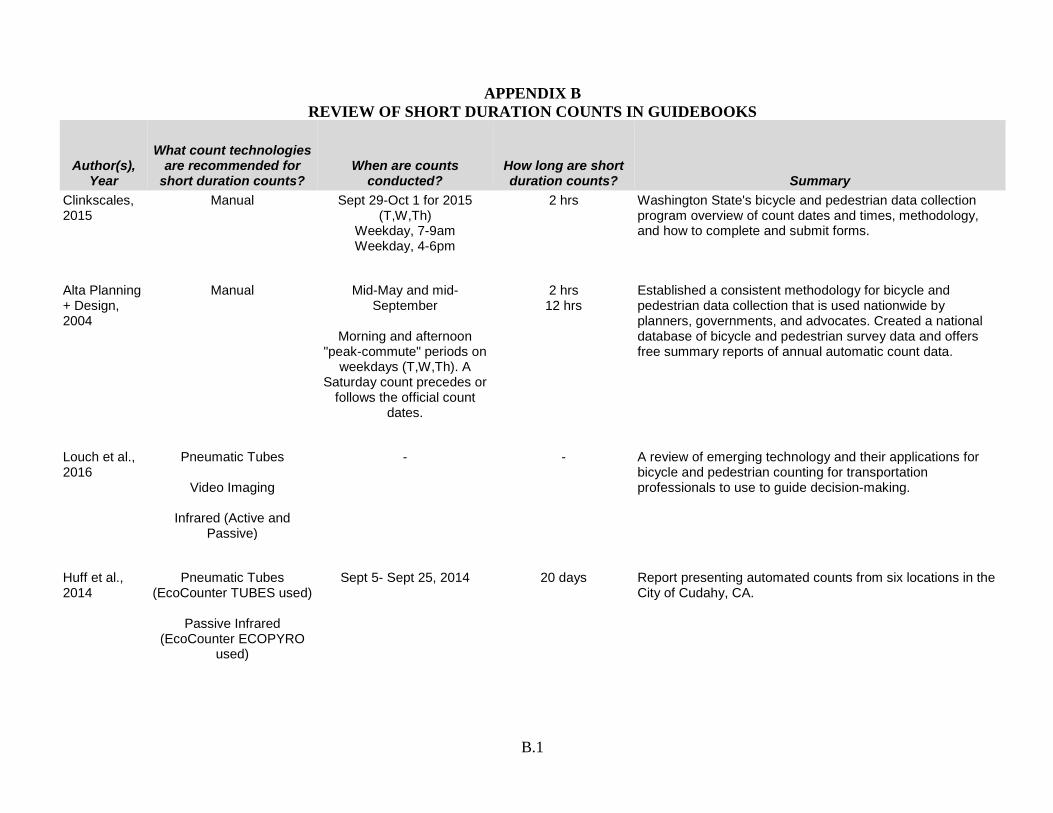
Guidebooks on bike and pedestrian counting are helpful in determining what
practices are recommended for and commonly used by agencies and organizations for short
duration count programs. The guidebooks reviewed provided some guidance on what
counting technologies are recommended for short duration counts, and the timing and
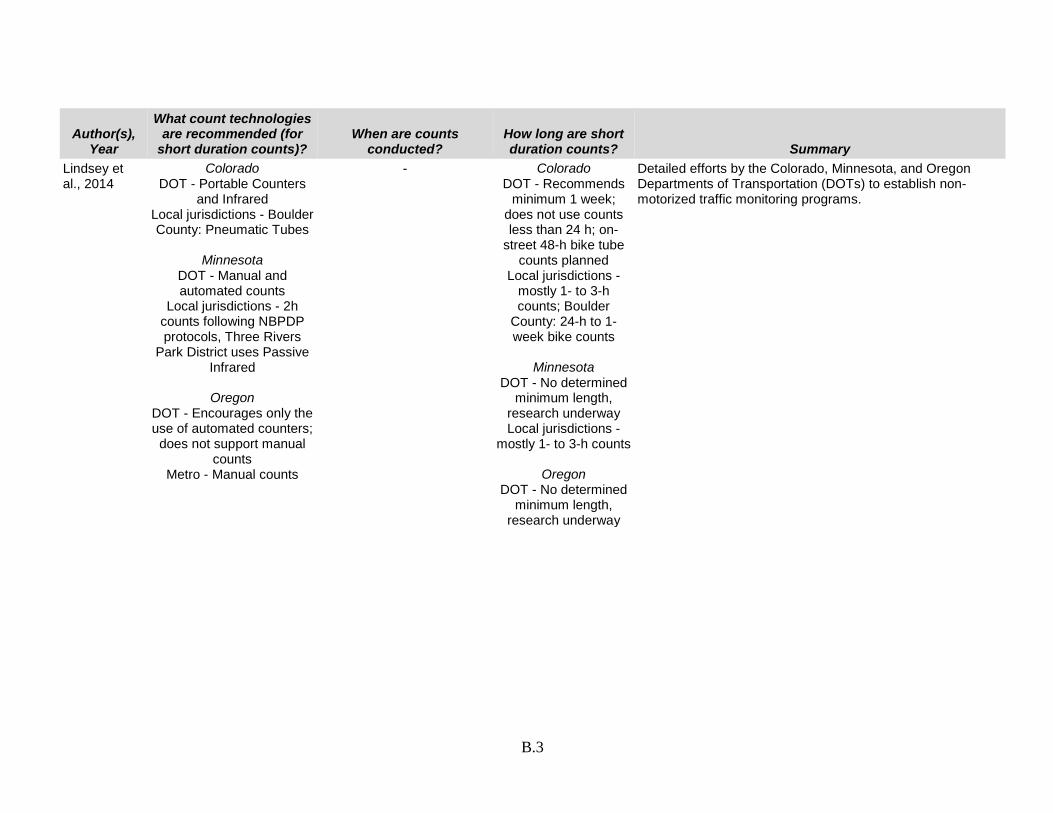
length of the count timeframe for short duration counts (Appendix B). Most of the literature
recommends manual counts, pneumatic tubes, and active and passive infrared counting
technologies. Additionally, most of the guidance literature agreed that generally spring and
fall months were preferable because of higher, more consistent activity levels. Ryus et al.
(2014) found that collecting short duration counts from different time periods may also be
helpful in improving estimation accuracy when extrapolating AADNT using these data. In
26
terms of the time length for short duration counts, 1- to 3-h counts are most common for
manual counts (e.g., counts conducted by local jurisdictions in Colorado and Minnesota)
and a minimum of 1-2 weeks for automated counts (e.g., Colorado DOT counts). Still,
some agencies have yet to determine a minimum recommended length for short duration
counts, but have research efforts underway to answer this question (e.g., Minnesota DOT
and Oregon DOT)(Lindsey et al. 2014).
For the Washington State Bicycle and Pedestrian Documentation Project
(WSDPDP), volunteers collect manual counts in late September or early October, which
coincides with peak periods for walking and bicycle for work and school-related trips in
Washington State. The counts are conducted on Tuesday, Wednesday, and Thursday
during both the morning (7-9AM) and afternoon (4-6PM) peak travel times. These peak
periods were selected because they typically have the highest volumes of pedestrian and
bicycling use (Clinkscales 2015). In order to reduce the chance of weather-bias and offer
scheduling flexibility, volunteers can choose to collect counts at each location on one of
the three days and the morning and afternoon counts can occur on different days. While
the NBPDP recommends Saturday counts, the WSBPDP does not currently collect these
data.
The NBPDP recommends 2-hour manual counts conducted in mid-May and mid-
September during the morning and afternoon peak-commute periods on consecutive
weekdays (Tuesday, Wednesday, Thursday). A Saturday count typically precedes or
follows the official count dates. If resources are limited, the afternoon peak on a weekday
in mid-September is the preferred time to count. Twelve hour counts are also suggested for
both a weekday and a Saturday from 7AM-7PM.
27
In a guidebook recently developed for the Utah Department of Transportation,
Burbidge & Marriott (2016) recommended that if resources are limited and counts can only
be conducted once per year that it is best to do so in mid-September to align with the
NBPDP counts. The guidebook provided guidance on when to count on weekdays and
weekends for peak-hour counts and 12-hour counts. Weekday peak-hour counts should be
conducted from 7-9AM and 4-6PM on consecutive weekdays (Tuesday, Wednesday,
Thursday). Weekday 12-hour counts should occur from 7AM-7PM, choosing one weekday
and breaking the duration into shifts to avoid fatigue. For weekends, peak-hour counts on
Saturday from 10AM-2PM and 12-hour counts on Saturday from 7AM-7PM are suggested.
At a minimum, count durations on weekdays should be 2 hours and 3 hours on weekends.
Agencies in Seattle, Portland, and Victoria, BC also choose to count during the
afternoon peak travel times on weekdays (Tuesday, Wednesday, Thursday) following the
NBPDP methodology (Table 3). Seattle Department of Transportation (SDOT) has
conducted counts quarterly and is the only agency to conduct 2-hour counts during the off-
peak from 10AM-noon on weekdays. Portland Bureau of Transportation (PBOT) employs
volunteers to count from June through September on good weather days, mid-week
(Tuesday, Wednesday, Thursday) either during the morning (7-9AM) or afternoon (4-
6PM) peak times. Similarly for trail counts in the Portland Metro area, volunteers are
directed to conduct counts during the afternoon peak from 5-7PM on a weekday (Tuesday,
Wednesday, Thursday) or on Saturday from 9-11am. In Victoria, BC, the Capitol Regional
District also conducts quarterly counts during weekday morning (7-9AM) and afternoon
(3-6PM) peak travel times.
28
Table 3 Recommended Times and Days for Conducting Short Duration Counts
Jurisdiction or Organization Time DOW
Month(s) or Season(s) Conducted
Washington State National Bike and Pedestrian Documentation Project [WSDOT, Cascade Bicycle Club]
7-9AM 4-6PM
T,W,Th Sept 29-Oct 1 for 2015
National Bicycle and Pedestrian Documentation Project (NBPDP) [Alta Planning and Design, Institute of Transportation Engineers (ITE) Pedestrian and Bicycle Council]
5-7PM Weekday (Choose one T,W,Th)
Mid-May and mid-Sept May 16-22 and Sept 13-18 for 2016
12-2PM Saturday
7AM-7PM Weekday (Choose one T,W,Th)
7AM-7PM Saturday
Seattle, WA Manual Count Program [Seattle Department of Transportation (SDOT), NBPDP]
10AM-noon (off-peak)
Weekday (Choose one T,W,Th)
Jan, May, July, Sept
5-7PM Weekday (Choose one T,W,Th)
12-2PM Saturday
Portland, OR Manual Bike Counts [Portland Bureau of Transportation (PBOT)]
4-6PM Weekday (Choose one T,W,Th)
June-Sept, excluding week of 4th of July
7-9AM Weekday (Choose one T,W,Th)
Portland, OR Trail Counts [Metro, PBOT, NBPDP]
5-7PM Weekday (Choose one T,W,Th)
Mid-Sept Sept 15-20 for 2015
9-11AM Saturday or Sunday
Vancouver, BC Pedestrian Volume and Opinion Survey [City of Vancouver]
10AM-6PM, excluding 2-3PM
Weekdays May-early June and Sept-Oct for 2013
Victoria, BC Regional Cycling Counts [Capitol Regional District, NBPDP]
7-9AM Weekday (Choose one T,W,Th)
Jan, May, July, Oct
3-6PM Weekday (Choose one T,W,Th)
Note: Bold indicates preferred times.
29
Jurisdiction or Organization Time DOW Month(s) or Season(s) Conducted
Utah [Active Planning, Utah Department of Transportation]
7-9AM Consecutive weekdays (T,W,Th)
Spring and Fall. If resources are limited and can only count once per year, do so in mid-Sept to coincide with NBPDP guidance.
4-6PM Consecutive weekdays (T,W,Th)
7AM-7PM Weekday (Choose one T,W,Th)
10AM-2PM Saturday
7AM-7PM Saturday
Minnesota [Minneapolis Department of Public Works, Transit for Livable Communities, NBPDP, Minnesota Department of Natural Resources (DNR), the Metropolitan Council, the Three Rivers Park District, and the Minneapolis Park and Recreation Board]
4-6PM Weekday (Choose one T,W,Th)
Early to mid-Sept
- Saturday
Other times important locally
Other days important locally
Note: Bold indicates preferred times.
The majority of jurisdictions reviewed in Table 4 agree that 2-hour counts should
be conducted on weekday afternoon peak times (Tuesday, Wednesday, Thursday),
although some choose to count from 4-6PM and others from 5-7PM. Four of the
jurisdictions also suggested counting on weekdays during the morning peak travel times
from 7-9AM (Tuesday, Wednesday, Thursday). Five of the nine jurisdictions suggest
counting on Saturday either midday from 12-2PM (NBPDP; SDOT), during the morning
peak from 9-11AM (Portland, OR Trail Counts), or from 10AM-2PM (Utah DOT).
Overall, September is the most commonly suggested month for conducting counts amongst
the reviewed jurisdictions, followed by May and June.
30
Washington
In Washington, municipality transportation planners and engineers, parks and
recreation departments, and non-profits were contacted to ensure that every organization
that may be involved in counting programs was reached out to (See Appendix C for
complete contact list). People in 10 communities were interviewed following this project’s
questionnaire (Appendix D) to understand the state of the practice in bicycle and pedestrian
counting. Bicycle and pedestrian counting programs range from temporary short-term,
mid-term, and seasonal, to permanent continuous counting. For example, the City of
Olympia has been conducting mid-term counts since 2008, three times a year for seven
days. They have accrued extensive data and have found the value in counting. The City of
Redmond has an extensive seasonal counting program. They installed 18 temporary
counters that operated from March-June 2015. The City of Tacoma has three permanent,
continuous counters where they have been collecting data since January 2015. The City of
Seattle operated 10 permanent, continuous counters, with one installed as early as 2009.
Finally, looking into the future, the City of Bellevue is in the process of securing funding
to install 27 permanent, continuous counters over the next two years. For further
information, see Table 4 below.
Communities throughout Washington are eager to conduct bicycle and pedestrian
counts. However, not all have the funding or resources to do so. WSDOT has been able to
fill this void and support short and long-term bicycle and pedestrian counting in
Washington communities. In 2008, WSDOT created the Washington State Bicycle and
Pedestrian Documentation Project. The inspiration behind this program was a goal set by
the Washington State Bicycle Facilities and Pedestrian Walkways Plan to double the
31
amount of people walking and biking by 2027. One of the key performance metrics to
monitor that goal was bicycle and pedestrian counts. Since 2008, short-term counts are
conducted every year in late September or early October. As of 2012, 38 communities
participate in the program and eight of the 10 communities we interviewed are participating
in the Washington State Bicycle and Pedestrian Documentation Project.
In addition to short-term counting, WSDOT also monitors permanent, continuous
bicycle and pedestrian counters at 15 locations in Washington. These counters are located
several cities, including Bainbridge Island, Bellevue, East Wenatchee, Olympia, Redmond,
Seattle, and Spokane. WSDOT uses Eco-Counter counting equipment, with passive
infrared, inductive loops, or a combination of both technologies. These counters have been
installed from 2011-2016.
32
Table 4 Overview of Bike and Pedestrian Count Programs in Washington as of 2016
City Count Types
Short Duration Continuous
Notes for Count Programs Notes on Accuracy
Participates in
WSNBPDP
# of Non- WSDOT
Counters
# of WSDOT
Counters Bellevue Short
Continuous Y 0 2 Securing funding
to install 27 permanent counters over the next two years.
*
Bellingham Short Y 0 Pending Working with Washington Bikes and WSDOT to install permanent counters within the next year.
N/A
Mount Vernon
Short Y 8 0 Had permanent counters in seven locations for eight years along trails in Mt. Vernon. However, permanent counting ended in 2013.
None given
Olympia Short Mid Continuous
Y 0 1 Mid-term counting since 2008. Conducted three times a year for seven days.
*
Redmond Short Seasonal Continuous
Y 0 1 Installed seasonal counters at 19 locations to count from March-June 2015.
Note: there are gaps in the data due to monitor memory maxing out and some false counts due to vegetation breaking the infrared beam.. - David Shaw *
Richland N/A N 0 0 No bicycle or pedestrian count program
N/A
Seattle Short Continuous
Y 10 2 City of Seattle operates counters that were installed 2009-2016.
None given
33
Short
Duration Continuous
City Count Types
Participates in
WSNBPDP
# of Non- WSDOT
Counters
# of WSDOT Counters
Notes for Count Programs Notes on Accuracy
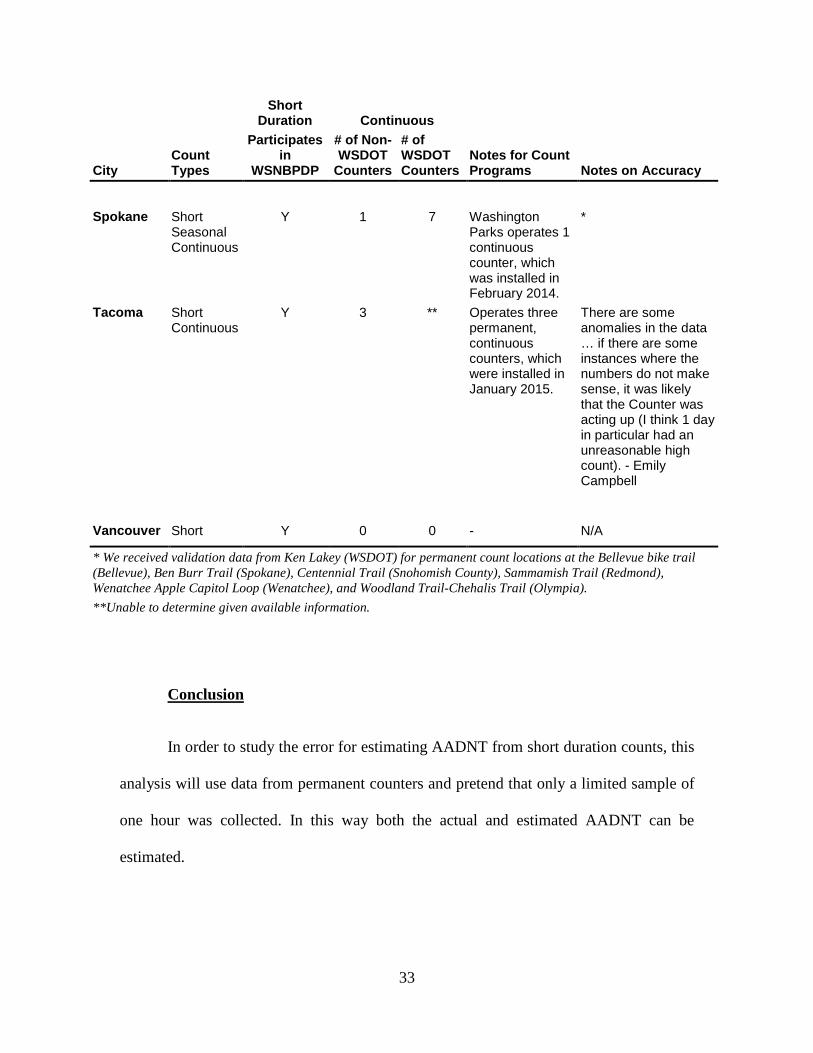
Spokane Short Seasonal Continuous
Y 1 7 Washington Parks operates 1 continuous counter, which was installed in February 2014.
*
Tacoma Short Continuous
Y 3 ** Operates three permanent, continuous counters, which were installed in January 2015.
There are some anomalies in the data … if there are some instances where the numbers do not make sense, it was likely that the Counter was acting up (I think 1 day in particular had an unreasonable high count). - Emily Campbell
Vancouver Short Y 0 0 - N/A
* We received validation data from Ken Lakey (WSDOT) for permanent count locations at the Bellevue bike trail (Bellevue), Ben Burr Trail (Spokane), Centennial Trail (Snohomish County), Sammamish Trail (Redmond), Wenatchee Apple Capitol Loop (Wenatchee), and Woodland Trail-Chehalis Trail (Olympia). **Unable to determine given available information.
Conclusion
In order to study the error for estimating AADNT from short duration counts, this
analysis will use data from permanent counters and pretend that only a limited sample of
one hour was collected. In this way both the actual and estimated AADNT can be
estimated.
34
DATA DESCRIPTION
To study error for WSDOT specifically, continuous count data from the state of
Washington was desired. Since that was limited as documented in Table 5, data from the
the nearby city of Portland, Oregon was also included. A parallel FHWA project was also
being conducted by the project team on a similar research question looking at data from
three additional cities: Arlington, Virginia; San Diego, California; and Boulder,
Colorado. Since these data were already formatted and prepared for study little additional
work was required to include them in the study. Thus, this analysis includes data from 6
cities and 146 stations, a more extensive dataset than any previous analysis of non-
motorized traffic data of this type.
Continuous count data were obtained from Arlington, Boulder, Mt. Vernon,
Portland, San Diego, and Seattle from 2002 to 2016. To determine actual AADNT for a
given year for a given site, at least one full 24-hours of count data representing each day-
of-the-week in every month were needed. From this data set, 146 locations had sufficient
data for the analysis, totaling 1,461,604 hourly observations. A data summary is
presented in Table 5.
35
Table 5 Summary of Available Data
Community Time Period Type of Counters
Number of Sites Counted Total # of Sites
Bikes Only
Peds Only
Bike-Ped Combined
Arlington, VA 2012-2016 Passive infrared and inductive loop combination
18 11 - 29
Boulder, CO 2002, 2004, 2007-2008, 2010-2012, 2016
Inductive loops 17 - - 17
Mt. Vernon, WA
2009-2011 Passive infrared - - 6 6
Portland, OR 2009-2015 Passive infrared, inductive loops, pneumatic tubes
9 8 15 32
San Diego, CA 2013-2016 Passive infrared and inductive loop combination
33 13 - 46
Seattle, WA 2014-2016 Passive infrared and inductive loop combination, pneumatic tubes
9 7 - 16
Total
86 21 39 146
Note: “–“ denotes no data of a given type.
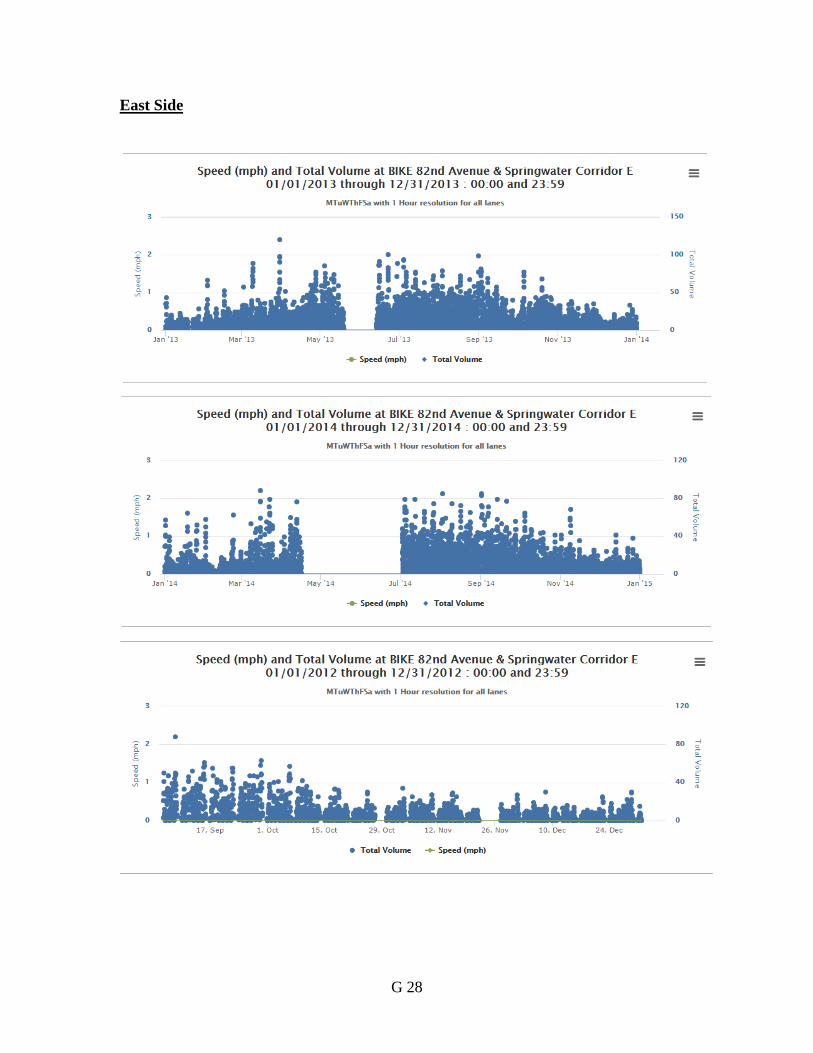
SEATTLE, WA
The Seattle data was provided by Washington State Department of Transportation
(WSDOT) and the Seattle Department of Transportation (SDOT).
Location and Facility Type
WSDOT has two counters in Seattle located at the University of Washington
Transit Center (North and South), which were installed in February and March 2016.
36
SDOT maintains 12 counters, which are located on multi-use trails, protected bike lanes,
neighborhood greenways, the Fremont Bridge and SW Spokane Street.
Table 6 Seattle Bicycle and Pedestrian Continuous Count Locations
Facility Type Facility Name Mode
Multi-Use Trails Elliott Bay Trail in Myrtle Edward Park Bicycles and pedestrians separately
Burke-Gilman Trail north of NE 70th St. Bicycles and pedestrians separately
Chief Seattle Trail north of S Thistle St. Bicycles and pedestrians separately
Mountains to the Sound Trail west of the I-90 floating bridge
Bicycles and pedestrians separately
Protected Bike Lanes Broadway between Pike St. and Union St. Bicycles only
2nd Ave. south of Madison Bicycles only
Linden Ave. N south of N 135th St. Bicycles only
Neighborhood Greenways 26th Ave. Southwest at SW Oregon St. in Delridge
Bicycles only
39th Ave. Northeast at NE 62nd St. in Wedgewood
Bicycles only
NW 58th St. at 22nd Ave. Northwest in Ballard
Bicycles only
Bridges Fremont Bridge Bicycles only
SW Spokane St. Bridge Bicycles only
Source: Author’s analysis of Seattle Department of Transportation information
37
Table 7 Seattle Count Sites Used in Analysis by Mode and AADNT
Both SDOT and WSDOT utilize Eco-Counter technologies for collecting data in
Seattle. WSDOT uses the Urban MULTI counter, which differentiates between
pedestrians and bicyclists using a combination of passive infrared (PYRO model) and an
inductive loop (ZELT model).
SDOT collects non-motorized traffic counts using inductive loops, infrared, and
pneumatic tubes. SDOT uses pneumatic tubes along three neighborhood greenways to
39
count bicycles bi-directionally. At two locations with protected bike lanes, SDOT
continuously counts bikes bi-directionally using pneumatic tubes. On multi-use trails,
SDOT counts a mix of bicycles and pedestrians using inductive loops and infrared
counters. These counters collect bi-directional traffic data for bicycles and pedestrians at
four locations. At the Fremont Bridge and SW Spokane Street, Eco-Totem counters are
used to count bicyclists, which combine inductive loops (ZELT) with a totem display.
The funding and installation of these counters were supported by SDOT and the Cascade
Bicycle Club.
Figure 10 UW Transit Center Urban MULTI. Source: WSDOT
40
Figure 11 Fremont Bridge Eco-Totem Source: SDOT
Time Period
Data was provided from 2013 to 2016. The data from automated feeds updates at
5am every morning to Eco-Counter’s website to allow for the continuous data to be
accessible to the present day.
Specific Quality Control Issues
The accuracy of the detectors in Seattle have not been confirmed by SDOT or
WSDOT and neither agency has provided accuracy adjustment factors. The data was
quality checked for unusual patterns, spikes, zeroes, and unusually low counts using
graphs of the total daily volume over time.
41
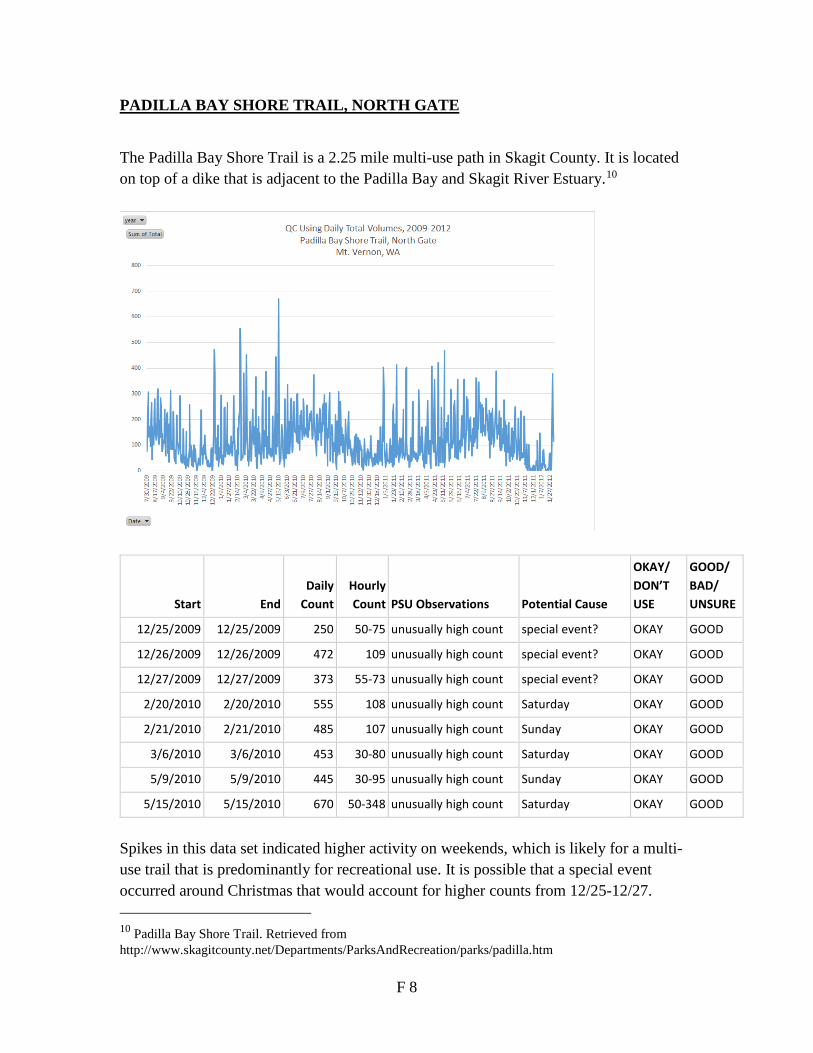
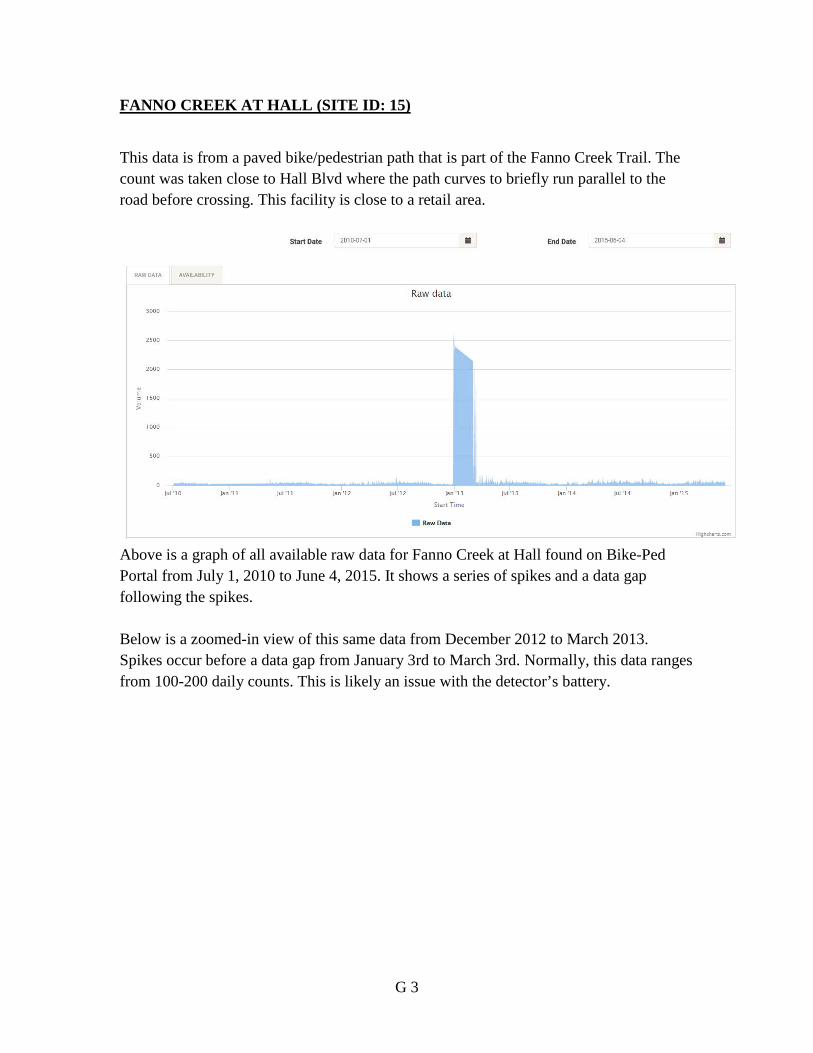
MT. VERNON AND SKAGIT COUNTY, WA
From 2008-2012, Skagit Healthy Communities collected continuous count data
from 13 sites in Mount Vernon and Skagit County. This data was provided in per vehicle
format, which includes a timestamp and direction for each pedestrian, bicyclist, or other
warm body which enters the detection zone. The data was processed in Excel by binning
the counts by hour and combining both flow directions. There is no evidence to suggest
that these data are reliable by direction. There was no documentation of counter
validation or testing.
Location and Facility Type
Ten count sites had continuous count data for a full calendar year. Nine of the
sites were located on multi-use trails and one site was located on a shared sidewalk on the
Berentson Bridge adjacent to SR-20.
42
Table 8 Mt. Vernon Count Sites, 2008-2012
Facility Name Available Data Range
Berentson (Swinomish) Bridge Kulshan Creek Trail (18th St West Side) Kulshan Creek Trail (by the middle school) Maddox Creek Padilla Bay Shore Trail (South Gate) Padilla Bay Shore Trail (North Gate) Port of Skagit Trail (Crosswinds Drive) Port of Skagit Trail (Higgins Airport and Ovenell) Port of Skagit Trail (Josh Wilson and HAR PORT) Port of Skagit Trail (Ovenell Rd and FTM PO) Skagit Playfields (Martin Road West) Skagit Playfields (Martin Road East) Trumpeter Trail (Off Division)
Note: All Mt. Vernon sites recorded bicycle-pedestrian combined counts.
Equipment Type
The Scanner, a passive infrared counter manufactured by JAMAR Technologies,
was used to collect counts for these 13 sites. This is an older model that JAMAR no
longer sells that can either display a total volume or provide timestamped per vehicle
data.
43
Time Period
The data provided was available from January 2008 to May 2012.
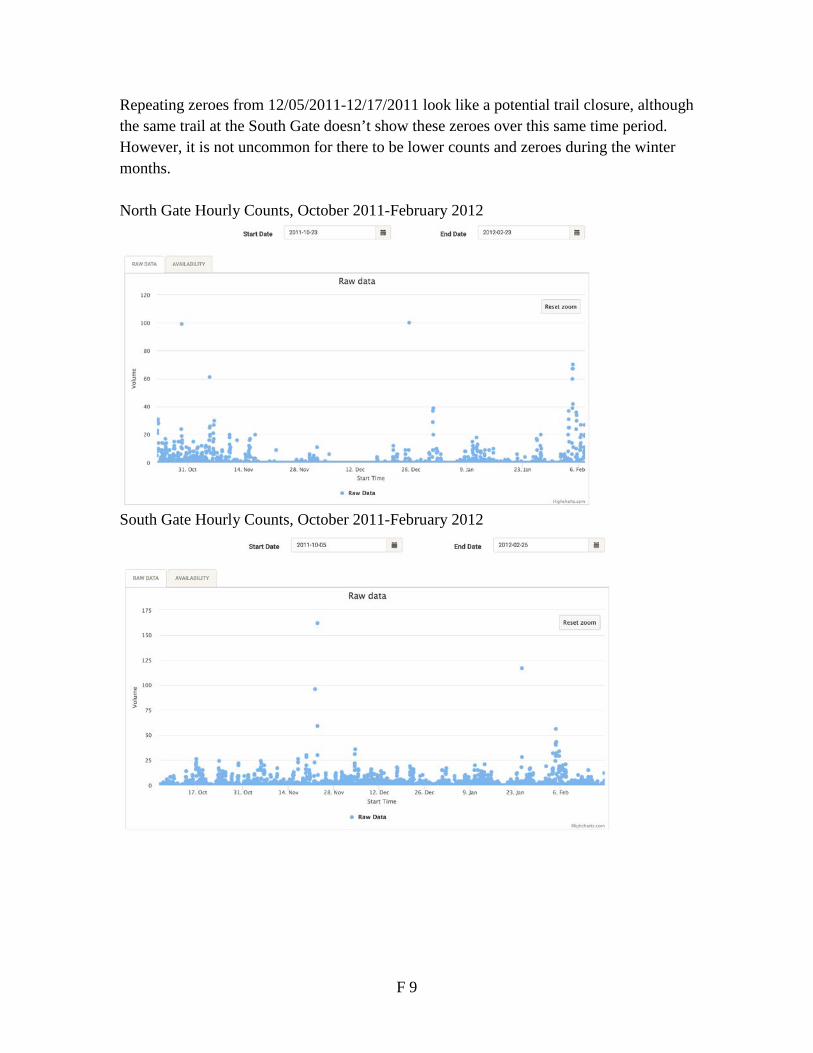
Specific Quality Control Issues
According to email correspondence with the manufacturer, The Scanner does not
automatically adjust the data for Daylight Savings Time (DST). However, The Scanner
user manual indicates that when The Scanner is connected to a computer, it will use the
computer’s date and time automatically, unless this feature is disabled. Therefore, the
shuttle file that includes the switch to DST in early March would still be in Pacific
Standard Time (UTC-8:00), but the following shuttle file would be in Pacific Daylight
Time (UTC-7:00) it would be updated with the computer’s clock during the data upload.
The reverse would happen in early November for the switch back to Pacific Standard
Time. The data was adjusted to indicate the corresponding time zone for every shuttle file
using either (UTC-8:00) or (UTC-7:00) at the end of the date and time stamp.
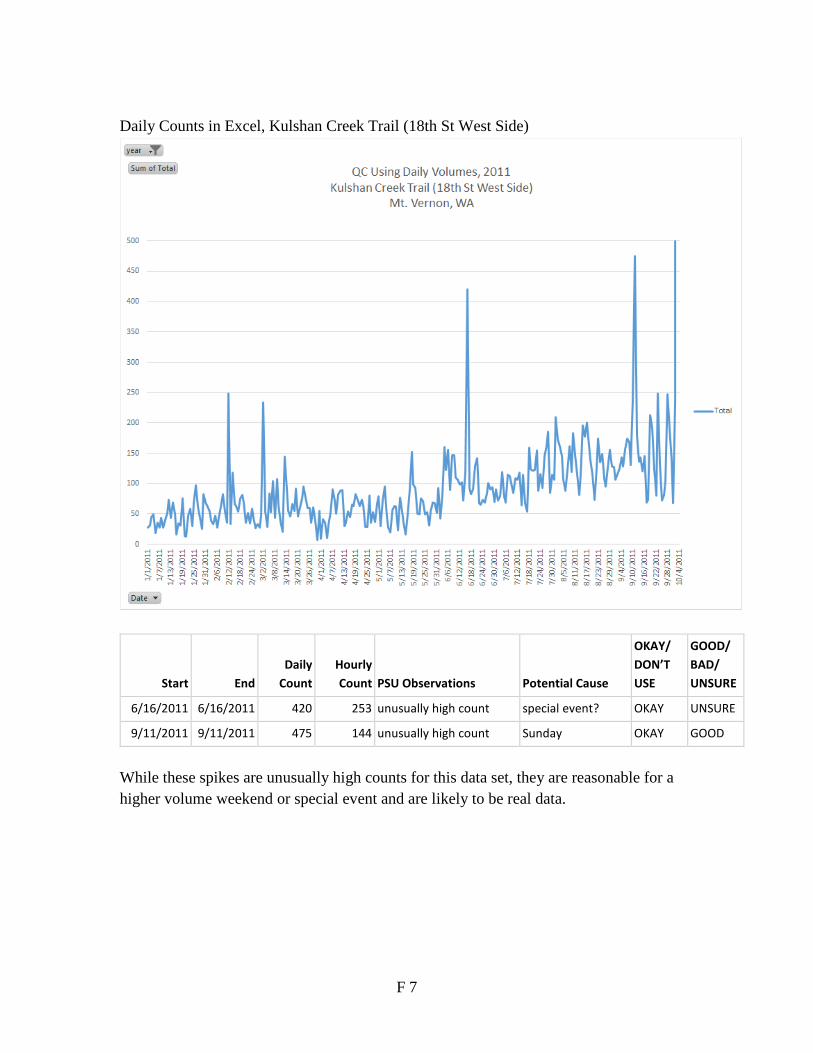
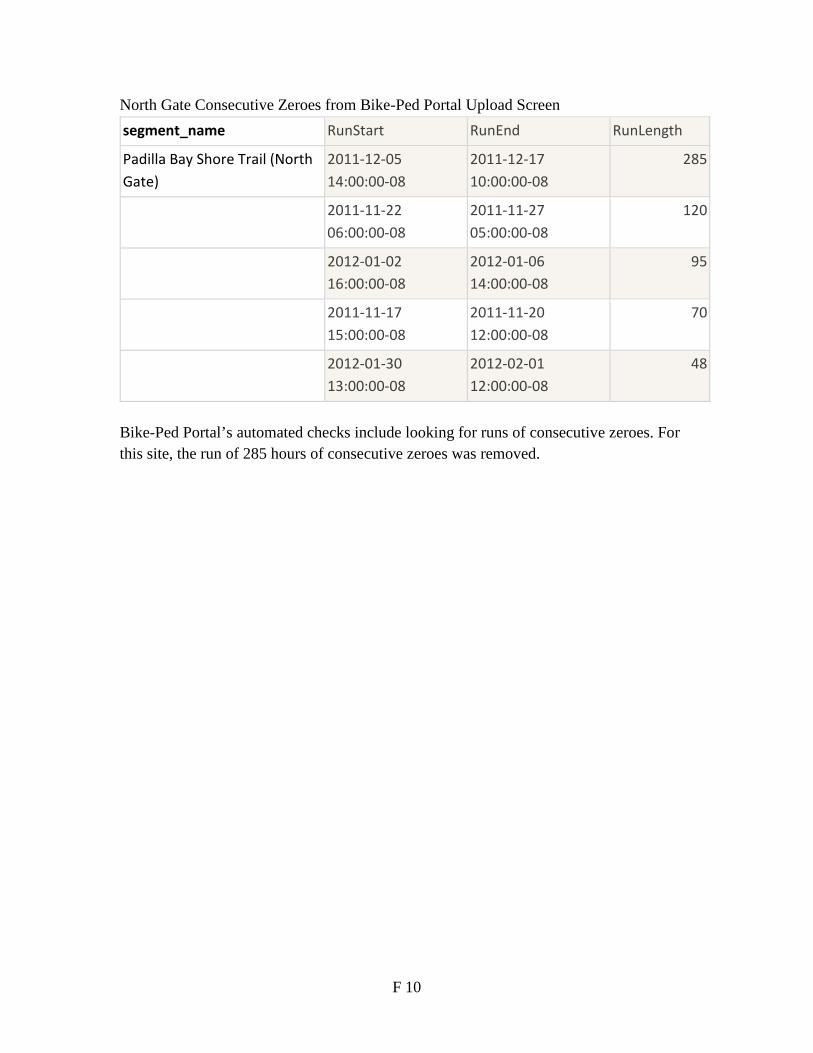
The data was quality checked for unusual patterns, spikes, zeroes, and unusually
low counts using graphs of the total daily volume over time in Excel and the hourly
volumes over time in Bike-Ped Portal (Appendix F). The most common data problems
found were repeating zeroes and unusually high counts, likely from equipment
malfunction.
44
OTHER COMMUNITIES IN WASHINGTON STATE
Location and Facility Type
WSDOT maintains permanent, continuous counters at 15 locations along multi-
use paths throughout Washington State including in Bainbridge Island, Bellevue, East
Wenatchee, Olympia, Redmond, Seattle, and Spokane.
During this project, the research team learned that the City of Tacoma has data for
3 continuous counters for the Flume Line Trail (multi-use trail), Park Avenue at 56th
(shared street), and Wright Park (bike lane). However, of the data provided by the city,
only the Wright Park site had sufficient data to include in the analysis.
Similarly, Washington Parks has continuous data from the Kardong Bridge in
Spokane that the research team was unable to procure for this project. This data was
collected using TRAFx counting equipment starting in February 2014.
For this analysis, a full calendar year of data was needed. Because many of the
continuous counters were recently installed in late 2015 and early 2016, they do not
provide enough data for the analysis, although they did provide long-term data.
45
Table 10 Count Sites in Other Communities in Washington State, 2011-2017
City Facility Name Available Data Range
Bainbridge Island
Bainbridge Island Winslow Way 4/27/2015 - Present
Bellevue Bellevue I-90 Trail Bellevue SR 520 Trail 1
3/3/2015 - Present 3/2/2015 - Present
East Wenatchee
Apple Trail Capitol Loop by Old Wenatchee Bridge
10/15/2015 - Present
Olympia Woodland Trail West 7/28/2015 - Present
Redmond Sammamish River Trail East Sammamish River Trail
6/23/15 - Present 4/5/2016 - Present*
Spokane Ben Burr Trail Altamont Centennial Trail - Kendall Yards Children of the Sun Trail FREYA Children of the Sun Trail Parksmith Kendall Yards EB Kendall Yards WB
*Cannot use for analysis because there is not a full calendar year of data currently available
Table 11 Count Sites in Other Communities in Washington State by Mode and AADNT
Site Mode AADNT
2015 2016 Apple Capitol Loop Trail bicycle 220 Ben Burr Trail Altamont pedestrian 84 Ben Burr Trail Altamont bicycle 13 Centennial Trail - Kendall Yards pedestrian 408 Centennial Trail - Kendall Yards bicycle 231 Children of the Sun Trail-Freya pedestrian 31 Children of the Sun Trail-Freya bicycle 29 Parksmith Total_Children of the Sun Trail pedestrian 13 12 Parksmith Total_Children of the Sun Trail bicycle 30 38 Woodland Trail West bicycle 221
Note: These sites were used in creating factors for the guidebook for Washington State, however, they were not used in the hourly error analysis.
46
Figure 12 Apple Capitol Loop Trail, Old Wenatchee Bridge. Source: WSDOT
Equipment Type
For these count locations, WSDOT uses Eco-Counter software, with passive
infrared, inductive loops, or a combination of both technologies. The City of Tacoma data
was collected using Eco-Counter inductive loops (ZELT).
Time Period
Data from WSDOT was provided from 2011-2016. Automated feeds update the
data to Eco-Counter’s website to allow for the continuous data to be accessible to the
47
present day. Data from the City of Tacoma was provided from January 1, 2015- June 5,
2016 as .csv file downloaded from Eco-Counter.
Specific Quality Control Issues
Validation data from Ken Lakey (WSDOT) is available for permanent count
locations at the Bellevue bike trail (Bellevue), Ben Burr Trail (Spokane), Centennial Trail
(Snohomish County), Sammamish Trail (Redmond), Wenatchee Apple Capitol Loop
(Wenatchee), and Woodland Trail-Chehalis Trail (Olympia).
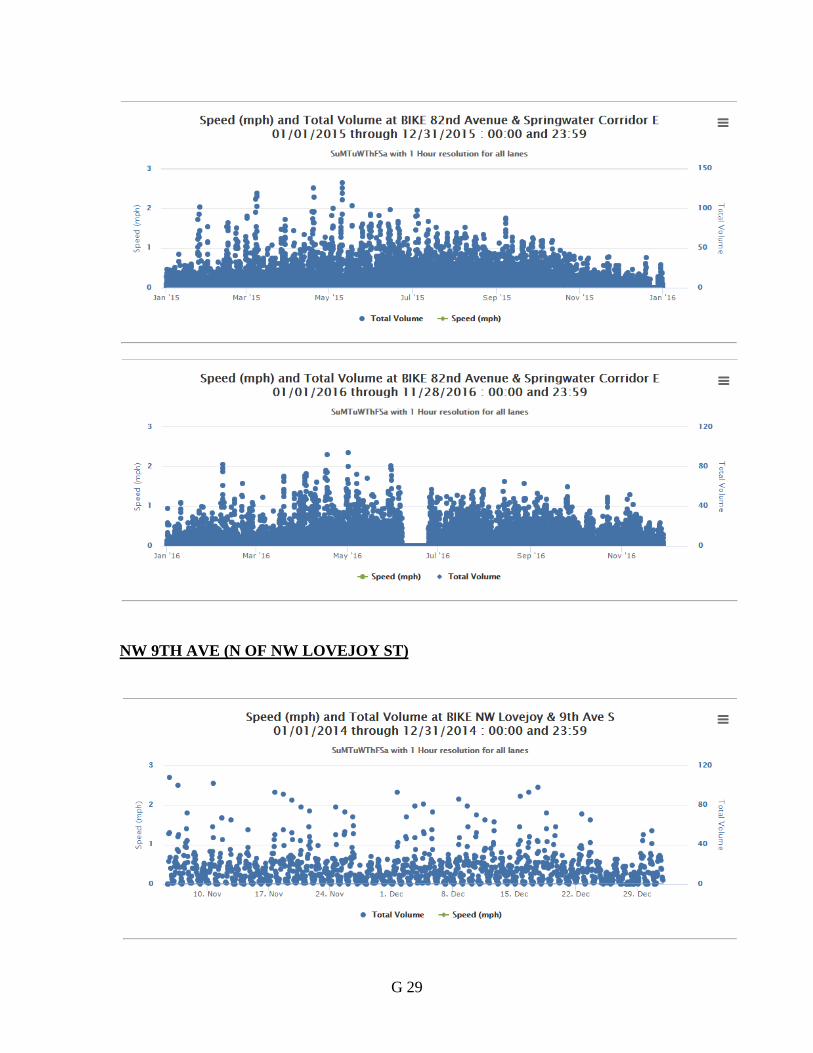
PORTLAND, OR
The Portland data was provided by the Portland Bureau of Transportation
(PBOT), Metro, the regional metropolitan planning agency for Portland, the Oregon
Department of Transportation (ODOT), and TriMet.
Location and Facility Type
Since the early 1990s, PBOT has been collecting non-motorized traffic counts
from locations including the Hawthorne Bridge, the Broadway Bridge, Riverwalk (lower
deck of the Steel Bridge), SW Moody Avenue, and various locations with bike lanes
throughout the city.
The Hawthorne Bridge, the Broadway Bridge, and Riverwalk are separated from
motor vehicle traffic and are shared space for bicyclists and pedestrians. On the
Hawthorne Bridge, painted bicycle and pedestrian emblems on the sidewalk suggest the
space each mode should occupy to prevent conflicts. SW Moody Ave. is a bidirectional
48
separated bike lane at the same grade as the sidewalk for pedestrians, but is grade
separated from motor vehicle traffic. The separated bike lane is painted green and the
bicycle and pedestrian emblems are used differentiate the spaces. PBOT also provided
continuous count data from inductive loops in bike lanes throughout the city from 44
locations, however only about four locations, including NW Lovejoy and 9th Ave., were
of sufficient accuracy to be used for this analysis due to QC concerns. These loops are
largely quadrupole inductive loops used for advance detection of bicycles for the
purposes of signal actuation.
Figure 13 Quadrupole inductive loop in bike lane at NW Lovejoy and 9th Ave. Source: James Lindsey
49
Table 12 Examples of Portland Bicycle and Pedestrian Continuous Count Locations
Facility Type Facility Name Who is Counted
Shared use sidewalk Hawthorne Bridge Bicycles only
Broadway Bridge Bicycles only
Shared use pedestrian- and bicycle-only bridge
Riverwalk Bicycles only
Separated Bike Lane SW Moody Ave. Bicycles only
Bike lane NW Lovejoy and 9th Ave. Bicycles only
Source: Author’s analysis of Portland Bureau of Transportation information
Metro provided data from 64 off-street trails using trail counters that are
maintained by several jurisdictions including Metro, Tualatin Hills Park and Recreation
District, Washington Park TMA, City of Portland, and City of Tualatin.
Portland also has three unique count locations at the Eastbank Esplanade, I-205
multi-use path, and Tilikum Crossing, which are discussed in more detail in this section.
The Eastbank Esplanade is located adjacent to the Willamette River and provides
a scenic bike- and pedestrian-only connection along the east waterfront. The counter at
this location is found just north of the Hawthorne Bridge and is maintained by PBOT.
This counter is the first piezoelectric and infrared combination counter in the west coast
of the U.S. installed in 2016.
50
Figure 14 Piezoelectric and passive infrared combo on the Eastbank Esplanade. Source: Krista Nordback
The I-205 multi-use path was completed in 1982 and extends 16.5 miles from the
Clackamas River in Gladstone to Vancouver, Washington. At its intersection with SE
Yamhill, are two diamond inductive loops maintained by the Oregon Department of
Transportation (ODOT).
51
Figure 15 I-205 multi-use path inductive loops. Source: Krista Nordback
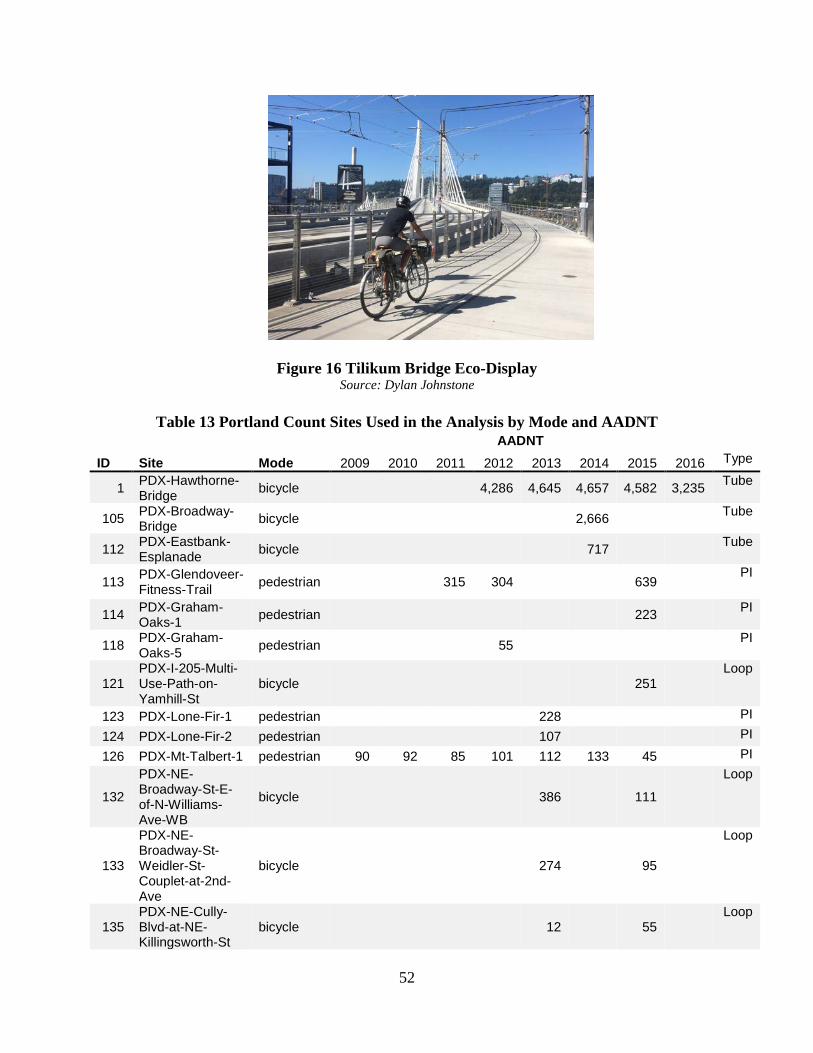
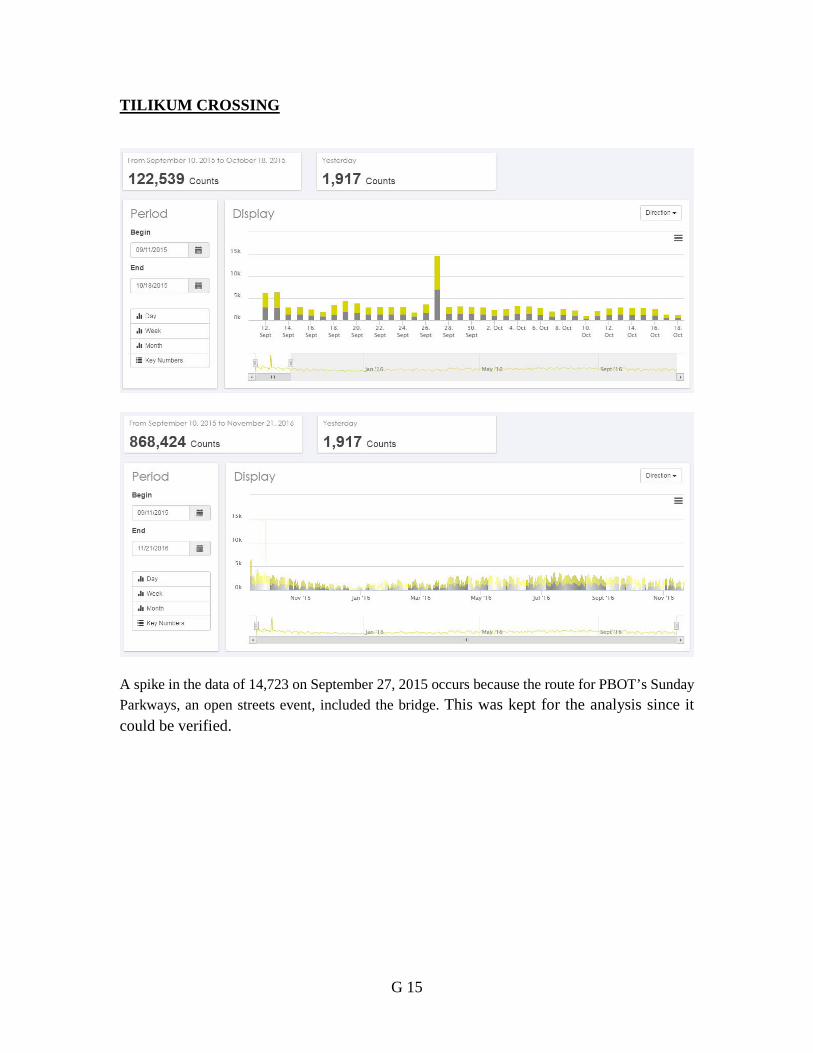
Tilikum Crossing is a bridge that stretches across the Willamette River between
SW and SE Portland that is solely used by transit, bicyclists, and pedestrians. One each
side of the bridge is approximately a 14-foot-wide path that is used by bicyclists and
pedestrians with paint used to separate the different uses.
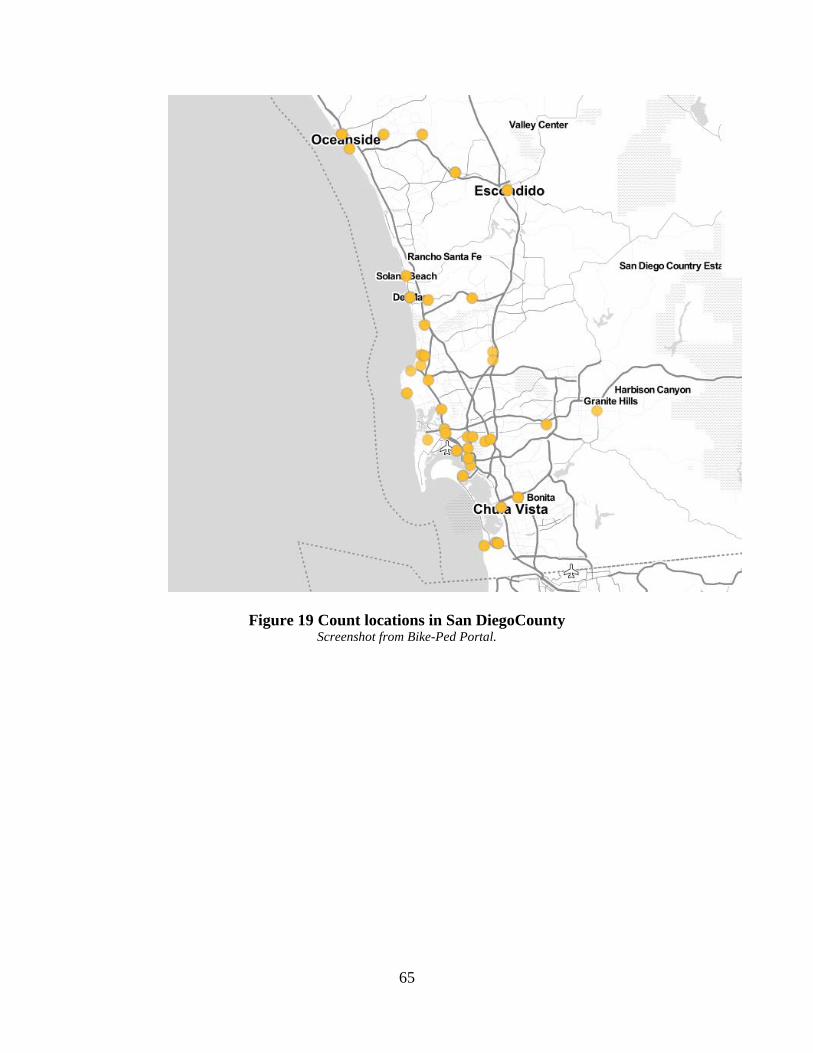
The San Diego data was collected using Eco-Counter passive infrared and
inductive loop counters, including Eco-Multi, Pyro Box, and Zelt, models.
Time Period
Data from Sherry Ryan at San Diego State University was provided from 2013 to
2016.
Specific Quality Control Issues
After review, the researchers found that spikes and repeated zeroes were the most
common issues found with the San Diego data set.
68
ACCURACY OF DATA
Quality control was conducted by the research team to remove inconsistencies in
the data provided by various agencies and organizations. The data were both manually
checked by the research team and checked using an automated code in Bike-Ped Portal
that flagged repeating zeroes, repeating non-zeroes, and high counts. Suspicious data was
excluded from analysis. Due to an oversight, partial count days were included in the
analysis, but since there are few such days in the datasets, the results and findings not
significantly impacted.
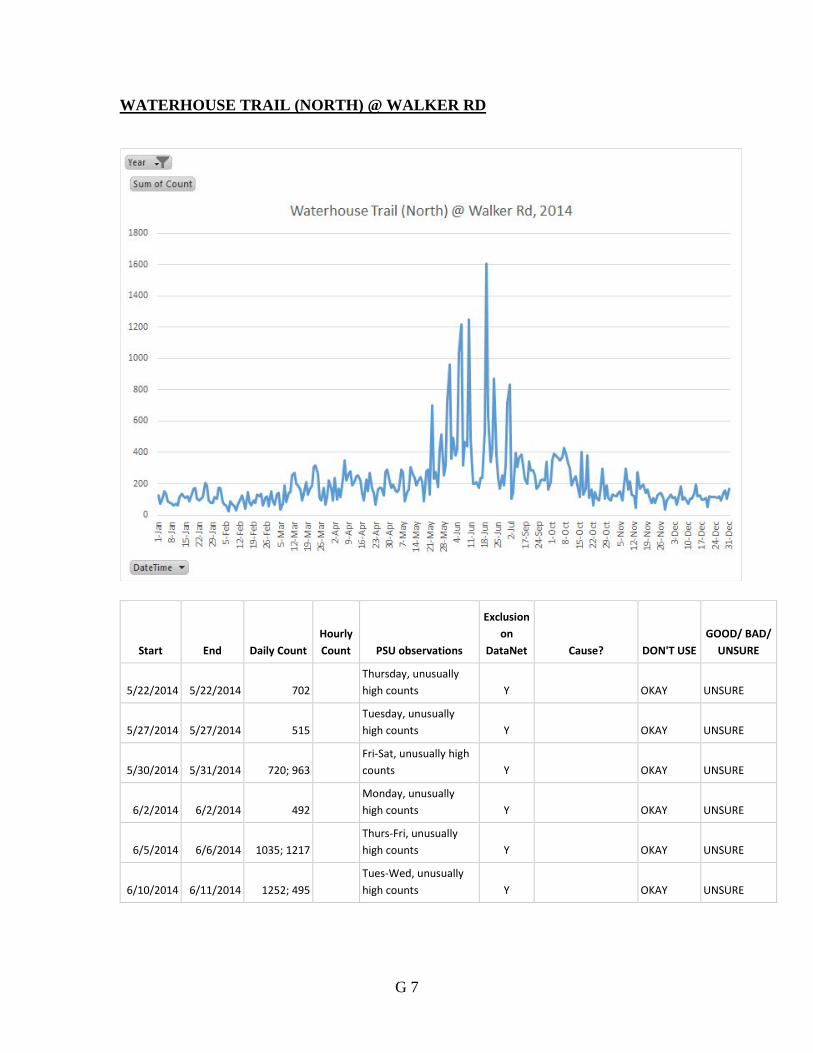
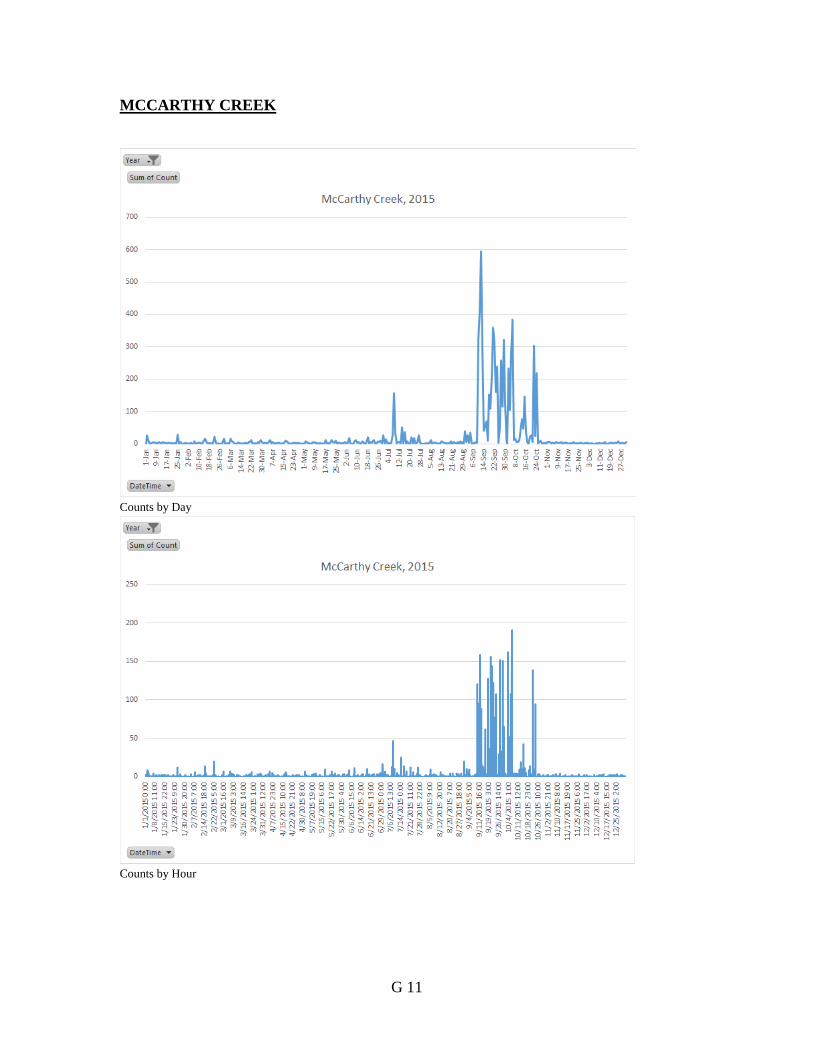
Inconsistencies included unusual patterns (e.g., duplicate data), spikes (e.g.,
detector malfunction with counts >1000 per hour), low counts, and repeating zeroes using
graphs of the total volume over time (Appendices F-G). Unusually low counts and
repeating zeroes where there appeared to be temporary closures to the facility (e.g.,
holidays, snow events) were not removed. Spikes that appeared to be potentially caused
by equipment malfunction, vandalism, or insect or other wildlife activity, were removed
from the analysis. However, spikes that appeared due to special events that genuinely
increased pedestrian or bicycle activity were included.
If counts spiked for just one or a few hours and the counts were below 1,000 per
hour, we considered this an actual event, even if we could not find the event listed on the
internet. However if such a spike was followed by a data gap or repeating zeroes, we felt
this was indicative of a counter malfunction and excluded such spikes. If the high
volumes (>200 per hour) continued into late and night and went on for days, we
considered this a malfunction of some sort and excluded these data from analysis.
69
The 1,000 per hour threshold was determined after a review of bicycle and
pedestrian capacity and saturation flow rate studies (Tables 17-19). This threshold was
considered to be flexible for the person conducting the quality checks to use discretion in
determining if the data appeared to be real or a malfunction. This discretion was
necessary in order to not over clean the data at higher volume sites. The threshold was
also loosely based off the peak hourly volumes found for one bicycle flow direction on
the Hawthorne Bridge, a site with some of the largest bicycle volumes in the U.S. (e.g,
roughly 5,000 riders daily)(Figure 20). Since many of the sites checked had much lower
daily volumes than this, it would be an anomaly for 1,000 users to pass within one hour
given demonstrated travel patterns and volumes.
70
Table 17 Review of Bicycle-Only Capacity and Saturation Flow Rate Studies
Location or Reference Author
Study Year Path Width
Saturation Flow
(Bicycles/h)
Saturation Flow Rate Bicycles/h/ft
Assuming an 8 ft Path
Netherlands Stembord, H.
1991 0.78 m (2.6 ft) 3,000-3,500 1,346 10,769
Canada Navin, F.B.D.
1994 1.25 m (4.1 ft) 5,000 1,220 9,756
Canada Navin, F.B.D.
1994 2.5 m (8.2 ft) 10,000 - -
Netherlands Botma, H. 1995 1 m (3.3 ft) 3,200 970 7,758
Netherlands Botma, H. 1995 2 m (6.6 ft) 6,400 - -
Netherlands Botma, H. 1995 3 m (9.9 ft) 9,600 - -
Davis, CA Homburger, W.S.
1976 1.0 m (3.3 ft) 2,600 788 6,303
China Yang, J.M. 1985 2 m (6.6 ft) 4,400-4,500 682 5,455
China Yang, J.M. 1985 3 m (9.9 ft) 6,600-6,700 677 5,414
China Lui et al. 1993 1 m (3.3 ft) 1,800-2,100 636 5,091
Swedish Capacity Manual
Vagverk, S. 1977 1.2 m (4 ft) 1,500 375 3,000
US (Highway Capacity Manual)
1994 2 lanes (6.6 ft) 2350* 356 2,848
US (Highway Capacity Manual)
1994 1 lane (3.3 ft) 500* 152 1,212
*Assumptions about the range of data and the size of the lanes were made and put in (). Analysis of data from Allen et al. 1998. Source: Author's analysis from Allen et al. 1998, Johnson 2014, and Hummer et al. 2006
71
Table 18 Summary of Bicycle-Only Capacity and Saturation Flow Rate Studies
Summary by Region Assuming an 8 ft Path
Netherlands 7,700-11,000
Canada 9,700
China 5,000-5,400
Swedish Capacity Manual 3,000
Davis, CA 6,300 Source: Author's analysis from Johnson 2014 and Hummer et al. 2006
Table 19 Review of Pedestrian-Only Capacity and Saturation Flow Rate Studies
Author, Year Study Name Capacity Assumed Speed
Pedestrian Buffer Zone
FHWA, 1998 Recommended Procedures for Chapter 13 "Pedestrians" of the Highway Capacity Manual
4,000-5,000 pedestrians/h/m, for simplicity 4,500 ped/h/m (75 ped/min/m)
0.75 m/s 0.75 m^2/ped
TRB, 1994 Highway Capacity Manual LOS E up to 82 ped/min/m or 4920 ped/h/m
Fruin, 1971 Pedestrian Planning and Design LOS E up to 82 ped/min/m or 4920 ped/h/m
Pushkarev Zupan, 1975b
Urban Space for Pedestrians LOS F up to 82 ped/min/m or 4920 ped/h/m
AADNTysk = the actual annual average daily bicyclists and/or pedestrians for the site, s,
year, y, and mode, k.
Estimated AADNTyskhdg = the annual average daily bicyclists and/or pedestrians estimated
for a given trial short duration site, s, year, y, mode, k, for the hour of the day the trial
short duration count, h, for trial short duration count date, d, and for trial factor group, g.
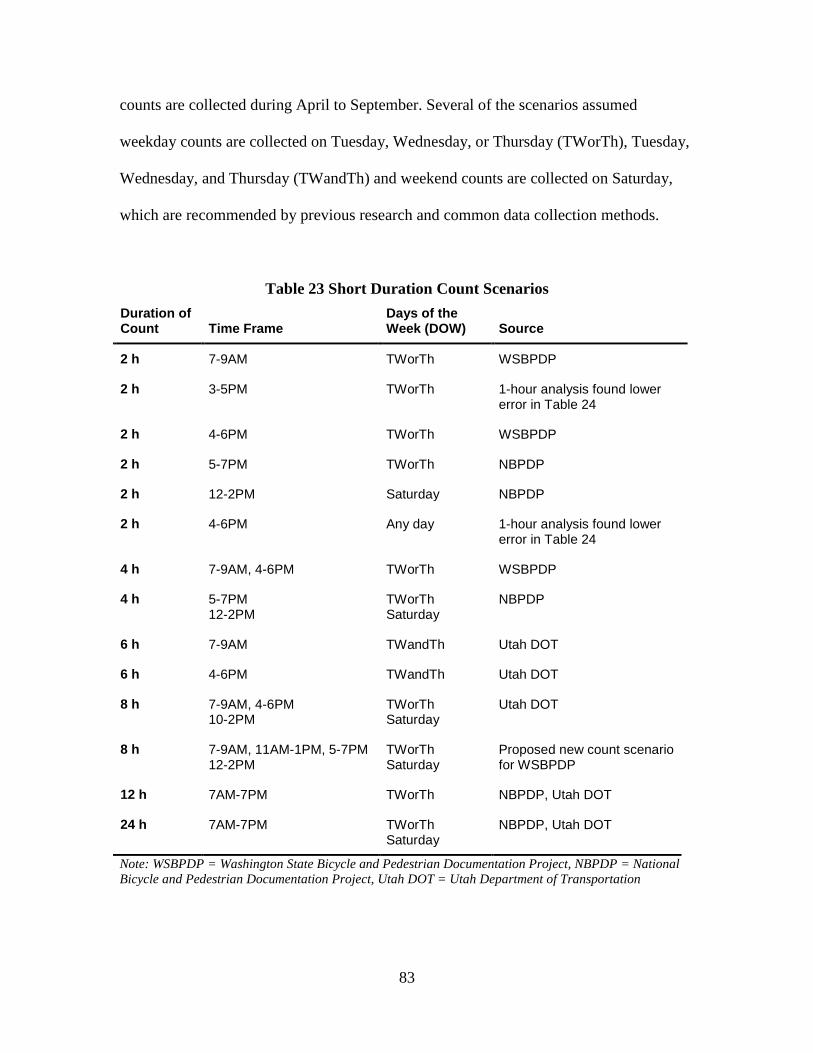
SHORT DURATION COUNT SCENARIOS
Several short duration count scenarios are examined in this study as shown in
Table 23. Most of the scenarios are selected from recommended timeframes from various
count programs found in the United States and Canada. All of the scenarios assumed that
(Equation 5)
83
counts are collected during April to September. Several of the scenarios assumed
weekday counts are collected on Tuesday, Wednesday, or Thursday (TWorTh), Tuesday,
Wednesday, and Thursday (TWandTh) and weekend counts are collected on Saturday,
which are recommended by previous research and common data collection methods.
Table 23 Short Duration Count Scenarios Duration of Count Time Frame
Days of the Week (DOW) Source
2 h 7-9AM TWorTh WSBPDP
2 h 3-5PM TWorTh 1-hour analysis found lower error in Table 24
2 h 4-6PM TWorTh WSBPDP
2 h 5-7PM TWorTh NBPDP
2 h 12-2PM Saturday NBPDP
2 h 4-6PM Any day 1-hour analysis found lower error in Table 24
4 h 7-9AM, 4-6PM TWorTh WSBPDP
4 h 5-7PM 12-2PM
TWorTh Saturday
NBPDP
6 h 7-9AM TWandTh Utah DOT
6 h 4-6PM TWandTh Utah DOT
8 h 7-9AM, 4-6PM 10-2PM
TWorTh Saturday
Utah DOT
8 h 7-9AM, 11AM-1PM, 5-7PM 12-2PM
TWorTh Saturday
Proposed new count scenario for WSBPDP
12 h 7AM-7PM TWorTh NBPDP, Utah DOT
24 h 7AM-7PM TWorTh Saturday
NBPDP, Utah DOT
Note: WSBPDP = Washington State Bicycle and Pedestrian Documentation Project, NBPDP = National Bicycle and Pedestrian Documentation Project, Utah DOT = Utah Department of Transportation
84
One purpose of this study is to investigate error estimation for different hours
throughout the day. Thus, many of the 2-hour count scenarios are derived timeframes
recommended by existing count programs or guidance to represent various hours from
7:00AM to 7:00PM. Several 2-hour scenarios represent times when the highest counts for
different travel patterns are expected (e.g., PM peak hours for commute patterns, midday
Saturdays for recreational patterns). Two 2-hour scenarios are included because the initial
error analysis determined that counts in the afternoon produced the lowest error
estimations regardless of other variables (e.g., day of week, hourly factor group, city).
The 4-hour count scenarios were modeled from the Washington State Bicycle and
Pedestrian Documentation Project (WSBPDP) and the National Bicycle and Pedestrian
Documentation Project (NBPDP). Because both 4-hour scenarios sample days throughout
April to September, rather than specific days in late September or early October, the
corresponding errors are likely to be lower than that of the actual WSBPDP or NBPDP
counts.
The 6-hour count scenarios are based on guidance from the Utah Department of
Transportation (Utah DOT), which recommends counting on consecutive weekdays
(Tuesday, Wednesday, and Thursday) during morning and evening commute peak hours.
The 8-hour count scenarios are combinations of 2-hour scenarios previously discussed.
One 8-hour scenario expands upon the 4-hour NBPDP scenario by adding a midday
period on the weekdays from 11:00AM-1:00PM and a midday period on Saturday from
12:00-2:00PM. This scenario allows for an estimation of AMI to be computed.
Estimations of AMI can be used to determine the correct factor group, and thus calculate
85
more accurate error estimates. This scenario is the research team’s proposed new count
scenario for WSBPDP.
The 12-hour and 24-hour count scenarios are both modeled from the NBPDP and
Utah DOT guidance. Counts are assumed to be collected from 7:00AM-7:00PM on
Tuesday, Wednesday, or Thursday only for the 12-hour scenario. The 24-hour scenario
counts during these same times and additionally from 7:00AM-7:00PM on Saturday. It is
possible to collect these counts using manual counters by dividing the time period into
shifts to avoid fatigue. However, it is typical that these counts would be taken using
automated, continuous counters specifically calibrated to bicycles and/or pedestrians.
The comparison of count scenarios calculated the mean percentage error (MPE),
mean absolute percentage error (MAPE), and standard deviation of the MAPE using the
actual AADNT and the estimated AADNT. The equations below show how these
Note: Available data used in this analysis were collected from April to September. ARL = Arlington, BOU = Boulder, MVN = Mt. Vernon, PDX = Portland, SAN = San Diego, SEA = Seattle
90
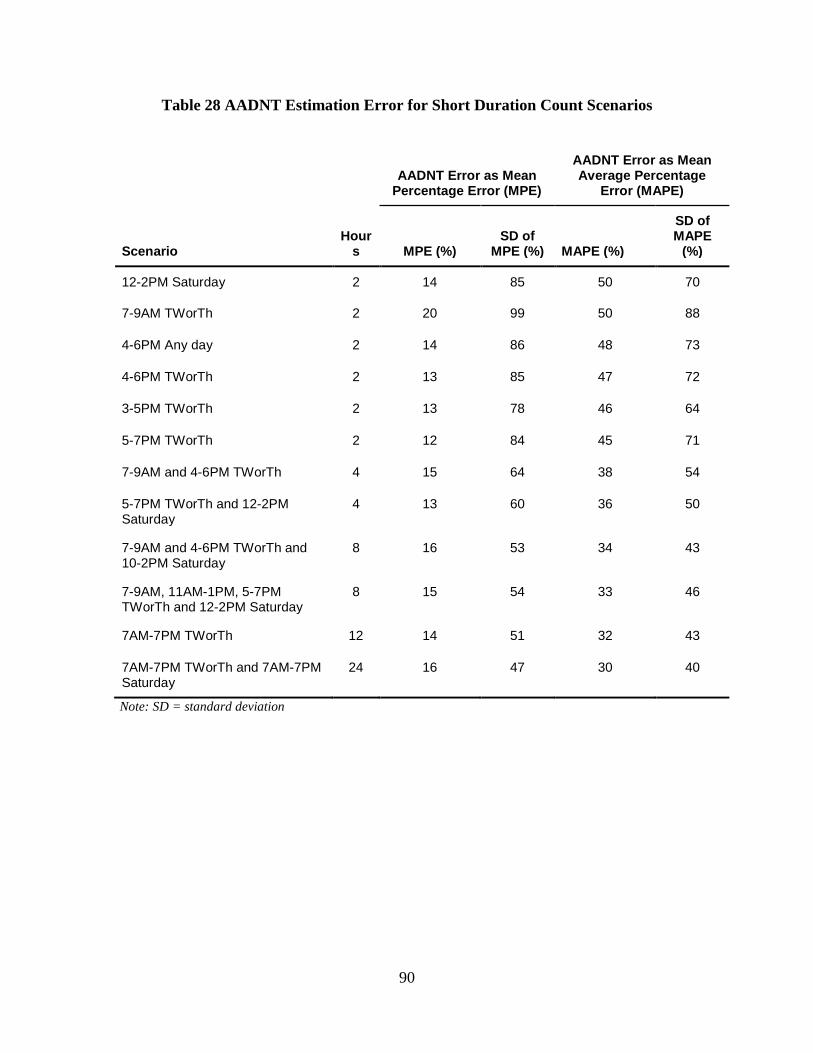
Table 28 AADNT Estimation Error for Short Duration Count Scenarios
Hours
AADNT Error as Mean Percentage Error (MPE)
AADNT Error as Mean Average Percentage
Error (MAPE)
Scenario MPE (%) SD of
MPE (%) MAPE (%)
SD of MAPE
(%)
12-2PM Saturday 2 14 85 50 70
7-9AM TWorTh 2 20 99 50 88
4-6PM Any day 2 14 86 48 73
4-6PM TWorTh 2 13 85 47 72
3-5PM TWorTh 2 13 78 46 64
5-7PM TWorTh 2 12 84 45 71
7-9AM and 4-6PM TWorTh 4 15 64 38 54
5-7PM TWorTh and 12-2PM Saturday
4 13 60 36 50
7-9AM and 4-6PM TWorTh and 10-2PM Saturday
8 16 53 34 43
7-9AM, 11AM-1PM, 5-7PM TWorTh and 12-2PM Saturday
8 15 54 33 46
7AM-7PM TWorTh 12 14 51 32 43
7AM-7PM TWorTh and 7AM-7PM Saturday
24 16 47 30 40
Note: SD = standard deviation
91
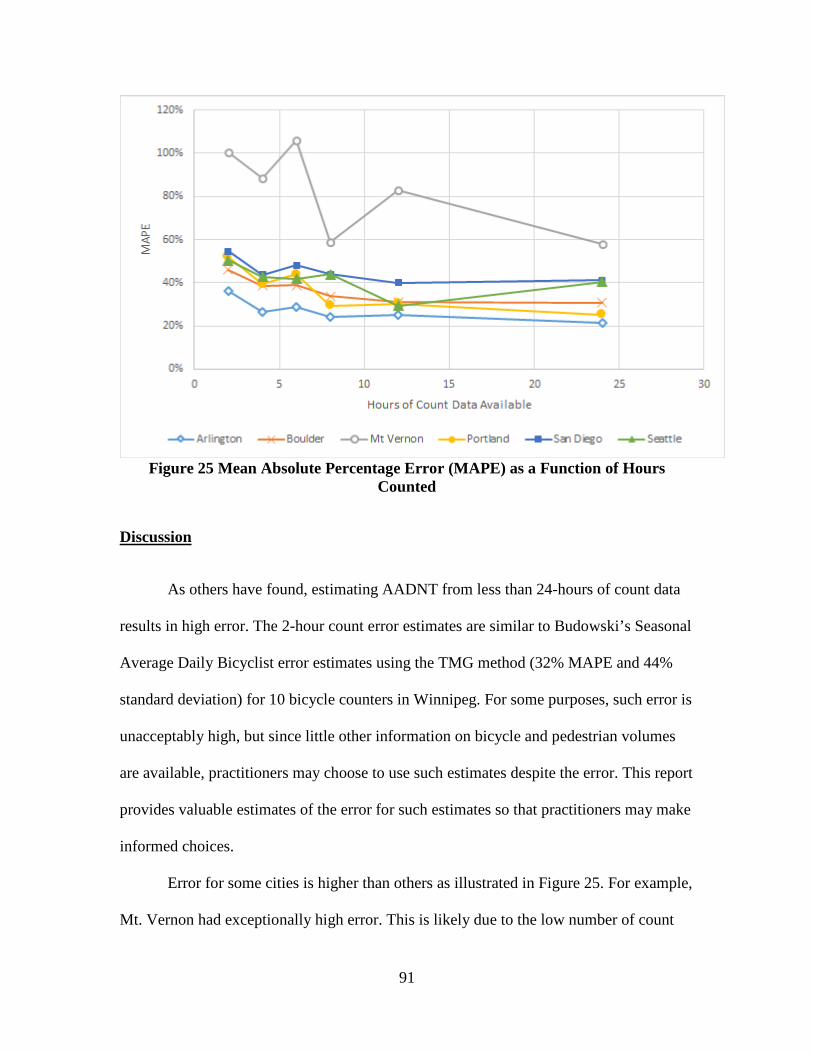
Figure 25 Mean Absolute Percentage Error (MAPE) as a Function of Hours
Counted
Discussion
As others have found, estimating AADNT from less than 24-hours of count data
results in high error. The 2-hour count error estimates are similar to Budowski’s Seasonal
Average Daily Bicyclist error estimates using the TMG method (32% MAPE and 44%
standard deviation) for 10 bicycle counters in Winnipeg. For some purposes, such error is
unacceptably high, but since little other information on bicycle and pedestrian volumes
are available, practitioners may choose to use such estimates despite the error. This report
provides valuable estimates of the error for such estimates so that practitioners may make
informed choices.
Error for some cities is higher than others as illustrated in Figure 25. For example,
Mt. Vernon had exceptionally high error. This is likely due to the low number of count
92
sites (only six sites total), the high variability of the counts (possibly due to inaccuracies
in the equipment) and low volumes. However, volume does not clearly correlate with
error in this dataset of all the cities overall. Similarly, San Diego also had data quality
problems, likely due to lack of equipment maintenance budget, most, but not all, of which
were identified during our data quality process. Such problems may have caused the
relatively high error. Error for Arlington is the lowest of the six cities studied, likely due
to the higher number of count sites (22 total, leading to at least seven per factor group)
and the consistent data quality. It should be noted that Arlington data has been cleaned to
an extent that data for the other cities were not. This cleaning was conducted by the
counter manufacturer at the request of the city and included estimating data where counts
were missing and removing erroneous high counts. This resulted in data being more
consistent than other datasets.
Another source of error is the number of permanent counters used to create the
adjustment factors. Error (MAPE) was 54% lower from estimates where two permanent
counters were used to create the factors compared to estimates where only one permanent
counters was used. This illustrates the importance of installing multiple counters per
factor group. The TMG recommends at least three counters. In this study the number of
counters per factor group ranged from 1 to 14. Future study of these data will investigate
this source of error further.
It is likely that because more special events occur on weekends than weekdays,
there is more variability in weekend counts, and thus higher error. However, it is unclear
why Sunday produced less error than Saturday. This study was unable to determine
93
whether more events happen on Saturday or Sunday, but this does impact the error and
warrants further study.
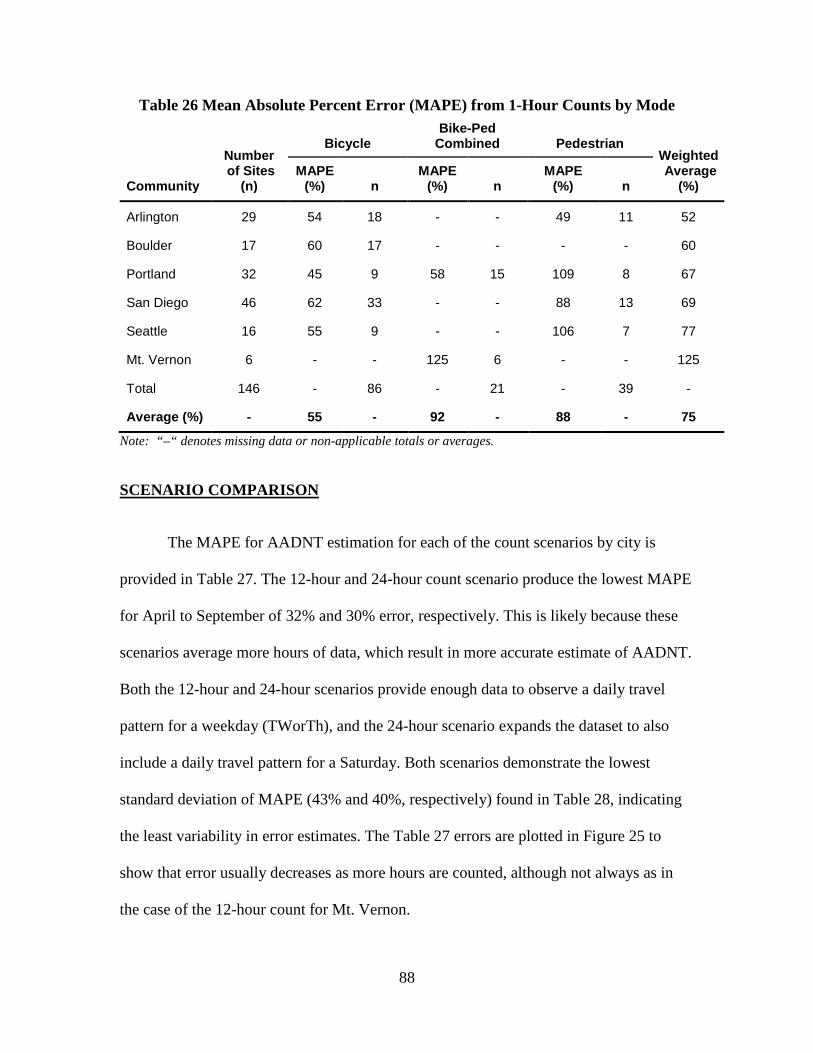
As shown in Table 26, error for bicycle counts seems lower than for pedestrian
and combined bicycle-pedestrian counts, overall, but this may be a factor of variability
and data quality rather than actually associated with pedestrians. In fact, Arlington which
has relatively good data quality and relatively high volumes shows slightly lower
AADNT estimation error for pedestrians than bicycles.
As shown in Figure 25, MAPE for the 8-hour manual count strategy (7-9AM,
11AM-1PM, 5-7PM TWorTh and 12-2PM Saturday) is relatively lower than other
scenarios with similar durations. This indicates that if manual counts are to be collected
this is a good scenario.
94
CONCLUSIONS
This research demonstrates that using manual counts to estimate annual average
daily non-motorized traffic (AADNT) is likely to result in errors higher than 20%.
However, since this is common practice, the report presents estimates of this error using
common estimation methods applied to count data from six cities using frequently used
manual count scenarios. For example, Mean Absolute Percent Error (MAPE) averages
45% for the often used 5:00-7:00PM 2-hour count period on Tuesday, Wednesday, or
Thursday.
Error varies by number of count sites in the factor group, month, time of day, day
of week, and city. It is also likely to vary by variability and volume at the count sites, and
quality of the data. The commute factor group demonstrates the lowest error. Afternoon
counts seem to be best for reducing error (2:00-6:00PM). While Monday is associated
with high error, Friday is closer to the other weekdays in terms of reducing error. Sunday
is often as good if not better than Saturday in terms of error contrary to what others have
found. Likely due to data quality but also non-motorized traffic volume, Arlington had
the lowest AADNT estimation error (mean absolute percent error) and Mt. Vernon,
Washington had the highest. Average AADNT estimation errors for the studied short
duration count scenarios ranged from 30% to 50%. Error is lower for scenarios in which
more peak hours are counted and when more than one permanent counter was available
to estimate adjustment factors.
95
RECOMMENDATIONS
Recommendations for the Washington State Bicycle and Pedestrian Documentation
Program (WSBPDP):
• Communities are urged to use counting equipment to count longer than 24 hours
(preferably one week) in order to reduce the error.
• If manual counting is continued, the 8-hour peak hour count scenario (7-9AM,
11AM-1PM, 4-6PM on a Tuesday, Wednesday or Thursday and 12-2PM Saturday)
during a nonholiday week and good weather from May through September is
recommended for potential future WSBPDP use. The average error of 33%
(MAPE) for this scenario, this error is relatively low for manual count-based
estimate. Also, this scenario provides information on how weekend and weekday
travel compare and provides some basis for understanding weekday travel patterns.
• Conduct segment (screenline) counts for manual short duration counts
• Install more than one continuous counter per factor group. Error (MAPE) decreases
over 50% for factors groups with two continuous counters rather than one. Each of
the four regions (Coast Range, Puget Lowlands, Cascades, and Eastern
Washington) are expected to have separate factor groups, which are likely to each
include the commute, noon-activity, and mixed pattern groups discussed herein. In
addition, bicycle and pedestrian modes should be grouped separately. This indicates
a minimum of 24 groups in the state (4 regions X 3 pattern groups X 2 modes),
though there are likely to be more groups if, for example, rural and urban areas have
different noon activity patterns or different cities have different patterns. Adding
96
counters in the Coast Range and Cascades is especially needed as these areas had
not counters at the time of analysis.
• Maintain and calibrate continuous counters and short duration counting equipment
at initialization and annually thereafter.
• Collect data from both continuous and short duration coverage count sites for a
network-wide count program.
Detailed recommendations from this research are included in a guidebook for
communities in the WSBPDP included in Appendix J of this report. This guidebook,
incorporates results from this research as well as those of a companion project by Dr.
Michael Lowry at University of Idaho. This following sections details how decisions for
the guidebook were made and supported by available analysis.
WHEN TO COUNT
From the hourly analysis of Mean Absolute Percentage Error (MAPE) by day of
week in Table 29 demonstrates that the lowest errors were mostly found in the afternoon
and the highest errors in the mornings. In order to maintain consistency with grouping
methods outlined in previous research by Miranda-Moreno (2013), manual counts would
need to be collected during weekday mornings from 7-9AM and midday from 11AM-
1PM, despite the high error in the mornings. This allows for adaptations of the
Weekday/Weekend Index and Average Morning/Midday Index for manual counts to be
calculated (referred to as Weekend Ratio and Midday Ratio, respectively). These indices
are useful for determining travel patterns for count sites to group them.
97
In the count scenario comparison, the 4-6PM TWorTh had slightly lower error
than the 5-7PM TWorTh scenario. Considering this, the researchers chose to recommend
counting during the 4-6PM evening period. This maintains consistency with the
WSBPDP but is not consistent with the National Bicycle and Pedestrian Documentation
Project current count timeframe (5-7PM). Similarly, the analysis found lower error to be
observed on Sunday rather than Saturday, which is contrary to what other research has
found. However, because it is not common practice to conduct weekday counts on Friday
or weekend counts on Sunday, these days are not recommended in the guidebook or
included in many of the analyzed count scenarios.
Table 29 Mean Absolute Percentage Error (MAPE) for 1-Hour Counts by Day of
Week
Hour Sun Mon Tues Wed Thurs Fri Sat Avg.
7 160 134 110 111 106 109 127 122
8 103 82 72 78 73 78 86 82
9 76 82 65 66 72 69 76 72
10 74 79 66 66 66 69 94 73
11 71 74 65 66 67 68 96 72
12 67 76 79 65 71 76 69 72
13 67 76 66 73 67 73 69 70
14 69 75 63 64 63 64 68 67
15 66 66 61 61 61 60 65 63
16 66 63 59 60 62 59 68 62
17 73 61 59 65 66 67 84 68
18 95 65 73 70 69 75 147 85
Average 82 78 70 70 70 72 87
98
Note: The hours with the lowest errors are in bold. The hours in gray shading were chosen by the research team as a proposed new count scenario for WSBPDP in the guidebook.
The thresholds for the Weekend and Midday Ratios were determined after
reviewing literature on WWI and AMI, and seek to maintain consistency with previously
used methods. For the example Weekend Ratio and Midday Ratio calculations from
manual counts in the guidebook, continuous count data were obtained from the Seattle
Department of Transportation. Continuous data were used instead of manual counts for
two reasons. First, the researchers only had access to manual count data from 7-9AM and
4-6PM TWorTh, which was not sufficient to complete the calculations. Second,
continuous data were necessary to verify if the ratios were accurately placing each site
into its appropriate group. To do this, actual WWI and AMI were calculated for each site
for 2016 using continuous data, and these groups were compared to the groups from the
computed Weekend and Midday Ratios from manual counts.
ADJUSTMENT FACTORS AND AADNT
To create WBPDP-specific factors, a different method was used that used for the
previous analysis. Based on the literature review, the disaggregate factoring method (also
known as “day-of-year” factors) results in the lowest AADNT estimation error (Nosal et
al. 2014, Hankey et al. 2014, Budowski et al. 2017). For this reason a disaggregate hour-
of-year factoring approach as proposed by Budowski was used to create factors for the
State of Washington. The method was applied to Washington State continuous count data
for 2015 and 2016, the only years in which sufficient continuous count data were
available for the state. In order to make the factors useful, they were tailored to the dates
99
of the 2015 and 2016 WBPDP. These hour-of-year factors are simply calculated as the
average of the counts in the hours of interest divided by the AADNT for that year, mode
and site (equation provided in Guidebook, page 34). When multiple sites are available in
that factor group for that set of hours, the resulting factors are averaged together. All of
the factor reported in Table 30 are based on data from at least two continuous counters.
To estimate AADNT at a two-hour count site, the average hourly bicycle or pedestrian
volume counted should be divided by the appropriate factor from the table. An example
is given in the guidebook.
The estimated error based on a two-hour count alone is high. According to the
analysis results in Table 28, the error is 45% to 50% MAPE with 64% to 88% standard
deviation, indicating a wide range of error using TMG-style factors. Using the hour-of-year
disaggregate factoring approach, the error (MAPE) averages at 38% with 41% standard
deviation and -2% MPE indicating a slight bias toward under estimating. This is an
improvement on the TMG-style method included in the analysis, but still less than the desired
accuracy. Overall, for the disaggregate hour-of-year method there is about an 80% chance
that the error will be within plus or minus 60%. As summarized in Table 31 the error for 4-
6PM Bicycle counts is much lower, with MAPE from 3% to 34% for the Puget Lowland
Region. This is an area where more continuous counters and may indicate that with more
counters factors are more robust.
100
Table 30 Adjustment Factors by Factor Group for Washington State 2015 and 2016
4-6PM 0.24 0.12 0.14 - 0.08 0.18 Notes: “-” denotes insufficient data to calculate factors. There were insufficient data for calculating factors for the Eastern Washington Commute (Pedestrian and Bicycle), Eastern Washington Multipurpose Bicycle, and Puget Lowland Commute Pedestrian factor groups. Factors were not calculated for the midday (11AM-1PM TWorTh) and weekend (12-2PM Saturday) counts for 2015 and 2016 because the WSBPDP did not count during those time periods.
Table 31 MAPE for Disaggregate Factors
Year Hour
Eastern Washington Puget Lowlands Noon Activity Mixed Noon Activity Commute
Notes: “-” denotes insufficient data to calculate factors.
Only six factor groups are listed in Table 30. In the future the number of factor
groups should expand as more continuous count data become available for the State of
101
Washington. The four regions for Washington were used from previous research by
Nordback et al. (2017): Coast Range, Puget Lowland, Cascades, and Eastern Washington.
At the time of the analysis, no continuous count sites were located in the Coast Range or
Cascades regions. Each are likely to have their own commute, noon-activity, and mixed
pattern groups identified in this research. Factor groups are expected to be different for
each mode and may differ by other variables such as land use. This indicates a minimum
of 24 groups in the state (4 regions X 3 pattern groups X 2 modes), though there are
likely to be more groups if, for example, rural and urban areas have different noon
activity patterns or different cities have different patterns.
When factors from the incorrect factor group are applied to a count site, there is
greater error. In an example, Figure 26 uses factors for bicycles from the Fremont Bridge
in Seattle, a commute pattern in the Puget Lowlands, and test data from the Apple Capitol
Loop Trail in Wenatchee, a non-commute pattern in Eastern Washington. This produced
highly erroneous results. Even at peak hours, significant undercounting occurs (absolute
errors greater than 50%).
102
The figure above shows AADBT estimation error for Wednesday September 28, 2016 for the Apple Capitol Loop Trail (Eastern Washington, non-commute pattern). When the Fremont Bridge hourly factors from a different factor group (Puget Lowland, commute pattern) are applied to the Apple Capitol Loop data to estimate AADBT, this produces highly erroneous results. For this example, AADBT estimation error is greater than 25% for most hours of the day when the incorrect factor group is used, even at peak hours.
Figure 26 Error from Choosing Incorrect Factor Group
Next Steps
The grouping of the sites is an aspect of the method that might impact the error. In
this analysis sites were grouped only by the morning to midday ratio (AMI), but in the
future using the Weekend/Weekday Index to group sites with high weekend activity and
high weekday activity is likely to also decrease error (Miranda-Moreno et al. 2013).
When the correct morning/midday patterns and weekend/weekday patterns are
known, one can group the site appropriately, but how much does the error increase when
the incorrect group is chosen, or it changes from year to year? Grouping short duration
103
sites in the wrong factor group is another source of error that should be investigated
further.
Another area of future work is examination of the number of continuous counters
needed for reducing error.
104
ACKNOWLEDGMENT
The Washington Department of Transportation and the Federal Highway Administration
funded this work. The team at Portland State University (PSU) included substantial
software development work by Hui Zhang, Morgan Harvey, and Will Brown with
assistance and direction from Dr. Kristin Tufte. The data were managed and cleaned by
Portland State students led by Michelle Watkins, Carlynn De Joya and Lynn Tran. An
expert panel for a parallel FHWA funded project provided important feedback from
Jeremy Raw (FHWA), Dr. Greg Lindsey (University of Minnesota), Mark Hallenbeck
(University of Washington), and Dr. Sherry Ryan (San Diego State University). Dr. Mike
Lowry, University of Idaho, provided substantial assistance for various aspects of this
project. The survey of Washington State bicycle and pedestrian data organizations was
conducted by Raeleigh Stark, when she was a PSU master’s student in Urban and
Regional Planning. Hau Hagedorn kindly managed the project for PSU after Principal
Investigator, Krista Nordback, moved to University of North Carolina and continued
technical direction of the project.
105
REFERENCES
Alta Planning and ITE. No date. National Bicycle and Pedestrian Documentation Project. Accessed at http://bikepeddocumentation.org/
Budowski, A. 2015. “Developing Expansion Factors to Estimate Cyclist Seasonal
Average Daily Traffic in Winnipeg, MB.” Master’s Thesis, University of Manitoba.
Budowski, A., McLaughlin, F., Nordback, K., and Montufar, J. 2017. "Estimating
Seasonal Average Daily Bicyclists Using 2-h Short Duration Counts." 96th Annual Meeting of the Transportation Research Board, Transportation Research Board of the National Academies, Washington, DC.
Brosnan, M., M. Petesch, J. Pieper, S. Schumacher, and G. Lindsey. 2015. “Validation of
Bicycle Counts from Pneumatic Tube Counters in Mixed Traffic Flows.” Presented at 94th Annual Meeting of the Transportation Research Board, Washington, D.C.
Burbidge, S. 2016. Developing a Rubric and Best Practices for Conducting Counts of Non-
Motorized Transportation Users. Utah Department of Transportation Research Division. Report No. UT-16.02.
Diogenes, M., R. Greene-Roesel, L. Arnold, and D. Ragland. 2007. “Pedestrian Counting
Methods at Intersections: A Comparative Study.” Transportation Research Record: Journal of the Transportation Research Board, no. 2002. Transportation Research Board of the National Academies, Washington, D.C., 26–30.
El Esawey, M. 2016. “Toward a Better Estimation of Annual Average Daily Bicycle
Traffic: Comparison of Methods for Calculating Daily Adjustment Factor.” Transportation Research Record: Journal of the Transportation Board. no. 2593, Transportation Research Board. Washington, D.C., 28-36.
El Esawey, M. 2014. “Estimation of Annual Average Daily Bicycle Traffic with
Adjustment Factors.” Transportation Research Record: Journal of the Transportation Research Board, no. 2443, Transportation Research Board of the National Academies, Washington, D.C., 106–114.
El Esawey, M., C. Lim, T. Sayed, and A. I. Mosa. 2013. “Development of Daily
Adjustment Factors for Bicycle Traffic.” Journal of Transportation Engineering, 139, no. 8, 859–871.
Federal Highway Administration. 2013. Traffic Monitoring Guide. Washington, DC, U.S.
Federal Highway Administration. 2014. “Assessing Roadway Traffic Count Duration and Frequency Impacts on Annual Average Daily Traffic (AADT) Estimation.” Federal Highway Administration.
Federal Highway Administration. Traffic Monitoring Guide, 2016. Figliozzi, M., P. Johnson, C. Monsere, and K. Nordback. 2014. “A Methodology to
Characterize Ideal Short-Term Counting Conditions and Improve AADT Estimation Accuracy Using a Regression-Based Correcting Function.” Journal of Transportation Engineering, 140, no. 5.
Fournier, N., E. Christofa, and M.A. Knodler. 2015. “The Bicycle Cycle: A Sinusoidal
Model for Predicting Bicycle Demand.” 95rd Annual Meeting of the Transportation Research Board. Washington, D.C., National Academies.
Ginger, N., A. Hong, J. Murphy, D. Rose, P. Schmiedeskamp, A. Snypp, and E. Torikai.
2011. “Bicycle Planning, Best Practices, and Count Methodology.” Transportation Planning Studio Final Report. University of Washington.
Greene-Roesel, R., M.C. Diogenes, D.R. Ragland, and L.A. Lindau. 2008. “Effectiveness
of a Commercially Available Automated Pedestrian Counting Device in Urban Environments: Comparison with Manual Counts.” Paper 08-0503. Presented at 87th Annual Meeting of the Transportation Research Board, Washington, D.C., 2008.
Griffin, G., K. Nordback, T. Gotschi, E. Stolz, and S. Kothuri. 2014. Transportation
Research Circular E-C183: Monitoring Bicyclist and Pedestrian Travel and Behavior: Current Research and Practice. Transportation Research Board of the National Academies, Washington D.C.
Gosse, A.C. and A. Clarens. 2014. “Estimating Spatially and Temporally Continuous
Bicycle Volumes by Using Sparse Data.” Transportation Research Record: Journal of the Transportation Board. No. 2443, Transportation Research Board. Washington, D.C., 115-122.
Hankey, S. G. Lindsey, and J. Marshall. 2014. “Day-of-Year Scaling Factors and Design
Considerations for Nonmotorized Traffic Monitoring Programs.” Transportation Research Record: Journal of the Transportation Research Board, no. 2468, Transportation Research Board of the National Academies, Washington, D.C., 64–73.
Hjelkrem, O.A., and T. Giæver. 2009. “A Comparative Study of Bicycle Detection
Methods and Equipment.” Presented at 16th ITS World Congress and Exhibition on Intelligent Transport Systems and Services, Stockholm, Sweden.
Hyde-Wright, A., B. Graham, and K. Nordback. 2014. “Counting Bicyclists with
32–37. Jones, M.G., S. Ryan, J. Donlon, L. Ledbetter, D.R. Ragland, and L. Arnold. 2010.
Seamless Travel: Measuring Bicycle and Pedestrian Activity in San Diego County and its Relationship to Land Use, Transportation, Safety, and Facility Type. California PATH Research Report UCB-ITS-PRR-2010-12. University of California.
Lindsey, G. et al. 2013. The Minnesota Bicycle and Pedestrian Counting Initiative:
Methodologies for Non-motorized Traffic Monitoring. St. Paul, MN: Minnesota Department of Transportation.
Lindsey, G., M. Petesch, and S. Hankey. 2015. The Minnesota Bicycle and Pedestrian
Counting Initiative: Implementation Study. St. Paul, MN: Minnesota Department of Transportation.
Lindsey, G., K. Nordback, and M.A. Figliozzi. 2014. “Institutionalizing Bicycle and
Pedestrian Monitoring Programs in Three States: Progress and Challenges.” Transportation Research Record: Journal of the Transportation Research Board, No. 2443. pp 134–142.
Lindsey, G., J. Chen, and S. Hankey. 2012. “Adjustment Factors for Estimating Miles
Traveled by Nonmotorized Traffic.” Paper presented at the 92nd Annual Meeting of the Transportation Research Board. Washington, DC, Transportation Research Board of the National Academies.
Miranda-Moreno, L. F., T. Nosal, R. J. Schneider, and F. Proulx. 2013. “Classification of
Bicycle Traffic Patterns in Five North American Cities.” Transportation Research Record: Journal of the Transportation Research Board, no. 2339, Transportation Research Board of the National Academies, Washington, D.C., 68-79.
Niska, A., A. Nilsson, M. Varedian, J. Eriksson, and L. Soderstrom. 2012.
“Uppföljning av gång- och cykeltrafik: utveckling av en harmoniserad metod för kommunal uppföljning av gång- respektive cykeltrafik med hjälp av resvaneundersökningar och cykelflödesmätningar. Evaluating pedestrian and cycle traffic: development of a harmonised method for monitoring the municipal proportion of pedestrian and cycle traffic through travel surveys and cycle counts.” Swedish National Road and Transport Research Institute (VTI). VTI Rapport, Issue 743, 82.
Nordback, K., and Janson, B. 2010. "Automated Bicycle Counts: Lessons from Boulder."
Transportation Research Record: Journal of the Transportation Research Board, Transportation Research Board of the National Academies, Washington, D.C., 2010(2190), 11-18.
108
Nordback, K., Piatkowski, D., Janson, B., Marshall, W., Krizek, K., and Main, D. 2011. "Using Inductive Loops to Count Bicycles in Mixed Traffic." Journal of Transportation of the Institute of Transportation Engineers, 2(1), 39-56.
Nordback, K. L. 2012. “Estimating Annual Average Daily Bicyclists and Analyzing
Cyclist Safety at Urban Intersections.” Ph.D., University of Colorado Denver. Nordback, K., K.A. Tufte, M. Harvey, N. McNeil, E. Stolz and J. Liu. 2015. “Creating a
National Nonmotorized Traffic Count Archive: Process and Progress.” Transportation Research Record: Journal of the Transportation Research Board, no. 2527, 90–98.
Nordback, K., W. E. Marshall, B. N. Janson, and E. Stolz. 2013. “Estimating Annual
Average Daily Bicyclists: Error and Accuracy.” Transportation Research Record: Journal of the Transportation Research Board, no. 2339, Transportation Research Board of the National Academies, Washington, D.C., 90–97.
Nordback, K., W.E. Marshall, and B.N. Janson. 2013. “Development of Estimation
Methodology for Bicycle and Pedestrian Volumes Based on Existing Counts.” Denver, CO, Colorado Department of Transportation (CDOT), 157.
Nordback, K., and M. Sellinger. 2014. Methods for Estimating Bicycling and Walking in
Washington State. Olympia, WA: Washington State Department of Transportation.
Nosal, T., L. F. Miranda-Moreno, and Z. Krstulic. 2014. “Incorporating Weather:
Comparative Analysis of Annual Average Daily Bicyclist Traffic Estimation Methods.” Transportation Research Record: Journal of the Transportation Research Board, no. 2468, Transportation Research Board of the National Academies, Washington, D.C., 100–110.
Roll, J.F. 2013. “Bicycle Traffic Count Factoring: An Examination of National, State and
Locally Derived Daily Extrapolation Factors.” Dissertations and Theses. Paper 998. Portland State University, Portland, OR.
Ryus, P., E. Ferguson, K.M. Laustsen, R.J. Schneider, F.R. Proulx, T. Hull, and L.
Miranda-Moreno. NCHRP 797: Guidebook on Pedestrian and Bicycle Volume Data Collection. Transportation Research Board of the National Academies, Washington D.C., 2014.
Ryus, P., E. Ferguson, K.M. Laustsen, R.J. Schneider, F.R. Proulx, T. Hull, and L.
Turner, S. and P. Lasley. 2013. “Quality Counts for Pedestrians and Bicyclists: Quality Assurance Procedures for Non-Motorized Traffic Count Data.” Transportation Research Record: Journal of the Transportation Research Board, No. 2339. Transportation Research Board of the National Academies, Washington, D.C., 57–67.
Voyt, M. 2015. “Analysis of the Impact of Count Duration and Missing Data on AADT
Estimates in Manitoba.” Master’s Thesis, University of Manitoba.
APPENDIX A
Review of Estimation and Adjustment Literature
APPENDIX A REVIEW OF ESTIMATION AND ADJUSTMENT LITERATURE
Author(s), Year Summary Facilities
Temporal/ Seasonal
Adjustment Factors
Short-term (<24 hrs)
Mid-length (1 day - 1 mo)
Long (1 mo-11 mo)
Continuous (12+ mo)
Permanent (Y/N)
El Esawey, 2016
Compared methods for computing adjustment factors by AASHTO, El Esawey, and Hankey et al. using the same data set from Vancouver, BC. Proposed a model to determine daily adjustment factors at any region according to the local characteristics of any day. Found that the day-of-year method to be the best of the three methods with 17.5% mean absolute percent error (MAPE).
street network daily monthly seasonal
day-of-week day-of-month day-of-year
x Y
Fournier et al., 2016
This paper developed and validated a simply calibrated mathematical model for seasonal bicycle demand using a sinusoidal function that generally fits locations with seasonal change.
multi-use trails street network
one month in winter/
summer
x x x Y
Budowski, 2015
Used 10 continuous counters on 5 paths in Winnipeg, Manitoba to develop adjustment factors for short duration bicycle counts.
multi-use trails hourly day-of-season
x
x Y
Lindsey, 2015
Installed and validated permanent automated sensors, used portable sensors for short duration counts, developed methods for extrapolating counts, and integrated continuous counts into MnDOT traffic monitoring databases.
multi-use trails street network
day-of-year x x x x Y
Author(s), Year Summary Facilities
Temporal/ Seasonal
Adjustment Factors
Short-term (<24 hrs)
Mid-length (1 day - 1 mo)
Long (1 mo-11 mo)
Continuous (12+ mo)
Permanent (Y/N)
El Esawey, 2014
Developed daily and monthly adjustment factors (DFs and MFs) to estimate accuracy of annual average daily bicycle (AADBT) traffic volumes using 12 continuous count locations in Vancouver, BC. Found that MFs (11.5% error) were superior to using seasonal factors (17% error) and lowest errors were achieved when factors were applied to data from the same year as the development data. Estimating AADBT using only 1 day of bicycle volume using DFs (15% error), MFs (11% error).
street network daily monthly
x x Y
Figliozzi et al., 2014
This project developed a methodology to correct for the use of daily and monthly adjustment factors for bicycle traffic. Used 1 year data on bicycle volume from Portland, Oregon and a linear regression model to express the relationship between estimation error for AADB with adjustment factors and the characteristics of the day of the count, previous days, and weather variables.
separated bikeways
daily monthly
x
x Y
Gosse & Clarens, 2014
Proposed a framework where a small city with no permanent counting infrastructure and some manual volunteer bicycle counts can reasonably estimate an edge-specific bicycle usage network-wide. Models use spatial, temporal, and weather factors.
street network hourly weather-related commute-day
x
x
N
Author(s), Year Summary Facilities
Temporal/ Seasonal
Adjustment Factors
Short-term (<24 hrs)
Mid-length (1 day - 1 mo)
Long (1 mo-11 mo)
Continuous (12+ mo)
Permanent (Y/N)
Hankey et al., 2014
Proposed reasons to use day-of-year adjustment factors for estimating AADNT. Found that day-of-year factors have less error than the standard scaling method (day of week and month of year) and that error is reduced as the length of short-duration counts is increased, although it reported only marginal increases in accuracy for counts longer than 1 week. Reported that counting on consecutive or nonconsecutive days minimally influences AADNT estimation while reducing labor demands.
multi-use trails day-of-year month-of-year
x
x N
Nordback & Sellinger, 2014
The first and second phases of creating a method to calculate Bicycle and Pedestrian Miles Traveled (BMT/PMT) in Washington state. Recommendations for improvements to existing Washington State Bicycle and Pedestrian Documentation Program to provide data for BMT/PMT estimates.
multi-use trails street network
seasonal daily
hourly day-of-week
monthly weekday
x
x Y
Nosal et al., 2014
Expansion factor method produces estimates with considerable error. Proposes two AADBT estimation methods using weather and disaggregate models and compares these methods to traditional expansion factor methods. These methods resulted in an average absolute relative error of 11% using 1 day of short-term data.
separated bikeways
street network
monthly day-of-week day-of-month
weather-related day-of-year
(disaggregate)
x x
x Y
Author(s), Year Summary Facilities
Temporal/ Seasonal
Adjustment Factors
Short-term (<24 hrs)
Mid-length (1 day - 1 mo)
Long (1 mo-11 mo)
Continuous (12+ mo)
Permanent (Y/N)
El Esawey et al., 2013
Discusses grouping bicycle count data using daily factors by weekday/ weekend, weather-specific factors, and different road class factors. Analyzed a large data set from Vancouver, BC and found that the best estimation results of the monthly average cycling volumes were achieved when using daily factors that are disaggregated by weather conditions. Reported that grouping factors by weekdays and weekends provided similar estimation errors. Found that daily adjustment factors degrade in reliability over time, which calls up regular updates every few years.
street network day-of-week weekday/ weekend
weather-related
x x x x Y
Lindsey et al., 2013
Project included analyses of continuous counts from six locations on multi-use trails in Minnesota using inductive loop detectors and active infrared monitors. Integrated continuous counts with data from vehicular monitoring programs.
multi-use trails day-of-week monthly
x
x Y
Author(s), Year Summary Facilities
Temporal/ Seasonal
Adjustment Factors
Short-term (<24 hrs)
Mid-length (1 day - 1 mo)
Long (1 mo-11 mo)
Continuous (12+ mo)
Permanent (Y/N)
Miranda-Moreno et al., 2013
Analyzed a large data set of cycling volumes from 5 North American cities (Montreal, Ottawa, Vancouver B.C., Portland OR, and San Francisco) and along the Route Verte. Bicycle volume patterns at any location could be classified as utilitarian, mixed utilitarian, mixed recreational, and recreational. Calculated hourly and daily expansion factors. Found seasonal patterns across the four categories and cities were identified. MFs were developed separately for each city. No testing or evaluation of developed factors. Analysis lacked a full year of cycling volume data (only April-November data).
multi-use trails street network
separated bikeways
cycle tracks
hourly daily
monthly
x Y
Nordback et al., 2013
Used continuous count data and a factoring method to estimate AADBT and AADPT from short-term counts for the Colorado DOT. Found that applying motorized factors to non-motorized counts will likely lead to high estimation error, except in specific situations. Determined 20% average error for one week of short term counts, which can be reduced by counting from May to October when volumes are highest.
multi-use trails street network
hourly daily
monthly weather-related
x
x Y
Author(s), Year Summary Facilities
Temporal/ Seasonal
Adjustment Factors
Short-term (<24 hrs)
Mid-length (1 day - 1 mo)
Long (1 mo-11 mo)
Continuous (12+ mo)
Permanent (Y/N)
Nordback et al., 2013
Used continuous bicycle counts from Boulder, CO to estimate AADBT and analyze estimation errors. Found 15% error with 4 weeks of continuous count data to 54% when using only 1 h of data. Analysis recommended one full week of automated counts are the most cost-effective length for short-term counts when the devices are specifically calibrated for bicycle counting. Found that seasons with higher bicycle volume have less variation in bicycle counts and thus more accurate estimates.
multi-use trails street network
hourly daily
monthly
x
x Y
Roll, 2013 Used count data from Eugene, OR and
surveys (National Household Travel Survey and Oregon Household Activity Survey) to create and validate time-of-day factors for estimation.
multi-use trails street network
time-of-day
x
N
Lindsey et al., 2012
Proposed reasons to use day-of-year adjustment factors for estimating AADT for non-motorized traffic. Found that day-of-year factors have less error than the standard scaling method (day of week and month of year) and that error is reduced as the length of short-duration counts is increased, although only marginal increases in accuracy for counts longer than 1 week. Reported that counting on consecutive versus nonconsecutive days minimally influences AADT estimation while reducing labor demands.
multi-use trails day-of-week month-of-year
x
x Y
Author(s), Year Summary Facilities
Temporal/ Seasonal
Adjustment Factors
Short-term (<24 hrs)
Mid-length (1 day - 1 mo)
Long (1 mo-11 mo)
Continuous (12+ mo)
Permanent (Y/N)
Niska et al., 2012
Recommended methods for estimating annual change in pedestrian and bicycle traffic using data from Lund and Jönköping, Sweden. Used 200 short-term counts and one permanent counter, supplemented with travel surveys. Reported error for predicting year-to-year change based on the number of randomly selected count sites.
* weather-related x
x *
Nordback, K.L., 2012
Dissertation on estimating AADBT using factoring methods and developing a method to analyze safety at urban intersections using counts from Boulder, Colorado.
multi-use trails street network
hourly daily
monthly weather-related
peak-hour
x
x Y
Ginger et al., 2011
Analyzed and validated bicycle count data to determine adjustment factors that could be applied to peak period counts to estimate whole-day and off-peak periods.
multi-use trails street network
day-of-week peak-hour
x x x
N
Jones et al., 2010
Includes a literature review, primary data collection, count and survey results, and the development of a predictive model. This project was coordinated with the National Bicycle & Pedestrian Documentation Project.
multi-use trails street network
monthly x
x N
Author(s), Year Summary Facilities
Temporal/ Seasonal
Adjustment Factors
Short-term (<24 hrs)
Mid-length (1 day - 1 mo)
Long (1 mo-11 mo)
Continuous (12+ mo)
Permanent (Y/N)
Burbidge, 2016
Created a structured approach to conducting non-motorized traffic counts that were most appropriate for counting in Utah. Evaluated existing count methodologies and compiled findings into a guidebook.
multi-use trails street network
N/A x
x
Y
Vogt, 2015 Thesis examining the effect of missing data from permanent counters on the accuracy of AADT and an analysis of short duration counts on accuracy of AADT estimates using data from Manitoba, Canada.
street network day-of-week monthly
x
x Y
* Unable to determine based on available information.
APPENDIX B
Review of Short Duration Counts in Guidebooks
B.1
APPENDIX B REVIEW OF SHORT DURATION COUNTS IN GUIDEBOOKS
Author(s), Year
What count technologies are recommended for
short duration counts? When are counts
conducted? How long are short duration counts? Summary
Clinkscales, 2015
Manual Sept 29-Oct 1 for 2015 (T,W,Th)
Weekday, 7-9am Weekday, 4-6pm
2 hrs Washington State's bicycle and pedestrian data collection program overview of count dates and times, methodology, and how to complete and submit forms.
Alta Planning + Design, 2004
Manual Mid-May and mid-September
Morning and afternoon
"peak-commute" periods on weekdays (T,W,Th). A
Saturday count precedes or follows the official count
dates.
2 hrs 12 hrs
Established a consistent methodology for bicycle and pedestrian data collection that is used nationwide by planners, governments, and advocates. Created a national database of bicycle and pedestrian survey data and offers free summary reports of annual automatic count data.
Louch et al., 2016
Pneumatic Tubes
Video Imaging
Infrared (Active and Passive)
- - A review of emerging technology and their applications for bicycle and pedestrian counting for transportation professionals to use to guide decision-making.
Huff et al., 2014
Pneumatic Tubes (EcoCounter TUBES used)
Passive Infrared
(EcoCounter ECOPYRO used)
Sept 5- Sept 25, 2014 20 days Report presenting automated counts from six locations in the City of Cudahy, CA.
B.2
Author(s), Year
What count technologies are recommended (for
short duration counts)? When are counts
conducted? How long are short duration counts? Summary
Burbidge & Marriott, 2016
Manual (Tally sheets, mechanical counting
devices, electronic counting devices, video observations)
Pneumatic Tubes
Video Imaging
Infrared (Active and
Passive)
Radio Beams
Laser Scanning (Limited use in US)
Spring and Fall If resources are limited and
can only count once per year, do so in mid-
September to coincide with NBPDP guidance.
Weekday peak, 7-9am and
4-6pm on consecutive weekdays (T,W,Th)
Weekday 12-hour, 7am-7pm
(choose one weekday, broken into shifts to avoid
fatigue)
Weekend peak, 10am-2pm on Saturday
Weekend 12-hour, 7am-7pm
on Saturday (broken into shifts)
Minimum 2 hrs on weekdays and 3 hrs
on weekends
Created a structured approach to conducting non-motorized traffic counts that were most appropriate for counting in Utah. Evaluated existing count methodologies and compiled findings into a guidebook.
Griffin et al., 2014
Manual
Pneumatic Tubes
Infrared
- 2 hr manual counts (NBPDP)
7 days (Nordback) 2 weeks (VTI)
Reported on current projects research and techniques in active transportation monitoring, specifically for studying traffic volumes and behavioral data.
B.3
Author(s), Year
What count technologies are recommended (for
short duration counts)? When are counts
conducted? How long are short duration counts? Summary
Lindsey et al., 2014
Colorado DOT - Portable Counters
and Infrared Local jurisdictions - Boulder County: Pneumatic Tubes
Minnesota
DOT - Manual and automated counts
Local jurisdictions - 2h counts following NBPDP protocols, Three Rivers
Park District uses Passive Infrared
Oregon
DOT - Encourages only the use of automated counters;
does not support manual counts
Metro - Manual counts
- Colorado DOT - Recommends
minimum 1 week; does not use counts less than 24 h; on-
street 48-h bike tube counts planned
Local jurisdictions - mostly 1- to 3-h counts; Boulder
County: 24-h to 1-week bike counts
Minnesota
DOT - No determined minimum length,
research underway Local jurisdictions -
mostly 1- to 3-h counts
Oregon DOT - No determined
minimum length, research underway
Detailed efforts by the Colorado, Minnesota, and Oregon Departments of Transportation (DOTs) to establish non-motorized traffic monitoring programs.
B.4
Author(s), Year
What count technologies are recommended (for
short duration counts)? When are counts
conducted? How long are short duration counts? Summary
Ryus et al., 2014
Manual
Video Imaging
Pneumatic Tubes
Temporary Inductive Loops
Infrared (Active and Passive)
Radio Beam
Laser Scanners (battery-powered)
Times with higher activity levels (e.g., summer months on days with good weather). Collecting short counts from
different time periods can also improve estimation
accuracy.
Extrapolating short-term counts from 2-h counts can provide highly inaccurate results. Recent
research suggests 4-7 days of counts will reduce error in an
annual volume estimate to >20%.
A comprehensive guidebook on methods (data collection and analysis) and technologies for counting pedestrians and bicyclists. Includes case studies from various U.S. locations.
Ryus et al., 2014
Manual
Video Imaging
Pneumatic Tubes
Temporary Inductive Loops
Infrared (Active and Passive)
Radio Beam
Laser Scanners (battery-
powered)
Months representative of average or typical use
levels, generally spring and fall. Mid-May and mid-September (NBPDP)
Manual counts for 1- to 3-h on sequential
days (NBPDP) Automated counts for
7-14 days
A web-report detailing findings on accuracy and consistency of a range of automatic count technologies. Determined that it is critical for practitioners to calibrate and evaluate accuracy of counters at specific sites to better understand the effectiveness of the counters in capturing non-motorized traffic volumes under site-specific conditions. Includes guidance on how to best collect pedestrian and bicycle volume data.
C.1
APPENDIX C
Washington State Contact List for Questionnaires and Interviews
C.2
APPENDIX C
WASHINGTON STATE CONTACT LIST FOR QUESTIONNAIRES AND INTERVIEWS
City Organization Contact Person
Bellevue City of Bellevue Transportation Department Franz Loewenherz
Bellevue City of Bellevue Transportation Department Kyle Potuzak
Bellevue City of Bellevue Parks and Rec Geoff Bradley
Bellingham City of Bellingham Kim Brown
Bellingham Belingham Parks and Recreation Elizabeth Haveman
Bellingham Belingham Parks and Recreation Josh Neyman
Mount Vernon Skagit Healthy Communities Elizabeth McNett Crowl
Olympia City of Olympia Sophie Stimson
Olympia City of Olympia John Lindsay
Olympia City of Olympia Michelle Swanson
Redmond City of Redmond Joel Pfundt
Redmond City of Redmond Parks David Shaw
Richland Richland Parks and Recreation
Seattle Department of Transportation Craig Moore
Seattle Seattle DOT Brian Dougherty
Spokane City of Spokane Street Department Bobby Halbig
Spokane Bicycling Advisory Board Bradley Bleck
Tacoma Puyallup Watershed Initiative Liz Kaster
Tacoma Tacoma Metro Parks Debbie Terwilleger
Tacoma City of Tacoma Josh Diekmann
Tacoma City of Tacoma Emily Cambell
C.3
City Organization Contact Person
Turnwater City of Turnwater Paula Reeves
Vancouver City of Vancouver Jennifer Campos
Vancouver
Haley Heath
Vancouver City of Vancouver Parks and Recreation
Yakima Yakima Parks
N/A Washington Bikes Blake Trask
N/A Cascade Bicycle Club Jeff Aken
N/A WSDOT Ken Lakey
N/A Washington State Parks Moose Hempel
Note: Bold indicates individuals who were interviewed following the questionnaire.
D 1
APPENDIX D
Washington State Permanent Bike Counter Questionnaire
D 2
APPENDIX D
WASHINGTON STATE PERMANENT BIKE COUNTER QUESTIONNAIRE
TREC at Portland State University (PSU) is working with Washington State DOT on a study to
understand when is the best time to count bicyclists and pedestrians. For this reason, we are
looking for permanent bicycle and pedestrian count data in or near the State of Washington.
Have you installed a permanent (installed for at least a year), continuous bike counter in your
community? (If not, do you know any other agencies who have one?)
If so, when was the counter installed?
Are you planning to install a permanent, continuous bike counter within the next year?
Which types of bike counter have or are you planning to install?
a. Pneumatic tubes
b. Inductive loop
c. Passive infrared
d. Piezoelectric
e. Video image with automotive conversion
f. other
What is the make and model of the device?
If you have or are planning to install a bike counter, where is it located?
D 3
On which type of facility is it located?
a. Across an entire road
b. Within a bike lane
c. On a multi-use paved trail
d. On a soft surface trail
e. On a sidewalk or sidepath adjacent to a street
What are you counting?
just bicyclists
bicyclists and pedestrians together
bicyclists and pedestrians separately
just pedestrians
Has it been validated for accuracy? If so, how? Have you documented this?
Would you be willing to let PSU use your count data for a study sponsored by WSDOT to
understand when to conduct short duration bicycle and pedestrian counts?
Do you know of any other jurisdictions who are collecting continuous bicycle and pedestrian
count data?
E 1
APPENDIX E
Oregon Contact List
E 2
APPENDIX E
OREGON CONTACT LIST
City/County Organization Contact Person
Portland Explore Washington Park JP McNeil
Portland City of Portland Peter Koonce
Portland Metro Robert Spurlock
Portland ODOT Jessica Horning
Portland TriMet Jeff Owen
Portland City of Portland Tom Jensen
Portland City of Portland Roger Geller
Washington County Washington County Shelley Oylear
F 1
APPENDIX F
Quality Control Reports for Mt. Vernon, WA
F 2
Mt. Vernon, WA QC Report The Mt. Vernon data was collected using The Scanner, a passive infrared detector by JAMAR Technologies8. It was provided in per-vehicle format, which includes a timestamp and direction for each pedestrian, bicyclist, or other warm body which enters the detection zone. The data was processed in Excel by binning the data by hour. Next, a time series was created for the missing bins (e.g., overnight when you expect to observe zeroes) and the counts for these bins were set to zero. Data gaps (e.g., gaps between shuttle files that do not overlap) were excluded from the time series to prevent false zeroes. A single UTC time zone offset was applied to each timestamp as The Scanner does not account for Daylight Savings Time. This processing was necessary to upload the data to Bike-Ped Portal, which does not currently support per-vehicle data types. Since there is no evidence to suggest that these data are reliable by direction, the different flows were combined into a total count for each site. The data was quality checked for unusual patterns, spikes, zeroes, and unusually low counts using graphs of the total daily volume over time in Excel and the hourly volumes over time in Bike-Ped Portal. Unusually low counts and zeroes where there appeared to be temporary closures to the facility (e.g., holidays, snow events) or other events that we could not explain definitely were not removed. The research team excluded data that appeared to be due to equipment malfunction, vandalism, or insect or other wildlife activity (e.g., spikes at night), but not when they appeared due to special events that genuinely increased pedestrian or bicycle activity. If counts spiked for just one or a few hours and the counts were below 1,000 per hour, we considered this an actual event, even if we could not find the event listed on the internet. However if such a spike was followed by a data gap, we felt this was indicative of a counter malfunction and excluded such spikes. If the high volumes (>200 per hour) continued into late and night and went on for days, we considered this a malfunction of some sort. Below are examples of common issues we came across when completing QC for these data sets.
8 The Scanner Manual. Retrieved from http://www.jamartech.com/files/The_Scanner_Manual.pdf
F 3
KULSHAN CREEK TRAIL (18TH ST WEST SIDE)
This is a multi-use, paved trail that connects downtown Mt. Vernon with residential and commercial areas to the east. It is 2.5 miles in length, which passes next to several schools, salmon rearing ponds, and parks. Bike commuters, walkers/joggers, and skaters enjoy this trail.9 Daily Counts in Excel, Kulshan Creek Trail (18th St West Side)
9 Mt. Vernon Chamber of Commerce. Retrieved from http://www.mountvernonwa.gov/index.aspx?NID=622
F 4
Hourly Counts on Bike-Ped Portal, Kulshan Creek Trail (18th St West Side)
Start End Daily
Count Hourly Count PSU Observations Potential Cause
OKAY/ DON’T USE
GOOD/ BAD/ UNSURE
1/14/2008 1/14/2008 215 40-55 unusually high count OKAY GOOD
2/5/2008 2/7/2008 532; 221; 361 100-231 unusually high count special event? OKAY GOOD
12/31/2008 12/31/2008 269 108 unusually high count New Year’s Eve OKAY GOOD
The 2008 data looks to have some spikes, but there is no reason to believe that this is not real data. The spikes are within a reasonable range of the average daily count and do not appear to be a malfunction of the detector.
F 5
Daily Counts in Excel, Kulshan Creek Trail (18th St West Side)
Hourly Counts on Bike-Ped Portal, Kulshan Creek Trail (18th St West Side)
F 6
Start End Daily
Count Hourly Count PSU Observations Potential Cause
OKAY/ DON’T USE
GOOD/ BAD/ UNSURE
10/3/2011 10/3/2011 6,831 1,200+ unusually high count malfunction DON'T USE BAD
10/4/2011 10/4/2011 65,029 2,500+ unusually high count malfunction DON'T USE BAD
In 2011, the data clearly shows high spikes just before the end of the data set, which is highly suspect. There may have been a malfunction in the detector and therefore this data was not used in our analysis. Next, the research team zoomed in on this same data to a maximum of 500 on the vertical axis to look for any additional issues.
F 7
Daily Counts in Excel, Kulshan Creek Trail (18th St West Side)
Start End Daily
Count Hourly Count PSU Observations Potential Cause
OKAY/ DON’T USE
GOOD/ BAD/ UNSURE
6/16/2011 6/16/2011 420 253 unusually high count special event? OKAY UNSURE
9/11/2011 9/11/2011 475 144 unusually high count Sunday OKAY GOOD
While these spikes are unusually high counts for this data set, they are reasonable for a higher volume weekend or special event and are likely to be real data.
F 8
PADILLA BAY SHORE TRAIL, NORTH GATE
The Padilla Bay Shore Trail is a 2.25 mile multi-use path in Skagit County. It is located on top of a dike that is adjacent to the Padilla Bay and Skagit River Estuary.10
Start End Daily
Count Hourly Count PSU Observations Potential Cause
OKAY/ DON’T USE
GOOD/ BAD/ UNSURE
12/25/2009 12/25/2009 250 50-75 unusually high count special event? OKAY GOOD
12/26/2009 12/26/2009 472 109 unusually high count special event? OKAY GOOD
12/27/2009 12/27/2009 373 55-73 unusually high count special event? OKAY GOOD
2/20/2010 2/20/2010 555 108 unusually high count Saturday OKAY GOOD
2/21/2010 2/21/2010 485 107 unusually high count Sunday OKAY GOOD
3/6/2010 3/6/2010 453 30-80 unusually high count Saturday OKAY GOOD
5/9/2010 5/9/2010 445 30-95 unusually high count Sunday OKAY GOOD
5/15/2010 5/15/2010 670 50-348 unusually high count Saturday OKAY GOOD
Spikes in this data set indicated higher activity on weekends, which is likely for a multi-use trail that is predominantly for recreational use. It is possible that a special event occurred around Christmas that would account for higher counts from 12/25-12/27. 10 Padilla Bay Shore Trail. Retrieved from http://www.skagitcounty.net/Departments/ParksAndRecreation/parks/padilla.htm
F 9
Repeating zeroes from 12/05/2011-12/17/2011 look like a potential trail closure, although the same trail at the South Gate doesn’t show these zeroes over this same time period. However, it is not uncommon for there to be lower counts and zeroes during the winter months. North Gate Hourly Counts, October 2011-February 2012
South Gate Hourly Counts, October 2011-February 2012
F 10
North Gate Consecutive Zeroes from Bike-Ped Portal Upload Screen segment_name RunStart RunEnd RunLength
Padilla Bay Shore Trail (North Gate)
2011-12-05 14:00:00-08
2011-12-17 10:00:00-08
285
2011-11-22 06:00:00-08
2011-11-27 05:00:00-08
120
2012-01-02 16:00:00-08
2012-01-06 14:00:00-08
95
2011-11-17 15:00:00-08
2011-11-20 12:00:00-08
70
2012-01-30 13:00:00-08
2012-02-01 12:00:00-08
48
Bike-Ped Portal’s automated checks include looking for runs of consecutive zeroes. For this site, the run of 285 hours of consecutive zeroes was removed.
F 11
PADILLA BAY SHORE TRAIL, SOUTH GATE
Start End Daily Count PSU Observations Potential Cause
Unusually low counts in late August through September of 2011 appear as a dip in the graph. It is likely that there was construction on the trail or a closure for some reason that resulted in low counts.
F 12
Start End Daily Count Hourly Count PSU Observations
Potential Cause
OKAY/ DON’T USE
GOOD/ BAD/ UNSURE
5/20/2012 5/20/2012 41,953 1000+ unusually high count end of data DON'T USE BAD
5/21/2012 5/21/2012 28,125 1000+ unusually high count end of data DON'T USE BAD
In May 2012, the data spikes to 41k and then 28k the next day just prior to the end of the data set. This is likely to be a detector malfunction.
F 13
Start End Daily
Count Hourly Count PSU Observations
Potential Cause
OKAY/ DON’T USE
GOOD/ BAD/ UNSURE
11/15/2009 11/15/2009 2393 286 unusually high counts at night, 286 at 7pm Sunday
DON’T USE UNSURE
11/16/2009 11/16/2009 5270 626 unusually high counts at night, 626 at 3am Monday
DON’T USE UNSURE
11/17/2009 11/17/2009 3248 1370
unusually high count at night, spike at 2am (1370) Tuesday
DON’T USE UNSURE
11/18/2009 11/18/2009 3354 920 unusually high counts at night, 920 at 23:00 Wed
DON’T USE UNSURE
11/19/2009 11/19/2009 2360 890 unusually high counts at night, 890 at midnight Thurs
DON’T USE UNSURE
In mid-November 2009, the research team found five days where unusually high counts (e.g., hourly counts ranging from 286-1370) occurred at night. There is not enough evidence to conclude the cause of these high counts, but a reasonable guess is that they could be attributed to wildlife.
F 14
SKAGIT PLAYFIELDS (MARTIN ROAD WEST)
The Skagit Playfields are located next to the Skagit Community College. The fields may be reserved from March to October and the picnic shelter may be reserved from May to September for use.11 A multi-use, unpaved trail runs along the perimeter of the fields.
Start End Daily Count Hourly Count PSU Observations Potential Cause
Very low dips in April, May, and August when counts are regularly between 100-300 per day. While we are unsure of what may have caused these unusually low counts, it is likely to be real data.
11 Retrieved from http://www.skagitcounty.net/Departments/ParksAndRecreation/parks/playfields.htm
F 15
PORT OF SKAGIT CROSSWIND DRIVE
Located next to the airport, the Port of Skagit trail system spans 10 miles and is composed of wide, gravel trails.12 These trails are popular for walking, running, and biking.
Start End Daily Count Hourly Count PSU Observations Potential Cause
OKAY/ DON’T USE
GOOD/ BAD/ UNSURE
7/8/2010 8/9/2010 74-1691 unusual data and spikes start of shuttle file
DON'T USE UNSURE
This data was flagged as suspect because it differs largely from the usual pattern that tends to be with 50-100 people per day. The large spikes and dips in the counts are suspect, especially since the suspect data ranges over the period of one month. Additionally, some of the larger hourly counts occur overnight, which would be unlikely.
12 Retrieved from http://www.beactiveskagit.org/uploads/Port%20Trail%20System.pdf
G 1
APPENDIX G
Quality Control Reports for Portland, OR
G 2
Sites Provided by Metro in Portland, OR QC Report
The Metro data was collected using TRAFx Infrared Trail Counters by three different jurisdictions: Metro, Tualatin Hills Park & Recreation District (THPRD), and Explore Washington Park. These detectors count pedestrians, bicyclists, and any warm body that enters the detection zone. The raw data was provided through TRAFx DataNet, which is binned into hourly data. This data was adjusted for Daylight Savings Time and uploaded to Bike-Ped Portal. The data was quality checked for unusual patterns, spikes, unusually low counts, and zeroes using graphs of the volume over time found on Bike-Ped Portal. Unusually low counts and zeroes where there appeared to be temporary closures to the facility (e.g., holidays, snow events) were not removed. On DataNet, users were able to indicate data exclusions by day (but not by hour), which the research team considered excluding from the analysis. If the research team used these exclusions when they appeared to be excluded due to equipment malfunction, vandalism, or insect or other wildlife activity, but not when they appeared due to special events that genuinely increased pedestrian or bicycle activity.
Example of data exclusions for Fanno Creek at Hall found on TRAFx DataNet
Below are examples of common issues we came across when completing QC for these data sets.
G 3
FANNO CREEK AT HALL (SITE ID: 15)
This data is from a paved bike/pedestrian path that is part of the Fanno Creek Trail. The count was taken close to Hall Blvd where the path curves to briefly run parallel to the road before crossing. This facility is close to a retail area.
Above is a graph of all available raw data for Fanno Creek at Hall found on Bike-Ped Portal from July 1, 2010 to June 4, 2015. It shows a series of spikes and a data gap following the spikes. Below is a zoomed-in view of this same data from December 2012 to March 2013. Spikes occur before a data gap from January 3rd to March 3rd. Normally, this data ranges from 100-200 daily counts. This is likely an issue with the detector’s battery.
G 4
Start End Daily Count Hourly Count PSU observations
Exclusion on
DataNet Cause?
OKAY /DON'T
USE
GOOD/ BAD/
UNSURE
12/26/2012 3/9/2012 spikes 1000-
2600
series of spikes and a data gap from Jan 2, 2013- Mar 1, 2013
probably battery
DON'T USE UNSURE
12/26/2012 1/2/2013 1808 spike Y DON’T USE UNSURE
3/4/2013 3/4/2013 4056 spike Y Monday DON’T USE UNSURE
3/9/2013 3/9/2013 3312 spike Y Saturday DON’T USE UNSURE
3/23/2013 3/23/2013 615 seasonal variation Y Saturday OKAY UNSURE
G 5
BURLINGTON CREEK (SITE ID: 3)
This is site a pedestrian trail along a heavily forested, gravel road. The road is closed to motor vehicles and is located off of McNamee Rd.
Start End Daily Count Hourly Count PSU observations
Exclusion on
DataNet Cause?
OKAY /DON'T
USE
GOOD/ BAD/
UNSURE
7/11/2015 7/13/2015 0 0 zeroed out N
Possible reasons: construction closure, vandalism or equipment move.
DON'T USE UNSURE
7/29/2015 9/15/2015 mostly 0 0 zeroed out N
Possible reasons: construction closure, vandalism or equipment move.
DON'T USE UNSURE
The data is suspect because repeated zeroes are present in mid-July 2015 for two days and then again in late July through mid-September.
G 6
HAZELDALE PARK (SITE ID: 26)
This site is a paved path that connects a residential area to Hazeldale Park. The count is conducted underneath trees and includes pedestrians and bicyclists. There are also sports facilities nearby.
Start End Daily Count Hourly Count PSU observations
Exclusion on
DataNet Cause?
OKAY /DON'T
USE
GOOD/ BAD/
UNSURE
5/8/2011 5/12/2011 0-12 zeroed out N
DON'T USE UNSURE
This is an example of another site where zeroes are present for multiple days, this time in May. This could be a potential closure, although there was no evidence to confirm this.
G 7
WATERHOUSE TRAIL (NORTH) @ WALKER RD
Start End Daily Count Hourly Count PSU observations
Exclusion on
DataNet Cause? DON'T USE
GOOD/ BAD/
UNSURE
5/22/2014 5/22/2014 702 Thursday, unusually high counts Y OKAY UNSURE
5/27/2014 5/27/2014 515 Tuesday, unusually high counts Y OKAY UNSURE
5/30/2014 5/31/2014 720; 963 Fri-Sat, unusually high counts Y OKAY UNSURE
6/2/2014 6/2/2014 492 Monday, unusually high counts Y OKAY UNSURE
6/5/2014 6/6/2014 1035; 1217 Thurs-Fri, unusually high counts Y OKAY UNSURE
6/10/2014 6/11/2014 1252; 495 Tues-Wed, unusually high counts Y OKAY UNSURE
G 8
6/18/2014 6/20/2014 536; 1605;
637 309
Spike; unusually high counts followed by gap, Wed-Fri Y OKAY UNSURE
6/23/2014 6/23/2014 874 Monday, unusually high counts Y OKAY UNSURE
6/30/2014 6/30/2014 717 Monday, unusually high counts Y OKAY UNSURE
7/1/2014 7/1/2014 836 Tuesday, unusually high counts Y OKAY UNSURE
7/3/2014 9/11/2014 DATA GAP data gap data gap N DON'T USE N/A
Waterhouse Trail connects to the Rock Creek Regional Trail. It is a greenway surround by residential areas in a suburban setting. The hourly counts look okay around the morning peak (see examples for 5/22 and 5/27 below) and are reasonable counts for summer months. However, these counts were flagged as suspect originally because these patterns are very different from other years in the data set, occur before a data gap, and the spikes were excluded by the data provider (THPRD). Upon consulting the data provider the team was unable to secure documentation or reasons for why the data was originally excluded on DataNet, and therefore kept the data for our analysis because it was not unreasonable.
G 9
Date Time Count
5/22/2014 0:00 0
5/22/2014 1:00 0
5/22/2014 2:00 0
5/22/2014 3:00 0
5/22/2014 4:00 0
5/22/2014 5:00 0
5/22/2014 6:00 25
5/22/2014 7:00 94
5/22/2014 8:00 81
5/22/2014 9:00 111
5/22/2014 10:00 66
5/22/2014 11:00 85
5/22/2014 12:00 43
5/22/2014 13:00 29
5/22/2014 14:00 22
5/22/2014 15:00 30
5/22/2014 16:00 24
5/22/2014 17:00 15
5/22/2014 18:00 29
5/22/2014 19:00 35
5/22/2014 20:00 6
5/22/2014 21:00 2
5/22/2014 22:00 0
5/22/2014 23:00 5
G 10
Date Time Count
5/27/2014 0:00 1
5/27/2014 1:00 1
5/27/2014 2:00 0
5/27/2014 3:00 1
5/27/2014 4:00 1
5/27/2014 5:00 9
5/27/2014 6:00 12
5/27/2014 7:00 10
5/27/2014 8:00 27
5/27/2014 9:00 125
5/27/2014 10:00 80
5/27/2014 11:00 45
5/27/2014 12:00 51
5/27/2014 13:00 20
5/27/2014 14:00 19
5/27/2014 15:00 22
5/27/2014 16:00 17
5/27/2014 17:00 13
5/27/2014 18:00 24
5/27/2014 19:00 28
5/27/2014 20:00 7
5/27/2014 21:00 2
5/27/2014 22:00 0
5/27/2014 23:00 0
G 11
MCCARTHY CREEK
Counts by Day
Counts by Hour
G 12
Start End Daily
Count Hourly Count PSU observations
Exclusion on
DataNet Cause? DON'T USE
GOOD/ BAD/ UNSURE
9/10/2015 10/24/2015 150-600 100-200 Spikes; unusually high counts N
Could be school related use. USE UNSURE
This site has such low counts regularly that seeing any activity seems irregular. Sudden activity in September could be attributed to a school pattern. The weather is still nice in the fall, but activity then drops off again when the weather gets colder and rainier. The research team decided to use this site for the analysis, but leave it out of the factoring because it has such an odd pattern.
G 13
Miscellaneous Sites in Portland, OR QC Report The Portland data was collected using a variety of counting technologies including inductive loops, pneumatic tubes, and infrared from Portland Bureau of Transportation (PBOT), Metro, the regional metropolitan planning agency for Portland, the Oregon Department of Transportation (ODOT), and TriMet. The data was quality checked for unusual patterns, spikes, zeroes, and unusually low counts using graphs of the volume over time in Bike-Ped Portal, Eco-Visio, and PORTAL, a data archive for the Portland-Vancouver metro region. Unusually low counts and zeroes where there appeared to be temporary closures to the facility (e.g., holidays, snow events) were not removed. The research team excluded data that appeared to be due to equipment malfunction, but not when they appeared due to special events that genuinely increased pedestrian or bicycle activity. If counts spiked for just one or a few hours and the counts were below 1,000 per hour, we considered this an actual event, even if we could not find the event listed on the internet. However if such a spike was followed by a data gap, we felt this was indicative of a counter malfunction and excluded such spikes. If the high volumes (>200 per hour) continued into late and night and went on for days, we considered this a malfunction of some sort.
I-205 MULTI-USE PATH ON YAMHILL ST.
Data provided by ODOT for this site was available from June 2014 to May 2016. There are four data gaps in February and March of 2015 and 2016. January 4, 2016 has unusually low counts due to a snow event.
TONQUIN TRAIL
This trail is located in Wilsonville and is managed by Metro. The data is collected using an Eco-MULTI, which had various installation problems. A long string of zeroes occurs after a spike and before a data gap. Following this data gap, another long string of zeroes is observed. These observations occur for both the pedestrian and bicycle data.
G 14
G 15
TILIKUM CROSSING
A spike in the data of 14,723 on September 27, 2015 occurs because the route for PBOT’s Sunday Parkways, an open streets event, included the bridge. This was kept for the analysis since it could be verified.
G 16
A spike in the data of 14,723 on September 27, 2015 occurs because the route for PBOT’s Sunday Parkways, an open streets event, included the bridge. This was kept for the analysis since it could be verified.
G 17
SW MOODY AVE.
Because of technical issues in loading the graphs of raw data on Bike-Ped Portal, graphs in Eco-Visio were used instead. Unusually low counts from September 9-October 17, 2013 were kept. Repeated zeroes over a period of days were removed. Unusually low counts found before repeated zeroes for both southbound and northbound bikes from July 20-September 8, 2015, which were removed. There were no issues observed with spikes. Southbound
Northbound
G 18
BROADWAY BRIDGE
Repeated zeroes were the only issues observed in this data, aside from data gaps.
South Sidewalk (Eastbound)
This is the typical flow that most cyclists going eastbound will follow on the Broadway Bridge. Higher volumes are expected for this flow. The only observable issue was repeated zeroes between March 27-April 2, 2015.
G 19
Southside Sidewalk (Westbound)
There are expected to be lower volumes on the south sidewalk riding westbound because it is contraflow to the higher volumes going eastbound on the same side. Most cyclists going westbound chose to be on the north sidewalk. The counts during this time appear to be abnormally more than the typical patterns observed. It is possible that this may be due to construction occurring on the bridge that closed the north sidewalk, thus requiring cyclists going eastbound and westbound to share.
G 20
North Sidewalk (Westbound)
Higher volumes are expected for westbound cyclists on the north sidewalk as this is the typical observed flow.
G 21
G 22
North Sidewalk (Eastbound)
Lower volumes are expected for eastbound cyclists on the north sidewalk as this is not the typical observed flow.
G 23
RIVERWALK (LOWER DECK OF THE STEEL BRIDGE)
Repeated zeroes from a few days to a month were observed for the same time periods for both the eastbound and westbound counts over four periods.
G 24
Eastbound
G 25
Westbound
G 26
SPRINGWATER TRAIL AT 82ND
West Side, 1/1/2012 - Present
G 27
G 28
East Side
G 29
NW 9TH AVE (N OF NW LOVEJOY ST)
G 30
I 1
APPENDIX I
Weekday/Weekend Index (WWI) Analysis
I 2
Summary of WWI
WWI = Vwe /Vwd where: Vwe = average weekend daily traffic Vwd = average weekday daily traffic (Miranda-Moreno 2013)
BAA Cutoffs Weekday Commute: Average WWI <=0.8 Weekly Multipurpose: 0.8<(Average WWI)<=1.2 Weekend Multipurpose: Average WWI >1.2
Collecting Network-wide Bicycle and Pedestrian Data: A Guidebook for When and Where to Count / Dylan Johnstone, Krista Nordback, Michael Lowry. Transportation Research and Education Center (TREC). Portland State University. September 2017.
Published separately as WA-RD 875.1, available here:
Americans with Disabilities Act (ADA) Information: This material can be made available in an alternate format by emailing the Office of Equal Opportunity at [email protected] or by calling toll free, 855-362-4ADA(4232). Persons who are deaf or hard of hearing may make a request by calling the Washington State Relay at 711.
Title VI Statement to Public: It is the Washington State Department of Transportation’s (WSDOT) policy to assure that no person shall, on the grounds of race, color, national origin or sex, as provided by Title VI of the Civil Rights Act of 1964, be excluded from participation in, be denied the benefits of, or be otherwise discriminated against under any of its federally funded programs and activities. Any person who believes his/her Title VI protection has been violated, may file a complaint with WSDOT’s Office of Equal Opportunity (OEO). For additional information regarding Title VI complaint procedures and/or information regarding our non-discrimination obligations, please contact OEO’s Title VI Coordinator at (360) 705-7082.