1 Optimizing the Analysis of Naphtha by ICP-OES Introduction Trace metal content in naphtha is important for a number of reasons 1 . The presence of metals such as nickel during the cracking process can poison the expensive catalyst, while vanadium causes corrosion problems. During the refining process, release of toxic metals such as lead, mercury, and arsenic must be monitored and minimized. The presence of trace metals is also used to gain insight into the geological origin and migration of crude oil to aid in exploration. The analysis of naphtha by ICP- OES is complicated by the high volatility of the sample, which can overload the plasma. It is therefore often diluted with a suitable solvent such as kerosene or xylene to facilitate the analysis. Unfortunately, due to the low levels of detection desired, dilution may not always be a viable course of action. In this paper, we will determine the optimum parameters to analyze naphtha directly without dilution. Experimental An iCAP 6500 Duo ICP spectrometer (ThermoFisher Scientific, Waltham, MA) was used for all measurements. The following components were incorporated (all from Glass Expansion, Melbourne, Australia): • Spray chamber: IsoMist XR Programmable Temperature Spray Chamber • Torch: D-Torch with alumina inner tube and ceramic outer tube • Injector: Quartz tapered 1.0mm bore • Nebulizer: SeaSpray glass concentric with 0.4mL/min uptake • Pump tubing: Contour Flared-end Solva two tag, Orange/ Yellow 0.51mm ID. The IsoMist XR (Glass Expansion) was used to control spray chamber temperature. The IsoMist XR has a range of -25 o C to +80 o C in increments of 1 o C and accuracy of + /-0.1 o C. It is controlled with proprietary software via a USB port or wireless Bluetooth ® technology. Photos of the IsoMist XR and the encapsulated glass spray chamber (which resides inside the IsoMist housing) are shown in Figure 1. The encapsulation resin is temperature conductive to achieve rapid heat transfer. The resin is also molded to fit the chamber cavity so that there is no dead volume. This is particularly important at temperatures well below the freezing point as were employed here in order to eliminate condensation and freezing. A screen display of the temperature vs. time graph is shown in Figure 2 (page 2). Due to the enhanced insulation and temperature conductivity, the device is able to go from room temperature to -25 o C in about 20 minutes. Similar to all IsoMist models, the one used here includes a torch interface kit specific to the iCAP Duo. Although also available in quartz and PFA, the chamber used here was made of borosilicate glass. The uptake rate of the naphtha was measured with a TruFlo sample monitor (Glass Expansion) which was calibrated for naphtha. The standard TruFlo is calibrated for aqueous matrices but Glass Expansion offers a service to calibrate it for other solvents. The instrument parameters employed are listed here Plasma gas flow rate (L/min) 16 Auxiliary gas flow rate (L/min) 2 Forward Power (watts) 1350 Nebulizer gas flow rate (L/min) 0.28 and 0.38 Sample uptake rate (mL/min) 0.5 Spray chamber temperature ( o C) -10 and -25 Figure 1: IsoMist XR™ Controlled Temperature Spray Chamber Accessory and encapsulated cyclonic spray chamber
Transcript
1
Optimizing the Analysis of Naphtha by ICP-OESIntroductionTrace metal content in naphtha is important for a number of reasons1. The presence of metals such as nickel during the cracking process can poison the expensive catalyst, while vanadium causes corrosion problems. During the refining process, release of toxic metals such as lead, mercury, and arsenic must be monitored and minimized. The presence of trace metals is also used to gain insight into the geological origin and migration of crude oil to aid in exploration. The analysis of naphtha by ICP-OES is complicated by the high volatility of the sample, which can overload the plasma. It is therefore often diluted with a suitable solvent such as kerosene or xylene to facilitate the analysis. Unfortunately, due to the low levels of detection desired, dilution may not always be a viable course of action. In this paper, we will determine the optimum parameters to analyze naphtha directly without dilution.
ExperimentalAn iCAP 6500 Duo ICP spectrometer (ThermoFisher Scientific, Waltham, MA) was used for all measurements. The following components were incorporated (all from Glass Expansion, Melbourne, Australia):
• Spray chamber: IsoMist XR Programmable Temperature Spray Chamber
• Torch: D-Torch with alumina inner tube and ceramic outer tube
• Injector: Quartz tapered 1.0mm bore
• Nebulizer: SeaSpray glass concentric with 0.4mL/min uptake
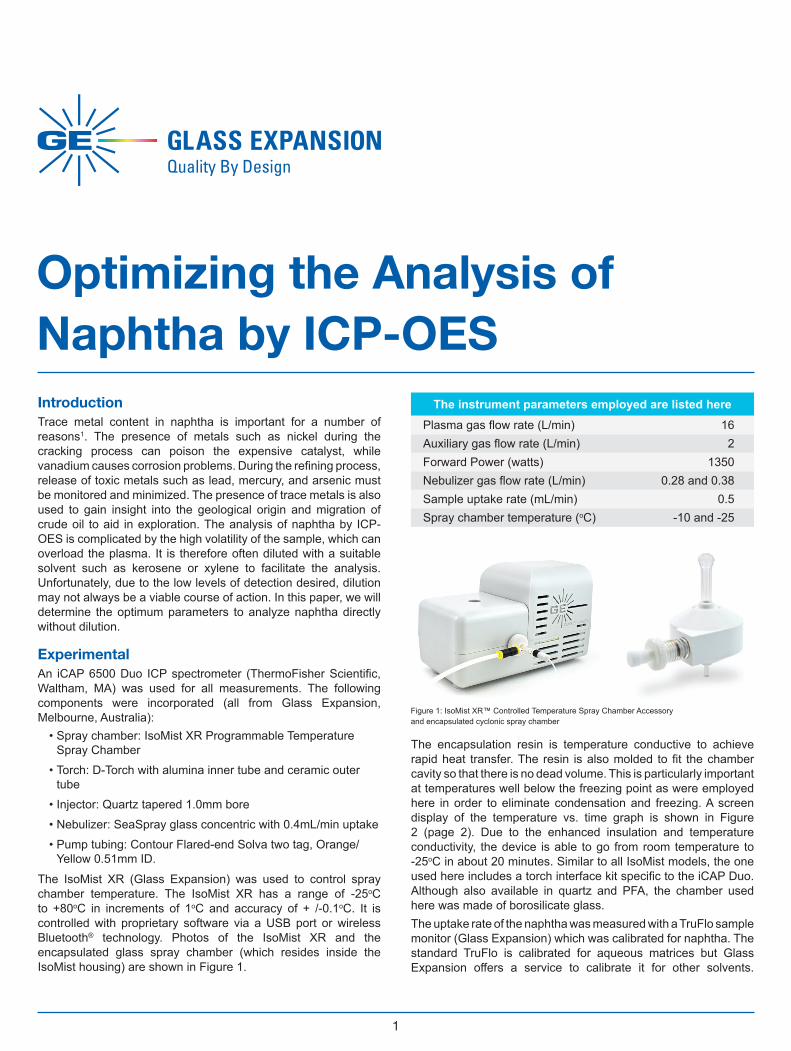
The IsoMist XR (Glass Expansion) was used to control spray chamber temperature. The IsoMist XR has a range of -25oC to +80oC in increments of 1oC and accuracy of + /-0.1oC. It is controlled with proprietary software via a USB port or wireless Bluetooth® technology. Photos of the IsoMist XR and the encapsulated glass spray chamber (which resides inside the IsoMist housing) are shown in Figure 1.
The encapsulation resin is temperature conductive to achieve rapid heat transfer. The resin is also molded to fit the chamber cavity so that there is no dead volume. This is particularly important at temperatures well below the freezing point as were employed here in order to eliminate condensation and freezing. A screen display of the temperature vs. time graph is shown in Figure 2 (page 2). Due to the enhanced insulation and temperature conductivity, the device is able to go from room temperature to -25oC in about 20 minutes. Similar to all IsoMist models, the one used here includes a torch interface kit specific to the iCAP Duo. Although also available in quartz and PFA, the chamber used here was made of borosilicate glass.The uptake rate of the naphtha was measured with a TruFlo sample monitor (Glass Expansion) which was calibrated for naphtha. The standard TruFlo is calibrated for aqueous matrices but Glass Expansion offers a service to calibrate it for other solvents.
The instrument parameters employed are listed herePlasma gas flow rate (L/min) 16Auxiliary gas flow rate (L/min) 2Forward Power (watts) 1350Nebulizer gas flow rate (L/min) 0.28 and 0.38Sample uptake rate (mL/min) 0.5Spray chamber temperature (oC) -10 and -25
Figure 1: IsoMist XR™ Controlled Temperature Spray Chamber Accessory and encapsulated cyclonic spray chamber
2
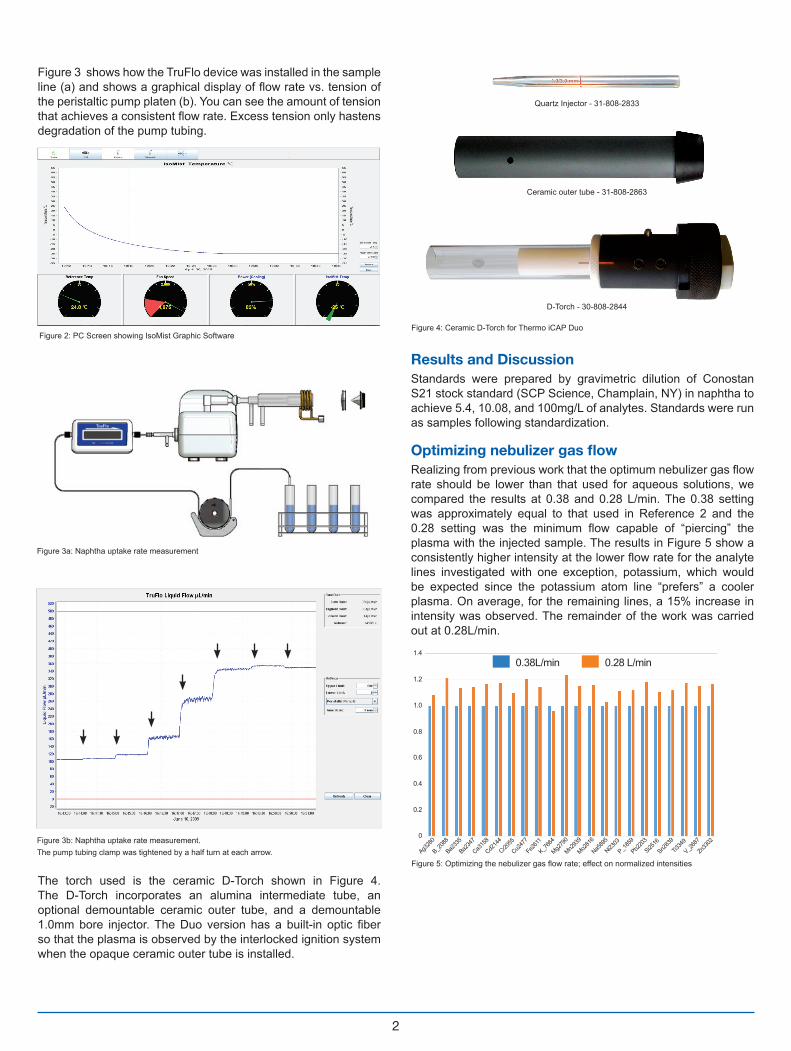
Figure 3 shows how the TruFlo device was installed in the sample line (a) and shows a graphical display of flow rate vs. tension of the peristaltic pump platen (b). You can see the amount of tension that achieves a consistent flow rate. Excess tension only hastens degradation of the pump tubing.
The torch used is the ceramic D-Torch shown in Figure 4. The D-Torch incorporates an alumina intermediate tube, an optional demountable ceramic outer tube, and a demountable 1.0mm bore injector. The Duo version has a built-in optic fiber so that the plasma is observed by the interlocked ignition system when the opaque ceramic outer tube is installed.
Results and DiscussionStandards were prepared by gravimetric dilution of Conostan S21 stock standard (SCP Science, Champlain, NY) in naphtha to achieve 5.4, 10.08, and 100mg/L of analytes. Standards were run as samples following standardization.
Optimizing nebulizer gas flow Realizing from previous work that the optimum nebulizer gas flow rate should be lower than that used for aqueous solutions, we compared the results at 0.38 and 0.28 L/min. The 0.38 setting was approximately equal to that used in Reference 2 and the 0.28 setting was the minimum flow capable of “piercing” the plasma with the injected sample. The results in Figure 5 show a consistently higher intensity at the lower flow rate for the analyte lines investigated with one exception, potassium, which would be expected since the potassium atom line “prefers” a cooler plasma. On average, for the remaining lines, a 15% increase in intensity was observed. The remainder of the work was carried out at 0.28L/min.
Figure 2: PC Screen showing IsoMist Graphic Software
Figure 3a: Naphtha uptake rate measurement
Figure 3b: Naphtha uptake rate measurement. The pump tubing clamp was tightened by a half turn at each arrow.
Figure 4: Ceramic D-Torch for Thermo iCAP Duo
Quartz Injector - 31-808-2833
Ceramic outer tube - 31-808-2863
Figure 5: Optimizing the nebulizer gas flow rate; effect on normalized intensities
Figure 5: Optimizing the nebulizer gas flow rate; effect on normalized intensities
1.4
1.2
1.0
0.8
0.6
0.4
0.2
Ag328
0
B_208
8
Ba233
5
Ba234
7
Ca315
8
Cd214
4
Cr2055
Cu247
7
Fe26
11
K_766
4
Mg279
0
Mn293
9
Mo281
6
Na589
5
Ni2303
P_185
9
Pb220
3
Si2516
Sn283
9
Ti334
9
V_268
7
Zn33
020
0.38L/min 0.28 L/min
D-Torch - 30-808-2844
3
Optimizing Spray Chamber TemperaturePrevious work with naphtha2,3 was performed with a standard IsoMist which was limited to -10oC for the low end. With the IsoMist XR, temperatures as low as -25oC could be achieved and maintained. We therefore compared the results at -10oC and -25oC to see if improvement could be realized. Figure 6 shows an approximate 100% increase in intensities on average for all lines. Figure 7 compares the precision at the low and high standards. At the low end (a), some of the lines run at -10oC appear to show intensity-related poor precision not seen at -25oC. This goes away in large part for the high concentration standard (b) but the precision is still consistently better at -25oC. As expected then, accuracy is also higher at the -25oC temperature (Figure 8).
ReproducibilityShort term reproducibility was examined over a two hour period and the results shown in Figure 9 (page 4) are quite acceptable with an average difference of 3.3 %. To test longer term reproducibility, the experiment was repeated 5 days later. Results in Figure 10 (page 4) show a high degree of consistency with an average deviation of 2.6% for the 5.4 ppm standard and 3.1% for the 10.08ppm standard.
Figure 6: Effect of Spray Chamber Temperature on Intensity
Figure 6: Effect of Spray Chamber Temperature on Intensity
Figure 7a: Precision Comparison (%RSD)
Figure 7b: Precision Comparison (%RSD)
Figure 7: Precision Comparison (%RSD)
Figure 7: Precision Comparison (%RSD)
0
20
-25oC
-25oC
-10oC
-10oC
40
Ag328
0
B_208
8
Ba233
5
Ba234
7
Ca315
8
Cd214
4
Cr2055
Cu247
7
Fe26
11
K_766
4
Mg279
0
Mn293
9
Mo281
6
Ni2303
P_185
9
Pb220
3
Si2516
Sn283
9
Ti334
9
V_268
7
Zn33
02
Ag328
0
Al3092
B_208
8
Ba233
5
Ba234
7
Ca315
8
Cd214
4
Cr2055
Cu247
7
Fe26
11
K_766
4
Mg279
0
Mn293
9
Mo281
6
Ni2303
P_185
9
Pb220
3
Si2516
Sn283
9
V_268
7
Zn33
02
Ag328
0
B_208
8
B_208
8
Ba233
5
Ca315
8
Cd214
4
Cr2055
Cu247
7
Fe26
11
K_766
4
Mg279
0
Mn293
9
Mo281
6
Ni2303
Na589
5
P_185
9
Pb220
3
Si2516
Sn283
9
V_268
7
Zn33
02
-25oC -10oC
60
80
100
120
Figure 8: Accuracy Comparison at 5.4ppm
Figure 8: Accuracy Comparison at 5.4ppm
Ag328
0
B_208
8
Ba233
5
Ba234
7
Ca315
8
Cd214
4
Cr2055
Cu247
7
Fe26
11
K_766
4
Mg279
0
Mn293
9
Mo281
6
Ni2303
Na589
5
P_185
9
Pb220
3
Si2516
Sn283
9
V_268
7
Zn33
020
1
2
3
4
5
6
7
8
9 -25oC -10oC
Figure 9: Intensity Reproducibility over two hours
Figure 9: Intensity Reproducibility over two hoursAg3
280
Al3092
B_208
8
Ba233
5
Ba234
7
Ca315
8
Cd214
4
Cr2055
Cu247
7
Fe26
11
K_766
4
Mg279
0
Mn293
9
Mo281
6
Ni2303
Na589
5
P_185
9
Pb220
3
Si2516
Sn283
9
V_268
7
Ti334
9
Zn33
020
0.10.20.30.40.50.60.70.80.91.01.11.21.3
conc
ernt
ratio
n (p
pm)
12:10 14:25
4
Detection LimitsBoth method detection limits (MDL) and method quantification limits (MQL) were calculated and are shown in Table II. In almost all cases, MDL’s are in the ppb range. All are adequate for measuring metals in naphtha for the purposes described in the introduction.
SummaryFor the optimum analysis of naphtha, it was found that the lowest practical nebulizer gas flow of 0.28L/min gave the best performance. Using the IsoMist Programmable Temperature spray chamber at a temperature of -25oC rather than -10oC gave higher intensities, better precision, and higher accuracy. Using the proper sample introduction components and the stated parameters, accurate, precise, and reproducible results could be achieved without dilution of the naphtha.
Figure 10: Five Day Reproducibility
Figure 10: Five Day Reproducibility
0
2.0
4.0
6.0
8.0
10.0
12.0
March 18 - 5.4ppm March 18 - 10ppm March 23 - 5.4ppm March 23 - 10ppm
Ag328
0
Ba233
5
Ba234
7
Ca315
8
Cd214
4
Cr2055
Cu247
7
Fe26
11
K_766
4
Mg279
0
Mn293
9
Mo281
6
Ni2303
P_185
9
Pb220
3
Si2516
Sn283
9
V_268
7
Zn33
02
Table II: Limits of Detection and Quantification
Line Predicted MDL(ppm) Predicted MQL(ppm)Ag3280 0.0013 0.0045
B_2088 0.0442 0.1473
Ba2335 0.0004 0.0014
Ba2347 0.0132 0.0442
Ca3158 0.0034 0.0114
Cd2144 0.0004 0.0014
Cr2055 0.0028 0.0094
Cu2247 0.0031 0.0102
Fe2611 0.0021 0.0072
K_7664 0.0058 0.0194
Mg2790 0.0147 0.0489
Mn2939 0.0017 0.0055
Mo2816 0.002 0.0067
Na5895 0.0042 0.0139
Ni2303 0.0075 0.0249
P_1859 0.0112 0.0375
Pb2203 0.0045 0.0149
S_1826 0.0696 0.232
Si2516 0.00194 0.0064
Sn2839 0.0074 0.0249
V_2687 0.0022 0.0073
Zn3302 0.151 0.5035
REfERENCES1. S. J. Kumar and S. Gangadharan, J. Anal. At. Spectrom., 1999, 14, 967-971.
2. M. Cassap, Thermo Fisher Applications Note #40899, 2010.
3. J. Dulude, V. Dolic, and R. Stux, Glass Expansion Application Note # 010407, 2007.