94
Optimizing Tradeoffs of NonFunctional Properties in Software Jonathan Dorn July 20, 2017

Optimizing Tradeoffs of Non-‐Functional Properties in Software Jonathan Dorn July 20, 2017

2

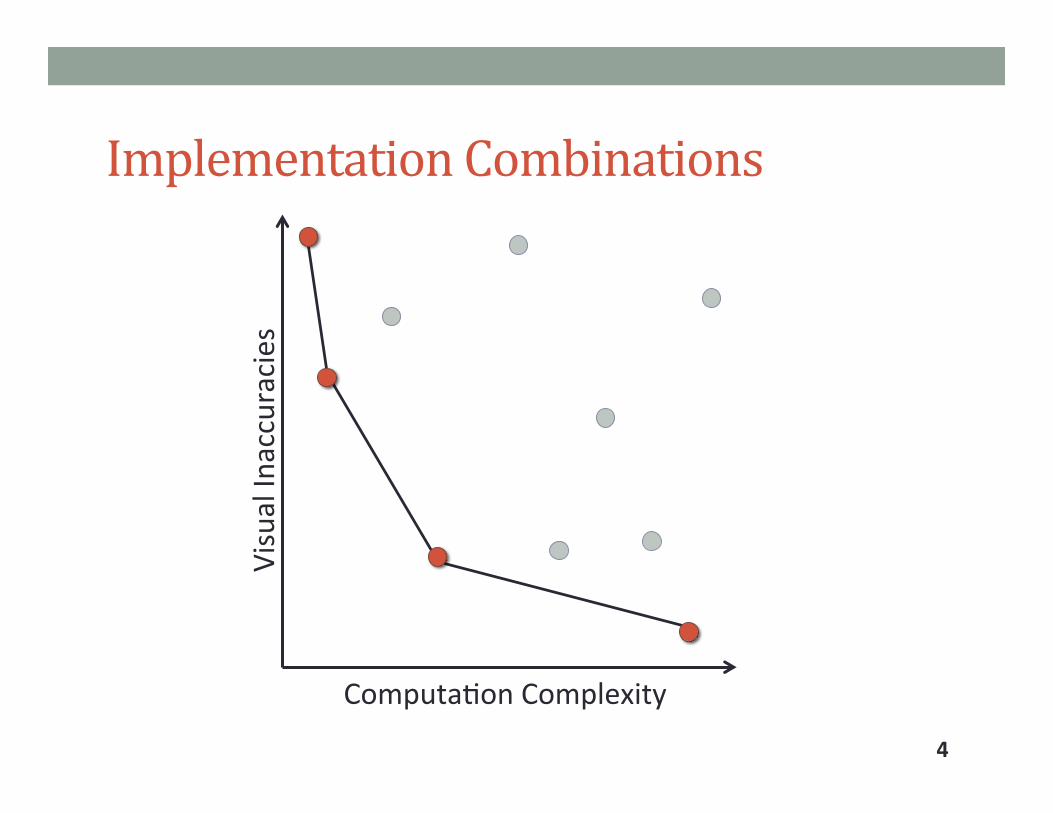
Implementation Combinations
3
Computa5on Complexity
Visual Inaccuracies
Implementation Combinations
4
Visual Inaccuracies
Computa5on Complexity

Implementation Combinations
5
Visual Inaccuracies
Computa5on Complexity

Thesis
Search-‐based so=ware engineering techniques
applying local so=ware transforma5ons can
automa5cally and effec5vely explore tradeoffs
between a variety of measurable non-‐func3onal
proper3es in exis5ng so=ware ar5facts with
indica5ve workloads across applica5on domains.
6

Non-‐Functional Properties
• Not “what” a program does, but “how well.” • “More” or “less;” “higher” or “lower.”
• Characterize implementa5ons by how much of a property they posses.
• O=en interact via tradeoffs. • E.g., performance vs. maintainability.
7

Optimization Philosophy
Program Transforma5ons
• Un-‐annotated source code. • “Raw” C, Java, assembly.
• Local transforma5ons. • E.g., change one func5on call or one line. • Likely to be independent.
Program Proper5es
• Retain func5onality.
• Improvement correlated with human percep5on.
• Es5mate proper5es automa3cally.
8

Insights
• Adapt program repair. • Evolu3onary search: Modify an exis5ng “nearly correct” implementa5on. • Regression tes3ng: Only consider programs that retain func5onality.
• Adapt profile-‐guided op5miza5on. • Indica3ve workloads: Short runs can indicate important opportuni5es.
9

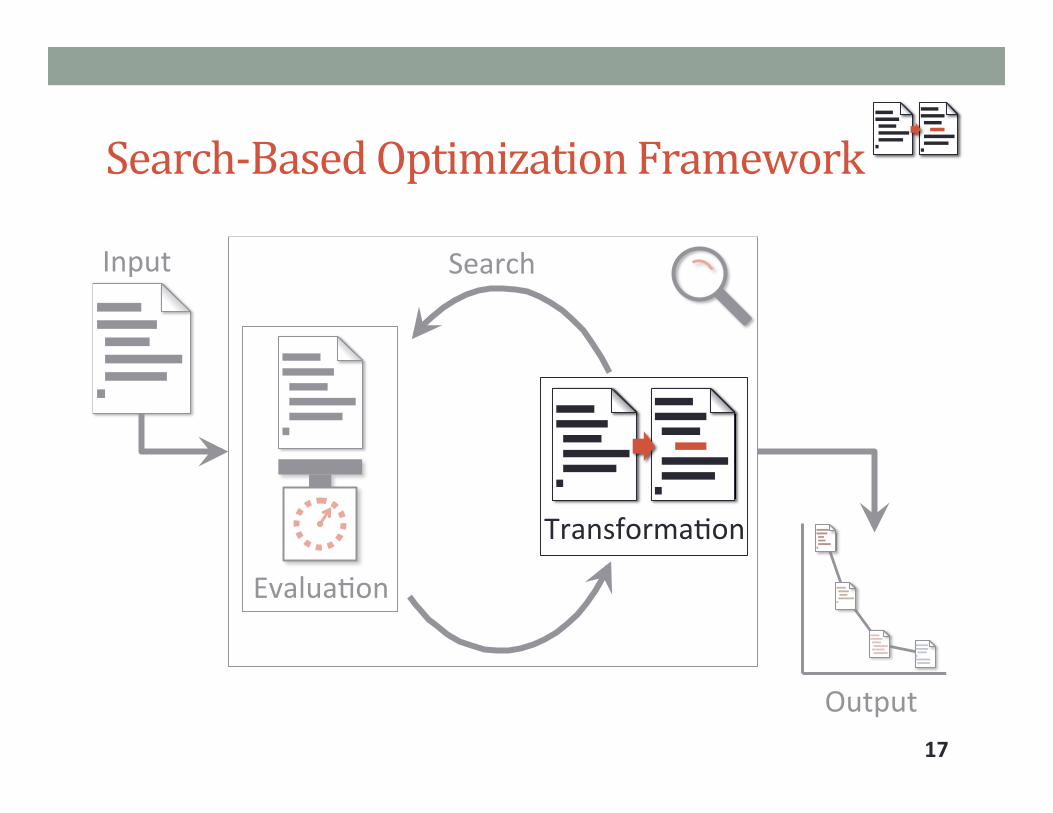
Search-‐Based Optimization Framework
10
Input
Evalua5on
Transforma5on
Search
Output
Evolu3onary search
Regression tes3ng
Indica3ve workloads
Independent local transforma3ons

Search-‐Based Optimization Framework
11
Input
Evalua5on
Transforma5on
Search
Output

Outline
Overview
Applica5on Domains Graphics: Run Time and Visual Quality Data Centers: Output Accuracy and Energy Use Unit Tests: Readability and Test Coverage
Concluding Thoughts
12
Outline
Overview
Applica5on Domains Graphics: Run Time and Visual Quality Data Centers: Output Accuracy and Energy Use Unit Tests: Readability and Test Coverage
Concluding Thoughts
13

Computer Generated Imagery • Video games topped $90B in 2015.* • Diagnos5c imaging projected to top $30B by 2021.**
• Applica5ons demand: • High-‐quality visuals. • Interac5ve performance.
14
* hcp://www.gamesindustry.biz/ar5cles/2015-‐04-‐22-‐gaming-‐will-‐hit-‐usd91-‐5-‐billion-‐this-‐year-‐newzoo ** hcp://www.marketsandmarkets.com/PressReleases/diagnos5c-‐imaging-‐market.asp

Aliasing Example
15
Credit “Moire pacern of bricks” by Colin M.L. Burnec, via Wikimedia Commons, licensed under CC BY-‐SA 3.0.
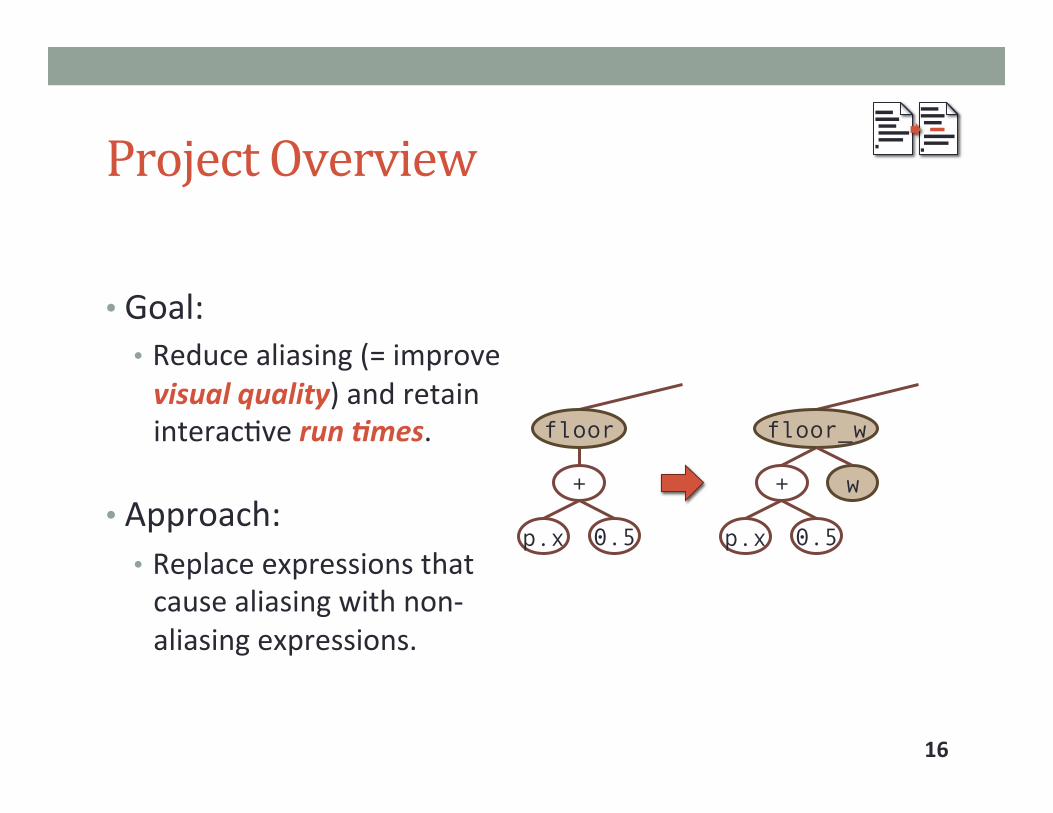
Project Overview
• Goal: • Reduce aliasing (= improve visual quality) and retain interac5ve run 3mes.
• Approach: • Replace expressions that cause aliasing with non-‐aliasing expressions.
16
+
p.x 0.5
floor
+
p.x 0.5
floor_w
w
Search-‐Based Optimization Framework
17
Input Search
Output
Evalua5on
Transforma5on
●
●
● ●
●
●
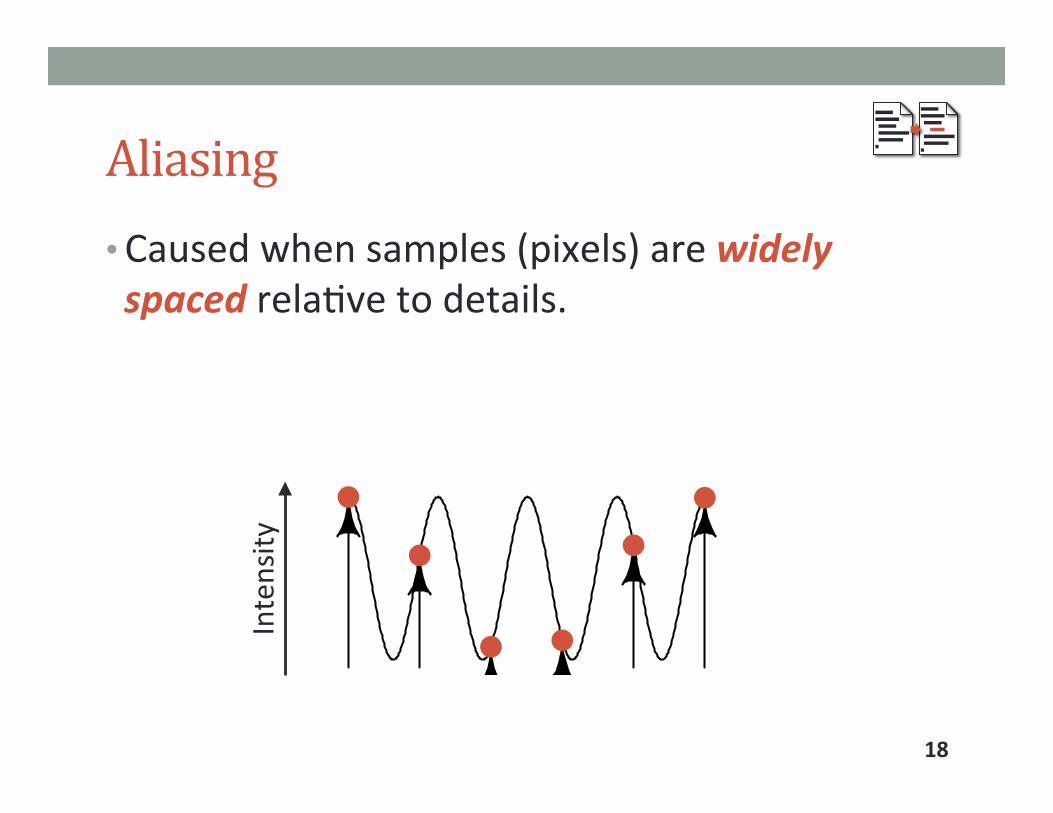
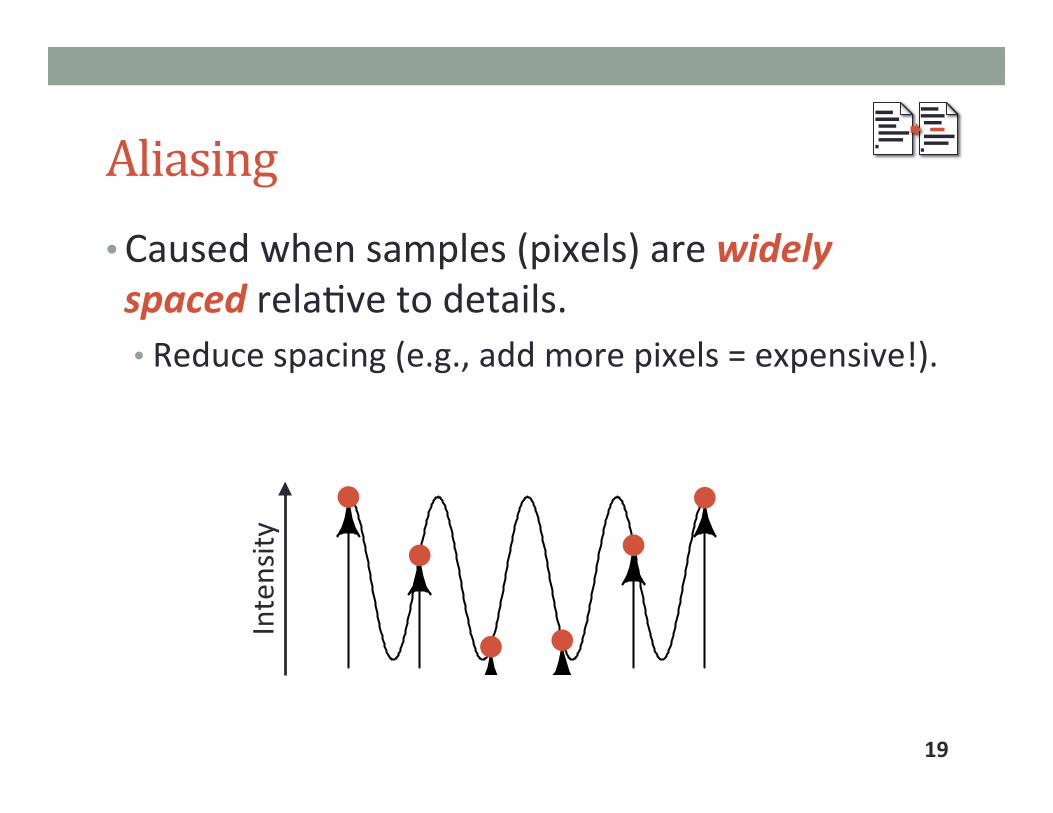
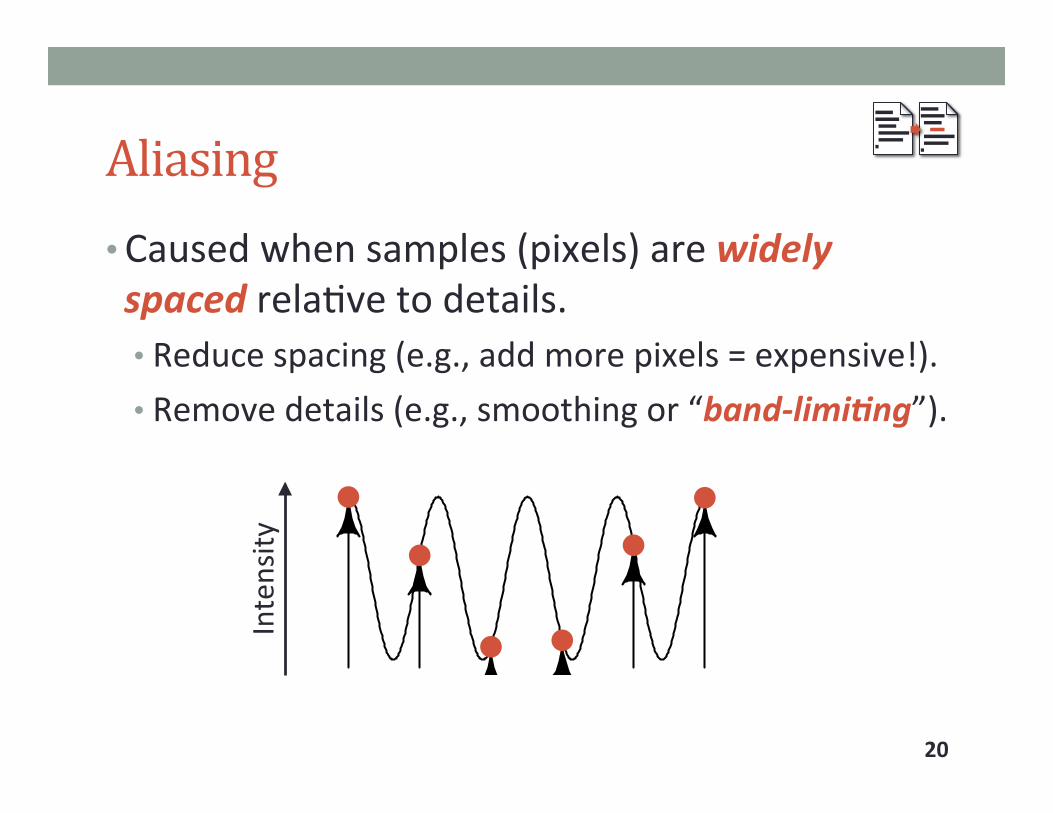
Aliasing • Caused when samples (pixels) are widely spaced rela5ve to details.
18
Intensity
●
●
● ●
●
●
Aliasing • Caused when samples (pixels) are widely spaced rela5ve to details. • Reduce spacing (e.g., add more pixels = expensive!).
19
Intensity
●
●
● ●
●
●
Aliasing • Caused when samples (pixels) are widely spaced rela5ve to details. • Reduce spacing (e.g., add more pixels = expensive!). • Remove details (e.g., smoothing or “band-‐limi3ng”).
20
Intensity

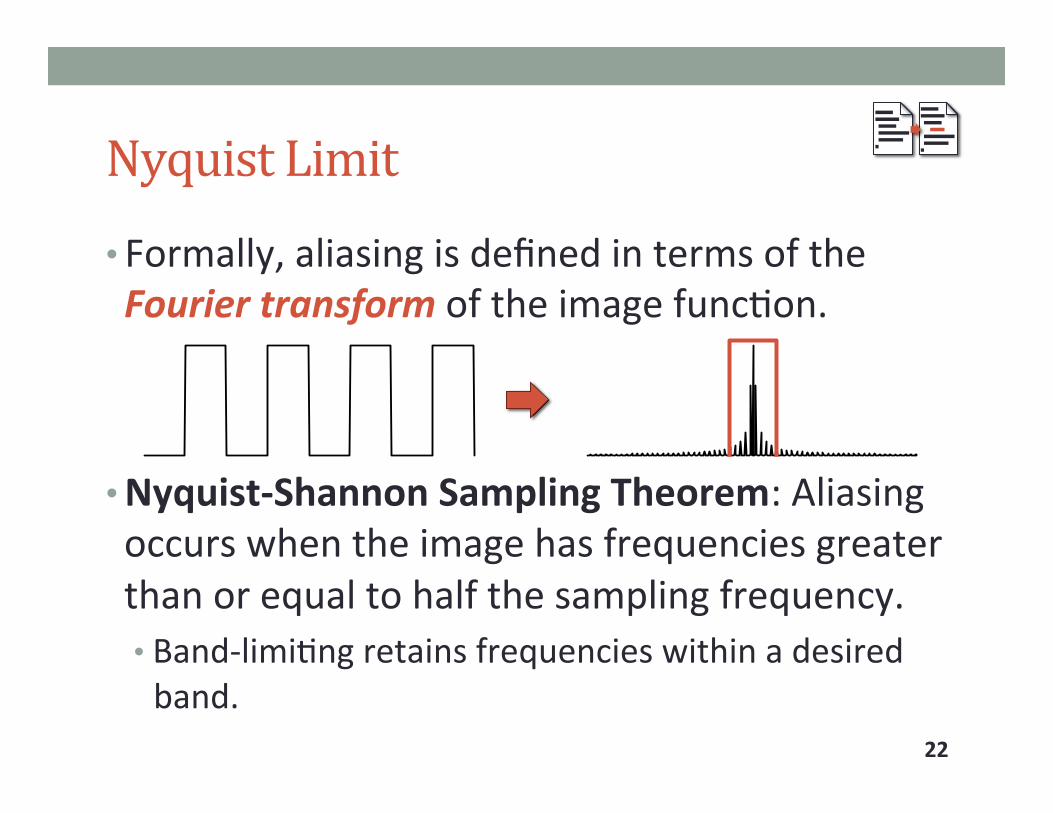
• Formally, aliasing is defined in terms of the Fourier transform of the image func5on.
• Nyquist-‐Shannon Sampling Theorem: Aliasing occurs when the image has frequencies greater than or equal to half the sampling frequency. • Band-‐limi5ng retains frequencies within a desired band.
Nyquist Limit
21
• Formally, aliasing is defined in terms of the Fourier transform of the image func5on.
• Nyquist-‐Shannon Sampling Theorem: Aliasing occurs when the image has frequencies greater than or equal to half the sampling frequency. • Band-‐limi5ng retains frequencies within a desired band.
Nyquist Limit
22

Convolution Theorem • Product of Fourier transforms of f and g is equal to the Fourier transform of the convolu3on of f and g:
23
fg
F [f ] · F [g] = F [f ∗ g]
f ∗ g =
∫ ∞
−∞
f (x− x′)g(x′) dx′
fg
F [f ] · F [g] = F [f ∗ g]
f ∗ g =
∫ ∞
−∞
f (x− x′)g(x′) dx′fg
F [f ] · F [g] = F [f ∗ g]
f ∗ g =
∫ ∞
−∞
f (x− x′)g(x′) dx′
fg
F [f ] · F [g] = F [f ∗ g]
f ∗ g =
∫ ∞
−∞
f (x− x′)g(x′) dx′
fg
F [f ] · F [g] = F [f ∗ g]
f ∗ g =
∫ ∞
−∞
f (x− x′)g(x′) dx′

f̂ (x, w) =
∫∞
−∞
f (x− x′)g(x′, w) dx
Band-‐Limiting • Convolve the image with a filter before sampling.
24

• Convolve the image with a filter before sampling.
• Convolving shader programs. • Insight: compose band-‐limited sub-‐components.
Band-‐Limiting
25
f̂ (x, w) =
∫∞
−∞
f (x− x′)g(x′, w) dx
Our Band-‐Limiting Transformation
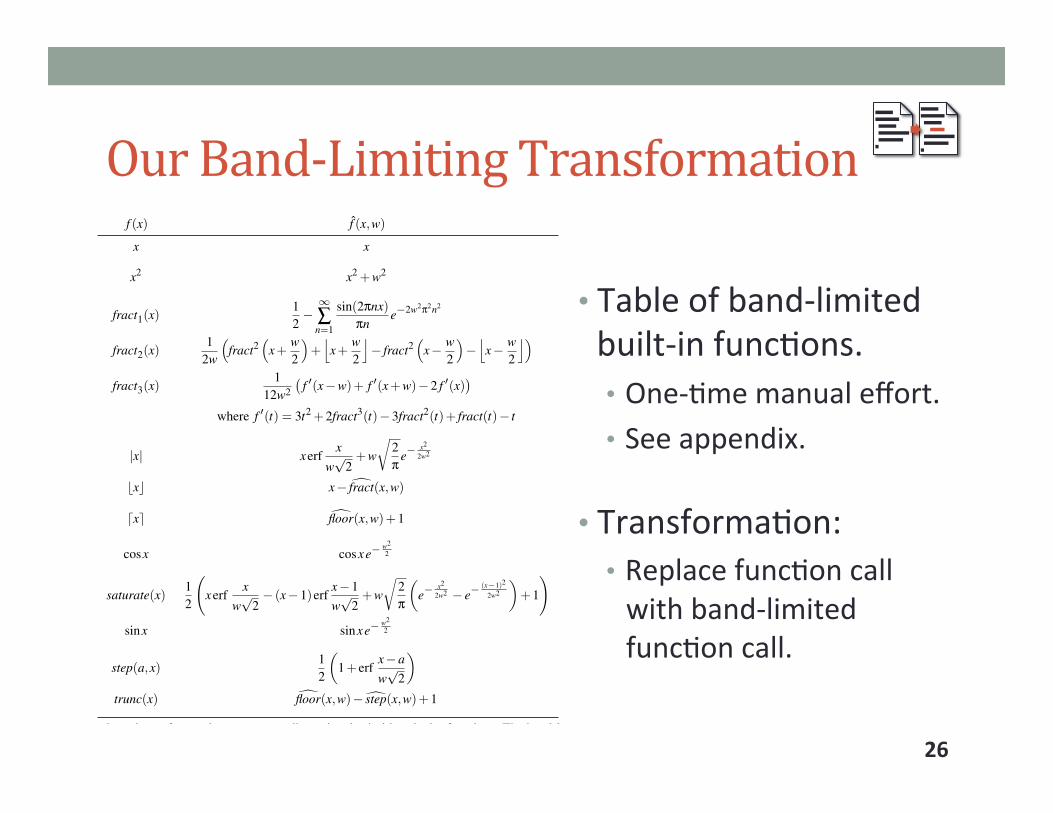
• Table of band-‐limited built-‐in func5ons. • One-‐5me manual effort. • See appendix.
• Transforma5on: • Replace func5on call with band-‐limited func5on call.
26
J. Dorn & C. Barnes & J. Lawrence & W. Weimer / Towards Automatic Band-Limited Procedural Shaders
f (x) f̂ (x,w)
x x
x2 x2 +w2
fract1(x)12�
1Ân=1
sin(2pnx)pn
e�2w2p2n2
fract2(x)1
2w
⇣fract2
⇣x+
w2
⌘+j
x+w2
k� fract2
⇣x� w
2
⌘�j
x� w2
k⌘
fract3(x)1
12w2�
f 0(x�w)+ f 0(x+w)�2 f 0(x)�
where f 0(t) = 3t2 +2fract3(t)�3fract2(t)+ fract(t)� t
|x| xerfx
wp
2+w
r2p e�
x2
2w2
bxc x� dfract(x,w)
dxe dfloor(x,w)+1
cosx cosxe�w22
saturate(x)12
xerf
xwp
2� (x�1)erf
x�1wp
2+w
r2p
✓e�
x2
2w2 � e�(x�1)2
2w2
◆+1
!
sinx sinxe�w22
step(a,x)12
✓1+ erf
x�awp
2
◆
trunc(x) dfloor(x,w)�dstep(x,w)+1
Table 1: Band-limited versions of several common one-dimensional primitive shader functions. The band-limiting kernel usedto derive the second column is the Gaussian function with a standard deviation equal to the sample spacing w. The fract function,used as the basis of bxc, dxe, and trunc(x), is defined: fract(x) = x�bxc. The different versions of the fract function correspondto the different approximation strategies described in the paper (Section 3.3). The trunc function truncates its argument to thenearest integer in the direction of zero. The Gauss error function is denoted by erf.
To construct the band-limited shader, we first determinethe projections of the screen-space x and y vectors. For ex-ample, in the the OpenGL Shading Language these are avail-able as dFdx(p) and dFdy(p) [RLK09]. Given these two vec-tors, we then use the axis-aligned approximation (see Sec-tion 3.2) to compute the sample spacing in the surface coor-dinate system.
We compose the body of the band-limited shader in abottom-up fashion. Table 1 provides the implementation ofa properly band-limited floor function. We simply replacecalls to floor with calls to this band-limited function, pass-ing the computed approximate sample spacing.
Band-limiting the remainder of the function is trivial. Ob-serve that ss and tt are linear combinations of functionsfor which we have band-limited expressions. As describedin Section 3, their band-limited values are simply the lin-ear combination of the band-limited subexpressions. For the
same reason, 1�ss and 1�tt are band-limited expressionsas well. According to the result of Section 3.1, since the ssand tt are already band-limited and their product is multi-plicatively separable, the product itself is band-limited andsimilarly for (1�ss)⇤(1�tt). Finally, we note that the linearcombination of the two products is properly band-limited.
Figure 3 shows the checkerboard shader applied to an in-finite plane. Note that the target image required 2048 shadercalls per pixel to converge while the band-limited images re-quired only one call per pixel.
4. Approximate Band-Limiting through Partial
Substitution
Not all shaders are conveniently linear combinations ofterms of mathematically separable functions, however. Inthis section we consider an automated search strategy for ap-proximating band-limited shaders in such situations. We mo-
c� 2015 The Author(s)Computer Graphics Forum c� 2015 The Eurographics Association and John Wiley & Sons Ltd.

Search-‐Based Optimization Framework
27
Input
Evalua5on
Transforma5on
Search
Output
Error & Run 5me
Replace with band-‐limited func5on
Gene5c Algorithm

Evaluation
• Benchmarks: 11 programs used in previous work on an5aliasing.
• Compare against 16x supersampling.
• Metrics: • Error rela5ve to 2000x supersampling. • Run 3me.
28

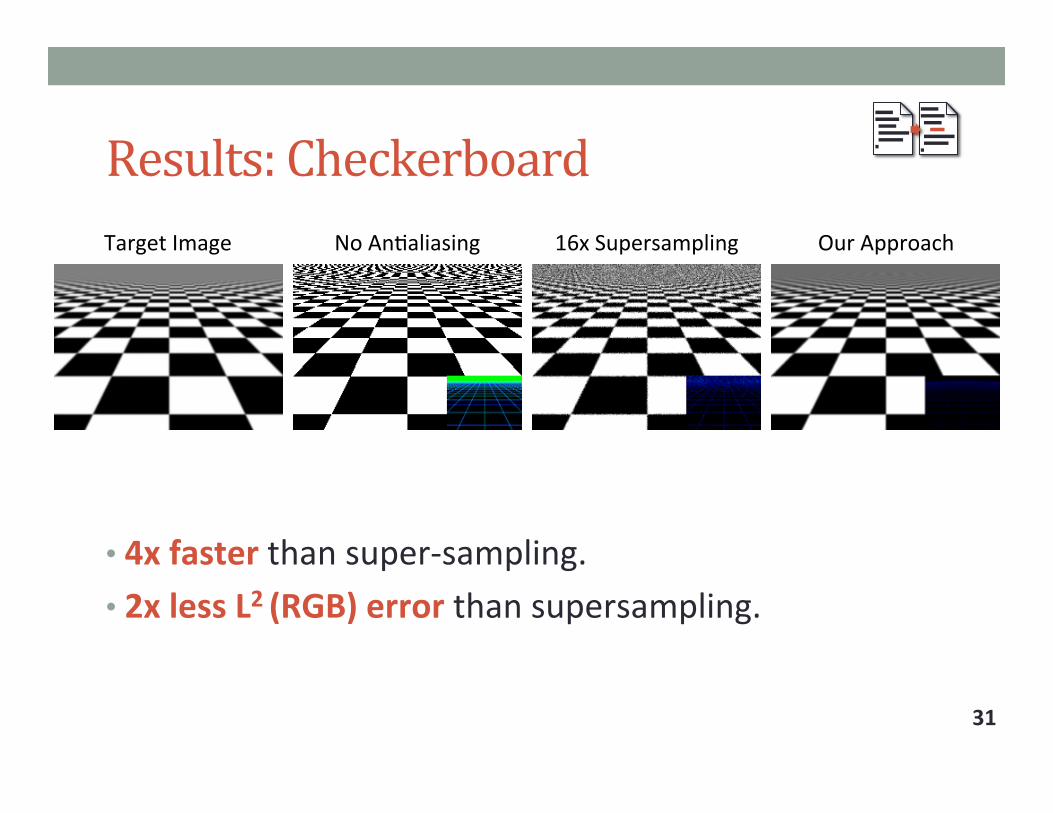
Results: Checkerboard Target Image No An5aliasing 16x Supersampling Our Approach
29

Results: Checkerboard Target Image No An5aliasing 16x Supersampling Our Approach
30
Error heatmap L2 in RGB
Results: Checkerboard
• 4x faster than super-‐sampling. • 2x less L2 (RGB) error than supersampling.
Target Image No An5aliasing 16x Supersampling Our Approach
31

Results: Brick and Wood Target Image No An5aliasing 16x Supersampling Our Approach
5x faster, 3x more L2 error than supersampling.
6x faster, 2x less L2 error than supersampling. 32
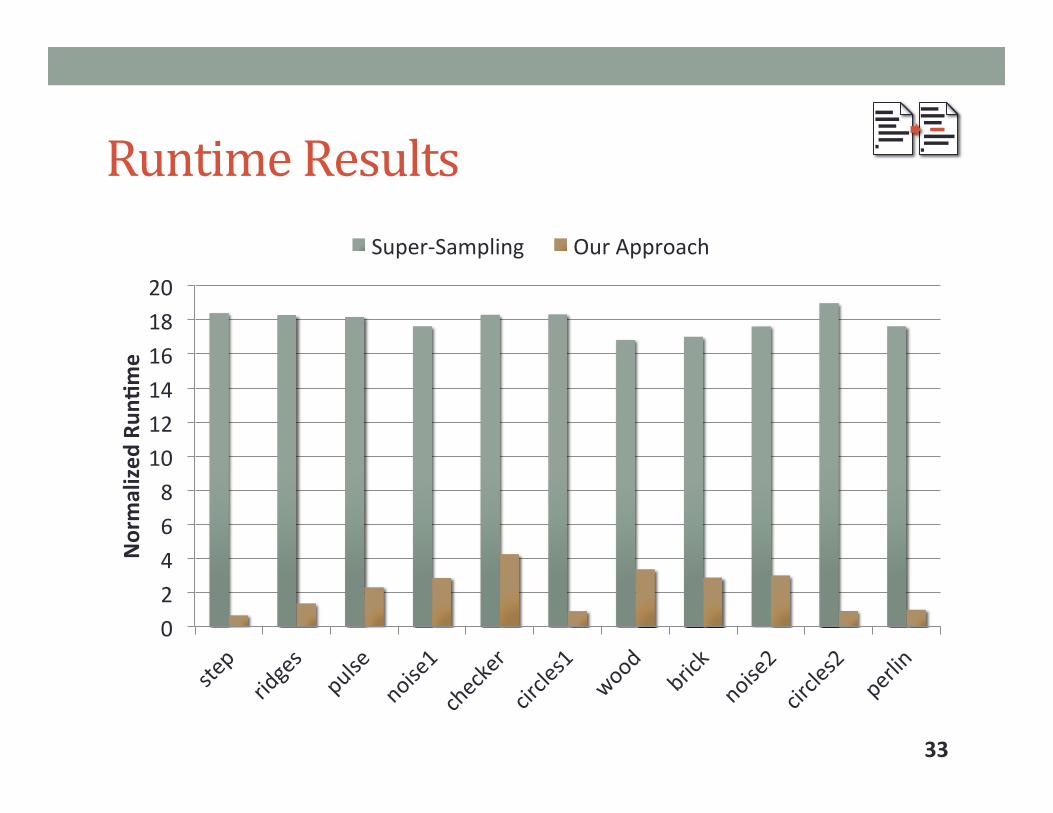
Runtime Results
0 2 4 6 8
10 12 14 16 18 20
Normalized
Run
Ome
Super-‐Sampling Our Approach
33

Error Results
0
0.5
1
Normalized
Error
Super-‐Sampling Our Approach
34

Aliasing Reduction Summary
• Developed an5-‐aliasing approach for programs. • Derived and published band-‐limited expression for common programming language primi5ves.
• Added new Pareto non-‐dominated points to the design space. • In many cases, we dominate exis5ng approach.
• Pacific Graphics 2015.
35
Outline
Overview
Applica5on Domains Graphics: Run Time and Visual Quality Data Centers: Output Accuracy and Energy Use Unit Tests: Readability and Test Coverage
Concluding Thoughts
36

Data Center Energy Use
0.82%
1.53%
2.78%
0
20
40
60
80
100
120
2000 2005 2010
Electricity
Use
(billion kW
h/year) Infrastructure
Communica5ons
Storage
High-‐end servers
Mid-‐range servers
Volume servers
37
Percentages of US electricity use in a
given year
Reproduced from [Koomey 2011]

Approximate Computing Applications • “Correct” answer is unknown or not well defined. • Recommenda5on systems. • Search systems. • Predic5on systems.
38

Project Overview • Goal: • Reduce energy retaining human-‐acceptable output.
• Approach: • Op5mize energy use and output error. • Iden5fy largest energy reduc5on below error threshold.
39
Energy
Error

Search-‐Based Optimization Framework
40
Input
Transforma5on
Search
Output
Evalua5on
Measuring Program Energy
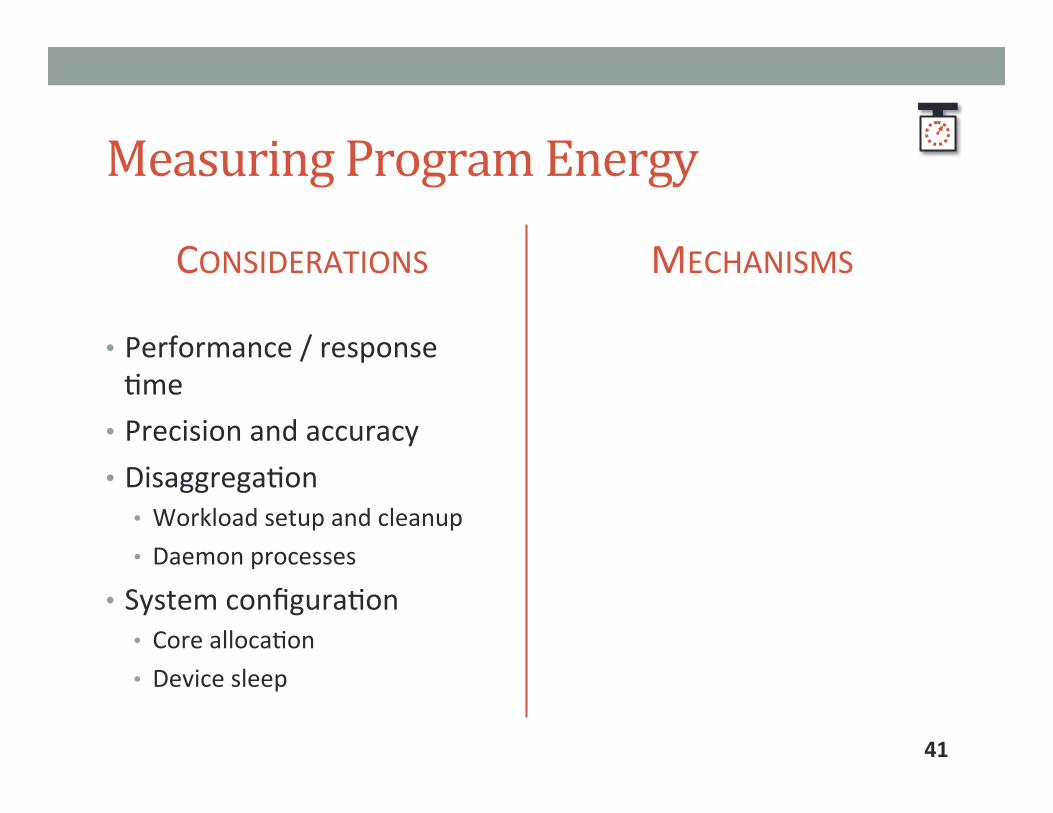
CONSIDERATIONS
• Performance / response 5me • Precision and accuracy • Disaggrega5on • Workload setup and cleanup • Daemon processes
• System configura5on • Core alloca5on • Device sleep
MECHANISMS
41
Measuring Program Energy
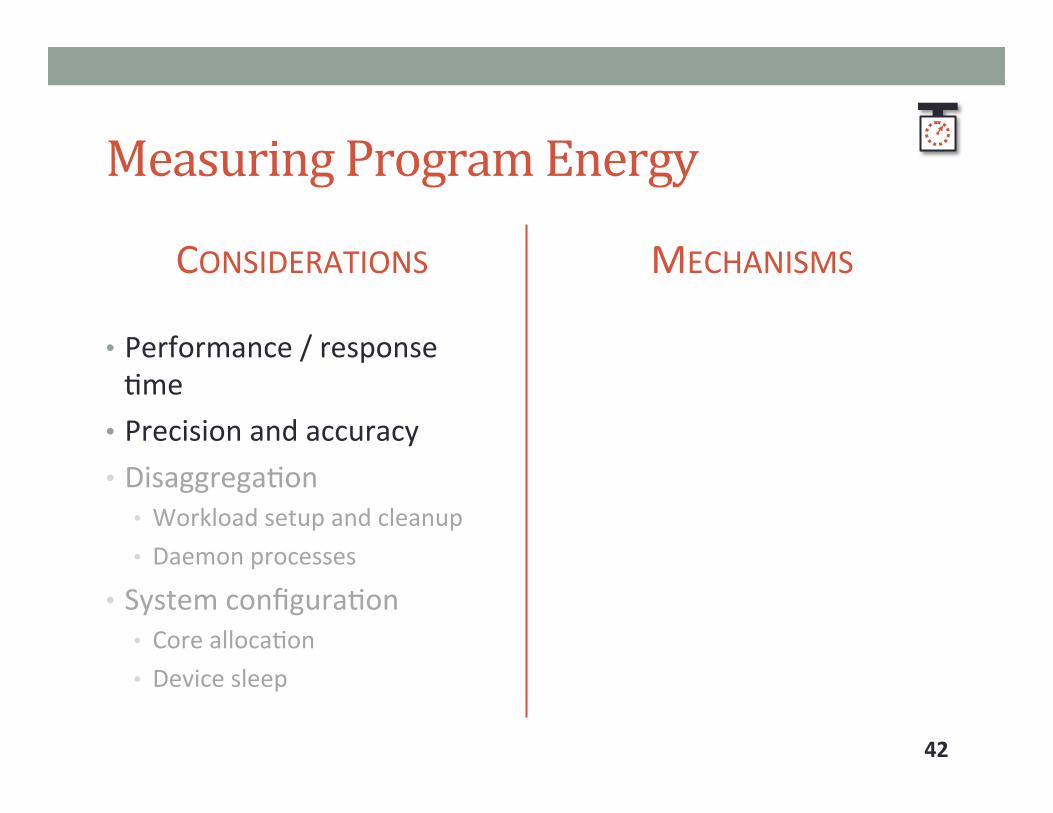
CONSIDERATIONS
• Performance / response 5me • Precision and accuracy • Disaggrega5on • Workload setup and cleanup • Daemon processes
• System configura5on • Core alloca5on • Device sleep
MECHANISMS
42

Measuring Program Energy
CONSIDERATIONS
• Performance / response 5me • Precision and accuracy • Disaggrega5on • Workload setup and cleanup • Daemon processes
• System configura5on • Core alloca5on • Device sleep
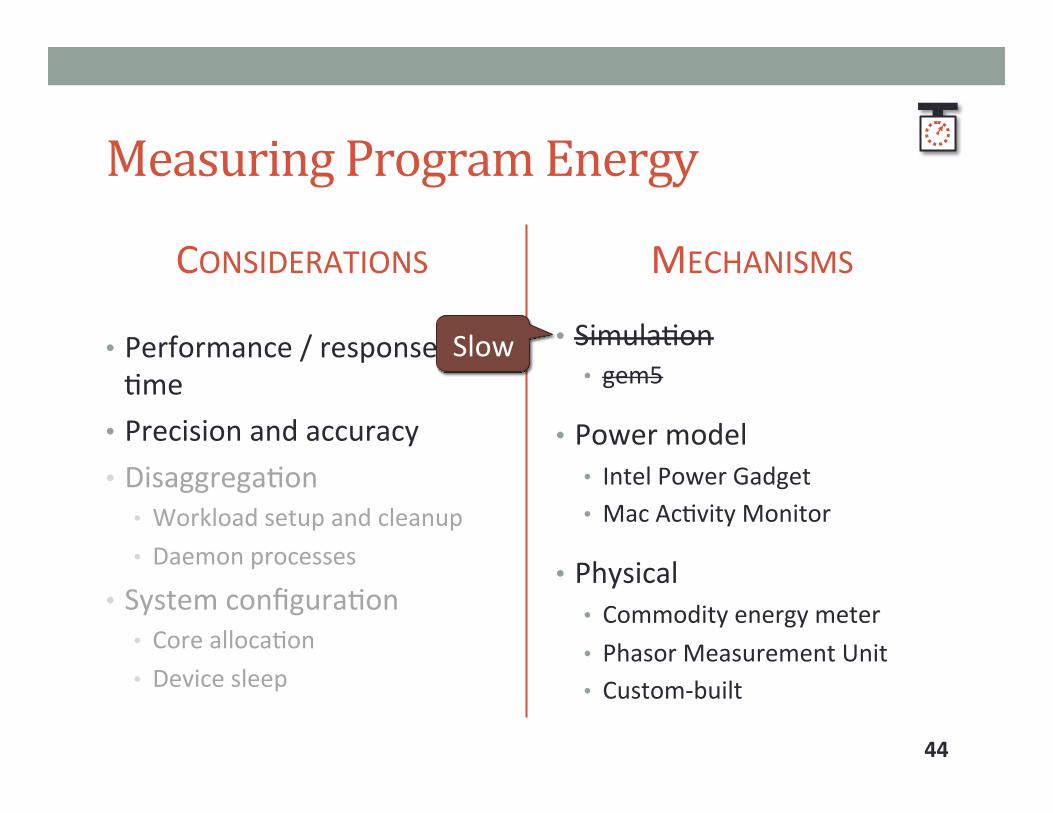
MECHANISMS
• Simula5on • gem5
• Power model • Intel Power Gadget • Mac Ac5vity Monitor
• Physical • Commodity energy meter • Phasor Measurement Unit • Custom-‐built
43
Measuring Program Energy
CONSIDERATIONS
• Performance / response 5me • Precision and accuracy • Disaggrega5on • Workload setup and cleanup • Daemon processes
• System configura5on • Core alloca5on • Device sleep
MECHANISMS
• Simula5on • gem5
• Power model • Intel Power Gadget • Mac Ac5vity Monitor
• Physical • Commodity energy meter • Phasor Measurement Unit • Custom-‐built
44
Slow

Measuring Program Energy
CONSIDERATIONS
• Performance / response 5me • Precision and accuracy • Disaggrega5on • Workload setup and cleanup • Daemon processes
• System configura5on • Core alloca5on • Device sleep
MECHANISMS
• Simula5on • gem5
• Power model • Intel Power Gadget • Mac Ac5vity Monitor
• Physical • Commodity energy meter • Phasor Measurement Unit • Custom-‐built
45
Slow
Inaccurate

Measuring Program Energy
CONSIDERATIONS
• Performance / response 5me • Precision and accuracy • Disaggrega5on • Workload setup and cleanup • Daemon processes
• System configura5on • Core alloca5on • Device sleep
MECHANISMS
• Simula5on • gem5
• Power model • Intel Power Gadget • Mac Ac5vity Monitor
• Physical • Commodity energy meter • Phasor Measurement Unit • Custom-‐built
46
Slow
Inaccurate
Coarse-‐grained
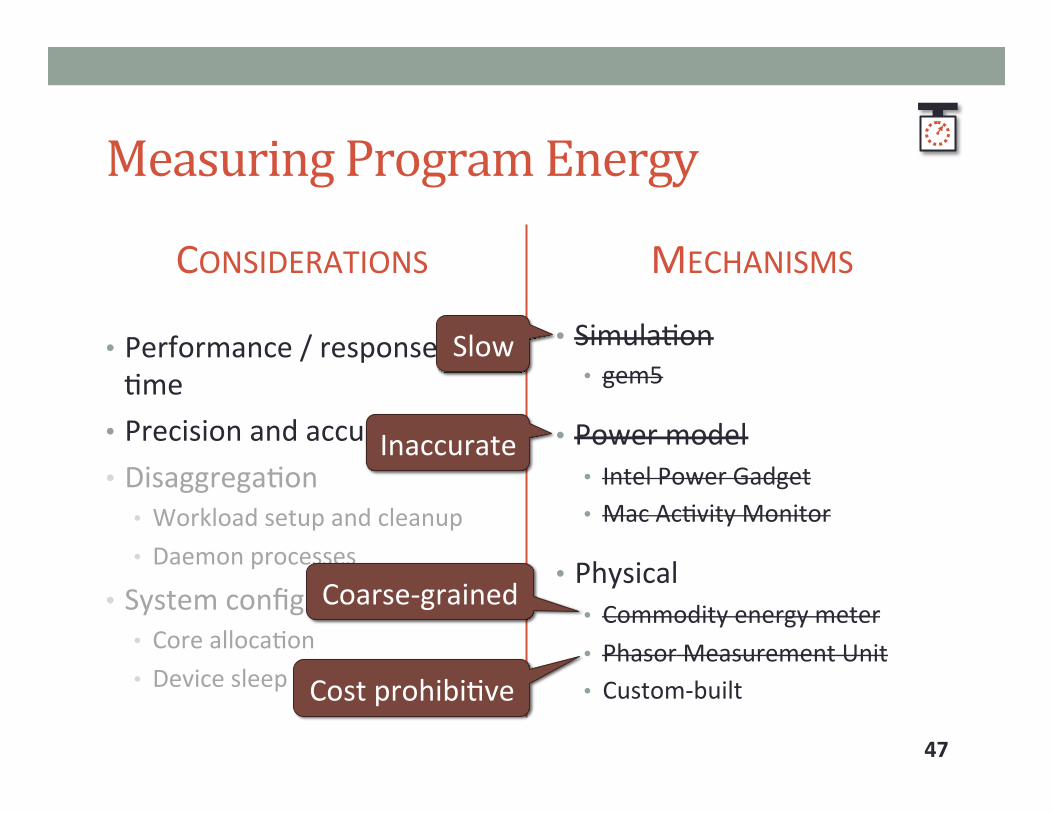
Measuring Program Energy
CONSIDERATIONS
• Performance / response 5me • Precision and accuracy • Disaggrega5on • Workload setup and cleanup • Daemon processes
• System configura5on • Core alloca5on • Device sleep
MECHANISMS
• Simula5on • gem5
• Power model • Intel Power Gadget • Mac Ac5vity Monitor
• Physical • Commodity energy meter • Phasor Measurement Unit • Custom-‐built
47
Slow
Inaccurate
Coarse-‐grained
Cost prohibi5ve

Fast and Accurate Physical Energy Measurement
• Sampling rate: • Internal: 1200 Hz • External: 10-‐20 Hz
• Variance < 1W on 100W load.
• $100 per system monitored.
48

Search-‐Based Optimization Framework
49
Input
Transforma5on
Search
Output
Evalua5on
Energy & Error
Insert, Delete, & Swap
Gene5c Algorithm
Evaluation
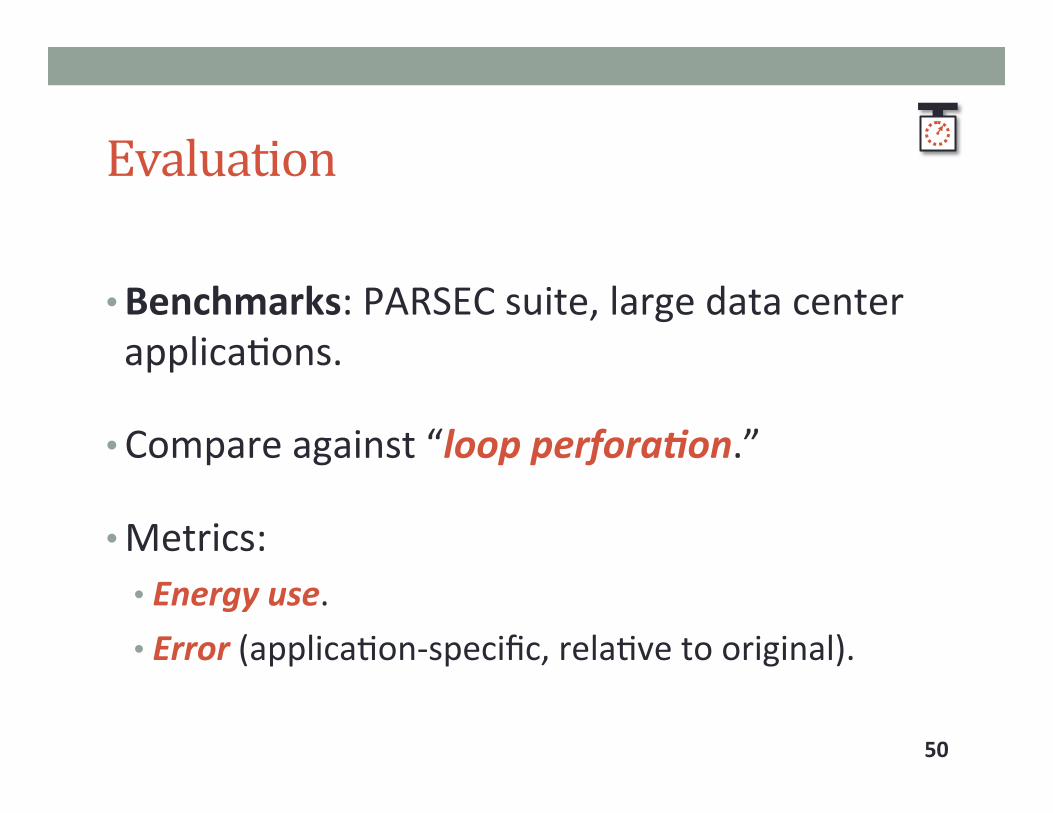
• Benchmarks: PARSEC suite, large data center applica5ons.
• Compare against “loop perfora3on.”
• Metrics: • Energy use. • Error (applica5on-‐specific, rela5ve to original).
50

Data Center Benchmarks (PARSEC) Benchmark ApplicaOon Domain Error Metric
blackscholes Financial analysis RMSE bodytrack Computer vision RMSE ferret Similarity search Kendall’s τ fluidanimate Anima5on Hamming Distance freqmine Data mining RMSE swap5ons Financial analysis RMSE vips Media processing Image Similarity x264 Media processing Image Similarity
51

Data Center Benchmarks Benchmark ApplicaOon Domain Error Metric
blackscholes Financial analysis RMSE bodytrack Computer vision RMSE ferret Similarity search Kendall’s τ fluidanimate Anima5on Hamming Distance freqmine Data mining RMSE swap5ons Financial analysis RMSE vips Media processing Image Similarity x264 Media processing Image Similarity
blender 3D renderer Image Similarity libav Media processing Image Similarity
52

Data Center Benchmarks Benchmark ApplicaOon Domain Error Metric
blackscholes Financial analysis RMSE bodytrack Computer vision RMSE ferret Similarity search Kendall’s τ fluidanimate Anima5on Hamming Distance freqmine Data mining RMSE swap5ons Financial analysis RMSE vips Media processing Image Similarity x264 Media processing Image Similarity
blender 3D renderer Image Similarity libav Media processing Image Similarity
53
Order of magnitude larger. Evaluate scalability.

Acceptable Error
• Highly subjec5ve and domain-‐specific.
• Protocol: • No5ceable distor5on on casual viewing (blender, bodytrack, libav, vips, x264). • All values within 5% of original (blackscholes, freqmine, swap5ons). • At least half of search results in common (ferret). • No acceptable error (fluidanimate).
54

Energy Reduction Results (%) Benchmark No Error Acceptable Error
blackscholes 92 92 bodytrack 0 59 ferret 0 30 fluidanimate 0 0 freqmine 8 8 swap5ons 39 68 vips 21 29 x264 0 65
blender 1 10 libav 3 92
55

PARSEC Results
56
Our technique Loop perforation
0 10 20 30
Joules
0
1
2
Err
or
bodytrack
0 20 40 60 80
Joules
0%
5%
10%
Err
or
ferret
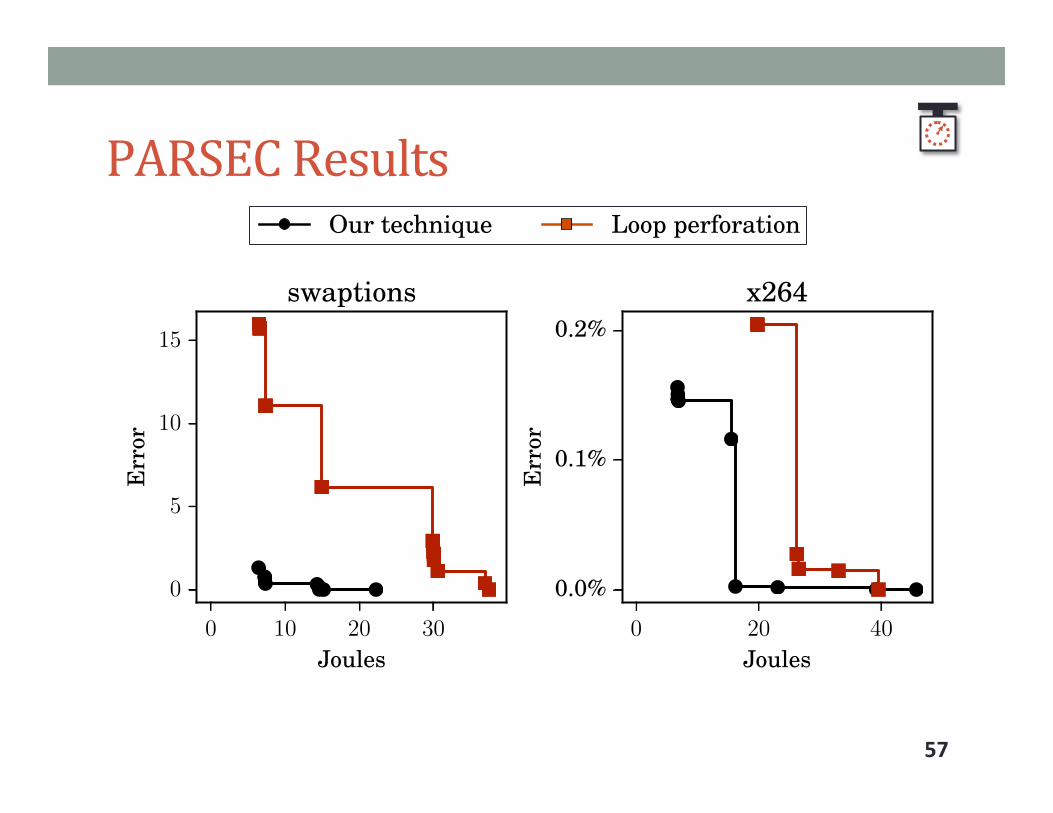
PARSEC Results
57
Our technique Loop perforation
0 10 20 30
Joules
0
5
10
15
Err
or
swaptions
0 20 40
Joules
0.0%
0.1%
0.2%
Err
or
x264

Can You Spot the Difference?
58

Can You Spot the Difference?
59
65% lower energy
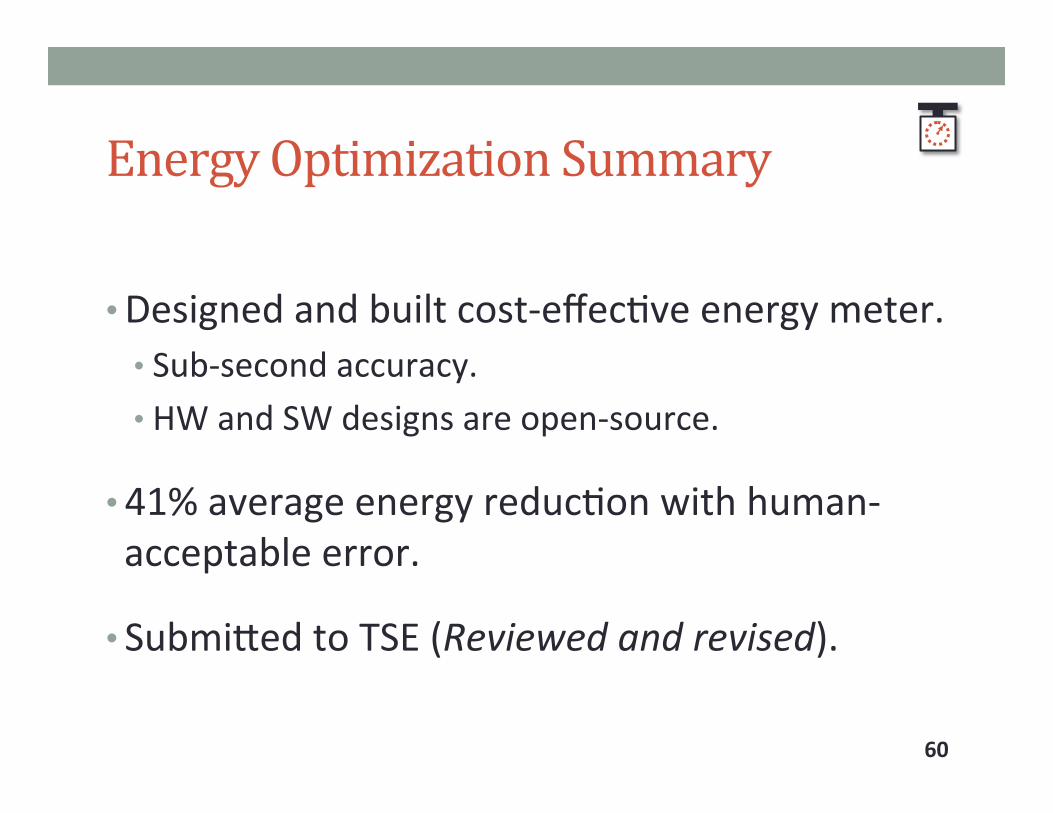
Energy Optimization Summary
• Designed and built cost-‐effec5ve energy meter. • Sub-‐second accuracy. • HW and SW designs are open-‐source.
• 41% average energy reduc5on with human-‐acceptable error.
• Submiced to TSE (Reviewed and revised).
60

Outline
Overview
Applica5on Domains Graphics: Run Time and Visual Quality Data Centers: Output Accuracy and Energy Use Unit Tests: Readability and Test Coverage
Concluding Thoughts
61

Expensive Testing Failures • Mars Spirit Rover ($1B). • Almost lost mission due to filesystem bug.*
• Knight Capital trading glitch ($440M). • Development so=ware released into produc5on.
• Inadequate tes5ng costs the US over $60B.***
62
* Glenn Reeves and Tracy Neilson. “The mars rover spirit FLASH anomaly.” IEEE Aerospace Conference, 2005. ** hcps://dealbook.ny5mes.com/2012/08/02/knight-‐capital-‐says-‐trading-‐mishap-‐cost-‐it-‐440-‐million/ *** RTI Health, Social, and Economics Research. “The Economic Impacts of Inadequate Infrastructure for
So=ware Tes5ng.” NIST, 2002.

Test Coverage
• Approximate measure of test suite quality. • Lines, branches, condi5ons, etc. • Muta5on tes5ng.
• Many standards and organiza5ons mandate par5cular thresholds. • DO-‐178B (avionics so=ware) • ANSI/IEEE Std 1008-‐1987 (so=ware unit tes5ng)
63

Developer Time in IDEs
64
Reading
Wri5ng
Reading
Wri5ng
Adapted from [Beller, et al. 2015]
Produc5on Code Test Code

Project Overview
• Goal: • Generate readable, high-‐coverage test suites.
• Approach: 1. Model test readability. 2. Op5mize coverage and
readability. 3. Validate with human
study.
65

Input
Output
Search-‐Based Optimization Framework
66
Transforma5on
Search
Evalua5on
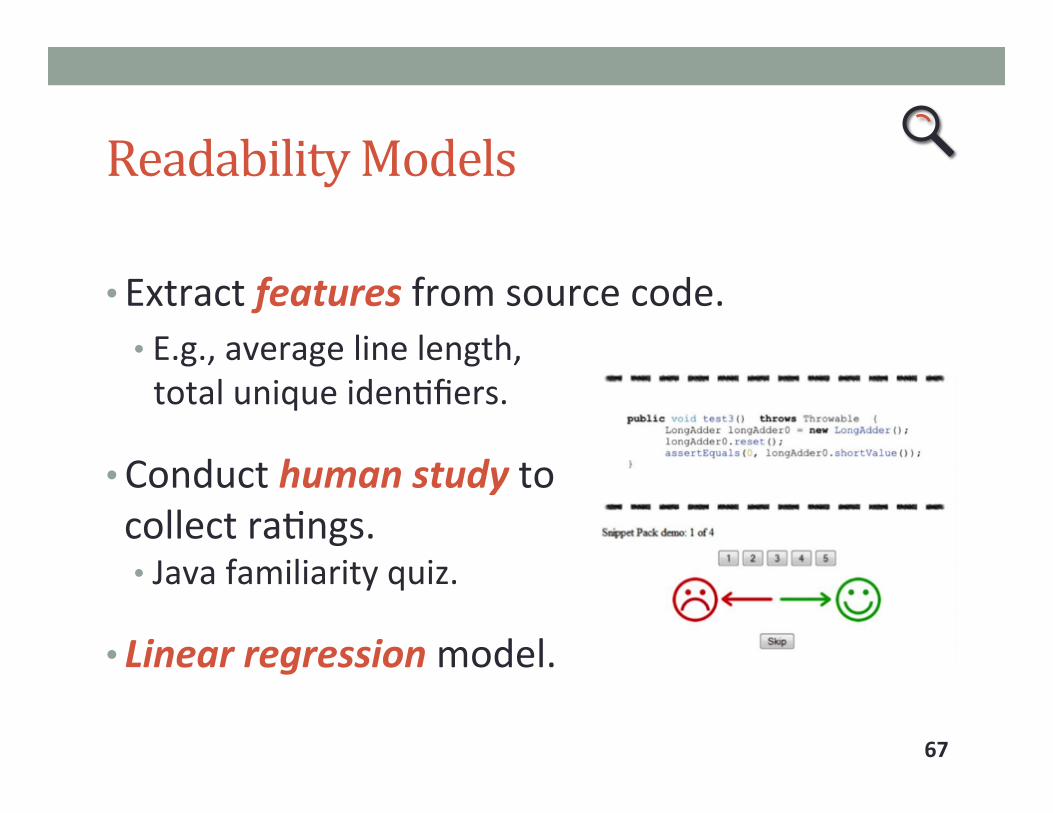
Readability Models
• Extract features from source code. • E.g., average line length, total unique iden5fiers.
• Conduct human study to collect ra5ngs. • Java familiarity quiz.
• Linear regression model.
67

Generating Test Suites • Extend EVOSUITE test suite generator for Java. • Op5mizes coverage objec5ves via evolu5onary search.
68
CharRange charRange0 = CharRange.isNot(’#’); Character character0 = Character.valueOf(’#’); CharRange charRange1 = CharRange.isNotIn(’\"’, (char) character0); char char0 = charRange1.getStart(); assertEquals(’\"’, char0); boolean boolean0 = charRange0.contains(’\"’); assertTrue(boolean0);

Generating Test Suites • Extend EVOSUITE test suite generator for Java. • Op5mizes coverage objec5ves via evolu5onary search.
• Extend fitness func5on with readability model.
69
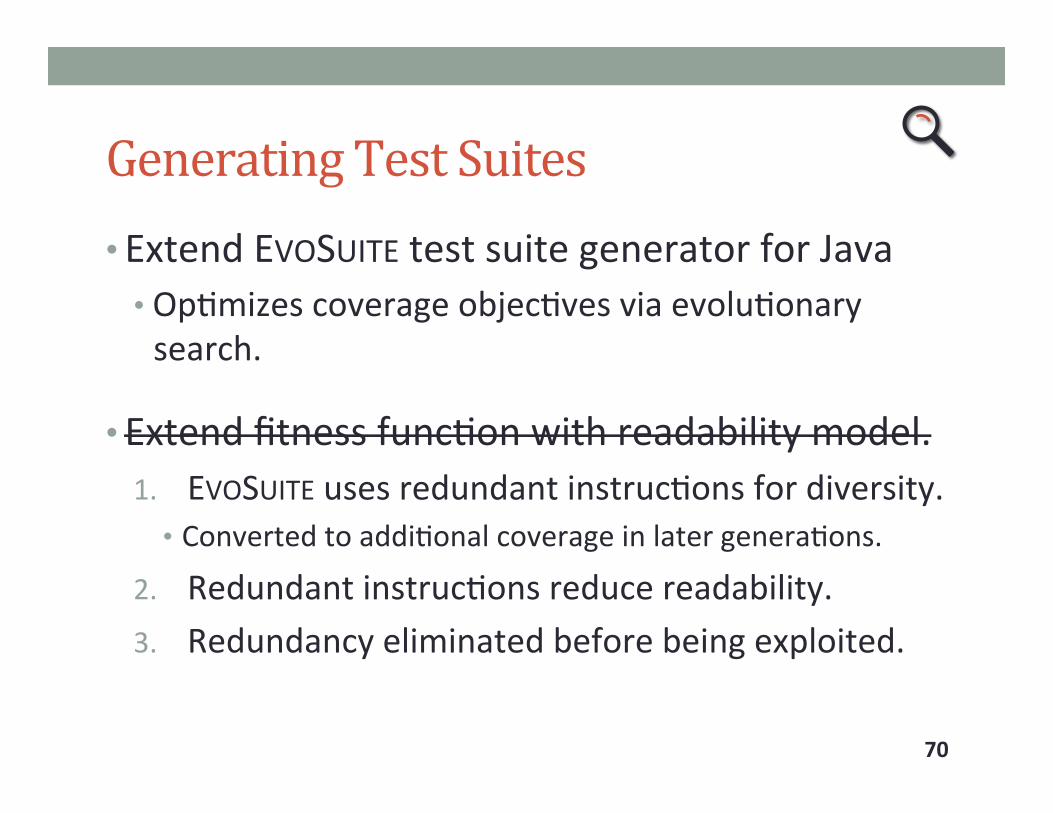
Generating Test Suites • Extend EVOSUITE test suite generator for Java • Op5mizes coverage objec5ves via evolu5onary search.
• Extend fitness func5on with readability model. 1. EVOSUITE uses redundant instruc5ons for diversity. • Converted to addi5onal coverage in later genera5ons.
2. Redundant instruc5ons reduce readability. 3. Redundancy eliminated before being exploited.
70

Generating Test Suites • Extend EVOSUITE test suite generator for Java • Op5mizes coverage objec5ves via evolu5onary search.
• Extend fitness func5on with readability model.
• Op5mize coverage, then readability. • Two-‐phase op5miza5on. • Transforma5on should maintain coverage.
71

Readability Transformation • Transforma5on: • Replace RHS of assignment with same-‐type expression. • Remove dead code.
72
Foo foo = new Foo(); Bar bar = new Bar(“Some parameter”, 17); foo.setBar(bar); assertTrue(foo.isBar());
Foo foo = new Foo(); Bar bar = new Bar(); foo.setBar(bar); assertTrue(foo.isBar());

Readability Transformation • Transforma5on: • Replace RHS of assignment with same-‐type expression. • Remove dead code.
73
Foo foo = new Foo(); Bar bar = new Bar(“Some parameter”, 17); foo.setBar(bar); assertTrue(foo.isBar());
Foo foo = new Foo(); Bar bar = new Bar(“Some parameter”, 17); foo.setBar(null); assertTrue(foo.isBar());
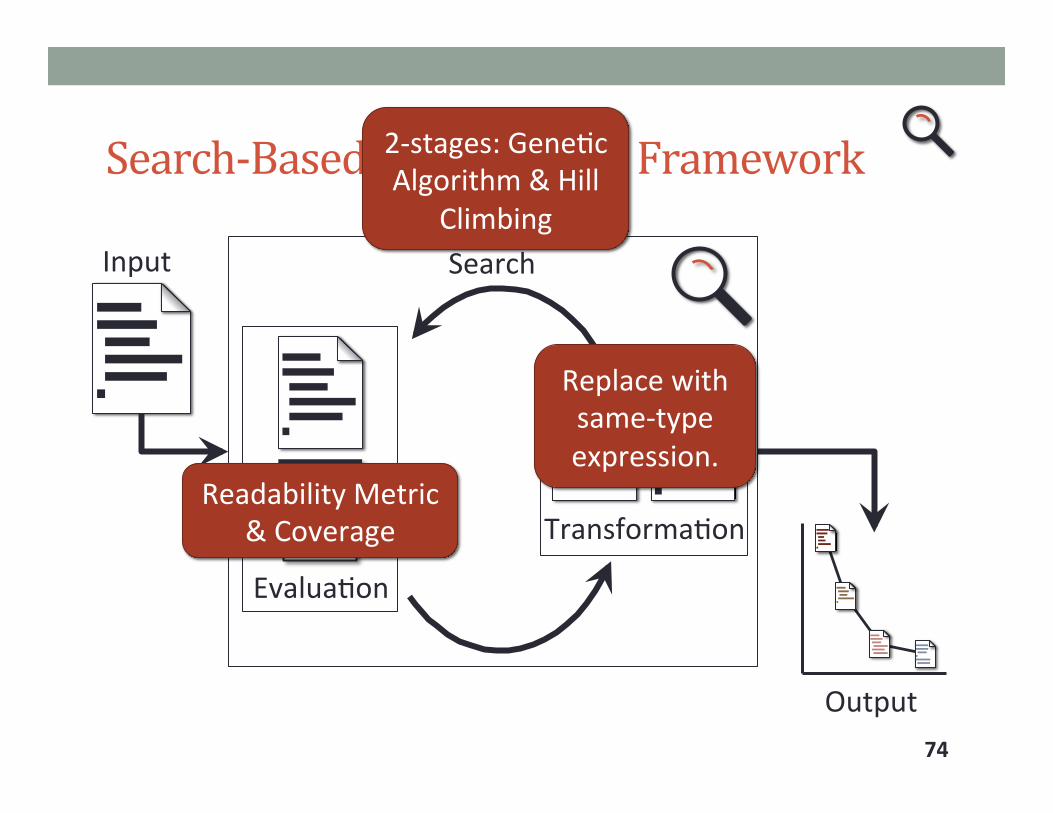
Input
Output
Search-‐Based Optimization Framework
74
Transforma5on
Search
Evalua5on
Replace with same-‐type expression.
2-‐stages: Gene5c Algorithm & Hill
Climbing
Readability Metric & Coverage
Evaluation
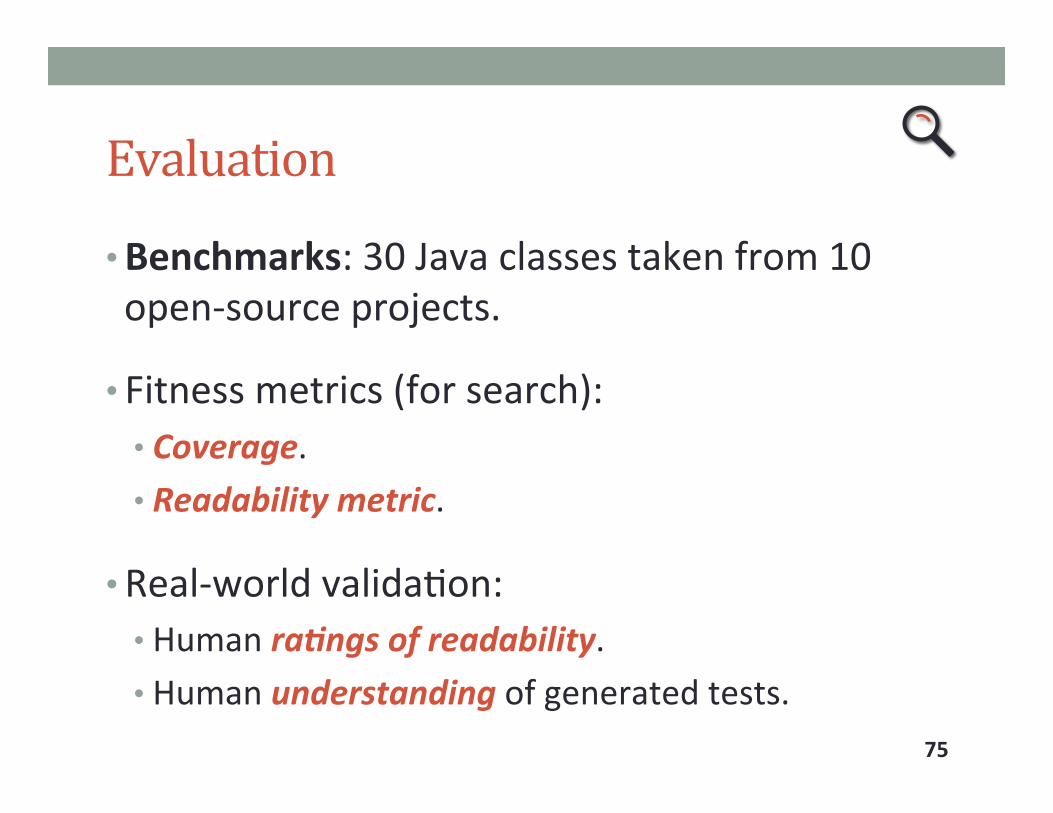
• Benchmarks: 30 Java classes taken from 10 open-‐source projects.
• Fitness metrics (for search): • Coverage. • Readability metric.
• Real-‐world valida5on: • Human ra3ngs of readability. • Human understanding of generated tests.
75

Head-‐to-‐Head Comparison
76

Human Preference Results
0
25
50
75
100
% Preferring OpO
mized
Tests
77
Average: 69%

Test Understanding
78

Test Understanding Results
0
1
2
3
4
5
6
7
Avg
Minutes
Time to Answer
Not Op5mized Op5mized
79

Readable Test Suite Summary
• Developed effec5ve readability model for tests. • Algorithm to op5mize readability and coverage. • Empirical evalua5on of test readability on human performance.
• Dis5nguished Paper at ESEC-‐FSE 2015.
80

Outline
Overview
Applica5on Domains Graphics: Run Time and Visual Quality Data Centers: Output Accuracy and Energy Use Unit Tests: Readability and Test Coverage
Concluding Thoughts
81
Contributions
• Representa5ons, transforma5ons, and search strategies for op5mizing non-‐func5onal proper5es. • Empirical evalua5ons of evolu5onary op5miza5on of non-‐func5onal proper5es in three applica5on domains. • First project to automa5cally band-‐limit procedural shaders. • Deriva5ons for band-‐limi5ng shading language primi5ves. • Demonstra5on of op5miza5ons enabled by relaxing requirement of bitwise output equivalence. • Demonstra5on of impact of readability of maintenance ac5vi5es.
82

Jonathan Dorn, Jeremy Lacomis, Westley Weimer, Stephanie Forrest. Automa3cally Exploring Tradeoffs Between So>ware Output Fidelity and Energy Costs. Transac5ons on So=ware Engineering. (Reviewed and revised)
Jonathan Dorn, Connelly Barnes, Jason Lawrence, Westley Weimer. Towards Automa3c Band-‐Limited Procedural Shaders. Pacific Graphics. 2015.
Ermira Daka, Jose Campos, Gordon Fraser, Jonathan Dorn, Westley Weimer. Modeling Readability to Improve Unit Tests. Founda5ons of So=ware Engineering. 2015. ACM SIGSOFT DisOnguished Paper Award.
Ermira Daka, Jose Campos, Jonathan Dorn, Gordon Fraser, Westley Weimer. Genera3ng Readable Unit Tests for Guava. Symposium on Search Based So>ware Engineering. 2015.
Eric Schulte, Jonathan Dorn, Stephen Harding, Stephanie Forrest, Westley Weimer. Post-‐compiler So>ware Op3miza3on for Reducing Energy. Architectural Support for Programming Languages and Opera5ng Systems. 2014.
Chris Gregg, Jonathan Dorn, Kim Hazelwood, Kevin Skadron. Fine-‐Grained Resource Sharing for Concurrent GPGPU Kernels. 4th USENIX Workshop on Hot Topics in Parallelism. 2012.
83

Optimizing Tradeoffs of Non-‐Functional Properties in Software
84

BACKUP
85

Results: Brick and Wood Target Image No An5aliasing 16x Supersampling Our Approach
5x faster, 3x more L2 error than supersampling.
6x faster, 2x less L2 error than supersampling. 86

Results: Noise1 and Noise2 Target Image No An5aliasing 16x Supersampling Our Approach
7x faster, same L2 error as supersampling.
6x faster, sane L2 error as supersampling. 87
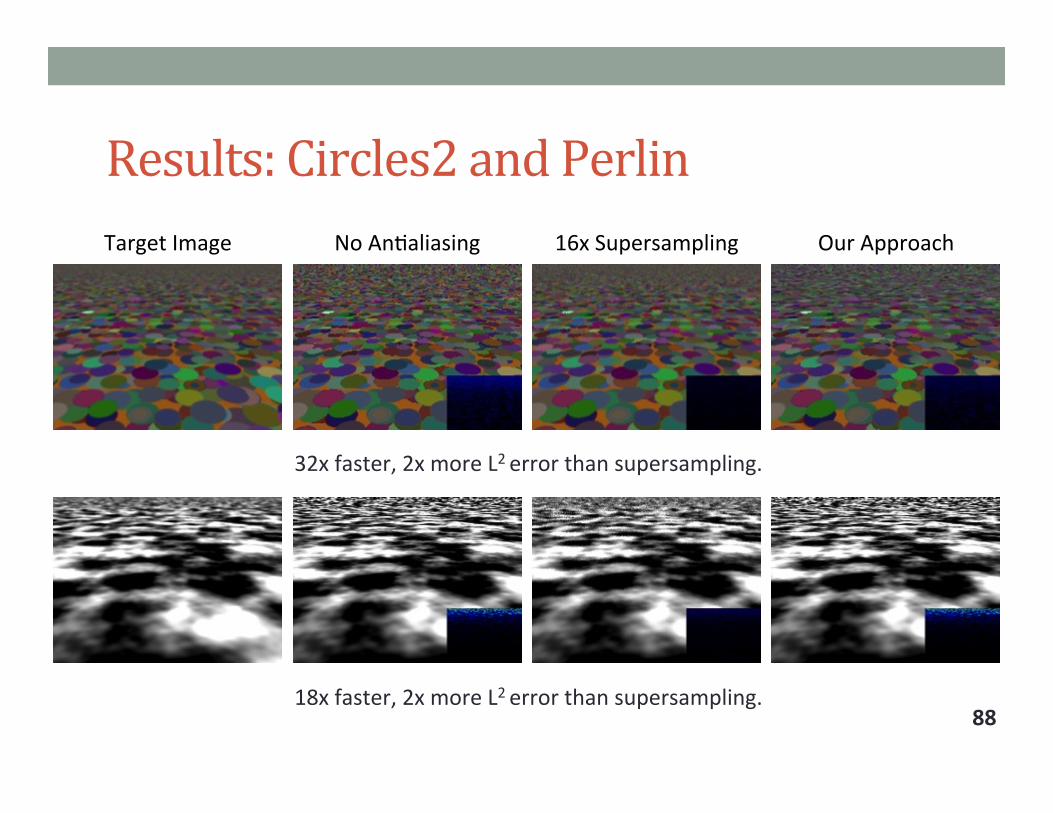
Results: Circles2 and Perlin Target Image No An5aliasing 16x Supersampling Our Approach
32x faster, 2x more L2 error than supersampling.
18x faster, 2x more L2 error than supersampling. 88

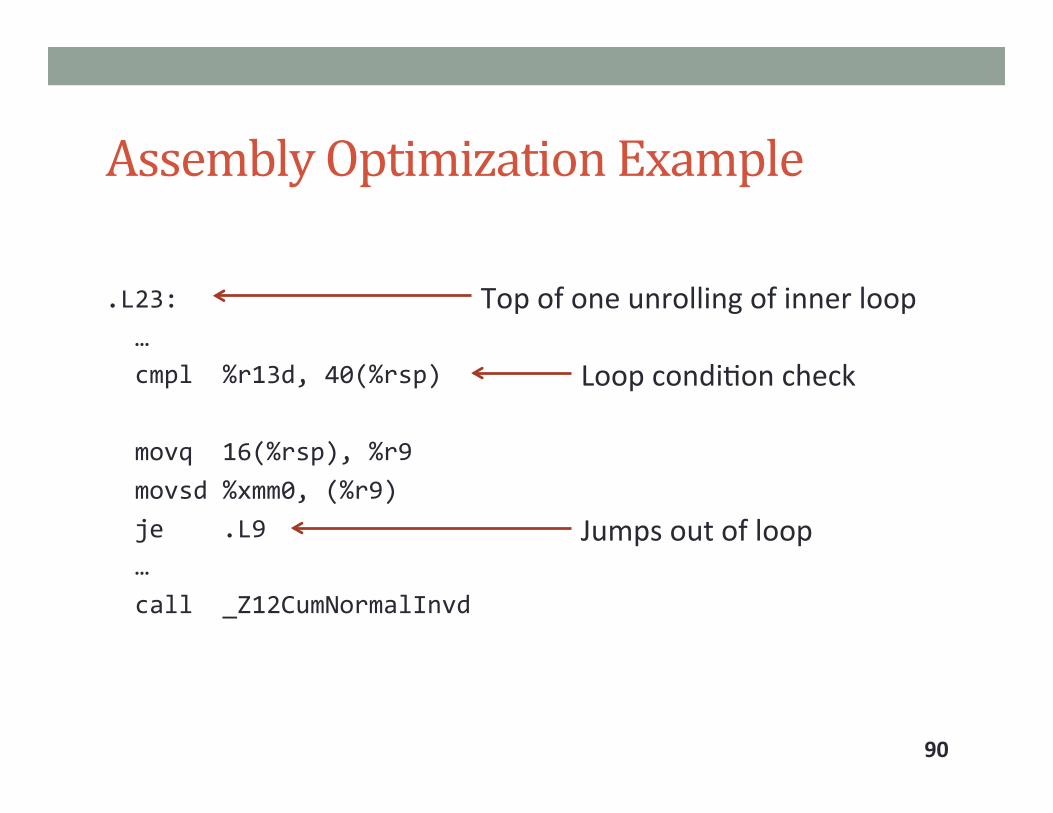
Assembly Optimization Example
.L23: … cmpl %r13d, 40(%rsp) movq 16(%rsp), %r9 movsd %xmm0, (%r9) je .L9 … call _Z12CumNormalInvd
89
Assembly Optimization Example
.L23: … cmpl %r13d, 40(%rsp) movq 16(%rsp), %r9 movsd %xmm0, (%r9) je .L9 … call _Z12CumNormalInvd
Top of one unrolling of inner loop
Loop condi5on check
Jumps out of loop
90

Assembly Optimization Example
.L23: … cmpl %r13d, 40(%rsp) xorl %eax, %eax movq 16(%rsp), %r9 movsd %xmm0, (%r9) je .L9 … call _Z12CumNormalInvd
Resets condi5on flags
91
Always exits loop!

Assembly Optimization Example
.L23: … cmpl %r13d, 40(%rsp) xorl %eax, %eax movq 16(%rsp), %r9 movsd %xmm0, (%r9) je .L9 … call _Z12CumNormalInvd
• No change in observed behavior.
• Skipped itera5ons increase precision. • Fixed number of digits in output.
92

Energy and Runtime
-‐20% 0% 20% 40% 60% 80% 100%
blackscholes
bodytrack
ferret
fluidanimate
freqmine
swap5ons
vips
x264
Energy ReducOon
Energy Run5me
93

Feature Predictive Power
0 0.1 0.2 0.3 0.4 0.5
Has asser5ons Method ra5o
Avg arithme5c operators Max characters Avg branches
Total asser5ons Has excep5ons Iden5fier ra5o
Avg nulls Avg loops
Total numbers Avg string length
Max nulls Total floats
Token entropy Total dis5nct methods
Total iden5fiers Total unique iden5fiers Max iden5fier length
Total line length Total constructor calls Avg iden5fier length
Total iden5fier length Max line length
94


