61
OPTIONS WITH OPTIONS Webinar Interactive Brokers March 28, 2018 Tomas Bernholm & Carl Björkegren
OPTIONS WITH
OPTIONS
Webinar Interactive Brokers
March 28, 2018
Tomas Bernholm & Carl Björkegren

• Hagströmer & Qviberg • Nordea Securities • Hedge fund LYNX • Avanza • Nasdaq
Tomas Bernholm

• UBS Warburg • Nordea Securities • ABG Sundal Collier • C&M Hedge Fund • Enspiri Consulting
Carl Bjorkegren

DISCLAIMER
Nasdaq makes no representations or warranties with respect to the information and disclaims all liability for any use made of the contents of this document. All information is provided “as is” without warranty of any kind. Nasdaq assumes no responsibility for any errors or omissions. This document is provided for informational purposes only, does not constitute legal advice or investment advice and
should not be relied upon for that purpose. Investing in securities involves risks. Securities can increase and decrease in value and there is no guarantee that you will get your investment back. Past
performance is no guarantee of future returns. Advice from a securities professional is strongly advised before taking or refraining from taking any action as a result of the contents of this document.

CONTENT Introduction Why options? What is an option? How can we use them? -The four basic option positions -Some different combinations and strategies -Important terminology -Some about risk, implied volatility and valuation

THE NORDIC DERIVATIVES MARKETS
Sweden Denmark Finland Norway

THE NORDIC DERIVATIVES MARKETS Examples, some underlying stocks ABB (ABB) A.P. Møller-Mærsk B (MAERSK) AstraZeneca (AZN) Atlas Copco A (ATCOA) Autoliv SDB (ALIV) Carlsberg B (CARLB) Danske Bank (DANSKE) DSV (DSV) Electrolux B (ELUXB) Ericsson B (ERICB) Hennes & Mauritz B (HMB) Kone Corp (KNEBV3) Marine Harvest ASA (MHG) Nokia (NOKI) Nokian Tyres (NRE1V3) Nordea (NDA) Norsk Hydro ASA (NHY) Novo Nordisk B (NOVOB) Outokumpu (OUT1V3) Pandora (PNDORA) Seadrill Ltd (SDRL) SAAB B (SAAB) Vestas Wind Systems (VWS) Volvo B (VOLVB)
Index OMXS30 (Sweden) OMXC25 (Denmark) OMXH25 (Finland) OMXO20 (Norway)

Source: Credit Suisse & Nasdaq Market research. All indicies are based on time series from (1966 - 2017)
TOP 20 Rank Country Annual
return % 1 Sweden 8.55 % 2 Finland 8.55 % 3 South Africa 7.68 % 4 Denmark 7.46 % 5 Norway 6.61 % 6 Netherlands 6.53 %
7 U.K. 6.50 % 8 Ireland 6.18 % 9 Europe 5.84 % 10 New Zealand 5.81 % 11 Australia 5.77 % 12 USA 5.72 % 13 Germany 5.72 % 14 Belgium 5.61 % 15 France 5.61 % 16 Switzerland 5.60 %
17 World-ex U.S. 5.56 %
18 World 5.18 % 19 Canada 4.69 % 20 Japan 4.49 %
0%
1%
2%
3%
4%
5%
6%
7%
8%
9%
Swed
en
Finl
and
Sout
h Af
rica
Denm
ark
Nor
way
Net
herla
nds
U.K
.
Irela
nd
Euro
pe
New
Zea
land
Aust
ralia
USA
Ger
man
y
Belg
ium
Fran
ce
Switz
erla
nd
Wor
ld-e
x U
.S.
Wor
ld
Cana
da
Japa
n
Spai
n
Aust
ria
Port
ugal
Italy
WORLD CLASS LONG TERM RETURNS ANNUALIZED REAL RATE OF RETURN FOR EQUITY MARKETS 1966-2017 (52 YEARS)

WHY OPTIONS?
ALTERNATIVES, CHOICES, OPTIONS…

TRADITIONAL PORTFOLIO
Positive Neutral Negative
Create return?

POSSIBLE TO CREATE A RETURN IN DIFFERENT MARKET CONDITIONS
WITH OPTIONS
Positive Neutral Negative
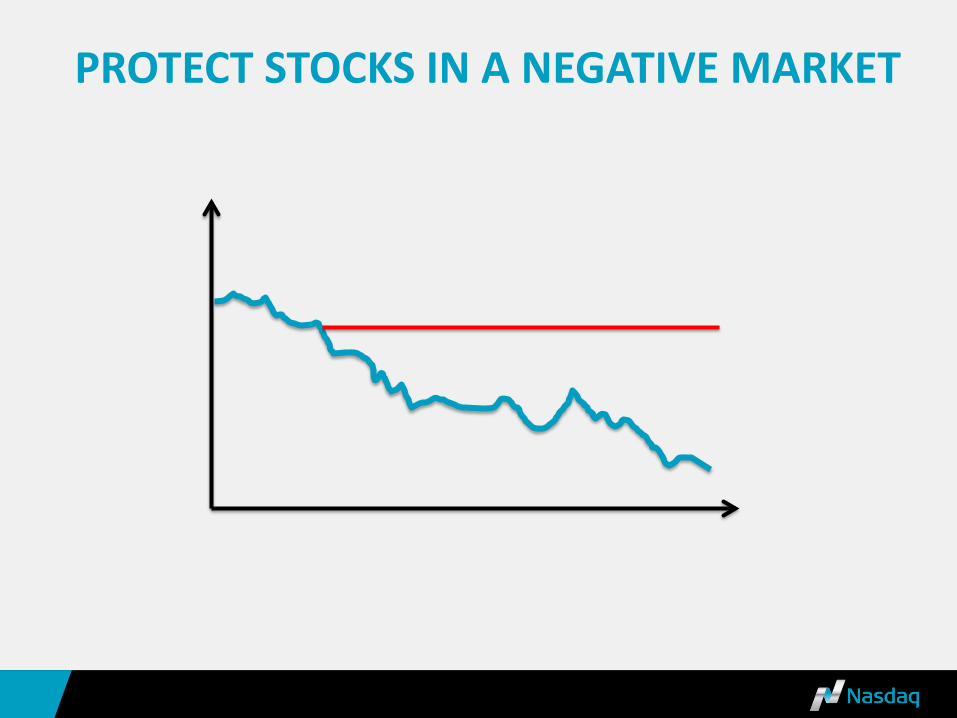
PROTECT STOCKS IN A NEGATIVE MARKET
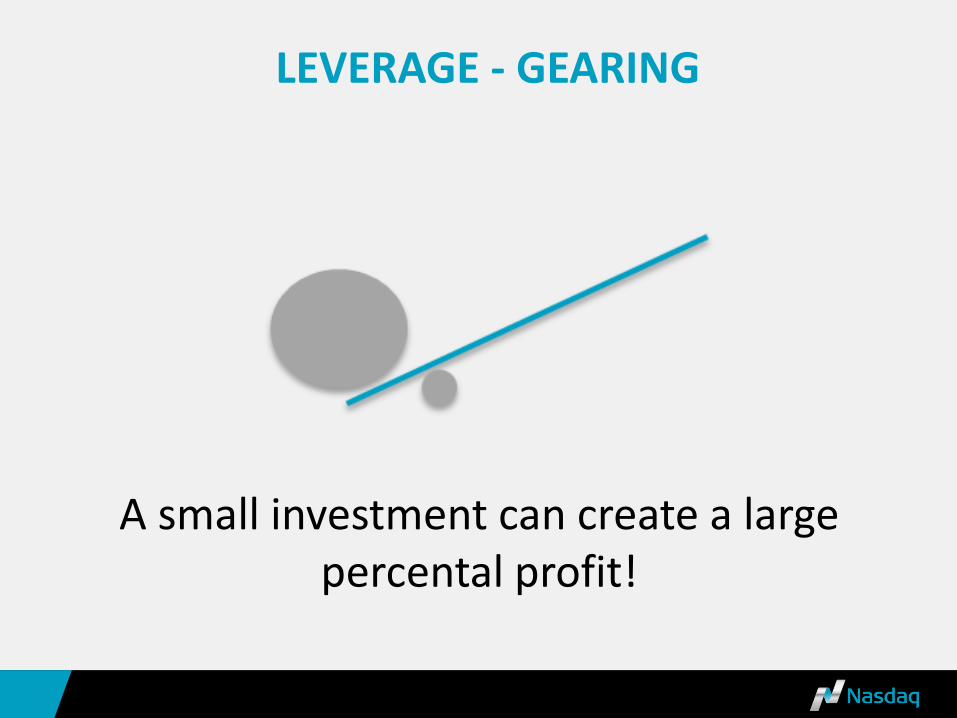
LEVERAGE - GEARING
A small investment can create a large percental profit!
14
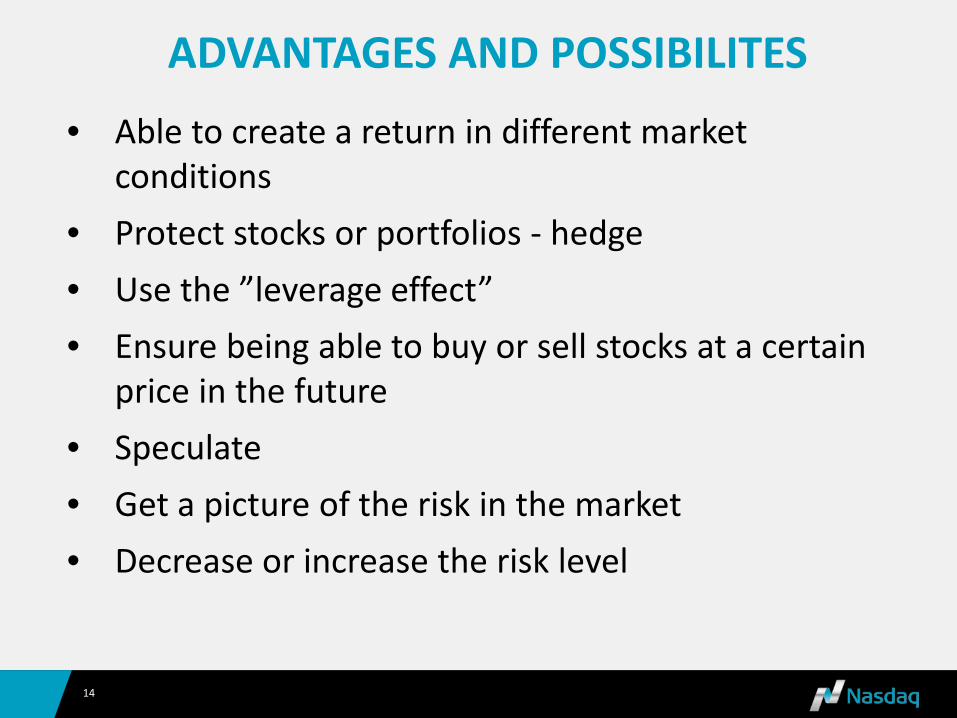
• Able to create a return in different market conditions
• Protect stocks or portfolios - hedge • Use the ”leverage effect” • Ensure being able to buy or sell stocks at a certain
price in the future • Speculate • Get a picture of the risk in the market • Decrease or increase the risk level
ADVANTAGES AND POSSIBILITES

15
Stand alone In combinations with other options Together with stocks or futures/forwards
OPTIONS CAN BE USED IN DIFFERENT WAYS:

WHAT IS AN OPTION?
RIGHTS…

TWO TYPES OF OPTIONS
Call option Right to buy
Put option Right to sell
To a predefined price and during a predefined time period

18
THE FOUR BASIC OPTION POSITIONS
Call Put Right to buy
Right to sell
BUYER
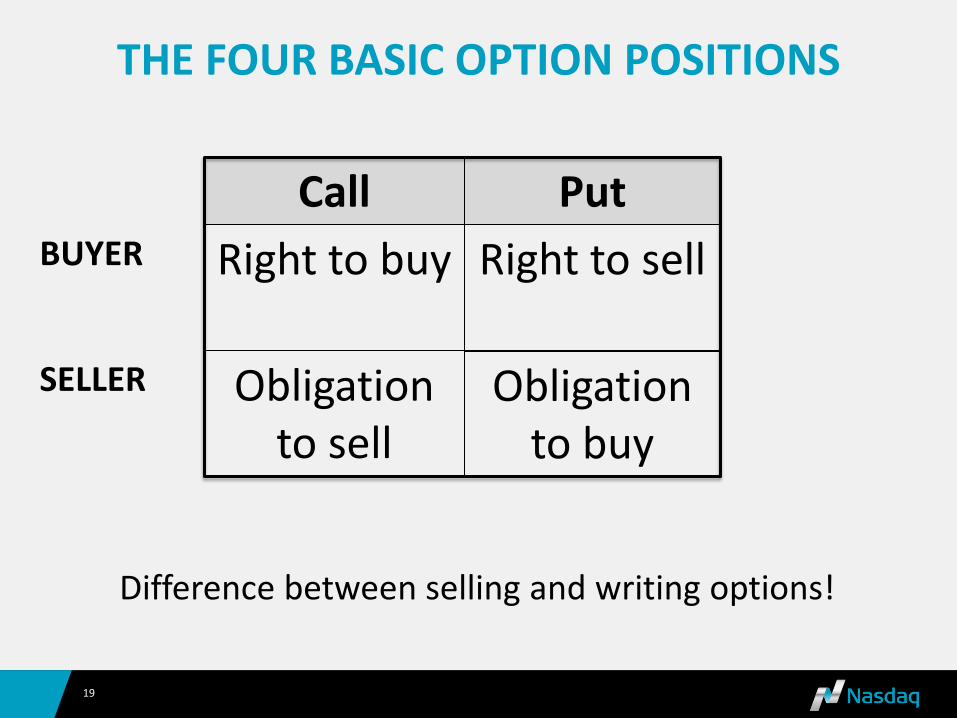
19
Difference between selling and writing options!
Call Put Right to buy
Right to sell
Obligation
to sell Obligation
to buy
BUYER
SELLER
THE FOUR BASIC OPTION POSITIONS

20
LONG OR SHORT THE UNDERLYING?
Bought Call Sold (written) Call Bought Put Sold (written) Put
Long Short Short Long

21
Options have different maturities. Nasdaq (Nordic) have: 1, 2, 3, 6, 12, 24 and 36 months, also “weekly options”
Expiration day: 3rd Friday in the month
Traded on the Exchange just like stocks Many strikes (good strike density) Premium=price of the option, longer options cost more 1 option is normally equivalent to 100 stocks
22
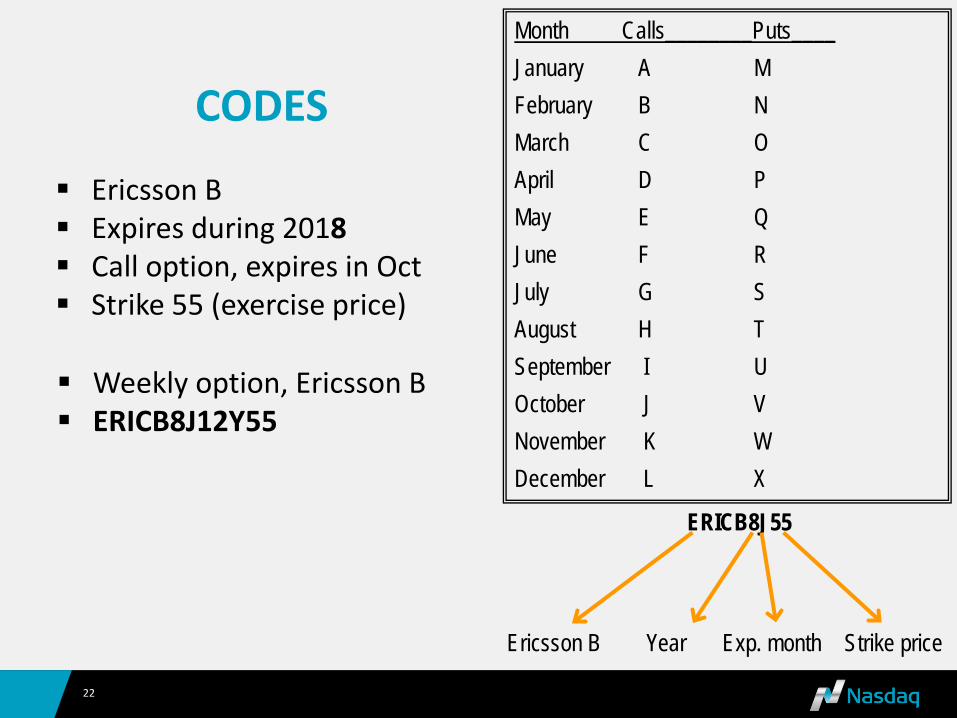
CODES
ERICB8J55
Ericsson B Year Exp. month Strike price
Month Calls________Puts____ January A M February B N March C O April D P May E Q June F R July G S August H T September I U October J V November K W December L X
Ericsson B Expires during 2018 Call option, expires in Oct Strike 55 (exercise price)
Weekly option, Ericsson B ERICB8J12Y55

AMERICAN AND EUROPEAN OPTIONS
23
American options – Our stock options European options – Our index options
CHARTS (At expiration)

I I I I I I I I 85 90 95 100 105 110 115 120
+
_
5 SEK
Construction: Buy stocks @ 100 SEK (or forward)
STOCK
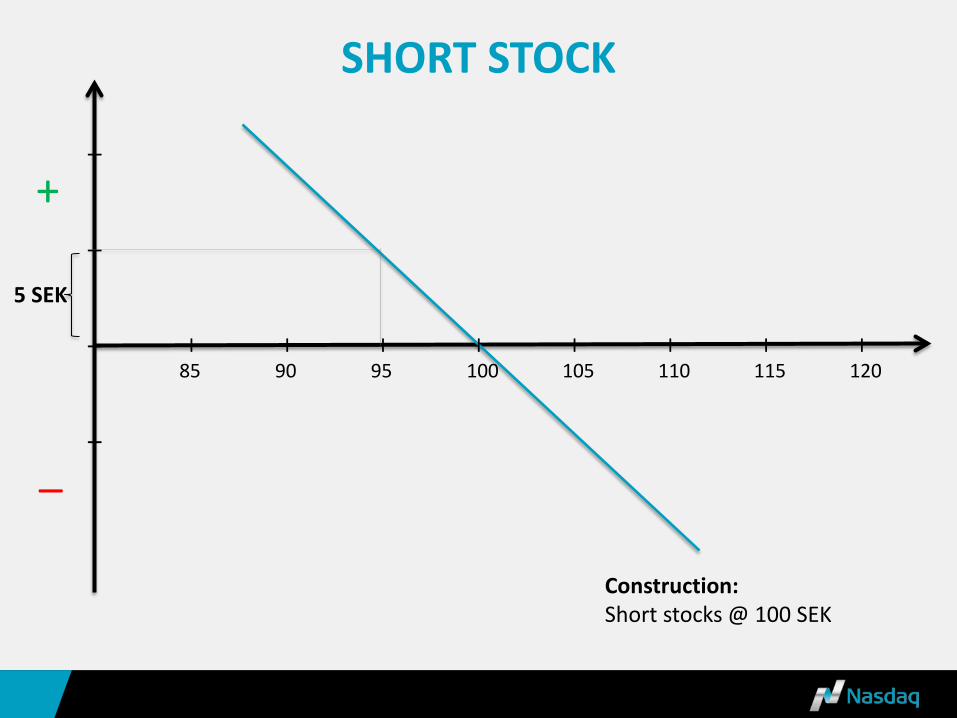
I I I I I I I I 85 90 95 100 105 110 115 120
+
_
5 SEK
Construction: Short stocks @ 100 SEK
SHORT STOCK

I I I I I I I I 85 90 95 100 105 110 115 120
+
_
5 SEK
Construction: Bought call, strike 100, premium 5 SEK
BOUGHT CALL

I I I I I I I I 85 90 95 100 105 110 115 120
+
_
5 SEK
Construction: Bought put, strike 100, premium 5 SEK
BOUGHT PUT

I I I I I I I I 85 90 95 100 105 110 115 120
+
_
5 SEK
Construction: Written call, strike 100, premium 5 SEK
SOLD (WRITTEN) CALL

I I I I I I I I 85 90 95 100 105 110 115 120
+
_
5 SEK
Construction: Written put, strike 100, premium 5 SEK
SOLD (WRITTEN) PUT

SOME STRATEGIES

TO CONSIDER WHEN BUYING CALLS AND PUTS…
When buying calls and puts ”naked” you are often dependent on a LARGE or FAST move (in order to generate the return you want)
KEEP IN MIND WHEN WRITING OPTIONS
You have to be ready to fulfill your obligations
”Unlikely does not mean impossible”

STRATEGY 1
Neutral to slightly positive to underlying stock

34
• You write puts with strike price 100 SEK
• The premium you get is 5,00 SEK
• You now have the obligation to buy the
underlying stock at 100 SEK (in reality 95 SEK)
WRITTEN PUT

I I I I I I I I 85 90 95 100 105 110 115 120
+
_
5 SEK
Construction: Written put, strike 100 @ 5 SEK
WRITTEN PUT

STRATEGY 2
Neutral to slightly positive to underlying stock

37
• You buy stocks @ 100 SEK • You sell (write) calls with strike 105 SEK • The premium you get is 3,00 SEK
COVERED CALL

I I I I I I I I 85 90 95 100 105 110 115 120
+
_
3 SEK
Construction Stocks: 1000 @ 100 SEK Written calls (10) with strike 105, @ 3 SEK
Stocks
Utf. Call
Whole position
COVERED CALL
3 SEK

39
3 scenarios: 1) Stock price @ 105 or higher, you might have to sell your
stocks for 105 SEK (in reality 105 + 3,00 = 108,00 SEK)
2) Stock goes sideways, the option expires worthless, you keep your premium of 3,00 SEK (3 000 SEK and a 3% return even if an unchanged stock price)
3) Stock price drops, the option becomes worthless, you make a return of 3 000 SEK on the sold option but lose on the falling stocks (the premium reduces the loss by 3 000 SEK)
COVERED CALL

STRATEGY 3
Neutral to slightly positive to underlying stock

41
”SOLD STRANGLE AGAINST STOCKS”
You buy stocks @ 100 SEK You are fine by selling the stocks @105 SEK You are happy to buy more stocks @ 95 SEK
Sell (write) calls with strike price 105 kr, receive 3,00 SEK Sell (write) puts with strike price 95 kr, receive 3,00 SEK In total you receive 6 SEK Outcome @ 100 SEK? Outcome @ 105 SEK? Outcome @ 95 SEK?

95 SEK
105 SEK
100 SEK
110 SEK

STRATEGY 4
Positive to the stock but want a hedge (temporary insurance)

I I I I I I I I 85 90 95 100 105 110 115 120
+
_
8 SEK
Construction: Stocks: 1000 (@ 100 SEK) Bought puts (10 contracts) strike 95 SEK @ 3 SEK
Stocks Whole position
PROTECTIVE PUT
Bought put

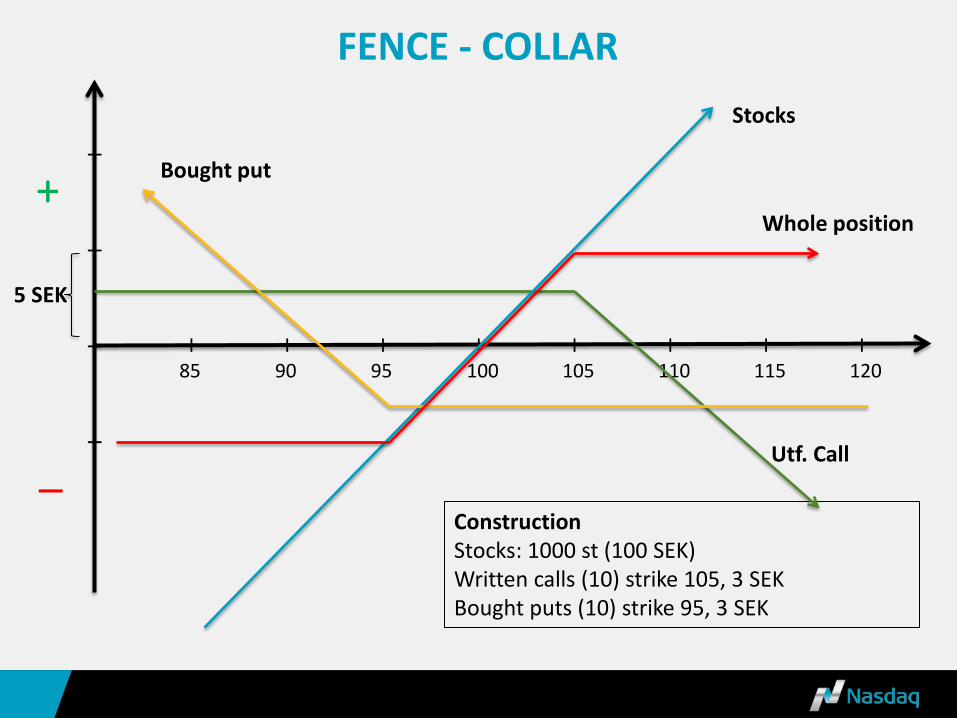
STRATEGY 5
Establish a cheap hedge for the stocks (with capped upside)
I I I I I I I I 85 90 95 100 105 110 115 120
+
_
5 SEK
Construction Stocks: 1000 st (100 SEK) Written calls (10) strike 105, 3 SEK Bought puts (10) strike 95, 3 SEK
Stocks
Utf. Call
Whole position
FENCE - COLLAR
Bought put
I I I I I I I I 85 90 95 100 105 110 115 120
+
_
5 SEK
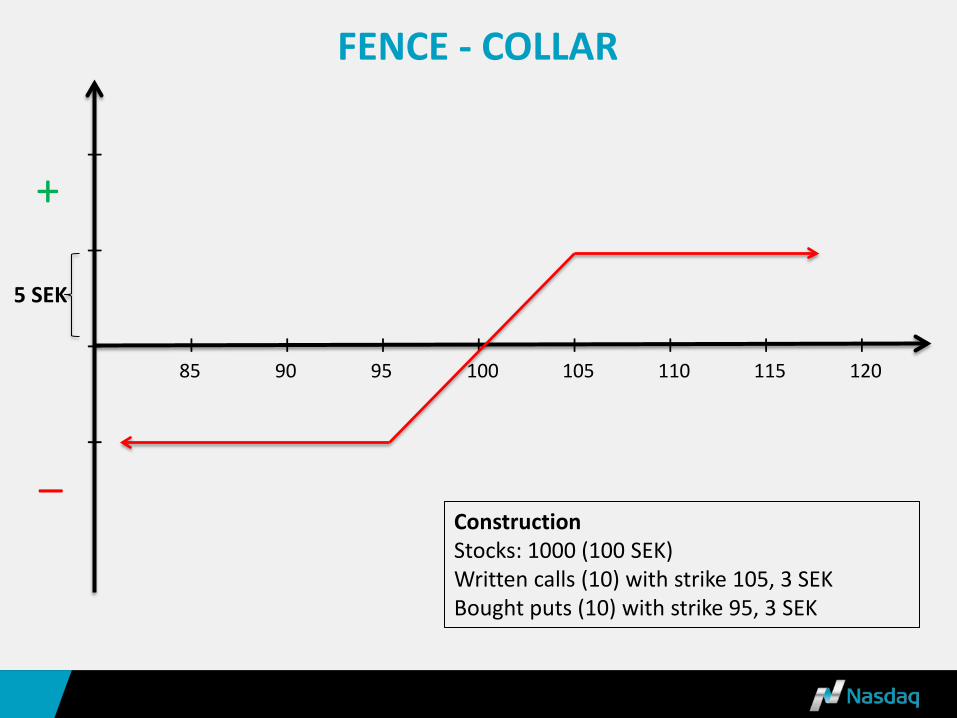
Construction Stocks: 1000 (100 SEK) Written calls (10) with strike 105, 3 SEK Bought puts (10) with strike 95, 3 SEK
FENCE - COLLAR

STRATEGY 6
Good return when limited increase in the stock price

I I I I I I I I 85 90 95 100 105 110 115 120
+
_ Construction Bought calls (10) with strike 100 @ 5 SEK Written calls (10) with strike 105 @ 2,50 SEK Max profit: 5,00-2,50=2,50 SEK (100%)
”CALL SPREAD”
2,50
STRATEGY 7
Maximize the return in a limited increase in the stock price

I I I I I I I I 85 90 95 100 105 110 115 120
+
_
5 SEK
Construction Stocks: 1000 Bought calls (10) strike 100 @ 5 SEK Written calls (20) strike 105 @ 2,50 SEK Gross cost = 0 kr (-5,00+2,50+2,50 SEK = 0)
5 SEK
”RATIO SPREAD AGAINST STOCKS”
Whole position

VALUATION
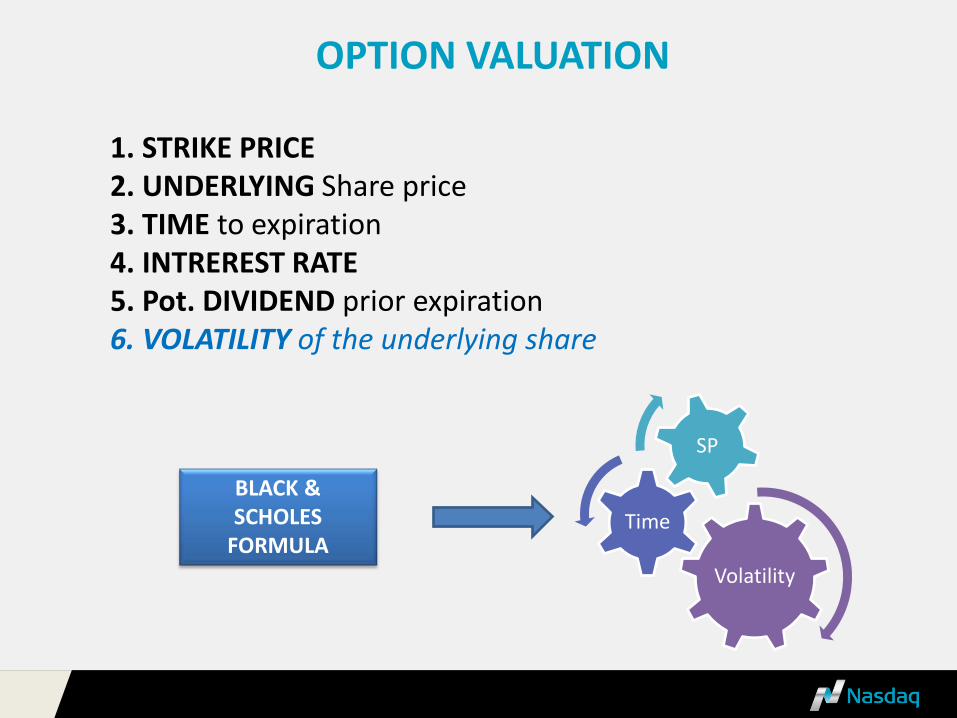
Volatility
Time
SP
BLACK & SCHOLES
FORMULA
1. STRIKE PRICE 2. UNDERLYING Share price 3. TIME to expiration 4. INTREREST RATE 5. Pot. DIVIDEND prior expiration 6. VOLATILITY of the underlying share
OPTION VALUATION

• The financial term for the standard deviation
• A percentage figure that indicates a probable change in the option's price – Applies for change up or down – With the certainty of one (1) standard deviation
• Evaluating the expected market risk (speed) • Historical Volatility vs. Implied Volatility (Edge)
• Predicting market movements? • Normal distribution - and lognormal distribution (skew)
VOLATILITY

Probability Theory Option valuation
Volatility 20%
68,3 %
95,4 %
99,7 %
95,4 %
99,7 %
NORMAL DISTRIBUTION CURVE
BULL BEAR NEUTRAL
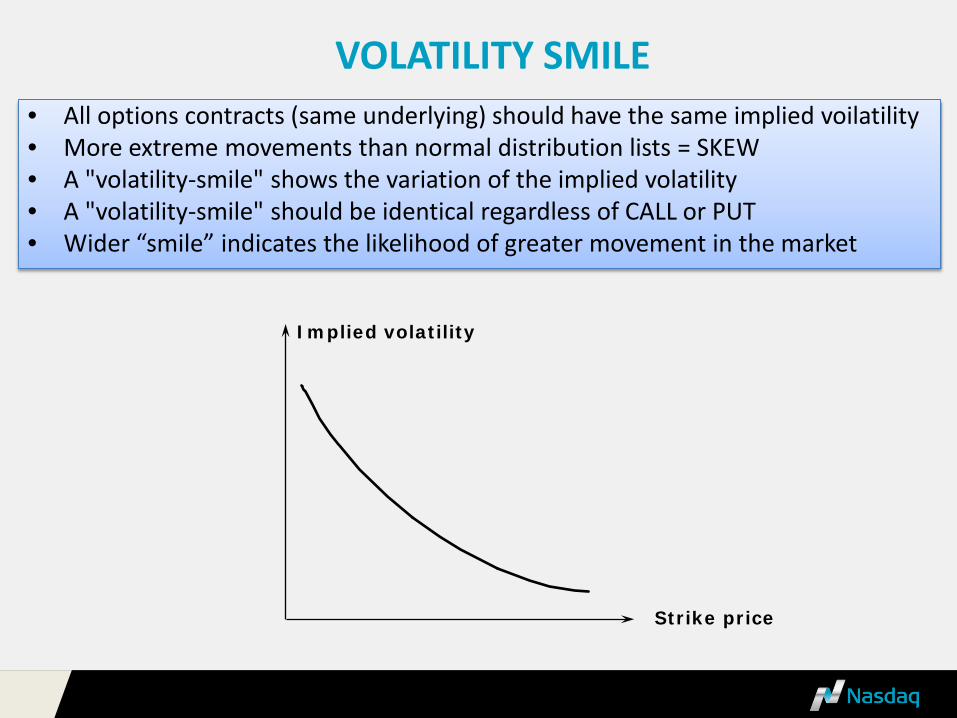
• All options contracts (same underlying) should have the same implied voilatility • More extreme movements than normal distribution lists = SKEW • A "volatility-smile" shows the variation of the implied volatility • A "volatility-smile" should be identical regardless of CALL or PUT • Wider “smile” indicates the likelihood of greater movement in the market
Implied volatility
Strike price
VOLATILITY SMILE
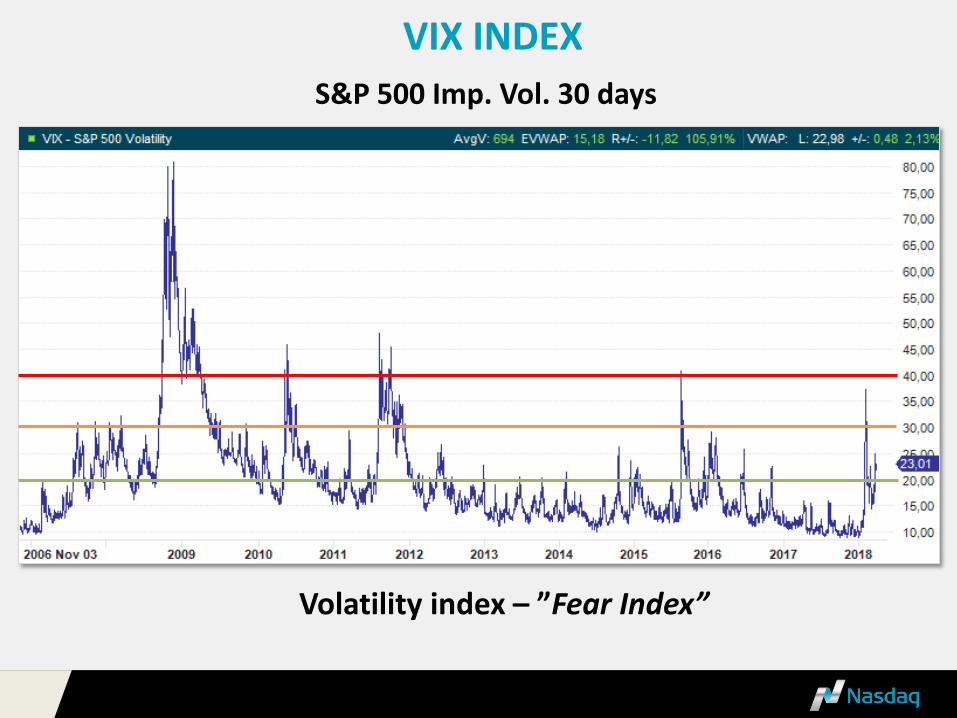
S&P 500 Imp. Vol. 30 days
Volatility index – ”Fear Index”
VIX INDEX

”Tail Index”
S&P 500
120 = normal 128 = Avg (5y) 134 = Avg (6m)
SKEW INDEX

How to lose money with a long call in a bullish market
Scenario: Stock = 750 (SEK) Profit warning/bad news Stock = 500 Buying ATM Call = 32 Day after: Stock = 520 (recovers + 4%) Option leverage = Big profit?
Stock 500 Strike 500 Time 30 days Rate 1 % Volatility 55 % Call teor. Price: 31,61
Stock 520 Strike 500 Time 29 days Rate 1 % Volatility 25 % Call teor. Price: 26,99
P/L - 15,60 %

DISCLAIMER
Nasdaq makes no representations or warranties with respect to the information and disclaims all liability for any use made of the contents of this document. All information is provided “as is” without warranty of any kind. Nasdaq assumes no responsibility for any errors or omissions. This document is provided for informational purposes only, does not constitute legal advice or investment advice and
should not be relied upon for that purpose. Investing in securities involves risks. Securities can increase and decrease in value and there is no guarantee that you will get your investment back. Past
performance is no guarantee of future returns. Advice from a securities professional is strongly advised before taking or refraining from taking any action as a result of the contents of this document.


