33
www.wpiservices.com Opus Suite: Systems & Logistics Cost Optimization Simplifying Life Cycle Decisions and Readiness Analysis
www.wpiservices.com
Opus Suite: Systems & Logistics Cost
Optimization
Simplifying Life Cycle Decisions and
Readiness Analysis
www.wpiservices.com 2
• The Optimization Trade Space
• Current Customers
• Programs Supported
• Opus Suite for Decision Support Across the Life
Cycle
• Tool Suite Detail
• Modeling Example
Overview
www.wpiservices.com
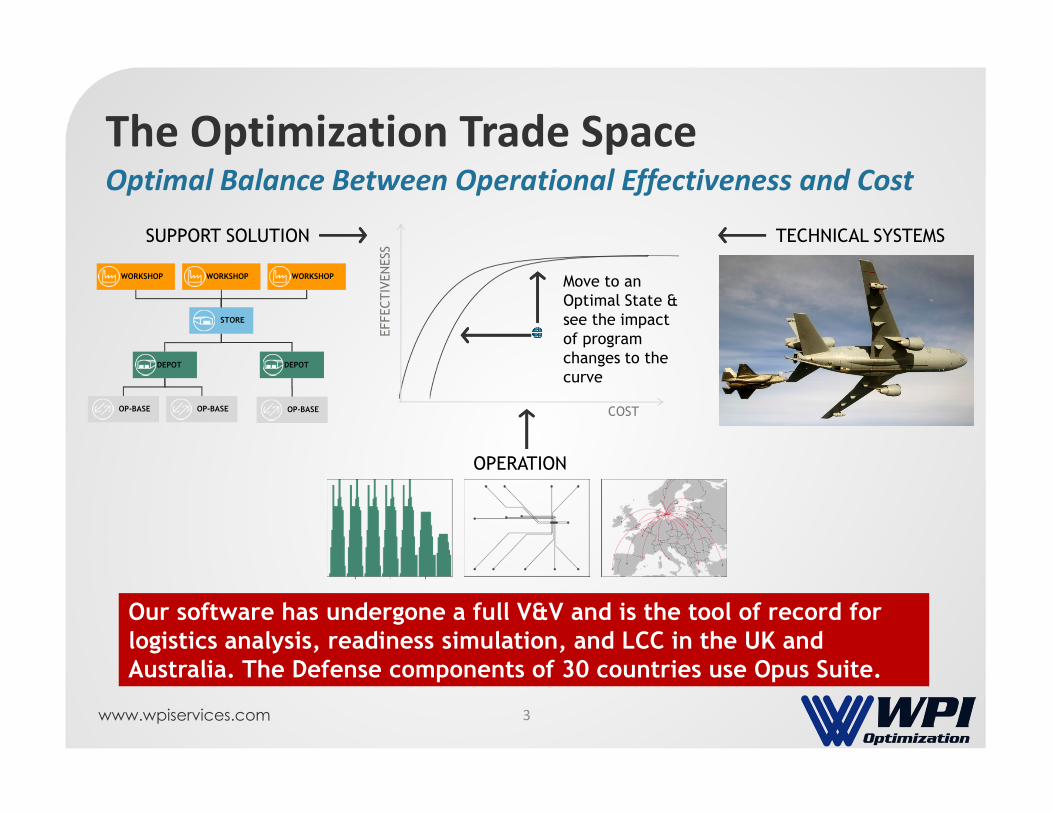
OPERATION
TECHNICAL SYSTEMSSUPPORT SOLUTION
DEPOT DEPOT
WORKSHOP WORKSHOP WORKSHOP
STORE
OP-BASE OP-BASE OP-BASE
Our software has undergone a full V&V and is the tool of record for
logistics analysis, readiness simulation, and LCC in the UK and
Australia. The Defense components of 30 countries use Opus Suite.
COST
EFFEC
TIV
EN
ESS
Move to an
Optimal State &
see the impact
of program
changes to the
curve
The Optimization Trade SpaceOptimal Balance Between Operational Effectiveness and Cost
3
www.wpiservices.com
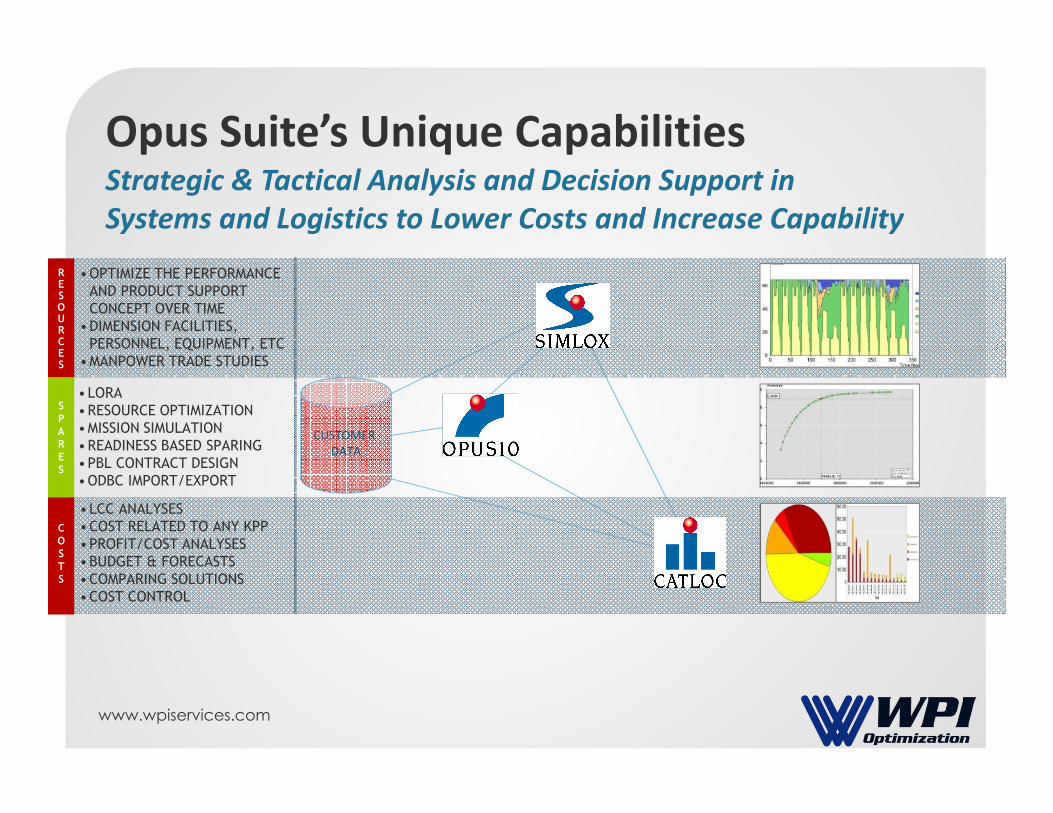
CUSTOMER
DATA
•LORA
•RESOURCE OPTIMIZATION
•MISSION SIMULATION
•READINESS BASED SPARING
•PBL CONTRACT DESIGN
•ODBC IMPORT/EXPORT
S
P
A
R
E
S
•OPTIMIZE THE PERFORMANCE
AND PRODUCT SUPPORT
CONCEPT OVER TIME
•DIMENSION FACILITIES,
PERSONNEL, EQUIPMENT, ETC
•MANPOWER TRADE STUDIES
R E S O U R C E S
•LCC ANALYSES
•COST RELATED TO ANY KPP
•PROFIT/COST ANALYSES
•BUDGET & FORECASTS
•COMPARING SOLUTIONS
•COST CONTROL
C
O
S
T
S
Strategic & Tactical Analysis and Decision Support in
Systems and Logistics to Lower Costs and Increase Capability
Opus Suite’s Unique Capabilities
www.wpiservices.com
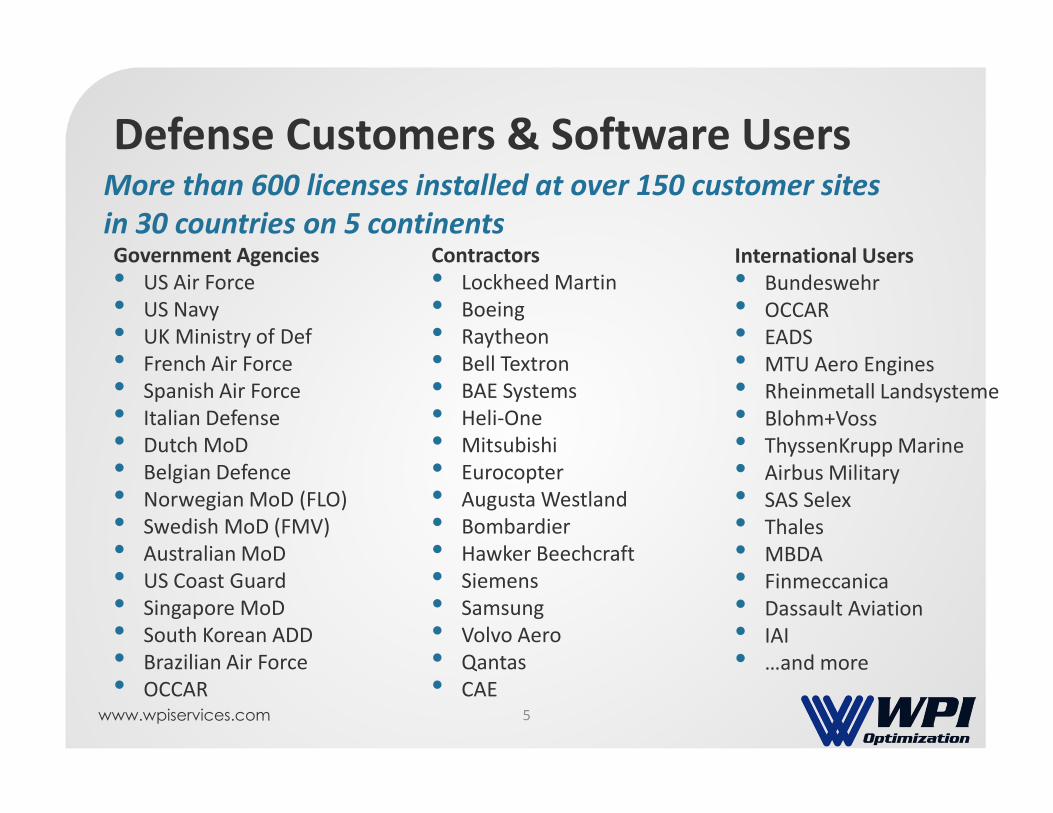
Defense Customers & Software UsersMore than 600 licenses installed at over 150 customer sites
in 30 countries on 5 continentsGovernment Agencies
• US Air Force
• US Navy
• UK Ministry of Def
• French Air Force
• Spanish Air Force
• Italian Defense
• Dutch MoD
• Belgian Defence
• Norwegian MoD (FLO)
• Swedish MoD (FMV)
• Australian MoD
• US Coast Guard
• Singapore MoD
• South Korean ADD
• Brazilian Air Force
• OCCAR
Contractors
• Lockheed Martin
• Boeing
• Raytheon
• Bell Textron
• BAE Systems
• Heli-One
• Mitsubishi
• Eurocopter
• Augusta Westland
• Bombardier
• Hawker Beechcraft
• Siemens
• Samsung
• Volvo Aero
• Qantas
• CAE
International Users
• Bundeswehr
• OCCAR
• EADS
• MTU Aero Engines
• Rheinmetall Landsysteme
• Blohm+Voss
• ThyssenKrupp Marine
• Airbus Military
• SAS Selex
• Thales
• MBDA
• Finmeccanica
• Dassault Aviation
• IAI
• …and more
5
www.wpiservices.com
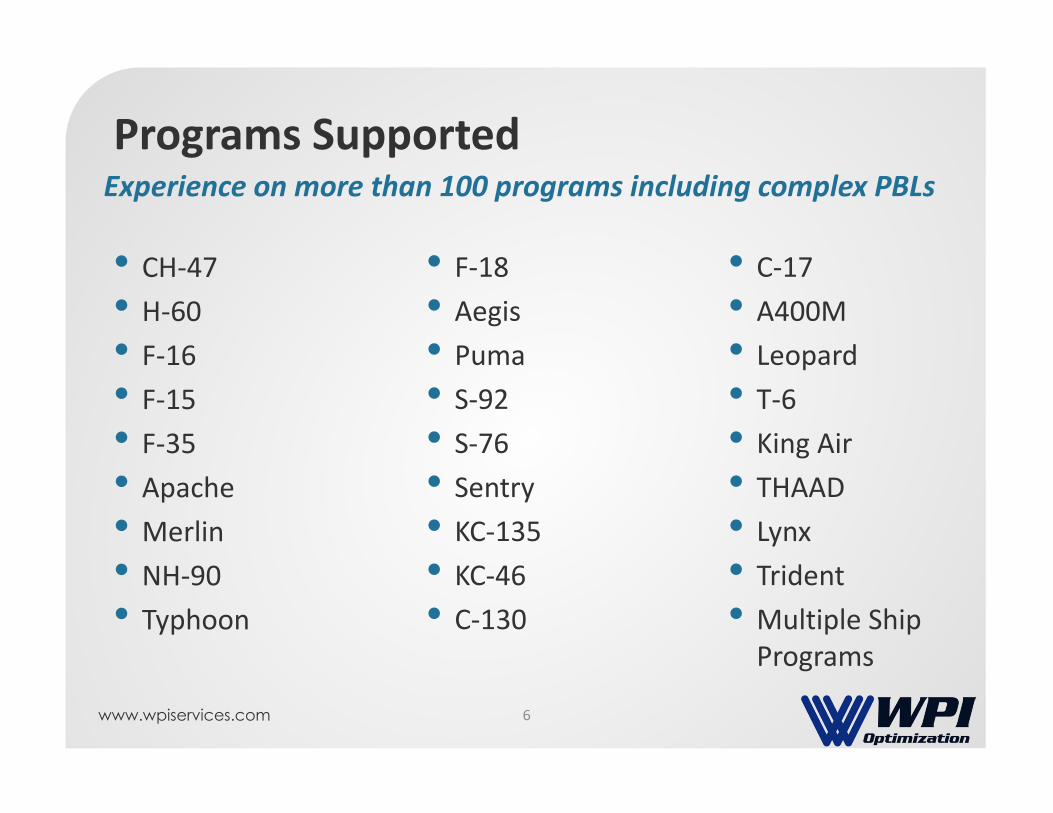
Programs Supported
• CH-47
• H-60
• F-16
• F-15
• F-35
• Apache
• Merlin
• NH-90
• Typhoon
• F-18
• Aegis
• Puma
• S-92
• S-76
• Sentry
• KC-135
• KC-46
• C-130
• C-17
• A400M
• Leopard
• T-6
• King Air
• THAAD
• Lynx
• Trident
• Multiple Ship
Programs
Experience on more than 100 programs including complex PBLs
6
www.wpiservices.com
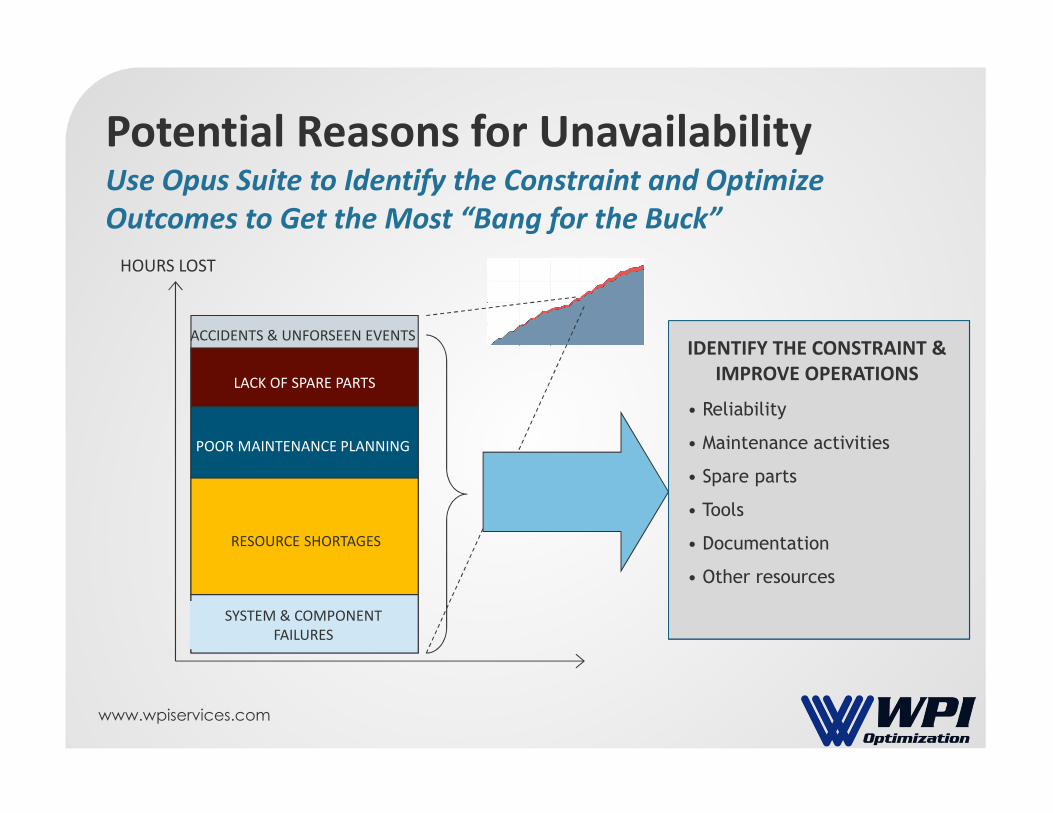
HOURS LOST
ACCIDENTS & UNFORSEEN EVENTS
LACK OF SPARE PARTS
POOR MAINTENANCE PLANNING
RESOURCE SHORTAGES
SYSTEM & COMPONENT
FAILURES
• Reliability
• Maintenance activities
• Spare parts
• Tools
• Documentation
• Other resources
IDENTIFY THE CONSTRAINT &
IMPROVE OPERATIONS
Potential Reasons for UnavailabilityUse Opus Suite to Identify the Constraint and Optimize
Outcomes to Get the Most “Bang for the Buck”
www.wpiservices.com
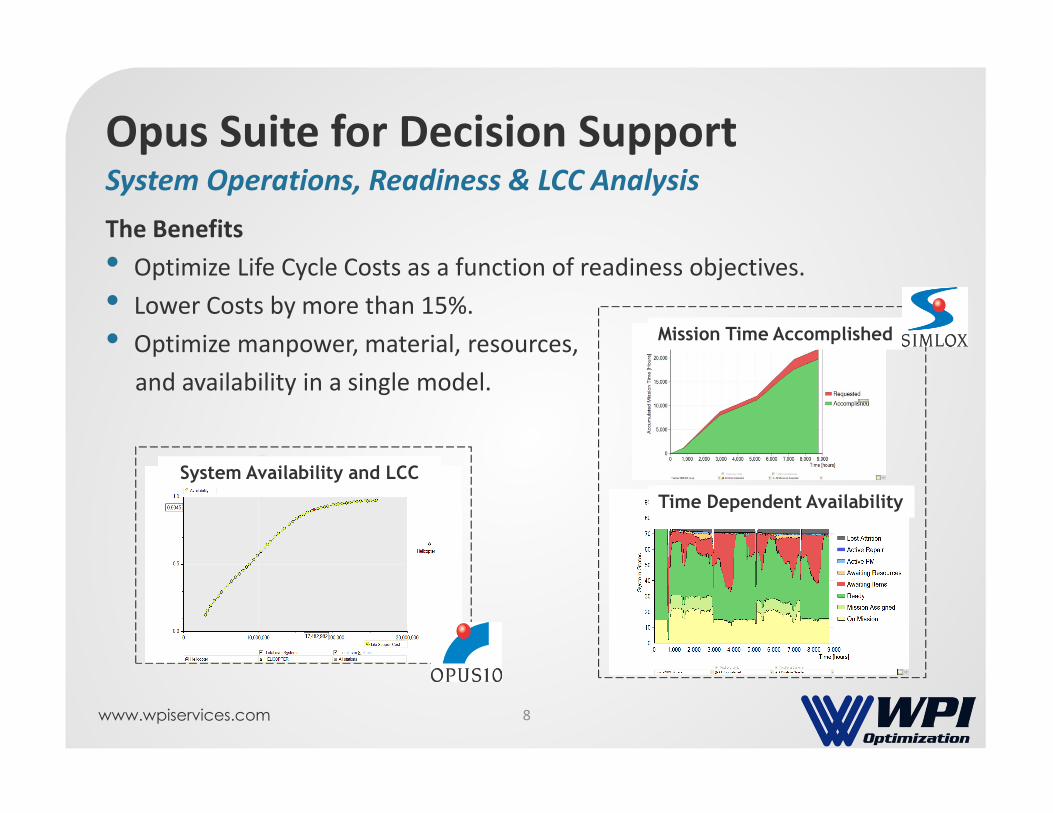
The Benefits
• Optimize Life Cycle Costs as a function of readiness objectives.
• Lower Costs by more than 15%.
• Optimize manpower, material, resources,
and availability in a single model.
Opus Suite for Decision SupportSystem Operations, Readiness & LCC Analysis
Data
Requirements
and
Information
System AnalysisSpare Parts and
Inventory
Analysis
System Availability and LCC
Operator Task
Analysis
Transportation
and
Distribution
Analysis
Time Dependent Availability
Mission Time Accomplished
8
www.wpiservices.com
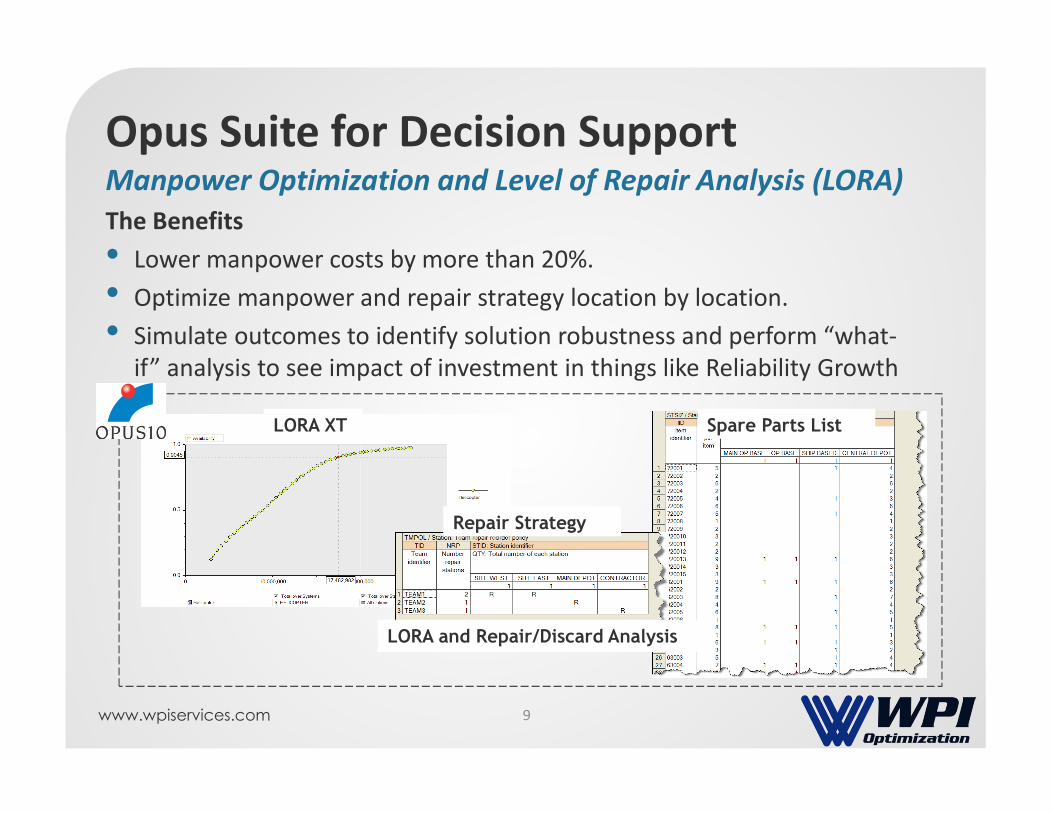
The Benefits
• Lower manpower costs by more than 20%.
• Optimize manpower and repair strategy location by location.
• Simulate outcomes to identify solution robustness and perform “what-
if” analysis to see impact of investment in things like Reliability Growth
Opus Suite for Decision SupportManpower Optimization and Level of Repair Analysis (LORA)
Spare Parts ListLORA XT
LORA and Repair/Discard Analysis
Repair Strategy
9
www.wpiservices.com
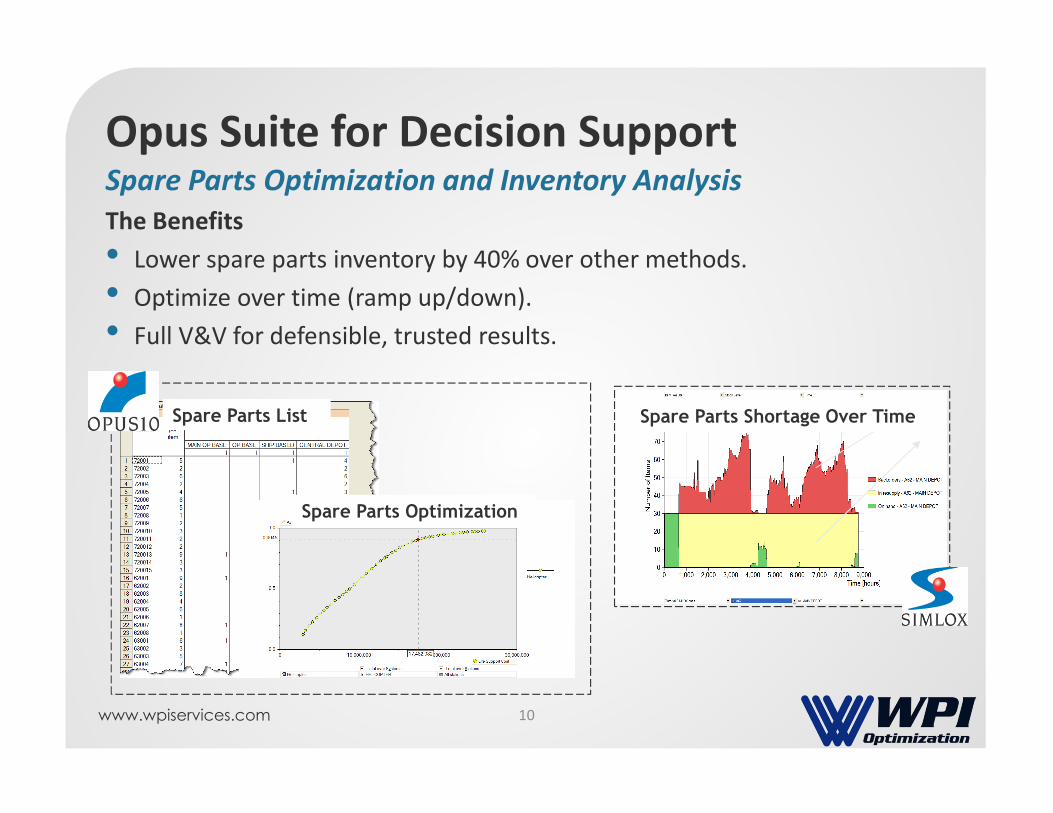
The Benefits
• Lower spare parts inventory by 40% over other methods.
• Optimize over time (ramp up/down).
• Full V&V for defensible, trusted results.
Opus Suite for Decision SupportSpare Parts Optimization and Inventory Analysis
Spare Parts List
Spare Parts Optimization
Spare Parts Shortage Over Time
10
www.wpiservices.com
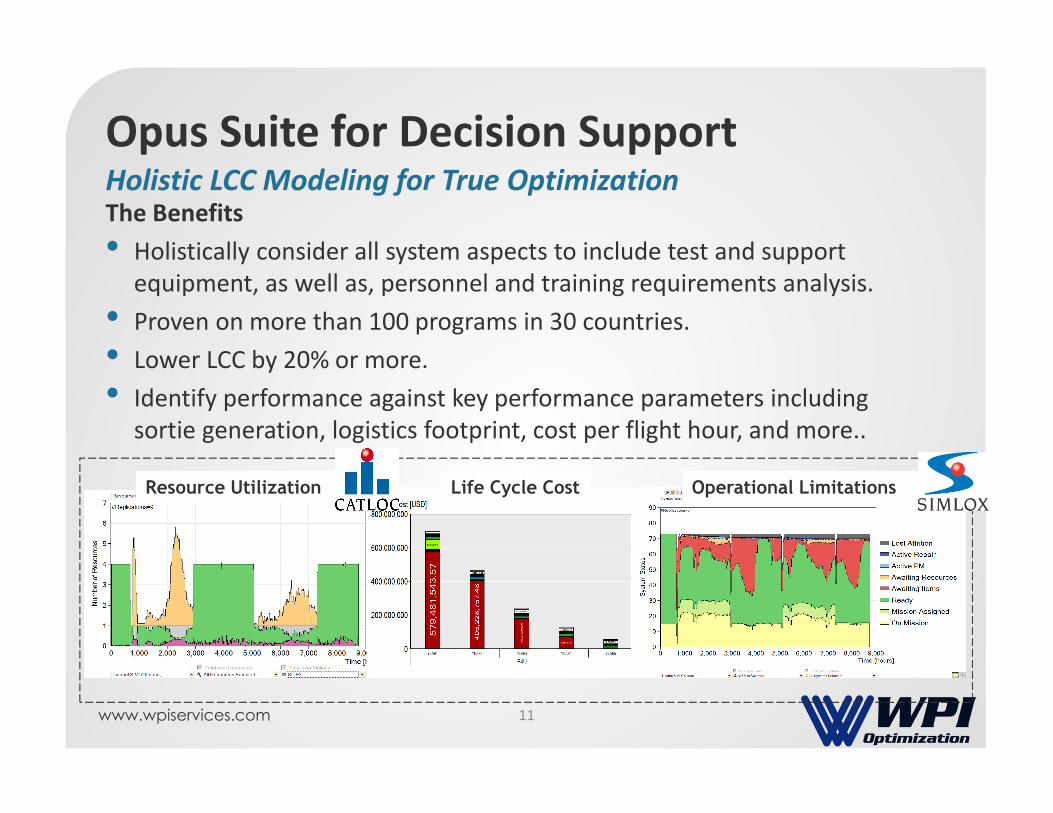
The Benefits
• Holistically consider all system aspects to include test and support
equipment, as well as, personnel and training requirements analysis.
• Proven on more than 100 programs in 30 countries.
• Lower LCC by 20% or more.
• Identify performance against key performance parameters including
sortie generation, logistics footprint, cost per flight hour, and more..
Opus Suite for Decision SupportHolistic LCC Modeling for True Optimization
Resource Utilization Operational LimitationsLife Cycle Cost
11
www.wpiservices.com
Preliminary Model Inputs (80% Solution)
• Preliminary Model Development will provide the 80% solution estimate– Additional fidelity can be added incrementally (about 300 potential input
variables) to continue to lower O&S costs and optimize performance.
• Input examples are:– Item ID
– Item Failure Rate (or a metric that may be used to derive failure modes/rates)
– Item Acquisition Costs
– Item Repair Costs
– System Configuration
– System Duty Cycle
– System Repair Turnaround Time
– Item Repair Turnaround Time
– Transportation Time Between Locations
– Quantity of Systems per Site
Only a basic set of inputs is required to begin modeling that can
be refined and incrementally expanded over time.
www.wpiservices.com
OPUS10
Logistics Support &
Spares
Optimization
www.wpiservices.com
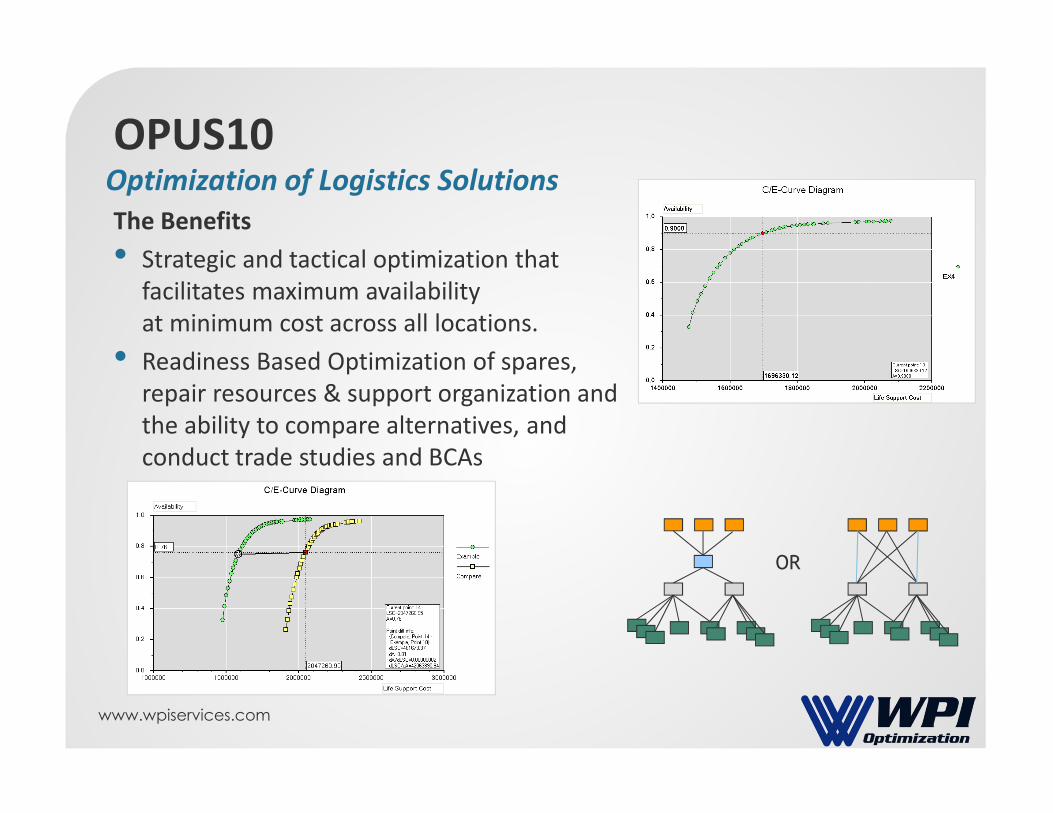
OPUS10
OR
The Benefits
• Strategic and tactical optimization that
facilitates maximum availability
at minimum cost across all locations.
• Readiness Based Optimization of spares,
repair resources & support organization and
the ability to compare alternatives, and
conduct trade studies and BCAs
Optimization of Logistics Solutions
www.wpiservices.com
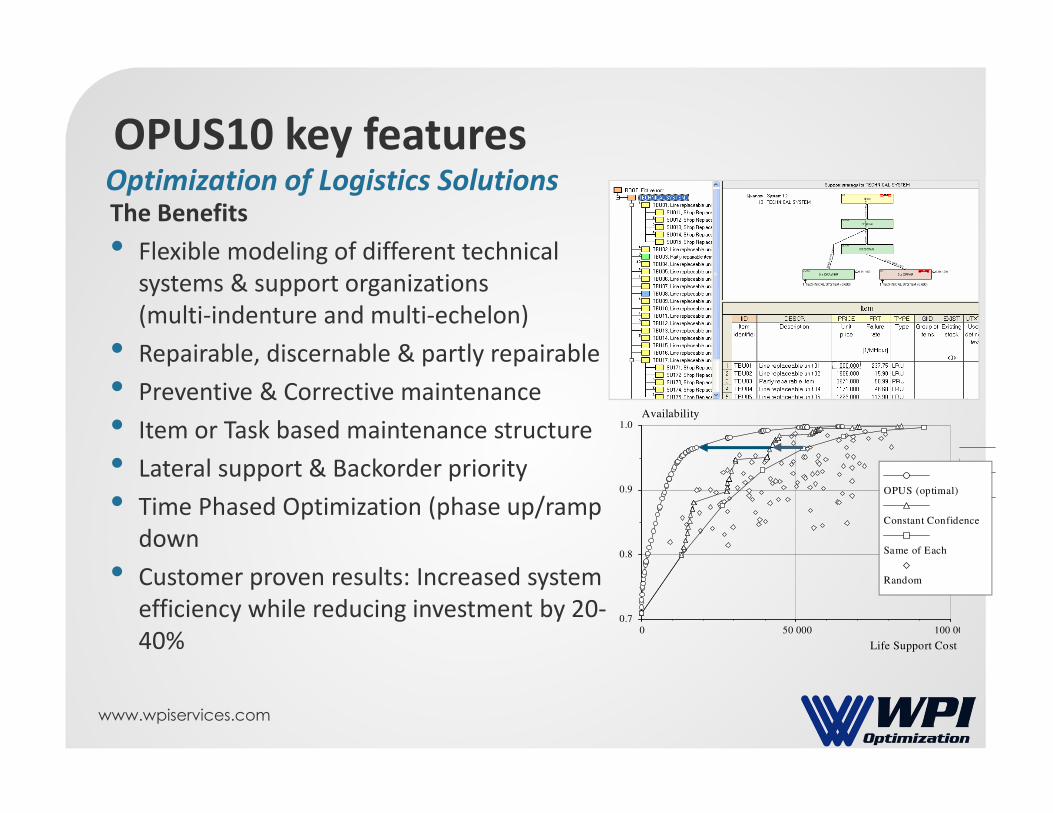
OPUS10 key features
0 50 000 100 000
Life Support Cost
0.7
0.8
0.9
1.0Availability
Random
Same of Each
C
O
Random
Same of Each
Constant Confidence
OPUS (optimal)
The Benefits
• Flexible modeling of different technical
systems & support organizations
(multi-indenture and multi-echelon)
• Repairable, discernable & partly repairable
• Preventive & Corrective maintenance
• Item or Task based maintenance structure
• Lateral support & Backorder priority
• Time Phased Optimization (phase up/ramp
down
• Customer proven results: Increased system
efficiency while reducing investment by 20-
40%
Optimization of Logistics Solutions
www.wpiservices.com
SIMLOX
Simulation of Operations and
Logistics Support
www.wpiservices.com
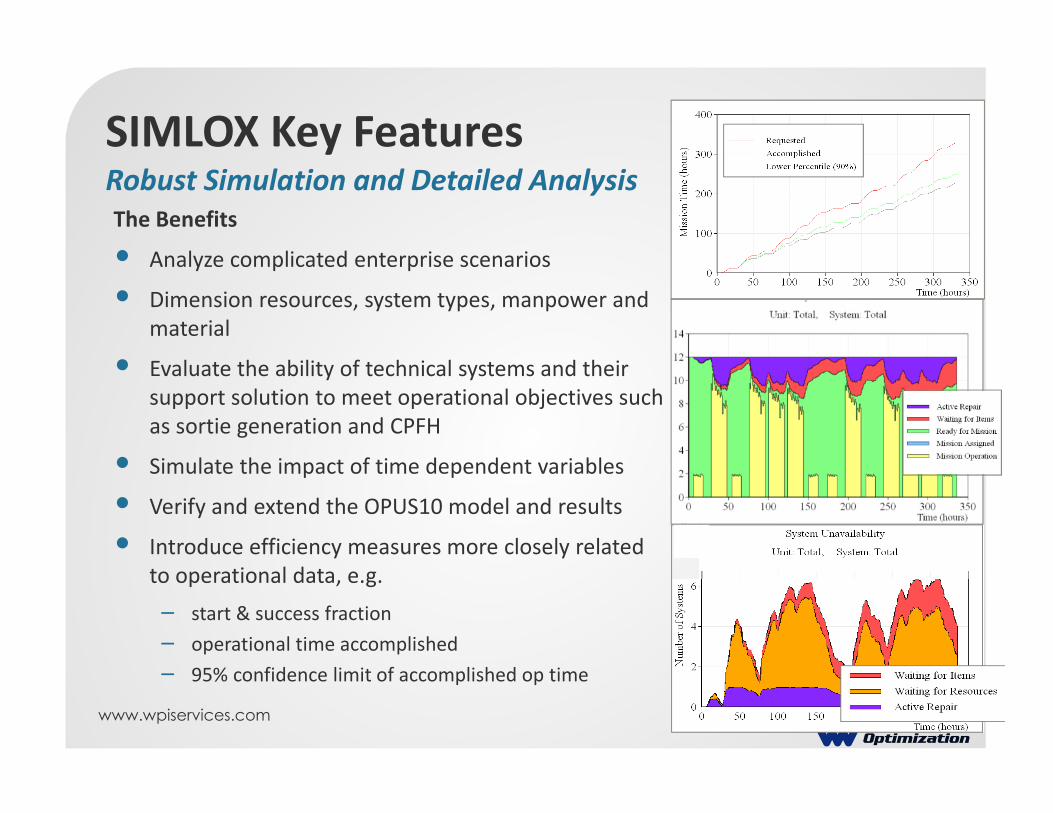
SIMLOX Key Features
The Benefits
• Analyze complicated enterprise scenarios
• Dimension resources, system types, manpower and
material
• Evaluate the ability of technical systems and their
support solution to meet operational objectives such
as sortie generation and CPFH
• Simulate the impact of time dependent variables
• Verify and extend the OPUS10 model and results
• Introduce efficiency measures more closely related
to operational data, e.g.
– start & success fraction
– operational time accomplished
– 95% confidence limit of accomplished op time
Robust Simulation and Detailed Analysis
www.wpiservices.com
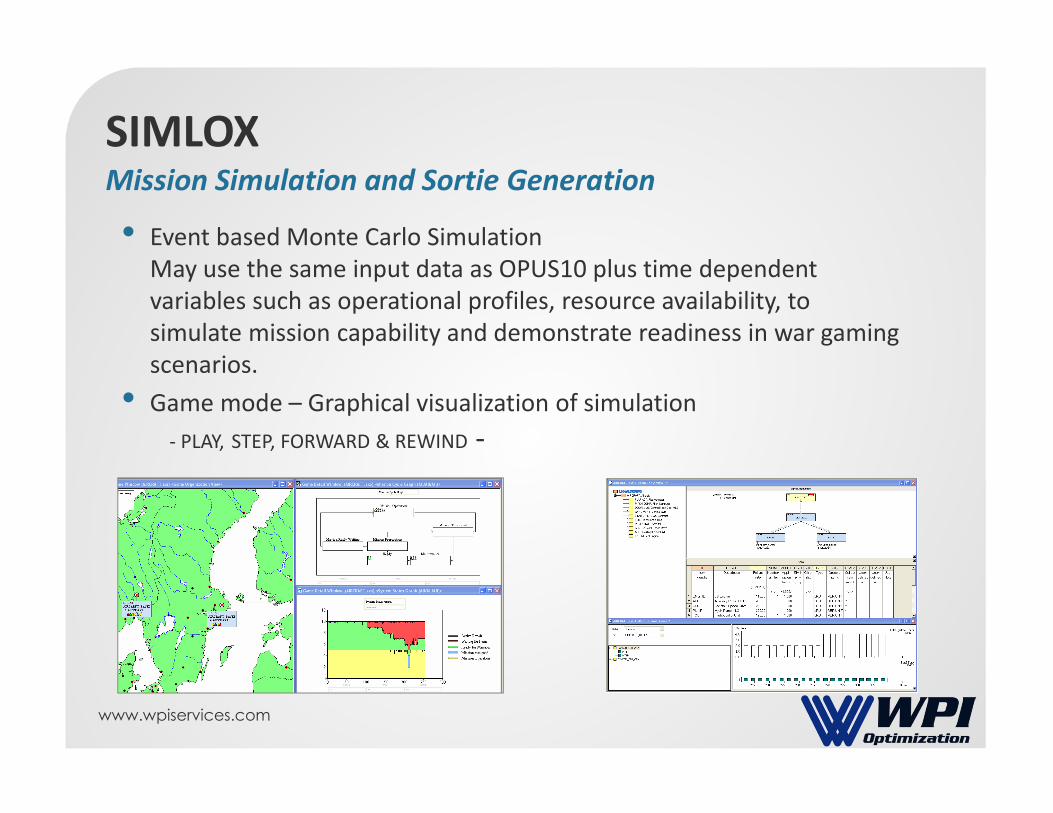
SIMLOX
• Event based Monte Carlo Simulation
May use the same input data as OPUS10 plus time dependent
variables such as operational profiles, resource availability, to
simulate mission capability and demonstrate readiness in war gaming
scenarios.
• Game mode – Graphical visualization of simulation
- PLAY, STEP, FORWARD & REWIND -
Mission Simulation and Sortie Generation
www.wpiservices.com
CATLOC
LCC & Cost
Analysis
www.wpiservices.com
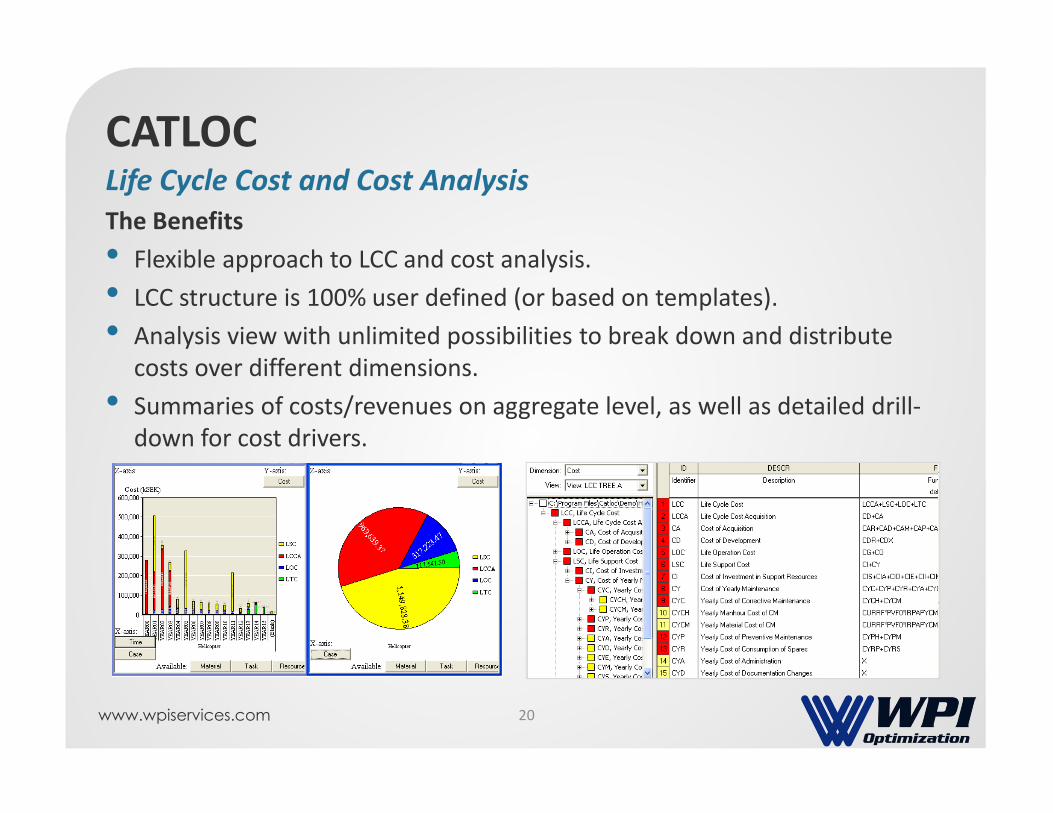
The Benefits
• Flexible approach to LCC and cost analysis.
• LCC structure is 100% user defined (or based on templates).
• Analysis view with unlimited possibilities to break down and distribute
costs over different dimensions.
• Summaries of costs/revenues on aggregate level, as well as detailed drill-
down for cost drivers.
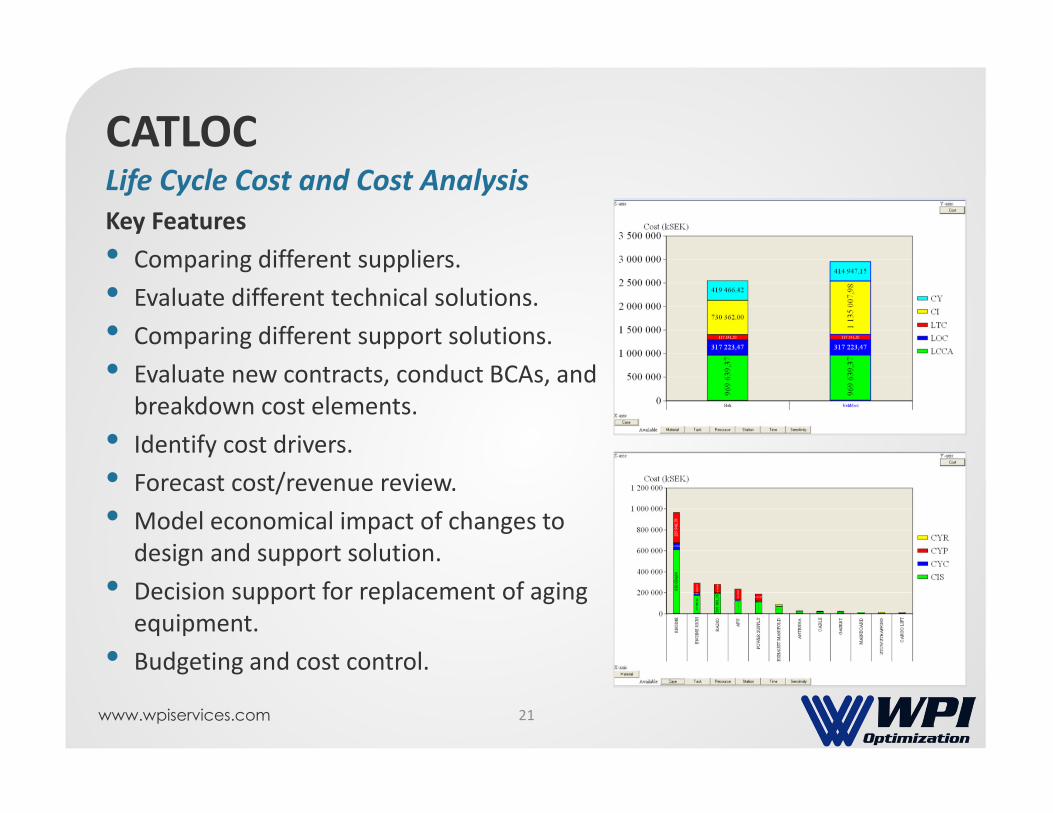
CATLOCLife Cycle Cost and Cost Analysis
20
www.wpiservices.com
Key Features
• Comparing different suppliers.
• Evaluate different technical solutions.
• Comparing different support solutions.
• Evaluate new contracts, conduct BCAs, and
breakdown cost elements.
• Identify cost drivers.
• Forecast cost/revenue review.
• Model economical impact of changes to
design and support solution.
• Decision support for replacement of aging
equipment.
• Budgeting and cost control.
CATLOCLife Cycle Cost and Cost Analysis
21
www.wpiservices.com
Analysis Example
www.wpiservices.com
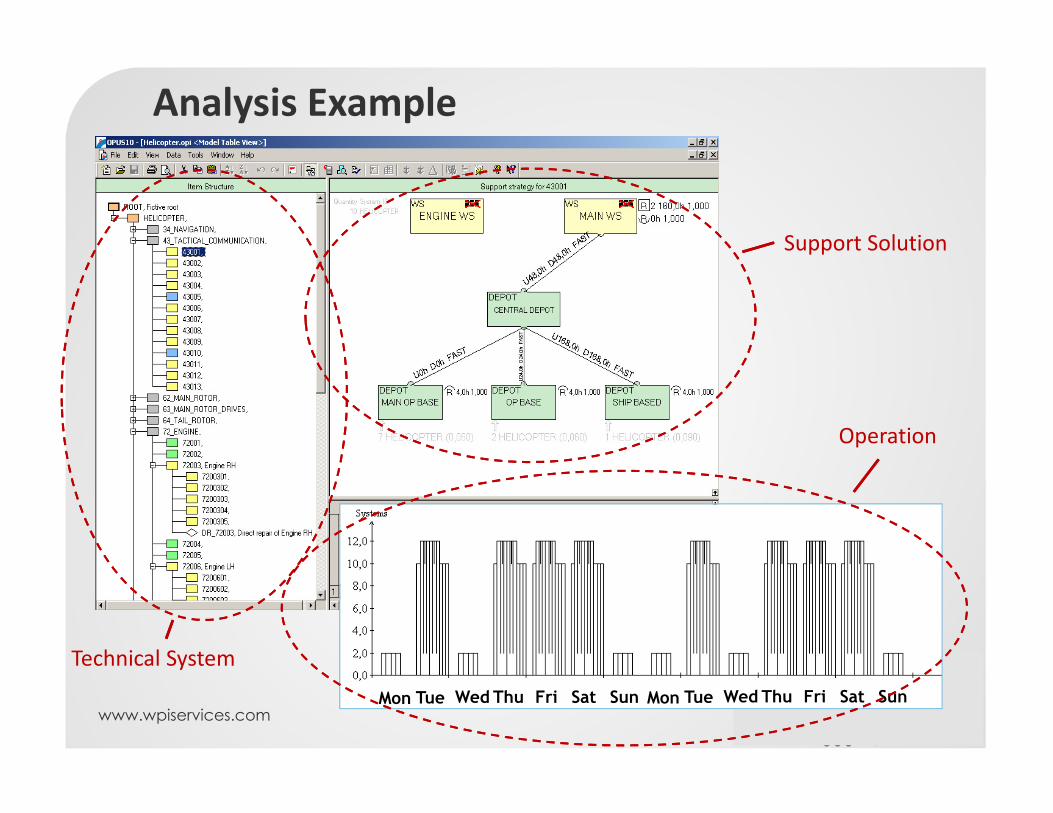
Analysis Example
Mon Tue Wed Thu Fri Sat Sun Mon Tue Wed Thu Fri Sat Sun
Technical System
Support Solution
Operation
www.wpiservices.com
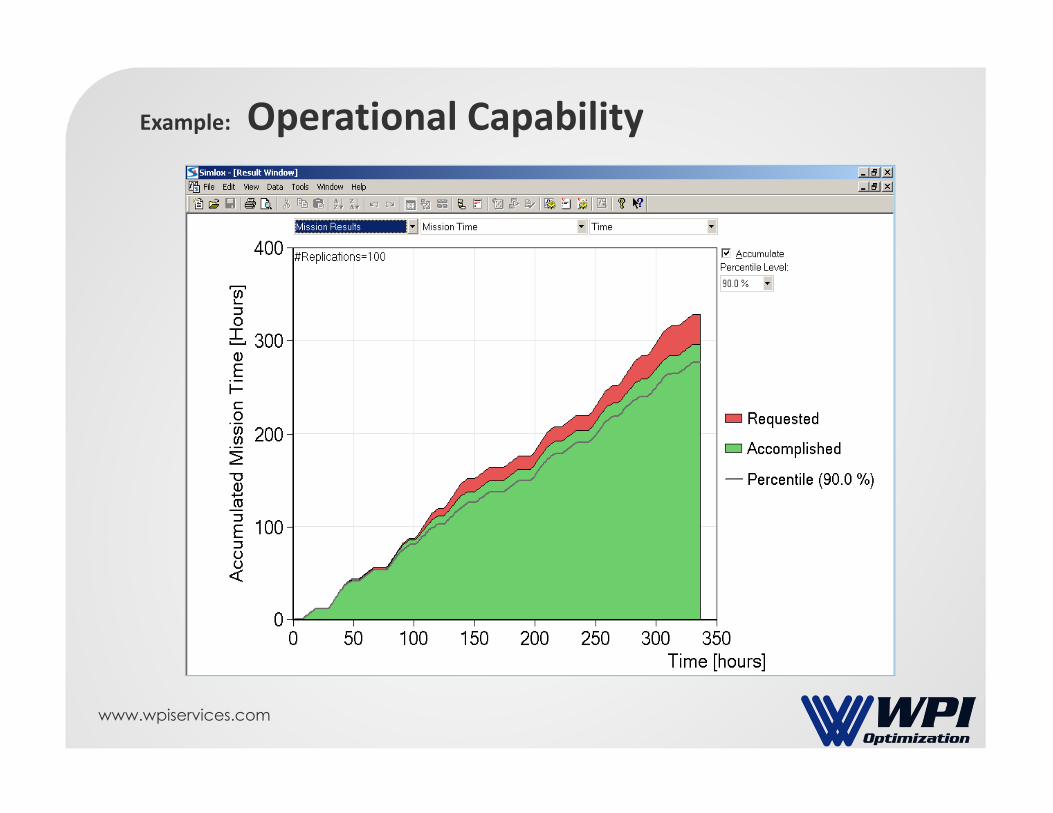
Example: Operational Capability
www.wpiservices.com
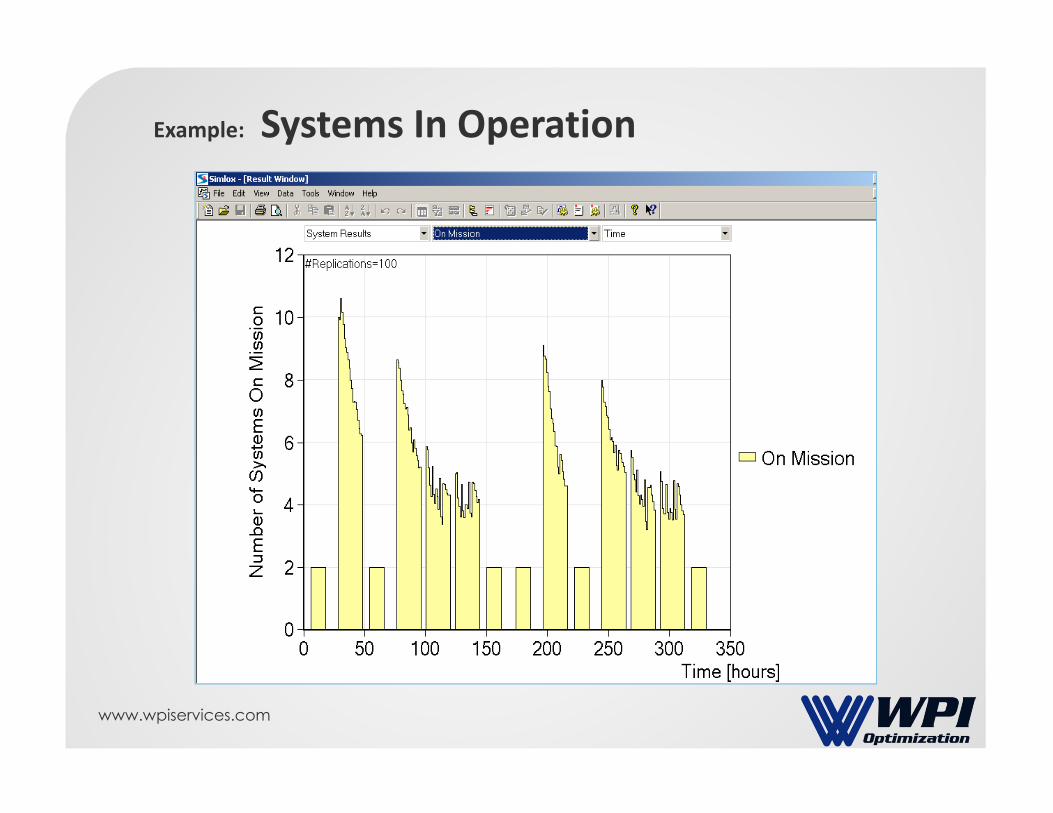
Example: Systems In Operation
www.wpiservices.com
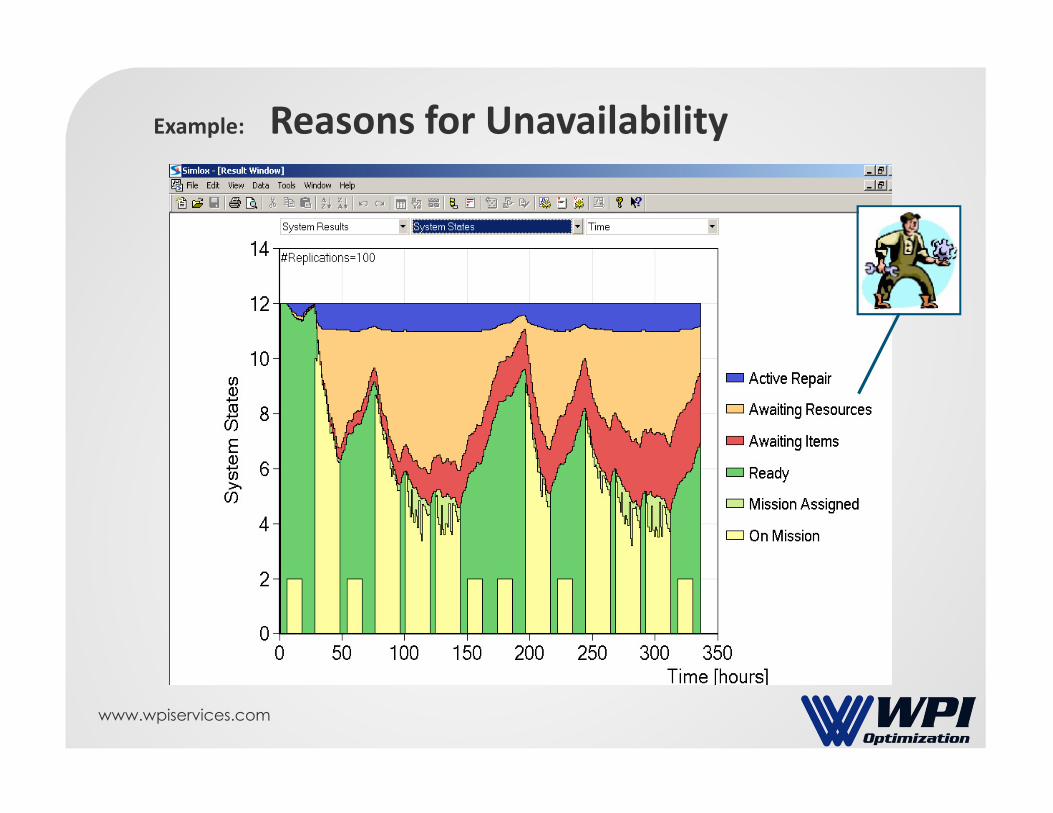
Example: Reasons for Unavailability
www.wpiservices.com
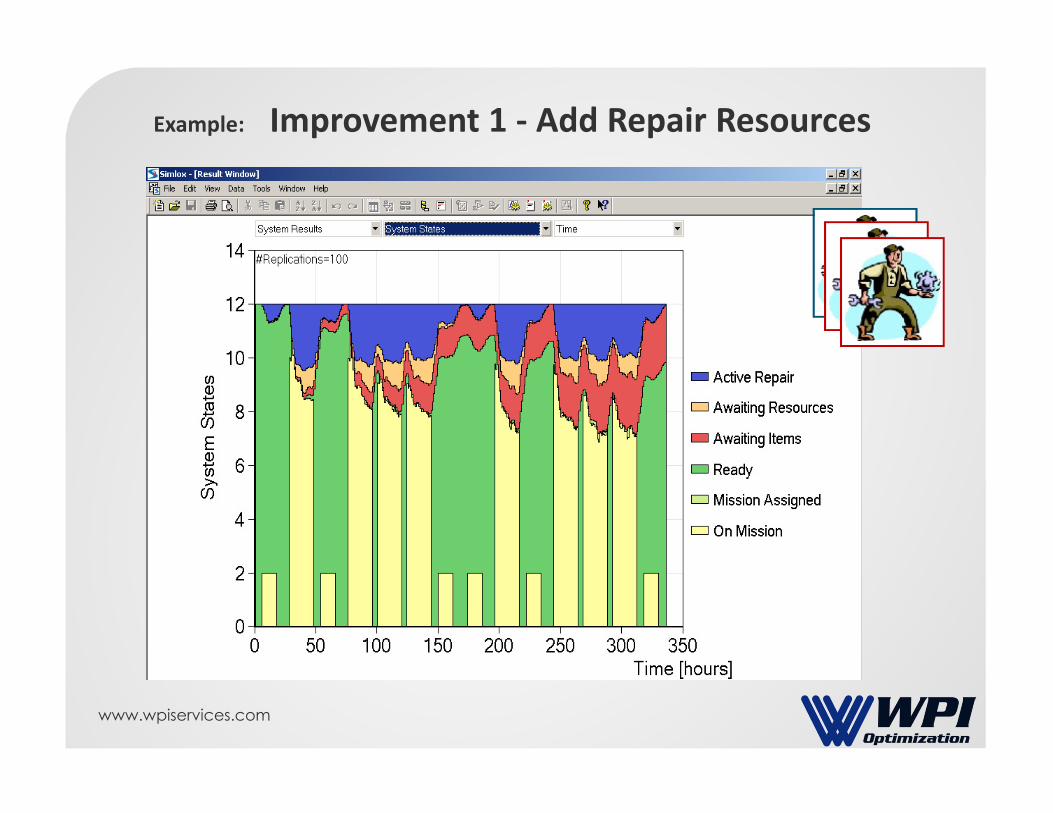
Example: Improvement 1 - Add Repair Resources
www.wpiservices.com
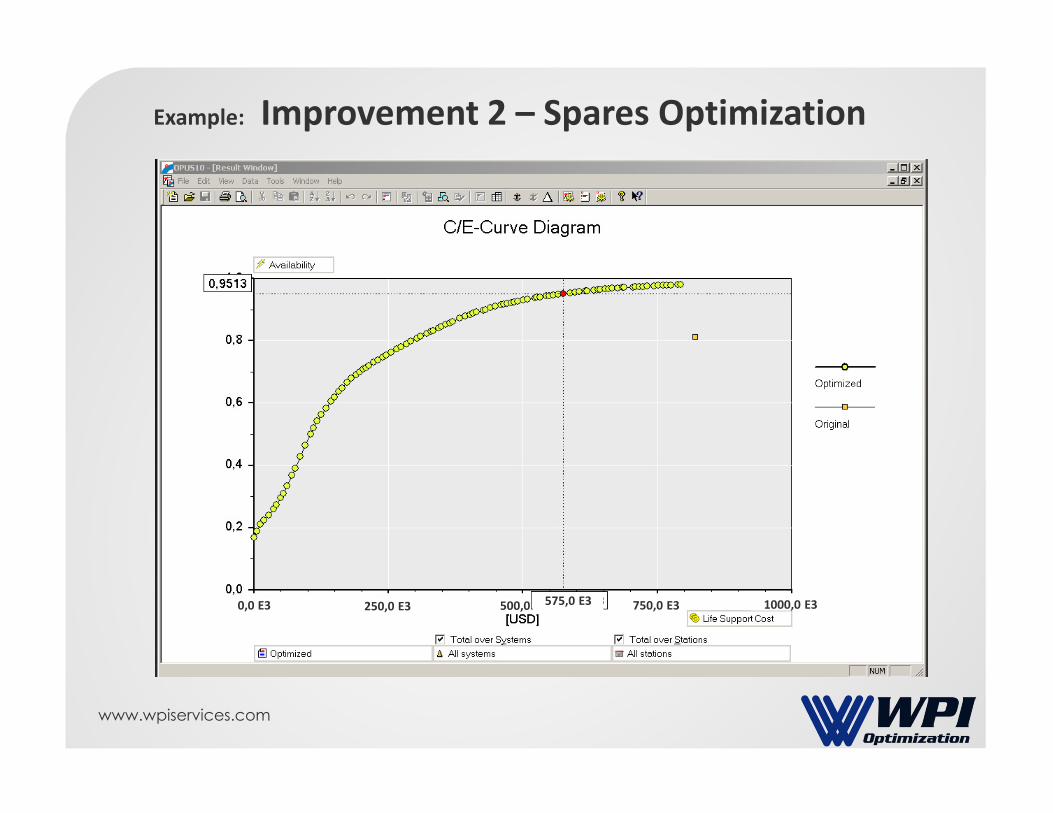
100,0 E3
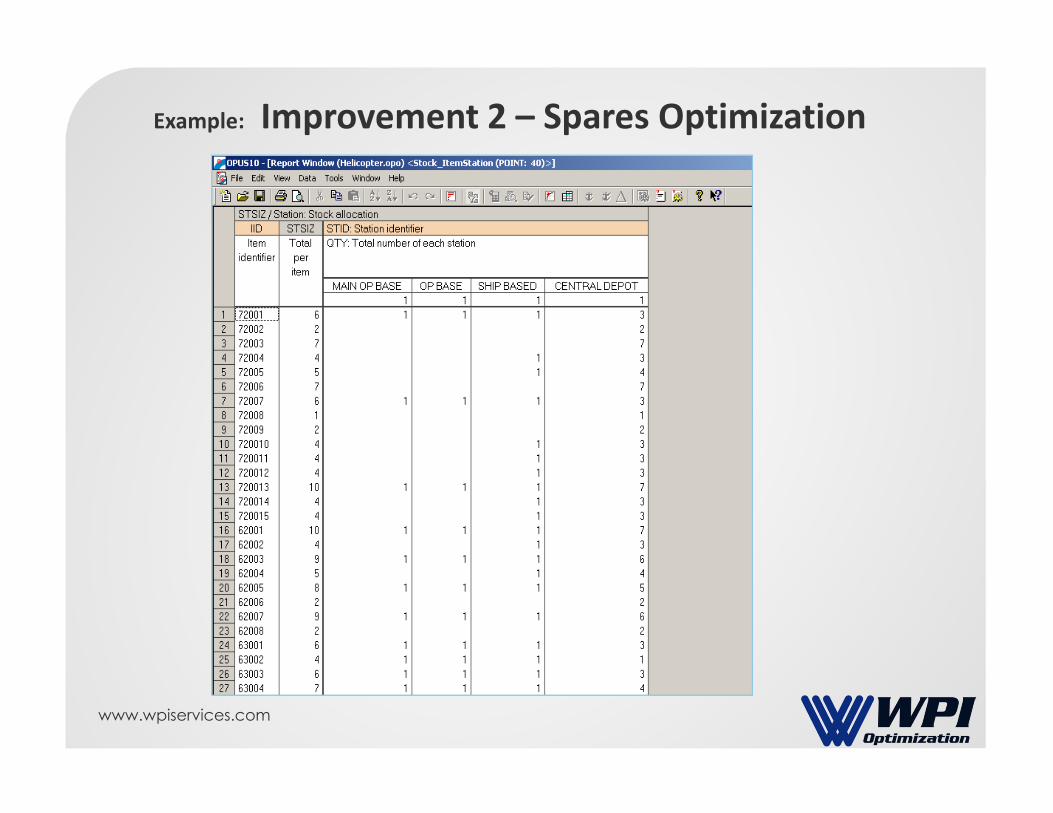
Example: Improvement 2 – Spares Optimization
575,0 E3 750,0 E3500,0 1000,0 E30,0 E3 250,0 E3
www.wpiservices.com
Example: Improvement 2 – Spares Optimization
www.wpiservices.com
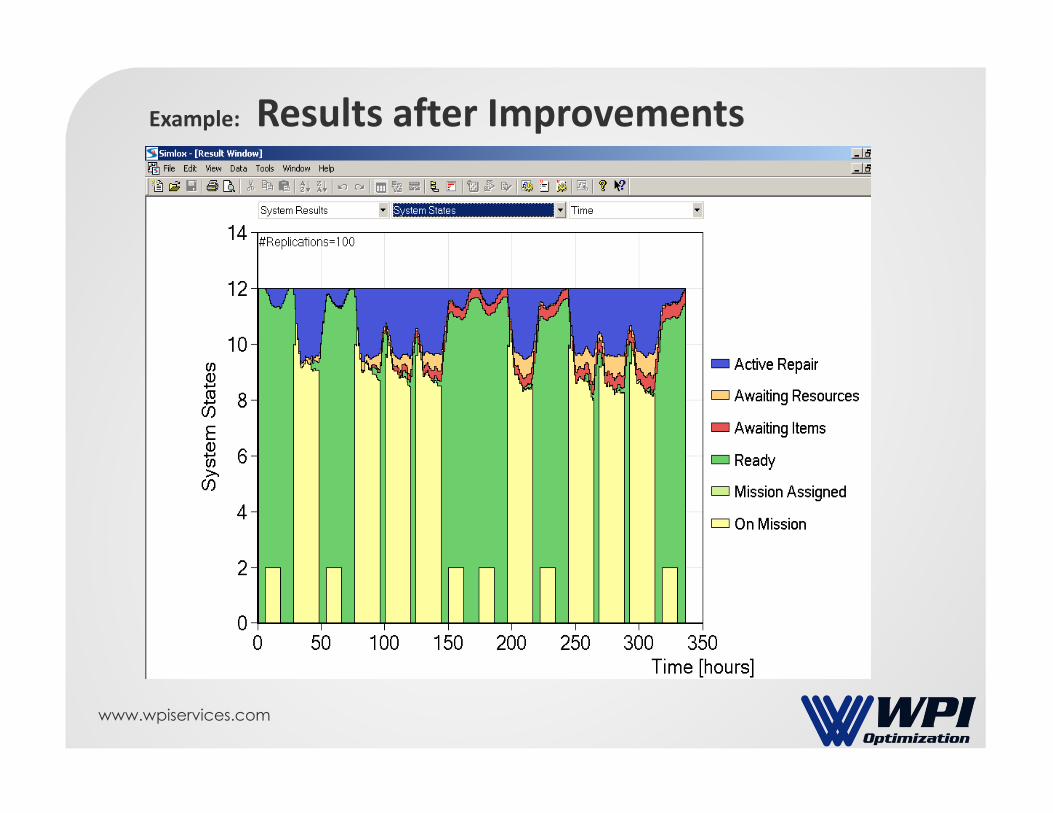
Example: Results after Improvements
www.wpiservices.com
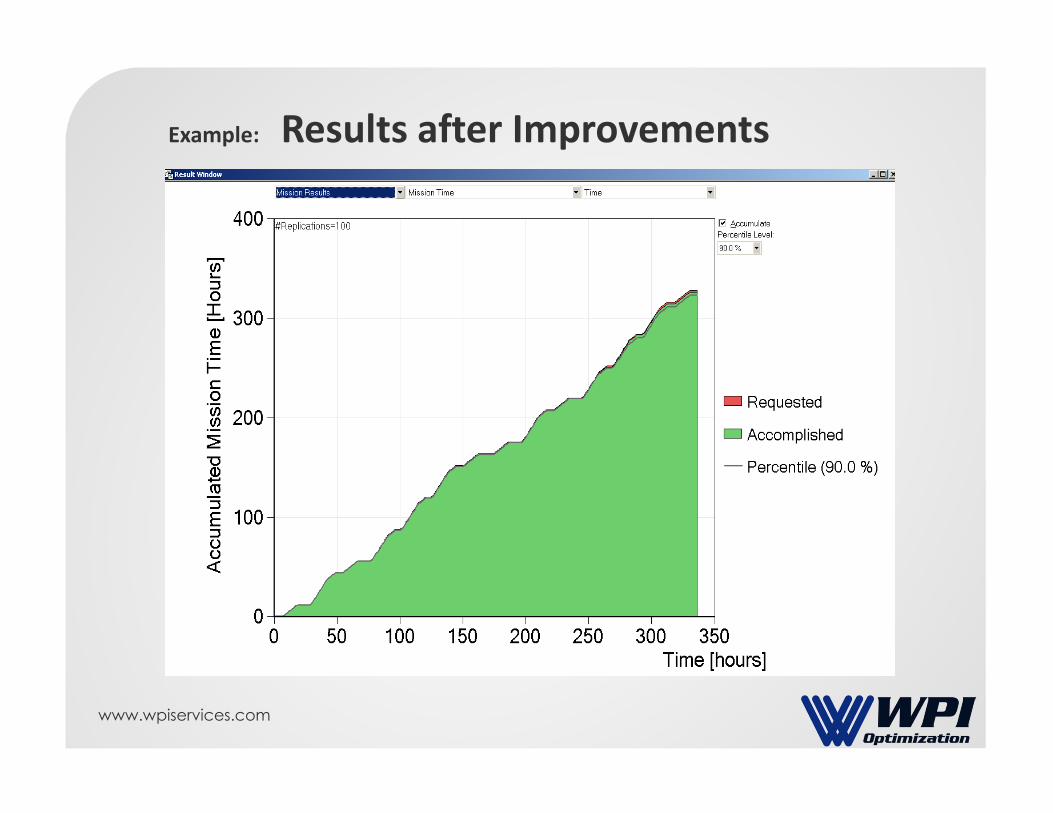
Example: Results after Improvements
www.wpiservices.com
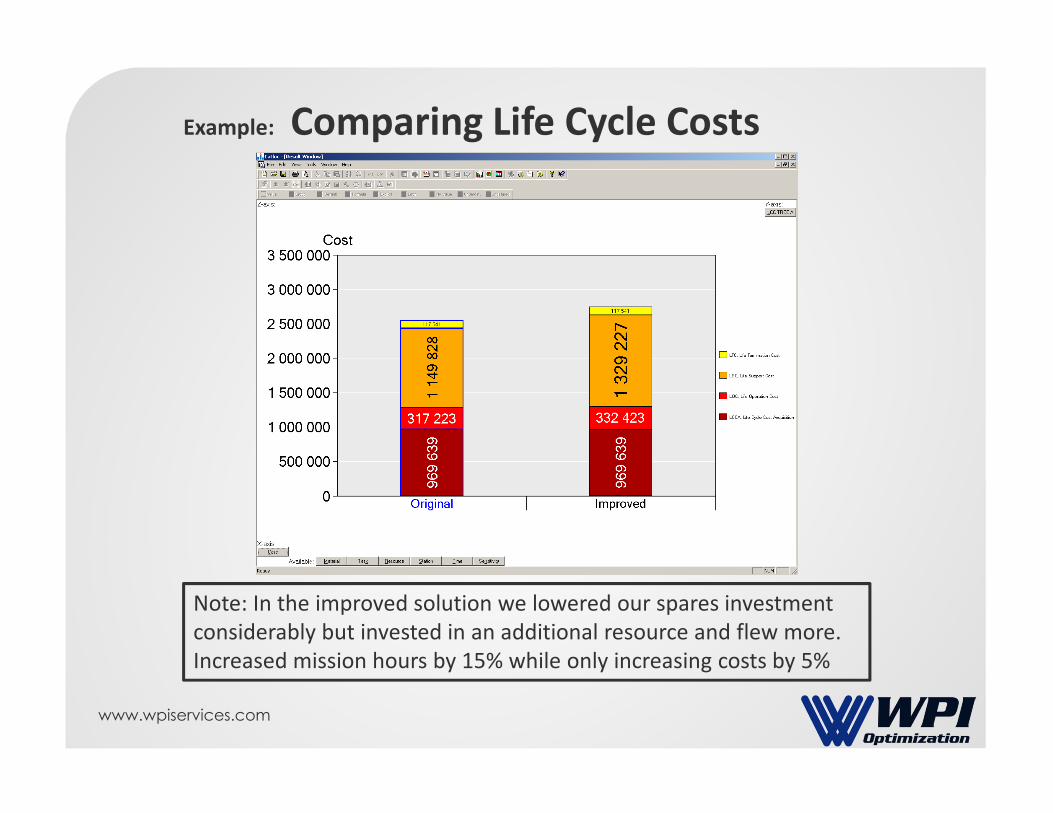
Example: Comparing Life Cycle Costs
Note: In the improved solution we lowered our spares investment
considerably but invested in an additional resource and flew more.
Increased mission hours by 15% while only increasing costs by 5%
www.wpiservices.com
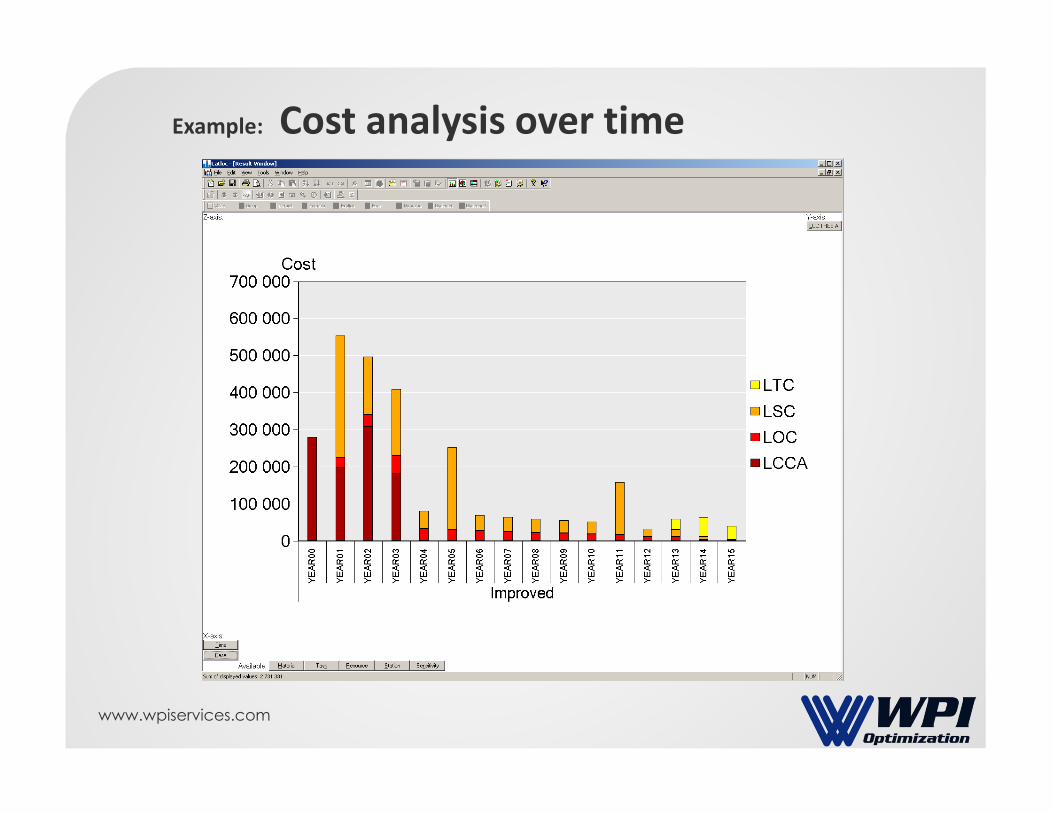
Example: Cost analysis over time


![Opus 144, Six Fairy Tales for Flute Solo [Opus 144]](https://static.documents.pub/doc/80x56/61e4550386b9437ad2408547/opus-144-six-fairy-tales-for-flute-solo-opus-144.jpg)


![Sevcik,Otakar - Opus 03 Violin Studies 40 Variations Opus 3[1]](https://static.documents.pub/doc/80x56/563db9d1550346aa9aa03913/sevcikotakar-opus-03-violin-studies-40-variations-opus-31.jpg)


