Fertilizer-drawn forward osmosis for irrigation of tomatoes 1 2 Tahir Majeed, Soleyman Sahebi, Fezeh Lotfi, Jungeun Kim, Sherub Phuntsho, and Ho Kyong 3 Shon * 4 School of Civil and Environmental Engineering, Faculty of Engineering and Information Technology, 5 University of Technology, Sydney (UTS), PO Box 123, Broadway, NSW 2007, Australia. 6 Abstract— Fertilizer drawn forward osmosis (FDFO) is a low energy desalination concept, 7 designed particularly for fertigation. This study was aimed to evaluate associated operational 8 issues related to FDFO real application targeting tomato crop fertilizer requirements to 9 prepare draw solution (DS) to desalinate seawater feed solution (FS). Commercially available 10 fertilizers as NH 4 NO 3 , NH 4 Cl, KNO 3 , KCl, NH 4 H 2 PO 4 and urea were used to prepare mixed 11 fertilizer DS (MFDS) in varying nitrogen:phosphorous:potassium (N:P:K) ratios. FO 12 performance in terms of flux and reverse solute flux (RSF) was evaluated using MFDS in 13 different ratios and concentrations. MFDS prepared from different fertilizers resulted in 14 significant variations in FO performances in terms of water flux and RSF. Flux outcome 15 varied from 2.50 LMH to 12.49 LMH depending on fertilizer component present in DS and 16 its concentrations used. MFDS carrying high osmotic pressure components delivered high 17 flux outcome than others. J w (LMH)/∆π(bar) fluctuation within 0.062 to 0.19 for these MFDS 18 used indicated that the osmotic pressure may not be taken as the only dictating factor for FO 19 outcome. Effects of changing nitrogen fertilizers in a particular NPK MFDS were evaluated 20 to find best performing mixed fertilizer. DS prepared from different nitrogen fertilizers as 21 urea, NH 4 NO 3 and NH 4 Cl having same NPK concentrations were evaluated and found that 22 NH 4 Cl based DS mixtures performed well over others whereas urea and NH 4 NO 3 based DS 23 mixtures exhibited same flux. RSF results for these DS indicated that all nitrogen and 24 potassium based MFDS exhibited higher N and K RSF. However, DS using NH 4 H 2 PO 4 25 delivered extremely low P-RSF of 12.35 g/m 2 /h. For seawater quality FS, higher nutrients 26 concentration in the final DS at the end of long run tests suggested using dilution or any other 27 technique to reduce excessive nutrients before putting it for any direct end use. 28 Keywords: Forward osmosis desalination, Fertigation for Tomato, NPK crop nutrients, 29 Fertilizer draw solution, Seawater feed 30 * Corresponding author. E-mail: [email protected]
Transcript
Fertilizer-drawn forward osmosis for irrigation of tomatoes1
2
Tahir Majeed, Soleyman Sahebi, Fezeh Lotfi, Jungeun Kim, Sherub Phuntsho, and Ho Kyong 3
Shon* 4
School of Civil and Environmental Engineering, Faculty of Engineering and Information Technology, 5
University of Technology, Sydney (UTS), PO Box 123, Broadway, NSW 2007, Australia. 6
Abstract— Fertilizer drawn forward osmosis (FDFO) is a low energy desalination concept, 7
designed particularly for fertigation. This study was aimed to evaluate associated operational 8
issues related to FDFO real application targeting tomato crop fertilizer requirements to 9
prepare draw solution (DS) to desalinate seawater feed solution (FS). Commercially available 10
fertilizers as NH4NO3, NH4Cl, KNO3, KCl, NH4H2PO4 and urea were used to prepare mixed 11
fertilizer DS (MFDS) in varying nitrogen:phosphorous:potassium (N:P:K) ratios. FO 12
performance in terms of flux and reverse solute flux (RSF) was evaluated using MFDS in 13
different ratios and concentrations. MFDS prepared from different fertilizers resulted in 14
significant variations in FO performances in terms of water flux and RSF. Flux outcome 15
varied from 2.50 LMH to 12.49 LMH depending on fertilizer component present in DS and 16
its concentrations used. MFDS carrying high osmotic pressure components delivered high 17
flux outcome than others. Jw (LMH)/∆π(bar) fluctuation within 0.062 to 0.19 for these MFDS 18
used indicated that the osmotic pressure may not be taken as the only dictating factor for FO 19
outcome. Effects of changing nitrogen fertilizers in a particular NPK MFDS were evaluated 20
to find best performing mixed fertilizer. DS prepared from different nitrogen fertilizers as 21
urea, NH4NO3 and NH4Cl having same NPK concentrations were evaluated and found that 22
NH4Cl based DS mixtures performed well over others whereas urea and NH4NO3 based DS 23
mixtures exhibited same flux. RSF results for these DS indicated that all nitrogen and 24
potassium based MFDS exhibited higher N and K RSF. However, DS using NH4H2PO4 25
delivered extremely low P-RSF of 12.35 g/m2/h. For seawater quality FS, higher nutrients 26
concentration in the final DS at the end of long run tests suggested using dilution or any other 27
technique to reduce excessive nutrients before putting it for any direct end use. 28
limits, presence of unwanted impurities, ease in DS preparations and previous FDFO studies 197
(Phuntsho, Shon et al. 2011). 198
199
(NH4)2SO4 was rejected due to difficulties shown in preparing DS at higher concentration. 200
Commercial (NH4)2SO4 showed acute difficulties in preparing DS. It took long time to 201
dissolve completely despite using mixing aids and left black insoluble matter even at 2M 202
concentration which was difficult to filter out as it quickly blocked filter paper pores. 203
Removal of suspension was necessary to reduce the chances of pump or membrane damage. 204
205
Ca(NO3)2 was an ideal choice as DS for FDFO process as comparatively it exhibits high 206
osmotic pressure. OLI data showed that 1M Ca(NO3)2 DS indicates osmotic pressure of 207
52.32 atm which was highest among all nitrogen fertilizers being evaluated followed by 208
NH4Cl, NH4NO3 and urea. However, Ca(NO3)2 was eliminated from MFDS component’s list 209
as calcium carried high probability of forming insoluble suspensions with phosphates 210
fertilizers (Haynes 1985; Marais 2004) in mixed fertilizers. Although Ca(NO3)2 beside 211
carrying high osmotic pressure among these fertilizers, was suitable for preparing DS for the 212
last two tomato growth stages not using any phosphate fertilizers, still there was risk that it 213
might leave excessive calcium in the final diluted DS (FDDS) which may harm tomato yield. 214
Ca2+ also reduces potassium intake by the plant and tomato yield drops drastically due to 215
plant’s K+ deficiency (Hartz et al. 1999; Hebbar, Ramachandrappa et al. 2004). 216
217
NH4NO3 was considered partly due to its non- availability in granular form. All necessary 218
NH4NO3 based DS were prepared from the available liquid NH4NO3 fertilizer. Urea was 219
evaluated for FDFO process as it is considered as the most popular N-source agricultural 220
fertilizer in the world even for tomato crop too. It is cheap, very soluble even at high 221
concentration, easily available, enriched highly with N (up to 46%). However, OLI software 222
data showed that urea has the lowest osmotic pressure among all available fertilizers. 223
224
Commercial NH4Cl and MAP fertilizers also left insoluble residue during preparation of high 225
concentration MFDS but solutions were filtered out easily. Due to impurities presents in the 226
commercial fertilizers and their solubility issues, all prepared DS were filtered to reduce 227
chances of membrane fouling. Considering evaluated physical and chemical characteristics of 228
these fertilizers, 6 fertilizers were shortlisted for their use as MFDS for FDFO process (Table 229
2). Out of these, 4 fertilizers were categorized as common fertilizers. 230
231
Table 2 Shortlisted fertilizers used to prepare mixed fertilizer DS, showing their NPK nutrient 232
composition and osmotic pressure these fertilizers exerts at 1M concentrations 233
234 Preparation of mixed fertilizer DS suitable for tomato application 235 236
Looking into average tomato plant life cycle of 120 days and fertilizer requirements, whole 237
tomato crop span is divided into 4 stages, i.e., Planting - First flowering, Rapid growth –238
Flowering, Fruit set- Fruit ripening and Fruit Ripening-Harvest (Claude J. Phene 2004) 239
hereafter described as S1, S2, S3 and S4 respectively. Shortlisted fertilizers were used to 240
prepare MFDS matching nutrients requirements of tomato plant for these stages. These 241
MFDS were used as DS in the FO experiments and evaluated with respect to pH, flux, RSF 242
and ultimate essential nutrient concentrations in the final DS. 243
244
NH4Cl was preferably selected as the main N-source fertilizer for preparing MFDS carrying 245
N-fertilizer nutrients. Influence of two other N-source fertilizers such as NH4NO3 and urea 246
was also studied for preparing these MFDS to evaluate suitability of these two commonly 247
used fertilizers for FDFO process. For that, while preparing N-based MFDS for some of the 248
tests, NH4Cl was replaced and evaluated for other replacement N-source fertilizers as 249
NH4NO3 and urea. This was while replacing N-source from NH4Cl to urea or NH4NO3, the 250
desired NPK value of the new MFDS blend was not changed. However, while replacing 251
NH4Cl nitrogen source fertilizer in MFDS with NH4NO3 or urea, the theoretical osmotic 252
pressure of the MFDS was also changed. For P-nutrient source fertilizer, only MAP was used 253
and for K-nutrient source fertilizer, KCl was used with KNO3 in the entire study. 254
255
Blended mixtures showed various changes in physical and chemical properties of the blended 256
mixtures when compared with their individual ingredients solutions. Issues were noticed in 257
preparing higher concentration MFDS as MAP and NH4Cl fertilizers produced suspensions 258
and left residue at higher concentrations. Similarly, fertilizers containing the same salt i.e., 259
KCl and KNO3 were mixed carefully as they decreased solubility in the mixture. Hence 260
MFDS for various tomato crop nutrients requirements were prepared to concentrations limits 261
that did not produce any excessive residue or suspensions in solutions. 262
263
2.2 Water Flux in FDFO process using mixed fertilizer draw solutes 264
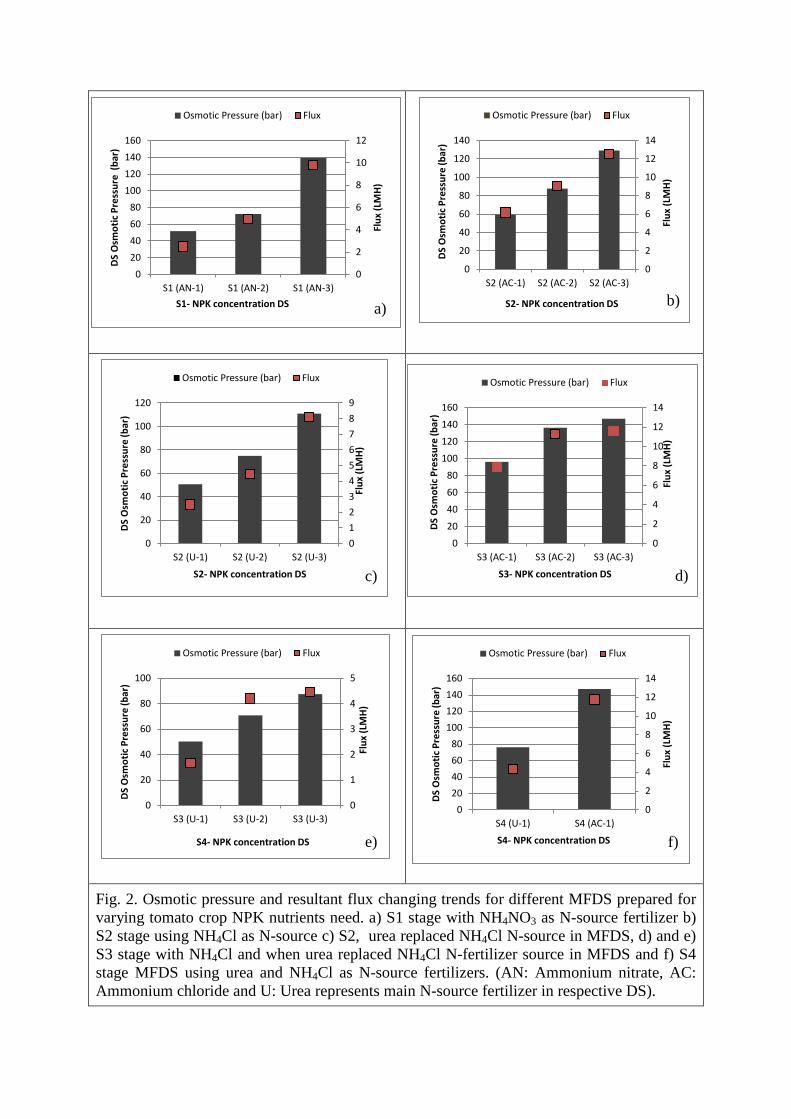
The performance of MFDS in term of water flux (Jw) for FDFO process is presented in Fig. 2. 265
MFDS were prepared for 4 tomato growth stages namely S1, S2, S3 and S4 representing 266
NPK nutrients values of 11.5-19-11.5, 15-7-22, 10-0-20, 15-0-30 respectively. Based on each 267
stage’s fertilizer requirements, MFDS were prepared in various concentration using different 268
quantities of fertilizers but keeping the NPK value same for that particular stage evaluation. 269
MFDS were prepared from 0.25%, 0.33% and 0.5% selected quantities of tomato growth 270
stages requirements showing minimum issues and are represented by suffix -1, -2 and -3 in 271
the bracket of the x-axis label in Fig. 2-7. For stage 4, MFDS were prepared for only 0.15% 272
S4 stage quantity. Different stage MFDS showed flux from 2.51 LMH to 12.54 LMH with 273
seawater FS. 274
275
For a solution carrying more than one solute, the expression of total osmotic pressure for a 276
mixture of different solutes can be written as 277
278
𝜋𝑇𝑇𝑇𝑇𝑇 = �𝜋𝑛
𝑛
𝜋=0
(1)
or 279
𝜋𝑇𝑇𝑇𝑇𝑇 = 𝜋1 + 𝜋2 + 𝜋3 + 𝜋4 + ⋯ (2) 280
281
Subscripts 1, 2, 3, 4... represent various components of the draw solute. 282
283
Osmotic pressure differential (∆π ) across the membrane, net driving force available for 284
forward osmosis using sea water quality is expressed by 285
286
∆π = 𝜋𝑇𝑇𝑇𝑇𝑇 − 𝜋𝑠𝑠 (3) 287
288
MFDS prepared in various concentrations were separately evaluated with these nutrients 289
ratio. OLI software results showed that resultant osmotic pressure of the MFDS was the sum 290
of the osmotic pressure of individual components share present in the mixture and follow Eq. 291
(1) and (2). Eq. (3) was used to obtain net osmotic pressure driving force for FO process. It 292
was observed that the flux changes with rising MFDS concentration but not linearly in all 293
cases (Fig. 2). Flux results did not respond proportionally to changing respective osmotic 294
pressure. Results showed either positive or negative deviation for linear trends. The main 295
reason for these variations in slope for different MFDS seems to be due to type and 296
concentration of individual components present in MFDS. Each MFDS behaved differently 297
depending on the concentration of various components present in the mixture. 298
299
Basic flux equation (Jw= Aσ ∆π) reveals that the flux should change linearly with osmotic 300
pressure gradient available across the semi-permeable membrane as other parameters are 301
fixed for these tests but the slope varies for all MFDS in Fig. 2(a-f). The above flux equation 302
suits ideal or very weak solutions and however, it still accounts for the main driving force 303
(osmotic pressure gradient) for osmosis. From the nonlinear flux results in Fig. 2 results, it is 304
realized that for non-ideal solutions and high DS concentration, other chemical properties of 305
the solutes additionally contribute to these resultant flux variations. Membrane permeability 306
coefficient (A) decreases at high DS osmotic pressures (Mehta and Loeb 1978). High 307
concentrated MFDS results further show high deviation of the theoretical flux to actual flux 308
means that the other relevant forces also increase with DS concentration. 309
310
Further, dissimilar slope of the flux and osmotic pressure curves for these MFDS shown in 311
Fig. 2 (a-f) seems to follow earlier research evaluations and confirm that the rising DS 312
concentration does not change water flux linearly in FO (Sutzkover et al. 2000; Suh and Lee 313
2013) as concentration polarization (both external concentration (ECP) and internal 314
concentraton (ICP)) varies with DS/FS changing concentrations (Mehta and Loeb 1978; 315
McCutcheon, McGinnis et al. 2006; Gao et al. 2013; Suh and Lee 2013). High FS 316
concentration also contributed to increase ECP which directly caused high reduction of the 317
resultant water flux (Suh and Lee 2013). The main reason for the variation in slope for 318
different MFDS seems due to the type and concentration of individual components present in 319
MFDS. Each MFDS behaved differently depending on the concentration of various 320
components present in the mixture. The effect of membrane properties, DS diffusion 321
coefficients, inter-molecular interactions, ionization energy have been evaluated by many 322
researchers for FO flux but these lack clear reasoning for the changes of flux with osmotic 323
pressure (Paul 1974; Mehta and Loeb 1978; Schaep et al. 1998; McCutcheon, McGinnis et al. 324
2006; Chung et al. 2012). 325
326
Fig. 2. Osmotic pressure and resultant flux changing trends for different MFDS prepared for 327
varying tomato crop NPK nutrients need. a) S1 stage with NH4NO3 as N-source fertilizer b) 328
S2 stage using NH4Cl as N-source c) S2, urea replaced NH4Cl N-source in MFDS, d) and e) 329
S3 stage with NH4Cl and when urea replaced NH4Cl N-fertilizer source in MFDS and f) S4 330
stage MFDS using urea and NH4Cl as N-source fertilizers. (AN: Ammonium nitrate, AC: 331
Ammonium chloride and U: Urea represents main N-source fertilizer in respective DS) 332
333
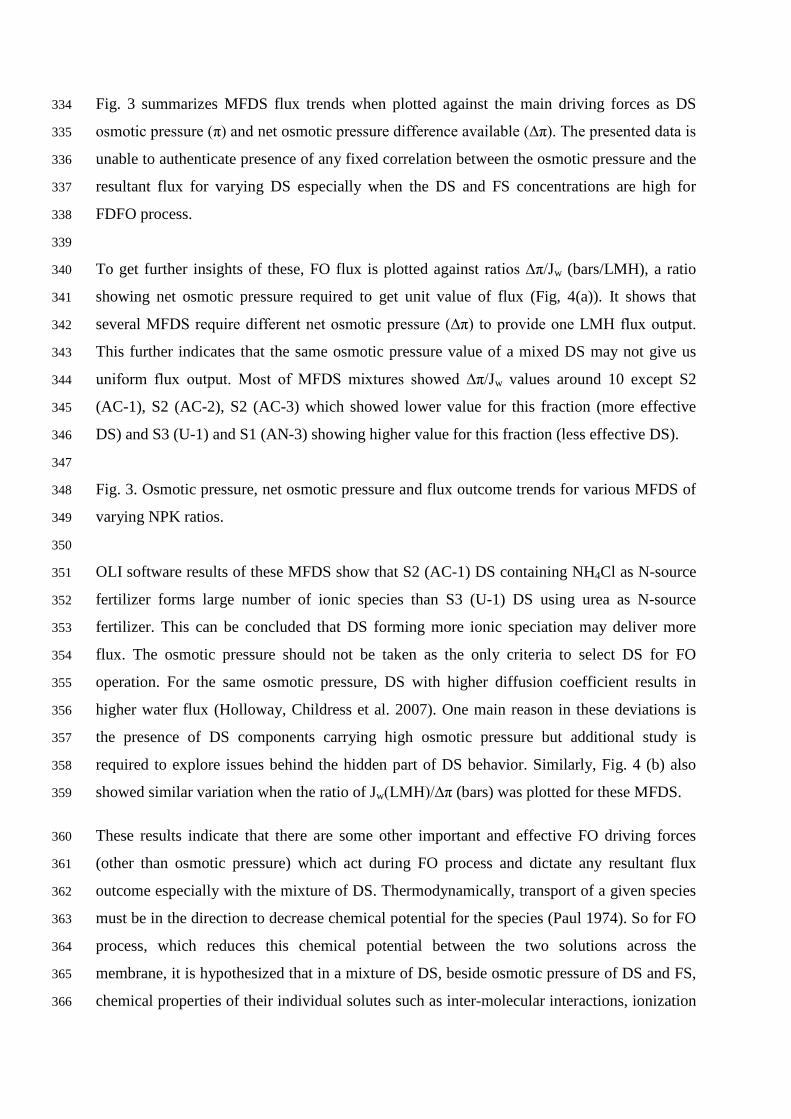
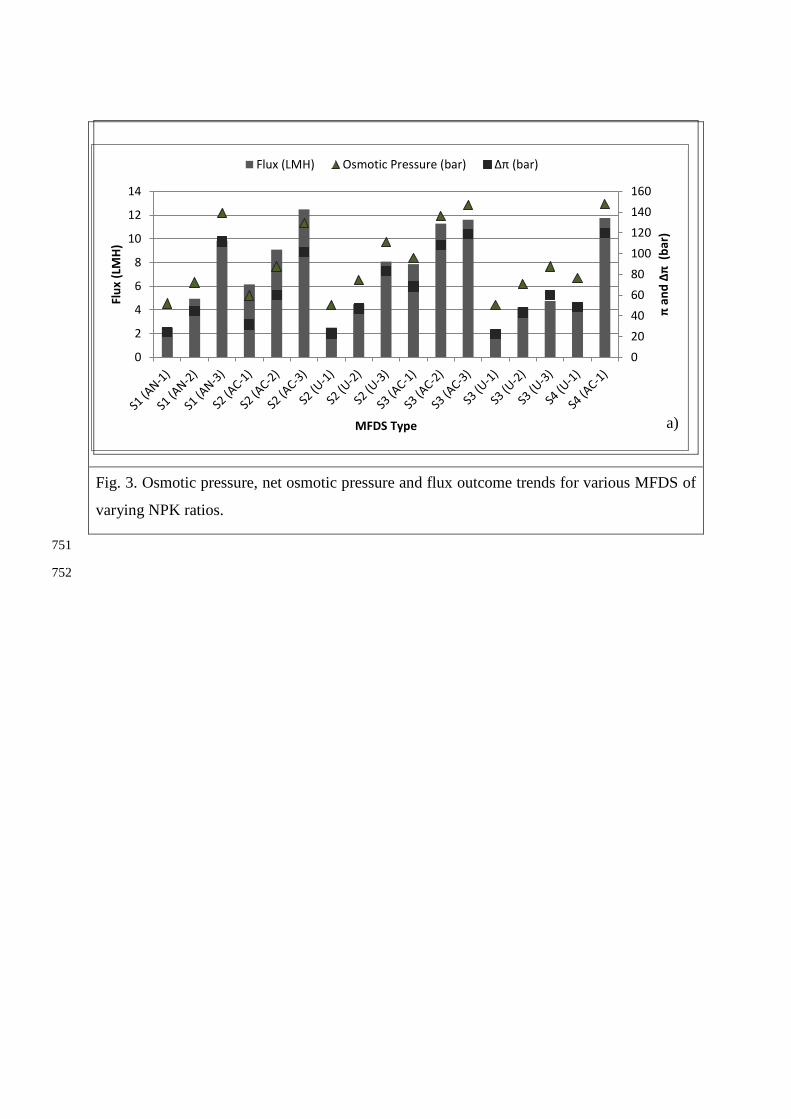
Fig. 3 summarizes MFDS flux trends when plotted against the main driving forces as DS 334
osmotic pressure (π) and net osmotic pressure difference available (∆π). The presented data is 335
unable to authenticate presence of any fixed correlation between the osmotic pressure and the 336
resultant flux for varying DS especially when the DS and FS concentrations are high for 337
FDFO process. 338
339
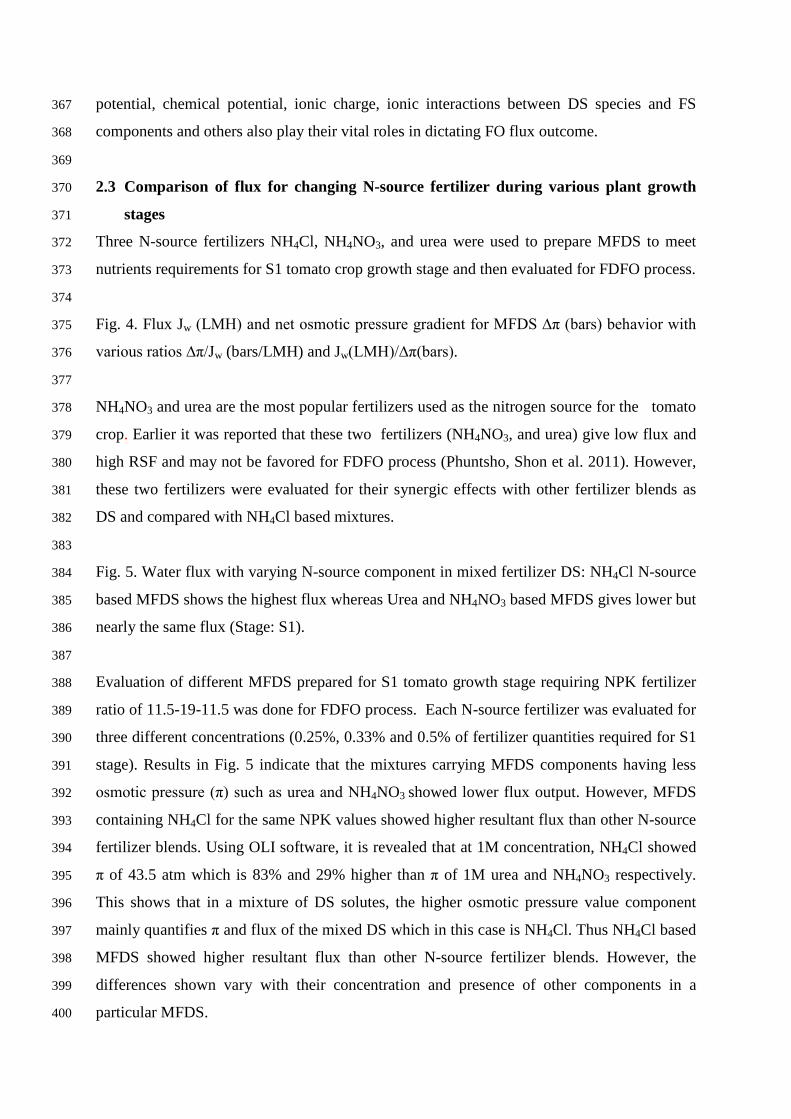
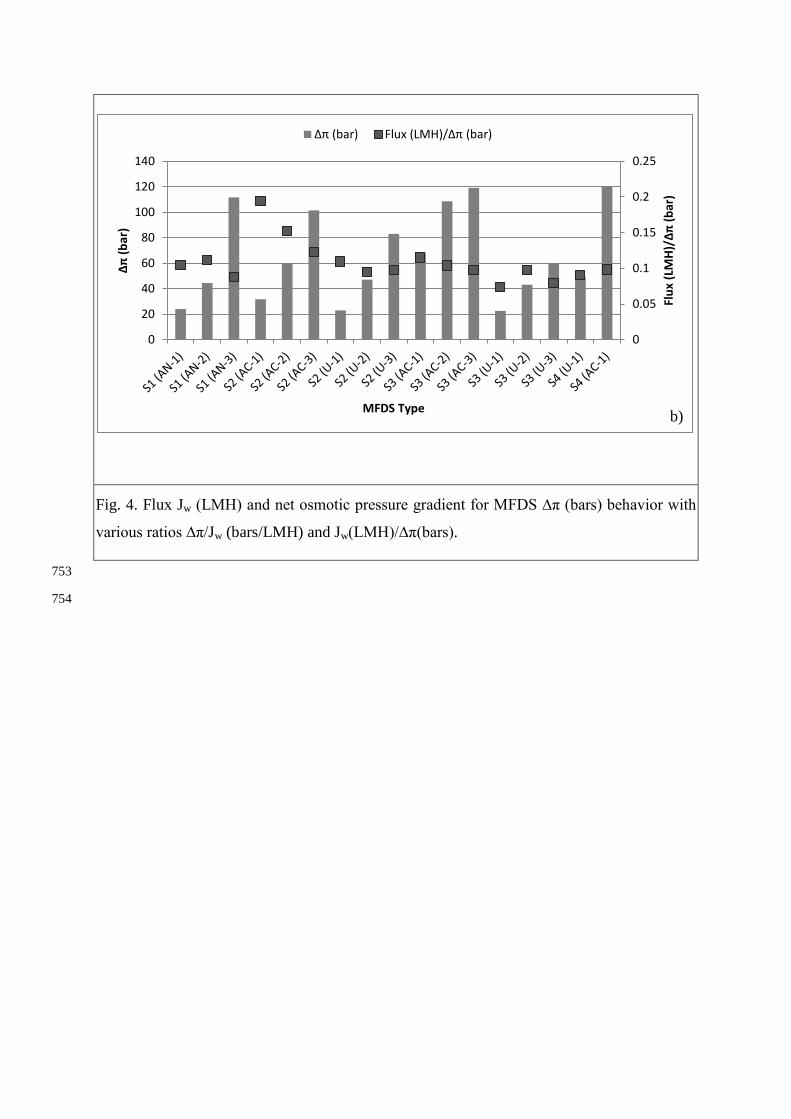
To get further insights of these, FO flux is plotted against ratios ∆π/Jw (bars/LMH), a ratio 340
showing net osmotic pressure required to get unit value of flux (Fig, 4(a)). It shows that 341
several MFDS require different net osmotic pressure (∆π) to provide one LMH flux output. 342
This further indicates that the same osmotic pressure value of a mixed DS may not give us 343
uniform flux output. Most of MFDS mixtures showed ∆π/Jw values around 10 except S2 344
(AC-1), S2 (AC-2), S2 (AC-3) which showed lower value for this fraction (more effective 345
DS) and S3 (U-1) and S1 (AN-3) showing higher value for this fraction (less effective DS). 346
347
Fig. 3. Osmotic pressure, net osmotic pressure and flux outcome trends for various MFDS of 348
varying NPK ratios. 349
350
OLI software results of these MFDS show that S2 (AC-1) DS containing NH4Cl as N-source 351
fertilizer forms large number of ionic species than S3 (U-1) DS using urea as N-source 352
fertilizer. This can be concluded that DS forming more ionic speciation may deliver more 353
flux. The osmotic pressure should not be taken as the only criteria to select DS for FO 354
operation. For the same osmotic pressure, DS with higher diffusion coefficient results in 355
higher water flux (Holloway, Childress et al. 2007). One main reason in these deviations is 356
the presence of DS components carrying high osmotic pressure but additional study is 357
required to explore issues behind the hidden part of DS behavior. Similarly, Fig. 4 (b) also 358
showed similar variation when the ratio of Jw(LMH)/∆π (bars) was plotted for these MFDS. 359
These results indicate that there are some other important and effective FO driving forces 360
(other than osmotic pressure) which act during FO process and dictate any resultant flux 361
outcome especially with the mixture of DS. Thermodynamically, transport of a given species 362
must be in the direction to decrease chemical potential for the species (Paul 1974). So for FO 363
process, which reduces this chemical potential between the two solutions across the 364
membrane, it is hypothesized that in a mixture of DS, beside osmotic pressure of DS and FS, 365
chemical properties of their individual solutes such as inter-molecular interactions, ionization 366
potential, chemical potential, ionic charge, ionic interactions between DS species and FS 367
components and others also play their vital roles in dictating FO flux outcome. 368
369
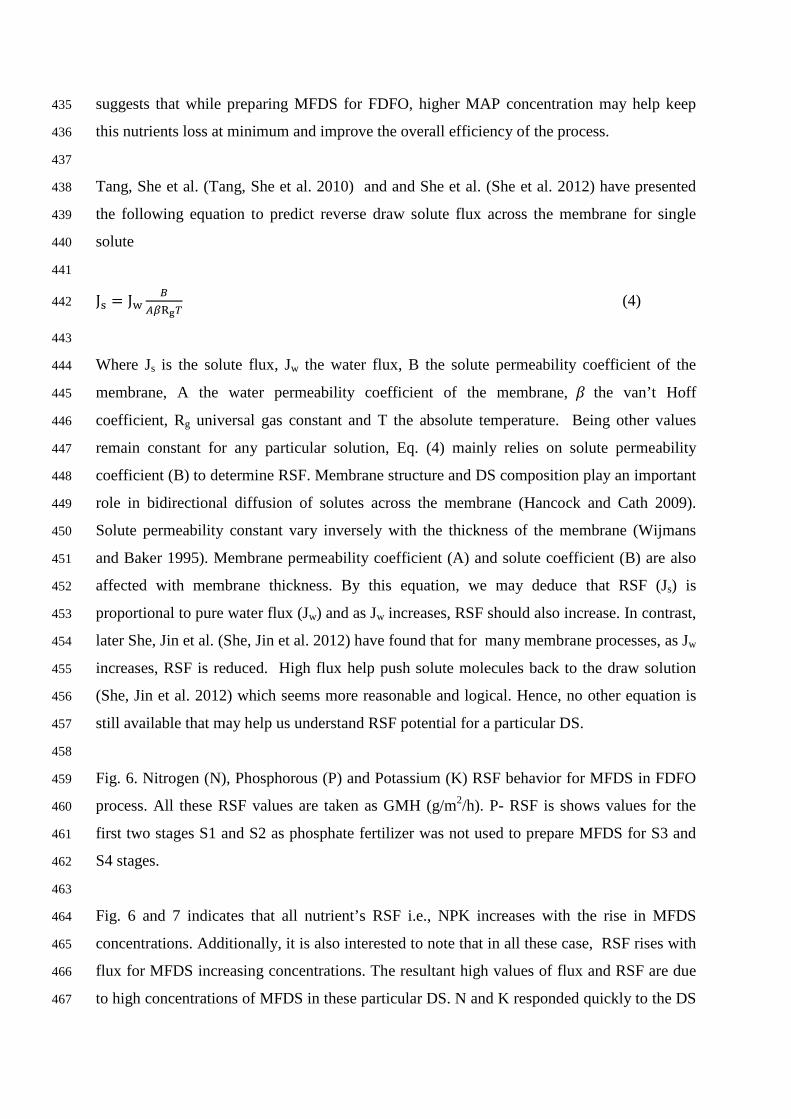
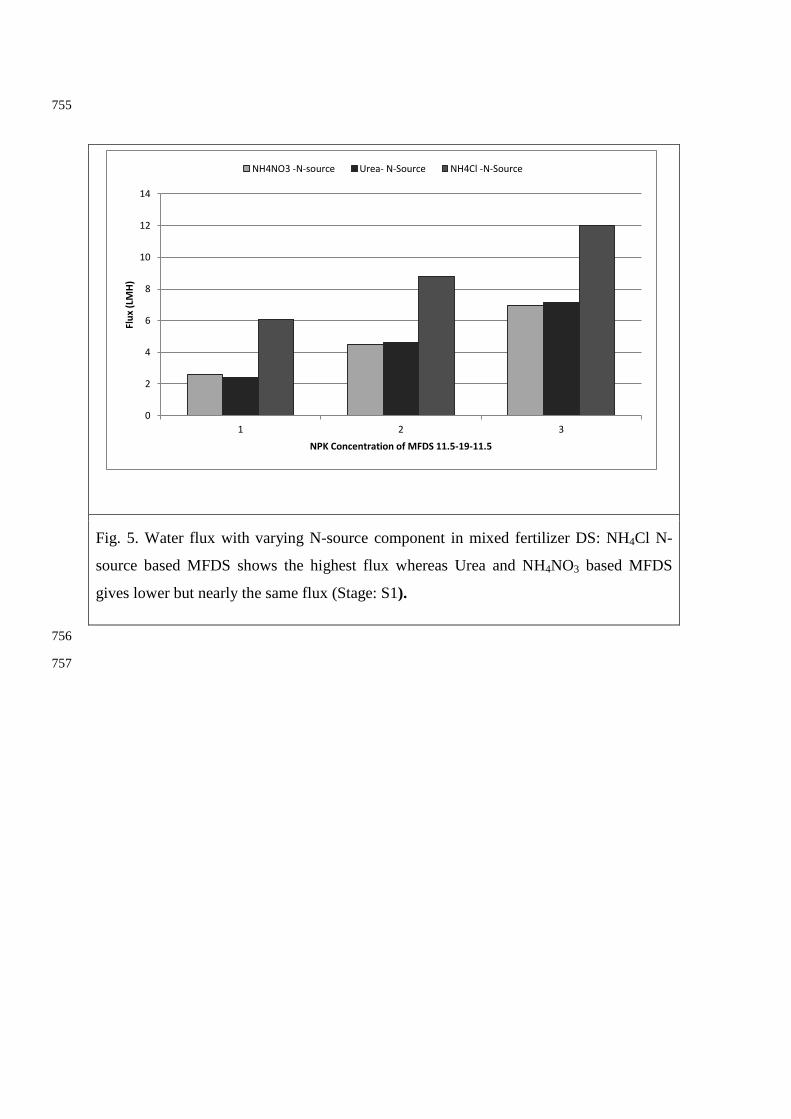
2.3 Comparison of flux for changing N-source fertilizer during various plant growth 370
stages 371
Three N-source fertilizers NH4Cl, NH4NO3, and urea were used to prepare MFDS to meet 372
nutrients requirements for S1 tomato crop growth stage and then evaluated for FDFO process. 373
374
Fig. 4. Flux Jw (LMH) and net osmotic pressure gradient for MFDS ∆π (bars) behavior with 375
various ratios ∆π/Jw (bars/LMH) and Jw(LMH)/∆π(bars). 376
377
NH4NO3 and urea are the most popular fertilizers used as the nitrogen source for the tomato 378
crop. Earlier it was reported that these two fertilizers (NH4NO3, and urea) give low flux and 379
high RSF and may not be favored for FDFO process (Phuntsho, Shon et al. 2011). However, 380
these two fertilizers were evaluated for their synergic effects with other fertilizer blends as 381
DS and compared with NH4Cl based mixtures. 382
383
Fig. 5. Water flux with varying N-source component in mixed fertilizer DS: NH4Cl N-source 384
based MFDS shows the highest flux whereas Urea and NH4NO3 based MFDS gives lower but 385
nearly the same flux (Stage: S1). 386
387
Evaluation of different MFDS prepared for S1 tomato growth stage requiring NPK fertilizer 388
ratio of 11.5-19-11.5 was done for FDFO process. Each N-source fertilizer was evaluated for 389
three different concentrations (0.25%, 0.33% and 0.5% of fertilizer quantities required for S1 390
stage). Results in Fig. 5 indicate that the mixtures carrying MFDS components having less 391
osmotic pressure (π) such as urea and NH4NO3 showed lower flux output. However, MFDS 392
containing NH4Cl for the same NPK values showed higher resultant flux than other N-source 393
fertilizer blends. Using OLI software, it is revealed that at 1M concentration, NH4Cl showed 394
π of 43.5 atm which is 83% and 29% higher than π of 1M urea and NH4NO3 respectively. 395
This shows that in a mixture of DS solutes, the higher osmotic pressure value component 396
mainly quantifies π and flux of the mixed DS which in this case is NH4Cl. Thus NH4Cl based 397
MFDS showed higher resultant flux than other N-source fertilizer blends. However, the 398
differences shown vary with their concentration and presence of other components in a 399
particular MFDS. 400
In contrast, at 1M concentration, urea shows π of 23.7 atm whereas NH4NO3 shows π of 33.7 401
atm at 1M concentration which is 42% higher than urea. Despite these differences in π, both 402
NH4NO3 and urea showed nearly the same flux for MFDS having the same NPK ratios. From 403
these results, we may also conclude that in these MFDS, π exerted by these two fertilizer 404
fractions (urea and NH4NO3) in MFDS does not contribute significantly to the overall π of 405
the MFDS carrying other major components as KCl, MAP, and KNO3 in mixed DS. Thus, 406
due to the lower π of these two fertilizers, the resultant flux is dictated not by the π of urea 407
and NH4NO3 but by other components of MFDS. These results again may be considered due 408
to influence of intermolecular associations between the different components of the DS. 409
410
2.4 Reverse solute flux using MFDS blend 411
FS samples were collected at the end of each MFDS experiment and analyzed in the lab to 412
evaluate any draw solute reverse diffusion across the membrane to the feed side. Since RSF is 413
considered as loss of valuable DS inputs, it was regularly monitored for all MFDS to prepare 414
guidelines for cost control and waste discharge management. Moreover, in FDFO process, as 415
RSF involves diffusion of nutrients towards the FS side which is normally discarded or 416
dumped back to other receiving bodies, excessive nutrient present may too create algal bloom 417
and eutrophication problems in the receiving water. 418
419
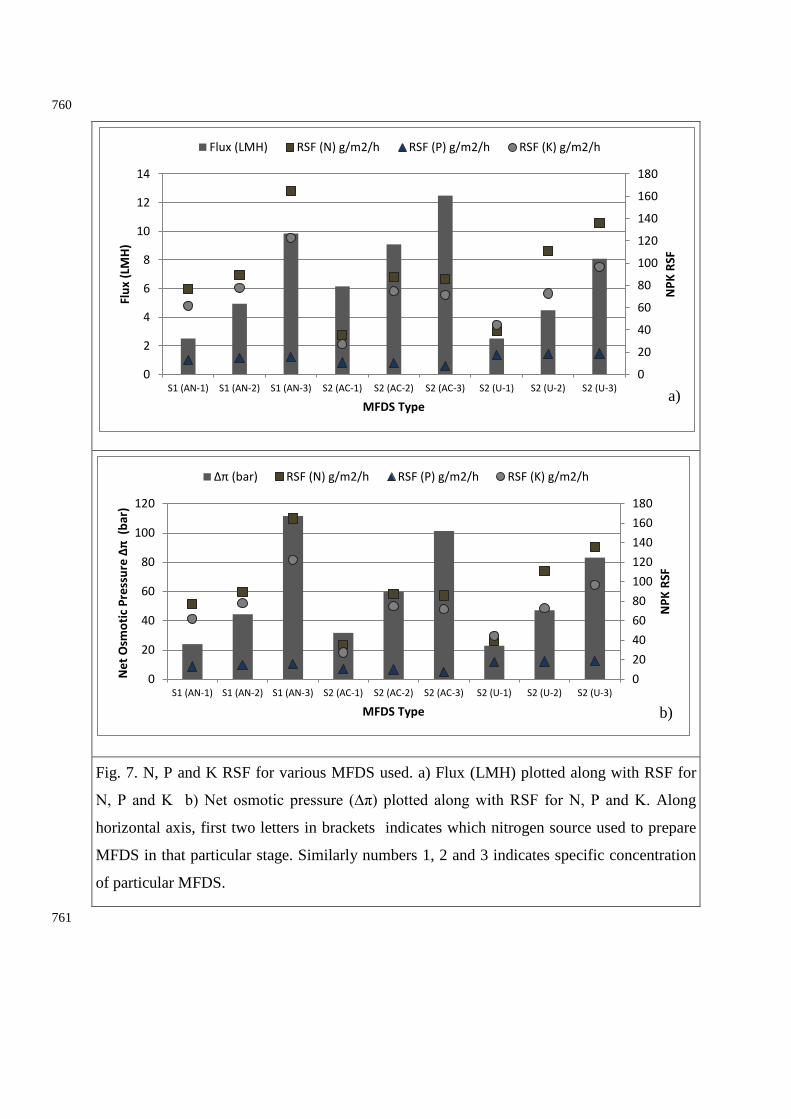
Fig. 6 and 7 compare flux and net osmotic pressure (∆π) of MFDS to NPK RSF (in g/m2/h). 420
Similar to FO flux, RSF outcome also showed varying behavior with MFDS. Apparently, all 421
nitrates based MFDS blends indicated high RSF values. Moreover, MFDS having high 422
concentration of urea or NH4NO3 showed high RSF in terms of nitrogen. Nitrates due to 423
smaller molecular size penetrate deeply into the membrane (Paugam et al. 2003; Paugam et 424
al. 2004; Wang et al. 2005). For most of the RSF results for S1 and S2, it is observed that N-425
RSF is higher than K- and P- RSF which is perhaps due to small size of N – hydrated radii. 426
RSF for the K and P always remained on the lower side for nearly all MFDS. However S3 427
and S4 results further indicates that the K- RSF is higher than N-RSF for these two stages. 428
These results are due to high potassium concentration (Table 1) in MFDS for stage S3 and 429
S4. 430
431
Some of the MFDS prepared from KNO3 also showed high RSF values. Phosphates loss was 432
observed at minimum while using MAP as phosphate /nitrogen nutrient’s source component. 433
MAP based MFDS showed low RSF not only for phosphorus but for nitrogen as well. This 434
suggests that while preparing MFDS for FDFO, higher MAP concentration may help keep 435
this nutrients loss at minimum and improve the overall efficiency of the process. 436
437
Tang, She et al. (Tang, She et al. 2010) and and She et al. (She et al. 2012) have presented 438
the following equation to predict reverse draw solute flux across the membrane for single 439
solute 440
441
Js = Jw𝐵
𝐴𝐴Rg𝑇 (4) 442
443
Where Js is the solute flux, Jw the water flux, B the solute permeability coefficient of the 444
membrane, A the water permeability coefficient of the membrane, 𝛽 the van’t Hoff 445
coefficient, Rg universal gas constant and T the absolute temperature. Being other values 446
remain constant for any particular solution, Eq. (4) mainly relies on solute permeability 447
coefficient (B) to determine RSF. Membrane structure and DS composition play an important 448
role in bidirectional diffusion of solutes across the membrane (Hancock and Cath 2009). 449
Solute permeability constant vary inversely with the thickness of the membrane (Wijmans 450
and Baker 1995). Membrane permeability coefficient (A) and solute coefficient (B) are also 451
affected with membrane thickness. By this equation, we may deduce that RSF (Js) is 452
proportional to pure water flux (Jw) and as Jw increases, RSF should also increase. In contrast, 453
later She, Jin et al. (She, Jin et al. 2012) have found that for many membrane processes, as Jw 454
increases, RSF is reduced. High flux help push solute molecules back to the draw solution 455
(She, Jin et al. 2012) which seems more reasonable and logical. Hence, no other equation is 456
still available that may help us understand RSF potential for a particular DS. 457
458
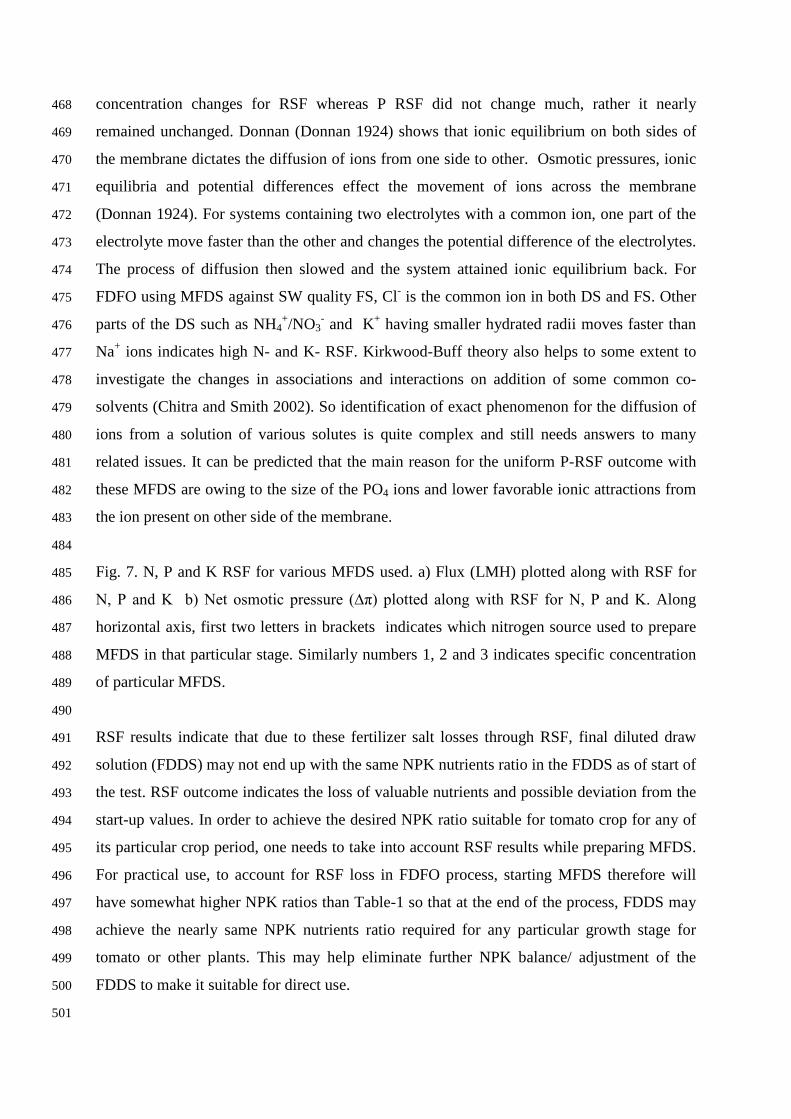
Fig. 6. Nitrogen (N), Phosphorous (P) and Potassium (K) RSF behavior for MFDS in FDFO 459
process. All these RSF values are taken as GMH (g/m2/h). P- RSF is shows values for the 460
first two stages S1 and S2 as phosphate fertilizer was not used to prepare MFDS for S3 and 461
S4 stages. 462
463
Fig. 6 and 7 indicates that all nutrient’s RSF i.e., NPK increases with the rise in MFDS 464
concentrations. Additionally, it is also interested to note that in all these case, RSF rises with 465
flux for MFDS increasing concentrations. The resultant high values of flux and RSF are due 466
to high concentrations of MFDS in these particular DS. N and K responded quickly to the DS 467
concentration changes for RSF whereas P RSF did not change much, rather it nearly 468
remained unchanged. Donnan (Donnan 1924) shows that ionic equilibrium on both sides of 469
the membrane dictates the diffusion of ions from one side to other. Osmotic pressures, ionic 470
equilibria and potential differences effect the movement of ions across the membrane 471
(Donnan 1924). For systems containing two electrolytes with a common ion, one part of the 472
electrolyte move faster than the other and changes the potential difference of the electrolytes. 473
The process of diffusion then slowed and the system attained ionic equilibrium back. For 474
FDFO using MFDS against SW quality FS, Cl- is the common ion in both DS and FS. Other 475
parts of the DS such as NH4+/NO3
- and K+ having smaller hydrated radii moves faster than 476
Na+ ions indicates high N- and K- RSF. Kirkwood-Buff theory also helps to some extent to 477
investigate the changes in associations and interactions on addition of some common co-478
solvents (Chitra and Smith 2002). So identification of exact phenomenon for the diffusion of 479
ions from a solution of various solutes is quite complex and still needs answers to many 480
related issues. It can be predicted that the main reason for the uniform P-RSF outcome with 481
these MFDS are owing to the size of the PO4 ions and lower favorable ionic attractions from 482
the ion present on other side of the membrane. 483
484
Fig. 7. N, P and K RSF for various MFDS used. a) Flux (LMH) plotted along with RSF for 485
N, P and K b) Net osmotic pressure (∆π) plotted along with RSF for N, P and K. Along 486
horizontal axis, first two letters in brackets indicates which nitrogen source used to prepare 487
MFDS in that particular stage. Similarly numbers 1, 2 and 3 indicates specific concentration 488
of particular MFDS. 489
490
RSF results indicate that due to these fertilizer salt losses through RSF, final diluted draw 491
solution (FDDS) may not end up with the same NPK nutrients ratio in the FDDS as of start of 492
the test. RSF outcome indicates the loss of valuable nutrients and possible deviation from the 493
start-up values. In order to achieve the desired NPK ratio suitable for tomato crop for any of 494
its particular crop period, one needs to take into account RSF results while preparing MFDS. 495
For practical use, to account for RSF loss in FDFO process, starting MFDS therefore will 496
have somewhat higher NPK ratios than Table-1 so that at the end of the process, FDDS may 497
achieve the nearly same NPK nutrients ratio required for any particular growth stage for 498
tomato or other plants. This may help eliminate further NPK balance/ adjustment of the 499
FDDS to make it suitable for direct use. 500
501
2.5 Long run tests for MFDS and expected final diluted draw solution (FDDS) 502
concentration 503
S2 and S4 based NPK MFDS were evaluated for flux for long run tests using two N- 504
fertilizers (NH4Cl and urea). These tests were operated for long time to evaluate flux outcome 505
responds to long time test run. NH4Cl nitrogen source was used to prepare MFDS having 506
NPK (11.5-19-11.5) ratio. Two other MFDS were prepared for S4 stage, one with NH4Cl as 507
main N-source fertilizer and other urea as N-source fertilizer for the same NPK (10-0-10) 508
blend. 509
510
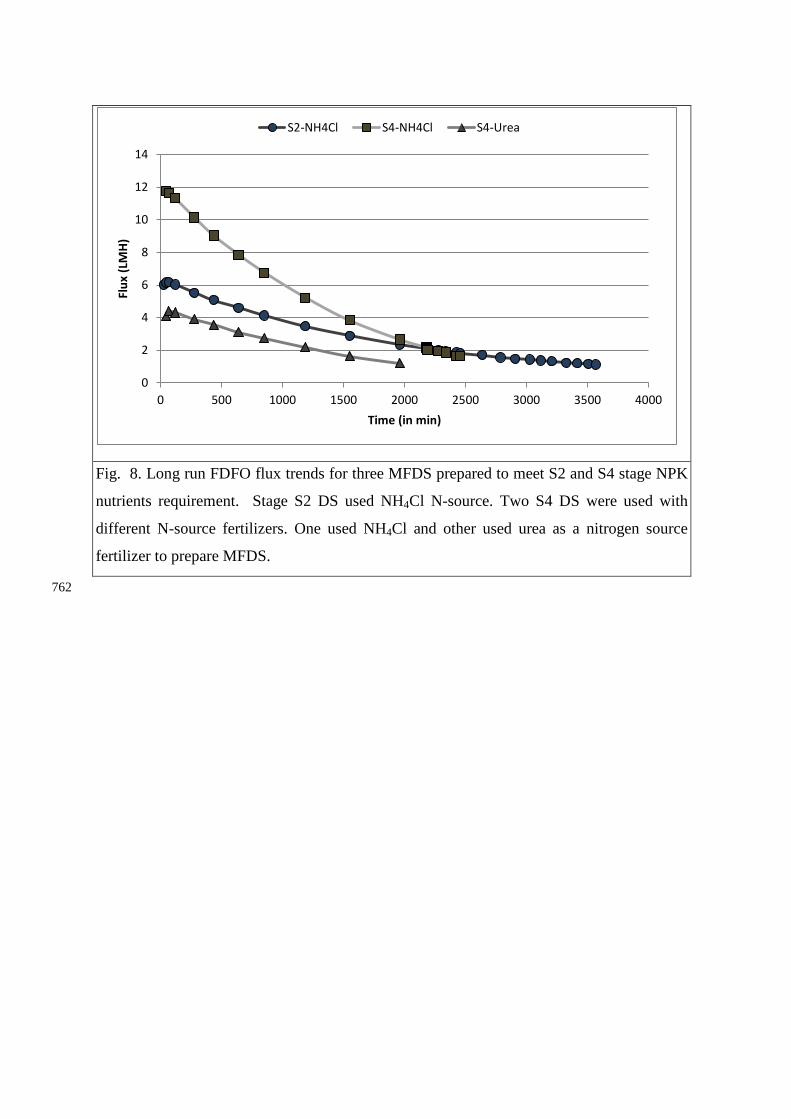
Fig. 8 shows the flux behavior for MFDS prepared to meet S4 stage nutrients requirements. 511
S4-NH4Cl MFDS was prepared using KCl and NH4Cl having concentration of 1.2M and 512
2.02M respectively. Similarly S4-Urea MFDS was prepared using KCl and urea having 513
individual concentration of 1.2M and 0.97M respectively. Starting with the same NPK 514
nutrients value for both MFDS, the results showed that in the beginning of the test, huge 515
difference between the water flux is recorded for NH4Cl and urea based N-source MFDS 516
blends. But as the tests were continued to proceed for more than 2000 minutes, steadily the 517
gap became narrow. There may be two reasons for this trend. Firstly, NH4Cl based MF blend 518
showed high initial flux, more water passed towards that side and reduces the concentration 519
of the DS by diluting it quickly. This dilution lowers the available driving force ∆π, resulting 520
sharp decline of the flux. On the other hand, as urea based MFDS had lower initial flux, water 521
permeation towards DS was slow, little dilution occurred over the same period of time so 522
urea based DS did not show a sharp flux declining trend. After a certain period of operational 523
run, due to dilution difference attributed to varying flux, NH4Cl based DS possesses lower ∆π 524
as compared to urea based DS. Thus as the test proceed toward the final stage, the available 525
osmotic pressure of NH4Cl based MFDS became close to the urea based MFDS and showed 526
nearly equal flux. 527
528
Fig. 8. Long run FDFO flux trends for three MFDS prepared to meet S2 and S4 stage NPK 529
nutrients requirement. Stage S2 DS used NH4Cl N-source. Two S4 DS were used with 530
different N-source fertilizers. One used NH4Cl and other used urea as a nitrogen source 531
fertilizer to prepare MFDS. 532
533
Additionally, in the recirculation mode FO test, as the test proceeded, DS keeps on diluting 534
due to water permeation through FO membrane whereas at the same time the FS gets 535
concentrated in respect to the solutes present in the FS. Continuous water permeation towards 536
DS side reduced the overall concentration of salts in the DS with time that results in reduction 537
of available ∆π. Comparably, during the continuous operation run, FS concentration changes 538
just marginally in comparison to DS concentration which do not either affect FS osmotic 539
pressure or contribute to lower the available flux driving force i.e., ∆π. As these processes 540
continue for long duration, DS dilution brings the driving force down and as a result overall 541
flux keeps decreasing continuously. DS dilution plays a major role in reducing the net 542
available osmotic pressure (based on the bulk osmotic pressures of the DS and FS) to deliver 543
resultant flux. On the other hand, concentrating FS along with RSF support also cause 544
increase of solutes concentration on the FS side which too affects ∆π in a longer test run. 545
546
Long run flux decline shown in Fig. 8 is not only due to the decrease of overall osmotic 547
pressure difference (∆π) between DS and FS. McCutcheon and Elimelech (McCutcheon and 548
Elimelech 2006) illustrated that due to concentration (CP) effects the concentrations at the 549
membrane surface are quite less than the bulk DS and FS concentrations and this small 550
effective osmotic pressure difference available at the membrane surface gives lower actual 551
flux in FO. In either membrane orientation mode (AL-FS or AL-DS), CP phenomenon is 552
developed on both sides of the membrane which restricted FO achieving the high theoretical 553
flux through FO operations (Cath, Gormly et al. 2005; Achilli, Cath et al. 2009; Phuntsho et 554
al. 2012). Similar CP effects are also noticed in Fig. 8 as the flux decline observed is more 555
than possible DS dilution and FS concentration affects. Severe CP development is noticed on 556
both sides of the membrane. ECP is severe as high concentration FS is used in this study. 557
558
ICP and ECP, along with dilution and concentrations of DS/FS contributed to reduce 559
available osmotic pressure across the membrane’s active layer which resulted lower flux 560
outcome compared to high theoretical flux potential. FO membrane always gives flux driven 561
by the concentrations present at the membrane surfaces and not by the actual concentrations 562
of DS and FS. As a result of DS/FS concentration difference at the membrane interface, we 563
achieve lower FO flux based on the ∆πeffective across the membrane interface instead of flux 564
based on ∆πbulk, the difference in osmotic pressure between DS and FS themselves. 565
3. CONCLUSIONS 566
567 FDFO performances were evaluated using suggested MFDS concentrations required for 568
tomato growth and seawater FS with special emphasize to understand practical issues related 569
to FDFO process. 570
571
Various MFDS exhibited flux from 2.50 LMH to 12.49 LMH depending on DS components 572
and their concentrations used. DS carrying high osmotic pressure components delivered high 573
flux outcome than others. For the same NPK ratio, MFDS prepared from different nitrogen 574
fertilizers indicated that NH4Cl based DS mixtures performed well over others whereas urea 575
and NH4NO3 DS mixtures exhibited same flux beside having significant osmotic pressure 576
difference between urea and NH4NO3. Jw(LMH)/∆π(bars) value fluctuation within 0.062 to 577
0.19 for these MFDS indicated that the osmotic pressure may not be taken as the only 578
dictating factor for FO outcome. 579
580
Nitrogen and potassium based MFDS showed higher N and K RSF. However, DS using 581
NH4H2PO4 delivered extremely low P-RSF ranging from 12-18.35 g/m2/h. Long run tests 582
showed that with seawater FS, FO gave FDDS enriched in nutrients, higher than the plant’s 583
requirement. Higher concentrations of nutrients in the final DS suggest that before putting it 584
for direct end use, FDDS either requires substantial dilution using additional fresh water or 585
some other post treatment technique to recycle additional nutrients to bring its nutrient level 586
down to match crop’s acceptable levels. The study also confirms that for direct fertigation, 587
FDFO desalination is more suitable for low salinity feed water. 588
589
The study confirms that FDFO can be used effectively to desalinate seawater feed source 590
using MFDS prepared from commercial fertilizers. 591
592
4. ACKNOWLEDGMENT 593
This study is funded by the National Centre for Excellence in Desalination Australia 594
(NCEDA) sponsored by Australian Government through Water for Future Initiative. 595
596
References 597
598
. "Food and Agriculture Organization of the United Nations." from 599 http://www.faostat3.fao.org/home/index.html. 600
Achilli, A., T. Y. Cath, et al. (2009). "Power generation with pressure retarded osmosis: An experimental and 601 theoretical investigation." Journal of membrane science 343(1): 42-52. 602
Achilli, A., T. Y. Cath, et al. (2009). "The forward osmosis membrane bioreactor: A low fouling alternative to 603 MBR processes." Desalination 239(1): 10-21. 604
Brouwer, C. and M. Heibloem (1986). "Irrigation water management: irrigation water needs." Training manual 605 3. 606
Cath, T. Y., A. E. Childress, et al. (2006). "Forward osmosis: Principles, applications, and recent 607 developments." Journal of membrane science 281(1): 70-87. 608
Cath, T. Y., S. Gormly, et al. (2005). "Membrane contactor processes for wastewater reclamation in space: Part 609 I. Direct osmotic concentration as pretreatment for reverse osmosis." Journal of membrane science 610 257(1): 85-98. 611
Chitra, R. and P. E. Smith (2002). "Molecular Association in Solution: A Kirkwood−Buff Analysis of Sodium 612 Chloride, Ammonium Sulfate, Guanidinium Chloride, Urea, and 2,2,2-Trifluoroethanol in Water." The 613 Journal of Physical Chemistry B 106(6): 1491-1500. 614
Chung, T.-S., S. Zhang, et al. (2012). "Forward osmosis processes: Yesterday, today and tomorrow." 615 Desalination 287(0): 78-81. 616
Claude J. Phene, D. (2004). Subsurface Drip Irrigation and Fertigation : Using phosphorus and potassium nitrate 617 to increase yield and quality of processing tomatoes. 618
Cuartero, J. and R. Fernández-Muñoz (1998). "Tomato and salinity." Scientia Horticulturae 78(1): 83-125. 619 de Fraiture, C. (2007). "Integrated water and food analysis at the global and basin level. An application of 620
WATERSIM." Water Resources Management 21(1): 185-198. 621 de Fraiture, C. and D. Wichelns (2010). "Satisfying future water demands for agriculture." Agricultural Water 622
Management 97(4): 502-511. 623 Donnan, F. G. (1924). "The theory of membrane equilibria." Chemical Reviews 1(1): 73-90. 624 Gao, Y., W. Li, et al. (2013). "Characterization of forward osmosis membranes by electrochemical impedance 625
spectroscopy." Desalination 312(0): 45-51. 626 Garcia-Castello, E. M., J. R. McCutcheon, et al. (2009). "Performance evaluation of sucrose concentration using 627
forward osmosis." Journal of membrane science 338(1): 61-66. 628 Hancock, N. T. and T. Y. Cath (2009). "Solute coupled diffusion in osmotically driven membrane processes." 629
Environmental Science & Technology 43(17): 6769-6775. 630 Hartz, T., G. Miyao, et al. (1999). "Potassium requirements for maximum yield and fruit quality of processing 631
tomato." Journal of the American Society for Horticultural Science 124(2): 199-204. 632 Hartz, T. K. and T. G. Bottoms (2009). "Nitrogen Requirements of Drip-irrigated Processing Tomatoes." 633
HortScience 44(7): 1988-1993. 634 Haynes, R. (1985). "Principles of fertilizer use for trickle irrigated crops." Nutrient Cycling in Agroecosystems 635
6(3): 235-255. 636 Hebbar, S., B. Ramachandrappa, et al. (2004). "Studies on NPK drip fertigation in field grown tomato (< i> 637
Lycopersicon esculentum</i> Mill.)." European Journal of Agronomy 21(1): 117-127. 638 Holloway, R. W., A. E. Childress, et al. (2007). "Forward osmosis for concentration of anaerobic digester 639
centrate." Water Research 41(17): 4005-4014. 640 Kessler, J. and C. Moody (1976). "Drinking water from sea water by forward osmosis." Desalination 18(3): 297-641
306. 642 Ling, M. M. and T.-S. Chung (2011). "Desalination process using super hydrophilic nanoparticles via forward 643
osmosis integrated with ultrafiltration regeneration." Desalination 278(1–3): 194-202. 644 Marais, M. A. (2004). SUBSURFACE DRIP IRRIGATION SYSTEMS. 645 McCutcheon, J. R. and M. Elimelech (2006). "Influence of concentrative and dilutive internal concentration 646
polarization on flux behavior in forward osmosis." Journal of membrane science 284(1–2): 237-247. 647 McCutcheon, J. R., R. L. McGinnis, et al. (2005). "A novel ammonia—carbon dioxide forward (direct) osmosis 648
desalination process." Desalination 174(1): 1-11. 649 McCutcheon, J. R., R. L. McGinnis, et al. (2006). "Desalination by ammonia–carbon dioxide forward osmosis: 650
Influence of draw and feed solution concentrations on process performance." Journal of membrane 651 science 278(1): 114-123. 652
McGinnis, R. L. and M. Elimelech (2008). "Global challenges in energy and water supply: the promise of 653 engineered osmosis." Environmental Science & Technology 42(23): 8625-8629. 654
Mehta, G. D. and S. Loeb (1978). "Internal polarization in the porous substructure of a semipermeable 655 membrane under pressure retarded osmosis." Journal of membrane science 4(2): 261-265. 656
Mehta, G. D. and S. Loeb (1978). "Performance of permasep B-9 and B-10 membranes in various osmotic 657 regions and at high osmotic pressures." Journal of membrane science 4(0): 335-349. 658
Mitchell, J., C. Shennan, et al. (1991). "Tomato fruit yields and quality under water deficit and salinity." Journal 659 of the American Society for Horticultural Science 116(2): 215-221. 660
Paugam, L., S. Taha, et al. (2003). "Elimination of nitrate ions in drinking waters by nanofiltration." 661 Desalination 152(1–3): 271-274. 662
Paugam, L., S. Taha, et al. (2004). "Mechanism of nitrate ions transfer in nanofiltration depending on pressure, 663 pH, concentration and medium composition." Journal of membrane science 231(1–2): 37-46. 664
Paul, D. R. (1974). "Further comments on the relation between hydraulic permeation and diffusion." Journal of 665 Polymer Science: Polymer Physics Edition 12(6): 1221-1230. 666
Phuntsho, S., H. Shon, et al. (2012). "Fertiliser drawn forward osmosis desalination: the concept, performance 667 and limitations for fertigation." Reviews in Environmental Science and Bio/Technology 11(2): 147-668 168. 669
Phuntsho, S., H. K. Shon, et al. (2011). "A novel low energy fertilizer driven forward osmosis desalination for 670 direct fertigation: Evaluating the performance of fertilizer draw solutions." Journal of membrane 671 science 375(1–2): 172-181. 672
Phuntsho, S., H. K. Shon, et al. (2012). "Blended Fertilizers as Draw Solutions for Fertilizer-Drawn Forward 673 Osmosis Desalination." Environmental Science & Technology 46(8): 4567-4575. 674
Schaep, J., B. Van der Bruggen, et al. (1998). "Influence of ion size and charge in nanofiltration." Separation 675 and Purification Technology 14(1–3): 155-162. 676
Semiat, R. (2008). "Energy issues in desalination processes." Environmental Science & Technology 42(22): 677 8193-8201. 678
Shalhevet, J. (1994). "Using water of marginal quality for crop production: major issues." Agricultural Water 679 Management 25(3): 233-269. 680
Shalhevet, J. and B. Yaron (1973). "Effect of soil and water salinity on tomato growth." Plant and Soil 39(2): 681 285-292. 682
She, Q., X. Jin, et al. (2012). "Relating reverse and forward solute diffusion to membrane fouling in osmotically 683 driven membrane processes." Water Research 46(7): 2478-2486. 684
Shon, H., S. Vigneswaran, et al. (2008). "Comparison of physico-chemical pretreatment methods to seawater 685 reverse osmosis: Detailed analyses of molecular weight distribution of organic matter in initial stage." 686 Journal of membrane science 320(1): 151-158. 687
Suh, C. and S. Lee (2013). "Modeling reverse draw solute flux in forward osmosis with external concentration 688 polarization in both sides of the draw and feed solution." Journal of membrane science 427: 365-374. 689
Sutzkover, I., D. Hasson, et al. (2000). "Simple technique for measuring the concentration polarization level in a 690 reverse osmosis system." Desalination 131(1–3): 117-127. 691
Tang, C. Y., Q. She, et al. (2010). "Coupled effects of internal concentration polarization and fouling on flux 692 behavior of forward osmosis membranes during humic acid filtration." Journal of membrane science 693 354(1): 123-133. 694
Wang, D.-X., M. Su, et al. (2005). "Separation performance of a nanofiltration membrane influenced by species 695 and concentration of ions." Desalination 175(2): 219-225. 696
Warczok, J., M. Gierszewska, et al. (2007). "Application of osmotic membrane distillation for reconcentration 697 of sugar solutions from osmotic dehydration." Separation and Purification Technology 57(3): 425-429. 698
Warner, J., T. Zhang, et al. (2004). "Effects of nitrogen fertilization on fruit yield and quality of processing 699 tomatoes." Canadian journal of plant science 84(3): 865-871. 700
Wijmans, J. G. and R. W. Baker (1995). "The solution-diffusion model: a review." Journal of membrane science 701 107(1–2): 1-21. 702
703 704
705
List of Tables
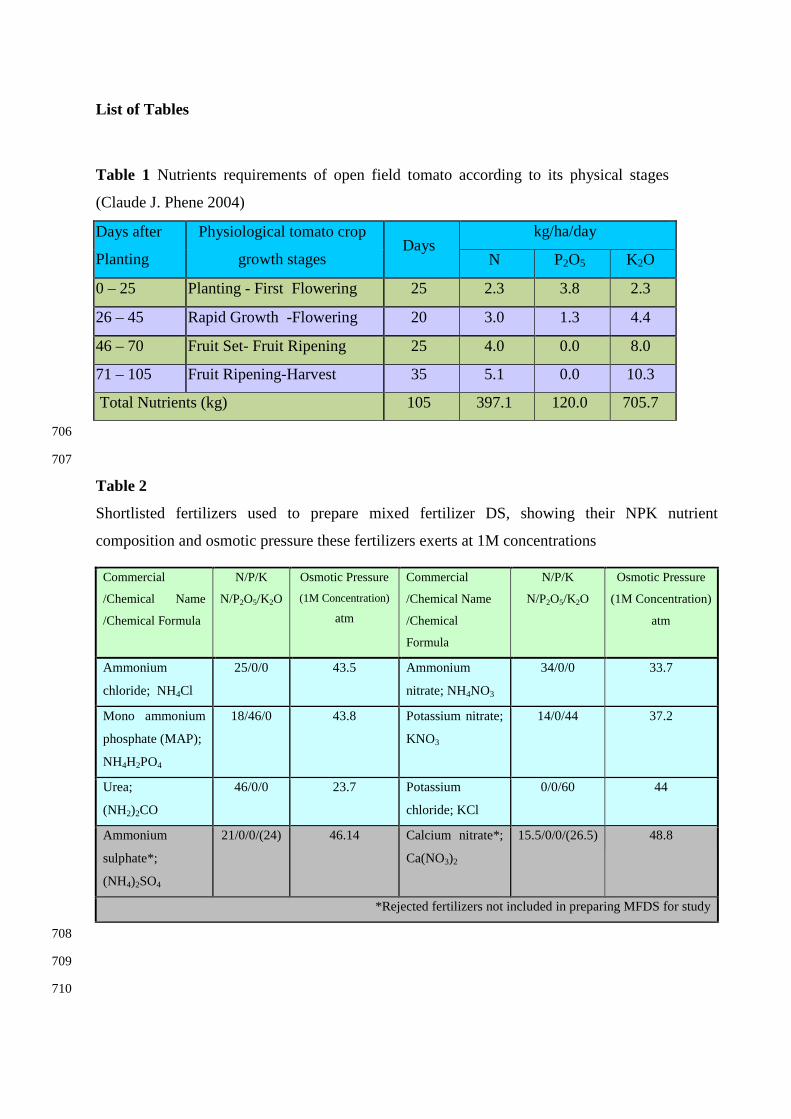
Table 1 Nutrients requirements of open field tomato according to its physical stages
(Claude J. Phene 2004)
Days after
Planting
Physiological tomato crop
growth stages Days
kg/ha/day
N P2O5 K2O
0 – 25 Planting - First Flowering 25 2.3 3.8 2.3
26 – 45 Rapid Growth -Flowering 20 3.0 1.3 4.4
46 – 70 Fruit Set- Fruit Ripening 25 4.0 0.0 8.0
71 – 105 Fruit Ripening-Harvest 35 5.1 0.0 10.3
Total Nutrients (kg) 105 397.1 120.0 705.7
706
707
Table 2
Shortlisted fertilizers used to prepare mixed fertilizer DS, showing their NPK nutrient
composition and osmotic pressure these fertilizers exerts at 1M concentrations
Commercial
/Chemical Name
/Chemical Formula
N/P/K
N/P2O5/K2O
Osmotic Pressure (1M Concentration)
atm
Commercial
/Chemical Name
/Chemical
Formula
N/P/K
N/P2O5/K2O
Osmotic Pressure
(1M Concentration)
atm
Ammonium
chloride; NH4Cl
25/0/0 43.5 Ammonium
nitrate; NH4NO3
34/0/0 33.7
Mono ammonium
phosphate (MAP);
NH4H2PO4
18/46/0 43.8 Potassium nitrate;
KNO3
14/0/44 37.2
Urea;
(NH2)2CO
46/0/0 23.7 Potassium
chloride; KCl
0/0/60 44
Ammonium
sulphate*;
(NH4)2SO4
21/0/0/(24) 46.14 Calcium nitrate*;
Ca(NO3)2
15.5/0/0/(26.5) 48.8
*Rejected fertilizers not included in preparing MFDS for study
708
709
710
711
List of Figure captions 712
713
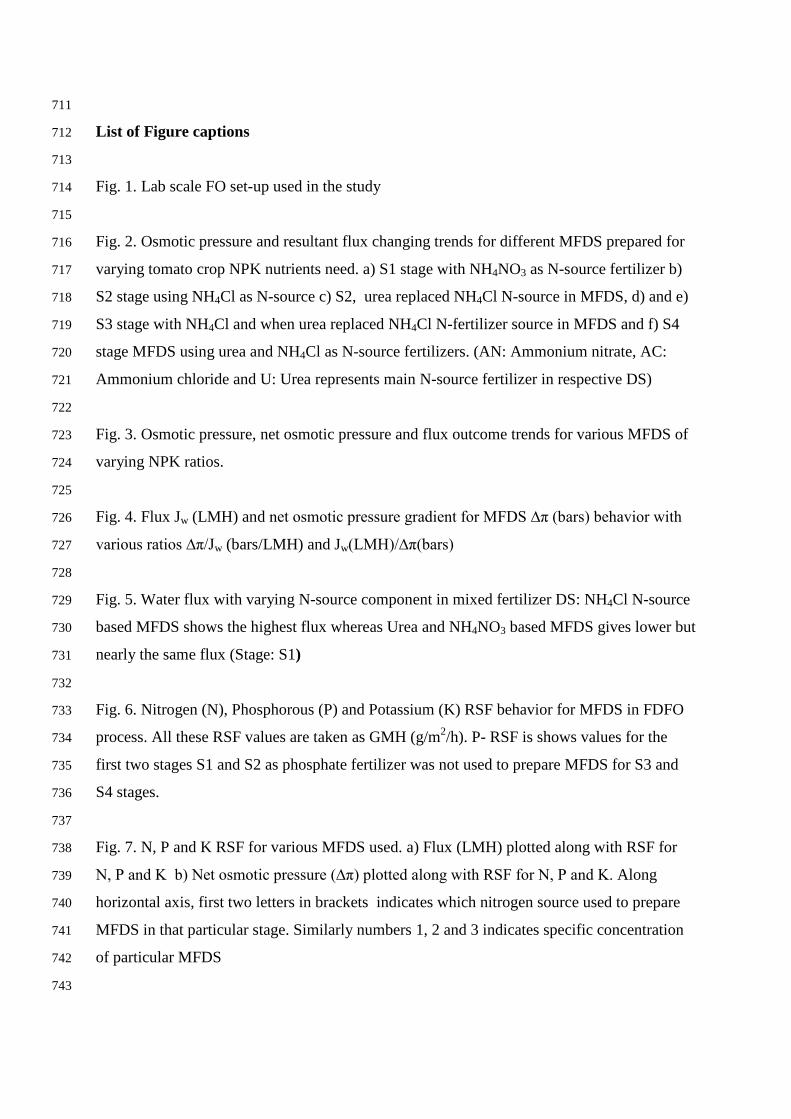
Fig. 1. Lab scale FO set-up used in the study 714
715
Fig. 2. Osmotic pressure and resultant flux changing trends for different MFDS prepared for 716
varying tomato crop NPK nutrients need. a) S1 stage with NH4NO3 as N-source fertilizer b) 717
S2 stage using NH4Cl as N-source c) S2, urea replaced NH4Cl N-source in MFDS, d) and e) 718
S3 stage with NH4Cl and when urea replaced NH4Cl N-fertilizer source in MFDS and f) S4 719
stage MFDS using urea and NH4Cl as N-source fertilizers. (AN: Ammonium nitrate, AC: 720
Ammonium chloride and U: Urea represents main N-source fertilizer in respective DS) 721
722
Fig. 3. Osmotic pressure, net osmotic pressure and flux outcome trends for various MFDS of 723
varying NPK ratios. 724
725
Fig. 4. Flux Jw (LMH) and net osmotic pressure gradient for MFDS ∆π (bars) behavior with 726
various ratios ∆π/Jw (bars/LMH) and Jw(LMH)/∆π(bars) 727
728
Fig. 5. Water flux with varying N-source component in mixed fertilizer DS: NH4Cl N-source 729
based MFDS shows the highest flux whereas Urea and NH4NO3 based MFDS gives lower but 730
nearly the same flux (Stage: S1) 731
732
Fig. 6. Nitrogen (N), Phosphorous (P) and Potassium (K) RSF behavior for MFDS in FDFO 733
process. All these RSF values are taken as GMH (g/m2/h). P- RSF is shows values for the 734
first two stages S1 and S2 as phosphate fertilizer was not used to prepare MFDS for S3 and 735
S4 stages. 736
737
Fig. 7. N, P and K RSF for various MFDS used. a) Flux (LMH) plotted along with RSF for 738
N, P and K b) Net osmotic pressure (∆π) plotted along with RSF for N, P and K. Along 739
horizontal axis, first two letters in brackets indicates which nitrogen source used to prepare 740
MFDS in that particular stage. Similarly numbers 1, 2 and 3 indicates specific concentration 741
of particular MFDS 742
743
Fig. 8. Long run FDFO flux trends for three MFDS prepared to meet S2 and S4 stage NPK 744
nutrients requirement. Stage S2 DS used NH4Cl N-source. Two S4 DS were used with 745
different N-source fertilizers. One used NH4Cl and other used urea as a nitrogen source 746
fertilizer to prepare MFDS. 747
748
749 750
Fig. 1. Lab scale FO set-up used in the study.
0
2
4
6
8
10
12
020406080
100120140160
S1 (AN-1) S1 (AN-2) S1 (AN-3)
Flux
(LM
H)
DS O
smot
ic P
ress
ure
(bar
)
S1- NPK concentration DS
Osmotic Pressure (bar) Flux
0
2
4
6
8
10
12
14
0
20
40
60
80
100
120
140
S2 (AC-1) S2 (AC-2) S2 (AC-3)
Flux
(LM
H)
DS O
smot
ic P
ress
ure
(bar
)
S2- NPK concentration DS
Osmotic Pressure (bar) Flux
0123456789
0
20
40
60
80
100
120
S2 (U-1) S2 (U-2) S2 (U-3)
Flux
(LM
H)
DS O
smot
ic P
ress
ure
(bar
)
S2- NPK concentration DS
Osmotic Pressure (bar) Flux
0
2
4
6
8
10
12
14
0
20
40
60
80
100
120
140
160
S3 (AC-1) S3 (AC-2) S3 (AC-3)
Flux
(LM
H)
DS O
smot
ic P
ress
ure
(bar
)
S3- NPK concentration DS
Osmotic Pressure (bar) Flux
0
1
2
3
4
5
0
20
40
60
80
100
S3 (U-1) S3 (U-2) S3 (U-3)
Flux
(LM
H)
DS O
smot
ic P
ress
ure
(bar
)
S4- NPK concentration DS
Osmotic Pressure (bar) Flux
0
2
4
6
8
10
12
14
020406080
100120140160
S4 (U-1) S4 (AC-1)
Flux
(LM
H)
DS O
smot
ic P
ress
ure
(bar
)
S4- NPK concentration DS
Osmotic Pressure (bar) Flux
Fig. 2. Osmotic pressure and resultant flux changing trends for different MFDS prepared for varying tomato crop NPK nutrients need. a) S1 stage with NH4NO3 as N-source fertilizer b) S2 stage using NH4Cl as N-source c) S2, urea replaced NH4Cl N-source in MFDS, d) and e) S3 stage with NH4Cl and when urea replaced NH4Cl N-fertilizer source in MFDS and f) S4 stage MFDS using urea and NH4Cl as N-source fertilizers. (AN: Ammonium nitrate, AC: Ammonium chloride and U: Urea represents main N-source fertilizer in respective DS).
a) b)
c) d)
e) f)
0246810121416
0
2
4
6
8
10
12
14
∆π /
Jw (b
ar/L
MH)
)
Flux
(LM
H)
MFDS Type
Flux (LMH) ∆π /Jw (bar/LMH))
020406080100120140160
0
2
4
6
8
10
12
14
π an
d ∆π
(ba
r)
Flux
(LM
H)
MFDS Type
Flux (LMH) Osmotic Pressure (bar) ∆π (bar)
751
752
Fig. 3. Osmotic pressure, net osmotic pressure and flux outcome trends for various MFDS of
varying NPK ratios.
a)
0
0.05
0.1
0.15
0.2
0.25
0
20
40
60
80
100
120
140
Flux
(LM
H)/∆
π (b
ar)
∆π (b
ar)
MFDS Type
∆π (bar) Flux (LMH)/∆π (bar)
753
754
Fig. 4. Flux Jw (LMH) and net osmotic pressure gradient for MFDS ∆π (bars) behavior with
various ratios ∆π/Jw (bars/LMH) and Jw(LMH)/∆π(bars).
b)
0
2
4
6
8
10
12
14
1 2 3
Flux
(LM
H)
NPK Concentration of MFDS 11.5-19-11.5
NH4NO3 -N-source Urea- N-Source NH4Cl -N-Source
755
756
757
Fig. 5. Water flux with varying N-source component in mixed fertilizer DS: NH4Cl N-
source based MFDS shows the highest flux whereas Urea and NH4NO3 based MFDS