OR First Starts Case Study 1 OR First Starts Case Study University of Missouri Health One Hospital Drive Columbia, Missouri 65212 Primary Contact: Robert P. Zitsch III, MD, FACS William E. Davis Professor and Chair, Department of Otolaryngology — Head and Neck Surgery Director, Operating Room Operations Committee University of Missouri Health [email protected]Secondary Contacts: Douglas S. Wakefield, PhD Director,Center for Health Care Quality University of Missouri Health Care [email protected]Donald S. Baker Business Technology Analyst University Hospital Surgery Services [email protected]Matthew W. Waterman Director of Surgical Services University of Missouri Health Care [email protected]Michael Brown, MD Anesthesiologist University of Missouri Health Care [email protected]Executive Summary University of Missouri Health, a comprehensive academic medical center that includes MU Health Care, MU School of Medicine and its University Physicians practice plan, MU Sinclair School of Nursing, and MU School of Health Professions, has a mission to advance the health of all people, especially Missourians, through exceptional clinical service, which supports the academic and research mission of the University of Missouri. MU Health recognizes that an electronic health record (EHR) is essential to its mission and has had an EHR infrastructure since 1996. Consisting of five hospitals and more than 50 clinics staffed by more than 550 university physicians, MU Health Care has the only Level 1 trauma center in mid-Missouri. Our health system offers primary, secondary and tertiary services to central Missourians in a 25-county service area with a population of 776,861. In 2009, we identified a trend of delayed Operating Room (OR) first starts. We achieved on-time first starts an average of only 21 percent of the time. The complexity of choreographing an on- time first start was overwhelming. We turned to the data available across numerous information technology (IT) solutions to isolate problems, make process changes, and track first-start leading
Transcript
OR First Starts Case Study 1
OR First Starts Case Study
University of Missouri Health One Hospital Drive
Columbia, Missouri 65212
Primary Contact:
Robert P. Zitsch III, MD, FACS William E. Davis Professor and Chair, Department
of Otolaryngology — Head and Neck Surgery Director, Operating Room Operations Committee
and lagging indicators. As we streamlined our processes, we then used IT to improve
communications (pre-, intra- and post-procedure), minimize delays and manage results, both in
the OR and for our patients.
Over the past 12 months, we are now averaging 77 percent on-time OR first starts at the main
University Hospital, up from 21 percent in fiscal year 2009. Meanwhile, since then our first start
volumes have increased by more than 18 percent across the health system.
Local Problem
On any given day, our health care system has between 20-30
first-start surgeries, or surgeries that are scheduled to begin
at the same time. Because ORs represent a critical source of
patient care services, income generation, and are a source of
high costs for hospitals, it is imperative that we minimize the
number of first-start delays.
Depending on the extent of delays in starting these first cases of the day on time, there can be
many serious side-effects such as:
Subsequent rippling delayed starts for remaining cases scheduled for that day
Case cancellations that result in unnecessary rework in getting them rescheduled
Poor surgery block time utilization
Extended OR hours that cause unplanned overtime costs
Dissatisfied providers and OR staff members
Delays are caused by a variety of factors, including the following:
Staff and/or equipment availability issues
o Lack of Communication among team members
o Little accountability for personnel being late
Inefficient block scheduling
Case being bumped because of other emergency cases
Changes in patient clinical status or preference
Patients not being present at the correct time or not following pre-surgery orders
While we cannot always make scheduling changes to reflect emergencies or changing patient
conditions, we can reduce delays related to our policies, procedures, and how we have designed
our processes to ultimately change our culture to one of personal accountability and rich in
communication. With these goals in mind, our institution embarked on a multi-year initiative to
reduce the percentage of first-start delays in our OR.
Delayed first starts are in itial
surgeries of a given day that do
not begin when they are
scheduled to start.
OR First Starts Case Study 3
Figure 1 below tells the story of declining on-time performance for a portion of fiscal year2009,
when we initiated our improvement efforts. During this timeframe, we averaged approximately
nearly 18 minutes of delay per delayed case, and we totaled 3,000-4,000 of delayed minutes
each month, valued at $189,000 - 252,000, based upon our estimated MU Health Care cost of
$63 per minute.
F i gure 1
Design and Implementation
In view of these disappointing statistics, we began our journey to improve on-time first starts in
2009. The Cerner Millennium EHR and PowerChart had been functioning since 1997, and
University Hospital implemented the department-specific solution, SurgiNet, in 2004. Although it
had been implemented for nearly 5 years, we were underutilizing the solution to our disadvantage.
Step 1: Defining a f irst-start delay and calculating baselines
Our operational definition of a delayed start is as follows: Wheels-in Time being more than five
minutes later than the scheduled start time (to include a five-minute grace period). Based on this
metric and using EHR time stamps, our baseline for fiscal year 2009 was calculated at 21 percent
on time first starts.
OR First Starts Case Study 4
Step 2: Process analysis and redesign
Through the Operating Room Oversight Committee (OROC), our hospital system’s leaders
chartered the First Start Improvement Team in 2009. The committee oversees all operating room
activities, and it sets policies and procedures governing all OR facilities.
We use PDSA (Plan-Do-Study-Act) and lean frameworks to conduct systematic process analysis
and testing of interventions. This work is supported by an evolving HIT and analytic infrastructure.
This infrastructure, in turn, supports an increasingly extensive array of analyses of processes,
development and testing of a number of interventions, as well as long-term, ongoing monitoring —
all of which our senior leaders strongly supported.
Instrumental to our success is the use of data from both direct observations and a variety of
information technologies to:
Provide baseline and post-implementation measurements
Communicate to key stakeholders what is needed when
Support ongoing monitoring and continued process improvements
The project’s intended goal and our leaders’ expectation is to consistently achieve 80 percent on-
time first starts across the health system. The surgical services department strives to achieve 100
percent on-time first starts and analyzes all variance.
How Health IT Was Utilized
During our improvement process and design, we used the following IT systems:
Kronos – Identified time delays, staff members were clocking in from areas
remote from the ORs.
Cerner Millennium EHR – Timing of anesthesia residents’ day-of-surgery notes,
combined with observations, led to requirement of when these residents needed to be in the OR and for the identification of procedures, which should
or should not be First Starts.
Instacount – This solution supported preparation of correct surgical
equipment and supply trays for delivery to ORs.
Cerner Millennium SurgiNet – We employed electronic posting and automated
electronic case tracking boards for intra-OR communications, case status boards in waiting areas for communications with patients’ families, automated
daily reports, and bi-weekly run chart summaries for key stakeholders.
OR First Starts Case Study 5
Automating Data Transmissions and Communications
Today, we use IT in a highly integrated manner to help sustain our on-time start percentages.
Figure 2 provides an overview of key areas in which we currently use automatic data
transmissions and communications.
F i gure 2
Steps 1-3 describe pre-op processes and communications. Step 4 focuses on day-of-surgery
processes and communications, and Step 5 addresses reporting.
1. Registration: Once the patient and surgeon have decided that a specific
surgical procedure is necessary, we register the patient in our registration system (IDX).
2. Scheduling: The registration system automatically provides the information needed to schedule a date and time. The scheduler enters this information into our EHR
(PowerChart), which automatically feeds the surgery IT system (SurgiNet).
OR First Starts Case Study 6
3. Pre-surgical notifications: SurgiNet sends pre-surgical notifications and prompts to several groups prior to the day of surgery:
a. OR Management identifies types of rooms, beds, staff, and equipment needed.
b. The Sterile Processing Department’s Instacount system identifies
provider-specific surgical trays and supplies that need to be in the assigned room on the day of surgery.
c. Anesthesia information system (SurgiNet Anesthesia) generates:
i. Required pre-surgical assessments ii. Additional clinical consultations (as needed)
iii. Patient consents iv. A list of next-day, first-start patients
d. Pre-Op anesthesia nurses contacts these next-day patients to:
i. Answer any questions ii. Reiterate key instructions (e.g., NPO (nothing by mouth) after
midnight, stopping medications) iii. Ensure patients are planning to arrive on time
4. Day of Surgery: There are extensive data feeds from the surgery information
system to populate tracking boards:
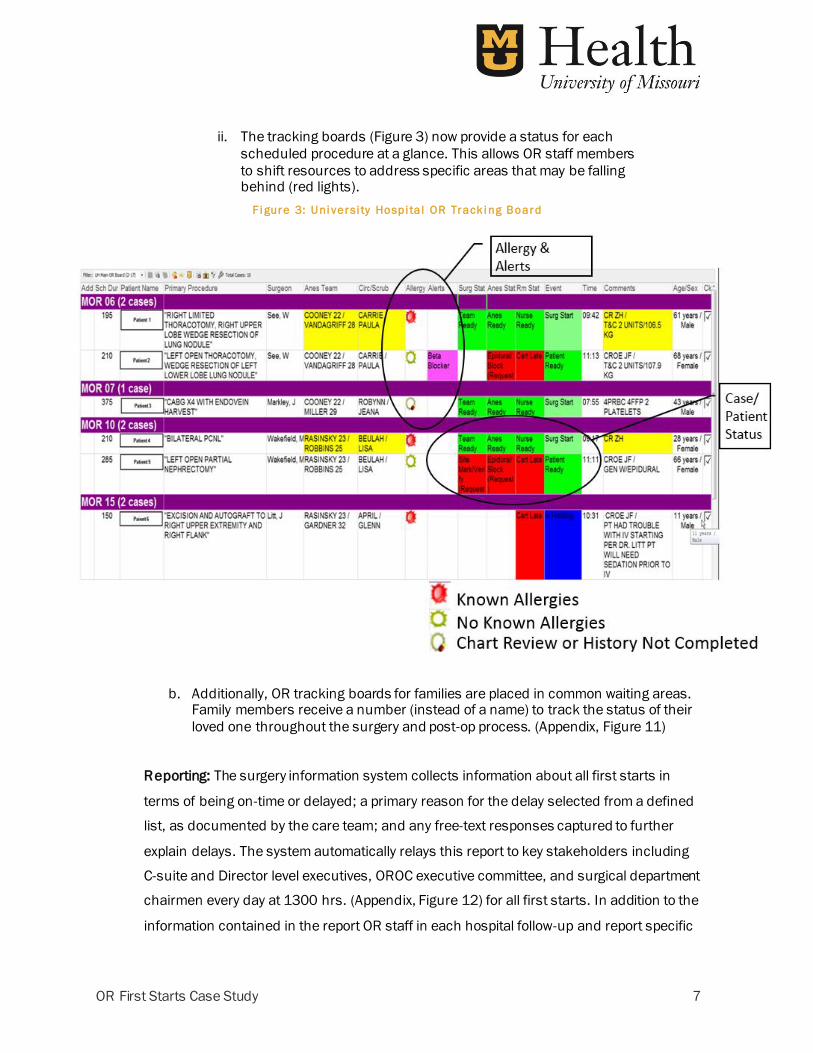
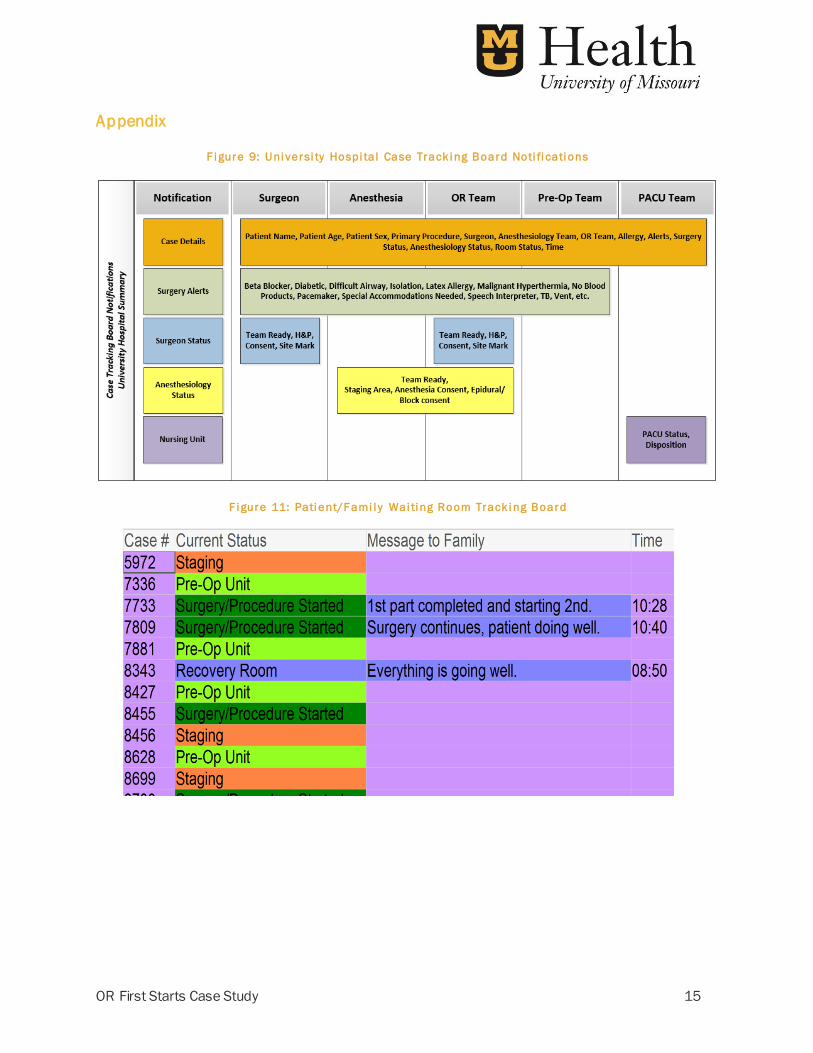
a. OR patient tracking boards for OR staff members (Appendix, Figure 9)
i. Use of the electronic tracking boards in ORs has been
particularly helpful. For every scheduled case, we track the status of specific readiness information using a red/green
“stop-light” type report. Patients cannot be wheeled back to the specific OR room until the room, the surgeon and the
anesthesiologist are ready (green light). (Appendix, Figure 10)
OR First Starts Case Study 7
ii. The tracking boards (Figure 3) now provide a status for each
scheduled procedure at a glance. This allows OR staff members
to shift resources to address specific areas that may be falling behind (red lights).
F i gure 3: Uni versi ty Hospi ta l OR Track i ng Board
b. Additionally, OR tracking boards for families are placed in common waiting areas. Family members receive a number (instead of a name) to track the status of their
loved one throughout the surgery and post-op process. (Appendix, Figure 11)
Reporting: The surgery information system collects information about all first starts in
terms of being on-time or delayed; a primary reason for the delay selected from a defined
list, as documented by the care team; and any free-text responses captured to further
explain delays. The system automatically relays this report to key stakeholders including
C-suite and Director level executives, OROC executive committee, and surgical department
chairmen every day at 1300 hrs. (Appendix, Figure 12) for all first starts. In addition to the
information contained in the report OR staff in each hospital follow-up and report specific
OR First Starts Case Study 8
details about the cause of each first start delay (i.e., names of specific equipment,
supplies, staff, care processes, or patient factors involved in the delay). Daily reports
facilitate rapid identification of and interventions to reduce future first start delays.
Weekly and monthly reports as shown in Figures 4-6 provide valuable summaries and
trend analyses. When we detect a dip in performance we review the delay reasons to
evaluate if the delays are due to special or common cause factors. For example, when
some of our top delay reasons over 3 months time were “consent missing” and “surgeon
or anesthesiologist unavailable” (Appendix, Figure 13), we examined the consent
documentation process and targeted communications to individuals who were late due to
personal reasons versus being late becase they were providing emergent care to another
patient. Because we tracked delay reasons, we can identify repetitive patterns involving
individuals, or processes of care, implement interventions, and track subsequent results.
(Appendix, Figure 14). Thus, what started out as an improvement “project” has evolved
into a “new way of managing”.
Reports of corrective actions are received by:
a. Executive Committee of Medical Staff
b. Daily Operations
c. Monthly Global Operating Room Operations Committee
We also report at the Bi-Monthly Operating Review for Surgery Services, where On-time
First Starts is a key metric. (Appendix, Figure 15)
Value Derived
Since 2009, we have had steady and sustained progress toward our goal of 80 percent on-time
first starts. Our average on-time OR first starts for the last four quarters was 77 percent compared
to fiscal year 2009 of on-time first starts of 21 percent. Although still shy of our 80 percent on-
time goal, we are pleased with our progress. (Figure 4 shows data by month.)
1. Across our most recent 3 years of results we have a soft cost savings of $141,241 per
month, based on a monthly savings of 2,248 minutes and our estimated OR cost of
$62.83 per minute.
OR First Starts Case Study 9
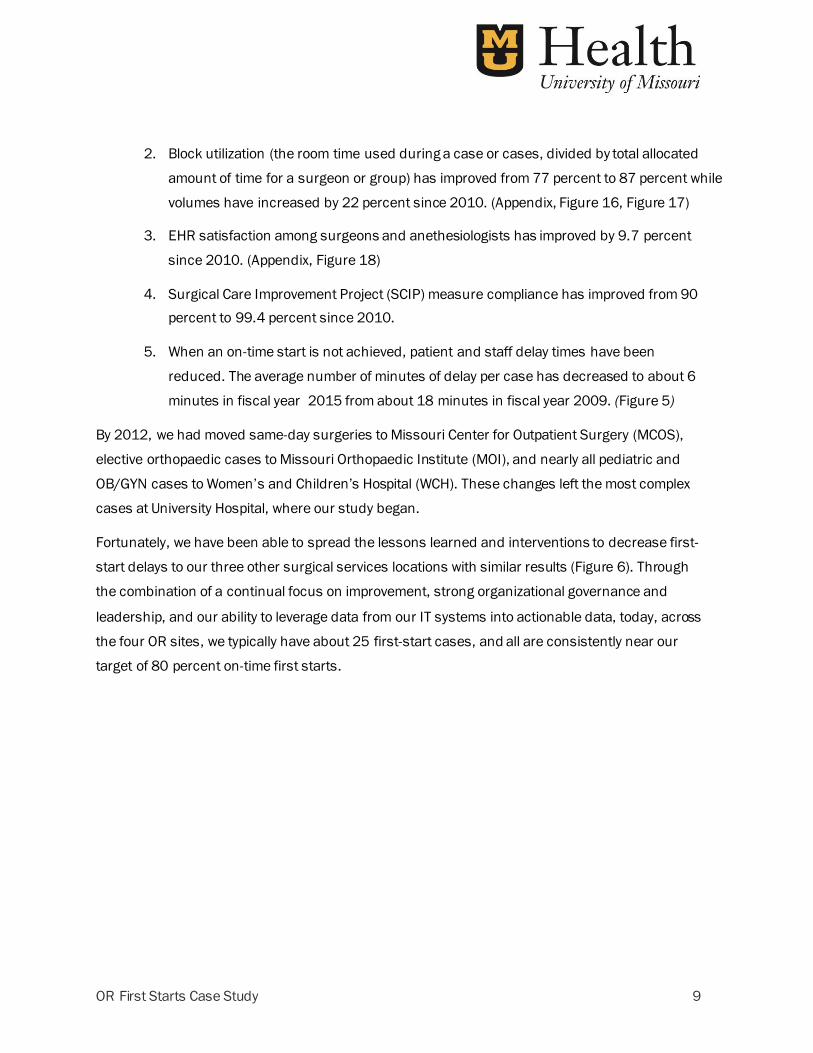
2. Block utilization (the room time used during a case or cases, divided by total allocated
amount of time for a surgeon or group) has improved from 77 percent to 87 percent while
volumes have increased by 22 percent since 2010. (Appendix, Figure 16, Figure 17)
3. EHR satisfaction among surgeons and anethesiologists has improved by 9.7 percent
since 2010. (Appendix, Figure 18)
4. Surgical Care Improvement Project (SCIP) measure compliance has improved from 90
percent to 99.4 percent since 2010.
5. When an on-time start is not achieved, patient and staff delay times have been
reduced. The average number of minutes of delay per case has decreased to about 6
minutes in fiscal year 2015 from about 18 minutes in fiscal year 2009. (Figure 5)
By 2012, we had moved same-day surgeries to Missouri Center for Outpatient Surgery (MCOS),
elective orthopaedic cases to Missouri Orthopaedic Institute (MOI), and nearly all pediatric and
OB/GYN cases to Women’s and Children’s Hospital (WCH). These changes left the most complex
cases at University Hospital, where our study began.
Fortunately, we have been able to spread the lessons learned and interventions to decrease first-
start delays to our three other surgical services locations with similar results (Figure 6). Through
the combination of a continual focus on improvement, strong organizational governance and
leadership, and our ability to leverage data from our IT systems into actionable data, today, across
the four OR sites, we typically have about 25 first-start cases, and all are consistently near our
target of 80 percent on-time first starts.
OR First Starts Case Study 10
F i gure 4
F i gure 3
OR First Starts Case Study 11
F i gure 4
Lessons Learned
Our project has been largely successful through the combination of a continual focus on
improvement, strong organizational governance and leadership, our ability to leverage data from
our IT systems into actionable data (by digitizing data to generate real-time reporting through
dashboards and same-day reporting for late start reasons) , and to replicate our success across
other sites.
Continual Focus on Improvement
We remain focused on reducing first-start delays from organization-wide monthly operation reports
as well as daily departmental reports and a commitment to documenting and tracking variance.
Communication is critical. Organizations need to understand and make transparent to all process
owners what it takes to achieve an on-time start. Achieving on-time first starts requires an
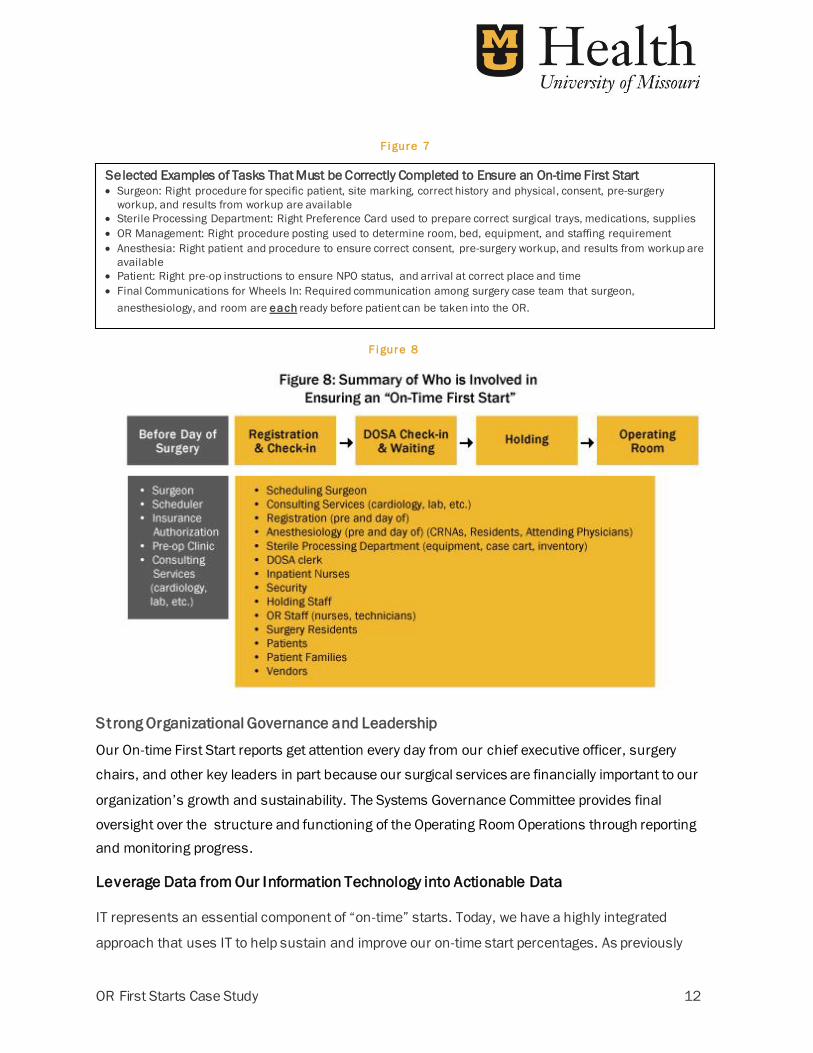
exacting choreography of many different individuals (Figure 8), who, in a timely and correct
manner, complete a complex set of sequenced and interdependent tasks. Examples of some of
the tasks required for completion on day of surgery are shown in Figures 7 and 8.
OR First Starts Case Study 12
Selected Examples of Tasks That Must be Correctly Completed to Ensure an On-time First Start Surgeon: Right procedure for specific patient, site marking, correct history and physical, consent, pre-surgery
workup, and results from workup are available
Sterile Processing Department: Right Preference Card used to prepare correct surgical trays, medications, supplies
OR Management: Right procedure posting used to determine room, bed, equipment, and staffing requirement
Anesthesia: Right patient and procedure to ensure correct consent, pre-surgery workup, and results from workup are
available
Patient: Right pre-op instructions to ensure NPO status, and arrival at correct place and time
Final Communications for Wheels In: Required communication among surgery case team that surgeon,
anesthesiology, and room are each ready before patient can be taken into the OR.
Strong Organizational Governance and Leadership
Our On-time First Start reports get attention every day from our chief executive officer, surgery
chairs, and other key leaders in part because our surgical services are financially important to our
organization’s growth and sustainability. The Systems Governance Committee provides final
oversight over the structure and functioning of the Operating Room Operations through reporting
and monitoring progress.
Leverage Data from Our Information Technology into Actionable Data
IT represents an essential component of “on-time” starts. Today, we have a highly integrated
approach that uses IT to help sustain and improve our on-time start percentages. As previously
F i gure 7
F i gure 8
OR First Starts Case Study 13
described, we use IT throughout the process to pull key “levers” from registration, scheduling, pre-
op communications, intra-op communications to both team and family members, and reporting.
Replicate Success
Our initial improvements at University Hospital have now been replicated across other surgical
service sites, including Missouri Orthopaedic Institute, Women’s and Children’s Hospital and
Missouri Center for Outpatient Surgery. (Figure 7)
Challenges:
Defining an On-Time First Start grace period
Initially using the difference between scheduled start time and wheels-in time to determine if
there was a delayed first start was helpful. However, it became apparent that we might be
introducing a measurement error because there can be inadvertent delays in entering the exact
Wheels-in Time in the EHR. Because staff and physicians were going to be held accountable for
on-time first starts, we subsequently decided to add a five-minute grace period to allow for delays
in data entry.
Time Clock Placement
Staff members were clocking in “on time”, but the time clock was closer to the parking garage than
it was to the surgery services area. Upon initial analysis, we didn’t understand how staff members
were late to the area. Our solution was to simply move the time clocks closer to surgery area.
There’s Always More to the Story
Users document delays by selecting a primary reason from a list of 57 possibilities. Although the user
can select only one reason, he or she can document additional details in email that display on the
report reviewed by management. The full truth always comes out in the emails and has been central
in how we understand delays and possible ways to improve processes and/or communications.
Next steps
While we continue to improve on-time first starts, our next step is to evaluate ways of improving
time lag between “wheels in” to the first incision of the surgery to further increase productivity
and efficiency.
OR First Starts Case Study 14
Financial Considerations
The team used the existing EHR and other supporting IT solutions as the primary point of
intervention and data collections; there were no software or hardware costs associated with these
changes nor are there ongoing costs related to these changes. The OR First Start committee
estimated a MU Health Care cost per minute for operating room time of $62.83 Decreasing the
frequency of delayed first starts as well as decreasing the average length of delay resulted in a
calculated soft value of $1.8 million in fiscal year 2015.
OR First Starts Case Study 15
Appendix
F i gure 9: Uni versi ty Hospi ta l Case Track i ng Board Noti fi cati ons
F i gure 11: Pati ent/F ami l y Wai ti ng Room Track i ng Board
OR First Starts Case Study 16
F i gure 12: Dai l y Repor t
F i gure 13: Top 10 De l ay Reasons i n Last 90 Day
OR First Starts Case Study 17
F i gure 14: De l ay Cause Progress Moni to r i ng
F i gure 15: B i -montl y Operati ng Revi ew Dashboard
OR First Starts Case Study 18
F i gure 16: Uni versi ty Hospi ta l OR Bl ock U ti l i zati on Percentage , F Y ’09 through F Y ’15
F i gure 17: Combi ned Case Vo l ume, F Y ’10 through F Y ’15
OR First Starts Case Study 19
F i gure 18: Surger y , Anesthesi o l ogy , & Or thop aedi c Surger y Sati sfacti on