Page 1
1
Paradise of Novelty – or Loss of Human Capital? Changing Fields and
Inventive Output
Sam Arts
KU Leuven
[email protected]
Lee Fleming
Fung Institute for Engineering Leadership
UC Berkeley
[email protected]
June 8, 2016
ABSTRACT
Does a person become more or less creative when entering a new field? Changing fields
results in a loss of expertise that might harm the value of subsequent output, yet exposure
to new knowledge and context might also increase the novelty of that output. Using
patent renewals as a measure of value and new to the patent corpus words as a measure of
novelty, we demonstrate correlations between changing fields and decreased value – but
increased novelty – in an inventor-firm fixed effects panel. This tradeoff can be partially
ameliorated through collaboration in the new field or use of the scientific literature. We
confirm the main predictions using unintended labor law change as an exogenous source
of variation in changing fields among inventors who move between employers. The
research resolves differing predictions on how field change influences creativity and
introduces new metrics that distinguish value from novelty.
This work is supported by NSF grant 1360228, KU Leuven grant IMP/16/002, the US Patents and
Trademark Office, the Ewing Marion Kauffman Foundation, and the Coleman Fung Institute for
Engineering Leadership. We wish to thank participants of the Haas Innovation and Management and
Organization seminars, the 2015 SMS and AOM junior faculty consortia, attendees at a 2015 Academy of
Management presentation and the Quantifying Science workshop at the Conference on Complex Systems,
and Gustavo Manso, Ben Balsmeier, Bruno Cassiman, Sandy Yu, Michael Bikard, and Matt Marx, for the
helpful feedback. Errors and omissions remain the authors’.
Page 2
2
INTRODUCTION
“The man who employs either his labour or his stock in a grater variety of ways than his situation
renders necessary…may hurt himself, and he generally does so.
Jack of all trades will never be rich, says the proverb.”
Adam Smith, Book IV, Chapter V, p. 563.
“Almost always the men who achieve these fundamental inventions of a new paradigm have been either
very young or very new to the field whose paradigm they change.”
Thomas Kuhn, The Structure of Scientific Revolutions, p. 89-90.
Creative search is uncertain and the optimal strategy rarely reveals itself. March (1991) characterized the
problem as a choice between exploiting known and proximal opportunities versus exploring new and
distant possibilities. The analogy aptly describes the risky search process of invention. On the one hand –
and more consistent with an economics perspective – people should exploit and build upon their prior
knowledge and expertise (Smith 1776, Jovanovic 1979). On the other hand – and more consistent with an
evolutionary perspective – people should explore new fields and learn and apply new knowledge
(Campbell 1960, Kuhn 1970, Merton 1973: 518).
We offer a resolution to these competing models of creative search, drawing theoretically from
March (1991) and proceeding empirically with more nuanced metrics of inventive output that distinguish
value from novelty. We avoid sole reliance upon the most popular measure in the patent literature, prior
art citations, which have been used to measure both novelty and value (Harhoff et al. 1999, Bernstein
2015). Instead, we use patent renewals as a measure of value and new to the patent corpus words as a
measure of novelty. We argue that inventors who change fields are less likely to create valuable patents –
because they lack prior knowledge and expertise (Simon 1983), but more likely to create novel patents –
because of exposure to new knowledge and perspectives (French and Sternberg 1989). We also propose
that collaboration in the new field or reliance upon scientific knowledge can soften this tradeoff.
To test our predictions, we use two different samples and types of analysis. First, we select the
full population of inventors with patents assigned to firms for 1975-2002 and estimate inventor-firm fixed
Page 3
3
effects panel models. Using repeated observations of the same inventor within the same firm, we illustrate
how changing fields increases the likelihood of a new word appearing in a patent and decreases the
probability of renewal. Second, we use an unintended change in non-compete labor law (the Michigan
Anti-Trust Reform Act, hereafter MARA) that exogenously pushed mobile inventors to change fields.
Prior research has established that inventors that are subject to non-competes and change firms are more
likely to leave their technical field of expertise and enter a new field, arguably to avoid a potential lawsuit
(Marx 2011). We replicate these results by combining differences in the likelihood of changing fields
across states (comparing inventors who change firms in states which proscribe non competes vs. those
who change firms in Michigan) with differences across cohorts induced by the timing of the law change
(pre- versus post-MARA). MARA had a strong and significant effect on the likelihood that mobile
inventors in Michigan changed fields, enabling an instrument for changing fields in cross sectional two-
stage least squares models (Duflo 2001).
Both samples indicate that inventors who change fields create less valuable patents, as measured
by maintenance fees paid to the US Patent and Trademark Office (USPTO) and alternately by future prior
art citations. This result supports economic arguments that stress the importance of experience and the
accretion of specialized human capital. Both samples also indicate that inventors who change fields create
more novel patents, as measured by new to the patent corpus words and alternatively by a decreased
number of backward prior art citations. This result supports evolutionary arguments that stress exposure
to diversity and fresh perspectives. Speaking to the managerial challenge of how inventors and firms can
manage this fundamental tension between novelty and value, we find that collaboration in the new field
reduces the decline in value and that reliance on published science increases the positive effect on
novelty. While we find strong support for the moderating effects of collaboration and use of the scientific
literature in the fixed effects models, the interactions are not consistently significant in the natural
experiment.
Page 4
4
The work highlights new and neglected measures in the literature on creativity and invention
(maintenance renewal for patent value, see Schankerman and Pakes 1986 and Harhoff et al. 1999, and a
newly calculated measure, new to the patent corpus words for novelty, see Balsmeier et al. 2015), offers a
resolution to differing predictions on the relationship between prior expertise and inventive output, and
suggests normative insights for technical professionals and their managers. It provides some of the first
well-identified evidence to 1) support the predictions of March (1991) and 2) observe how a job match
influences an inventor’s subsequent output (Topel and Ward 1992).
THEORY AND PREDICTIONS
Economists have long argued for the benefits of specialization in labor (Smith 1776), and these
paradigmatic assumptions strongly influence thinking on inventors and the process of invention. Because
technological progress is a cumulative problem-solving process, people typically rely upon prior
knowledge and expertise (Rosenberg 1982, Mokyr 2002). In order to first reach and then contribute to the
state of the art, an individual needs to accumulate knowledge about the existing prior art in the field as
well as field-specific learning and problem-solving skills (Cohen and Levinthal 1990). A person’s field-
specific knowledge and skills are the foundation on which the creative thinking process builds the new
(Simon 1983, 1996). Case studies highlight the importance of deep immersion in a field of expertise prior
to significant invention (Weisberg 1999). These assumptions suggest that scientists and engineers who
leave their technical field of expertise and start to explore a new field should create less valuable
inventions. Novices lack deep knowledge and skills in the new field and need time to reach the frontier of
knowledge (Chase and Simon 1973, Jones 2009). Assuming that inventors move to a better job match for
their extant skill set, they should create more valuable patents when they move voluntarily (Jovanovic
1979, Hoisl and Rassenfosse 2015).
Other scholars, mainly those who draw analogies to natural evolution (Darwin 1869), stress the
importance of exploring new knowledge for inventive output. John Vaught, inventor of the HP inkjet
Page 5
5
printer, described it thusly: “HP [Hewlett Packard] Labs was a wonderful place: I had to work in a single
field for only two or three years and then like magic it was a whole new field: a paradise of creativity.”
(Fleming 2002: 1065). Exposure to social, cognitive, and physical diversity provides the raw material for
recombinant novelty and helps to break a person’s overly constrained and stale perspectives (Campbell
1960, Simonton 1999). From a purely combinatorial perspective, and completely ignoring any other
influences on the first evolutionary stage of variation, a greater diversity in knowledge mechanically
affords more possibilities. Beyond the increased but purely combinatorial possibilities, many have argued
that exposure to new knowledge makes people more creative. While prior learning and existing
paradigms in a field help a person to interpret information and guide inventive search, they may also
cause learning myopia and constrain the direction of search (Allen and Marquis 1964, Ward 1995).
Scholars have labeled this cognitive process that causes extant expertise to block novel insights as
inflexibility of the information processing system, negative transfer, Einstellung, or mental block (e.g.,
Luchins and Luchins 1959, French and Sternberg 1989). Many have argued that creative professionals
should move between different fields of expertise and become generalists rather than specialists (e.g.,
French and Sternberg 1989: 183). By changing fields, they are freed from conventions and dogmas of a
particular field, catalyzed to adopt fresh perspectives and heuristics, and prompted to approach problems
with a helpful level of naïveté (Merton 1973: 518). The latter argumentation implies that inventors who
change fields should create more novel inventions.
Extensions of the evolutionary arguments resonate throughout the literature on science and
technology. For instance, Gilfillan (1935) and Kuhn (1970) argue that revolutionary discoveries are most
likely made by people who are either very young or new to the field. Novices are unbound by conventions
and dominant paradigms in the field and are hence more likely to adopt new and unconventional
perspectives and heuristics to solve a particular problem (Ben-David 1960, Merton 1973: 518, Gieryn and
Hirsh 1983). Established cognitive maps and technological paradigms embody clear prescriptions on
which search trajectory to follow (Dosi 1982). They become institutionalized into a field so that insiders
Page 6
6
continue to work in the same direction. People with field-specific expertise are thought to be more
reluctant to break with convention and depart from prior art, even while novel or “revolutionary” ideas
and inventions are thought to originate from breaking with the familiar trajectory (Kuhn 1970, Arts and
Veugelers 2014). Jeppesen and Lakhani (2010) illustrate that winning solutions to problem solving
contests are more likely provided by individuals with technical expertise that is “distant” from the
problem field. Azoulay et al. (2015) offer causal evidence that the death of a major figure in a field
occasions entry by field outsiders and that this entry renews the field.
We agree with many of these arguments and offer a simple model to resolve the controversy. We
provide support for the model with more nuanced measures of invention that explicitly distinguish value
from novelty. Although we do not differentiate empirically between architectural or component change,
we follow Henderson and Clark (1990) and conceptualize a new idea or invention as a combination of
previously uncombined ideas or components or the re-arrangement of previously used ideas or
components. This definition makes no comment on the novelty or value of that combination or re-
arrangement (Kaplan and Vakili 2014). In contrast, Amabile (1996) stipulates that creativity by definition
requires novelty and value. We agree these variables are crucial, however, we do not simultaneously
require both and allow them to vary within a new idea or invention. By our definition, an invention can be
valuable but not very novel, novel but not very valuable, or varying degrees of both. We assume that the
U.S. patent office saw a threshold of legal novelty that allowed the patent in the first place. This definition
avoids the normative and popular connotation that all inventions are intrinsically beneficial or valuable,
despite the empirical reality that most new ideas fail or have little value. While our evidence comes from
patent data and our prose often refers to inventors, these arguments should hold for other creative
professionals such as scientists or designers.
Our simple model is that inventors that change fields are exposed to new knowledge,
perspectives, and approaches. They will see new components and new ways to arrange new and old
components. This exposure increases the likelihood that the inventor will create more novel inventions,
Page 7
7
for a variety of reasons, including simple combinatorial opportunities, psychological refreshment,
unblocking, and re-arrangement of extant knowledge structures. Working in a new field will encourage
the inventor to question his or her assumptions, abstractions, creative goals, approaches, target customer
or user, success metrics, and prior procedures and solutions.
Field change and career exploration is difficult and time-consuming, however (Groysberg and
Lee 2009). It causes mistakes, errors, and delay, while the inventor climbs the learning curve in the new
field and connects their fresh ideas to their extant reservoir of experience (Rosenkopf and Almeida 2003).
It demands flexibility and the re-arrangement and re-coding of prior knowledge (French and Sternberg
1989), and these efforts take time and increase the rate and number of failed ideas. As a result of
unavoidable exploration, the likelihood of a successful – and valuable - invention decreases. Taken
together, the value of invention drops following a field change, however, the novelty increases.
Hypothesis 1: Inventors who do not change fields create more valuable inventions.
Hypothesis 2: Inventors who change fields create more novel inventions.
March’s original theory offers little insight to help the inventor avoid the downside of changing
fields while preserving the upside. To put it colloquially, is there any way the inventor who changes fields
can have their cake and eat it too? Recent work suggests the benefits and increasing popularity of
collaboration (Wuchty et al. 2007, Singh and Fleming 2010). Applying the arguments of this recent work
suggests that the negative effect of changing fields on the value of invention should be less pronounced if
the inventor collaborates with others in the new field. Likewise, the positive effect of changing fields on
the novelty of invention should be larger for collaborative inventors relative to individual inventors.
Inventors who collaborate in their new field should create more valuable inventions compared to
those who do not collaborate in their new field because collaboration can ease the “burden of knowledge”
and makes learning a new field less difficult and inefficient (Jones 2009). Rather than methodically
working through a great deal of new material from scratch in order to find what is useful and pertinent in
Page 8
8
a new field, or stumbling on their own, a collaborating inventor can simply ask their colleague. Such
inventors should also create more novel technologies because new collaborations can stimulate creativity
and new insights. A collaborator with depth in the new field can guide the novice and winnow his or her
worst ideas while keeping the best (Singh and Fleming 2010). To draw an evolutionary analogy,
collaborators can take advantage of their newcomer’s creativity in the variation stage, but they can also
filter the ideas that they recognize as previously tried and failed and unlikely to succeed in the selection
stage. This mechanism relies on more effective and efficient teaching, learning and communication, and
does not rely on moving extant collaborative capital (commonly known as “lift-outs”, see Groysberg and
Lee 2009). In other words, these arguments apply to working with an entirely new team of co-authors.
Hypothesis 3a: The negative effect of changing fields on the value of invention is weaker for
inventors who collaborate.
Hypothesis 3b: The positive effect of changing fields on the novelty of invention is stronger for
inventors who collaborate.
We expect similar benefits for inventors who draw upon published science in the new field,
because theories and prior empirical work enable more efficient search, and at the same time suggest
novel approaches. Awareness of published science facilitates prediction and decreases the need for
empirical iteration, experimentation, and learning (Roach and Cohen 2013). Science can illuminate dead
ends before they are explored empirically, through models that can predict a lack of performance or
publication of previous results that show an approach has already been tried unsuccessfully (Fleming and
Sorenson 2004). Theory can suggest causality and help an inventor predict how a new combination might
function. All of these mechanisms should increase the average value of inventions. Reliance on scientific
literature should also increase an inventor’s exposure to diversity and new ideas from other fields,
resulting in more novel inventions as well.
Hypothesis 4a: The negative effect of changing fields on the value of invention is weaker for
inventors who rely on published science.
Hypothesis 4b: The positive effect of changing fields on the novelty of invention is stronger for
inventors who rely on published science.
Page 9
9
METHODS
Research Design and Data
To study how changing fields affects subsequent output of an inventor, we use the U.S. patent database
for several reasons. First, patent data are publically available and provide a detailed insight into the output
of a large sample of inventors across different technical fields. The database allows us to construct
complete patenting careers (Li et al. 2014). Second, new metrics allow us to differentiate between value
and novelty. We develop a new measure, new to the patent corpus words, to proxy for the novelty of a
patent, and rely on the relatively unused measure of renewal fee payments to proxy for the value of a
patent. Third, given that the USPTO assigned patents into technology classes, the data allow us to identify
whether an inventor changed technical fields for each new patent they invent (see Jones 2009; as we rely
upon observing the same inventor across subsequent patents, our subjects need to patent at least twice).
Given a field change observed in a subsequent patent by the same inventor, we assess whether that second
patent is more or less likely to get renewed and the log of the number of new words it contains. Finally, a
patent lists an assignee that is typically the employer of the inventor. To identify different corporate
employers, we made use of the NBER assignee database containing harmonized names matched to firm
identifiers for Compustat firms. This enables control for organizational characteristics that influence an
inventor’s output in our fixed effects models, and to identify when an inventor moved firms (Marx et al.
2009) for our differences in differences models.
We use two different samples and research designs to test our predictions. First, we begin with
the full population of inventors and collect all patents assigned to firms but by design must restrict the
sample to inventors who have at least two patents assigned to the same firm. The advantage of this panel
setup is that we can use inventor-firm fixed effect models to control for unobserved heterogeneity among
inventors and firms, which arguably have a strong effect on the value and novelty of creative output. This
approach basically uses repeated observations on the same inventor within the same firm in order identify
Page 10
10
whether s/he creates more or less valuable – and more or less novel – patents when any subsequent patent
is categorized a new field. The sample includes 2,705,431 patents assigned to 396,336 unique inventors
and 46,880 unique firms, accounting for 396,336 unique inventor-firm pairs.
We complement these correlations with a natural experiment, based on the Michigan Antitrust
Reform Act (MARA), that causes exogenous variation in changing fields for the subset of inventors that
moved between firms in Michigan after 1985. The advantage of the natural experiment is in strengthening
causal inference; the disadvantage is in failing to control for unobserved heterogeneity among inventors
and firms (though we match inventors very closely on a number of characteristics). Moreover, the natural
experiment only affected a subset of inventors, i.e. inventors moving between firms in Michigan after
1985, which might be different from non-Michigan or non-mobile inventors, and therefore not
representative of the full population (though in robustness analyses we find no significant differences
between any of the sub-populations). Consistent results across these complementary designs strengthen
our confidence in the underlying model of changing fields and creative output.
Measures
Outcome variables.
To assess patent value, we calculate renewals as the ln of one plus the number of times a patent is
renewed by its owner. In order to remain valid, patent renewal fees must be paid to the USPTO after 3.5,
7.5, and 11.5 years.1 Patents that are renewed are, on average, more valuable to their owner (Schankerman
and Pakes 1986). As an alternative measure of patent value, we count the number of forward citations
received within 10 years (Harhoff et al. 1999). However, this measure is noisy (Bessen 2008), correlates
with examiner bias (Alcacer and Gittleman 2006), knowledge diffusion (Thompson and Fox-Kean 2005),
and the size of the inventive team (Wuchty et al. 2007). While we find consistent results with renewals
and forward citations, we believe renewals provide a cleaner measure of our theoretical construct.
1 For more information, see http://www.uspto.gov/learning-and-resources/fees-and-payment/uspto-fee-schedule.
28% of the patents in our sample are not renewed 4 years after grant while 42% are renewed three times (the
maximum).
Page 11
11
We assess patent novelty by counting the number of new words in a patent that appear for the first
time in the entire US patent corpus since 1975. To calculate the measure, we tokenized all words in the
title, abstract, and claims. No stop words were removed nor were spelling errors identified, though
numbers and hyphens were removed, and 1975-1979 establishes the baseline. We calculate the measure
as the ln of one plus the number of new words. As a robustness check, we also use the number of
backward citations to technical prior art made by a patent. Patents with fewer backward citations rely less
on technical prior art and are typically considered to be more novel (Ahuja and Lampert 2001). We find
consistent results for both measures.
Figure 1 illustrates the number of new words that appear each year in the corpus weighted by
their future reuse, broken out by the six broad NBER technology categories (Hall et al. 2001). The spikes
are identified as partially caused by the words listed. Figure 2 illustrates the 20 most reused novel words
over each five-year period from 1980 to 2014, colored by the six categories. Both figures demonstrate a
secular decline, caused by a decreasing time at risk of reuse. The measure includes typographical errors
because it is difficult to automatically assess whether a word is a mistake – or perhaps a novel technology.
We do not rely on topic modeling or other methods that seek to identify common ideas because they are
biased in favor of a technology’s success. Most importantly, failed novelty would be missed by a topic
modeling approach. Figure 1 is for illustrative purposes only; we do not rely on the reuse of novel words
to assess value because we want to measure value independent from novelty.
--------------------------
Insert Figures 1 and 2 here
--------------------------
Independent variables.
Changing fields. We retrieve the three-digit technology classes of all prior patents of an inventor
and identify whether there is any overlap between the three-digit technology classes of the subsequent
patent and the three-digit technology classes linked to all prior patents of the same inventor. We rely on
all classes assigned to a patent rather than just the primary class. Changing fields is a binary indicator that
Page 12
12
equals one in the absence of any overlapping class between all prior patents and the subsequent patent.
Collaboration is a binary indicator that equals one if the subsequent patent lists more than one
inventor and is used to test whether the effect of changing fields differs for inventors with co-authors in
the new field.
Science is a binary indicator that equals one if the focal patent cites the non-patent literature. Such
citations go mainly to peer reviewed scientific publications (see Fleming and Sorenson 2004) and indicate
an awareness of the inventor on the cited articles (Roach and Cohen 2013).
Control variables.
We include control variables for an inventor’s number of prior patents, technical specialization
(Herfindahl concentration index based on the three-digit technology classes of all prior patents of the
inventor), number of prior collaborations (number of distinct co-authors linked to all prior patents of the
inventor), a binary indicator move that is equal to one for the first patent of an inventor with a new firm as
assignee (used for the MARA experiment), and a binary indicator for whether the inventor previously
moved between employers (prior move). In line with prior research, an inventor is assumed to move in
case different assignees appear on two successive patents of the same inventor. In case inventors move
back and forth between firms, we only treat the first patent with a new firm as a move because the patent
with a former employer might be filed after the inventor already left. More productive inventors,
inventors who are technology generalists rather than specialists, and inventors who formerly collaborated
with a larger number of co-inventors, or who switched between employers, might be more or less inclined
to change fields. To control for the fact that inventors in the beginning or near the end of their career
might be more or less likely to change fields, we include the number of days since the first patent of the
inventor was filed (days since first patent). To control for the fact an inventor who more recently patented
in a field might be more or less likely to change fields, we include the number of days since the previous
patent of the inventor was filed (days since last patent). To control for firm size, we include number of
prior patents firm as the number of patents assigned to the firm listed as assignee. Finally, we include
Page 13
13
number of classes as the patent’s number of three-digit technology classes and number of subclasses.
Three-digit technology class and year indicators control for secular trends in fields. Due to the skew of
count variables, we use their logarithmic transformation after adding one for variables with zero values.
Table 1 presents a description and summary statistics for the full sample of inventors with at least one
prior patent and at least two patents assigned to the same firm for observation period 1975-2002.
--------------------------
Insert Table 1 here
--------------------------
RESULTS
Inventor and Firm Fixed Effects Model Results
Table 2 illustrates the firm-inventor fixed effects models with and without interaction terms. We proposed
that inventors who explore a new field will lack field-specific knowledge and skills, such that the value of
their output (as measured by renewals and future citations) will decrease. Without interaction terms,
model 1 illustrates that changing fields significantly decreases the number of renewals by 1.2%2; model 3
illustrates a decrease in future prior art citations by 1.1%. We also proposed that inventors who explore a
new field will gain exposure to new knowledge and perspectives, such that the novelty of their output will
increase (as measured by new words and decreased backward citations). Also without interaction terms
and as illustrated respectively in models 5 and 7, changing fields significantly increases the number of
new words by 0.9% and decreases the number of backwards prior art citations by 2.7%.
--------------------------
Insert Table 2 here
--------------------------
The preferred models include interaction terms. Considering the value models first, hypothesis 3a
proposed that the learning challenge of entering a new field can be eased by collaboration. As illustrated
2 e(−0.0117) − 1 = −1.2%. Because all outcome variables capturing value and novelty are calculated as the
logarithmic transformation of count measures after adding 1, and because changing fields, and its interaction with
collaboration and science, are binary measures, the marginal effects are calculated as e(𝑒𝑠𝑡𝑖𝑚𝑎𝑡𝑒𝑑 𝑐𝑜𝑒𝑓𝑓𝑖𝑐𝑖𝑒𝑛𝑡) − 1.
Page 14
14
respectively in the full models 2 and 4, the predicted first order effect of changing fields strengthens,
indicating a reduction in renewals and forward citations of 1.8% and 5.7%. The interaction between
changing fields and collaboration has the predicted opposite and significant effect on value, however, and
increases the number of renewals and forward citations by 0.6% and 3.9%. Thus, the decrease in
renewals from changing a field can be partially recovered by collaborating in the new field. Hypothesis
4a proposed that drawing upon science should have a similar effect. In addition to the 1.8% and 5.7%
reduction previously noted, the interaction between changing fields and science also has a positive effect
on value, increasing the number of renewals and forward citations by 0.2% and 4.6% (the p value for the
interaction term in the renewal model is 0.14 and thus does not reach significance). Collaboration and
science together ameliorate but do not fully overcome the challenge of learning in the renewal models,
but more than compensate for the penalty in the future citation models.
Turning to the novelty predictions, hypotheses 3b and 4b proposed that collaboration and science
enhance the creative upside of field change. While these hypotheses are generally supported, the results
are nuanced in the interaction models. In model 6 the first order effect of field change flips, from positive
(more new words) to negative (fewer new words). This first order effect of field change now indicates a
decrease in new words of 1.2%, however, it is balanced by a positive 1.0% and 3.7% interaction effect
with collaboration and science, respectively (all effects are significant). It appears that an inventor who
changes new fields needs co-authors and science to take full advantage of the creative upside. The first
order and interaction terms for the backward citation models follow the basic predictions but the
collaboration result is nowhere near significance; supporting the basic prediction, changing a field
correlates with patents that make 0.6% fewer backward citations and using science subtracts an additional
6.2% from this effect.
While the effects of changing fields appear small, consider that the unit of analysis is a single
patent inventor combination, and that the models include both inventor, firm, field, and year fixed effects.
At a more aggregate level, for instance at the level of an R&D department or a firm, the economic
Page 15
15
significance of a 1% to 2% change in the novelty or value of each patent is arguably high. The effect is
also larger for collaborative versus individual inventors, for those who rely on the scientific literature -
and for inventors subjected to a natural experiment, to which we now turn.
A Natural Experiment to Strengthen Causal Inference
The Michigan Antitrust Reform Act.
Any archival study that purports to link a change in fields with creative output must confront
severe endogeneity issues (Hoisl 2007). As perhaps the most obvious problem, a person might choose to
change fields in order to become more creative – and had already identified a fruitful opportunity. As a
further example, more creative people might cross boundaries between fields more successfully due to
their diverse knowledge base and cognitive flexibility. Alternatively, less productive people might fail to
find continuous employment in their field of expertise so that they are forced to change fields. Finally,
due to the increasing burden of knowledge on more recent generations, technical professionals have
become increasingly specialized so that there is a decreasing tendency to change fields over time (Jones
2009). To address these issues, the study design must provide an exogenous influence upon changing
fields, consider similarly productive and creative subjects, and control for time, field, and other
confounders. We address each of these in turn.
We exploit a natural experiment related to the inadvertent reversal of non-compete enforcement
law in Michigan as an exogenous shift in the likelihood that an inventor who changes employers also
changes technical fields. Using interviews of 52 inventors and a survey of 1,029 engineers, Marx (2011)
established that ex-employees subject to non-competes are more likely to leave their field of expertise in
order to avoid a potential lawsuit. A non-compete agreement prevents an ex-employee from working for
competitors in the same field, and hence exploiting their field-specific knowledge and expertise. As such,
it exogenously triggers technical professionals to explore a new field. In 1985, the Michigan Antitrust
Reform Act (MARA) was passed with the intention of harmonizing state law with the uniform state
Page 16
16
antitrust act (Bullard 1985). However, while passing MARA, legislators unintentionally revoked statute
445.761, which prohibited the enforcement of non-compete agreements in Michigan (Alterman 1985).
After the passing of MARA in 1985, employers in Michigan obtained the legal means to prevent their ex-
employees from working in the same technical field at a different firm (Marx et al. 2009). As such, the
Michigan experiment provided an exogenous pressure on inventors to change fields after they left their
former employer.
The time at which an inventor moves between firms (pre- or post-MARA) as well as his or her
state of residence (Michigan versus non-Michigan) determine the likelihood that an inventor changes
fields. Our identification relies on the fact that only mobile inventors residing in Michigan after the
passing of MARA are affected by the exogenous change in non-compete enforcement; Michigan
inventors before MARA and inventors from other states before and after MARA are not affected by the
policy change. Therefore, we can combine differences in changing fields between inventors from
different states (Michigan versus non-Michigan) with differences between cohorts induced by the timing
of MARA (pre- versus post-MARA). If MARA exogenously increased the likelihood that mobile
inventors in Michigan changed fields, the interaction between binary indicators for Michigan residence
and post-MARA should have a positive significant effect on the likelihood of changing fields. This
difference-in-differences (DD) can be used an instrument for changing fields (Duflo 2001). The DD
specification controls for overall time trends in changing fields (across all states) and for time invariant
unobserved differences between Michigan and non-Michigan inventors (Angrist and Pischke 2008).
Furthermore, regression DD allows us to include additional inventor and field characteristics affecting the
likelihood of changing fields as controls. The main assumption is that in the absence of MARA, the trend
in changing fields would not have been systematically different between Michigan and non-Michigan
mobile inventors.
Sample Selection.
In line with prior research, we select all U.S. inventors who patented in Michigan or in another
Page 17
17
non-enforcing state before the passing of MARA in 1985, including Alaska, California, Connecticut,
Minnesota, Montana, Nevada, North Dakota, Oklahoma, Washington, and West Virginia (Malsberger
1996, Marx et al. 2009, 2015). Inventors who did not patent in a non-enforcing state or only did so after
the passing of MARA are excluded, to ensure that MARA did not affect sample selection. We track all
subsequent patents linked to this set of inventors and assigned to a firm, and identify each move between
firms (again, the design relies upon inventors patenting at least twice). Only intrastate moves are taken
into account because inventors can emigrate from Michigan to a non-enforcing state to avoid a lawsuit
(Marx et al. 2015). Finally, we restrict the analysis to the 1975-1995 period, i.e. 10 years before and after
the passing of MARA. Notice that we collect all patents, both before and after MARA and in and out of
Michigan, for the states listed above. This results in the full sample of patents by inventors at risk of
moving between firms both in Michigan and elsewhere, before and after MARA. The resulting dataset
spans 21 years and consists of 29,956 inventors and 162,586 patents, of which 13,723 patents represent a
move, i.e. the first subsequent patent of an inventor after moving to a new firm. The final analysis is
restricted to these mobile inventors because the exogenous pressure to change fields due to MARA only
affects inventors who move between firms. Our sample selection strategy could result in bias because: (1)
the natural experiment affects the selection of treatment subjects, i.e. mobile inventors in Michigan post-
MARA, (2) the treatment and control subjects were already different before the natural experiment,
potentially confounding the results. We address each of these concerns in turn before presenting the
results on the effect of changing fields on inventive output.
Sample selection bias due to MARA.
A first concern is that the natural experiment influenced the selection of inventors into the study.
MARA could have affected the type of inventor who moves between firms in Michigan (our treatment
group), arguably because they know that they have to change fields. As one example of potential bias,
more productive inventors probably have greater bargaining power, to stay or go, and have multiple job
opportunities inside or outside the same firm. This could influence their decision to move, the decision of
Page 18
18
the recruiting firm to hire them, and to be subsequently observed in our dataset. To address this, we
compare inventor characteristics of the full population of both mobile and non-mobile inventors, both pre-
and post-MARA, both in Michigan and other states.
To assess whether our treatment group is different we calculate binary indicators of Michigan
residence, a Postmara application date of 1986 or later, and whether a subsequent patent is assigned to a
new firm (and thus indicates a Move). For dependent variables, we calculate all the study dependent
variables - average number of renewals (average number of times the prior patents of the inventor were
renewed), average number of forward citations (average number of forward citations received within ten
years for all prior patents of the inventor), average number of new words (among all prior patents of the
inventor), average number of backward citations (among all prior patents of the inventor) – and
additional variables including number of prior patents, technical specialization (number of distinct two-
digit NBER subcategories linked to prior patents of the inventor, see Hall et al. 2001), number of prior
collaborations (number of distinct co-inventors linked to prior patents of the inventor), and number of
prior moves (number of times the inventor previously moved between employers). Table 3 provides
summary statistics for the population at risk of moving, both before and after MARA, and in and out of
Michigan.
The full interaction between the three binary indicators - Michigan, Postmara, and Move -
identifies any dissimilarity between different subsets of the population. Table 4 illustrates no significant
interaction for any of the inventor characteristics. The fact that the treatment subjects are not significantly
different in any of the characteristics illustrates that it is unlikely that MARA influenced selection of the
treatment subjects, and that our results suffer from sample selection bias.
--------------------------
Insert Tables 3 and 4 here
--------------------------
Page 19
19
Coarsened Exact Matching.
In an experiment, one ideally observes two identical groups of subjects over time whereby one
group is affected by an exogenous treatment at a particular point in time. To decrease the chance that pre-
treatment differences between treated and control subjects confound the results, we construct a matched
subsample of inventors using Coarsened Exact Matching (CEM). CEM is a nonparametric multivariate
matching method that reduces the covariate imbalance between treated and control groups (Iacus et al.
2009, 2011). The objective of CEM is to improve the estimation of causal effects by reducing imbalance,
model dependence and statistical bias. To improve the pre-treatment similarity between treated and
control subjects, we match mobile Michigan inventors to mobile inventors from other states on the
following pre-MARA characteristics: (1) industry3 (chemical, computer and communications, drugs and
medical, electrical and electronic, mechanical, others), (2) degree of technical specialization (number of
distinct NBER subcategories linked to all prior patents of the inventor), (3) number of patents, (4) total
number of received citations (by all patents of the inventor filed before MARA), (5) whether the inventor
previously moved between employers, and (6) whether the inventor works alone or collaborates (indicator
that is one in case there are no co-inventers on prior patens of the inventor). We relied on CEM
coarsening algorithm to develop coarsened strata. Jointly applying these 6 criteria, we obtain 3,610 strata.
Only Michigan and non-Michigan mobile inventors for which there is at least one control respectively
treatment inventor in the same stratum are retained. The resulting sample consists of 6,246 patents (46%
of the original sample of patents representing a move) linked to 4,686 unique inventors (51% of the
original sample). The large majority of dropped patents (92%) belong to the control group of non-
Michigan mobile inventors who do not provide a proper control for the mobile Michigan inventors. In the
analysis, the matched patents of Michigan inventors get a weight of 1 and the matched control patents get
a weight equal to [# matched control patents in the stratum
# matched treated patents in the stratum 𝑥
# treated patents in the stratum
# control patents in the stratum].
3 To determine industry of employment, we use the main three-digit technology class of the last patent of the
inventor filed before 1985, and rely on the NBER classification (Hall et al. 2001).
Page 20
20
Table 5 provides summary statistics for the sample of mobile inventors that will be used in the
analysis. We include two additional control variables that were not used in the inventor-firm fixed effects
analysis. First, we include a binary indicator for inventor residence in a non-enforcing state. Although all
subjects had at least one prior patent before MARA in a non-enforcing state, they might have moved to an
enforcing state afterwards. The likelihood of moving between firms and changing fields will be different
for enforcing versus non-enforcing states (Marx et al. 2009). Second, because the turbulence in the auto
industry in Michigan during the observed period (both pre and post-MARA) might affect our results, we
include auto industry as a binary indicator for auto patents (as identified by Marx et al. 2009).
--------------------------
Insert Table 5 here
--------------------------
MARA Differences in Differences Model Results
Figure 3 illustrates the differential mobility trends that enable using MARA as a natural
experiment, displaying the average annual rate of changing fields, calculated by dividing the number of
patents indicating a field change by the total number of patents. The two-year moving average is
displayed in order to smooth out annual fluctuations and highlight the long-term trends. In line with prior
research, we find an overall decreasing trend in changing fields over time (oft attributed to the increasing
burden of knowledge that has shifted inventors to become more specialized over time, see Jones 2009).
Though the rate of changing fields is somewhat lower for Michigan inventors in the years preceding
MARA, the passing of MARA in 1985 predates an increase in the rate at which mobile inventors in
Michigan switched fields. Ten years after MARA, mobile inventors in Michigan are still more likely to
switch fields while they were less likely to switch pre-MARA.
-----------------------------------
Insert Figure 3 here
-----------------------------------
Table 6 estimates Figure 3 and compares the average rate of changing fields for mobile inventors
in Michigan versus mobile inventors from other states, both pre- and post-MARA. The average rate of
Page 21
21
changing fields decreased slightly in Michigan post-MARA from 0.53 to 0.52. Yet, the average rate of
switching decreased sharply in the other states from 0.60 to 0.48. The difference in differences subtracts
the difference in the comparison states from the difference in Michigan to determine the net effect of
MARA. By doing so, DD controls for the overall declining trend in switching. The treatment effect of
MARA is 0.10, representing a relative increase of 19% compared to the average pre-MARA rate of
changing fields in Michigan.
--------------------------
Insert Table 6 here
--------------------------
To estimate the effect of changing fields on the novelty and value of invention, we use a two-
stage least square model (2SLS). Because the endogenous variable is binary, we use the approach
suggested by Angrist (2001) and Angrist and Pischke (2008: 143). For a recent application of the
approach, see Galasso and Schankerman (2015). First, we estimate the likelihood of changing fields with
a logit model in a difference-in-differences configuration. We include the interaction between Michigan
and postmara as an exogenous variable capturing the causal effect of the policy reversal. Using logit
instead of OLS in the first stage results in a better fit. Second, we calculate the fitted probabilities of
changing fields and use these nonlinear fitted values bound between 0 and 1 as an instrument for
changing fields in the 2SLS models. Using non-linear fitted values as an instrument is the same as
plugging in fitted values when the first stage is estimated by OLS, but the advantage is a better predictor
of changing fields in the first stage (Angrist and Pischke 2008). The 2SLS model uses a single instrument
resulting in just-identified estimates. Standard errors are clustered at the inventor level to control for
repeated observations. Table 7 shows the first stage predicting the likelihood to change fields. The
coefficient of Michigan*Postmara in both columns 2 and 4 implies that MARA increased the likelihood
of changing fields by 10% in absolute terms, in addition to the pre-MARA baseline of changing fields in
Michigan of 53%. The F statistic for the first stage regression is consistently above 10, thus passing
conventional tests of instrument strength (Stock and Yogo 2005).
Page 22
22
--------------------------
Insert Table 7 here
--------------------------
Table 8 displays the second stage of the 2SLS models. It illustrates consistent and predicted
results for the first order predictions across all linear and interaction models: a 34% and 35% decrease in
renewals, a 37%, and 46% decrease in future citations, a 52% and 57% increase in new words, and a 32%
and 48% decrease in backward citations. The results are much stronger compared to the results of the
inventor-firm fixed effects models which did not correct for the potential endogeneity of changing fields.
They are also similar and close in magnitude to those reported by Hoisl and Rassenfosse (2015), who
measured inventor mobility with a survey and patent value using forward citations.
Interactions with collaboration and science are insignificant with the preferred measures of
renewals and new words (models 2 and 6), and insignificant for the collaboration interaction in the future
cites model 4, significant and in the predicted direction for the science interaction in the future and
backward cites models 4 and 8, and significant in the opposite direction for the collaboration interaction
in the backwards cites model 8. We hesitate to draw strong inferences from these interactions, as there
remain only 109 patents of Michigan inventors who move between firms post-MARA, change fields, and
do not collaborate in the new field and 62 patents of Michigan inventors who move between firms post-
MARA, change fields, and rely on published science.
--------------------------
Insert Table 8 here
--------------------------
DISCUSSION
This work makes three main contributions. First, it integrates opposite predictions on the relationship
between field-specific expertise and inventive output by offering more nuanced measures of invention
that distinguish between value and novelty. Second, it provides evidence for the impact of changing fields
on inventive output, combining inventor-firm fixed effects models on a large population of inventors with
Page 23
23
differences in differences models that exploit a change in labor law as a natural experiment. The models
and new measures together illustrate how changing fields both decreases the value of inventive output and
increases the novelty of that output. Third, the work offers potential ways that inventors and firms might
decrease the negative impact of changing fields and increase the positive impact, through collaboration
and reliance on published science in the new field. Stepping back from the immediate contributions, the
work also provides some of the first well-identified evidence for the predictions of March’s 1991 theory,
and an exogenous and arguably random match of technical professionals’ skillsets to new jobs.
While the results are consistent for the main predictions, the interactions are inconsistent in
MARA experiment models. The results also rely upon inventor disambiguation and inventors with at
least two patents. The natural experiment assumes that the change in labor law did not change inventors’
propensity to move; while three interactions across a larger population of inventors did not demonstrate
any significant differences between movers and non-movers and Michigan and non-Michigan inventors, it
remains possible that the labor law affected treated subjects differently. Finally, while forward and
backward citations are well used in the innovation literature, the renewal and new word measure are
relatively new.
Our findings have implications for inventors, their firms, and policymakers. First, and in contrast
to prior research that ignores the upside of exploitation, these results illustrate the pitfalls of exploration
for individuals and in turn, for the firms that hire those individuals (Audia and Goncalo 2007, Groysberg
and Lee 2009, Hoisl and Rassenfosse 2015). Though exploration connotes bravery, discovery, and
success, reality often means failure, especially in the short term. The current results are consistent with
other quasi-experimental work that illustrates performance benefits to exploitation at the firm level
(Balsmeier, Fleming, and Manso 2016). This is not a new idea and indeed, is a central tenet of March’s
1991 arguments.
Page 24
24
Second, we illustrate a practical and legal challenge for technical professionals and the firms that
employ them. Firms want to find professionals with a particular set of skills and expertise and that
expertise has typically been gained at a prior employer. If the firm operates in a region that enforces non-
competes, they will more often be forced to hire someone with less pertinent skills and retrain them. The
explorative inventor and his or her firm will suffer decreased value of output (Groysberg and Lee 2009
make similar arguments for securities analysts and investment banks). This may not be entirely bad, as the
more technically distant candidate should then create greater novelty. Furthermore, embedding that
candidate within networks of collaborators or hiring someone with facility in using the published
scientific literature can mitigate switching problems. One implication of the current work is that scientists
who collaborate or who can access the literature may suffer fewer losses after switching to a new field
than more empirical and assumedly more insular inventors.
Third, and in nuanced contradiction to Silicon Valley’s reputation as a hotbed of invention, this
work implies that regions that enforce non-competes invent more novel patents. Conti (2014) makes a
similar argument, though with different mechanisms, namely, firms undertake riskier research and
development because of decreased outbound mobility and subsequent knowledge leakage. Using changes
in Texas and Florida non-compete law, he shows a flattening of the patent citation distribution
(corresponding to riskier and hence more breakthrough and failed patents) and increased entry of firms
into new technology classes. Independent of such resource allocation decisions, these results illustrate
how two mobility mechanisms could also cause regions that enforce non-competes to invent more novel
patents. First, as illustrated here, inventors move further in technical distance from their old expertise
when changing jobs; this greater movement results in more novel patents. Second, if inventors’ outside
options become more limited, they might be more likely to change technical fields within their current
employer as well. Indeed, in unreported regressions, we found a positive though not always significant
impact of MARA on intra-firm field changes as well. The downside is less valuable output, as illustrated
here. If these mechanisms aggregate to the regional level, then Silicon Valley’s advantage may derive not
Page 25
25
from its ability to invent new technologies, as much as to exploit and refine already identified and
productive trajectories or promising breakthroughs. This line of reasoning implies multiple questions, for
example, are regions that enforce non-competes doing greater exploration, and in effect, subsidizing
search for regions that proscribe their enforcement? If so, do we see a flow of promising exploration
breakthroughs, in ideas and/or people, from enforcing to non-enforcing regions? Marx et al. (2015)
demonstrate that better inventors (as measured by citations to their patents) are more likely to emigrate to
non-enforcing states, following MARA. Are these inventors carrying more novel and original knowledge
as well?
The metrics developed here warrant further application and refinement. The use of renewals as a
measure of value presents face validity; firms should be less likely to pay maintenance fees on patents
that have no value. Yet, very few papers use renewals as an outcome measure and typically rely upon the
easily and widely available measure of forward citations. The new word measure also offers opportunity
for future research. By using the text of patent documents to measure novelty, one can avoid the use of
citations, which correlate positively with value, are subject to temporal changes, and suffer from examiner
bias. These are new and less characterized measures, for example, the new word measure is
fundamentally challenged in differentiating typos from technical novelty (dictionaries are not technical
enough to identify errors). The new word measure corresponds most closely to a new component rather
than a combination of new components, though many new words are hyphenated combinations of old
words. Topic modeling or tokenization approaches are unfortunately unsuitable, as they would bias the
measure towards identification of popular or successful topics. Ideally, the measure captures all novelty,
both failed and successful.
Counting the future uses of a new word (as illustrated in aggregate in Figure 1 and listed in Figure
2) also offers an analogous measure to future prior art citations, though the measure remains conditional
on a patent containing at least one new word. A new word that gets reused many times should be
considered a breakthrough, similar to a highly cited patent. Changing fields may or may not increase the
change of a breakthrough; both predictions can be motivated. On the one hand, when a field-experienced
Page 26
26
inventor creates novelty, one might expect that novelty to have greater future use on average, since a
field-experienced inventor can probably winnow failures more effectively. On the other hand, when a
field-changing inventor creates novelty, one might expect greater upside and fertility and less chance of
incremental improvement. While the MARA data are too thin to support such models, fixed effects
models (not shown) indicate a significant benefit for the inventor having changed their field. The
inclusion of collaboration and science interactions illustrates strong and significant interactions but also
the loss of the first order effect. There may therefore exist multiple and conditional paths to successful
exploration; future work should develop and test these ideas in a new context with stronger identification.
CONCLUSION
Inventive search is risky and the optimal strategy uncertain; inventors face a fundamental tradeoff
between local search and exploitation vs. distant search and exploration (March 1991). Inventors cannot
avoid this fundamental conundrum; every time they create they choose implicitly or explicitly and - to
some degree - to either work within more familiar fields or learn new approaches. This endogenous
choice thus causes first order methodological problems in studying the impact of search strategy on
inventive output. We approached this problem by considering within firm and inventor fixed effects
models and an unforeseen labor law reform that nudged inventors to change their fields when moving to a
new firm. We further exploited difference in differences and matching approaches that enabled close
comparison of mobile inventors that were and were not exogenously forced to change fields.
Armed with these methodological tools, we fashioned an informal model from two seemingly
conflicting perspectives. One perspective begins with the returns of specialization and accumulated
expertise upon the value of inventive output, and implies greater creativity from not changing fields.
Another perspective begins with the value of knowledge diversity and recombinant fecundity, and implies
the opposite prediction that greater creativity from changing fields. We believe both of these arguments
have merit and offered an empirical resolution through more nuanced measures of invention,
Page 27
27
distinguishing between the value and novelty of creativity. Consistent with our informal model, inventors
who do not change fields invent more valuable patents, as measured by renewal and citation; inventors
who change fields invent more novel patents, as measured by new words and fewer citations to prior art.
Furthermore, we illustrated how this fundamental tradeoff between value and novelty can be partially
ameliorated through collaboration in the new field and the application of scientific knowledge to the
technical challenge. Collaboration and reliance on science softens the decline in value and increases
novelty, though these interactions were not consistently significant across the natural experiment models.
The influence of March’s seminal paper can be observed by over 16,000 Google Scholar
citations, mainly in the organizations literature but increasingly in economics, finance, and operations.
Surprisingly, however, this follow on work provides little causal evidence. Though one might characterize
our contribution as an empirical exploitation of a popular idea, we hope that it opens up explorative
opportunity for future work.
Page 28
28
REFERENCES
Ahuja, G. & Lampert, C. M. 2001. Entrepreneurship in the large corporation: A longitudinal study of how
established firms create breakthrough inventions. Strategic Management Journal, 22: 521-543.
Alcacer, J., & Gittelman, M. 2006. Patent citations as a measure of knowledge flows: The influence of
examiner citations. The Review of Economics and Statistics, 88(4), 774-779.
Allen, T. J., Marquis, D. G. 1964. Positive and negative biasing sets: The effects of prior experience on
research performance. IEEE Transactions on Engineering Management: 158-161.
Alterman, I. 1985. New era for covenants not to compete. Michigan Bar Journal, March: 258–259.
Amabile, T. M. 1996. Creativity in context. Boulder, CO: Westview Press.
Amabile, T. M. 2013. Componential theory of creativity. In E. H. Kessler (Ed.), Encyclopedia of
Management Theory, Sage Publications.
Angrist, J. D. 2001. Estimation of Limited Dependent Variable Models With Dummy Endogenous
Regressors. Journal of Business & Economic Statistics, 19(1): 2-28.
Angrist, J. D., & Pischke, J. S. 2008. Mostly harmless econometrics: An empiricist's companion.
Princeton University Press.
Arts, S., & Veugelers, R. 2015. Technology familiarity, recombinant novelty, and breakthrough
invention. Industrial and Corporate Change, 24 (6): 1215-1246.
Audia, P. G., & Goncalo, J. A. 2007. Past success and creativity over time: A study of inventors in the
hard disk drive industry. Management Science, 53(1): 1-15.
Azoulay, P., Fons-Rosen, C. Graff Zivin J. 2015. “Does Science Advance One Funeral at a Time?”
Working paper: http://pazoulay.scripts.mit.edu/docs/plancks_principle.pdf.
Balsmeier, Lueck, S., Li, G., and L. Fleming 2015. Automated Disambiguations of the US Patent
Database, Working paper, Fung Institute for Engineering Leadership.
Balsmeier, Fleming, and Manso 2016. Independent Boards and Innovation. Forthcoming, Journal of
Financial Economics.
Ben-David, J. 1960. Roles and innovation in medicine. The American Jour of Sociology, 65(6): 557-558.
Bernstein, S. 2015. Does Going Public Affect Innovation?. The Journal of Finance, 70: 1365–1403.
doi:10.1111/jofi.12275.
Bessen, J. 2008. The value of US patents by owner and patent characteristics. Research Policy, 37(5):
932-945.
Bullard, P. 1985. Michigan Antitrust Reform Act: House Bill 4993, third analysis. M.S.A. Sec.: 1–4.
Campbell, D. 1960. Blind variation and selective retention in creative thought as in other knowledge
processes. Psychological Review, 67: 380-400.
Chase, W. G., & Simon, H. A. (1973). Perception in chess. Cognitive psychology, 4(1): 55-81.
Cohen, W. M., & Levinthal, D. A. 1990. Absorptive capacity: A new perspective on learning and
innovation. Administrative Science Quarterly, 35(1): 128-152.
Conti, R. 2014. Do non-competition agreements lead firms to pursue risky R&D projects? Strategic
Management Journal, 35(14): 1230–1248.
Darwin, C. R. 1869. On the origin of species by means of natural selection, or the preservation of
favoured races in the struggle for life. London: John Murray. 5th edition.
Dosi, G. 1982. Technological paradigms and technological trajectories: A suggested interpretation of the
determinants and directions of technical change. Research Policy, 11: 147-162.
Duflo, E. 2001. Schooling and labor market consequences of school construction in Indonesia: evidence
from an unusual policy experiment. American Economic Review, 91(4): 795-813.
Fleming, L. 2002. Finding the organizational sources of technological breakthroughs: the story of Hewlett
Packard's thermal inkjet. Industrial and Corporate Change, 11 (5): 1059-1084.
Fleming, L. & Sorenson, O. 2004. Science as a map in technological search. Strategic Management
Journal, 25(8), 909-928.
Page 29
29
Frensch, P. A., & Sternberg, R. J. 1989. Expertise and intelligent thinking: When is it worse to know
better? In R. J. Sternberg (Ed.), Advances in the psychology of human intelligence, 5: 157-188.
Hillside, NJ: Erlbaum.
Galasso, A., & Schankerman, M. 2015. Patents and cumulative innovation: Causal evidence from the
courts. The Quarterly Journal of Economics, 130(1), 317-369.
Gilfillan, S. C. 1935. The sociology of invention. Cambridge, MA: MIT Press.
Gieryn, T. F., & Hirsh, R. F. 1983. Marginality and innovation in science. Social Studies of Science,
13(1): 87-106.
Groysberg, B. and L. Lee 2009. Hiring Stars and Their Colleagues: Exploration and Exploitation in
Professional Service Firms. Organization Science 20(4): 740-758.
Hall, B., Jaffe, A., & Trajtenberg, M. (2001). The NBER patent citations data file: Lessons, insights and
methodological tools. NBER working paper no. 8498.
Harhoff, D., Narin, F., Scherer, F. M., & Vopel, K. 1999. Citation frequency and the value of patented
inventions. The Review of Economics and Statistics, 81(3): 511-515.
Hayes, J. R. 1989. Cognitive processes in creativity. In J. A. Glover, R. R. Ronning, & C. R. Reynolds
(Eds.), Handbook of creativity: 135-145. New York: Plemun.
Henderson, R. M., & Clark, K. B. 1990. Architectural innovation: The reconfiguration of existing product
technologies and the failure of established firms. Administrative Science Quarterly, 9-30.
Hoisl, K. 2007. Tracing mobile inventors – The causality between inventor mobility and inventor
productivity. Research Policy, 36: 619-636.
Hoisl, K. and G. Rassenfosse 2015. Knowledge Fit and Productivity Gains from Employee Mobility.
Working Paper, Max Planck Institute for Innovation and Competition.
Iacus, S. M., King, G., & Porro, G. 2009. CEM: Software for coarsened exact matching. Journal of
Statistical Software, 30(9).
Iacus, S. M., King, G., & Porro, G. 2011. Causal inference without balance checking: Coarsened exact
matching. Political Analysis, 20(1): 1-24.
Jeppesen, L. B., & Lakhani, K. R. 2010. Marginality and problem-solving effectiveness in broadcast
search. Organization science, 21(5): 1016-1033.
Jones, B. F. 2009. The burden of knowledge and the death of the renaissance man: Is innovation getting
harder? Review of Economic Studies, 76(1): 283-317.
Jovanovic, B. 1979. Job Matching and the Theory of Turnover, Journal of Political Economy, 87(5):
972-990.
Kuhn, T.S. 1970. The structure of scientific revolutions. Chicago: University of Chicago Press.
Kaplan, S., and K. Vakili 2014. The Double-Edged Sword of Recombination in Breakthrough Innovation.
Strategic Management Journal, 36(10): 1435–1457.
Li, G. C., Lai, R., D’Amour, A., Doolin, D. M., Sun, Y., Torvik, V. I., Yu, A. Z., & Fleming, L. 2014.
Disambiguation and co-authorship networks of the US patent inventor database 1975–2010,
Research Policy, 43(6): 941-955.
Luchins, A. S., & Luchins, E. H. 1959. Rigidity of behavior: A variational approach to the effect of
Einstellung. University of Oregon Press.
Malsberger, B. M. 1996. Covenants Not to Compete: A State-by-State Survey. The Bureau of National
Affairs, Washington, DC.
March, J. G. 1991. Exploration and exploitation in organizational learning. Org Science, 2(1): 71-87.
Marx, M., Strumsky, D., & Fleming, L. 2009. Mobility, skills, and the Michigan non-compete
experiment. Management Science, 55(6), 875-889.
Marx, M. 2011. The Firm Strikes Back: Non-compete Agreements and the Mobility of Technical
Professionals. American Sociological Review, 76(5): 695–712.
Marx, M., Singh, J., & Fleming, L. 2015. Regional disadvantage? Employee non-compete agreements
and brain drain. Research Policy, 44(2), 394-404.
Merton, R. K. 1973. The sociology of science: Theoretical and empirical investigations. University of
Chicago press.
Page 30
30
Mokyr, J. 2002. The gifts of Athena: Historical origins of the knowledge economy. Princeton Univ.
Press.
Roach, M., & Cohen, W. M. 2013. Lens or prism? Patent citations as a measure of knowledge flows from
public research. Management Science, 59(2), 504-525.
Rosenkopf, L. and P. Almeida 2003. Overcoming Local Search Through Alliances and Mobility.
Management Science, 49: pp. 751 - 766.
Rosenberg, N. 1982. Inside the black box: Technology and economics. Cambridge University Press.
Schankerman, M., & Pakes, A. 1986. Estimates of the Value of Patent Rights in European Countries
During the Post-1950 Period. The Economic Journal, 1052-1076.
Simon, H. A. 1983. Discovery, invention, and development: human creative thinking. Proceedings of the
National Academy of Sciences of the United States of America, 80(14): 4569.
Simon, H. A. 1996. The Sciences of the Artificial. MIT Press, Cambridge, MA.
Simonton, D. K. 1999. Origins of genius: Darwinian perspectives on creativity. New York: Oxford.
Singh, J., & Fleming, L. 2010. Lone inventors as sources of breakthroughs: Myth or reality?.
Management Science, 56(1), 41-56.
Smith, A. 1776. An Inquiry into the Nature and Causes of the Wealth of Nations. London: W. Strahan
and T. Cadell.
Stock, J. H., & Yogo, M. (2005). Testing for weak instruments in linear IV regression. Identification and
inference for econometric models: Essays in honor of Thomas Rothenberg.
Thompson, P., & Fox-Kean, M. 2005. Patent citations and the geography of knowledge spillovers: A
reassessment. American Economic Review, 450-460.
Toppel R. and Ward, P. 1992. Job mobility and the careers of young men. The Quarterly Journal of
Economics 87 (3), 335-374.
Ward, T. B. 1995. What’s old about new ideas? In S. M. Smith, T. B. Ward, & R. A. Finke (Eds.), The
creative cognition approach: 157-178. Cambridge, MA: MIT Press.
Weisberg, R. W. 1999. Creativity and knowledge: A challenge to theories. In R. J. Sternberg (Ed.),
Handbook of creativity: 226-250. New York: Cambridge University Press.
Wuchty, S., Jones, B. F., & Uzzi, B. 2007. The increasing dominance of teams in production of
knowledge. Science, 316(5827), 1036-1039.
Page 31
31
FIGURE 1: Number of novel words by first appearance in the United States patent corpus, with
1975-1979 as a baseline. Each word is weighted by its future usage in the corpus.
FIGURE 2: Most reused novel words by five-year periods, 1980-2014.
non-transitory (software patent limitation)
browser, computer-executable
http, java
Page 32
32
FIGURE 3: Annual rates of changing fields for U.S. mobile inventors: two-year moving average
Notes: The annual rates of changing fields are calculated by dividing the number of patents indicating a field change by the total number of
patents. The sample includes the first patent of an inventor after they moved between two firms within the same state as evidenced by a different
corporate assignee compared to the previous patent of the inventor. The sample is restricted to inventors with at least one prior patent before
MARA (1985) in a non-enforcing state. Michigan inventors are represented by the dashed line; inventors from other states by the solid line.
TABLE 1: Summary statistics inventors with at least one prior patent (1975-2002; n=2,705,431
patents) Variable Description Mean Stdev. Min. Max.
Renewals (ln)
Number of times a patent is renewed by paying the renewal fees. A patent can be
renewed after 4, 8 and 12 years, resulting in the count of renewals being 0, 1, 2, or
3. Measure for the value of the patent. Available for patents filed since 1981.
1.05 0.44 0.00 1.39
Forward citations (ln) Number of citations received by the patent within 10 years. Measure for the value of the patent.
1.79 1.06 0.00 6.82
New words (ln) Number of words in the title, abstract or claims of the patent that appear for the first time in the whole US patent database. Available for patents filed since 1980.
Measure for the novelty of the patent.
0.40 0.65 0.00 7.62
Backward citations (ln) Number of backward prior art citations. The fewer the number of backward citations, the more novel the invention.
1.94 0.83 0.00 6.53
Changing fields Binary: no overlap in the three-digit technology class(es) of the focal patent and the
three-digit technology classes linked to all prior patents of the same inventor. 0.28 0.00 1.00
Collaboration Binary: more than one inventor on the patent. 0.83 0.00 1.00
Science Binary: patent cites non-patent literature. 0.36 0.00 1.00
Number of prior patents (ln) Number of prior patents developed by the inventor. 1.99 0.98 0.69 7.17
Technical specialization Technical specialization of the inventor. Herfindahl index based on the three-digit
technology classes of all prior patents. 0.62 0.31 0.02 1.00
Number of prior collaborations (ln)
Number of unique prior co-authors(s) of the focal inventor. 1.97 0.97 0.00 6.37
Move Binary: inventor moved between employers. Indicator is equal to one for the first
patent of an inventor assigned to a new assignee. 0.05 0.00 1.00
Prior move Binary: inventor previously moved between employers. 0.20 0.00 1.00
Days since last patent (ln) Number of days since the inventor’s prior patent application. 4.51 2.18 0.00 10.41
Days since first patent (ln) Number of days since the inventor’s first patent application. 7.25 1.52 0.00 10.50 Number of prior patents firm
(ln)
Number of prior patents assigned to the firm listed as assignee. 6.13 2.57 0.00 10.69
Number of classes (ln) Number of technology classes. 0.48 0.49 0.00 2.77 Number of subclasses (ln) Number of technology subclasses. 1.30 0.68 0.00 5.15
Notes: This sample includes all patents of inventors that are assigned to a firm, filed between 1975 and 2002 inclusive. This sample is restricted
to inventors with at least one prior patent (and hence are at the risk of changing fields), and who have at least two patents assigned to the same
firm. The sample includes 2,705,431 patents; 473,419 inventor-firm pairs; 396,336 inventors and 46,880 firms. (ln) indicates logarithmic transformation after adding one for measures with zero values. Second patents are only available for the new word measure since 1980 and for
the renewal measure since 1981.
.300
.350
.400
.450
.500
.550
.600
.650
.700
1975 1977 1979 1981 1983 1985 1987 1989 1991 1993 1995
Page 33
33
TABLE 2: Inventor-firm fixed effects inventors with at least one prior patent (1975-2002; n=2,705,431 patents) (1) (2) (3) (4) (5) (6) (7) (8)
Renewals
(ln)
Renewals
(ln)
Forward
citations (ln)
Forward
citations (ln)
New words
(ln)
New words
(ln)
Backward
citations (ln)
Backward
citations (ln)
Changing fields -0.0117*** -0.0177*** -0.0114*** -0.0584*** 0.0090*** -0.0123*** -0.0269*** -0.0059** (0.0009) (0.0018) (0.0018) (0.0035) (0.0012) (0.0022) (0.0013) (0.0025)
Changing fields * Collaboration 0.0064*** 0.0381*** 0.0098*** 0.0003
(0.0018) (0.0036) (0.0023) (0.0027) Changing fields * Science 0.0019 0.0451*** 0.0359*** -0.0605***
(0.0013) (0.0028) (0.0020) (0.0023)
Collaboration 0.0264*** 0.0247*** 0.1007*** 0.0904*** 0.0197*** 0.0172*** 0.0494*** 0.0493*** (0.0011) (0.0012) (0.0024) (0.0027) (0.0013) (0.0015) (0.0017) (0.0018)
Science 0.0028*** 0.0023*** 0.0629*** 0.0511*** 0.0341*** 0.0248*** 0.2064*** 0.2223***
(0.0007) (0.0008) (0.0016) (0.0018) (0.0011) (0.0012) (0.0016) (0.0018) Number of prior patents (ln) -0.0337*** -0.0339*** -0.1577*** -0.1586*** -0.0463*** -0.0466*** 0.0398*** 0.0398***
(0.0014) (0.0014) (0.0031) (0.0031) (0.0019) (0.0019) (0.0023) (0.0023)
Technical specialization -0.0056** -0.0054** -0.0958*** -0.0941*** -0.0208*** -0.0203*** 0.0203*** 0.0194*** (0.0024) (0.0024) (0.0053) (0.0053) (0.0033) (0.0033) (0.0038) (0.0038)
Number of prior collaborations (ln) 0.0059*** 0.0063*** -0.0211*** -0.0182*** -0.0237*** -0.0228*** -0.0107*** -0.0114***
(0.0010) (0.0010) (0.0024) (0.0024) (0.0015) (0.0015) (0.0017) (0.0017) Move 0.0024 0.0024 0.0083** 0.0083** 0.0395*** 0.0395*** 0.0465*** 0.0465***
(0.0015) (0.0015) (0.0038) (0.0038) (0.0022) (0.0022) (0.0027) (0.0027) Prior move 0.0031 0.0032* 0.0124** 0.0129*** -0.0080*** -0.0076*** 0.0031 0.0025
(0.0019) (0.0019) (0.0049) (0.0049) (0.0026) (0.0026) (0.0035) (0.0034)
Days since last patent (ln) 0.0005*** 0.0005*** 0.0028*** 0.0027*** -0.0014*** -0.0014*** -0.0047*** -0.0048*** (0.0002) (0.0002) (0.0003) (0.0003) (0.0002) (0.0002) (0.0003) (0.0003)
Days since first patent (ln) -0.0011** -0.0011** 0.0039*** 0.0035*** 0.0016** 0.0015** -0.0029*** -0.0028***
(0.0005) (0.0005) (0.0012) (0.0012) (0.0007) (0.0007) (0.0008) (0.0008) Number of prior patents firm (ln) -0.0280*** -0.0280*** -0.1024*** -0.1025*** 0.0032* 0.0033** 0.0663*** 0.0661***
(0.0013) (0.0013) (0.0035) (0.0035) (0.0017) (0.0017) (0.0024) (0.0024)
Number of classes (ln) -0.0043*** -0.0043*** 0.0413*** 0.0414*** -0.0051*** -0.0050*** 0.0068*** 0.0067*** (0.0008) (0.0008) (0.0017) (0.0017) (0.0012) (0.0012) (0.0014) (0.0014)
Number of subclasses (ln) 0.0017*** 0.0017*** 0.1908*** 0.1910*** 0.0537*** 0.0538*** 0.0922*** 0.0920***
(0.0006) (0.0006) (0.0013) (0.0013) (0.0010) (0.0010) (0.0011) (0.0011) Constant 1.1591*** 1.1599*** 1.8902*** 1.8951*** 0.7779*** 0.7776*** 1.4651*** 1.4660***
(0.1817) (0.1814) (0.7158) (0.7093) (0.1984) (0.2031) (0.1802) (0.1763)
Inventor-firm fixed effects Yes Yes Yes Yes Yes Yes Yes Yes N 2,409,874 2,409,874 2,705,431 2,705,431 2,465,947 2,465,947 2,705,431 2,705,431
Notes: The sample includes all patents of inventors that are assigned to a firm, filed between 1975 and 2002, and granted by the end of 2002. The sample is restricted to
inventors with at least one prior patent (and hence are at the risk of changing fields), and have at least two patents assigned to the same firm. Second patents are only
available for the new word measure since 1980 and for the renewal measure since 1981. All models include year and technology class indicators. *** p<0.01, **
p<0.05, * p<0.1
TABLE 3: Summary statistics for inventors at risk of moving (1975-1995; n=162,586 patents)
Variables Description Mean Stdev. Min. Max.
Number of prior patents Number of prior patents created by the inventor. 10.59 18.62 1.00 338.00
Average number of forward citations Average number of forward citations within 10 years for all prior patents. 6.75 9.06 0.00 232.50
Average number of renewals Average number of renewals for prior patents. Available for patents filed since 1981. 2.14 0.77 0.00 3.00 Average number of new words Average number of new to the patent corpus words found in the title, abstract and claims of
prior patents. Available for patents filed since 1980.
1.28 3.00 0.00 177.00
Average number of backward citations Average number of backward prior art citations for prior patents. 7.23 5.21 0.00 116.75 Technical specialization Number of two-digit NBER subcategories linked to prior patents of the inventor (see Hall et
al. 2001).
3.83 2.76 1.00 32.00
Number of prior collaborations Number of unique co-authors(s) linked to prior patents of the inventor. 6.00 7.36 0.00 444.00 Number of prior moves Number of times the inventor switched between employers. 0.35 0.85 0.00 16.00
Michigan Binary: inventor resides in Michigan. 0.18 0.00 1.00
Postmara Binary: patent is filed after 1985. 0.46 0.00 1.00 Move Binary: first patent of an inventor assigned to a new firm. 0.08 0.00 1.00
Michigan*Postmara Binary: inventor resides in Michigan after MARA. 0.07 0.00 1.00
Michigan*Move Binary: first patent of an inventor assigned to a new firm in Michigan. 0.01 0.00 1.00 Postmara*Move Binary: first patent of an inventor assigned to a new firm after MARA. 0.05 0.00 1.00
Michigan*Postmara*Move Binary: first patent of an inventor assigned to a new firm in Michigan after MARA. 0.01 0.00 1.00
Notes: The sample includes all corporate patents of inventors with at least one prior patent before MARA (1985) in a non-enforcing state, and filed between 1975 and 1995. The sample includes 162,586 patents and 29,956 inventors. Inventor characteristics are calculated based on all prior patents of an inventor.
Page 34
34
TABLE 4: Characteristics of inventors at risk of moving (1975-1995; n=162,586 patents) (1) (2) (3) (4) (5) (6) (7) (8)
Number of
prior patents
Average number
of forward
citations
Average number
of renewals
Average number
of new words
Average number of
backward citations
Technical
specialization
Number of
prior
collaborations
Number of
prior moves
MODEL PQML OLS OLS OLS OLS PQML PQML PQML
Michigan 0.32 -1.01*** -0.07** 0.03 -0.30** -0.03 -0.07* -0.43***
(0.21) (0.11) (0.03) (0.09) (0.12) (0.03) (0.04) (0.12) Postmara 0.87*** 5.29*** 0.09*** -0.02 2.86*** 0.53*** 0.95*** 1.56***
(0.07) (0.27) (0.01) (0.05) (0.15) (0.02) (0.02) (0.05)
Move -0.62*** 0.12 -0.14*** -0.10 0.26*** 0.02 -0.17*** 0.55*** (0.04) (0.09) (0.03) (0.13) (0.07) (0.01) (0.02) (0.05)
Michigan*Postmara -0.37* -2.16*** -0.11*** 0.05 -0.32 0.03 0.01 -0.13
(0.22) (0.34) (0.03) (0.10) (0.23) (0.03) (0.06) (0.14) Michigan*Move -0.30 -0.14 -0.05 -0.44** 0.60*** 0.02 0.05 0.17
(0.22) (0.17) (0.09) (0.21) (0.20) (0.04) (0.05) (0.21)
Postmara*Move -0.20*** -1.97*** -0.02 -0.01 -1.31*** -0.20*** -0.32*** -0.47*** (0.07) (0.28) (0.03) (0.15) (0.16) (0.02) (0.03) (0.06)
Michigan*Postmara*Move 0.27 0.28 0.11 0.21 -0.07 -0.07 -0.11 0.18
(0.23) (0.39) (0.09) (0.33) (0.34) (0.05) (0.09) (0.17) Constant 1.90*** 4.74*** 2.11*** 1.30*** 5.97*** 1.06*** 1.29*** -2.01***
(0.04) (0.05) (0.01) (0.04) (0.04) (0.01) (0.02) (0.04) Log-likelihood -1396770.9 -367527.23 -614526.91 -122693.12
Notes: The sample includes all corporate patents of inventors with at least one prior patent before MARA (1985) in a non-enforcing state, and filed between 1975 and
1995. The sample includes 162,586 patents and 29,956 inventors. Inventor characteristics are calculated based on all prior patents of an inventor. Robust standard errors
in parentheses, clustered by inventor. The triple interaction Michigan*Postmara*Move indicates that the population of inventors that moved between firms in Michigan after MARA, i.e. our treatment group, are not significantly different from the control group of inventors. *** p<0.01, ** p<0.05, * p<0.10
TABLE 5: Summary statistics for mobile inventors (1975-1995; n=6,264 patents) Variable Description Mean Stdev. Min. Max.
Renewals (ln) Number of times a patent is renewed by paying the renewal fees. A patent can be renewed after 4,
8 and 12 years, resulting in the count of renewals being 0, 1, 2, or 3. Measure for the value of the patent. Available for patents filed since 1981.
1.02 0.48 0.00 1.39
Forward citations (ln) Number of citations received by the patent within 10 years. Measure for the value of the patent. 1.94 1.07 0.00 6.00 New words (ln) Number of words in the title, abstract or claims of the patent which appear for the first time in the
whole US patent database. Available for patents filed since 1980. Measure for the novelty of the
patent.
0.33 0.57 0.00 4.37
Backward citations (ln) Number of backward prior art citations. The fewer the number of backward citations, the more
novel the invention. 2.18 0.77 0.00 5.29
Changing fields Binary: no overlap in the three-digit technology class(es) of the focal patent and the three-digit technology classes linked to all prior patents of the same inventor.
0.52 0.00 1.00
Collaboration Binary: more than one inventor on the patent. 0.71 0.00 1.00
Science Binary: patent cites non-patent literature. 0.32 0.00 1.00 Michigan Binary: inventor resides in Michigan. 0.19 0.00 1.00
Postmara Binary: patent is filed after 1985. 0.69 0.00 1.00
Michigan* Postmara Binary: inventor resides in Michigan and patent is filed after 1985. Instrument for changing fields.
0.11 0.00 1.00
Non-enforcing state Binary: inventor resides in a non-enforcing state. 0.95 0.00 1.00
Auto industry Binary: auto industry patent (see Marx et al. 2009). 0.04 0.00 1.00 Number of prior patents (ln) Number of prior patents developed by the inventor. 1.26 0.58 0.69 3.78
Technical specialization Technical specialization of the inventor. Herfindahl index based on the three-digit technology
classes of all prior patents. 0.70 0.30 0.07 1.00
Number of prior collaborations (ln) Number of unique prior co-authors(s) of the focal inventor. 1.37 0.57 0.00 3.78
Prior move Binary: inventor previously moved between employers. 0.21 0.00 1.00
Days since last patent (ln) Number of days since the inventor’s prior patent application. 6.72 1.59 0.00 10.30
Days since first patent (ln) Number of days since the inventor’s first patent application. 7.81 0.98 0.00 10.37
Number of prior patents recruiting
firm (ln)
Number of prior patents assigned to the firm listed as assignee. 2.63 2.60 0.00 9.77
Number of classes (ln) Number of technology classes. 0.52 0.50 0.00 2.20
Number of subclasses (ln) Number of technology subclasses. 1.28 0.62 0.00 3.58
Notes: The sample includes the first patent of an inventor after they moved between two firms within the same state as evidenced by a different corporate assignee compared to the previous patent of the inventor. The sample is restricted to inventors with at least one prior patent before MARA (1985) in a non-enforcing state, and to
patents filed between 1975 and 1995 (10 years before and after MARA). Observations are matched using Coarsened Exact Matching. (ln) indicates logarithmic
transformation after adding one for measures with zero values. New words available for patents since 1980. Renewals available for patents since 1981.
Page 35
35
TABLE 6: Difference-in-differences average rate of changing fields for mobile inventors (1975-1995; n=6,264
patents)
Premara Postmara Difference
Michigan 0.53 0.52 -0.01
Non-Michigan 0.60 0.49 -0.11 Difference -0.07 0.03 0.10
Notes: The average rates of changing fields are calculated by dividing the number of patents indicating a field change by the total number of patents. The sample
includes the first patent of an inventor after they moved between two firms within the same state as evidenced by a different corporate assignee compared to the previous patent of the inventor. The sample is restricted to inventors with at least one prior patent before MARA (1985) in a non-enforcing state. Observations are
matched using Coarsened Exact Matching. Rates are shown for Michigan inventors versus non-Michigan inventors, pre- and post-MARA. While the rate of changing
fields decreases strongly for non-Michigan inventors post-mara, it remains more or less stable for Michigan inventors. The difference in differences indicates that MARA triggered mobile inventors in Michigan to change fields, presumably to avoid a potential lawsuit.
TABLE 7: Regression difference-in-differences of the likelihood to change fields for mobile inventors (1975-1995;
n=6,264 patents) (1) (2) (3) (4) Model OLS OLS Logit Logit
Michigan -0.07** -0.06** -0.32** -0.30** (0.03) (0.03) (0.14) (0.14)
Postmara -0.24*** 0.03 -1.15*** 0.13
(0.09) (0.10) (0.43) (0.48) Michigan * Postmara 0.12*** 0.10*** 0.55*** 0.48***
(0.04) (0.04) (0.17) (0.18)
Collaboration 0.03 0.13 (0.02) (0.09)
Science -0.01 -0.04
(0.02) (0.09) Non-enforcing state -0.01 -0.04
(0.04) (0.22)
Auto industry -0.04 -0.03 (0.26) (1.27)
Number of prior patents (ln) -0.18*** -0.92***
(0.02) (0.13) Technical specialization 0.03 0.04
(0.04) (0.18)
Number of prior collaborations (ln) -0.06*** -0.29*** (0.02) (0.10)
Prior move 0.04 0.19
(0.03) (0.12) Days since last patent (ln) 0.02*** 0.11***
(0.01) (0.04)
Days since first patent (ln) -0.02* -0.12* (0.01) (0.06)
Number of prior patents recruiting firm (ln) 0.01** 0.04**
(0.00) (0.02) Number of classes (ln) -0.05** -0.26**
(0.02) (0.11)
Number of subclasses (ln) -0.04** -0.19** (0.02) (0.09)
Constant 1.00*** 2.45**
(0.23) (1.18)
Log-likelihood -3804.8804 -3565.0587
(Pseudo) R2 0.1468 0.2105 0.1006 0.1573
N 6,246 6,246 6,246 6,246
Notes: The dependent variable is the likelihood that a given patent indicates that the inventor changed fields. The sample includes the first patent of an inventor after
they moved between two firms within the same state as evidenced by a different corporate assignee compared to the previous patent of the inventor. The sample is
restricted to inventors with at least one prior patent before MARA (1985) in a non-enforcing state, and to patents filed between 1975 and 1995. Observations are matched using Coarsened Exact Matching. All models include year and technology class indicators. The interaction between Michigan and Postmara captures the causal
effect of MARA, and illustrates how MARA triggered mobile inventors in Michigan to change fields. Robust standard errors in parentheses, clustered by inventor.
*** p<0.01, ** p<0.05, * p<0.10
Page 36
36
TABLE 8: Two-stage least squares regressions of the effect of changing fields for mobile inventors (1975-1995;
n=6,264 patents) (1) (2) (3) (4) (5) (6) (7) (8) Renewals
(ln)
Renewals
(ln)
Forward
citations (ln)
Forward
citations (ln)
New
words (ln)
New
words (ln)
Backward
citations (ln)
Backward
citations (ln)
Changing fields -0.42** -0.43* -0.46* -0.62* 0.42** 0.45* -0.38* -0.66**
(0.19) (0.25) (0.27) (0.35) (0.20) (0.26) (0.21) (0.28)
Changing fields * Collaboration 0.02 0.07 -0.00 0.41*** (0.10) (0.16) (0.11) (0.12)
Changing fields * Science -0.05 0.45*** -0.10 -0.23**
(0.07) (0.12) (0.08) (0.10) Collaboration 0.05*** 0.04 0.12*** 0.09 0.04** 0.04 0.02 -0.19***
(0.02) (0.05) (0.03) (0.08) (0.02) (0.06) (0.02) (0.07)
Science -0.02 0.00 0.07** -0.17** 0.05*** 0.10** 0.31*** 0.43*** (0.02) (0.04) (0.03) (0.07) (0.02) (0.04) (0.02) (0.05)
Michigan -0.02 -0.02 0.03 0.04 0.03 0.03 0.04 0.04
(0.02) (0.02) (0.03) (0.03) (0.02) (0.02) (0.02) (0.02) Postmara 0.10*** 0.10** 0.98*** 1.00*** 0.00 -0.00 0.44*** 0.45***
(0.04) (0.04) (0.13) (0.13) (0.04) (0.04) (0.10) (0.11)
Non-enforcing state 0.05 0.05 0.00 -0.00 0.04 0.04 -0.05 -0.06 (0.03) (0.03) (0.05) (0.05) (0.03) (0.03) (0.04) (0.04)
Auto industry 0.43 0.43 0.24 0.19 0.17 0.18 -0.16 -0.15
(0.27) (0.28) (0.49) (0.49) (0.30) (0.30) (0.38) (0.39) Number of prior patents(ln) -0.10*** -0.10*** -0.08 -0.09 0.07* 0.07* -0.08* -0.10**
(0.04) (0.04) (0.06) (0.06) (0.04) (0.04) (0.05) (0.05)
Technical specialization -0.09*** -0.09*** 0.04 0.05 -0.03 -0.03 -0.00 -0.02 (0.03) (0.03) (0.05) (0.05) (0.03) (0.03) (0.04) (0.04)
Number of prior collaborations (ln) -0.03* -0.03* -0.03 -0.02 0.01 0.01 -0.02 -0.00
(0.02) (0.02) (0.03) (0.03) (0.02) (0.02) (0.02) (0.02) Prior move 0.05** 0.05** 0.09** 0.09*** 0.00 0.00 0.10*** 0.09***
(0.02) (0.02) (0.04) (0.04) (0.02) (0.02) (0.03) (0.03)
Days since last patent (ln) 0.02*** 0.02*** 0.02* 0.02* -0.01 -0.01 -0.01 -0.01 (0.01) (0.01) (0.01) (0.01) (0.01) (0.01) (0.01) (0.01)
Days since first patent (ln) -0.03** -0.03** -0.03 -0.03 0.01 0.01 0.01 -0.00
(0.01) (0.01) (0.02) (0.02) (0.01) (0.01) (0.02) (0.02) Number of prior patents recruiting firm (ln) 0.02*** 0.02*** -0.00 -0.00 0.00 0.00 -0.00 -0.00
(0.00) (0.00) (0.01) (0.01) (0.00) (0.00) (0.00) (0.00)
Number of classes (ln) -0.04* -0.04* 0.11*** 0.11*** -0.00 -0.00 -0.08*** -0.08*** (0.02) (0.02) (0.03) (0.03) (0.02) (0.02) (0.03) (0.03)
Number of subclasses (ln) -0.03 -0.03 0.18*** 0.19*** 0.08*** 0.08*** 0.15*** 0.14***
(0.02) (0.02) (0.03) (0.03) (0.02) (0.02) (0.02) (0.02) Constant 1.22*** 1.23*** 1.09** 1.20** -0.43 -0.45 2.26*** 2.54***
(0.31) (0.34) (0.52) (0.56) (0.33) (0.36) (0.41) (0.44) IV test. F statistic first stage. 28.32 45.78 30.99 45.78
N 5,676 5,676 6,246 6,246 5,817 5,817 6,246 6,246
Notes: The dependent variables measure the value and novelty of a given patent. The sample includes the first patent of an inventor after they moved between two firms
within the same state as evidenced by a different corporate assignee compared to the previous patent of the inventor. The sample is restricted to inventors with at least one prior patent before MARA (1985) in a non-enforcing state, and to patents filed between 1975 and 1995. Observations are matched using Coarsened Exact
Matching. All models include year and technology class indicators. The interaction between Michigan and Postmara is used as an instrument for changing fields.
Robust standard errors in parentheses, clustered by inventor. *** p<0.01, ** p<0.05, * p<0.10

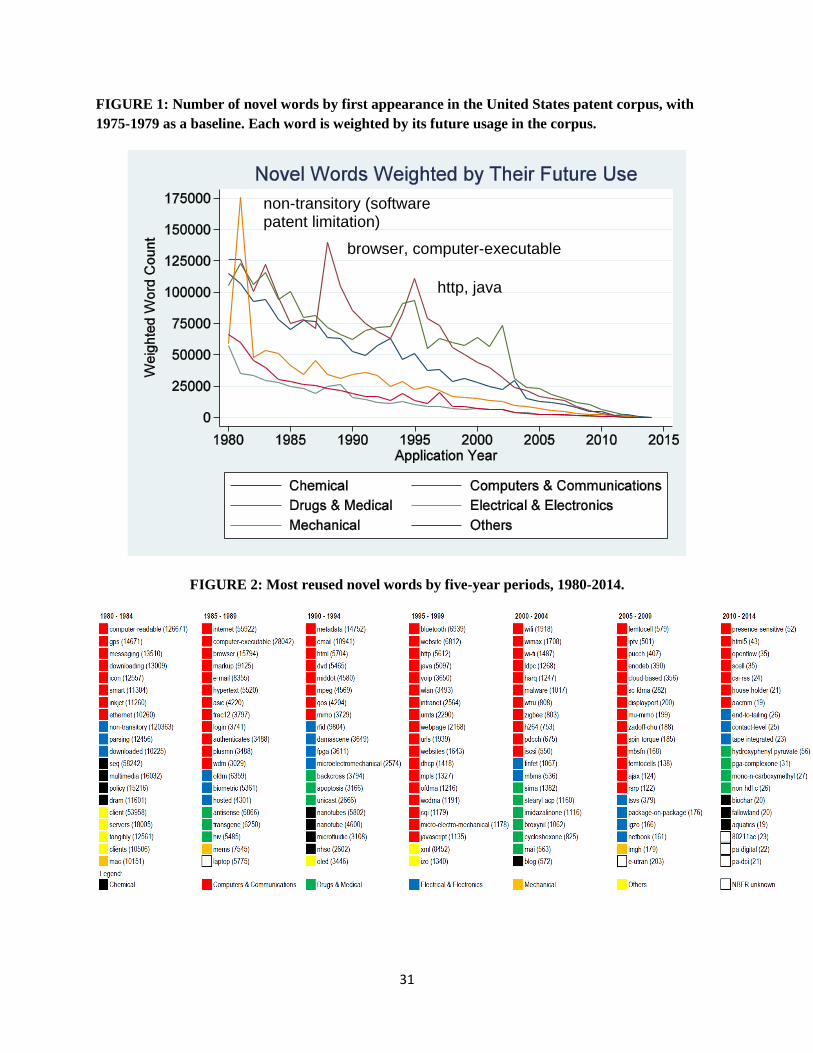
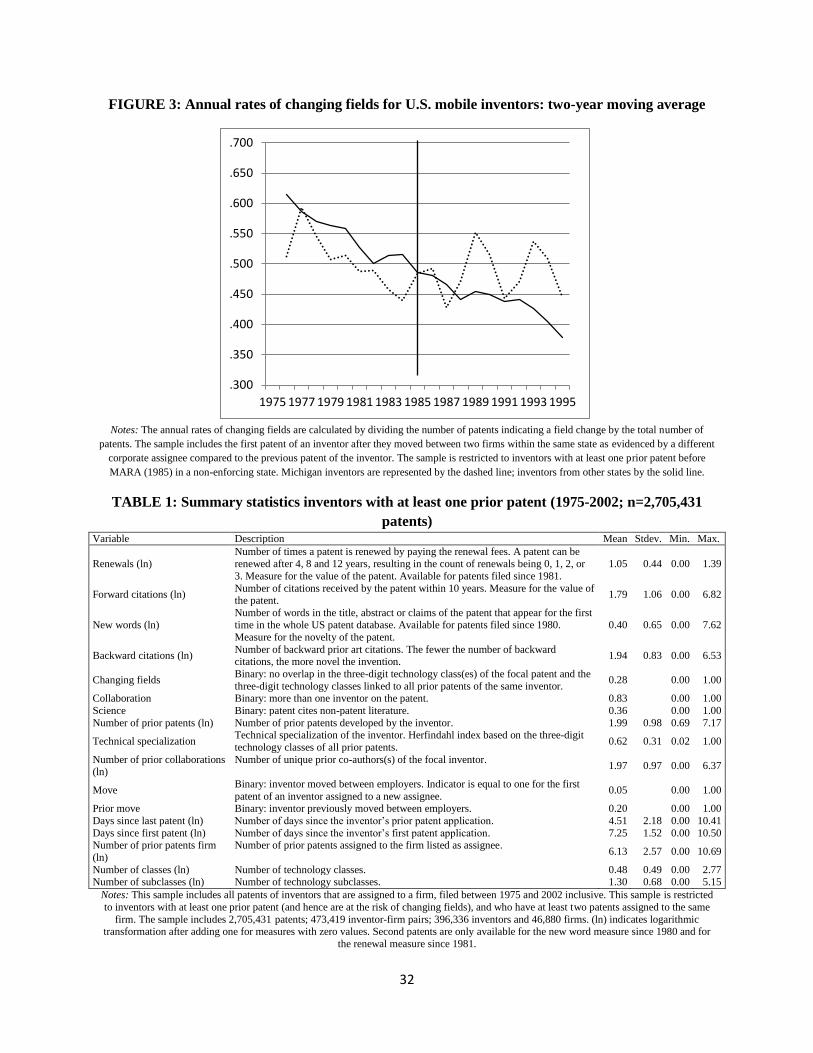
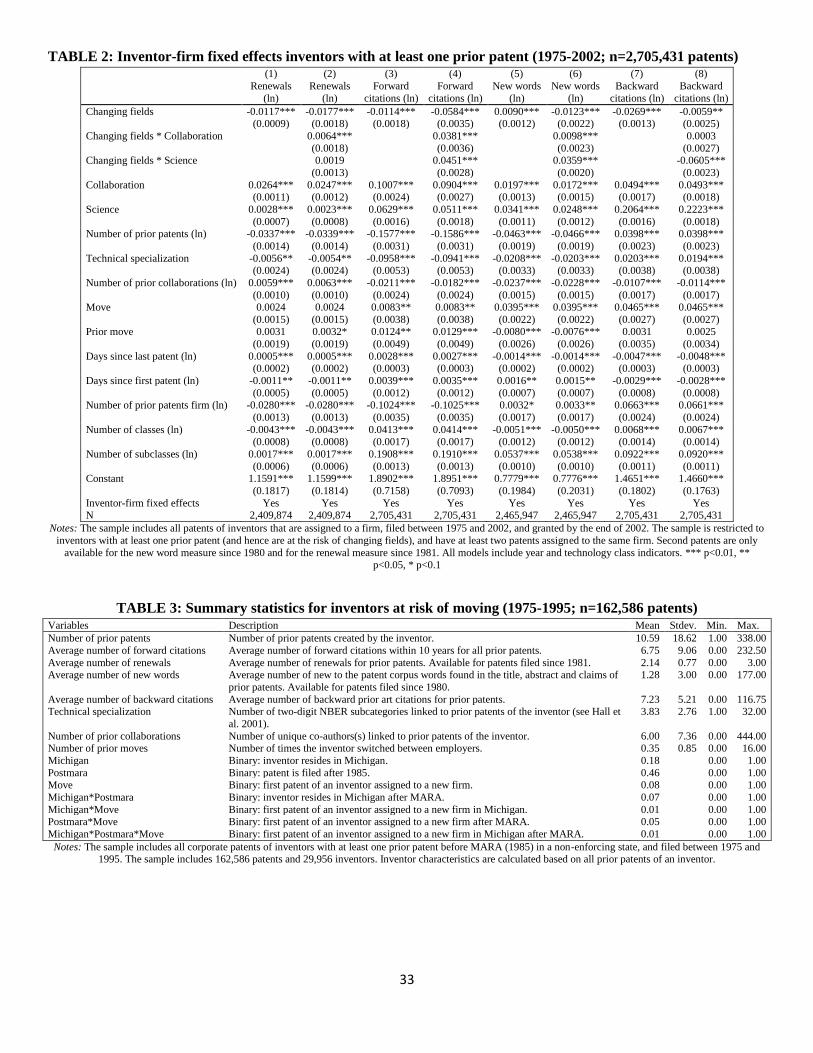
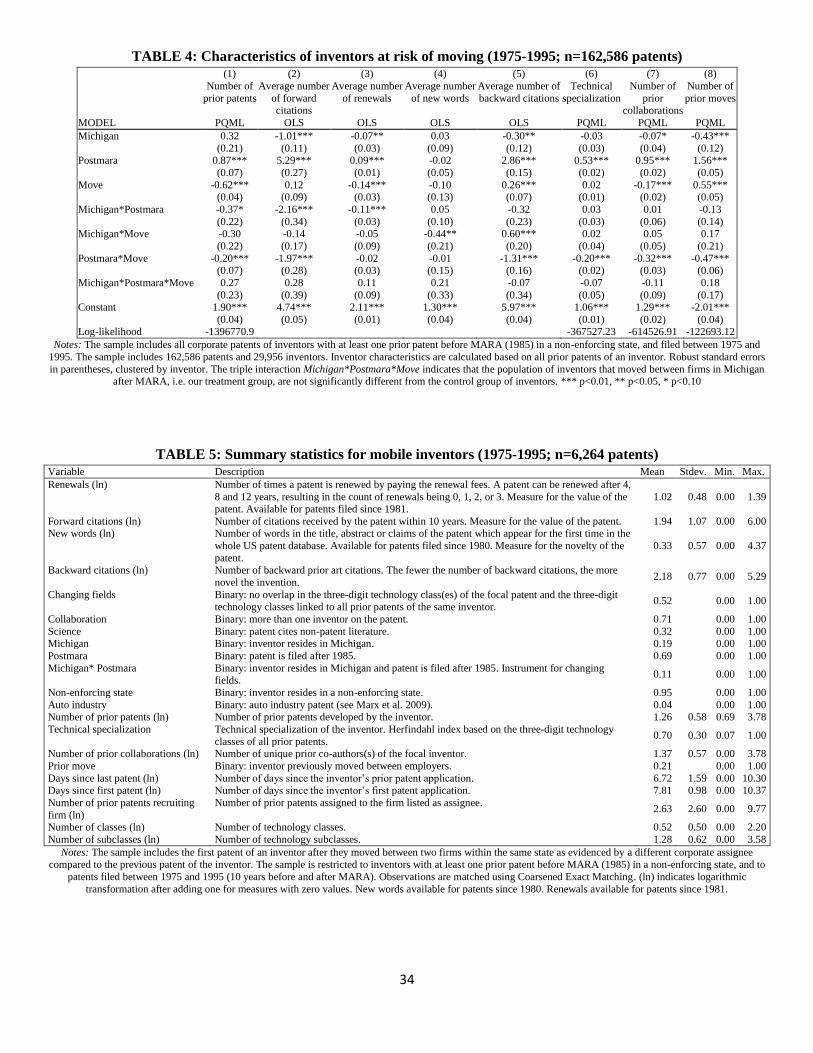
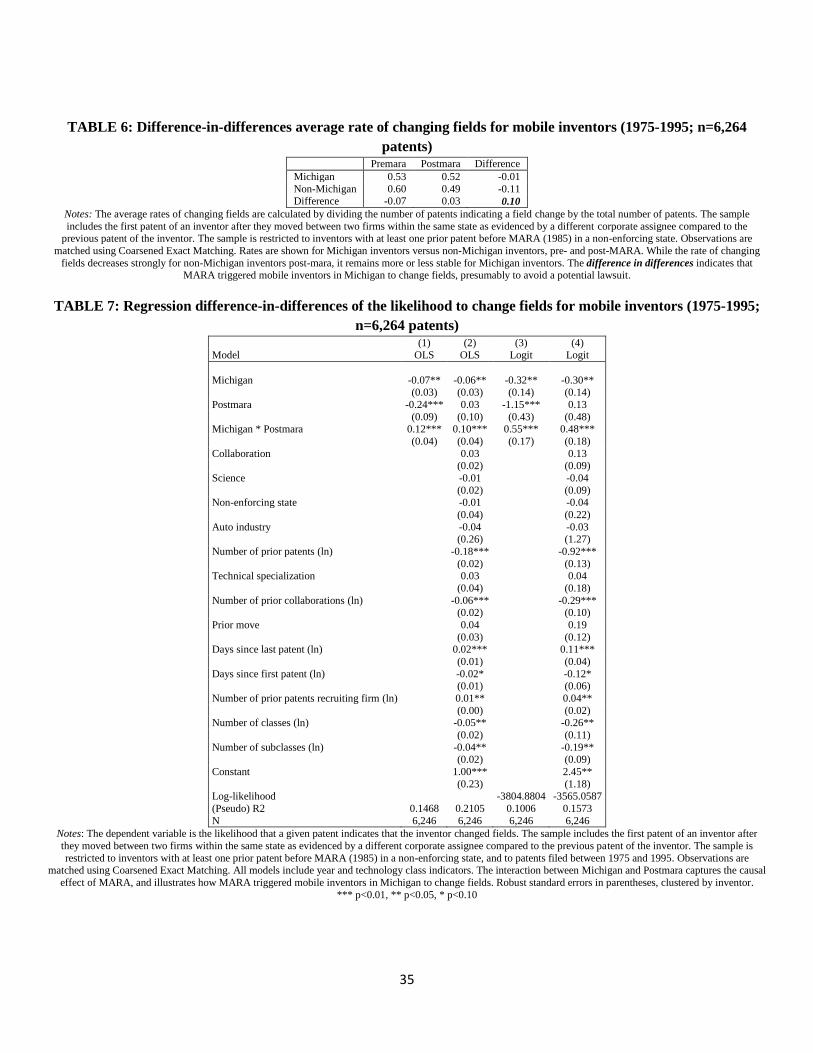
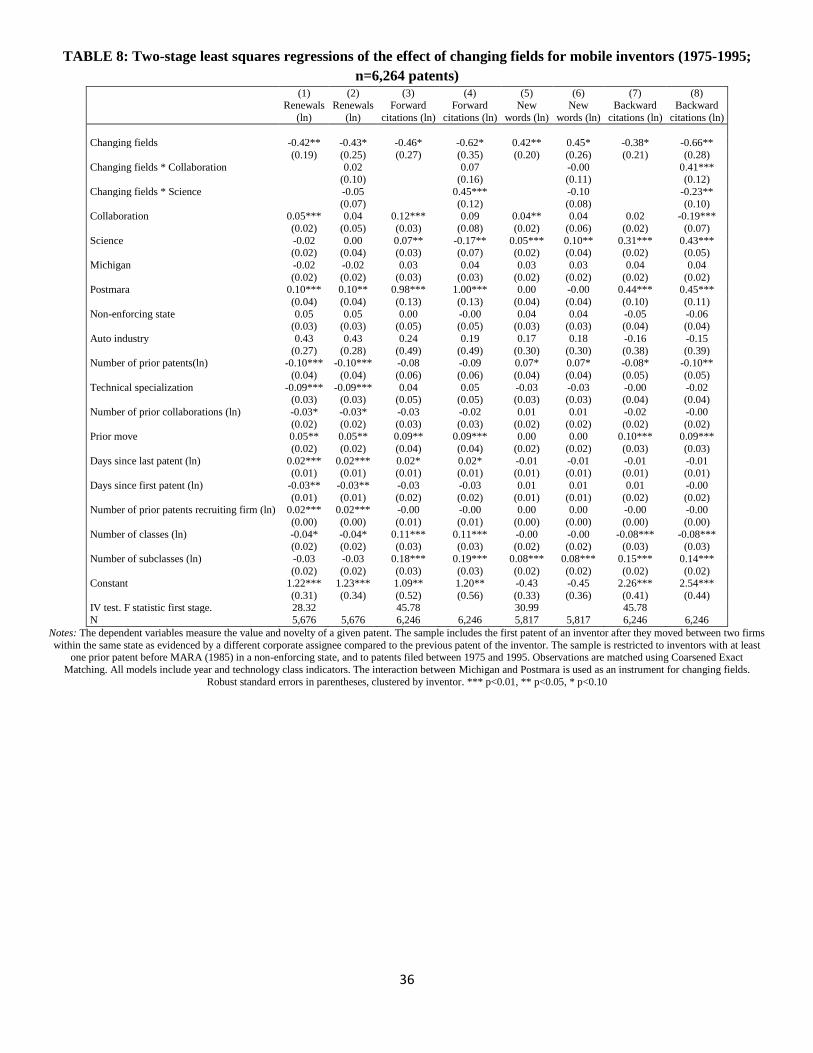


![INVENTIVE - Si2projects.si2.org/events_dir/2007/date/cadence.pdf · INVENTIVE Common Power Format: ... ATPG Constraint Validation Equivalence checking ... [ -sdc_files sdc_file_list]](https://static.documents.pub/doc/80x56/5ac901cf7f8b9aa3298c99f7/inventive-common-power-format-atpg-constraint-validation-equivalence-checking.jpg)


