41
© Peak Indicators Limited Oracle BI Suite Enterprise Edition Optimising BI EE using Oracle OLAP and Essbase Antony Heljula Technical Architect
© Peak Indicators Limited
Oracle BI Suite Enterprise Edition
Optimising BI EE using Oracle OLAP and Essbase
Antony Heljula
Technical Architect

© Peak Indicators Limited 2
Agenda
Overview
When Do You Need a Cube Engine?
Example Problem : Project DW
Oracle OLAP Demonstration
Oracle Essbase Demonstration
Performance Test
Summary
© Peak Indicators Limited 3
Overview
© Peak Indicators Limited 4
Overview
Oracle has two well-established “cube” engines in its product line:
Oracle OLAP
Oracle Essbase
Whilst they are architecturally and functionally quite different, they both offer significant potential for optimising your BI infrastructure
This presentation does not aim to give a detailed feature comparison, but instead to demonstrate from a “solutions architecture” point of view as to:
1. When a cube engine might be of benefit to you
2. How each of the two engines can be most effectively used and integrated with Oracle BI EE
We shall be looking at versions Oracle OLAP 11g and Oracle Essbase 11.1.1.1.1

© Peak Indicators Limited 5
When do you need a Cube Engine?
© Peak Indicators Limited 6
When do you need a Cube Engine?
Relational Data-Warehouses contain features that offer significant performance improvements compared to an OLTP:
Star-Schema Transformation
Materialized Views / Aggregate Tables
Hierarchy Tables
Denormalisation
Mini-Dimensions
Bitmap Join indexes
etc
BI Tools also have features that can provide further optimisation:
BI Server Caching
BI Presentation Services Caching
Aggregate Navigation
Fragmentation
etc

© Peak Indicators Limited 7
When do you need a Cube Engine?
Sometimes however, data volumes or reporting complexity are such that the level of “optimisation” required goes beyond manageable levels
Oracle BI
MVs
© Peak Indicators Limited 8
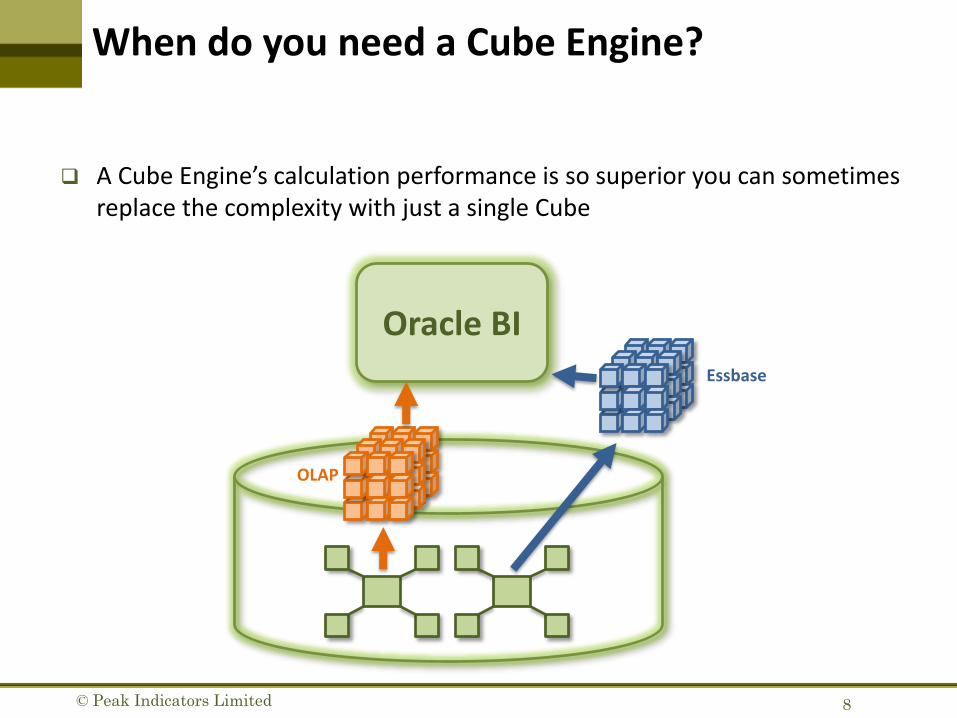
When do you need a Cube Engine?
A Cube Engine’s calculation performance is so superior you can sometimes replace the complexity with just a single Cube
Oracle BI
OLAP
Essbase

© Peak Indicators Limited 9
Example Problem : Project DW

© Peak Indicators Limited 10
Overview of Problem
Project Data-Warehouse contains a simple “Expenditure Items”star-schema:
3 Measures
5 Dimensions
© Peak Indicators Limited 11
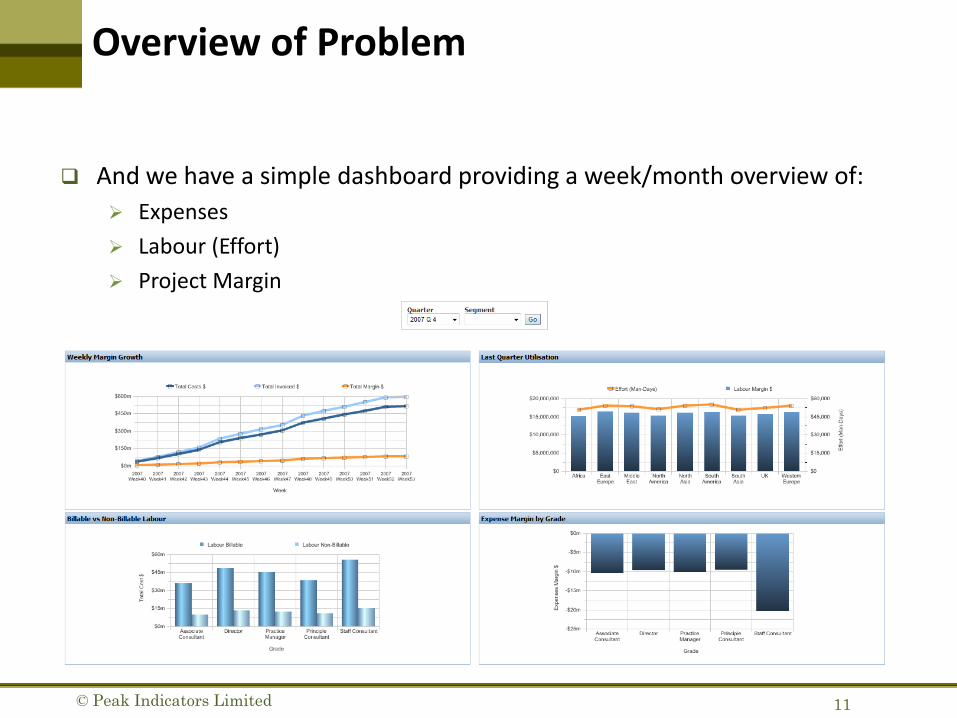
Overview of Problem
And we have a simple dashboard providing a week/month overview of:
Expenses
Labour (Effort)
Project Margin
© Peak Indicators Limited 12
Overview of Problem
We have the following factors to consider:
The central fact table stores >5 million records per year
Managers need to report by Week as well as at higher levels of summary
Security implemented as reasonably low level of granularity:
Project Managers can only see data relating to their Projects
Resource Managers can only see data relating to their Resources
So, this means:
Large volumes of data
Reporting required at both low and high levels of summary
Security applied at low level of granularity

© Peak Indicators Limited 13
Steps Already Taken
Two levels of MVs already created to:
Reduce the number of dimensions
Aggregate to Week and Month levels
Day Level:5M Recordsper year
Week Level:1.7M Recordsper year
Month Level0.5M Recordsper year
© Peak Indicators Limited 14
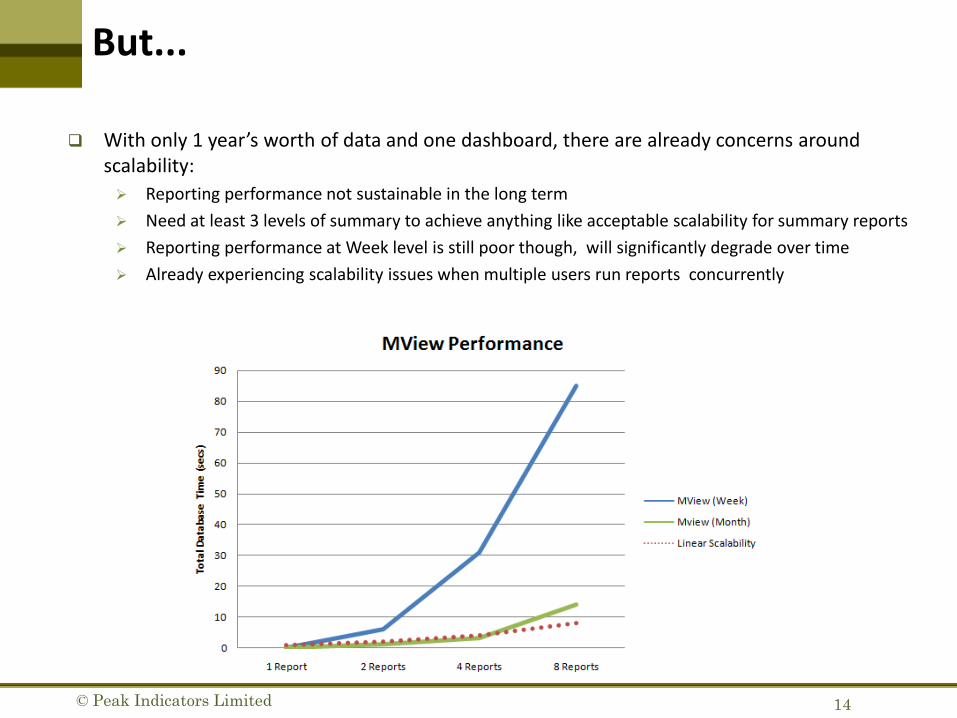
But...
With only 1 year’s worth of data and one dashboard, there are already concerns around scalability:
Reporting performance not sustainable in the long term
Need at least 3 levels of summary to achieve anything like acceptable scalability for summary reports
Reporting performance at Week level is still poor though, will significantly degrade over time
Already experiencing scalability issues when multiple users run reports concurrently
© Peak Indicators Limited 15
Possible Options
Usually the following options are considered: Leverage BI Server caching
Suitable for top-level dashboards only, so not drill-down reports
Create more Materialized Views New MV at Quarter level
Create new MVs dedicated Resource Managers (for reporting at Week level)
Create new MVs dedicated to Project Managers (for reporting at Week level)
Table Partitioning Perhaps at Quarter / Year levels
Not all reports will benefit from “partition elimination”
Purchase additional hardware Increase database memory
Add more CPUs
Stripe database over more disks
© Peak Indicators Limited 16
Where Are We Heading?
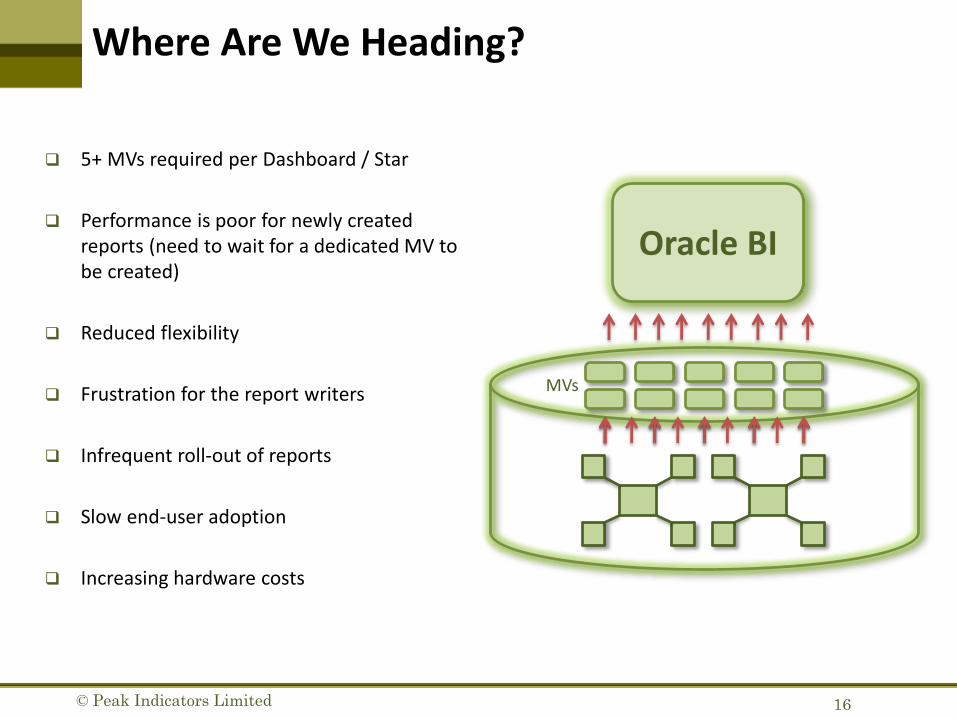
5+ MVs required per Dashboard / Star
Performance is poor for newly created reports (need to wait for a dedicated MV to be created)
Reduced flexibility
Frustration for the report writers
Infrequent roll-out of reports
Slow end-user adoption
Increasing hardware costs
Oracle BI
MVs

© Peak Indicators Limited 17
What about OLAP or Essbase?
Let’s see if Oracle OLAP / Essbase cubes can help rectify the situation
We are going to see if a single OLAP / Essbase cube will be enough to cater for all our reporting requirements
Ideally what we are looking for is: Performance and scalability with our existing hardware
Decent performance when reporting at low and high levels of summary
Reduced development effort
Less ETL maintenance and administration
Minimal impact to the existing implementation

© Peak Indicators Limited 18
Oracle OLAP
© Peak Indicators Limited 19
Oracle OLAP
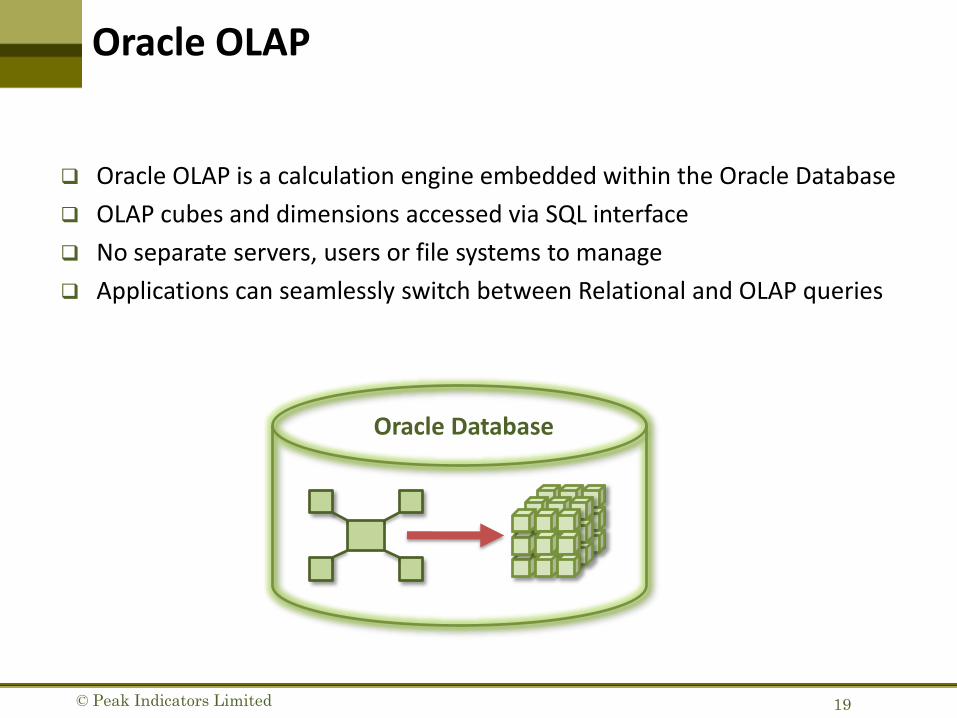
Oracle OLAP is a calculation engine embedded within the Oracle Database
OLAP cubes and dimensions accessed via SQL interface
No separate servers, users or file systems to manage
Applications can seamlessly switch between Relational and OLAP queries
Oracle Database
© Peak Indicators Limited 20
Oracle OLAP
There are currently two possible mechanisms through which BI EE can leverage the power of Oracle OLAP engine:
Relational Views (“Cube Views”)
Cube Organized Materialized Views (new with Oracle Database 11g)
Both mechanisms have their pros and cons
Integration with BI EE
© Peak Indicators Limited 21
Oracle OLAP
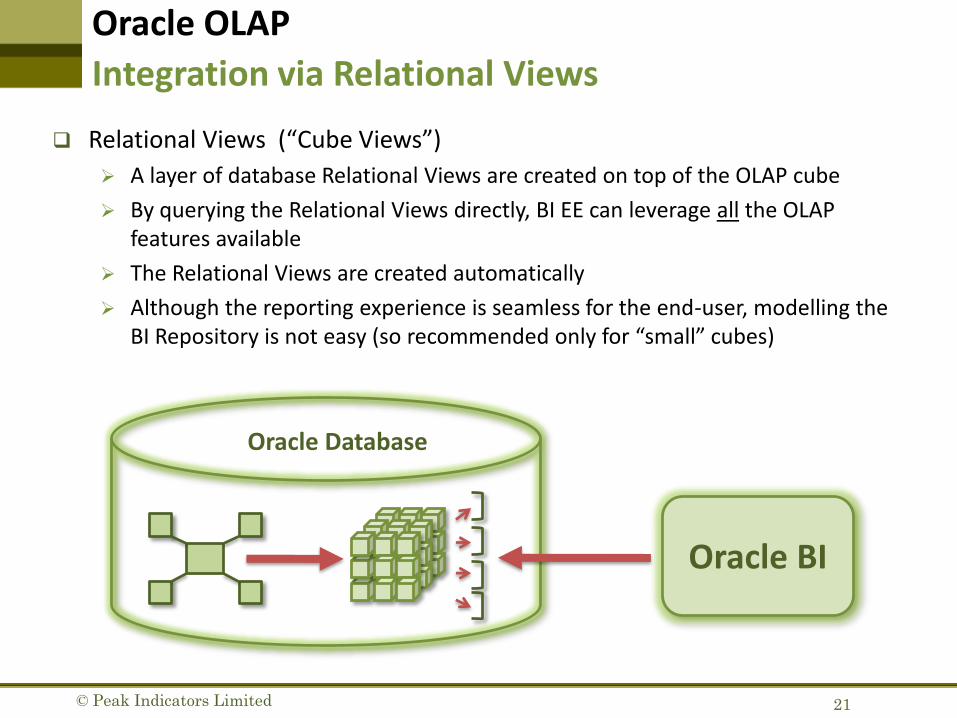
Relational Views (“Cube Views”)
A layer of database Relational Views are created on top of the OLAP cube
By querying the Relational Views directly, BI EE can leverage all the OLAP features available
The Relational Views are created automatically
Although the reporting experience is seamless for the end-user, modelling the BI Repository is not easy (so recommended only for “small” cubes)
Integration via Relational Views
Oracle Database
Oracle BI
© Peak Indicators Limited 22
Oracle OLAP
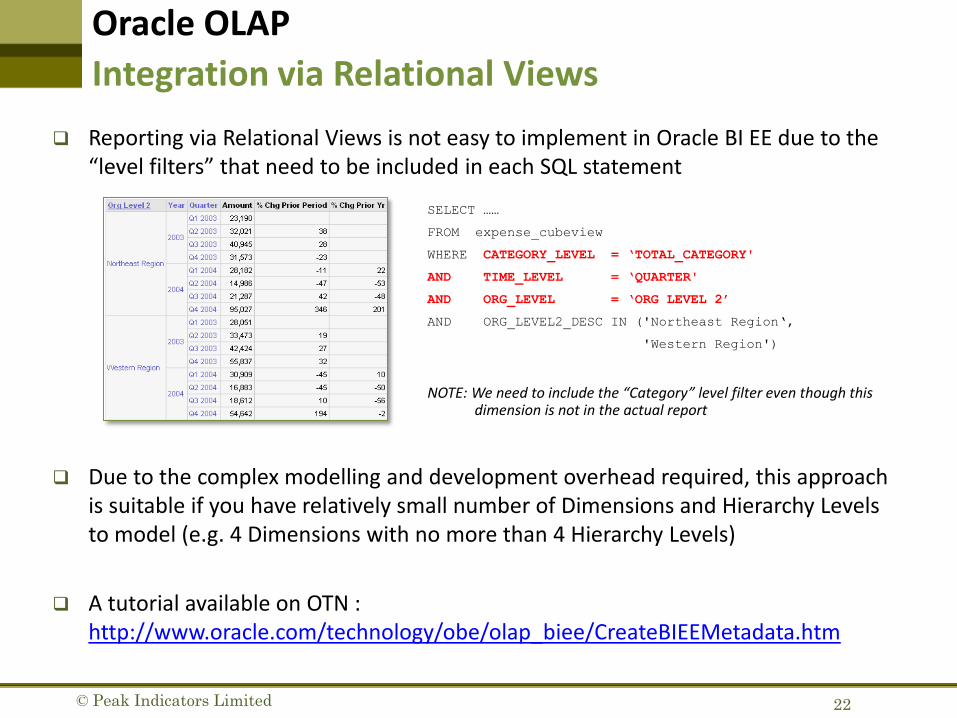
Reporting via Relational Views is not easy to implement in Oracle BI EE due to the “level filters” that need to be included in each SQL statement
Due to the complex modelling and development overhead required, this approach is suitable if you have relatively small number of Dimensions and Hierarchy Levels to model (e.g. 4 Dimensions with no more than 4 Hierarchy Levels)
A tutorial available on OTN : http://www.oracle.com/technology/obe/olap_biee/CreateBIEEMetadata.htm
Integration via Relational Views
SELECT ……
FROM expense_cubeview
WHERE CATEGORY_LEVEL = ‘TOTAL_CATEGORY'
AND TIME_LEVEL = ‘QUARTER'
AND ORG_LEVEL = ‘ORG LEVEL 2’
AND ORG_LEVEL2_DESC IN ('Northeast Region‘,
'Western Region')
NOTE: We need to include the “Category” level filter even though this dimension is not in the actual report

© Peak Indicators Limited 23
Oracle OLAP
Cube Organized Materialized Views (new with Oracle Database 11g) The OLAP cubes are presented as “Materialized Views” and therefore benefit from key
MV features such as Fast Refresh, Query Rewrite and Management of Stale Data
BI EE can take advantage of the “Query Rewrite” feature, where the Oracle Database will automatically rewrite standard relational queries to source from the OLAP cubes
Although this approach requires minimal development effort, not all relational queries are candidates for Query Rewrite and you cannot use any calculations defined in the OLAP cube itself
Integration via Query Rewrite
Oracle Database
Oracle BI
Rewrite

© Peak Indicators Limited 24
Oracle OLAP
Demonstration
Integration via Query Rewrite
© Peak Indicators Limited 25
Oracle OLAP
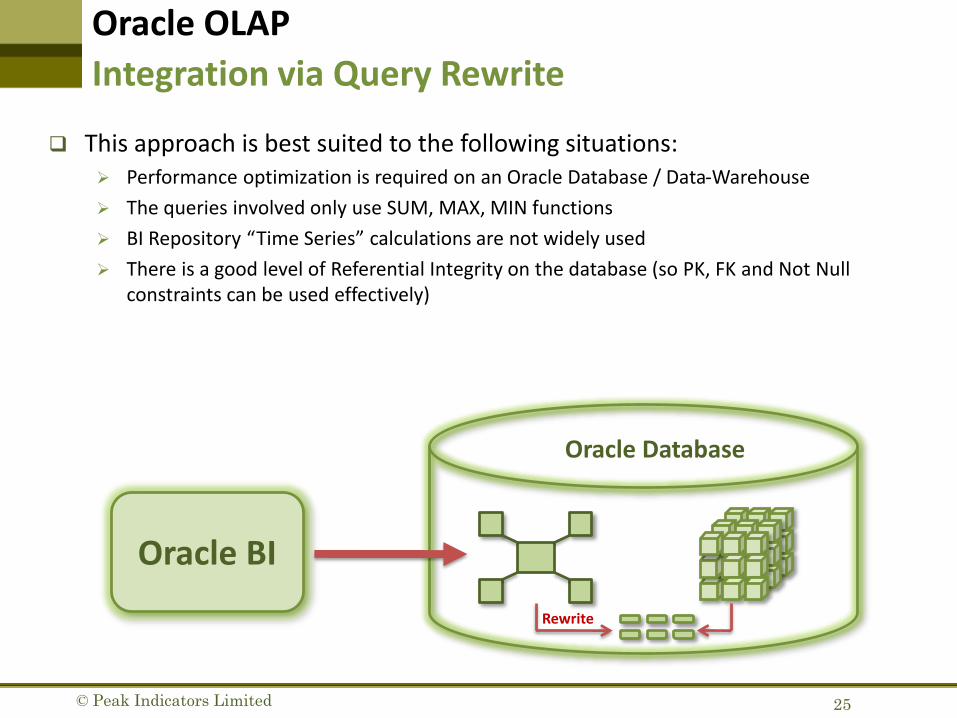
This approach is best suited to the following situations: Performance optimization is required on an Oracle Database / Data-Warehouse
The queries involved only use SUM, MAX, MIN functions
BI Repository “Time Series” calculations are not widely used
There is a good level of Referential Integrity on the database (so PK, FK and Not Null constraints can be used effectively)
Integration via Query Rewrite
Oracle Database
Oracle BI
Rewrite

© Peak Indicators Limited 26
Oracle Essbase
© Peak Indicators Limited 27
Oracle Essbase
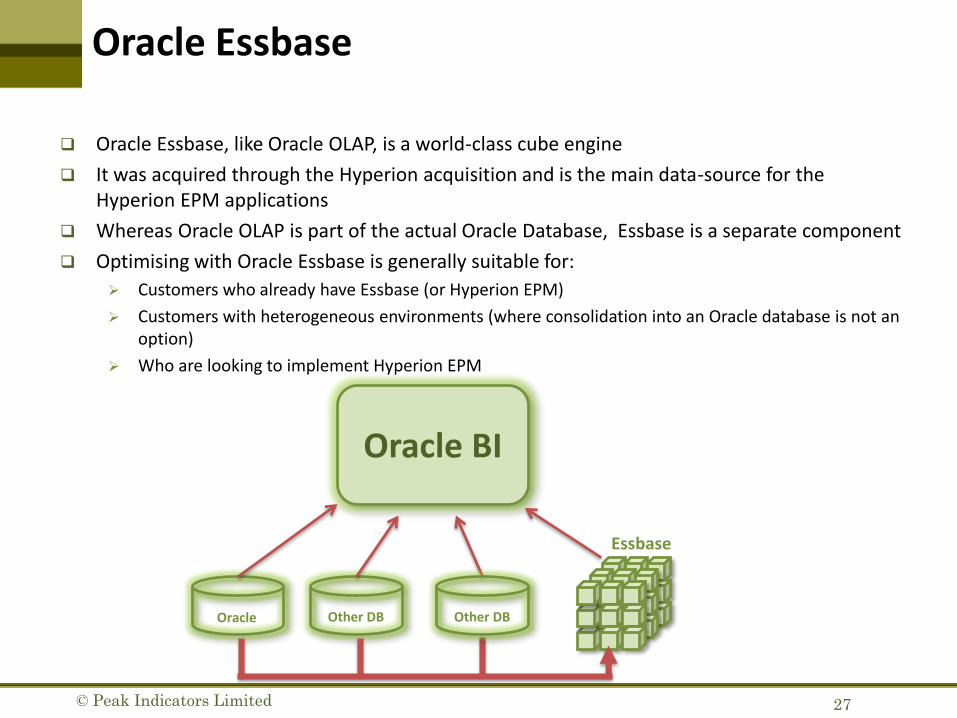
Oracle Essbase, like Oracle OLAP, is a world-class cube engine
It was acquired through the Hyperion acquisition and is the main data-source for the Hyperion EPM applications
Whereas Oracle OLAP is part of the actual Oracle Database, Essbase is a separate component
Optimising with Oracle Essbase is generally suitable for:
Customers who already have Essbase (or Hyperion EPM)
Customers with heterogeneous environments (where consolidation into an Oracle database is not an option)
Who are looking to implement Hyperion EPM
Oracle BI
Oracle Other DB Other DB
Essbase
© Peak Indicators Limited 28
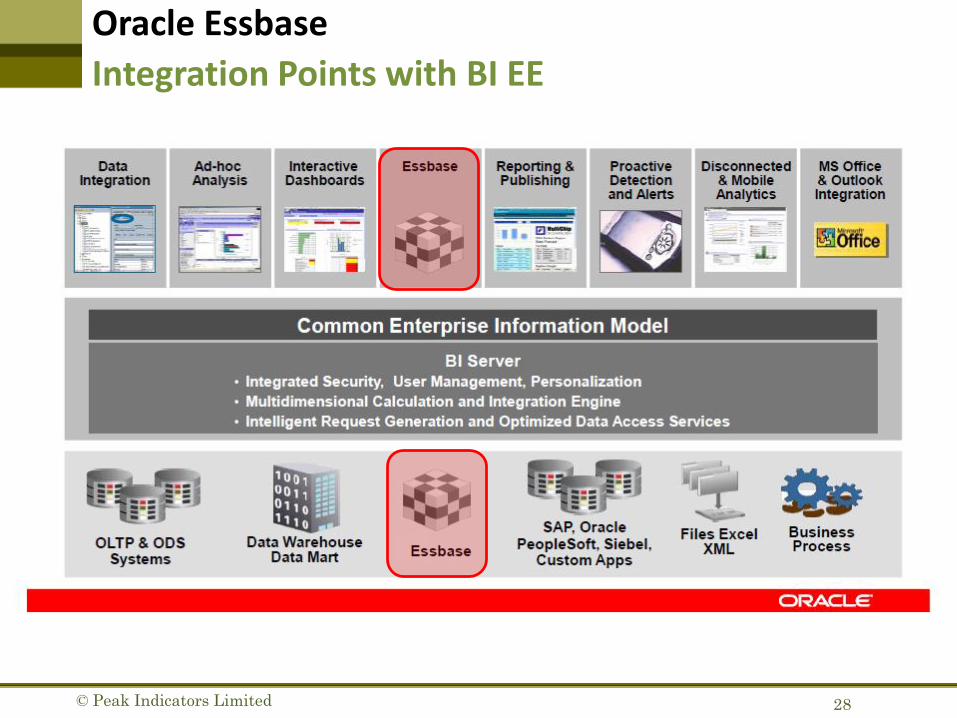
Oracle Essbase
Integration Points with BI EE

© Peak Indicators Limited 29
Oracle Essbase
Oracle BI EE accesses Essbase cubes via “MDX” queries
As the Essbase cube will already contain metadata on Dimensions, Hierarchies and Measures, modelling can be as easy as drag-and-drop!
As a Data-Source for Oracle BI EE
© Peak Indicators Limited 30
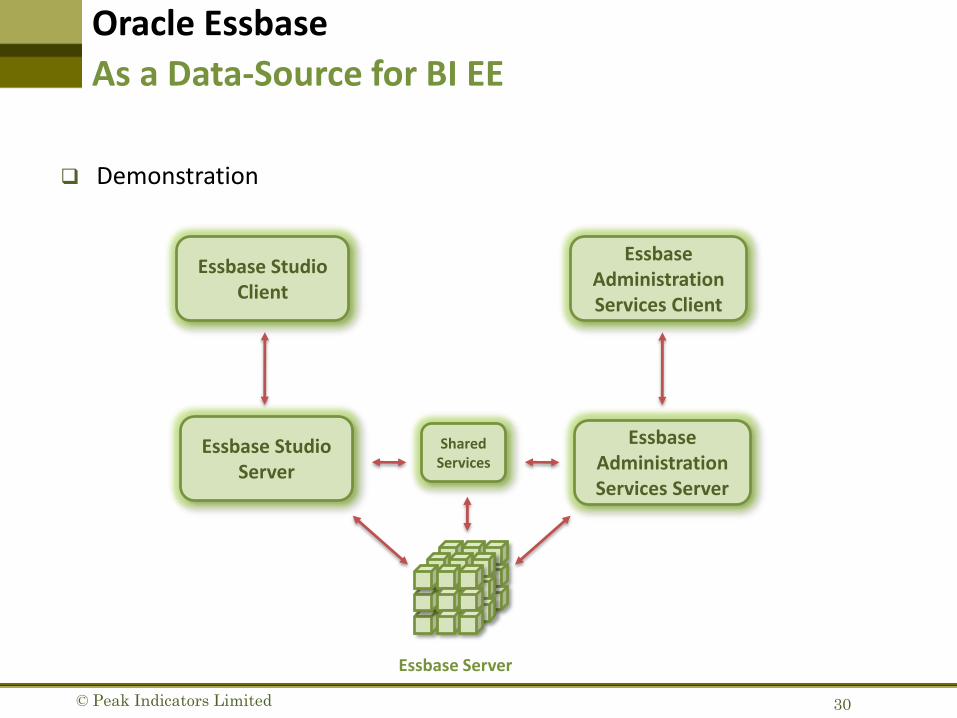
Oracle Essbase
Demonstration
As a Data-Source for BI EE
Essbase Server
Essbase Studio Server
Essbase Administration Services Server
Essbase Studio Client
Essbase Administration Services Client
Shared Services
© Peak Indicators Limited 31
Performance Test
© Peak Indicators Limited 32
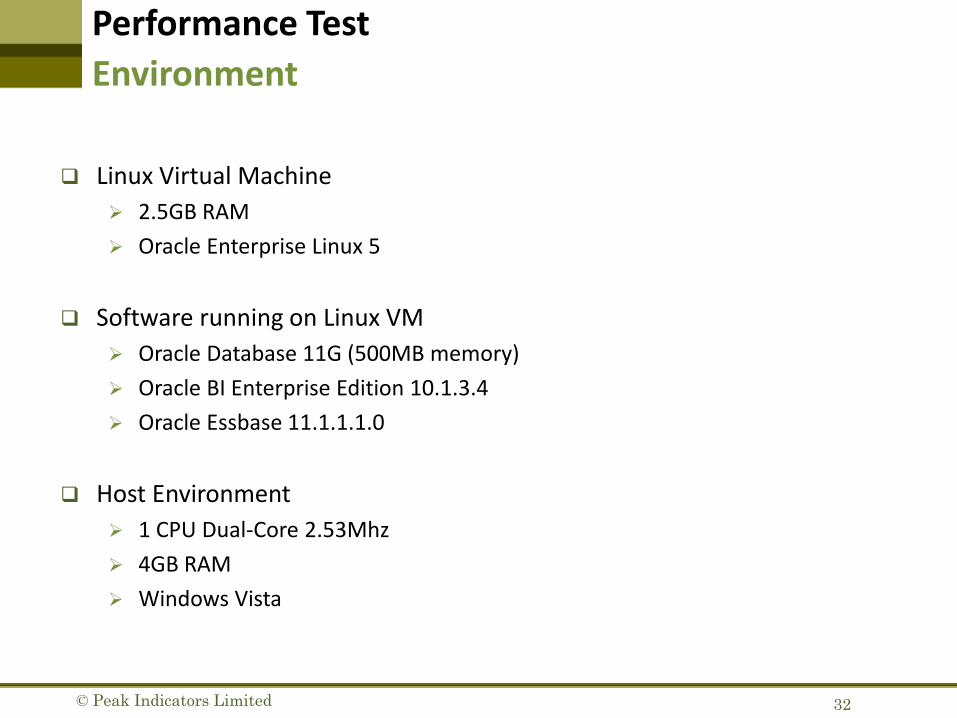
Performance Test
Linux Virtual Machine
2.5GB RAM
Oracle Enterprise Linux 5
Software running on Linux VM
Oracle Database 11G (500MB memory)
Oracle BI Enterprise Edition 10.1.3.4
Oracle Essbase 11.1.1.1.0
Host Environment
1 CPU Dual-Core 2.53Mhz
4GB RAM
Windows Vista
Environment
© Peak Indicators Limited 33
Performance Test
3 sets of identical dashboards:
Mview
OLAP 11g
Essbase
Each dashboard consists of 4 pages:
1 report
2 reports
4 reports
8 reports
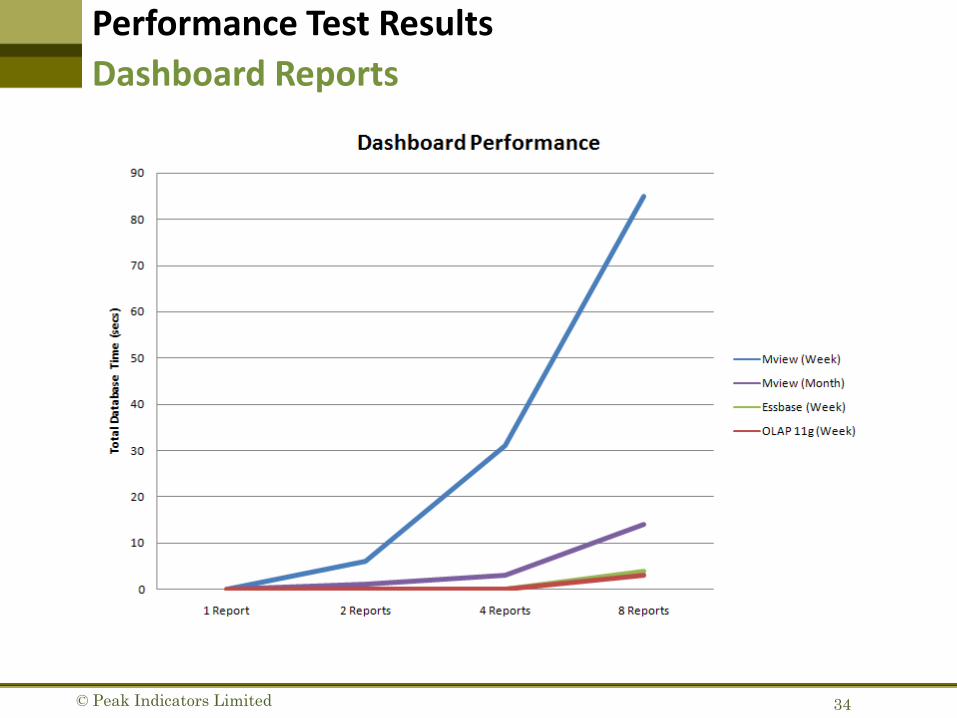
The sum of “total database time” from the resulting physical SQL/MDX queries was used for scoring
BI Server caching was disabled
Details
© Peak Indicators Limited 34
Performance Test Results
Dashboard Reports

© Peak Indicators Limited 35
Performance Test Results
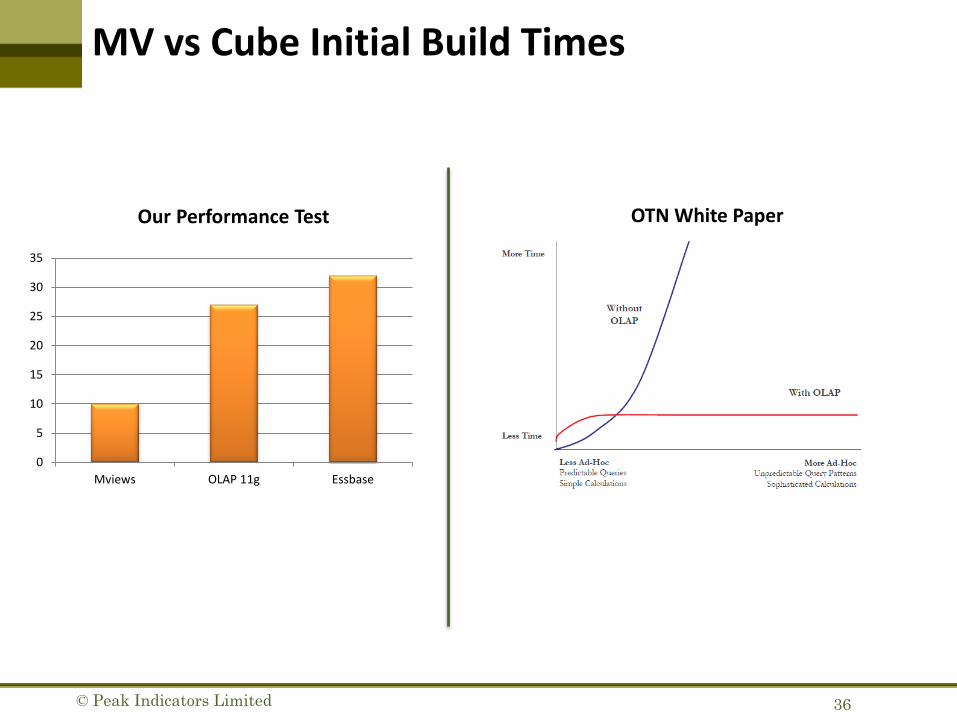
Compared to Oracle White Paper
OTN White Paper
© Peak Indicators Limited 36
MV vs Cube Initial Build Times
0
5
10
15
20
25
30
35
Mviews OLAP 11g Essbase
OTN White PaperOur Performance Test

© Peak Indicators Limited 37
Summary

© Peak Indicators Limited 38
Summary
Oracle OLAP / Essbase cubes can dramatically improve the performance and scalability of a BI implementation, whilst reducing complexity
Options are available for both “Oracle-only” and heterogeneous environments
Build times and performance in both cube engines are comparable
Any BI/DW developer can build and deploy OLAP and Essbase cubes
BI EE 11g......the “planned” future is bright!
© Peak Indicators Limited 39
Further Information
Oracle Technology Network:
Oracle OLAP
http://www.oracle.com/technology/products/bi/olap/index.html
Oracle Essbase
http://www.oracle.com/technology/products/bi/essbase/index.html
© Peak Indicators Limited 40
Peak Indicators Training
BI EE “Advanced” Optimisation training courses will be available from 1st
March 2009
For more information please email : [email protected]
BI EE “Advanced” Optimisation
© Peak Indicators Limited
Helping Your Business Intelligence Journey


