614
Oracle® Business Intelligence Discoverer Plus User’s Guide 10g Release 2 (10.1.2.0.0) Part No. B13915-02 November 2004

Oracle® Business Intelligence Discoverer PlusUser’s Guide
10g Release 2 (10.1.2.0.0)
Part No. B13915-02
November 2004

Oracle Business Intelligence Discoverer Plus User’s Guide, 10g Release 2 (10.1.2.0.0)
Part No. B13915-02
Copyright © 1999, 2004 Oracle. All rights reserved.
The Programs (which include both the software and documentation) contain proprietary information; they are provided under a license agreement containing restrictions on use and disclosure and are also protected by copyright, patent, and other intellectual and industrial property laws. Reverse engineering, disassembly, or decompilation of the Programs, except to the extent required to obtain interoperability with other independently created software or as specified by law, is prohibited.
The information contained in this document is subject to change without notice. If you find any problems in the documentation, please report them to us in writing. This document is not warranted to be error-free. Except as may be expressly permitted in your license agreement for these Programs, no part of these Programs may be reproduced or transmitted in any form or by any means, electronic or mechanical, for any purpose.
If the Programs are delivered to the United States Government or anyone licensing or using the Programs on behalf of the United States Government, the following notice is applicable:
U.S. GOVERNMENT RIGHTS Programs, software, databases, and related documentation and technical data delivered to U.S. Government customers are "commercial computer software" or "commercial technical data" pursuant to the applicable Federal Acquisition Regulation and agency-specific supplemental regulations. As such, use, duplication, disclosure, modification, and adaptation of the Programs, including documentation and technical data, shall be subject to the licensing restrictions set forth in the applicable Oracle license agreement, and, to the extent applicable, the additional rights set forth in FAR 52.227-19, Commercial Computer Software--Restricted Rights (June 1987). Oracle Corporation, 500 Oracle Parkway, Redwood City, CA 94065
The Programs are not intended for use in any nuclear, aviation, mass transit, medical, or other inherently dangerous applications. It shall be the licensee's responsibility to take all appropriate fail-safe, backup, redundancy and other measures to ensure the safe use of such applications if the Programs are used for such purposes, and we disclaim liability for any damages caused by such use of the Programs.
Oracle is a registered trademark of Oracle Corporation and/or its affiliates. Other names may be trademarks of their respective owners.
The Programs may provide links to Web sites and access to content, products, and services from third parties. Oracle is not responsible for the availability of, or any content provided on, third-party Web sites. You bear all risks associated with the use of such content. If you choose to purchase any products or services from a third party, the relationship is directly between you and the third party. Oracle is not responsible for: (a) the quality of third-party products or services; or (b) fulfilling any of the terms of the agreement with the third party, including delivery of products or services and warranty obligations related to purchased products or services. Oracle is not responsible for any loss or damage of any sort that you may incur from dealing with any third party.
Perspective® for Java licensed from Three D Graphics, Inc. Copyright © 1997, 2002, Three D Graphics, Inc.
iii
Contents
Send Us Your Comments ..................................................................................................................... xvii
Preface ............................................................................................................................................................... xix
OracleBI Discoverer Plus Relational Navigation and Accessibility................................................... xixKeyboard Navigation ............................................................................................................................... xixChanging font sizes and colors for enhanced readability ................................................................... xixIntended Audience.................................................................................................................................... xixDocumentation Accessibility ................................................................................................................... xxStructure ..................................................................................................................................................... xxAbout screenshots in this documentation ............................................................................................. xxRelated Documents ................................................................................................................................... xxConventions ............................................................................................................................................... xxiPrerequisites to run Discoverer Plus Relational ................................................................................... xxiJGoodies License Agreement................................................................................................................... xxi
Part I Getting started
1 Introducing Oracle Business Intelligence Discoverer
What is OracleBI Discoverer? ................................................................................................................ 1-1Why should I use OracleBI Discoverer? .............................................................................................. 1-2How do I access information using OracleBI Discoverer?............................................................... 1-3What is a typical workflow with OracleBI Discoverer? ................................................................... 1-3
Stage 1: Getting the data you want.................................................................................................. 1-3Stage 2: Analyzing data..................................................................................................................... 1-4Stage 3: Sharing data with other people ......................................................................................... 1-4
What are the different components of OracleBI Discoverer? .......................................................... 1-4Who is the Discoverer manager and what do they do?..................................................................... 1-6
2 Using Discoverer Plus with a relational data source
What is Discoverer Plus Relational?..................................................................................................... 2-1What is a relational data source? ........................................................................................................... 2-2What are business areas? ........................................................................................................................ 2-4What are folders? ...................................................................................................................................... 2-5What are items?......................................................................................................................................... 2-7What is the Discoverer Plus Relational sample database?............................................................... 2-8
iv
What are the new features in Discoverer Plus 10.1.2.0.0? ................................................................. 2-9Where can I find out more about Discoverer Plus Relational? .................................................... 2-10
3 Using Discoverer Plus with a multidimensional data source
How can I tell when I am using Discoverer Plus with a multidimensional data source? ......... 3-1What is Discoverer Plus OLAP? ............................................................................................................ 3-2What is online analytic processing (OLAP)? ...................................................................................... 3-2What are multidimensional data sources?........................................................................................... 3-2What are multidimensional cubes? ...................................................................................................... 3-3What are measures?.................................................................................................................................. 3-4What are dimensions and dimension members? ............................................................................... 3-5What are dimension hierarchies? .......................................................................................................... 3-5What are dimension attributes?............................................................................................................. 3-6About aggregating and filtering multidimensional data ................................................................. 3-6About applying filters after aggregating multidimensional data .................................................. 3-6About filters and dimensions ................................................................................................................ 3-7What is the Discoverer Catalog?............................................................................................................ 3-7About the Discoverer Plus OLAP Tutorial .......................................................................................... 3-8Where can I find out more about Discoverer Plus OLAP?............................................................... 3-8
4 Starting Discoverer
What is a Discoverer connection? ......................................................................................................... 4-1About starting Discoverer....................................................................................................................... 4-2How to display the Discoverer Plus connections page ..................................................................... 4-2How to start Discoverer using an existing connection...................................................................... 4-3How to start Discoverer by connecting directly ................................................................................. 4-4How to exit Discoverer Plus ................................................................................................................... 4-5Frequently asked questions ................................................................................................................... 4-5
What is the End User Layer (EUL)?................................................................................................. 4-5What are database accounts?............................................................................................................ 4-6How do I create and save login information in a Discoverer connection?................................ 4-6How do I edit a Discoverer connection?......................................................................................... 4-8How do I delete a Discoverer connection? ..................................................................................... 4-9What are public connections?........................................................................................................... 4-9What are user-defined connections? ............................................................................................... 4-9When and why do I need to change my password?..................................................................... 4-9How do I change the password for a connection? ..................................................................... 4-10How do I change the End User Layer for a Discoverer connection?....................................... 4-10What is Single Sign-on?.................................................................................................................. 4-11What is the difference between Single Sign-on and Discoverer passwords?......................... 4-11How do I know what Single Sign-on ID is being used in Discoverer Plus?........................... 4-11
5 About the Discoverer Plus Relational work area
About the work area ................................................................................................................................ 5-1About Discoverer’s drag and drop features ........................................................................................ 5-3
About dragging and dropping items in the Discoverer work area ............................................ 5-3
v
About repositioning items in the Discoverer work area .............................................................. 5-4About Discoverer menus ........................................................................................................................ 5-4
About the Standard Discoverer menu ............................................................................................ 5-4About Discoverer’s right-click menus............................................................................................. 5-5
About Discoverer toolbars...................................................................................................................... 5-5About the Standard toolbar .............................................................................................................. 5-5About the Formatting toolbar .......................................................................................................... 5-6About the Graph toolbar ................................................................................................................... 5-6About the Available Items toolbar .................................................................................................. 5-6About the Selected Items toolbar ..................................................................................................... 5-6About tool tips ................................................................................................................................... 5-7
About icons used in the Discoverer item navigator .......................................................................... 5-7What are axis items?................................................................................................................................. 5-8About data points ..................................................................................................................................... 5-9What is the Discoverer Worksheet Wizard? ........................................................................................ 5-9
6 Using workbooks and worksheets
What are workbooks? .............................................................................................................................. 6-2What are worksheets? .............................................................................................................................. 6-3About Discoverer worksheet types....................................................................................................... 6-4About table worksheets .......................................................................................................................... 6-4About crosstab worksheets..................................................................................................................... 6-4About designing workbooks for maximum performance................................................................ 6-4How to open workbooks......................................................................................................................... 6-5About opening workbooks in a non-Oracle database ...................................................................... 6-7How to edit workbooks........................................................................................................................... 6-8About saving a workbook to the database .......................................................................................... 6-8How to save workbooks.......................................................................................................................... 6-8How to copy workbooks ...................................................................................................................... 6-10How to delete workbooks from the database .................................................................................. 6-10About worksheet titles and text.......................................................................................................... 6-11How to create or edit worksheet titles or text .................................................................................. 6-12How to display or hide worksheet titles or text .............................................................................. 6-13How to rename worksheets and workbooks ................................................................................... 6-14How to re-order worksheets within a workbook............................................................................ 6-14How to refresh worksheets.................................................................................................................. 6-15How to delete worksheets ................................................................................................................... 6-15How to find data in a worksheet ........................................................................................................ 6-16About creating new workbooks ......................................................................................................... 6-17How to create new workbooks ........................................................................................................... 6-17How to add worksheets to a workbook ............................................................................................ 6-21How to view and update a workbook’s properties ......................................................................... 6-21About worksheet properties................................................................................................................ 6-22How to view and edit worksheet properties .................................................................................... 6-23
vi
7 Editing worksheets and worksheet items
About editing worksheets ...................................................................................................................... 7-1How to edit worksheets using the Edit Worksheet wizard.............................................................. 7-2How to add items to worksheets ........................................................................................................... 7-3How to create new worksheet items ..................................................................................................... 7-4How to remove items from worksheets ............................................................................................... 7-5How to duplicate a worksheet ............................................................................................................... 7-6How to change the format of worksheet items................................................................................... 7-7How to set the currency symbol for numeric items........................................................................... 7-9How to change the format of worksheet item headings................................................................ 7-11How to change the text in item headings ......................................................................................... 7-12
8 Creating graphs in Discoverer
What is a Discoverer graph?................................................................................................................... 8-1About using graphs in Discoverer ........................................................................................................ 8-2About components of a Discoverer graph ........................................................................................... 8-4About graph types and sub-types ......................................................................................................... 8-5About graph types available in Discoverer......................................................................................... 8-5Notes about creating bubble graphs..................................................................................................... 8-6Notes about creating high-low-close stock graphs ............................................................................ 8-7Notes about creating dual-Y graphs ..................................................................................................... 8-8Notes about creating pie graphs ............................................................................................................ 8-9How to edit a graph............................................................................................................................... 8-10How to hide and display a graph ....................................................................................................... 8-15How to change the position of a graph ............................................................................................. 8-16
Part II Analyzing data
9 Pivoting data
About pivoting worksheet items........................................................................................................... 9-1About pivoting data on a crosstab worksheet .................................................................................... 9-3How to pivot worksheet items in the Discoverer work area ........................................................... 9-4How to pivot worksheet items using the Edit Worksheet dialog ................................................... 9-5About unexpected results with pivoting ............................................................................................. 9-6
10 Drilling to analyze data
About drilling in Discoverer worksheets ......................................................................................... 10-1What are drill hierarchies?................................................................................................................... 10-2How to drill up and down ................................................................................................................... 10-3
How to drill up and down using a drill icon in worksheet data ............................................. 10-3How to drill up and down using a graph label in graph data ................................................. 10-5How to drill up and down using the Drill dialog ...................................................................... 10-6
About drilling to related items ........................................................................................................... 10-7How to drill to a related item .............................................................................................................. 10-8
How to drill to a related item using a drill icon ......................................................................... 10-8How to drill to a related item using the Drill dialog ................................................................. 10-9
vii
About drilling to detail ...................................................................................................................... 10-10How to drill to detail .......................................................................................................................... 10-11About drill links .................................................................................................................................. 10-12
About user defined drill links ..................................................................................................... 10-13About drill links defined by the Discoverer manager ............................................................. 10-14About using drill links.................................................................................................................. 10-15
How to create drill links .................................................................................................................... 10-16How to create drill links to Discoverer worksheets ................................................................. 10-16How to create drill links to Internet URLs ................................................................................ 10-18
How to use drill links ......................................................................................................................... 10-20How to drill out to a worksheet or Internet URL using a drill link icon .............................. 10-20How to drill out to a worksheet or Internet URL using the Drill dialog .............................. 10-21
11 Using parameters
What are parameters?............................................................................................................................ 11-1What are the benefits of using parameters? ..................................................................................... 11-2About using parameters ....................................................................................................................... 11-2About creating parameters .................................................................................................................. 11-2About using parameters to collect dynamic user input ................................................................. 11-3About filtering lists of parameter values based on selected conditions .................................... 11-3How to set parameters .......................................................................................................................... 11-4How to activate parameters ................................................................................................................. 11-6How to deactivate parameters............................................................................................................. 11-7How to create parameters..................................................................................................................... 11-8How to delete parameters .................................................................................................................. 11-10Examples of parameters ..................................................................................................................... 11-11
Example 1: Using a parameter to filter a worksheet ................................................................ 11-11Example 2: Using a parameter that enables multiple values to filter a worksheet ............ 11-12Example 3: Using a parameter to collect dynamic user input ................................................ 11-13
12 Using conditional formatting
What is conditional formatting?......................................................................................................... 12-1What is a conditional format? ....................................................................................................... 12-1What is a stoplight format?............................................................................................................ 12-2
About managing conditional formatting.......................................................................................... 12-2Notes on using conditional formats and stoplight formats .......................................................... 12-4How to activate and deactivate conditional formats and stoplight formats .............................. 12-4How to create conditional formats ..................................................................................................... 12-5How to create stoplight formats ......................................................................................................... 12-7How to edit conditional formats and stoplight formats ................................................................ 12-9How to delete conditional formats and stoplight formats .......................................................... 12-10How to change the color of stoplight formats ............................................................................... 12-11Examples of conditional formatting ................................................................................................ 12-12
Example 1: Conditional format to highlight Profit SUM values greater than 30000 .......... 12-12Example 2: Stoplight format to categorize Profit SUM values on a table worksheet ......... 12-13
viii
Example 3: Stoplight format to categorize hidden Profit SUM values on a crosstab worksheet ...................................................................................................................................... 12-14
13 Using conditions
What are conditions? ............................................................................................................................ 13-1What are multiple conditions?............................................................................................................ 13-2What are nested conditions? ............................................................................................................... 13-2About using conditions........................................................................................................................ 13-3About applying more than one condition ........................................................................................ 13-3How to activate and deactivate existing conditions ....................................................................... 13-3How to create single conditions ......................................................................................................... 13-5How to create multiple conditions..................................................................................................... 13-7How to create nested conditions ........................................................................................................ 13-9How to edit conditions ....................................................................................................................... 13-10How to delete conditions ................................................................................................................... 13-11Notes on how Discoverer applies conditions to roll-ups ............................................................ 13-12Example of how Discoverer applies conditions to roll-ups ........................................................ 13-12Examples of conditions ...................................................................................................................... 13-13
14 Using totals
What are totals?...................................................................................................................................... 14-1About totals on worksheets................................................................................................................. 14-2About SUM and Cell SUM.................................................................................................................. 14-2When to use SUM instead of Cell SUM ........................................................................................... 14-3
Example - using SUM to calculate the average sales per employee ........................................ 14-3When to use Cell SUM instead of SUM ........................................................................................... 14-3
Example - using Cell SUM to calculate an increase in sales ..................................................... 14-3About migrating workbook totals to OracleBI Discoverer ........................................................... 14-4What are aggregated values in Discoverer ....................................................................................... 14-4What are linear and non-linear totals ................................................................................................ 14-5How to display or hide totals .............................................................................................................. 14-5How to create totals............................................................................................................................... 14-6How to edit totals .................................................................................................................................. 14-9How to delete totals ........................................................................................................................... 14-10Examples of totals................................................................................................................................ 14-11Examples of worksheet aggregation in Discoverer ...................................................................... 14-13
Example 1: Example of a Rank calculation using an Oracle9i database ............................... 14-13Example 2: Example showing how Discoverer does not aggregate repeated values using an Oracle9i database .......................................................................................................... 14-14
15 Using percentages
What are percentages? .......................................................................................................................... 15-1How to display or hide percentages .................................................................................................. 15-2How to create percentages ................................................................................................................... 15-3How to edit percentages ....................................................................................................................... 15-5How to delete percentages ................................................................................................................... 15-6
ix
Example of percentages........................................................................................................................ 15-7
16 Sorting data
What is sorting? ..................................................................................................................................... 16-1About sorting on table worksheets.................................................................................................... 16-2About sorting on crosstab worksheets .............................................................................................. 16-2What is group sorting? ......................................................................................................................... 16-3How to sort data on a table worksheet .............................................................................................. 16-4How to sort data on a crosstab worksheet ........................................................................................ 16-5How to change how worksheet data is sorted ................................................................................. 16-6How to remove sorting from a worksheet ........................................................................................ 16-7Examples of sorting............................................................................................................................... 16-7
17 Using calculations
What are calculations? .......................................................................................................................... 17-1About using calculations ..................................................................................................................... 17-2What are analytic functions? ............................................................................................................... 17-3What analytic function templates are available in Discoverer?................................................... 17-3How to display or hide worksheet calculations .............................................................................. 17-4How to create calculations ................................................................................................................... 17-5How to create a new calculation using an analytic function template ....................................... 17-8How to edit calculations..................................................................................................................... 17-11How to delete calculations................................................................................................................. 17-13Examples of calculations .................................................................................................................... 17-14
Part III Sharing results with others
18 Printing worksheets and graphs
About printing in Discoverer Plus Relational................................................................................. 18-1About elements of a printed worksheet in Discoverer Plus Relational ..................................... 18-2What are Page Setup options .............................................................................................................. 18-3About Page Setup options for graphs ............................................................................................... 18-5How to change Page Setup options for a worksheet ...................................................................... 18-9How to print Discoverer workbooks ............................................................................................... 18-10How to print Discoverer worksheets............................................................................................... 18-12How to print Discoverer workbooks and worksheets to PDF files........................................... 18-14
19 Exporting data to other applications
About exporting Discoverer data to other applications................................................................. 19-1About exporting worksheets to Oracle Reports .............................................................................. 19-2About exporting worksheets to Microsoft Excel ............................................................................. 19-3
About using Internet Explorer v6.0 when exporting to Microsoft Excel format ................... 19-4About exporting worksheets to Microsoft Excel Web Query format .......................................... 19-4
About Discoverer support for Microsoft Excel Web Query format ........................................ 19-4About Microsoft Excel Web Query format and Discoverer security....................................... 19-5
x
About how worksheets and graphs are exported............................................................................ 19-5About exporting worksheets that contain page items.................................................................... 19-6About accessing exported files ........................................................................................................... 19-6How to export Discoverer data ........................................................................................................... 19-6
20 Sharing workbooks
About sharing workbooks ................................................................................................................... 20-1About sharing workbooks and security............................................................................................ 20-3How to share workbooks ..................................................................................................................... 20-3
How to share the currently open workbook with other Discoverer users ............................. 20-3How to share multiple workbooks with a single Discoverer user........................................... 20-5
21 Publishing worksheets in OracleAS Portal
What is OracleAS Portal?..................................................................................................................... 21-1What is Discoverer Portlet Provider? ................................................................................................ 21-3What are the different types of Discoverer portlet? ....................................................................... 21-3
About the Discoverer List of Worksheets portlet ....................................................................... 21-4About the Discoverer Worksheet portlet..................................................................................... 21-4About the Discoverer Gauges portlet........................................................................................... 21-5
What you need to publish Discoverer content in OracleAS Portal ............................................. 21-6About creating Discoverer portlets .................................................................................................... 21-6About publishing Discoverer content in portlets ........................................................................... 21-6About choosing database connections for Discoverer portlets .................................................... 21-7About choosing refresh options for Discoverer portlets ............................................................... 21-9About using worksheet parameters in Discoverer portlets .......................................................... 21-9About using OracleAS Portal as a personalization framework for Discoverer ...................... 21-10How to connect to OracleAS Portal and display the Add Portlets page................................... 21-11How to add a Discoverer List of Worksheets portlet to an Oracle Portal page ....................... 21-13How to add a Discoverer Worksheet portlet to an Oracle Portal page...................................... 21-14How to add a Discoverer Gauges portlet to an Oracle Portal page ........................................... 21-15How to edit a Discoverer portlet ...................................................................................................... 21-16How to customize a Discoverer portlet ........................................................................................... 21-17How to customize the Discoverer worksheet in a portlet ........................................................... 21-18How to map worksheet parameters to Page Parameters in Oracle Portal ................................ 21-19
How to map worksheet parameters to Generic Page Parameters ......................................... 21-19How to create a Page Parameter ................................................................................................. 21-20How to map a Generic Page Parameter to a Page Parameter................................................. 21-22
Part IV Advanced Discoverer Plus Relational features
22 Advanced Discoverer Plus Relational Features
Using scheduled workbooks............................................................................................................... 22-1What are scheduled workbooks?.................................................................................................. 22-1When to use scheduled workbooks.............................................................................................. 22-3An example of using a scheduled workbook.............................................................................. 22-3About accessing scheduled workbook results sets .................................................................... 22-4
xi
About how scheduled workbooks are processed....................................................................... 22-5How to schedule workbooks......................................................................................................... 22-5How to edit scheduled workbooks............................................................................................... 22-8How to copy a scheduled workbook............................................................................................ 22-9How to unschedule a scheduled workbook.............................................................................. 22-11How to delete scheduled workbooks and scheduled workbook results sets ...................... 22-12
Using lists of values (LOVs).............................................................................................................. 22-13What is a list of values (LOV)? .................................................................................................... 22-14LOV examples................................................................................................................................ 22-14
A LOV used to specify worksheet parameters .................................................................. 22-15A LOV used in a condition ................................................................................................... 22-15A LOV used in the Discoverer item navigator .................................................................. 22-16
About using long LOVs................................................................................................................ 22-16How to select single values from long LOVs..................................................................... 22-16How to select multiple values from long LOVs ................................................................ 22-18
Changing default settings.................................................................................................................. 22-19About default Discoverer settings .............................................................................................. 22-19How to change default Discoverer settings .............................................................................. 22-20How to revert to the default format settings............................................................................. 22-21How to change default worksheet formats ............................................................................... 22-21Notes on setting Advanced options ........................................................................................... 22-22
About automatic querying ................................................................................................... 22-22About fan traps....................................................................................................................... 22-22About multiple join paths..................................................................................................... 22-24
Using SQL............................................................................................................................................. 22-25What is SQL ................................................................................................................................... 22-25Why should I be interested in SQL?........................................................................................... 22-25What are summaries? ................................................................................................................... 22-25What are summary folders .......................................................................................................... 22-25What is an execution plan? .......................................................................................................... 22-26About the Discoverer execution plan......................................................................................... 22-26How to view SQL.......................................................................................................................... 22-26How to view a SQL execution plan ............................................................................................ 22-27
Part V Discoverer Plus Relational Reference
23 Dialog reference
Available Items pane ............................................................................................................................ 23-5Available Items pane: Calculations tab............................................................................................. 23-6Available Items pane: Conditions area ............................................................................................. 23-8Available Items pane: Items tab ......................................................................................................... 23-9Band by Rank dialog .......................................................................................................................... 23-11Band by Value dialog.......................................................................................................................... 23-12Calendar dialog.................................................................................................................................... 23-14Choose a responsibility dialog ......................................................................................................... 23-15Color Chooser dialog .......................................................................................................................... 23-16
xii
Color Palette Editor dialog ................................................................................................................ 23-18Choose Worksheet dialog .................................................................................................................. 23-19Column Width dialog ......................................................................................................................... 23-20Conditional Formats dialog............................................................................................................... 23-21Confirm Threshold dialog ................................................................................................................. 23-23Data Format dialog (Default Options) ............................................................................................ 23-24Data/graph pane .................................................................................................................................. 23-25Delete Scheduled Workbook Results dialog ................................................................................. 23-26Delete Workbooks from Database dialog....................................................................................... 23-27Difference dialog ................................................................................................................................. 23-28Drill dialog ........................................................................................................................................... 23-30Edit Calculation dialog....................................................................................................................... 23-32Edit Condition dialog ......................................................................................................................... 23-35Edit Graph dialog: Font dialog tab .................................................................................................. 23-39Edit Graph dialog: Legend tab.......................................................................................................... 23-40Edit Graph dialog: Pie Chart Options tab (column) ..................................................................... 23-41Edit Graph dialog: Pie Chart Options tab (row)............................................................................ 23-42Edit Graph dialog: Plot Area tab ...................................................................................................... 23-43Edit Graph dialog: Style tab .............................................................................................................. 23-45Edit Graph dialog: Titles, Totals, and Series tab ........................................................................... 23-46Edit Graph dialog: Type tab .............................................................................................................. 23-48Edit Graph dialog: X-Axis tab ........................................................................................................... 23-49Edit Graph dialog: Y-Axis tab ........................................................................................................... 23-52Edit Heading dialog ............................................................................................................................ 23-55Edit Parameter dialog ......................................................................................................................... 23-56Edit Parameter Values dialog ............................................................................................................ 23-59Edit Percentage dialog ........................................................................................................................ 23-61Edit Text Area dialog........................................................................................................................... 23-64Edit Title dialog ................................................................................................................................... 23-66Edit Total dialog................................................................................................................................... 23-68Edit Worksheet dialog ........................................................................................................................ 23-70Edit Worksheet dialog: Crosstab Layout tab .................................................................................. 23-71Edit Worksheet dialog: Parameters tab ........................................................................................... 23-72Edit Worksheet dialog: Select Items tab ......................................................................................... 23-74
Edit Worksheet dialog: Select Items tab: Items tab .................................................................. 23-76Edit Worksheet dialog: Select Items tab: Conditions tab ........................................................ 23-77Edit Worksheet dialog: Select Items tab: Calculations tab ...................................................... 23-78
Edit Worksheet dialog: Sort tab ........................................................................................................ 23-79Edit Worksheet dialog: Table Layout tab ........................................................................................ 23-81Edit Worksheet dialog: Worksheet Layout tab .............................................................................. 23-82Export Log dialog ................................................................................................................................ 23-83Export Wizard dialog: Format and Name page .............................................................................. 23-84Export Wizard dialog: Graph page................................................................................................... 23-86Export Wizard dialog: Page Item Prompts page ............................................................................ 23-87Export Wizard dialog: Parameter Prompts page............................................................................ 23-88Export Wizard dialog: Select page.................................................................................................... 23-89Export Wizard dialog: Supervise page ............................................................................................ 23-90
xiii
Find dialog (in Item Navigator) ........................................................................................................ 23-91Find dialog (in Worksheet) ................................................................................................................ 23-93Following Value dialog ...................................................................................................................... 23-95Format dialog ....................................................................................................................................... 23-97Format Data dialog.............................................................................................................................. 23-98Format Data dialog: Breaks tab......................................................................................................... 23-99Format Data dialog: Date tab .......................................................................................................... 23-100Format Data dialog: Format tab ...................................................................................................... 23-101Format Data dialog: Number tab.................................................................................................... 23-102Format Data dialog: Text tab ........................................................................................................... 23-104Format heading dialog...................................................................................................................... 23-105Group Total dialog ............................................................................................................................ 23-106Header/Footer Font dialog ............................................................................................................... 23-107Heading Format dialog (Default Options) ................................................................................... 23-108Join folders dialog ............................................................................................................................. 23-109Manage Links dialog ........................................................................................................................ 23-110Manage Workbooks dialog.............................................................................................................. 23-111Move Worksheets dialog.................................................................................................................. 23-113Moving Total dialog.......................................................................................................................... 23-114New Calculation dialog.................................................................................................................... 23-116New Condition dialog ...................................................................................................................... 23-119New Conditional Format dialog..................................................................................................... 23-123New Link dialog ................................................................................................................................ 23-125New Parameter dialog ...................................................................................................................... 23-128New Percentage dialog ..................................................................................................................... 23-131New Scheduled Workbook Results dialog................................................................................... 23-134New Stoplight Format dialog.......................................................................................................... 23-135New Total dialog................................................................................................................................ 23-137Open Workbook from Database dialog ........................................................................................ 23-139Options dialog: Advanced tab ........................................................................................................ 23-141Options dialog: EUL tab................................................................................................................... 23-143Options dialog: Formats tab ............................................................................................................ 23-144Options dialog: General tab ............................................................................................................ 23-145Options dialog: Query Governor tab............................................................................................. 23-147Options dialog: Sheet tab ................................................................................................................ 23-149Page Setup dialog .............................................................................................................................. 23-152Page Setup dialog: Graph tab ......................................................................................................... 23-153Page Setup dialog: Header/Footer tab ........................................................................................... 23-154Page Setup dialog: Margins tab ...................................................................................................... 23-156Page Setup dialog: Table/Crosstab tab .......................................................................................... 23-158Page Setup dialog: Worksheet tab.................................................................................................. 23-162Parameters dialog .............................................................................................................................. 23-164Percent Contribution dialog............................................................................................................ 23-166Percent Difference dialog ................................................................................................................ 23-167Percent Rank dialog .......................................................................................................................... 23-169Percent Running Contribution dialog........................................................................................... 23-171Preceding Value dialog..................................................................................................................... 23-172
xiv
Print dialog ......................................................................................................................................... 23-174Print Preview dialog ......................................................................................................................... 23-176Rank dialog......................................................................................................................................... 23-177Reference Lines dialog ..................................................................................................................... 23-179Running Total dialog ........................................................................................................................ 23-180Save Workbook to Database dialog ............................................................................................... 23-181Schedule Wizard dialog ................................................................................................................... 23-183Schedule Wizard dialog: General tab ............................................................................................ 23-184Schedule Wizard dialog: Schedule tab.......................................................................................... 23-185Scheduling Manager dialog ............................................................................................................ 23-187Select Condition dialog .................................................................................................................... 23-189Select Item dialog .............................................................................................................................. 23-190Select item to drill dialog................................................................................................................. 23-191Selected items pane........................................................................................................................... 23-192Select Parameter dialog .................................................................................................................... 23-193Select User dialog .............................................................................................................................. 23-194Select Value dialog ............................................................................................................................ 23-195Select Values dialog .......................................................................................................................... 23-196Select Workbook from Database dialog ....................................................................................... 23-198Share Workbooks dialog: User -> Workbook tab........................................................................ 23-199Share Workbooks dialog: Workbook -> User tab........................................................................ 23-201Show Condition dialog .................................................................................................................... 23-203Sort Crosstab dialog.......................................................................................................................... 23-204Stoplight colors dialog ..................................................................................................................... 23-206Text area .............................................................................................................................................. 23-207Title area .............................................................................................................................................. 23-208Total Format dialog (Default Options) .......................................................................................... 23-209Workbook Properties dialog ........................................................................................................... 23-210Workbook Wizard: Create/Open Workbook dialog ................................................................... 23-212Worksheet Properties dialog: Aggregation tab............................................................................ 23-214Worksheet Properties dialog: General tab.................................................................................... 23-216Worksheet Properties dialog: Sheet/Crosstab Format tab ......................................................... 23-217
A Discoverer calculation examples
How to find more information about Oracle analytic functions ................................................... A-1About the examples in this chapter ..................................................................................................... A-1How do I create calculations?................................................................................................................ A-1About using parameters to provide dynamic input to calculations .............................................. A-1Simple calculation examples................................................................................................................. A-2Oracle analytic function examples....................................................................................................... A-4
About analytic function categories ................................................................................................. A-5About analytic functions and drilling into and out of data ........................................................ A-5About creating analytic functions................................................................................................... A-5Ranking function examples ............................................................................................................. A-6
About ranking ............................................................................................................................ A-6Example: Assign ranks to sales figures................................................................................... A-6Example: Assign ranks to sales figures within region.......................................................... A-7
xv
Example: Show the top three selling cities per region.......................................................... A-8Example: Show the top three and bottom three selling cities per region .......................... A-8
Banding function examples ............................................................................................................. A-9About banding.......................................................................................................................... A-10Example: Banding by value (1) .............................................................................................. A-11Example: Banding by value (2) .............................................................................................. A-12Example: Banding by rank ..................................................................................................... A-13
Windowing function examples ..................................................................................................... A-14About windowing.................................................................................................................... A-14Example: Calculate a three month moving sales average.................................................. A-15Example: Show the cumulative values of sales ................................................................... A-16Example: Compare sales figures across time using windowing....................................... A-16
Reporting function examples ........................................................................................................ A-17About reporting functions ...................................................................................................... A-17Example: Calculate annual sales............................................................................................ A-17Example: Calculate annual sales by region.......................................................................... A-18Example: Calculate percentage of annual sales by region ................................................. A-19Example: Calculate city sales as a percentage of total sales .............................................. A-20
LAG/LEAD function examples .................................................................................................... A-21About LAG/LEAD functions................................................................................................. A-21Example: Compare sales figures across time using LAG/LEAD..................................... A-21Example: Calculate sales growth across time ...................................................................... A-23Example: Rank sales growth .................................................................................................. A-24
Statistical function examples ......................................................................................................... A-25About statistics functions........................................................................................................ A-25Example: Calculate linear regression ................................................................................... A-26
More about analytic functions expressions ................................................................................. A-27About analytic functions and sequencing ................................................................................... A-27Examples of sequencing ................................................................................................................. A-27
Example of applying single conditions on analytic function items ................................. A-28Example of applying multiple conditions on analytic function items ............................. A-28
About inverse percentile examples .............................................................................................. A-28About differences between PERCENTILE_CONT and PERCENTILE_DISC........................ A-29
Example: Compute the median profit using the PERCENTILE_DISC function ............ A-29Example: Compute the median profit using the PERCENTILE_CONT function.......... A-30
Hypothetical rank and distribution examples ............................................................................ A-30Example: Calculate hypothetical rank .................................................................................. A-31
Banding example............................................................................................................................. A-32Example: Producing equi-width bands using WIDTH_BUCKET.................................... A-32
FIRST/LAST aggregate examples ................................................................................................ A-33Example: Find the largest sales transactions in area with most sales trans’ ................... A-34Example: Find the average sales transaction in area with least sales trans’.................... A-35
Examples of using row-based and time-based intervals ............................................................... A-36Example: Creating a Difference calculation using a row-based interval ................................ A-36Example: Creating a Difference calculation using a time-based interval ............................... A-38Example: Creating a Preceding value calculation using a time-based interval ..................... A-40

xvi
B Discoverer support for Oracle Applications
What are Oracle Applications? ............................................................................................................. B-1What features does Discoverer support for Oracle Applications users?...................................... B-1What are the prerequisites to run Discoverer with Oracle Applications? ................................... B-2About using indexes and values in parameters ................................................................................ B-2How to start Discoverer in Oracle Applications mode using an existing connection ............... B-2
Glossary 1
Index

xvii
Send Us Your Comments
Oracle Business Intelligence Discoverer Plus User’s Guide, 10g Release 2 (10.1.2.0.0)
Part No. B13915-02
Oracle welcomes your comments and suggestions on the quality and usefulness of this publication. Your input is an important part of the information used for revision.
■ Did you find any errors?
■ Is the information clearly presented?
■ Do you need more information? If so, where?
■ Are the examples correct? Do you need more examples?
■ What features did you like most about this manual?
If you find any errors or have any other suggestions for improvement, please indicate the title and part number of the documentation and the chapter, section, and page number (if available). You can send comments to us in the following ways:
■ Electronic mail: [email protected]
■ FAX: 650 506 7421. Attn: OracleBI Discoverer
■ Postal service:
Oracle CorporationOracleBI Discoverer Documentation200 Oracle Parkway, 2OP9Redwood Shores, CA 94065USA
If you would like a reply, please give your name, address, telephone number, and electronic mail address (optional).
If you have problems with the software, please contact your local Oracle Support Services.

xviii
xix
Preface
Welcome to Discoverer Plus - the complete business intelligence (BI) analysis tool that works over the Internet.
Discoverer Plus enables you to query complex databases without having to understand the database language SQL (Structured Query Language). You can use Discoverer Plus to retrieve and analyze data, and produce reports in printed format or a range of electronic formats.
OracleBI Discoverer Plus Relational Navigation and AccessibilityThis section contains information about navigation and accessibility in Discoverer.
Keyboard NavigationOracleBI Discoverer Plus Relational supports standard keyboard navigation. Standard keyboard navigation includes the use of the tab key, mnemonics (using the Alt key and the underlined character), and accelerators (such as Alt+F4 to exit a window).
Changing font sizes and colors for enhanced readabilityYou can change the font size and color of worksheet items, headings, and totals to make them more readable.
To change the default font size and color of new worksheet items, headings, and totals, choose Tools | Options and specify appropriate settings on the "Edit Graph dialog: Titles, Totals, and Series tab".
To change the font size and color of existing worksheet items, headings, and totals, choose Format |Item Formats and specify appropriate settings on the "Format dialog".
Intended AudienceUse this guide when you want to use Discoverer to view and manipulate data to support business decisions and you want to know how to:
■ create new workbooks (i.e. collections of business intelligence reports) or use existing workbooks to find the information you are interested in
■ format the information to meet your requirements
■ analyze the information in different ways
■ share the information with other users
xx
Documentation AccessibilityOur goal is to make Oracle products, services, and supporting documentation accessible, with good usability, to the disabled community. To that end, our documentation includes features that make information available to users of assistive technology. This documentation is available in HTML format, and contains markup to facilitate access by the disabled community. Standards will continue to evolve over time, and Oracle is actively engaged with other market-leading technology vendors to address technical obstacles so that our documentation can be accessible to all of our customers. For additional information, visit the Oracle Accessibility Program Web site at http://www.oracle.com/accessibility/.
Accessibility of Code Examples in Documentation JAWS, a Windows screen reader, may not always correctly read the code examples in this document. The conventions for writing code require that closing braces should appear on an otherwise empty line; however, JAWS may not always read a line of text that consists solely of a bracket or brace.
Note: The JAWS screen-reader requires that Java Access Bridge software is installed on the client machine. You can download Java Access Bridge software from theSun Microsystems site at http://java.sun.com/products/accessbridge/.
For additional information about accessibility software, visit the Oracle Accessibility Program Web site at http://www.oracle.com/accessibility/.
Accessibility of Links to External Web Sites in Documentation This documentation may contain links to Web sites of other companies or organizations that Oracle does not own or control. Oracle neither evaluates nor makes any representations regarding the accessibility of these Web sites.
StructureThis manual contains the following parts:
■ Part I, "Getting started"
■ Part II, "Analyzing data"
■ Part III, "Sharing results with others"
■ Part IV, "Advanced Discoverer Plus Relational features"
■ Part V, "Discoverer Plus Relational Reference"
About screenshots in this documentationDiscoverer Plus can be deployed with a range of different user interface styles (e.g. using different colors, fonts, and button styles). Therefore, the appearance of the Discoverer user interface that you see when you use Discoverer might be different to the screenshots shown in this documentation.
Related DocumentsFor more information, see the following manuals:
■ Oracle Business Intelligence Discoverer Configuration Guide
■ Oracle Business Intelligence Discoverer Administration Guide
xxi
You can access the above documents and other information about OracleBI Discoverer (e.g. white papers, best practices, tutorials) on the Oracle Technology Network at www.oracle.com/technology.
ConventionsThe following conventions are used in this manual:
Discoverer often gives you several ways to perform an operation. For example, to create a new condition you could:
■ choose Tools | Conditions
■ click the Conditions toolbar button
Since you might not be using a mouse, the Discoverer documentation always tells you the menu and menu option to choose.
Prerequisites to run Discoverer Plus RelationalTo run Discoverer Plus Relational, a Discoverer End User Layer must already exist. The Discoverer manager must have created or upgraded the End User Layer using OracleBI Discoverer Administrator.
JGoodies License AgreementOracle Business Intelligence includes the JGoodies software, whose License Agreement follows:
Copyright© 2003 JGoodies Karsten Lentzsch. All rights reserved.
Redistribution and use in source and binary forms, with or without modification, are permitted provided that the following conditions are met:
■ Redistributions of source code must retain the above copyright notice, this list of conditions and the following disclaimer.
■ Redistributions in binary form must reproduce the above copyright notice, this list of conditions and the following disclaimer in the documentation and/or other materials provided with the distribution.
■ Neither the name of JGoodies nor the names of its contributors may be used to endorse or promote products derived from this software without specific prior written permission.
Convention Meaning
File | New Menu options are shown with a vertical bar separating the menu and the name of the option. For example, File | New indicates the selection of the New option from the File menu.
bold type Bold type is used to distinguish field names in Discoverer dialogs.
italic type Italic type is used for the names of other Oracle publications.
Note: Italic type is also used on reference dialogs to refer to areas of a dialog that have no label.
< > Angle brackets enclose user-supplied names.
monotype Characters you type are shown in monotype.

xxii
THIS SOFTWARE IS PROVIDED BY THE COPYRIGHT HOLDERS AND CONTRIBUTORS "AS IS" AND ANY EXPRESS OR IMPLIED WARRANTIES, INCLUDING, BUT NOT LIMITED TO, THE IMPLIED WARRANTIES OF MERCHANTABILITY AND FITNESS FOR A PARTICULAR PURPOSE ARE DISCLAIMED. IN NO EVENT SHALL THE COPYRIGHT OWNER OR CONTRIBUTORS BE LIABLE FOR ANY DIRECT, INDIRECT, INCIDENTAL, SPECIAL, EXEMPLARY, OR CONSEQUENTIAL DAMAGES (INCLUDING, BUT NOT LIMITED TO, PROCUREMENT OF SUBSTITUTE GOODS OR SERVICES; LOSS OF USE, DATA, OR PROFITS; OR BUSINESS INTERRUPTION) HOWEVER CAUSED AND ON ANY THEORY OF LIABILITY, WHETHER IN CONTRACT, STRICT LIABILITY, OR TORT (INCLUDING NEGLIGENCE OR OTHERWISE) ARISING IN ANY WAY OUT OF THE USE OF THIS SOFTWARE, EVEN IF ADVISED OF THE POSSIBILITY OF SUCH DAMAGE.

Part IGetting started
This part explains the basic concepts of OracleBI Discoverer Plus. If you are a first time Discoverer user, or want to refresh your Discoverer knowledge, familiarizing yourself with these concepts will help to you work more effectively with Discoverer.

Introducing Oracle Business Intelligence Discoverer 1-1
1Introducing Oracle Business Intelligence
Discoverer
This chapter introduces Oracle Business Intelligence Discoverer (OracleBI Discoverer), and includes the following topics:
■ "What is OracleBI Discoverer?"
■ "Why should I use OracleBI Discoverer?"
■ "How do I access information using OracleBI Discoverer?"
■ "What is a typical workflow with OracleBI Discoverer?"
■ "What are the different components of OracleBI Discoverer?"
■ "Who is the Discoverer manager and what do they do?"
What is OracleBI Discoverer?OracleBI Discoverer is an intuitive ad-hoc query, reporting, analysis, and Web publishing toolset that gives business users immediate access to information in databases.
OracleBI Discoverer enables business users at all levels of the organization to make faster and more informed business decisions. Using any standard Web browser, you have secure and immediate access to data from both relational and multidimensional data sources. OracleBI Discoverer provides a business view to hide the complexity of the underlying data structures, enabling you to focus on solving business problems.
OracleBI Discoverer comprises a number of integrated components that work together with the Oracle database to give you a complete and integrated Business Intelligence solution.
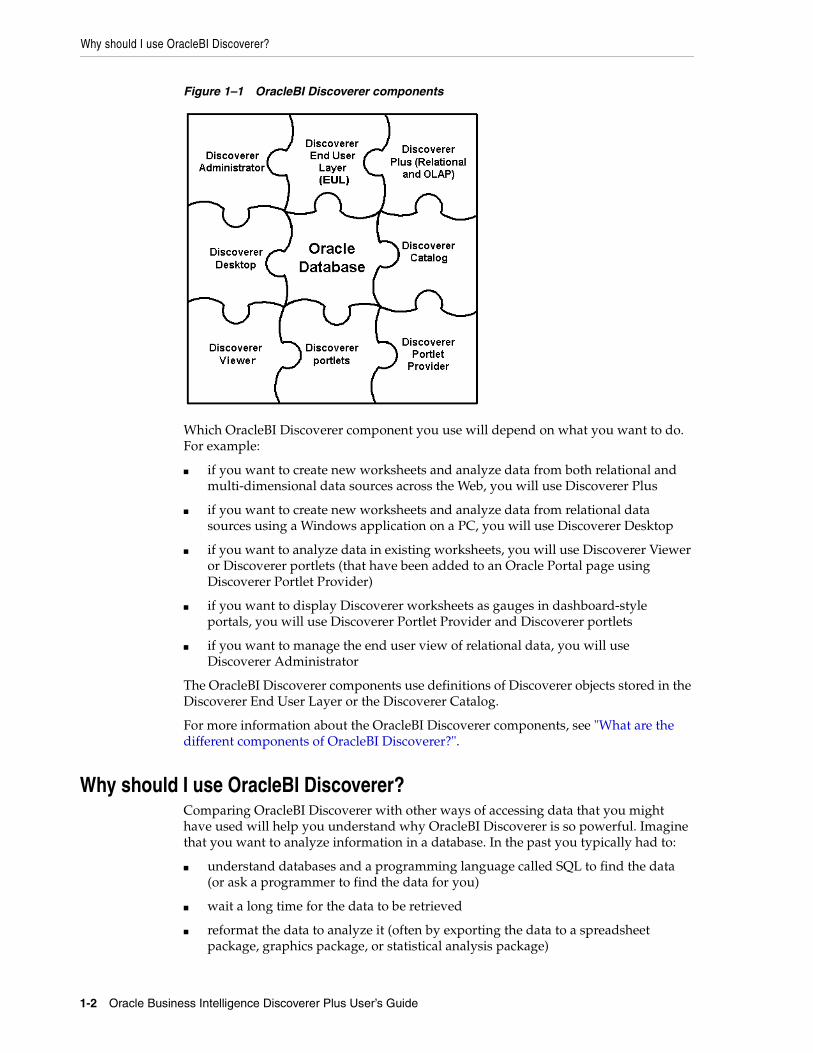
Why should I use OracleBI Discoverer?
1-2 Oracle Business Intelligence Discoverer Plus User’s Guide
Figure 1–1 OracleBI Discoverer components
Which OracleBI Discoverer component you use will depend on what you want to do. For example:
■ if you want to create new worksheets and analyze data from both relational and multi-dimensional data sources across the Web, you will use Discoverer Plus
■ if you want to create new worksheets and analyze data from relational data sources using a Windows application on a PC, you will use Discoverer Desktop
■ if you want to analyze data in existing worksheets, you will use Discoverer Viewer or Discoverer portlets (that have been added to an Oracle Portal page using Discoverer Portlet Provider)
■ if you want to display Discoverer worksheets as gauges in dashboard-style portals, you will use Discoverer Portlet Provider and Discoverer portlets
■ if you want to manage the end user view of relational data, you will use Discoverer Administrator
The OracleBI Discoverer components use definitions of Discoverer objects stored in the Discoverer End User Layer or the Discoverer Catalog.
For more information about the OracleBI Discoverer components, see "What are the different components of OracleBI Discoverer?".
Why should I use OracleBI Discoverer?Comparing OracleBI Discoverer with other ways of accessing data that you might have used will help you understand why OracleBI Discoverer is so powerful. Imagine that you want to analyze information in a database. In the past you typically had to:
■ understand databases and a programming language called SQL to find the data (or ask a programmer to find the data for you)
■ wait a long time for the data to be retrieved
■ reformat the data to analyze it (often by exporting the data to a spreadsheet package, graphics package, or statistical analysis package)
What is a typical workflow with OracleBI Discoverer?
Introducing Oracle Business Intelligence Discoverer 1-3
With OracleBI Discoverer, you simply open a workbook containing the data you want to see and start analyzing. You do not have to know anything about databases. You do not have to wait a long time to get information. You do not have to use another application to analyze your data.
OracleBI Discoverer’s powerful and intuitive user interface enables you to:
■ find data that you know is in the database
■ access data quickly without waiting for the computer to search through the entire database
■ view data in a familiar spreadsheet-style format that is easy to read and understand
■ analyze data using a variety of powerful techniques including:
■ drilling up and down through data
■ finding data that meets certain conditions or that falls within ranges that you specify
■ sorting data
■ prepare reports showing the results of your analysis
■ share data with other people, and in other applications (e.g. Microsoft Excel)
How do I access information using OracleBI Discoverer?You use OracleBI Discoverer to analyze information by creating and using Discoverer workbooks and worksheets.
A workbook is simply a named collection of worksheets. Each worksheet contains the data and graphs that you need to extract business information from the database. Each worksheet contains the result of a query.
Worksheets can show information:
■ as data points in cells (formatted as tables or as crosstabs)
■ as graphs (OracleBI Discoverer supports many different graph types)
You can create and analyze worksheets using Discoverer Plus and Discoverer Desktop.
You can view, analyze, and customize worksheets using Discoverer Viewer and Discoverer portlets.
What is a typical workflow with OracleBI Discoverer?As you become more familiar with OracleBI Discoverer, you will find a workflow that suits you best. Typically, using OracleBI Discoverer is a three-stage process:
■ "Stage 1: Getting the data you want"
■ "Stage 2: Analyzing data"
■ "Stage 3: Sharing data with other people"
Stage 1: Getting the data you wantWhen working with OracleBI Discoverer, you get the data you want by:
■ using existing workbooks created by the Discoverer manager or by other Discoverer users
What are the different components of OracleBI Discoverer?
1-4 Oracle Business Intelligence Discoverer Plus User’s Guide
■ creating new workbooks to analyze data in a new way using Discoverer Plus or Discoverer Desktop
Stage 2: Analyzing dataYour ultimate goal in using OracleBI Discoverer is to analyze data to arrive at a profitable business decision. To do this, you might ask yourself questions about your business. For example:
■ What is the average time for a hospital stay for heart transplant patients?
■ How many engineers have we hired in the last twelve months?
■ Which telephone lines need greater bandwidth?
With Discoverer's data analysis tools, you can find the answers to these and other business questions by:
■ pivoting data to create comparisons
■ drilling up and down in data to see consolidated or more detailed information
■ drilling out to analyze data in other applications
■ creating totals, calculating percentages, and creating custom calculations
■ displaying data visually in graphs and charts
The end result is a collection of worksheets and graphs that persuasively support your business decisions.
Stage 3: Sharing data with other peopleWhen you have retrieved and analyzed data, you will probably want to share your results with other people at your organization, with customers, or with business partners.
If the people you want to share data with also use OracleBI Discoverer:
■ you can share your Discoverer workbooks and worksheets with them (for more information about sharing workbooks, see "About sharing workbooks")
Discoverer Plus users can open worksheets and save their own personal copy to the database. Discoverer Viewer users can view worksheets, and save their own personalizations (personalizations do not affect the source worksheets in the database).
■ you can use Discoverer Portlet Provider to publish worksheets as portlets on Oracle Portal pages (for more information, see "Publishing worksheets in OracleAS Portal")
If the people you want to share data with do not use OracleBI Discoverer, you can export Discoverer worksheets in popular application formats (e.g. Microsoft Excel, HTML). For more information about exporting worksheets, see "About exporting Discoverer data to other applications".
What are the different components of OracleBI Discoverer?OracleBI Discoverer comprises the following components:
■ Oracle Business Intelligence Discoverer Plus
This component runs over the internet or intranet and enables you to:
What are the different components of OracleBI Discoverer?
Introducing Oracle Business Intelligence Discoverer 1-5
– create new worksheets and graphs to get the data you want
– analyze the data
– share worksheets and graphs with other people
For more information:
– about using Discoverer Plus Relational, see "Using Discoverer Plus with a relational data source"
– about using Discoverer Plus OLAP, see "Using Discoverer Plus with a multidimensional data source"
■ Oracle Business Intelligence Discoverer Viewer
This OracleBI Discoverer component runs over the internet or intranet inside a web browser. Use Discoverer Viewer to analyze the data in worksheets created in Discoverer Plus, and Discoverer Desktop. You can personalize worksheets (e.g. by repositioning items) and save your changes.
For more information about Discoverer Viewer, see the Oracle Business Intelligence Discoverer Viewer User’s Guide.
■ Oracle Business Intelligence Discoverer Portlet Provider and Discoverer portlets
These OracleBI Discoverer components run over the internet or intranet inside a web browser. Use Discoverer Portlet Provider to include Discoverer worksheets as areas (or portlets) within existing Oracle Portal pages. Discoverer Portlet Provider enables you to publish the following types of Discoverer portlet:
– a List of Worksheets portlet
– a Worksheet portlet
– a Gauges portlet
You can personalize worksheets (e.g. by adding stoplight formatting) and save your changes.
■ OracleBI Discoverer Desktop
This OracleBI Discoverer component is a Windows-only application that enables you to build new worksheets to analyze data from relational data sources. The worksheets you create in Discoverer Desktop can be used in Discoverer Plus, Discoverer Viewer, and Discoverer portals.
For more information about Discoverer Desktop, see the Oracle Business Intelligence Discoverer Desktop User’s Guide.
■ OracleBI Discoverer Administrator
This OracleBI Discoverer component is a Windows-only application used by the Discoverer manager to create and maintain a business oriented view of relational data. Discoverer Administrator provides wizards and dialogs to:
– control access to data
– manage summary data
– administer batch scheduling
For more information about Discoverer Administrator, see the Oracle Business Intelligence Discoverer Administration Guide.
■ OracleBI Discoverer End User Layer (EUL)
Who is the Discoverer manager and what do they do?
1-6 Oracle Business Intelligence Discoverer Plus User’s Guide
The Discoverer End User Layer component is a repository for storing and retrieving definitions of objects used when querying relational data sources.
For more information about the End User Layer, see the Oracle Business Intelligence Discoverer Administration Guide.
■ OracleBI Discoverer Catalog
The Discoverer Catalog component is a repository for storing and retrieving definitions of user objects when querying multidimensional data sources.
For more information about the Discoverer Catalog, see "What is the Discoverer Catalog?".
Who is the Discoverer manager and what do they do?The Discoverer manager is the person in your organization that is responsible for setting up and maintaining Discoverer. In some organizations, the Discoverer manager also creates predefined workbooks for Discoverer users.
The Discoverer manager uses the Discoverer Administrator component to:
■ organize the data in your organization’s database into business areas
■ give Discoverer users access to data that they are authorized to see
■ optimize Discoverer performance
The Discoverer manager also maintains the Discoverer Catalog.
For more information about the role of the Discoverer manager, see the Oracle Business Intelligence Discoverer Administration Guide.
Using Discoverer Plus with a relational data source 2-1
2Using Discoverer Plus with a relational data
source
This chapter introduces Discoverer Plus Relational and contains the following topics:
■ "What is Discoverer Plus Relational?"
■ "What is a relational data source?"
■ "What are business areas?"
■ "What are folders?"
■ "What are items?"
■ "What is the Discoverer Plus Relational sample database?"
■ "What are the new features in Discoverer Plus 10.1.2.0.0?"
■ "Where can I find out more about Discoverer Plus Relational?"
What is Discoverer Plus Relational?Discoverer Plus Relational is the Discoverer component that enables you to create and analyze worksheets. Using Discoverer Plus Relational, you can access and analyze data from your company’s database, without having to understand complex database concepts. Using wizards and menus, Discoverer Plus Relational guides you through the steps to retrieve and analyze data that supports your business decisions.
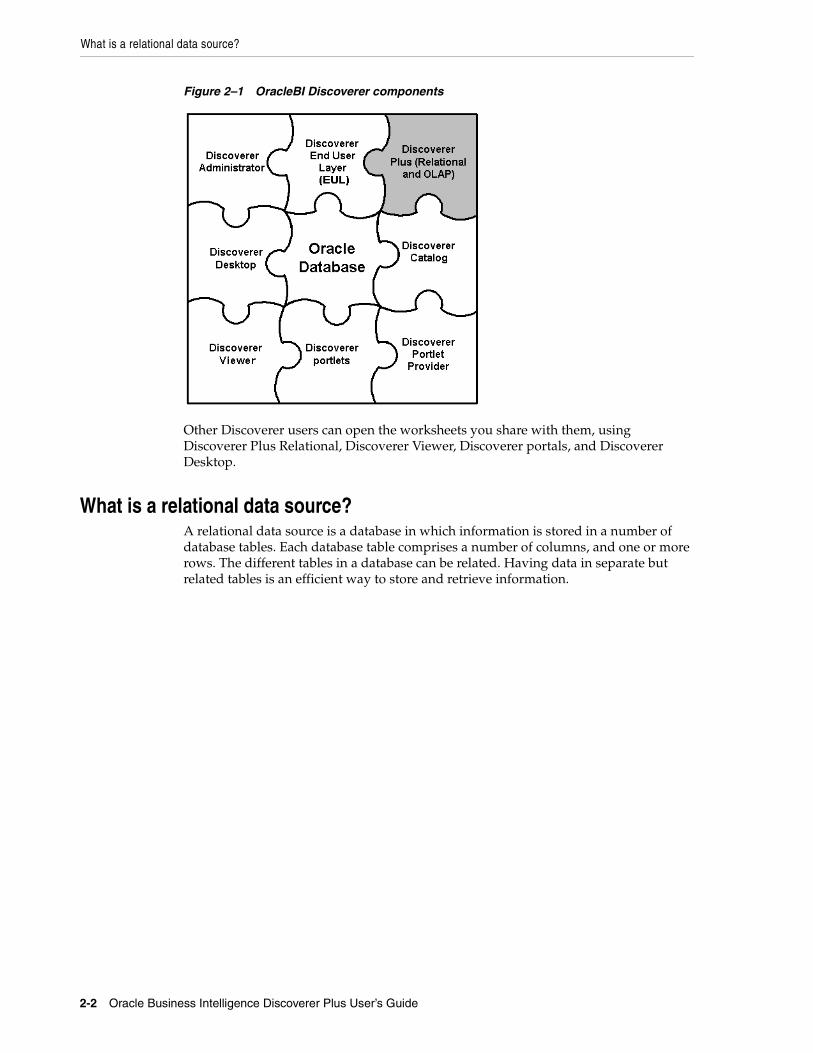
What is a relational data source?
2-2 Oracle Business Intelligence Discoverer Plus User’s Guide
Figure 2–1 OracleBI Discoverer components
Other Discoverer users can open the worksheets you share with them, using Discoverer Plus Relational, Discoverer Viewer, Discoverer portals, and Discoverer Desktop.
What is a relational data source?A relational data source is a database in which information is stored in a number of database tables. Each database table comprises a number of columns, and one or more rows. The different tables in a database can be related. Having data in separate but related tables is an efficient way to store and retrieve information.
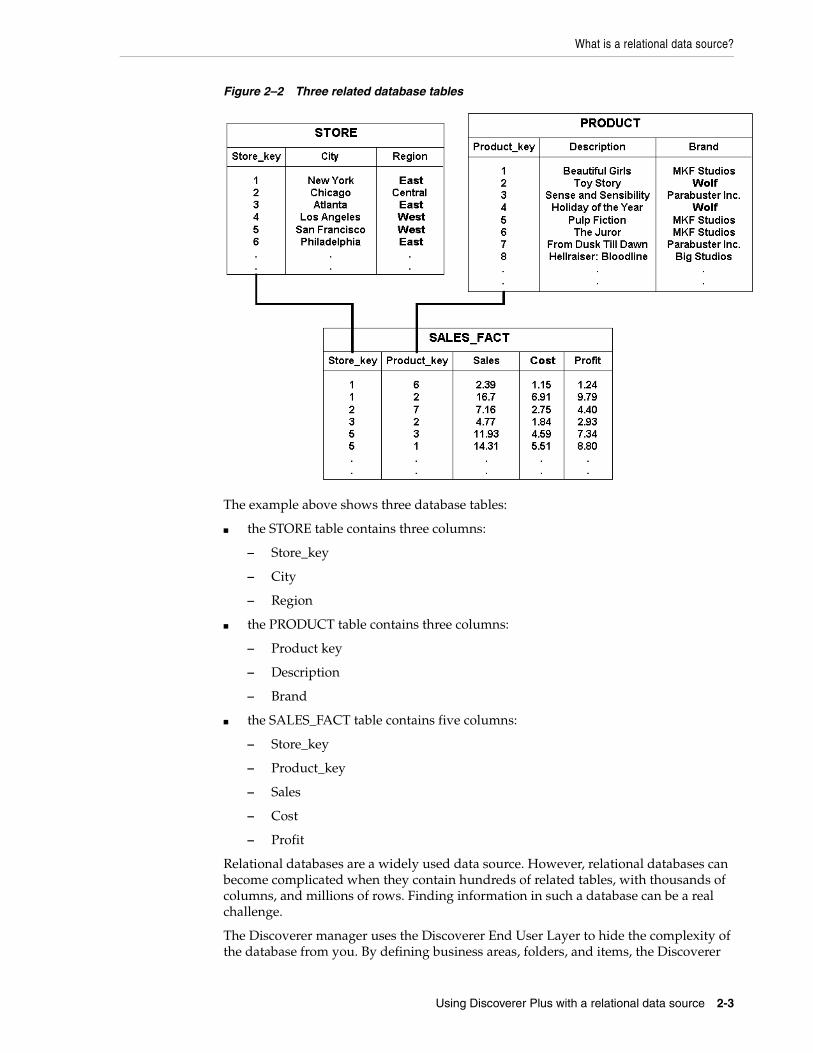
What is a relational data source?
Using Discoverer Plus with a relational data source 2-3
Figure 2–2 Three related database tables
The example above shows three database tables:
■ the STORE table contains three columns:
– Store_key
– City
– Region
■ the PRODUCT table contains three columns:
– Product key
– Description
– Brand
■ the SALES_FACT table contains five columns:
– Store_key
– Product_key
– Sales
– Cost
– Profit
Relational databases are a widely used data source. However, relational databases can become complicated when they contain hundreds of related tables, with thousands of columns, and millions of rows. Finding information in such a database can be a real challenge.
The Discoverer manager uses the Discoverer End User Layer to hide the complexity of the database from you. By defining business areas, folders, and items, the Discoverer
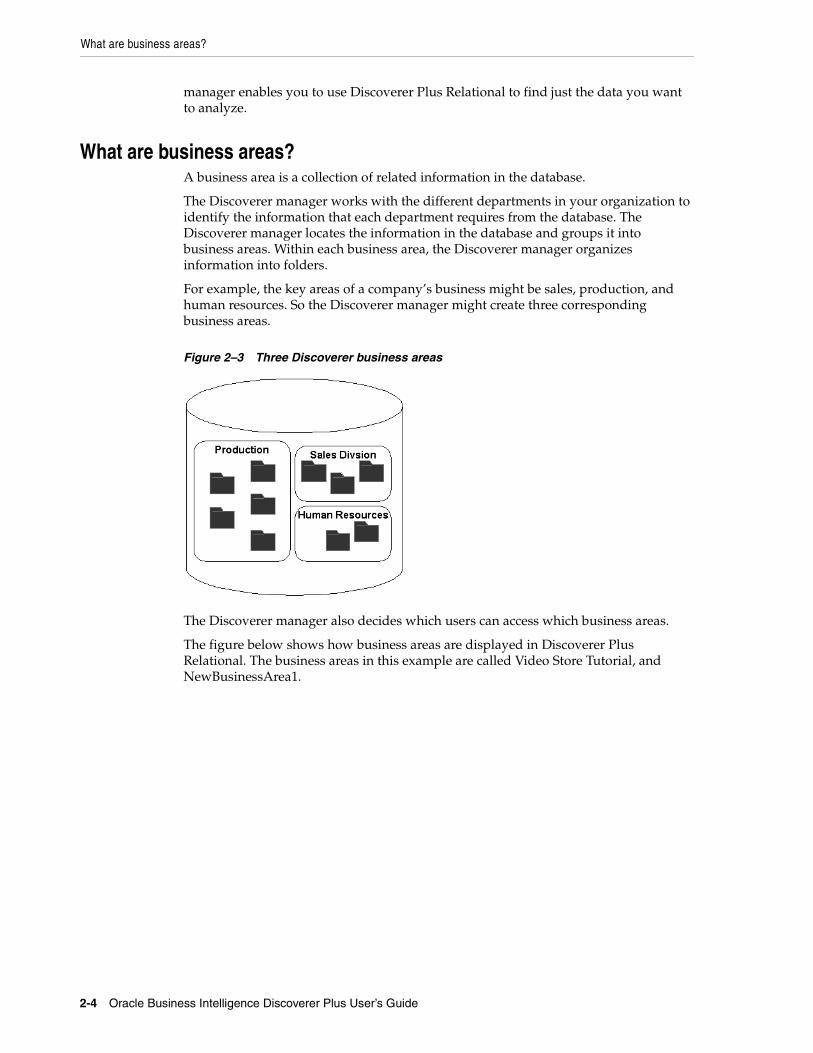
What are business areas?
2-4 Oracle Business Intelligence Discoverer Plus User’s Guide
manager enables you to use Discoverer Plus Relational to find just the data you want to analyze.
What are business areas?A business area is a collection of related information in the database.
The Discoverer manager works with the different departments in your organization to identify the information that each department requires from the database. The Discoverer manager locates the information in the database and groups it into business areas. Within each business area, the Discoverer manager organizes information into folders.
For example, the key areas of a company’s business might be sales, production, and human resources. So the Discoverer manager might create three corresponding business areas.
Figure 2–3 Three Discoverer business areas
The Discoverer manager also decides which users can access which business areas.
The figure below shows how business areas are displayed in Discoverer Plus Relational. The business areas in this example are called Video Store Tutorial, and NewBusinessArea1.
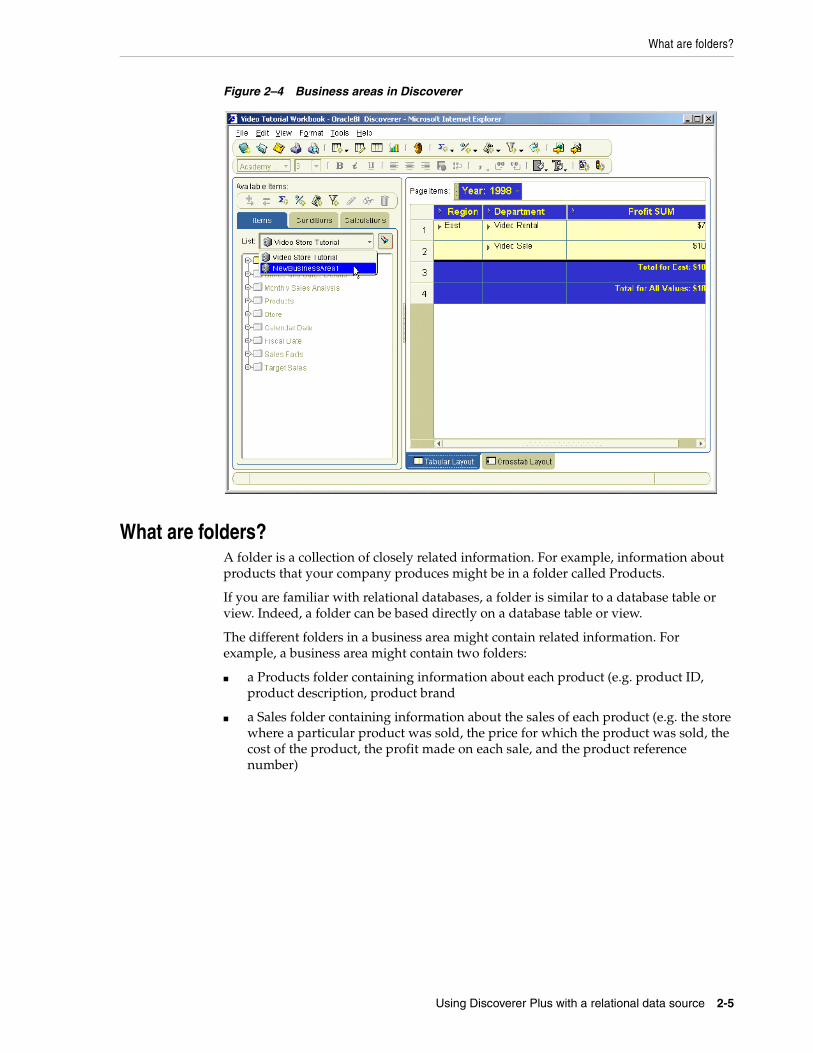
What are folders?
Using Discoverer Plus with a relational data source 2-5
Figure 2–4 Business areas in Discoverer
What are folders?A folder is a collection of closely related information. For example, information about products that your company produces might be in a folder called Products.
If you are familiar with relational databases, a folder is similar to a database table or view. Indeed, a folder can be based directly on a database table or view.
The different folders in a business area might contain related information. For example, a business area might contain two folders:
■ a Products folder containing information about each product (e.g. product ID, product description, product brand
■ a Sales folder containing information about the sales of each product (e.g. the store where a particular product was sold, the price for which the product was sold, the cost of the product, the profit made on each sale, and the product reference number)
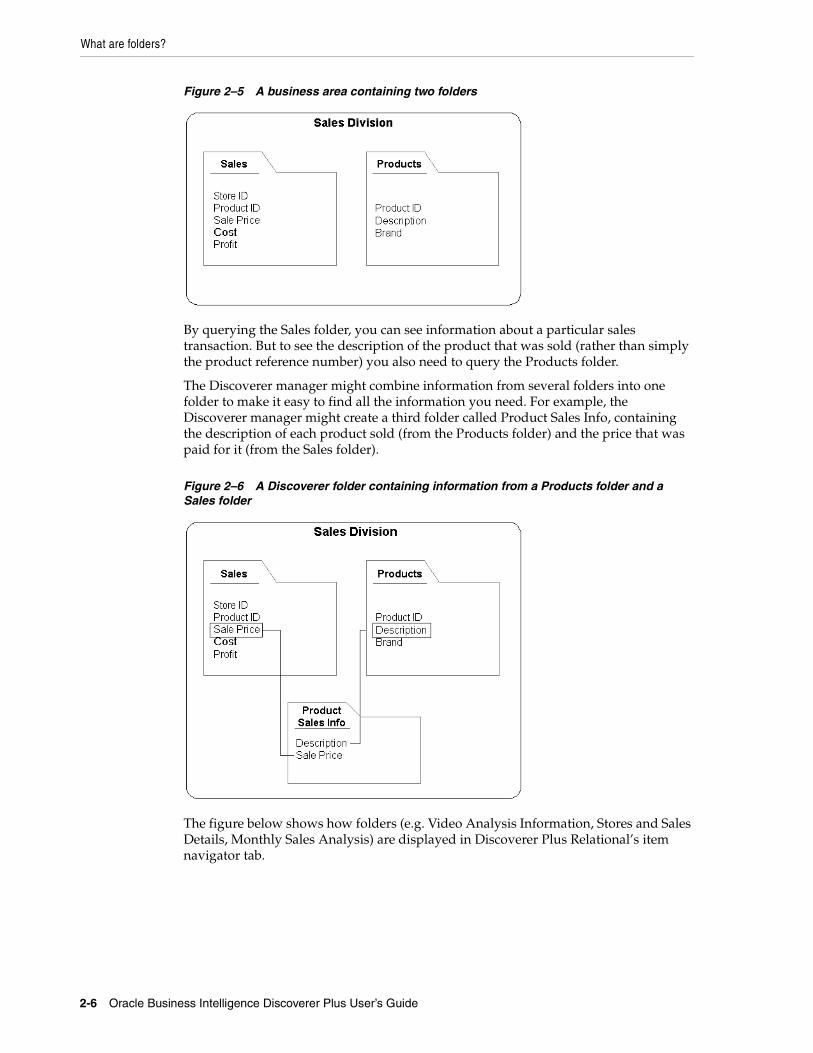
What are folders?
2-6 Oracle Business Intelligence Discoverer Plus User’s Guide
Figure 2–5 A business area containing two folders
By querying the Sales folder, you can see information about a particular sales transaction. But to see the description of the product that was sold (rather than simply the product reference number) you also need to query the Products folder.
The Discoverer manager might combine information from several folders into one folder to make it easy to find all the information you need. For example, the Discoverer manager might create a third folder called Product Sales Info, containing the description of each product sold (from the Products folder) and the price that was paid for it (from the Sales folder).
Figure 2–6 A Discoverer folder containing information from a Products folder and a Sales folder
The figure below shows how folders (e.g. Video Analysis Information, Stores and Sales Details, Monthly Sales Analysis) are displayed in Discoverer Plus Relational’s item navigator tab.
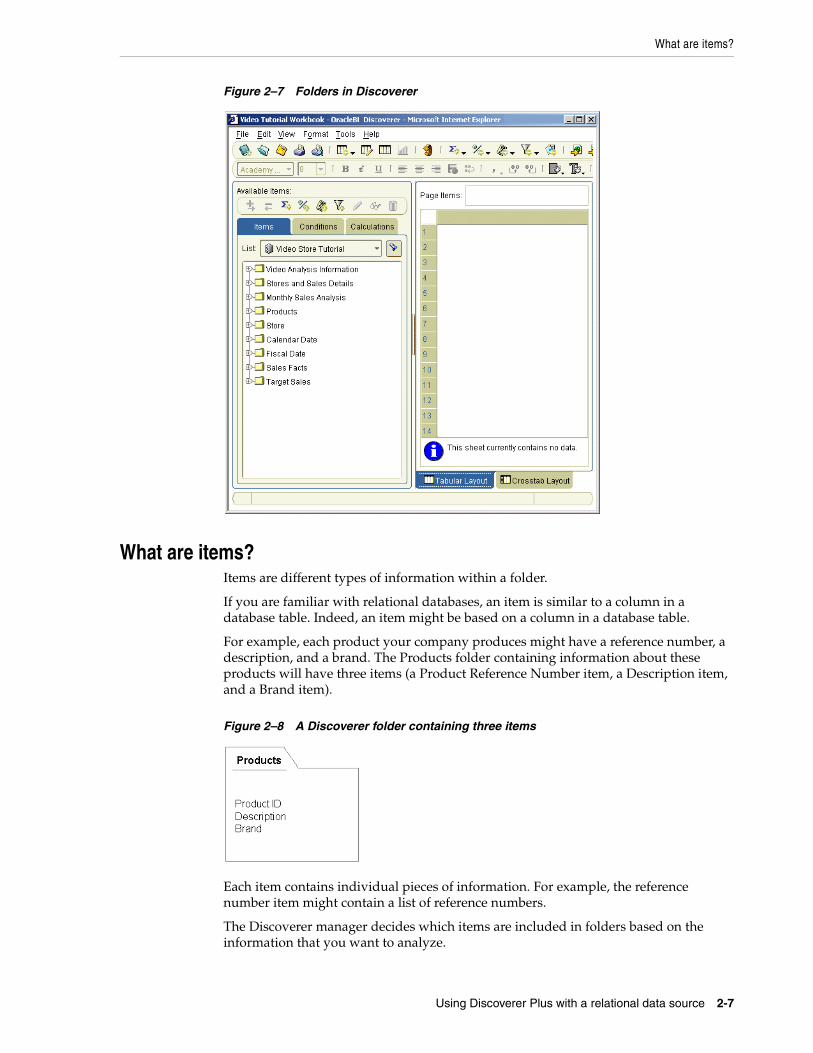
What are items?
Using Discoverer Plus with a relational data source 2-7
Figure 2–7 Folders in Discoverer
What are items?Items are different types of information within a folder.
If you are familiar with relational databases, an item is similar to a column in a database table. Indeed, an item might be based on a column in a database table.
For example, each product your company produces might have a reference number, a description, and a brand. The Products folder containing information about these products will have three items (a Product Reference Number item, a Description item, and a Brand item).
Figure 2–8 A Discoverer folder containing three items
Each item contains individual pieces of information. For example, the reference number item might contain a list of reference numbers.
The Discoverer manager decides which items are included in folders based on the information that you want to analyze.
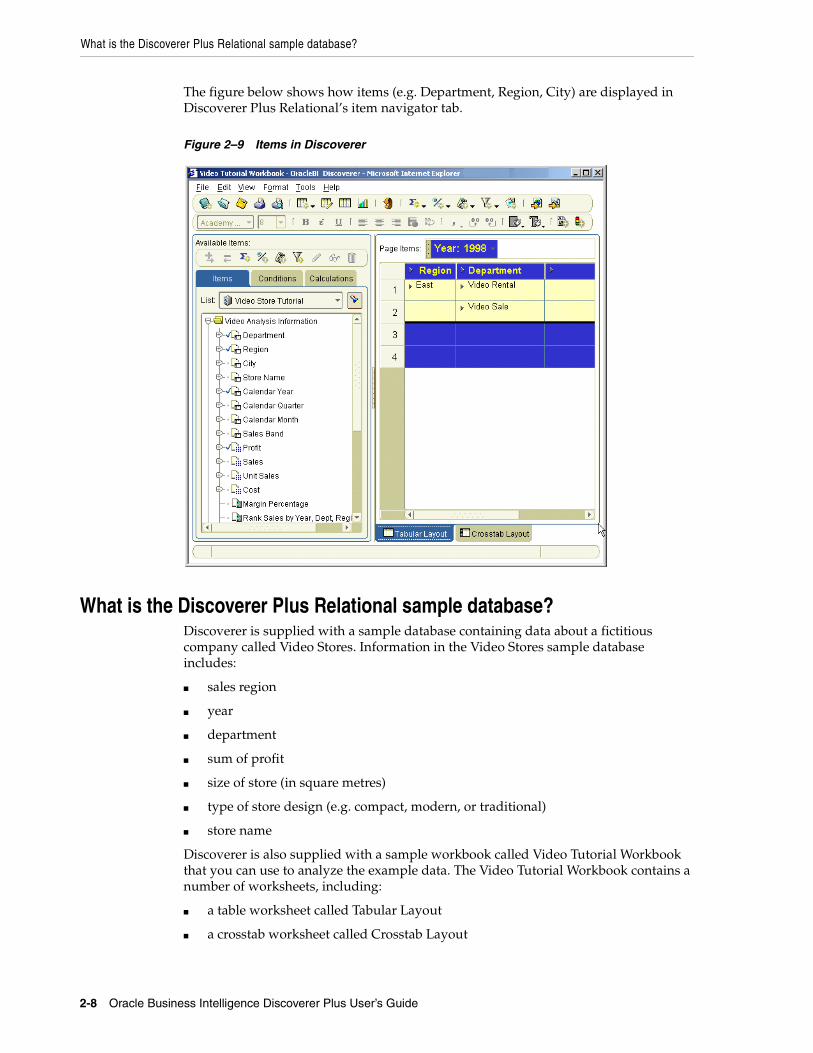
What is the Discoverer Plus Relational sample database?
2-8 Oracle Business Intelligence Discoverer Plus User’s Guide
The figure below shows how items (e.g. Department, Region, City) are displayed in Discoverer Plus Relational’s item navigator tab.
Figure 2–9 Items in Discoverer
What is the Discoverer Plus Relational sample database?Discoverer is supplied with a sample database containing data about a fictitious company called Video Stores. Information in the Video Stores sample database includes:
■ sales region
■ year
■ department
■ sum of profit
■ size of store (in square metres)
■ type of store design (e.g. compact, modern, or traditional)
■ store name
Discoverer is also supplied with a sample workbook called Video Tutorial Workbook that you can use to analyze the example data. The Video Tutorial Workbook contains a number of worksheets, including:
■ a table worksheet called Tabular Layout
■ a crosstab worksheet called Crosstab Layout
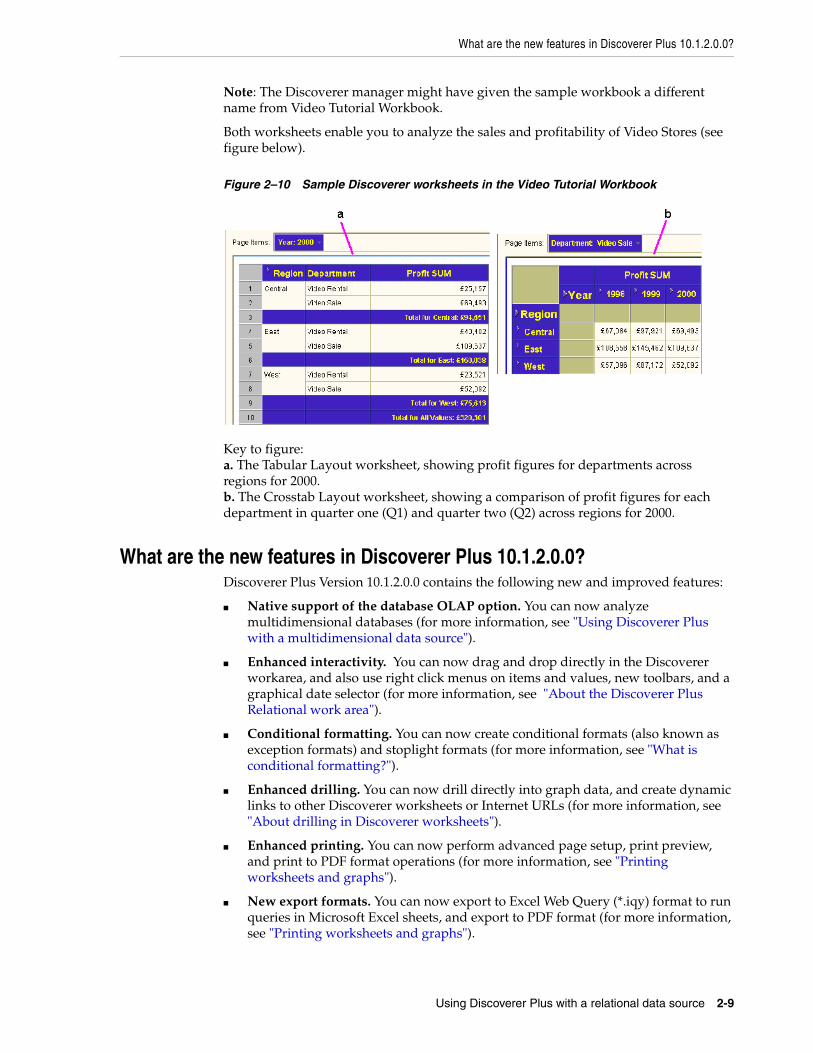
What are the new features in Discoverer Plus 10.1.2.0.0?
Using Discoverer Plus with a relational data source 2-9
Note: The Discoverer manager might have given the sample workbook a different name from Video Tutorial Workbook.
Both worksheets enable you to analyze the sales and profitability of Video Stores (see figure below).
Figure 2–10 Sample Discoverer worksheets in the Video Tutorial Workbook
Key to figure:a. The Tabular Layout worksheet, showing profit figures for departments across regions for 2000.b. The Crosstab Layout worksheet, showing a comparison of profit figures for each department in quarter one (Q1) and quarter two (Q2) across regions for 2000.
What are the new features in Discoverer Plus 10.1.2.0.0?Discoverer Plus Version 10.1.2.0.0 contains the following new and improved features:
■ Native support of the database OLAP option. You can now analyze multidimensional databases (for more information, see "Using Discoverer Plus with a multidimensional data source").
■ Enhanced interactivity. You can now drag and drop directly in the Discoverer workarea, and also use right click menus on items and values, new toolbars, and a graphical date selector (for more information, see "About the Discoverer Plus Relational work area").
■ Conditional formatting. You can now create conditional formats (also known as exception formats) and stoplight formats (for more information, see "What is conditional formatting?").
■ Enhanced drilling. You can now drill directly into graph data, and create dynamic links to other Discoverer worksheets or Internet URLs (for more information, see "About drilling in Discoverer worksheets").
■ Enhanced printing. You can now perform advanced page setup, print preview, and print to PDF format operations (for more information, see "Printing worksheets and graphs").
■ New export formats. You can now export to Excel Web Query (*.iqy) format to run queries in Microsoft Excel sheets, and export to PDF format (for more information, see "Printing worksheets and graphs").
Where can I find out more about Discoverer Plus Relational?
2-10 Oracle Business Intelligence Discoverer Plus User’s Guide
■ Enhanced workbook management. You can now select workbooks from a new workbook list that has improved support for large numbers of users (for more information, see "Using workbooks and worksheets").
■ New portlet types. You can now add a Gauges portlet (to represent data as a gauge) and a List of Worksheets portlet (which replaces the List of Workbooks portlet in previous releases) to Oracle Portal pages (for more information, see "Publishing worksheets in OracleAS Portal").
■ Single Sign-On support for Virtual Private Databases. Depending on how Discoverer has been set up, you can now access data in a Virtual Private Database using a Single Sign-On ID (for more information, see "How do I know what Single Sign-on ID is being used in Discoverer Plus?").
■ Enhanced worksheet formatting. You can now create worksheet text areas, and use new worksheet formatting options (for more information, see "Using workbooks and worksheets" and "Editing worksheets and worksheet items").
■ Enhanced workbook scheduling. You can now share scheduled workbook results with other Discoverer users (for more information, see "Sharing workbooks").
■ Enhanced parameter handling. You can now select parameters using cascading Lists of Values (LOVs) and parameter index values, and parameters are marked as mandatory or optional, (for more information, see "Using parameters").
■ Enhanced charting. You can now select from new graph types and predefined graph styles, and use drill functionality in graphs (for more information, see "Creating graphs in Discoverer").
Where can I find out more about Discoverer Plus Relational?To find out more about Discoverer Plus Relational, use:
■ the Discoverer Plus Relational help system
The Discoverer Plus Relational help system gives you context sensitive access to reference information from the Oracle Business Intelligence Discoverer Plus User’s Guide.
Click the Help button or press F1 in any Discoverer Plus Relational dialog to display context sensitive help, or choose Help | Help Topics to see a list of the topics in the help system.
To find a topic in the help system:
■ use the Contents tab to see a structured list of the topics in the help system
■ use the Index tab to search the help system using pre-defined keywords and phrases
■ use the Search tab to search the help system for keywords and phrase s that you define
■ the Oracle Business Intelligence Discoverer Plus User’s Guide
The Oracle Business Intelligence Discoverer Plus User’s Guide is available in html and PDF format on:
■ the Oracle Application Server Documentation CD
■ the Oracle Technology Network at www.oracle.com/technology
■ Oracle Technology Network

Where can I find out more about Discoverer Plus Relational?
Using Discoverer Plus with a relational data source 2-11
Other information about Discoverer Plus (e.g. white papers, best practices) is available from Oracle Technology Network at www.oracle.com/technology.

Where can I find out more about Discoverer Plus Relational?
2-12 Oracle Business Intelligence Discoverer Plus User’s Guide
Using Discoverer Plus with a multidimensional data source 3-1
3Using Discoverer Plus with a
multidimensional data source
This chapter introduces Discoverer Plus OLAP and contains the following topics:
■ "How can I tell when I am using Discoverer Plus with a multidimensional data source?"
■ "What is Discoverer Plus OLAP?"
■ "What is online analytic processing (OLAP)?"
■ "What are multidimensional data sources?"
■ "What are multidimensional cubes?"
■ "What are measures?"
■ "What are dimensions and dimension members?"
■ "What are dimension hierarchies?"
■ "What are dimension attributes?"
■ "About aggregating and filtering multidimensional data"
■ "About applying filters after aggregating multidimensional data"
■ "About filters and dimensions"
■ "What is the Discoverer Catalog?"
■ "About the Discoverer Plus OLAP Tutorial"
■ "Where can I find out more about Discoverer Plus OLAP?"
How can I tell when I am using Discoverer Plus with a multidimensional data source?
When you are using Discoverer Plus with a multidimensional data source, the Connect to property of the connection that you choose to start Discoverer Plus is set to OracleBI Discoverer for OLAP.
If you start Discoverer Plus with a multidimensional data source by entering login details directly in Discoverer Connections page, you must select OracleBI Discoverer for OLAP from the Connect To drop down list.
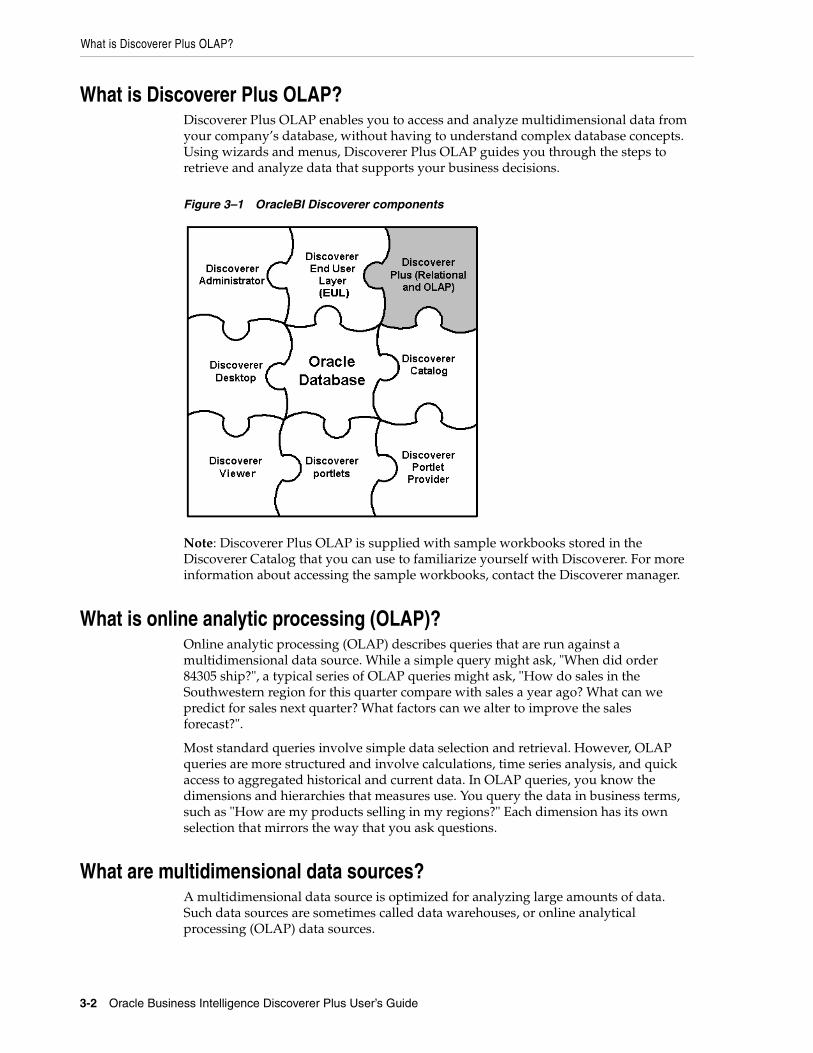
What is Discoverer Plus OLAP?
3-2 Oracle Business Intelligence Discoverer Plus User’s Guide
What is Discoverer Plus OLAP?Discoverer Plus OLAP enables you to access and analyze multidimensional data from your company’s database, without having to understand complex database concepts. Using wizards and menus, Discoverer Plus OLAP guides you through the steps to retrieve and analyze data that supports your business decisions.
Figure 3–1 OracleBI Discoverer components
Note: Discoverer Plus OLAP is supplied with sample workbooks stored in the Discoverer Catalog that you can use to familiarize yourself with Discoverer. For more information about accessing the sample workbooks, contact the Discoverer manager.
What is online analytic processing (OLAP)?Online analytic processing (OLAP) describes queries that are run against a multidimensional data source. While a simple query might ask, "When did order 84305 ship?", a typical series of OLAP queries might ask, "How do sales in the Southwestern region for this quarter compare with sales a year ago? What can we predict for sales next quarter? What factors can we alter to improve the sales forecast?".
Most standard queries involve simple data selection and retrieval. However, OLAP queries are more structured and involve calculations, time series analysis, and quick access to aggregated historical and current data. In OLAP queries, you know the dimensions and hierarchies that measures use. You query the data in business terms, such as "How are my products selling in my regions?" Each dimension has its own selection that mirrors the way that you ask questions.
What are multidimensional data sources?A multidimensional data source is optimized for analyzing large amounts of data. Such data sources are sometimes called data warehouses, or online analytical processing (OLAP) data sources.
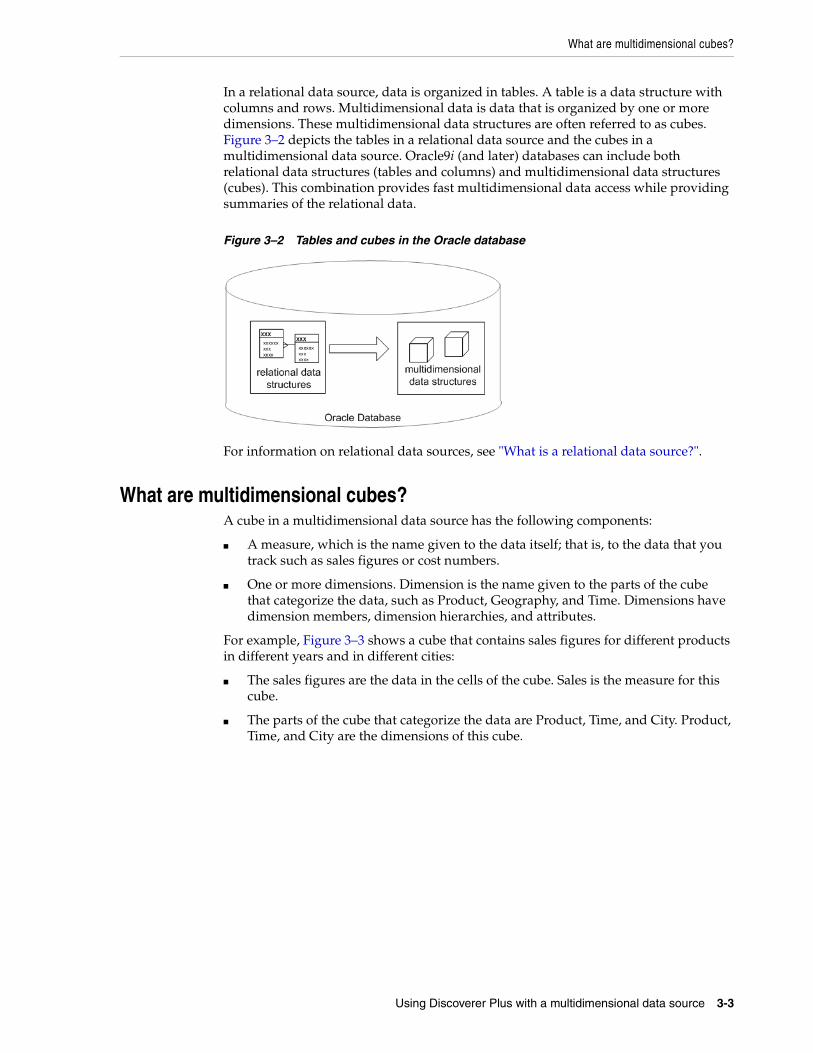
What are multidimensional cubes?
Using Discoverer Plus with a multidimensional data source 3-3
In a relational data source, data is organized in tables. A table is a data structure with columns and rows. Multidimensional data is data that is organized by one or more dimensions. These multidimensional data structures are often referred to as cubes. Figure 3–2 depicts the tables in a relational data source and the cubes in a multidimensional data source. Oracle9i (and later) databases can include both relational data structures (tables and columns) and multidimensional data structures (cubes). This combination provides fast multidimensional data access while providing summaries of the relational data.
Figure 3–2 Tables and cubes in the Oracle database
For information on relational data sources, see "What is a relational data source?".
What are multidimensional cubes?A cube in a multidimensional data source has the following components:
■ A measure, which is the name given to the data itself; that is, to the data that you track such as sales figures or cost numbers.
■ One or more dimensions. Dimension is the name given to the parts of the cube that categorize the data, such as Product, Geography, and Time. Dimensions have dimension members, dimension hierarchies, and attributes.
For example, Figure 3–3 shows a cube that contains sales figures for different products in different years and in different cities:
■ The sales figures are the data in the cells of the cube. Sales is the measure for this cube.
■ The parts of the cube that categorize the data are Product, Time, and City. Product, Time, and City are the dimensions of this cube.
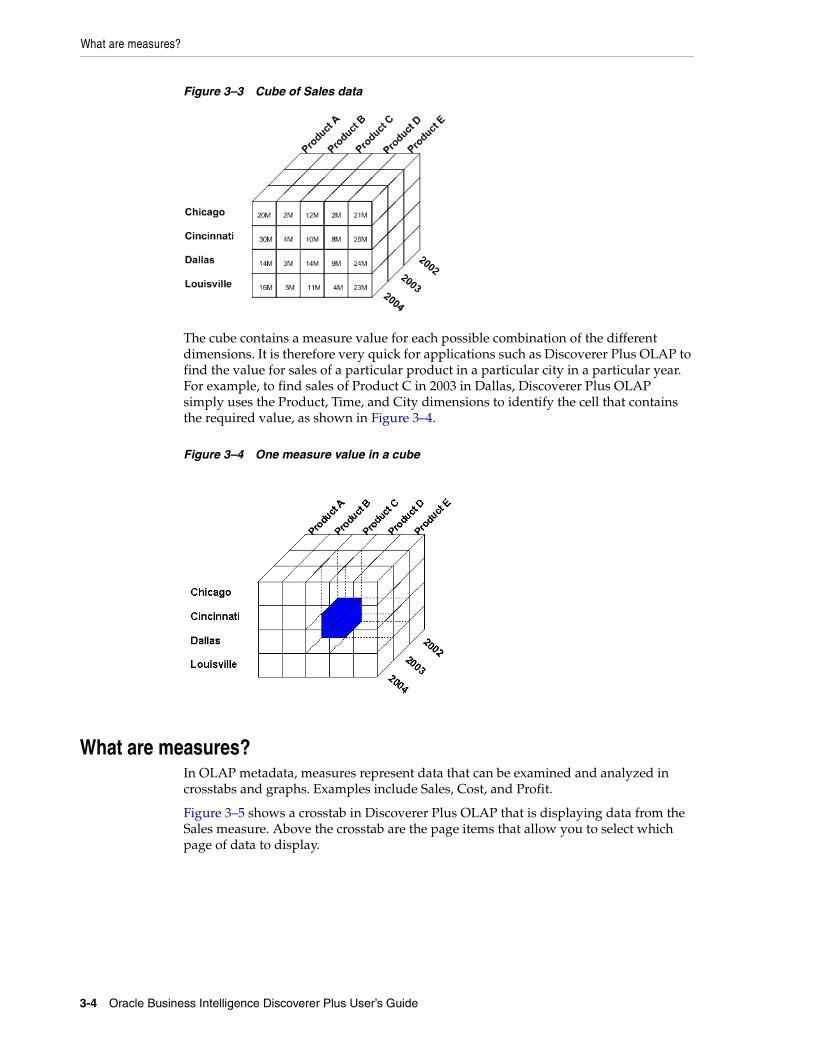
What are measures?
3-4 Oracle Business Intelligence Discoverer Plus User’s Guide
Figure 3–3 Cube of Sales data
The cube contains a measure value for each possible combination of the different dimensions. It is therefore very quick for applications such as Discoverer Plus OLAP to find the value for sales of a particular product in a particular city in a particular year. For example, to find sales of Product C in 2003 in Dallas, Discoverer Plus OLAP simply uses the Product, Time, and City dimensions to identify the cell that contains the required value, as shown in Figure 3–4.
Figure 3–4 One measure value in a cube
What are measures?In OLAP metadata, measures represent data that can be examined and analyzed in crosstabs and graphs. Examples include Sales, Cost, and Profit.
Figure 3–5 shows a crosstab in Discoverer Plus OLAP that is displaying data from the Sales measure. Above the crosstab are the page items that allow you to select which page of data to display.
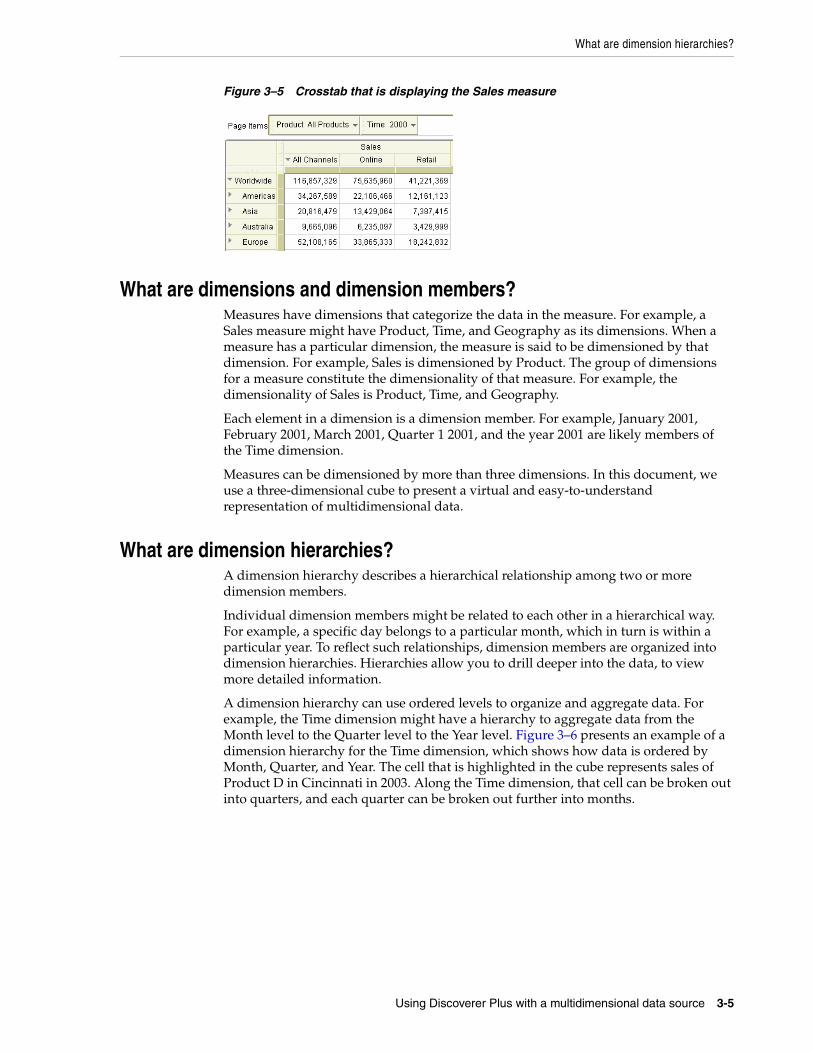
What are dimension hierarchies?
Using Discoverer Plus with a multidimensional data source 3-5
Figure 3–5 Crosstab that is displaying the Sales measure
What are dimensions and dimension members?Measures have dimensions that categorize the data in the measure. For example, a Sales measure might have Product, Time, and Geography as its dimensions. When a measure has a particular dimension, the measure is said to be dimensioned by that dimension. For example, Sales is dimensioned by Product. The group of dimensions for a measure constitute the dimensionality of that measure. For example, the dimensionality of Sales is Product, Time, and Geography.
Each element in a dimension is a dimension member. For example, January 2001, February 2001, March 2001, Quarter 1 2001, and the year 2001 are likely members of the Time dimension.
Measures can be dimensioned by more than three dimensions. In this document, we use a three-dimensional cube to present a virtual and easy-to-understand representation of multidimensional data.
What are dimension hierarchies?A dimension hierarchy describes a hierarchical relationship among two or more dimension members.
Individual dimension members might be related to each other in a hierarchical way. For example, a specific day belongs to a particular month, which in turn is within a particular year. To reflect such relationships, dimension members are organized into dimension hierarchies. Hierarchies allow you to drill deeper into the data, to view more detailed information.
A dimension hierarchy can use ordered levels to organize and aggregate data. For example, the Time dimension might have a hierarchy to aggregate data from the Month level to the Quarter level to the Year level. Figure 3–6 presents an example of a dimension hierarchy for the Time dimension, which shows how data is ordered by Month, Quarter, and Year. The cell that is highlighted in the cube represents sales of Product D in Cincinnati in 2003. Along the Time dimension, that cell can be broken out into quarters, and each quarter can be broken out further into months.
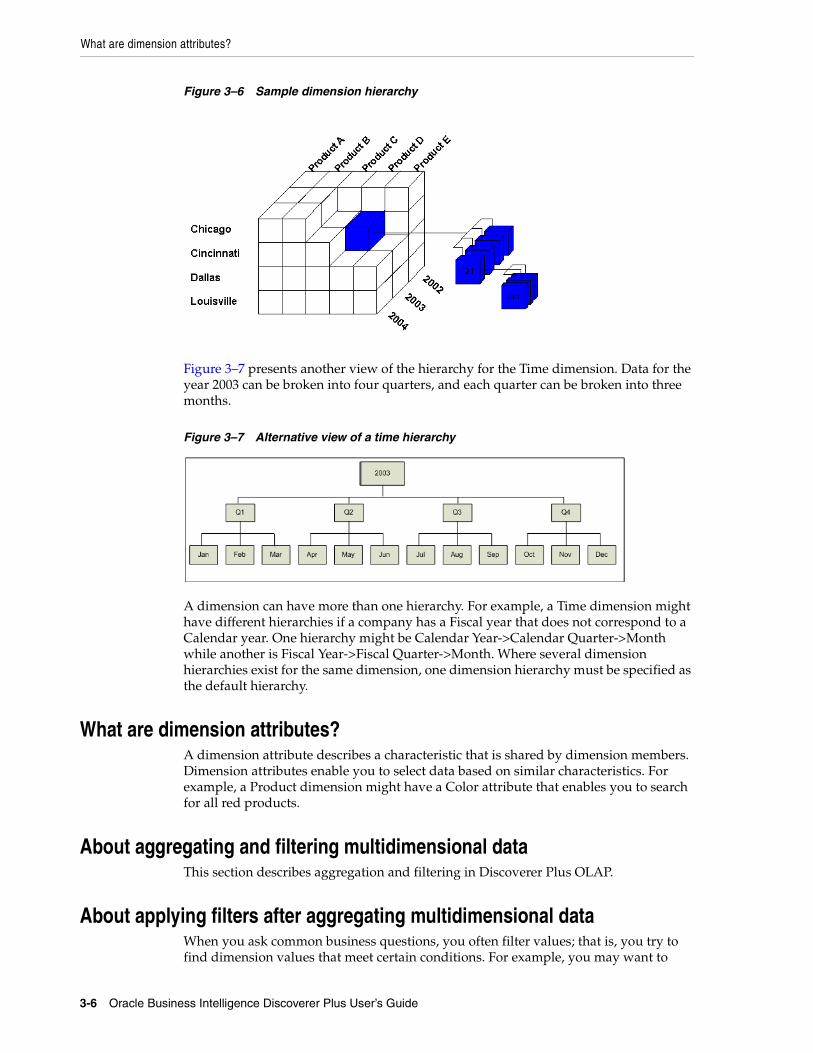
What are dimension attributes?
3-6 Oracle Business Intelligence Discoverer Plus User’s Guide
Figure 3–6 Sample dimension hierarchy
Figure 3–7 presents another view of the hierarchy for the Time dimension. Data for the year 2003 can be broken into four quarters, and each quarter can be broken into three months.
Figure 3–7 Alternative view of a time hierarchy
A dimension can have more than one hierarchy. For example, a Time dimension might have different hierarchies if a company has a Fiscal year that does not correspond to a Calendar year. One hierarchy might be Calendar Year->Calendar Quarter->Month while another is Fiscal Year->Fiscal Quarter->Month. Where several dimension hierarchies exist for the same dimension, one dimension hierarchy must be specified as the default hierarchy.
What are dimension attributes?A dimension attribute describes a characteristic that is shared by dimension members. Dimension attributes enable you to select data based on similar characteristics. For example, a Product dimension might have a Color attribute that enables you to search for all red products.
About aggregating and filtering multidimensional dataThis section describes aggregation and filtering in Discoverer Plus OLAP.
About applying filters after aggregating multidimensional dataWhen you ask common business questions, you often filter values; that is, you try to find dimension values that meet certain conditions. For example, you may want to
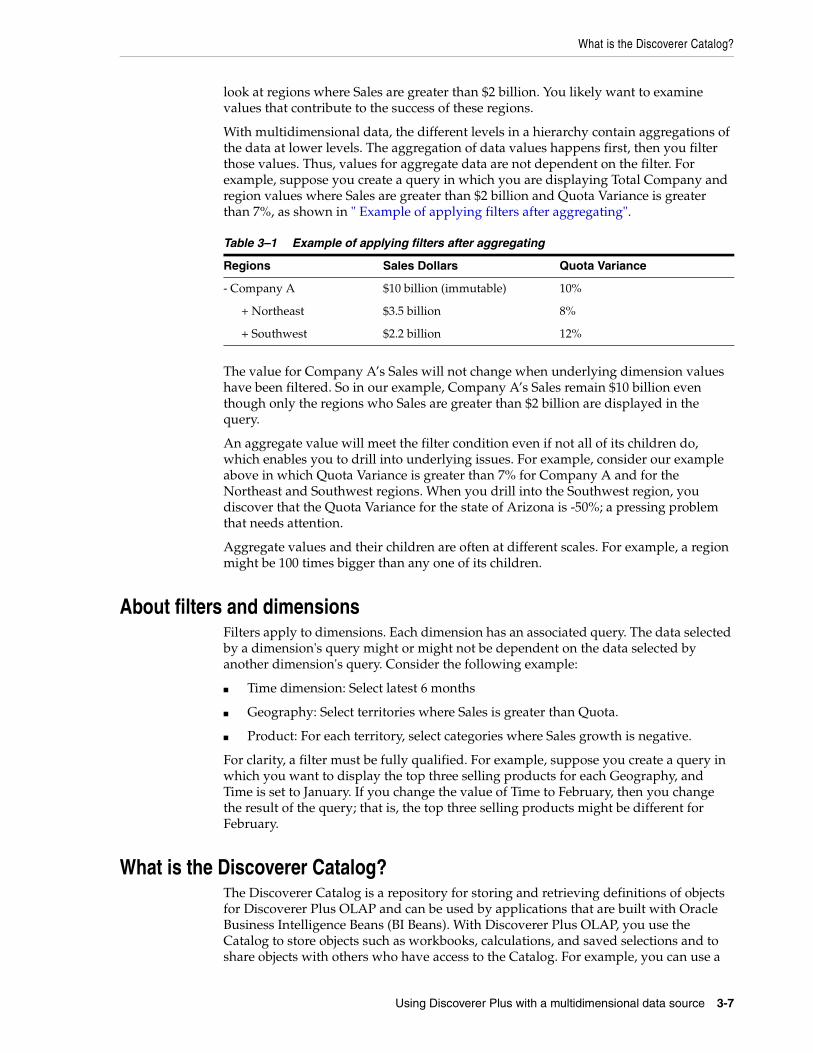
What is the Discoverer Catalog?
Using Discoverer Plus with a multidimensional data source 3-7
look at regions where Sales are greater than $2 billion. You likely want to examine values that contribute to the success of these regions.
With multidimensional data, the different levels in a hierarchy contain aggregations of the data at lower levels. The aggregation of data values happens first, then you filter those values. Thus, values for aggregate data are not dependent on the filter. For example, suppose you create a query in which you are displaying Total Company and region values where Sales are greater than $2 billion and Quota Variance is greater than 7%, as shown in " Example of applying filters after aggregating".
The value for Company A’s Sales will not change when underlying dimension values have been filtered. So in our example, Company A’s Sales remain $10 billion even though only the regions who Sales are greater than $2 billion are displayed in the query.
An aggregate value will meet the filter condition even if not all of its children do, which enables you to drill into underlying issues. For example, consider our example above in which Quota Variance is greater than 7% for Company A and for the Northeast and Southwest regions. When you drill into the Southwest region, you discover that the Quota Variance for the state of Arizona is -50%; a pressing problem that needs attention.
Aggregate values and their children are often at different scales. For example, a region might be 100 times bigger than any one of its children.
About filters and dimensionsFilters apply to dimensions. Each dimension has an associated query. The data selected by a dimension's query might or might not be dependent on the data selected by another dimension's query. Consider the following example:
■ Time dimension: Select latest 6 months
■ Geography: Select territories where Sales is greater than Quota.
■ Product: For each territory, select categories where Sales growth is negative.
For clarity, a filter must be fully qualified. For example, suppose you create a query in which you want to display the top three selling products for each Geography, and Time is set to January. If you change the value of Time to February, then you change the result of the query; that is, the top three selling products might be different for February.
What is the Discoverer Catalog?The Discoverer Catalog is a repository for storing and retrieving definitions of objects for Discoverer Plus OLAP and can be used by applications that are built with Oracle Business Intelligence Beans (BI Beans). With Discoverer Plus OLAP, you use the Catalog to store objects such as workbooks, calculations, and saved selections and to share objects with others who have access to the Catalog. For example, you can use a
Table 3–1 Example of applying filters after aggregating
Regions Sales Dollars Quota Variance
- Company A $10 billion (immutable) 10%
+ Northeast $3.5 billion 8%
+ Southwest $2.2 billion 12%
About the Discoverer Plus OLAP Tutorial
3-8 Oracle Business Intelligence Discoverer Plus User’s Guide
BI Beans application to create a graph and store it in the Catalog. If another user has appropriate access, that user can retrieve the graph that you stored in the Catalog and insert the graph into a new worksheet in Discoverer Plus OLAP.
The Catalog provides security at the object level, by allowing users and system administrators to specify access to certain objects.
About the Discoverer Plus OLAP TutorialFor a hands-on introduction to using Discoverer Plus OLAP, refer to the Discoverer Plus OLAP Tutorial. The tutorial guides you through the creation of a sample workbook, which displays data about a fictitious company.
You can access the Discoverer Plus OLAP Tutorial and other information about Discoverer (such as white papers and best practices) from Oracle Technology Network at www.oracle.com/technology.
Where can I find out more about Discoverer Plus OLAP?To find out more about Discoverer Plus OLAP, use:
■ the Discoverer Plus OLAP help system
Click the Help button or press F1 in any Discoverer Plus OLAP dialog to display context sensitive help, or choose Help | Help Topics to see a list of the topics in the help system.
To find a topic in the help system:
■ use the Contents tab to see a structured list of the topics in the help system
■ use the Index tab to search the help system using pre-defined keywords and phrases
■ use the Search tab to search the help system for keywords and phrase s that you define
■ the Discoverer Plus OLAP Tutorial
Use the Discoverer Plus OLAP tutorial to begin learning about Discoverer Plus OLAP. For more information, see "About the Discoverer Plus OLAP Tutorial".
■ Oracle Technology Network
Other information about Discoverer Plus OLAP (e.g. white papers, best practices) is available from Oracle Technology Network at www.oracle.com/technology.
Starting Discoverer 4-1
4Starting Discoverer
This chapter explains how to start Discoverer, and contains the following topics:
■ "What is a Discoverer connection?"
■ "About starting Discoverer"
■ "How to display the Discoverer Plus connections page"
■ "How to start Discoverer using an existing connection"
■ "How to start Discoverer by connecting directly"
■ "How to exit Discoverer Plus"
■ "Frequently asked questions"
What is a Discoverer connection?A Discoverer connection stores login details that enable you to connect to Discoverer. Each connection stores the following information:
■ database user name
■ database password
■ database name
■ (optional) Oracle Applications responsibility
■ language
■ EUL
Discoverer login details are saved automatically when you create a connection. From then on, you can start Discoverer simply by clicking on a connection name in the Discoverer connections list that is displayed when you run Discoverer.
Notes■ You can also start Discoverer without creating a connection, by connecting directly
(for more information, see "How to start Discoverer by connecting directly").
■ For more information about saving login information in a private connection, see "How do I create and save login information in a Discoverer connection?".
■ If you require login details to enable you to create your own Discoverer connections, contact the Discoverer manager.
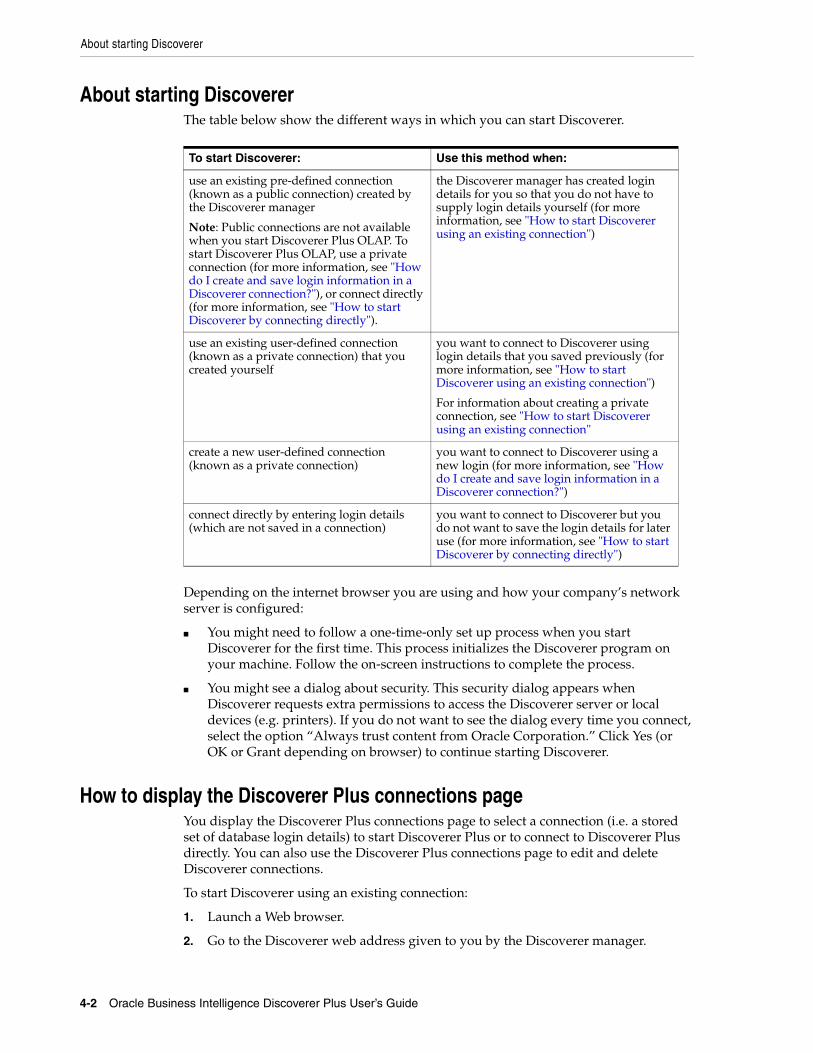
About starting Discoverer
4-2 Oracle Business Intelligence Discoverer Plus User’s Guide
About starting DiscovererThe table below show the different ways in which you can start Discoverer.
Depending on the internet browser you are using and how your company’s network server is configured:
■ You might need to follow a one-time-only set up process when you start Discoverer for the first time. This process initializes the Discoverer program on your machine. Follow the on-screen instructions to complete the process.
■ You might see a dialog about security. This security dialog appears when Discoverer requests extra permissions to access the Discoverer server or local devices (e.g. printers). If you do not want to see the dialog every time you connect, select the option “Always trust content from Oracle Corporation.” Click Yes (or OK or Grant depending on browser) to continue starting Discoverer.
How to display the Discoverer Plus connections pageYou display the Discoverer Plus connections page to select a connection (i.e. a stored set of database login details) to start Discoverer Plus or to connect to Discoverer Plus directly. You can also use the Discoverer Plus connections page to edit and delete Discoverer connections.
To start Discoverer using an existing connection:
1. Launch a Web browser.
2. Go to the Discoverer web address given to you by the Discoverer manager.
To start Discoverer: Use this method when:
use an existing pre-defined connection (known as a public connection) created by the Discoverer manager
Note: Public connections are not available when you start Discoverer Plus OLAP. To start Discoverer Plus OLAP, use a private connection (for more information, see "How do I create and save login information in a Discoverer connection?"), or connect directly (for more information, see "How to start Discoverer by connecting directly").
the Discoverer manager has created login details for you so that you do not have to supply login details yourself (for more information, see "How to start Discoverer using an existing connection")
use an existing user-defined connection (known as a private connection) that you created yourself
you want to connect to Discoverer using login details that you saved previously (for more information, see "How to start Discoverer using an existing connection")
For information about creating a private connection, see "How to start Discoverer using an existing connection"
create a new user-defined connection (known as a private connection)
you want to connect to Discoverer using a new login (for more information, see "How do I create and save login information in a Discoverer connection?")
connect directly by entering login details (which are not saved in a connection)
you want to connect to Discoverer but you do not want to save the login details for later use (for more information, see "How to start Discoverer by connecting directly")
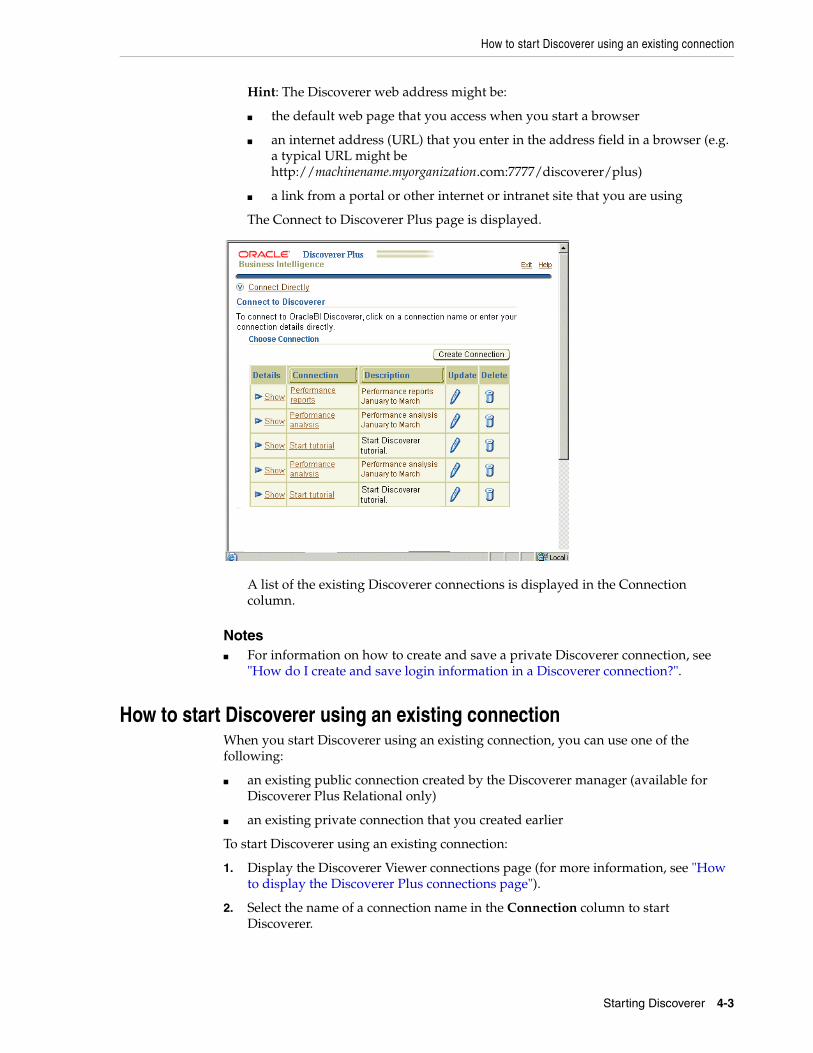
How to start Discoverer using an existing connection
Starting Discoverer 4-3
Hint: The Discoverer web address might be:
■ the default web page that you access when you start a browser
■ an internet address (URL) that you enter in the address field in a browser (e.g. a typical URL might be http://machinename.myorganization.com:7777/discoverer/plus)
■ a link from a portal or other internet or intranet site that you are using
The Connect to Discoverer Plus page is displayed.
A list of the existing Discoverer connections is displayed in the Connection column.
Notes■ For information on how to create and save a private Discoverer connection, see
"How do I create and save login information in a Discoverer connection?".
How to start Discoverer using an existing connectionWhen you start Discoverer using an existing connection, you can use one of the following:
■ an existing public connection created by the Discoverer manager (available for Discoverer Plus Relational only)
■ an existing private connection that you created earlier
To start Discoverer using an existing connection:
1. Display the Discoverer Viewer connections page (for more information, see "How to display the Discoverer Plus connections page").
2. Select the name of a connection name in the Connection column to start Discoverer.
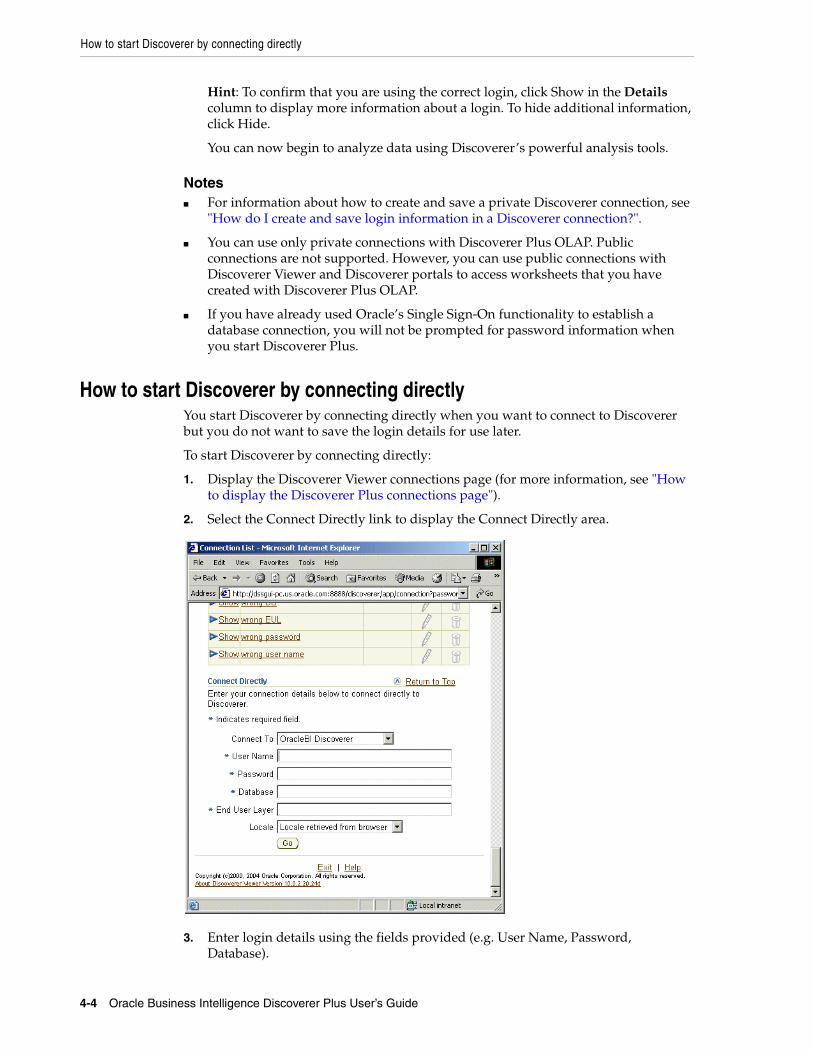
How to start Discoverer by connecting directly
4-4 Oracle Business Intelligence Discoverer Plus User’s Guide
Hint: To confirm that you are using the correct login, click Show in the Details column to display more information about a login. To hide additional information, click Hide.
You can now begin to analyze data using Discoverer’s powerful analysis tools.
Notes■ For information about how to create and save a private Discoverer connection, see
"How do I create and save login information in a Discoverer connection?".
■ You can use only private connections with Discoverer Plus OLAP. Public connections are not supported. However, you can use public connections with Discoverer Viewer and Discoverer portals to access worksheets that you have created with Discoverer Plus OLAP.
■ If you have already used Oracle’s Single Sign-On functionality to establish a database connection, you will not be prompted for password information when you start Discoverer Plus.
How to start Discoverer by connecting directlyYou start Discoverer by connecting directly when you want to connect to Discoverer but you do not want to save the login details for use later.
To start Discoverer by connecting directly:
1. Display the Discoverer Viewer connections page (for more information, see "How to display the Discoverer Plus connections page").
2. Select the Connect Directly link to display the Connect Directly area.
3. Enter login details using the fields provided (e.g. User Name, Password, Database).
Frequently asked questions
Starting Discoverer 4-5
4. Click Go to start Discoverer.
You can now begin to analyze data using Discoverer’s powerful analysis tools.
How to exit Discoverer PlusWhen you have finished using Discoverer Plus to analyze data, exit the application.
To exit Discoverer Plus:
1. Choose File | Exit.
If there are unsaved changes in one or more currently opened workbooks, a dialog prompts you to save or discard the changes.
■ Click Yes to save changes before closing Discoverer. Discoverer saves all changes that you have made since you last saved the workbook.
■ Click No to close Discoverer without saving changes. Discoverer saves none of the changes that you have made since you last saved the workbook.
Notes■ If you started Discoverer from an internet start page, the browser application is
not closed.
■ If you shut down the web browser that you used to start Discoverer during a Discoverer session, Discoverer will also exit.
Frequently asked questionsThis section answers frequently asked questions about starting Discoverer, and contains the following topics:
■ "What is the End User Layer (EUL)?"
■ "What are database accounts?"
■ "How do I create and save login information in a Discoverer connection?"
■ "How do I edit a Discoverer connection?"
■ "How do I delete a Discoverer connection?"
■ "What are public connections?"
■ "What are user-defined connections?"
■ "When and why do I need to change my password?"
■ "How do I change the password for a connection?"
■ "How do I change the End User Layer for a Discoverer connection?"
■ "What is Single Sign-on?"
■ "What is the difference between Single Sign-on and Discoverer passwords?"
What is the End User Layer (EUL)?The EUL is an intuitive, business-focused view of the database that uses terms that you are familiar with and can easily understand. The EUL insulates you from the complexity usually associated with databases. This enables you to focus on business issues instead of data access issues.
Frequently asked questions
4-6 Oracle Business Intelligence Discoverer Plus User’s Guide
What are database accounts?To use Discoverer, you need a database account that enables you to connect to Discoverer. You store database account details in a Discoverer connection along with EUL and language settings.
Note: If your organization uses Single Sign-on (a system for enabling users to log in once to access many different applications), you also need a Single Sign-on account. If you are not sure whether your organization uses Single Sign-on, contact the Discoverer manager. For more information, see "What is Single Sign-on?".
A database account comprises two pieces of information:
■ A user name - a short name by which you are identified in the database. For example, jchan, or marketing.
■ A password - a secret key that you use to authenticate your user name. An initial temporary password is created for you by the Discoverer manager. To keep your organization’s data secure, do not tell another person what your password is, or write down your password so that other people can read it (for more information, see "When and why do I need to change my password?").
How do I create and save login information in a Discoverer connection?You create and save login information in a new private Discoverer connection when you want to start Discoverer using login details that you have not saved previously.
To create and save login information in a Discoverer connection:
1. Display the Discoverer connections page (for more information, see "How to display the Discoverer Plus connections page").
2. Click Create Connection to display the Create Connection: Connection Details page.
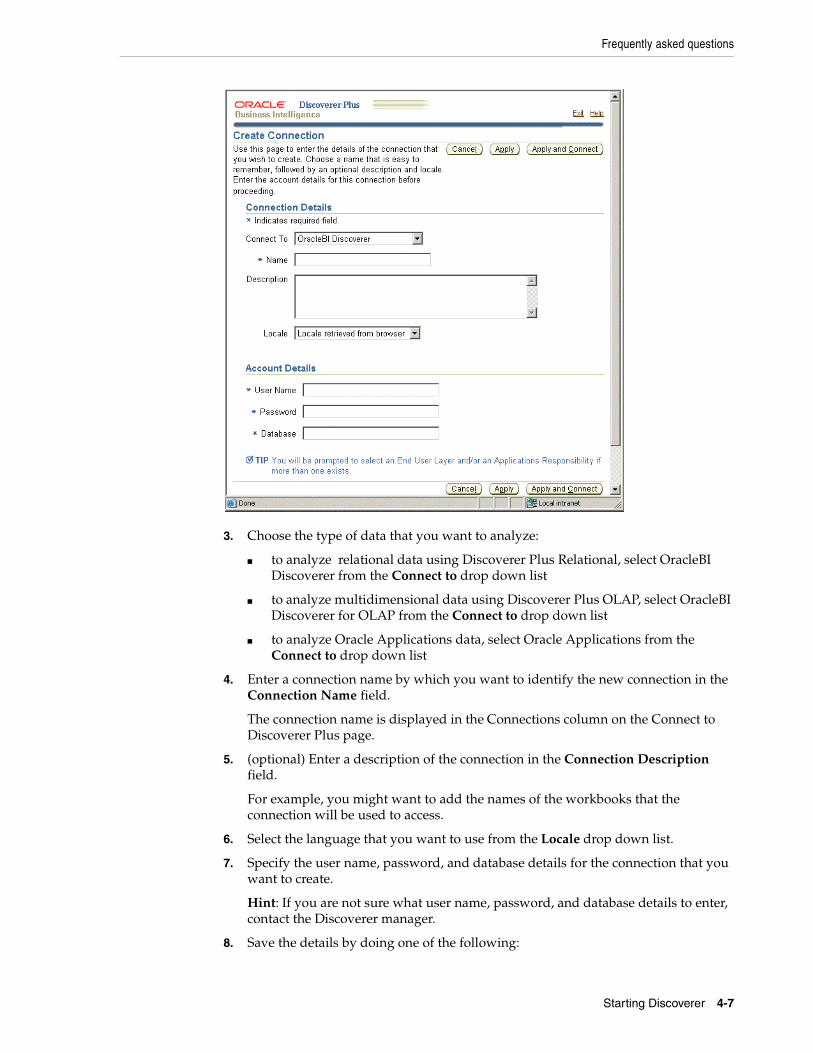
Frequently asked questions
Starting Discoverer 4-7
3. Choose the type of data that you want to analyze:
■ to analyze relational data using Discoverer Plus Relational, select OracleBI Discoverer from the Connect to drop down list
■ to analyze multidimensional data using Discoverer Plus OLAP, select OracleBI Discoverer for OLAP from the Connect to drop down list
■ to analyze Oracle Applications data, select Oracle Applications from the Connect to drop down list
4. Enter a connection name by which you want to identify the new connection in the Connection Name field.
The connection name is displayed in the Connections column on the Connect to Discoverer Plus page.
5. (optional) Enter a description of the connection in the Connection Description field.
For example, you might want to add the names of the workbooks that the connection will be used to access.
6. Select the language that you want to use from the Locale drop down list.
7. Specify the user name, password, and database details for the connection that you want to create.
Hint: If you are not sure what user name, password, and database details to enter, contact the Discoverer manager.
8. Save the details by doing one of the following:
Frequently asked questions
4-8 Oracle Business Intelligence Discoverer Plus User’s Guide
■ Click Apply to save the details you have entered and return to the Connections list.
■ Click Apply and Connect to save the details you have entered and start Discoverer using the login details specified.
9. If you selected Oracle Applications in the Connect To drop down list, the Select Oracle Applications Responsibility page is displayed. Do the following:
a. Select a responsibility from the Oracle Applications drop down list.
b. Click Apply to save the details that you specified.
10. If the user name has access to more than one End User Layer, the Create Connection: End User Layer page is displayed. Do the following:
a. Select an End User Layer from the End User Layer drop down list.
b. Click Apply to save the details that you specified.
If you clicked Apply, the Connect to Discoverer Plus page is displayed. The new connection that you have created is included in the list of connections. To start Discoverer using the connection that you have created, click the new connection name in the Connection list.
If you clicked Apply and Connect, Discoverer starts and prompts you to select a workbook and worksheet to open.
How do I edit a Discoverer connection?You edit a Discoverer connection when you want to change the login details stored in that connection. For example, you might want to change the user name that you use to start Discoverer.
To edit a Discoverer connection:
1. Display the Discoverer Viewer connections page (for more information, see "How to display the Discoverer Plus connections page").
2. Click the pencil icon in the Update column next to the name of the connection that you want to edit.
Hint: To confirm that you are using the correct connection, click Show in the Details column to display more information about a connection. To hide additional information, click Hide.
The Edit Connection page is displayed.
3. Change the connection details as required.
4. Save the details by doing one of the following:
■ Click Apply to save the details you have entered and return to the Connections list.
■ Click Apply and Connect to save the details you have entered and start Discoverer using the login details specified.
5. If the user name has access to more than one End User Layer, the Create Connection: End User Layer page is displayed. Do the following:
a. Select an End User Layer from the End User Layer drop down list.
b. Click Apply to save the details that you specified.
Frequently asked questions
Starting Discoverer 4-9
If you clicked Apply, the Connect to Discoverer Plus page is displayed. The new connection that you have created is included in the list of connections. To start Discoverer using the connection that you have created, click the new connection name in the Connection list.
If you clicked Apply and Connect, Discoverer starts and prompts you to select a workbook and worksheet to open.
Notes■ You can only edit private connections that you have created yourself. You cannot
edit public connections created by the Discoverer manager.
How do I delete a Discoverer connection?You delete a Discoverer connection when you want to remove login details permanently. For example, you might want to delete a temporary connection that you no longer need.
To delete a Discoverer connection:
1. Display the Discoverer Viewer connections page (for more information, see "How to display the Discoverer Plus connections page").
2. Click the trash can icon in the Delete column next to the name of the connection that you want to delete to display the Confirmation dialog.
Hint: To confirm that you are deleting the correct connection, click Show in the Details column to display more information about a connection. To hide additional information, click Hide.
3. Click Yes at the confirmation page to delete the connection and return to the Connect to Discoverer Plus page.
Notes■ You can only delete private connections that you have created yourself. You
cannot delete public connections created by the Discoverer manager.
What are public connections?Public connections are Discoverer logins created by the Discoverer manager. Public connections enable you to start Discoverer and access workbooks without having to create your own connections.
You cannot edit or delete public connections. Only the Discoverer manager can create, edit, and delete public connections.
What are user-defined connections?User-defined connections (also known as private connections) are Discoverer logins that you create yourself. You can edit and delete private connections. Only you can access, edit, and delete the private connections that you create.
When and why do I need to change my password?Typically you will have to change your password periodically to maintain data security.
Frequently asked questions
4-10 Oracle Business Intelligence Discoverer Plus User’s Guide
Your system manager specifies how long you can keep the same password before it expires. In other words, how long you can keep the password before you have to change it.
You will know your password has expired if you start Discoverer and are prompted to enter a new password. When you connect to Discoverer, you might be warned that your password will expire in a specified number of days. If you do not change the password in this period, you are prompted to enter a new password when the password expires.
It is also important to change your password if you think that someone else has found out what the password is.
How do I change the password for a connection?You change the password for a connection when the password:
■ has expired
■ is about to expire
■ has become known by another user
To change the password for a connection:
1. Display the Discoverer Viewer connections page (for more information, see "How to display the Discoverer Plus connections page").
2. Click the Update icon next to the connection for which you want to change the password.
3. Click Change Database Password.
4. In the Password field, enter the current database password for the current user name.
5. In the New Password field, enter a new database password for the current user name.
6. In the Verify Password field, re-enter the new database password for the current user name.
7. Click Finish.
The Connect to Discoverer Plus page is displayed. You can now use the connection to start Discoverer.
Notes■ If any of the password details that you entered were invalid, an error message is
displayed with advice on which value to change.
How do I change the End User Layer for a Discoverer connection?You change the End User Layer (EUL) for a Discoverer connection when you want the connection to start Discoverer using a different EUL (for more information, see "What is the End User Layer (EUL)?").
To change the EUL for a Discoverer connection:
1. Display the Discoverer Viewer connections page (for more information, see "How to display the Discoverer Plus connections page").
Frequently asked questions
Starting Discoverer 4-11
2. Click the Update icon next to the connection for which you want to change the End User Layer.
3. In the Password field, enter a valid password for the Discoverer connection.
4. Click Continue.
5. If the user name for the current Discoverer connection has access to more than one End User Layer, the Select End User Layer for Discoverer Connection page is displayed. Do the following:
a. Select an End User Layer from the End User Layer drop down list.
b. Click Finish.
The Connect to Discoverer Plus page is displayed. You can now use the connection to start Discoverer.
Notes■ If the user name does not have access to more than one End User Layer, you
cannot change the default End User Layer.
■ If the password that you entered was invalid, an error message is displayed with advice on which value to change.
What is Single Sign-on?Single sign-on is a feature that enables end users to use the same user name and password to authenticate several different Internet applications. This is obviously of great benefit since people do not like to sign-on more than is necessary.
What is the difference between Single Sign-on and Discoverer passwords?If your organization uses Single Sign-on, your Discoverer password is separate to your Single Sign-on password:
■ your Single Sign-on password authenticates your Single Sign-on user name
■ your database password authenticates your database user name
■ with a single Sign-on connection, you can connect using many different Discoverer connections
How do I know what Single Sign-on ID is being used in Discoverer Plus?To find out the Single Sign-on ID being used in Discoverer Plus, choose Help | About Discoverer to display the About OracleBI Discoverer dialog, and look in the Connected As area.

Frequently asked questions
4-12 Oracle Business Intelligence Discoverer Plus User’s Guide
About the Discoverer Plus Relational work area 5-1
5About the Discoverer Plus Relational work
area
This chapter introduces the main dialogs that you will work with when you use Discoverer Plus Relational, and includes the following topics:
■ "About the work area"
■ "About Discoverer’s drag and drop features"
■ "About Discoverer menus"
■ "About Discoverer toolbars"
■ "About icons used in the Discoverer item navigator"
■ "What are axis items?"
■ "About data points"
■ "What is the Discoverer Worksheet Wizard?"
Note: The examples in this chapter use the sample Video Tutorial Workbook that comes with Discoverer. The specific tables, charts, data, and other items you see on your screen depend on the actual data in your database, and the workbook(s) designed by your organization’s Discoverer manager.
About the work areaThe work area is where you will do most of your analysis work with Discoverer. The work area displays the current worksheet and tabs for other worksheets in the current workbook. Discoverer’s navigation facilities make it easy to find your way around workbooks and worksheets to find the information you want.
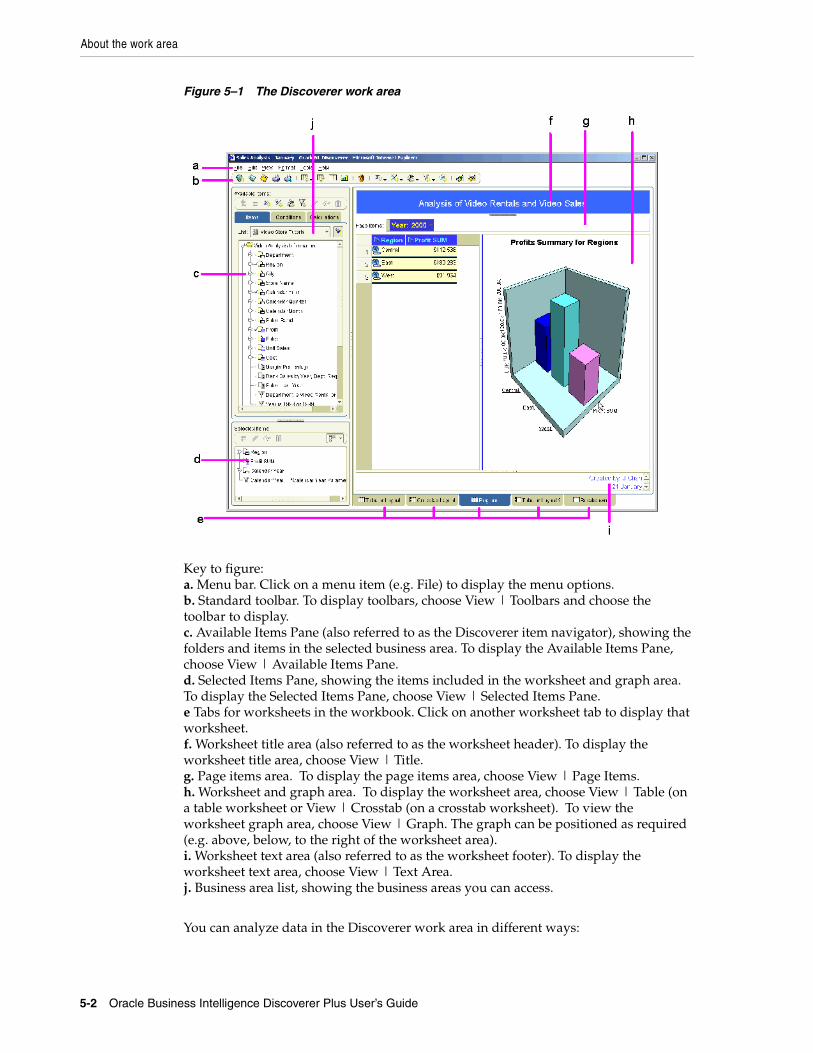
About the work area
5-2 Oracle Business Intelligence Discoverer Plus User’s Guide
Figure 5–1 The Discoverer work area
Key to figure:a. Menu bar. Click on a menu item (e.g. File) to display the menu options.b. Standard toolbar. To display toolbars, choose View | Toolbars and choose the toolbar to display.c. Available Items Pane (also referred to as the Discoverer item navigator), showing the folders and items in the selected business area. To display the Available Items Pane, choose View | Available Items Pane.d. Selected Items Pane, showing the items included in the worksheet and graph area. To display the Selected Items Pane, choose View | Selected Items Pane.e Tabs for worksheets in the workbook. Click on another worksheet tab to display that worksheet.f. Worksheet title area (also referred to as the worksheet header). To display the worksheet title area, choose View | Title.g. Page items area. To display the page items area, choose View | Page Items.h. Worksheet and graph area. To display the worksheet area, choose View | Table (on a table worksheet or View | Crosstab (on a crosstab worksheet). To view the worksheet graph area, choose View | Graph. The graph can be positioned as required (e.g. above, below, to the right of the worksheet area).i. Worksheet text area (also referred to as the worksheet footer). To display the worksheet text area, choose View | Text Area.j. Business area list, showing the business areas you can access.
You can analyze data in the Discoverer work area in different ways:
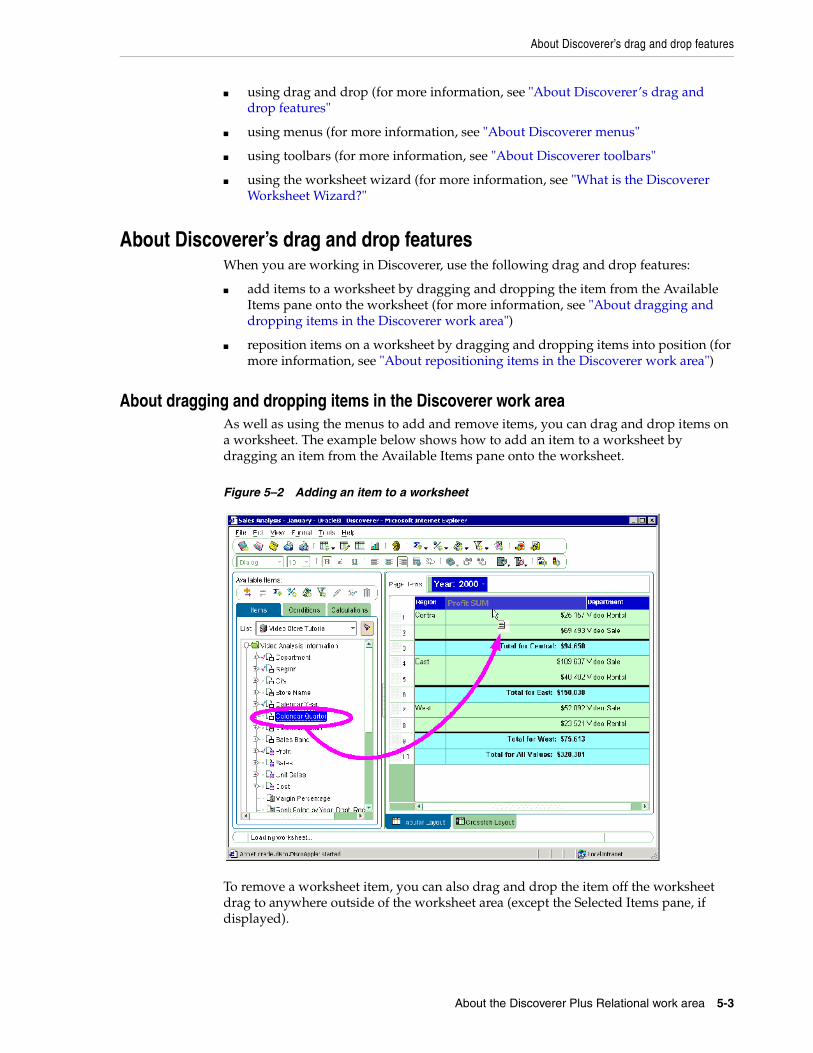
About Discoverer’s drag and drop features
About the Discoverer Plus Relational work area 5-3
■ using drag and drop (for more information, see "About Discoverer’s drag and drop features"
■ using menus (for more information, see "About Discoverer menus"
■ using toolbars (for more information, see "About Discoverer toolbars"
■ using the worksheet wizard (for more information, see "What is the Discoverer Worksheet Wizard?"
About Discoverer’s drag and drop featuresWhen you are working in Discoverer, use the following drag and drop features:
■ add items to a worksheet by dragging and dropping the item from the Available Items pane onto the worksheet (for more information, see "About dragging and dropping items in the Discoverer work area")
■ reposition items on a worksheet by dragging and dropping items into position (for more information, see "About repositioning items in the Discoverer work area")
About dragging and dropping items in the Discoverer work areaAs well as using the menus to add and remove items, you can drag and drop items on a worksheet. The example below shows how to add an item to a worksheet by dragging an item from the Available Items pane onto the worksheet.
Figure 5–2 Adding an item to a worksheet
To remove a worksheet item, you can also drag and drop the item off the worksheet drag to anywhere outside of the worksheet area (except the Selected Items pane, if displayed).
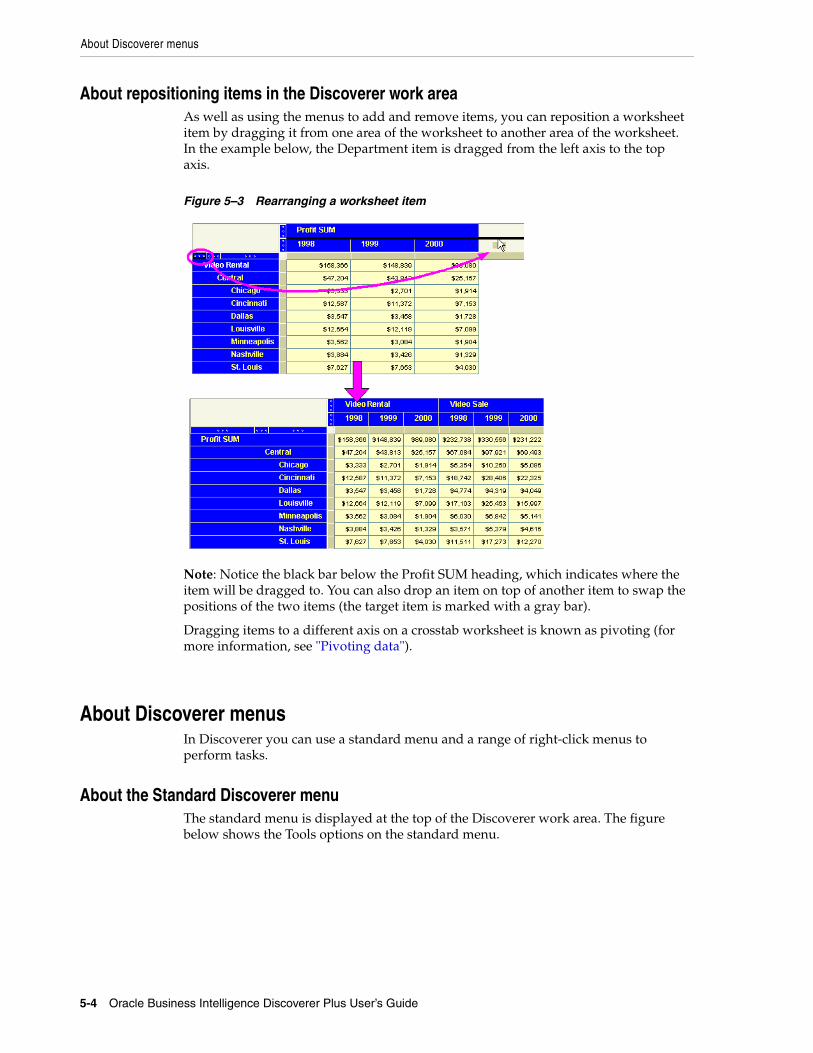
About Discoverer menus
5-4 Oracle Business Intelligence Discoverer Plus User’s Guide
About repositioning items in the Discoverer work areaAs well as using the menus to add and remove items, you can reposition a worksheet item by dragging it from one area of the worksheet to another area of the worksheet. In the example below, the Department item is dragged from the left axis to the top axis.
Figure 5–3 Rearranging a worksheet item
Note: Notice the black bar below the Profit SUM heading, which indicates where the item will be dragged to. You can also drop an item on top of another item to swap the positions of the two items (the target item is marked with a gray bar).
Dragging items to a different axis on a crosstab worksheet is known as pivoting (for more information, see "Pivoting data").
About Discoverer menusIn Discoverer you can use a standard menu and a range of right-click menus to perform tasks.
About the Standard Discoverer menuThe standard menu is displayed at the top of the Discoverer work area. The figure below shows the Tools options on the standard menu.
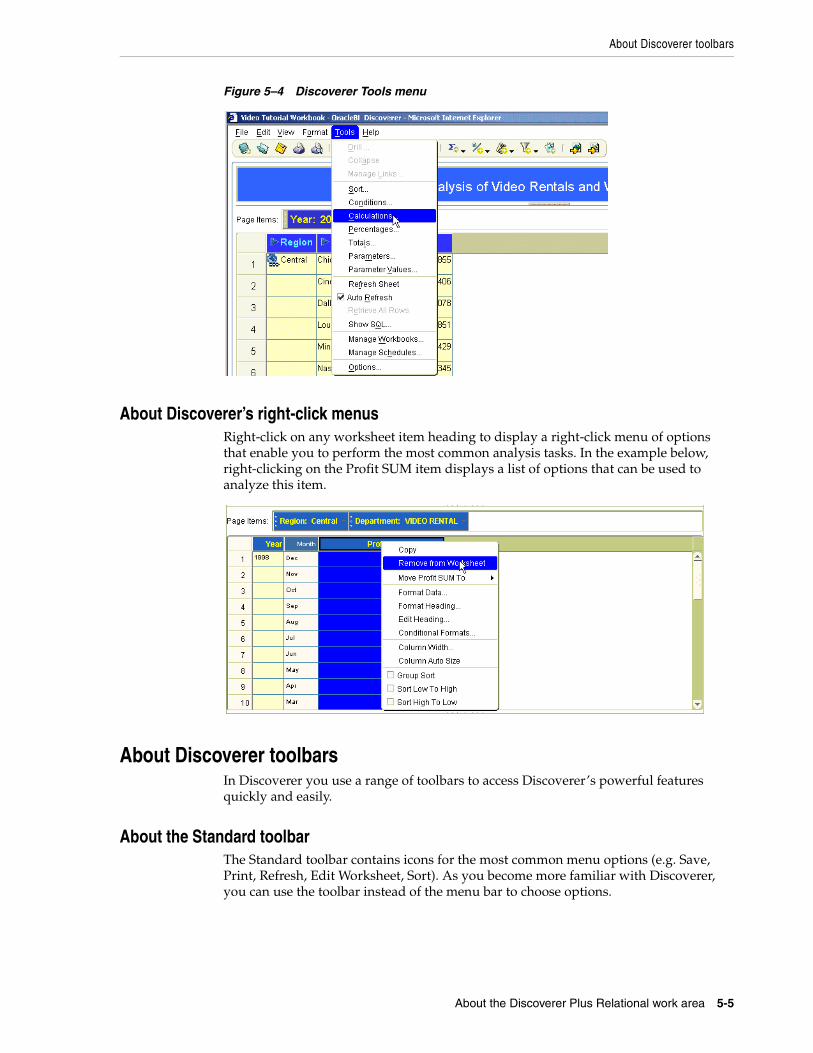
About Discoverer toolbars
About the Discoverer Plus Relational work area 5-5
Figure 5–4 Discoverer Tools menu
About Discoverer’s right-click menusRight-click on any worksheet item heading to display a right-click menu of options that enable you to perform the most common analysis tasks. In the example below, right-clicking on the Profit SUM item displays a list of options that can be used to analyze this item.
About Discoverer toolbarsIn Discoverer you use a range of toolbars to access Discoverer’s powerful features quickly and easily.
About the Standard toolbarThe Standard toolbar contains icons for the most common menu options (e.g. Save, Print, Refresh, Edit Worksheet, Sort). As you become more familiar with Discoverer, you can use the toolbar instead of the menu bar to choose options.
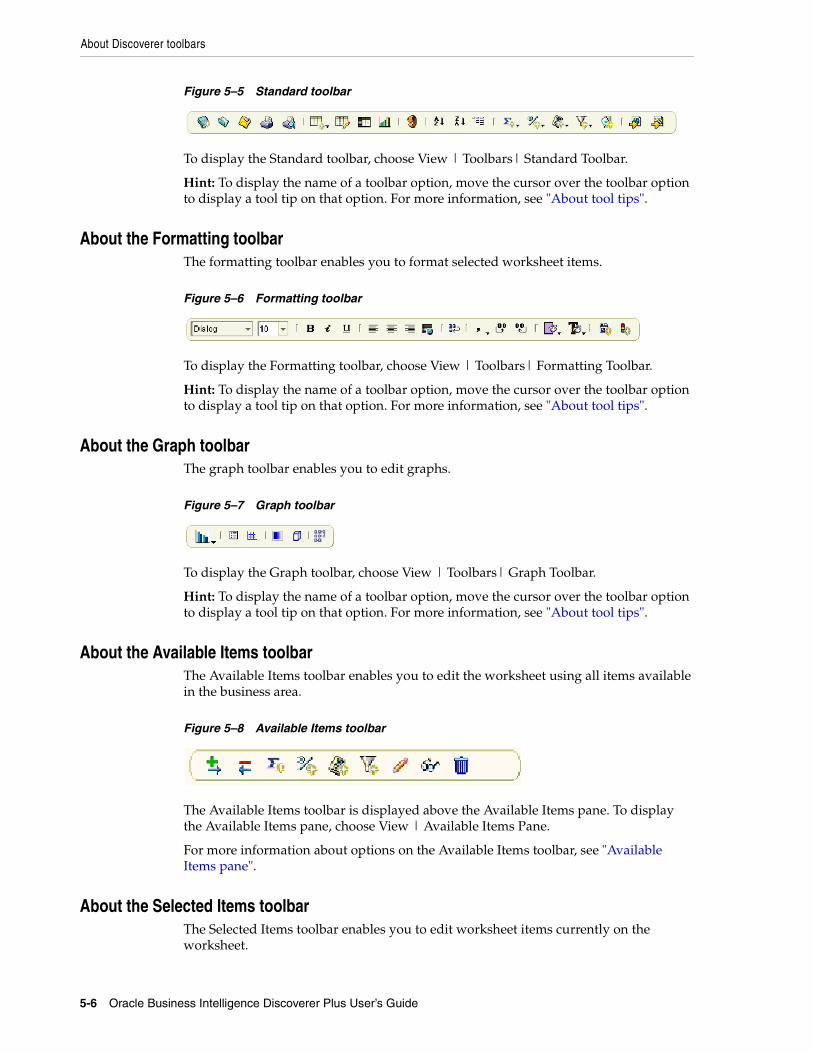
About Discoverer toolbars
5-6 Oracle Business Intelligence Discoverer Plus User’s Guide
Figure 5–5 Standard toolbar
To display the Standard toolbar, choose View | Toolbars| Standard Toolbar.
Hint: To display the name of a toolbar option, move the cursor over the toolbar option to display a tool tip on that option. For more information, see "About tool tips".
About the Formatting toolbarThe formatting toolbar enables you to format selected worksheet items.
Figure 5–6 Formatting toolbar
To display the Formatting toolbar, choose View | Toolbars| Formatting Toolbar.
Hint: To display the name of a toolbar option, move the cursor over the toolbar option to display a tool tip on that option. For more information, see "About tool tips".
About the Graph toolbarThe graph toolbar enables you to edit graphs.
Figure 5–7 Graph toolbar
To display the Graph toolbar, choose View | Toolbars| Graph Toolbar.
Hint: To display the name of a toolbar option, move the cursor over the toolbar option to display a tool tip on that option. For more information, see "About tool tips".
About the Available Items toolbarThe Available Items toolbar enables you to edit the worksheet using all items available in the business area.
Figure 5–8 Available Items toolbar
The Available Items toolbar is displayed above the Available Items pane. To display the Available Items pane, choose View | Available Items Pane.
For more information about options on the Available Items toolbar, see "Available Items pane".
About the Selected Items toolbarThe Selected Items toolbar enables you to edit worksheet items currently on the worksheet.
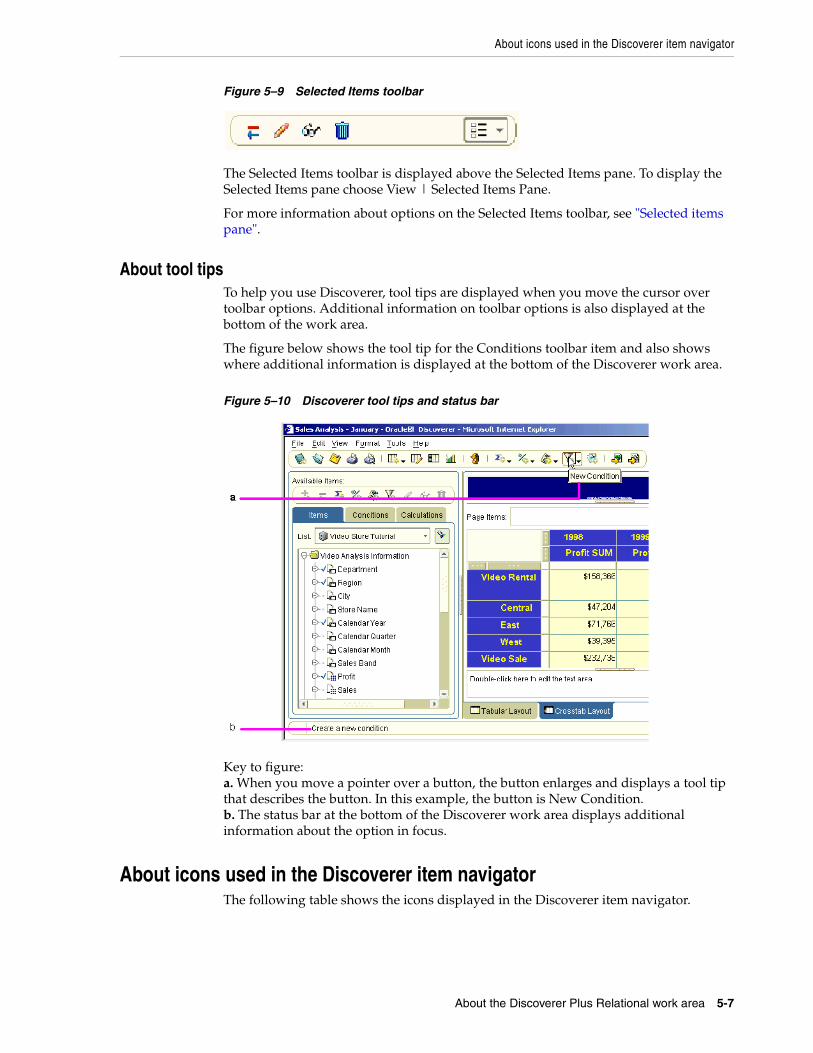
About icons used in the Discoverer item navigator
About the Discoverer Plus Relational work area 5-7
Figure 5–9 Selected Items toolbar
The Selected Items toolbar is displayed above the Selected Items pane. To display the Selected Items pane choose View | Selected Items Pane.
For more information about options on the Selected Items toolbar, see "Selected items pane".
About tool tipsTo help you use Discoverer, tool tips are displayed when you move the cursor over toolbar options. Additional information on toolbar options is also displayed at the bottom of the work area.
The figure below shows the tool tip for the Conditions toolbar item and also shows where additional information is displayed at the bottom of the Discoverer work area.
Figure 5–10 Discoverer tool tips and status bar
Key to figure:a. When you move a pointer over a button, the button enlarges and displays a tool tip that describes the button. In this example, the button is New Condition.b. The status bar at the bottom of the Discoverer work area displays additional information about the option in focus.
About icons used in the Discoverer item navigatorThe following table shows the icons displayed in the Discoverer item navigator.
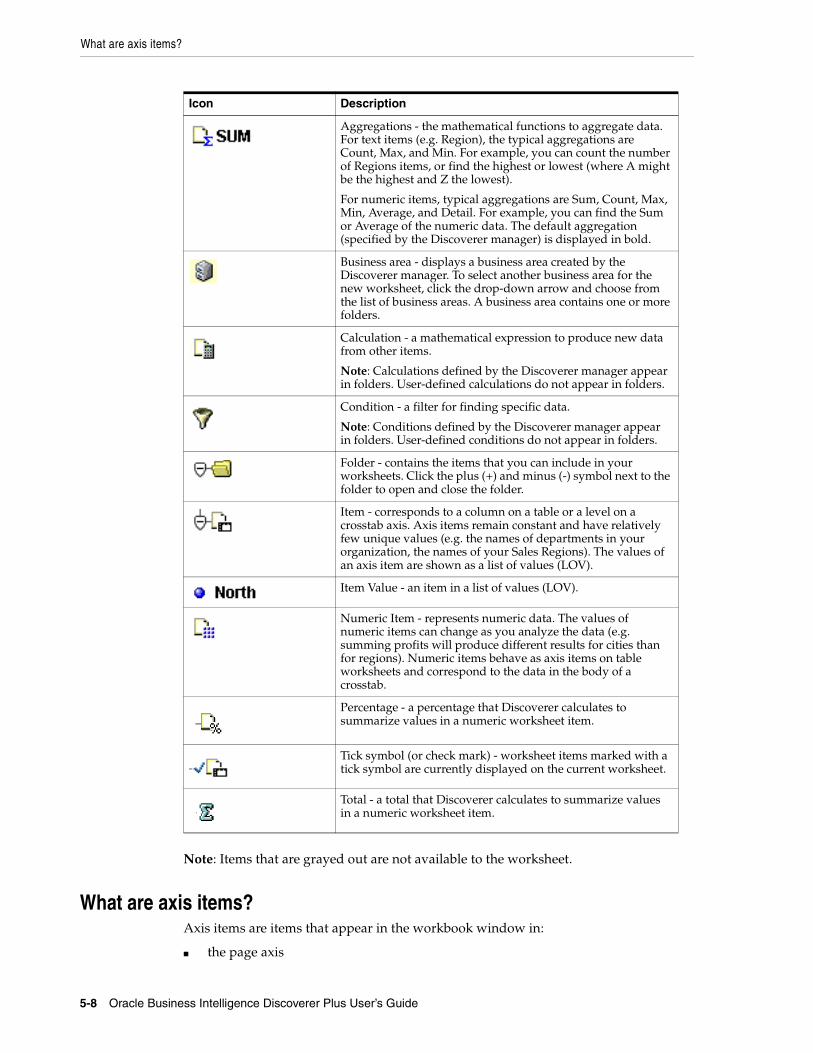
What are axis items?
5-8 Oracle Business Intelligence Discoverer Plus User’s Guide
Note: Items that are grayed out are not available to the worksheet.
What are axis items?Axis items are items that appear in the workbook window in:
■ the page axis
Icon Description
Aggregations - the mathematical functions to aggregate data. For text items (e.g. Region), the typical aggregations are Count, Max, and Min. For example, you can count the number of Regions items, or find the highest or lowest (where A might be the highest and Z the lowest).
For numeric items, typical aggregations are Sum, Count, Max, Min, Average, and Detail. For example, you can find the Sum or Average of the numeric data. The default aggregation (specified by the Discoverer manager) is displayed in bold.
Business area - displays a business area created by the Discoverer manager. To select another business area for the new worksheet, click the drop-down arrow and choose from the list of business areas. A business area contains one or more folders.
Calculation - a mathematical expression to produce new data from other items.
Note: Calculations defined by the Discoverer manager appear in folders. User-defined calculations do not appear in folders.
Condition - a filter for finding specific data.
Note: Conditions defined by the Discoverer manager appear in folders. User-defined conditions do not appear in folders.
Folder - contains the items that you can include in your worksheets. Click the plus (+) and minus (-) symbol next to the folder to open and close the folder.
Item - corresponds to a column on a table or a level on a crosstab axis. Axis items remain constant and have relatively few unique values (e.g. the names of departments in your organization, the names of your Sales Regions). The values of an axis item are shown as a list of values (LOV).
Item Value - an item in a list of values (LOV).
Numeric Item - represents numeric data. The values of numeric items can change as you analyze the data (e.g. summing profits will produce different results for cities than for regions). Numeric items behave as axis items on table worksheets and correspond to the data in the body of a crosstab.
Percentage - a percentage that Discoverer calculates to summarize values in a numeric worksheet item.
Tick symbol (or check mark) - worksheet items marked with a tick symbol are currently displayed on the current worksheet.
Total - a total that Discoverer calculates to summarize values in a numeric worksheet item.
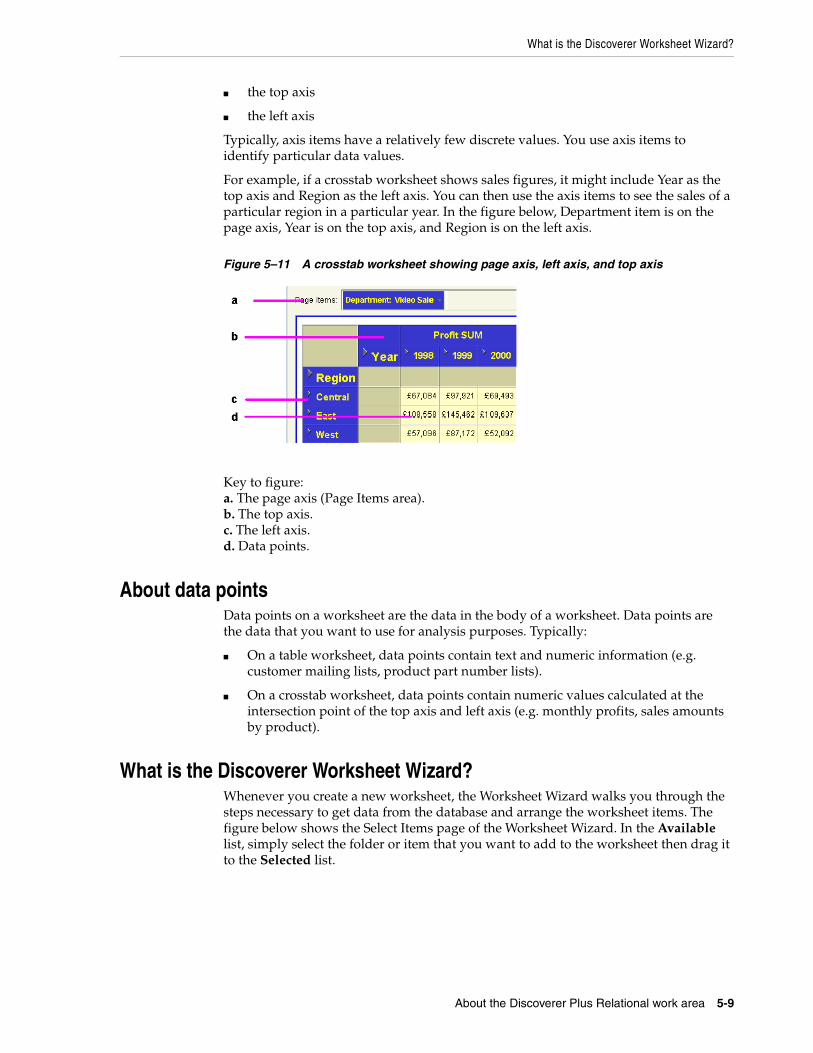
What is the Discoverer Worksheet Wizard?
About the Discoverer Plus Relational work area 5-9
■ the top axis
■ the left axis
Typically, axis items have a relatively few discrete values. You use axis items to identify particular data values.
For example, if a crosstab worksheet shows sales figures, it might include Year as the top axis and Region as the left axis. You can then use the axis items to see the sales of a particular region in a particular year. In the figure below, Department item is on the page axis, Year is on the top axis, and Region is on the left axis.
Figure 5–11 A crosstab worksheet showing page axis, left axis, and top axis
Key to figure:a. The page axis (Page Items area).b. The top axis.c. The left axis.d. Data points.
About data pointsData points on a worksheet are the data in the body of a worksheet. Data points are the data that you want to use for analysis purposes. Typically:
■ On a table worksheet, data points contain text and numeric information (e.g. customer mailing lists, product part number lists).
■ On a crosstab worksheet, data points contain numeric values calculated at the intersection point of the top axis and left axis (e.g. monthly profits, sales amounts by product).
What is the Discoverer Worksheet Wizard?Whenever you create a new worksheet, the Worksheet Wizard walks you through the steps necessary to get data from the database and arrange the worksheet items. The figure below shows the Select Items page of the Worksheet Wizard. In the Available list, simply select the folder or item that you want to add to the worksheet then drag it to the Selected list.
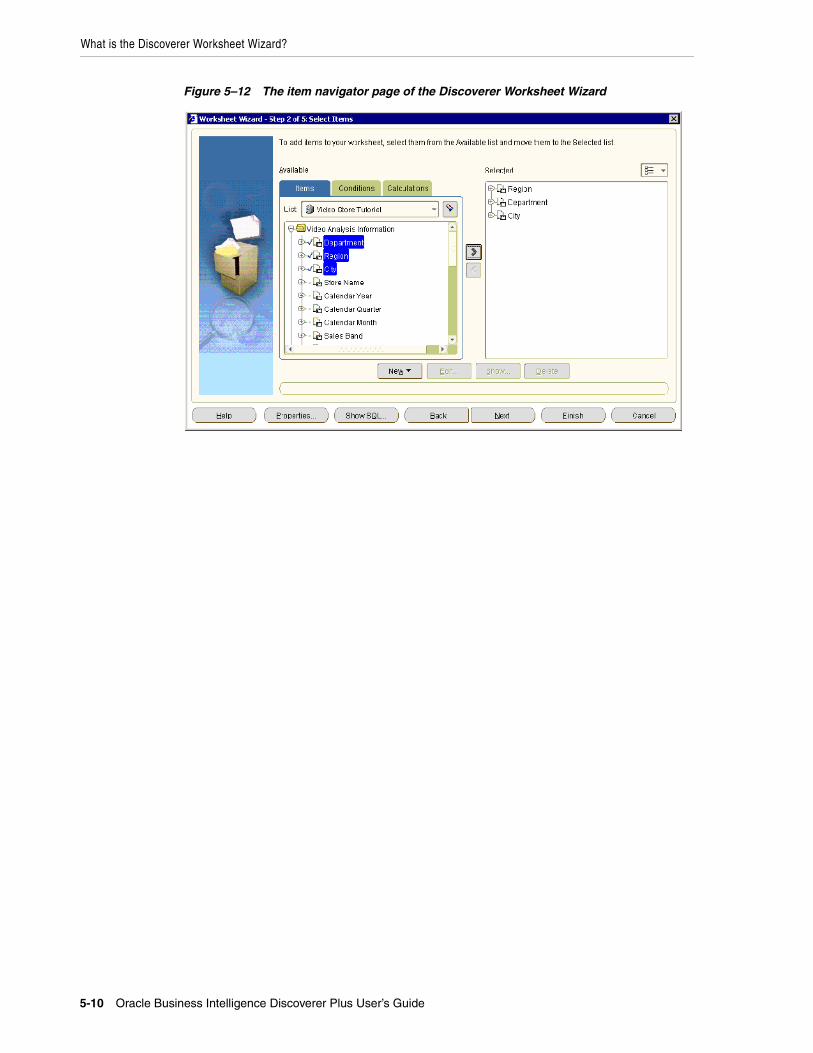
What is the Discoverer Worksheet Wizard?
5-10 Oracle Business Intelligence Discoverer Plus User’s Guide
Figure 5–12 The item navigator page of the Discoverer Worksheet Wizard
Using workbooks and worksheets 6-1
6Using workbooks and worksheets
This chapter explains how to use Discoverer Plus Relational workbooks and worksheets, and contains the following topics:
■ "What are workbooks?"
■ "What are worksheets?"
■ "About designing workbooks for maximum performance"
■ "How to open workbooks"
■ "About opening workbooks in a non-Oracle database"
■ "How to edit workbooks"
■ "About saving a workbook to the database"
■ "How to save workbooks"
■ "How to copy workbooks"
■ "How to delete workbooks from the database"
■ "About worksheet titles and text"
■ "How to create or edit worksheet titles or text"
■ "How to display or hide worksheet titles or text"
■ "How to rename worksheets and workbooks"
■ "How to re-order worksheets within a workbook"
■ "How to refresh worksheets"
■ "How to delete worksheets"
■ "How to find data in a worksheet"
■ "About creating new workbooks"
■ "How to create new workbooks"
■ "How to add worksheets to a workbook"
■ "How to view and update a workbook’s properties"
■ "About worksheet properties"
■ "How to view and edit worksheet properties"
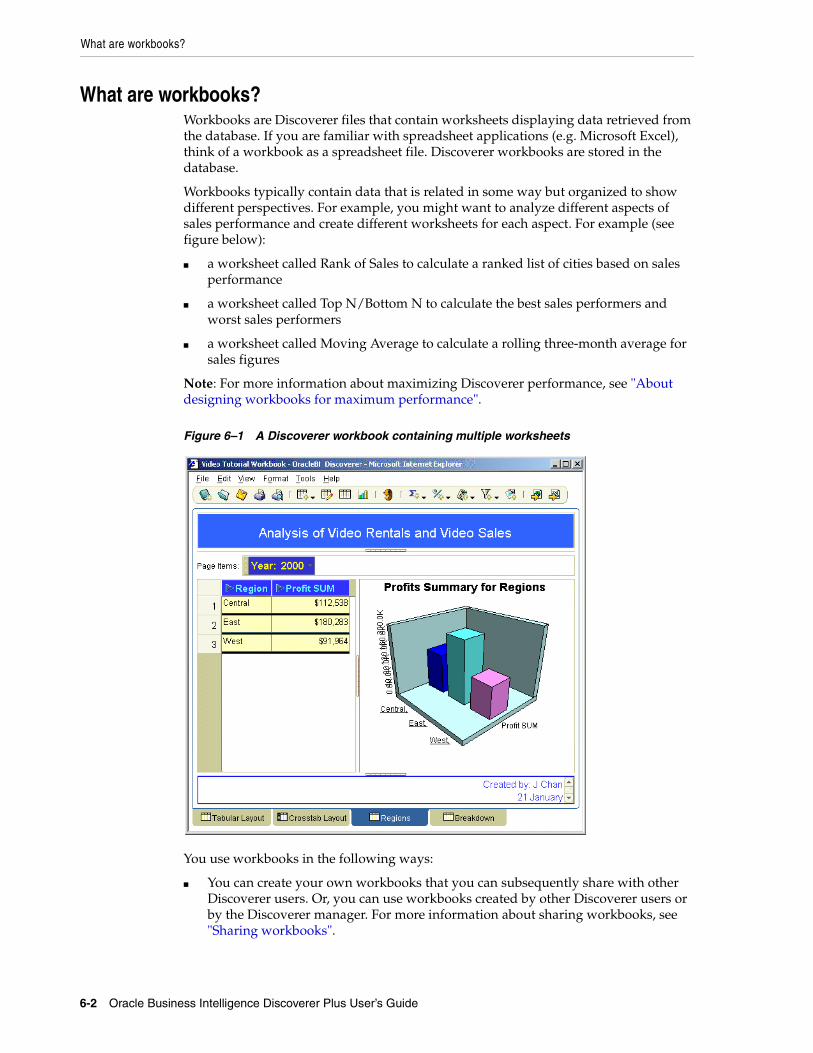
What are workbooks?
6-2 Oracle Business Intelligence Discoverer Plus User’s Guide
What are workbooks?Workbooks are Discoverer files that contain worksheets displaying data retrieved from the database. If you are familiar with spreadsheet applications (e.g. Microsoft Excel), think of a workbook as a spreadsheet file. Discoverer workbooks are stored in the database.
Workbooks typically contain data that is related in some way but organized to show different perspectives. For example, you might want to analyze different aspects of sales performance and create different worksheets for each aspect. For example (see figure below):
■ a worksheet called Rank of Sales to calculate a ranked list of cities based on sales performance
■ a worksheet called Top N/Bottom N to calculate the best sales performers and worst sales performers
■ a worksheet called Moving Average to calculate a rolling three-month average for sales figures
Note: For more information about maximizing Discoverer performance, see "About designing workbooks for maximum performance".
Figure 6–1 A Discoverer workbook containing multiple worksheets
You use workbooks in the following ways:
■ You can create your own workbooks that you can subsequently share with other Discoverer users. Or, you can use workbooks created by other Discoverer users or by the Discoverer manager. For more information about sharing workbooks, see "Sharing workbooks".
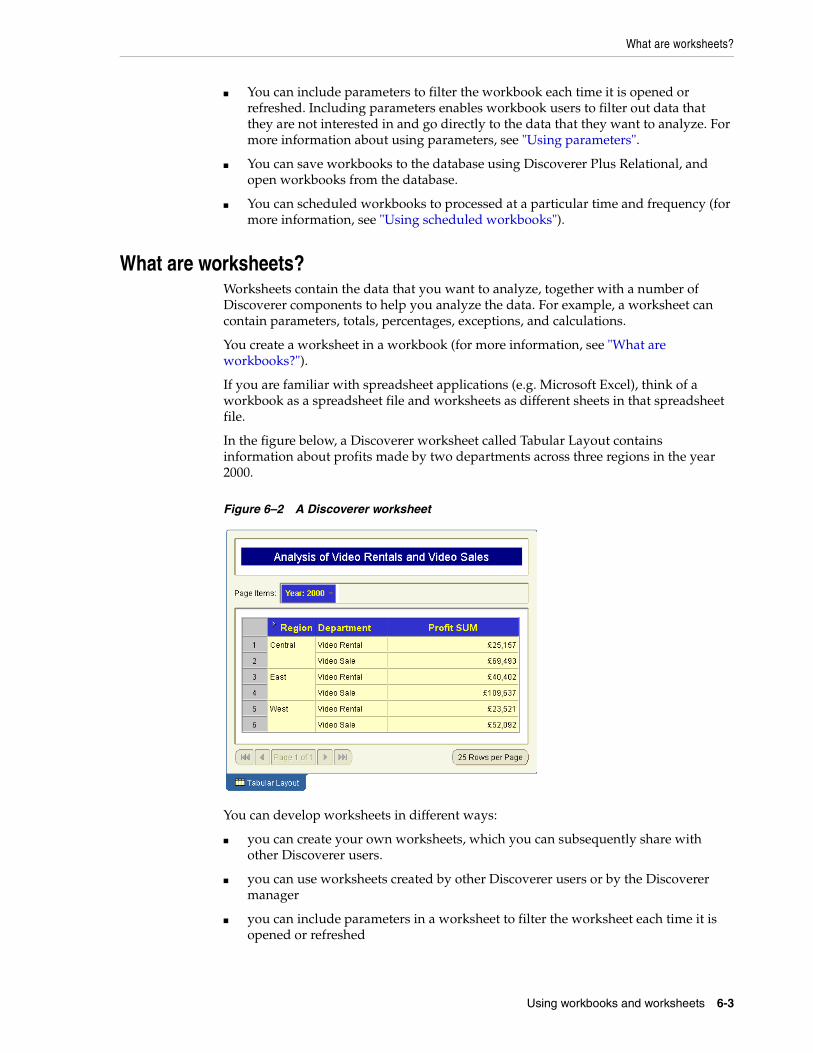
What are worksheets?
Using workbooks and worksheets 6-3
■ You can include parameters to filter the workbook each time it is opened or refreshed. Including parameters enables workbook users to filter out data that they are not interested in and go directly to the data that they want to analyze. For more information about using parameters, see "Using parameters".
■ You can save workbooks to the database using Discoverer Plus Relational, and open workbooks from the database.
■ You can scheduled workbooks to processed at a particular time and frequency (for more information, see "Using scheduled workbooks").
What are worksheets?Worksheets contain the data that you want to analyze, together with a number of Discoverer components to help you analyze the data. For example, a worksheet can contain parameters, totals, percentages, exceptions, and calculations.
You create a worksheet in a workbook (for more information, see "What are workbooks?").
If you are familiar with spreadsheet applications (e.g. Microsoft Excel), think of a workbook as a spreadsheet file and worksheets as different sheets in that spreadsheet file.
In the figure below, a Discoverer worksheet called Tabular Layout contains information about profits made by two departments across three regions in the year 2000.
Figure 6–2 A Discoverer worksheet
You can develop worksheets in different ways:
■ you can create your own worksheets, which you can subsequently share with other Discoverer users.
■ you can use worksheets created by other Discoverer users or by the Discoverer manager
■ you can include parameters in a worksheet to filter the worksheet each time it is opened or refreshed
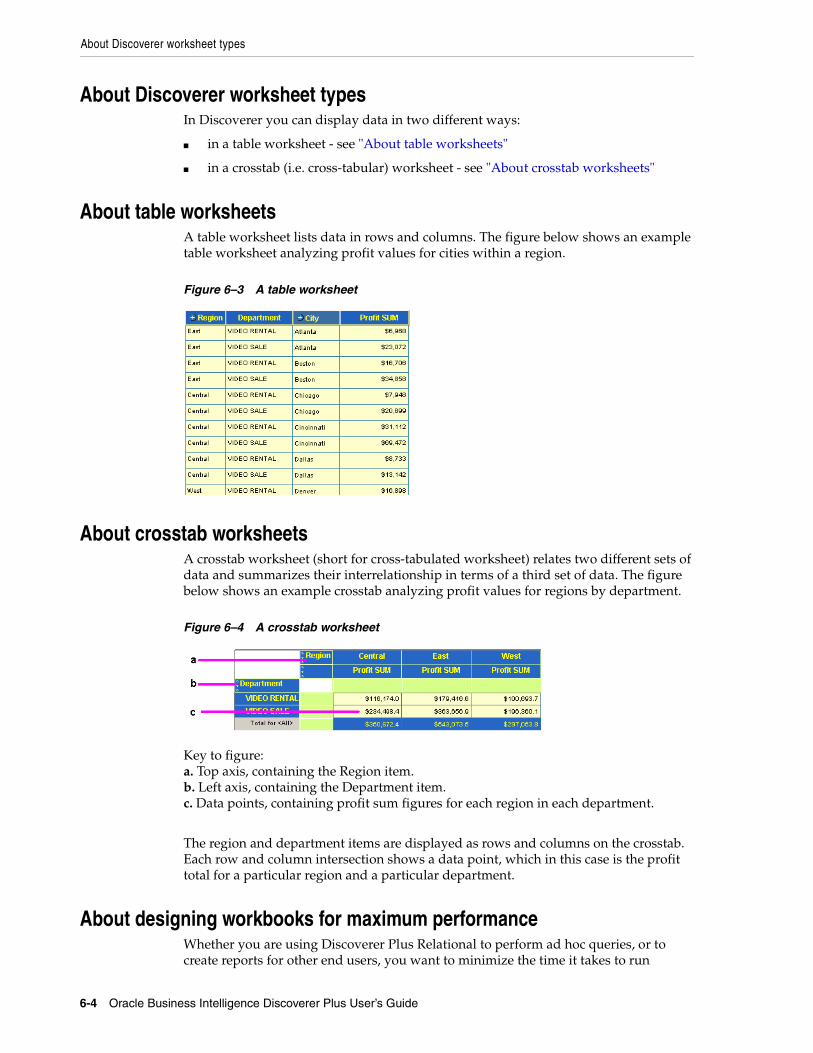
About Discoverer worksheet types
6-4 Oracle Business Intelligence Discoverer Plus User’s Guide
About Discoverer worksheet typesIn Discoverer you can display data in two different ways:
■ in a table worksheet - see "About table worksheets"
■ in a crosstab (i.e. cross-tabular) worksheet - see "About crosstab worksheets"
About table worksheetsA table worksheet lists data in rows and columns. The figure below shows an example table worksheet analyzing profit values for cities within a region.
Figure 6–3 A table worksheet
About crosstab worksheetsA crosstab worksheet (short for cross-tabulated worksheet) relates two different sets of data and summarizes their interrelationship in terms of a third set of data. The figure below shows an example crosstab analyzing profit values for regions by department.
Figure 6–4 A crosstab worksheet
Key to figure:a. Top axis, containing the Region item.b. Left axis, containing the Department item.c. Data points, containing profit sum figures for each region in each department.
The region and department items are displayed as rows and columns on the crosstab. Each row and column intersection shows a data point, which in this case is the profit total for a particular region and a particular department.
About designing workbooks for maximum performanceWhether you are using Discoverer Plus Relational to perform ad hoc queries, or to create reports for other end users, you want to minimize the time it takes to run
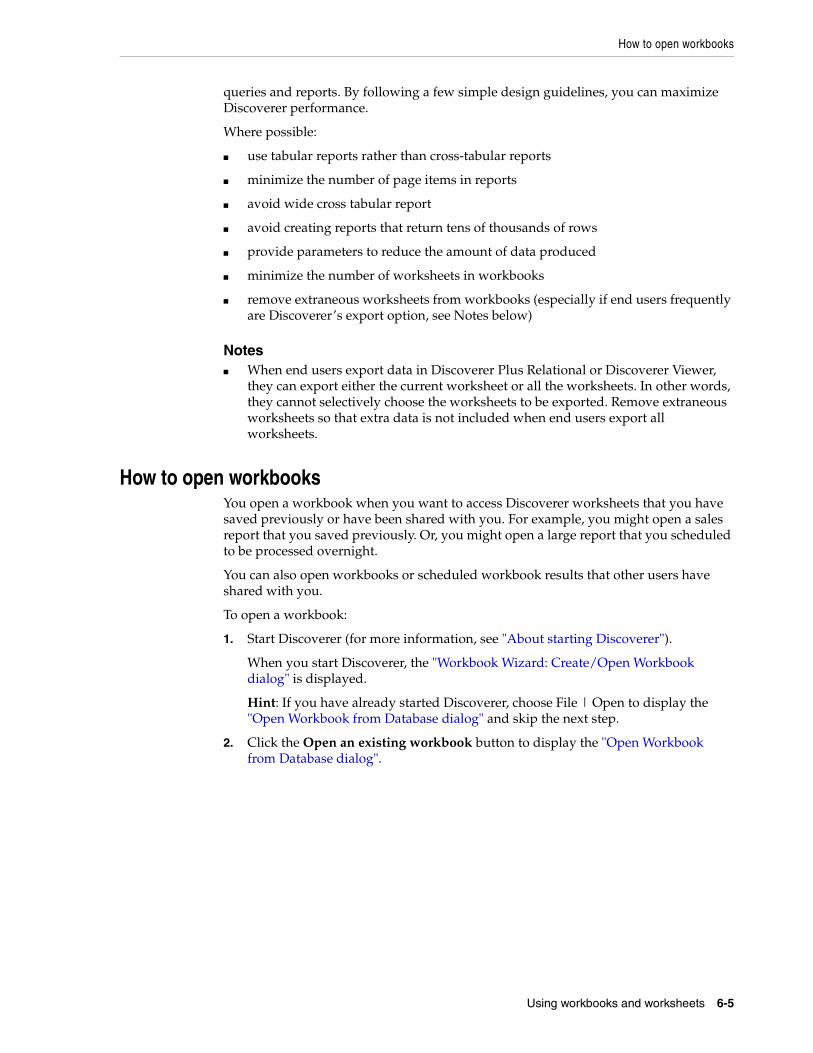
How to open workbooks
Using workbooks and worksheets 6-5
queries and reports. By following a few simple design guidelines, you can maximize Discoverer performance.
Where possible:
■ use tabular reports rather than cross-tabular reports
■ minimize the number of page items in reports
■ avoid wide cross tabular report
■ avoid creating reports that return tens of thousands of rows
■ provide parameters to reduce the amount of data produced
■ minimize the number of worksheets in workbooks
■ remove extraneous worksheets from workbooks (especially if end users frequently are Discoverer’s export option, see Notes below)
Notes■ When end users export data in Discoverer Plus Relational or Discoverer Viewer,
they can export either the current worksheet or all the worksheets. In other words, they cannot selectively choose the worksheets to be exported. Remove extraneous worksheets so that extra data is not included when end users export all worksheets.
How to open workbooksYou open a workbook when you want to access Discoverer worksheets that you have saved previously or have been shared with you. For example, you might open a sales report that you saved previously. Or, you might open a large report that you scheduled to be processed overnight.
You can also open workbooks or scheduled workbook results that other users have shared with you.
To open a workbook:
1. Start Discoverer (for more information, see "About starting Discoverer").
When you start Discoverer, the "Workbook Wizard: Create/Open Workbook dialog" is displayed.
Hint: If you have already started Discoverer, choose File | Open to display the "Open Workbook from Database dialog" and skip the next step.
2. Click the Open an existing workbook button to display the "Open Workbook from Database dialog".
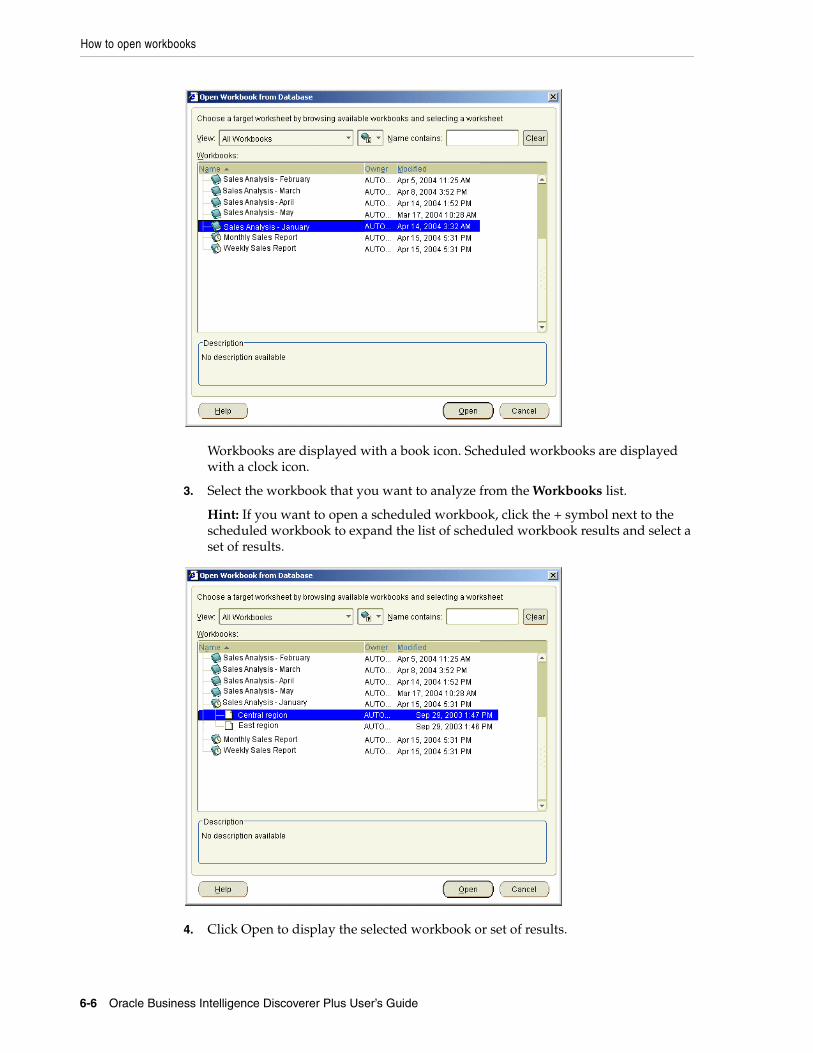
How to open workbooks
6-6 Oracle Business Intelligence Discoverer Plus User’s Guide
Workbooks are displayed with a book icon. Scheduled workbooks are displayed with a clock icon.
3. Select the workbook that you want to analyze from the Workbooks list.
Hint: If you want to open a scheduled workbook, click the + symbol next to the scheduled workbook to expand the list of scheduled workbook results and select a set of results.
4. Click Open to display the selected workbook or set of results.
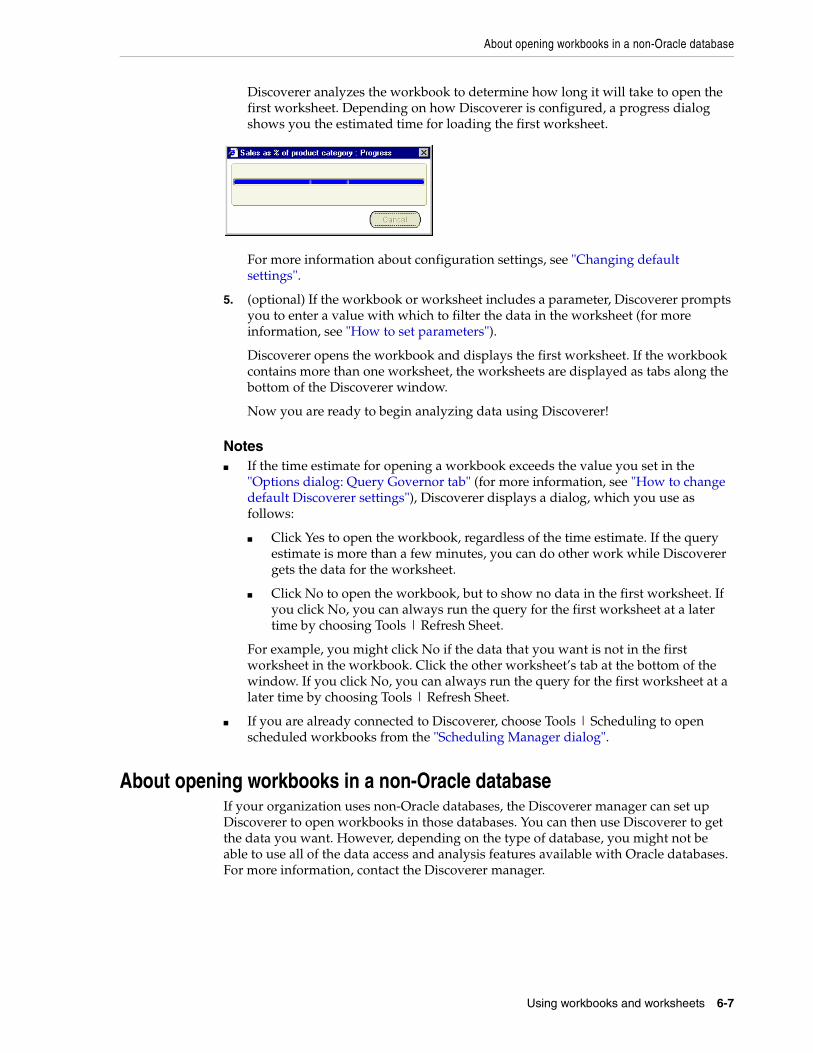
About opening workbooks in a non-Oracle database
Using workbooks and worksheets 6-7
Discoverer analyzes the workbook to determine how long it will take to open the first worksheet. Depending on how Discoverer is configured, a progress dialog shows you the estimated time for loading the first worksheet.
For more information about configuration settings, see "Changing default settings".
5. (optional) If the workbook or worksheet includes a parameter, Discoverer prompts you to enter a value with which to filter the data in the worksheet (for more information, see "How to set parameters").
Discoverer opens the workbook and displays the first worksheet. If the workbook contains more than one worksheet, the worksheets are displayed as tabs along the bottom of the Discoverer window.
Now you are ready to begin analyzing data using Discoverer!
Notes■ If the time estimate for opening a workbook exceeds the value you set in the
"Options dialog: Query Governor tab" (for more information, see "How to change default Discoverer settings"), Discoverer displays a dialog, which you use as follows:
■ Click Yes to open the workbook, regardless of the time estimate. If the query estimate is more than a few minutes, you can do other work while Discoverer gets the data for the worksheet.
■ Click No to open the workbook, but to show no data in the first worksheet. If you click No, you can always run the query for the first worksheet at a later time by choosing Tools | Refresh Sheet.
For example, you might click No if the data that you want is not in the first worksheet in the workbook. Click the other worksheet’s tab at the bottom of the window. If you click No, you can always run the query for the first worksheet at a later time by choosing Tools | Refresh Sheet.
■ If you are already connected to Discoverer, choose Tools | Scheduling to open scheduled workbooks from the "Scheduling Manager dialog".
About opening workbooks in a non-Oracle databaseIf your organization uses non-Oracle databases, the Discoverer manager can set up Discoverer to open workbooks in those databases. You can then use Discoverer to get the data you want. However, depending on the type of database, you might not be able to use all of the data access and analysis features available with Oracle databases. For more information, contact the Discoverer manager.
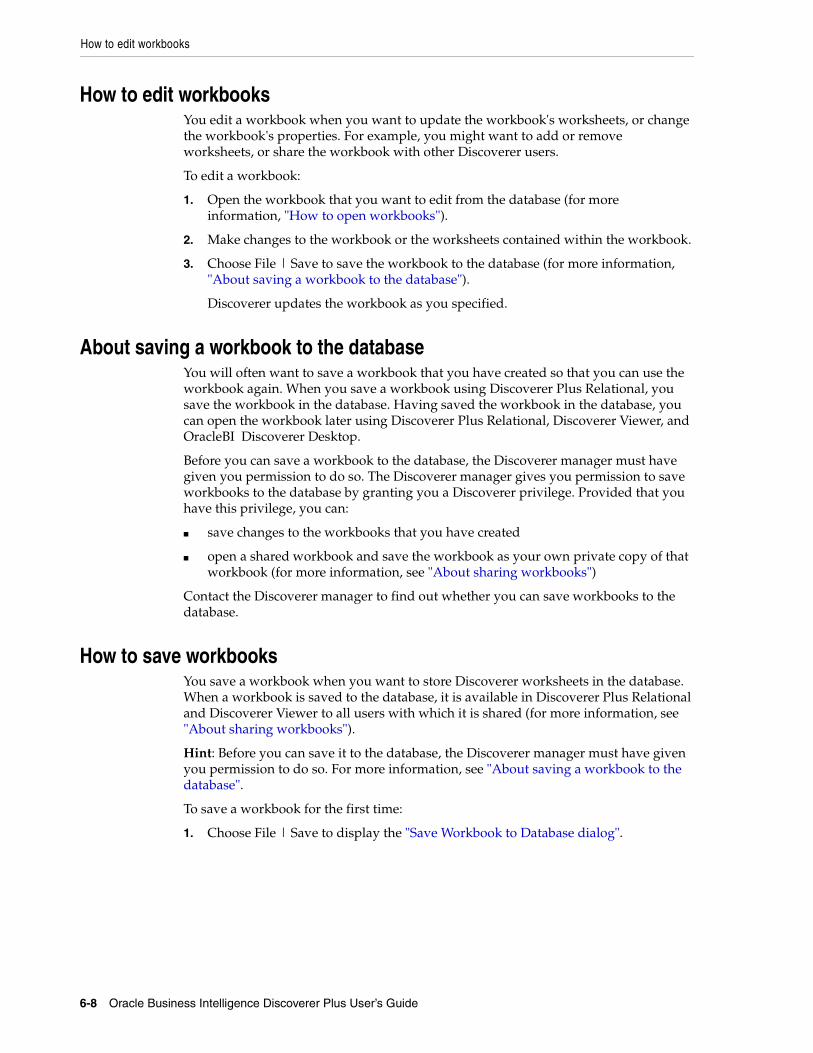
How to edit workbooks
6-8 Oracle Business Intelligence Discoverer Plus User’s Guide
How to edit workbooksYou edit a workbook when you want to update the workbook's worksheets, or change the workbook's properties. For example, you might want to add or remove worksheets, or share the workbook with other Discoverer users.
To edit a workbook:
1. Open the workbook that you want to edit from the database (for more information, "How to open workbooks").
2. Make changes to the workbook or the worksheets contained within the workbook.
3. Choose File | Save to save the workbook to the database (for more information, "About saving a workbook to the database").
Discoverer updates the workbook as you specified.
About saving a workbook to the databaseYou will often want to save a workbook that you have created so that you can use the workbook again. When you save a workbook using Discoverer Plus Relational, you save the workbook in the database. Having saved the workbook in the database, you can open the workbook later using Discoverer Plus Relational, Discoverer Viewer, and OracleBI Discoverer Desktop.
Before you can save a workbook to the database, the Discoverer manager must have given you permission to do so. The Discoverer manager gives you permission to save workbooks to the database by granting you a Discoverer privilege. Provided that you have this privilege, you can:
■ save changes to the workbooks that you have created
■ open a shared workbook and save the workbook as your own private copy of that workbook (for more information, see "About sharing workbooks")
Contact the Discoverer manager to find out whether you can save workbooks to the database.
How to save workbooksYou save a workbook when you want to store Discoverer worksheets in the database. When a workbook is saved to the database, it is available in Discoverer Plus Relational and Discoverer Viewer to all users with which it is shared (for more information, see "About sharing workbooks").
Hint: Before you can save it to the database, the Discoverer manager must have given you permission to do so. For more information, see "About saving a workbook to the database".
To save a workbook for the first time:
1. Choose File | Save to display the "Save Workbook to Database dialog".
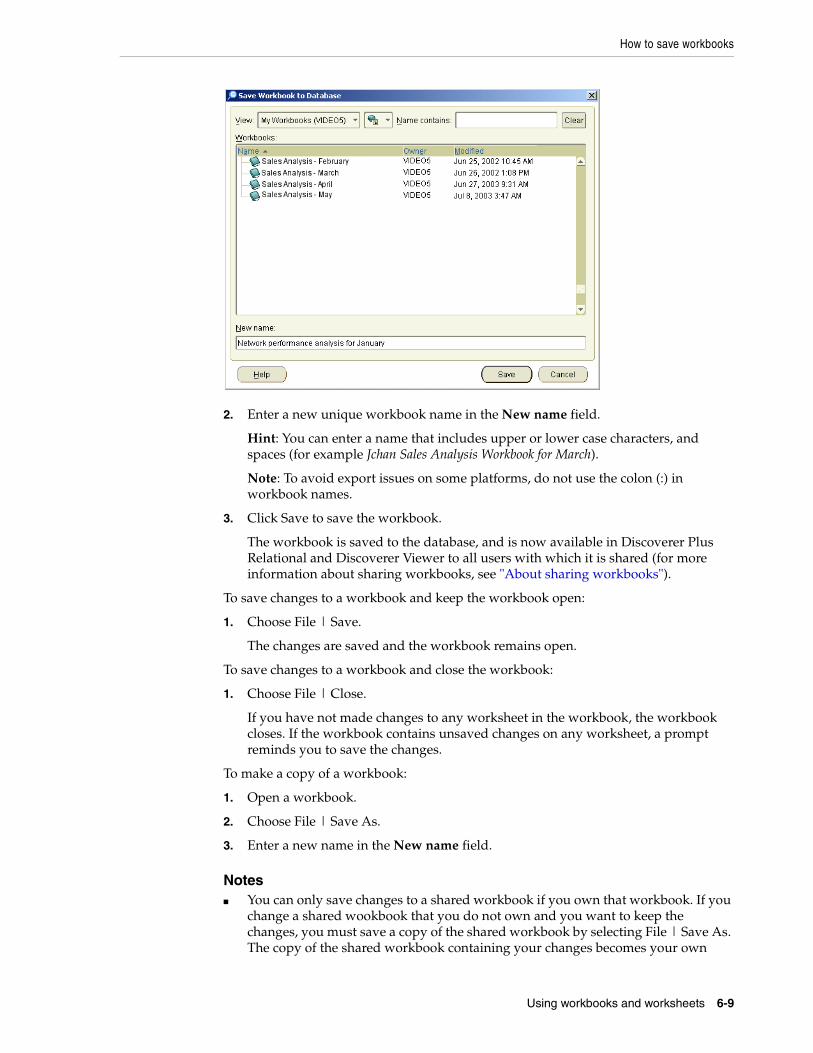
How to save workbooks
Using workbooks and worksheets 6-9
2. Enter a new unique workbook name in the New name field.
Hint: You can enter a name that includes upper or lower case characters, and spaces (for example Jchan Sales Analysis Workbook for March).
Note: To avoid export issues on some platforms, do not use the colon (:) in workbook names.
3. Click Save to save the workbook.
The workbook is saved to the database, and is now available in Discoverer Plus Relational and Discoverer Viewer to all users with which it is shared (for more information about sharing workbooks, see "About sharing workbooks").
To save changes to a workbook and keep the workbook open:
1. Choose File | Save.
The changes are saved and the workbook remains open.
To save changes to a workbook and close the workbook:
1. Choose File | Close.
If you have not made changes to any worksheet in the workbook, the workbook closes. If the workbook contains unsaved changes on any worksheet, a prompt reminds you to save the changes.
To make a copy of a workbook:
1. Open a workbook.
2. Choose File | Save As.
3. Enter a new name in the New name field.
Notes■ You can only save changes to a shared workbook if you own that workbook. If you
change a shared wookbook that you do not own and you want to keep the changes, you must save a copy of the shared workbook by selecting File | Save As. The copy of the shared workbook containing your changes becomes your own
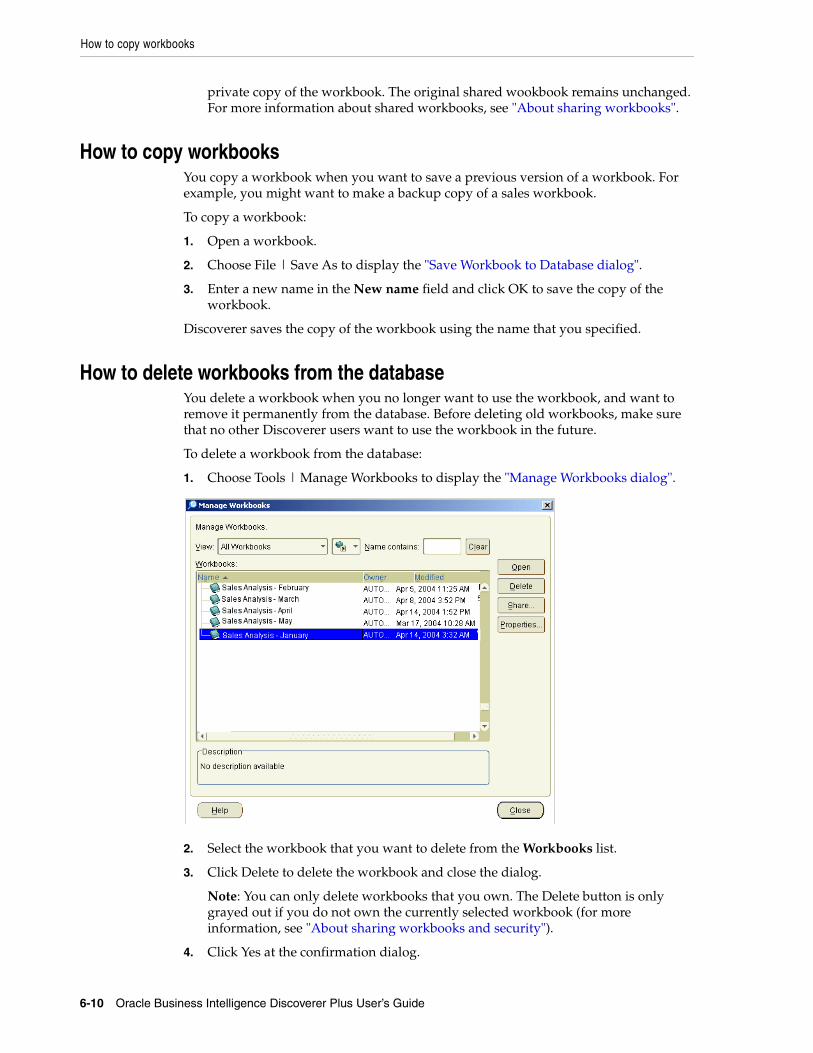
How to copy workbooks
6-10 Oracle Business Intelligence Discoverer Plus User’s Guide
private copy of the workbook. The original shared wookbook remains unchanged. For more information about shared workbooks, see "About sharing workbooks".
How to copy workbooksYou copy a workbook when you want to save a previous version of a workbook. For example, you might want to make a backup copy of a sales workbook.
To copy a workbook:
1. Open a workbook.
2. Choose File | Save As to display the "Save Workbook to Database dialog".
3. Enter a new name in the New name field and click OK to save the copy of the workbook.
Discoverer saves the copy of the workbook using the name that you specified.
How to delete workbooks from the databaseYou delete a workbook when you no longer want to use the workbook, and want to remove it permanently from the database. Before deleting old workbooks, make sure that no other Discoverer users want to use the workbook in the future.
To delete a workbook from the database:
1. Choose Tools | Manage Workbooks to display the "Manage Workbooks dialog".
2. Select the workbook that you want to delete from the Workbooks list.
3. Click Delete to delete the workbook and close the dialog.
Note: You can only delete workbooks that you own. The Delete button is only grayed out if you do not own the currently selected workbook (for more information, see "About sharing workbooks and security").
4. Click Yes at the confirmation dialog.
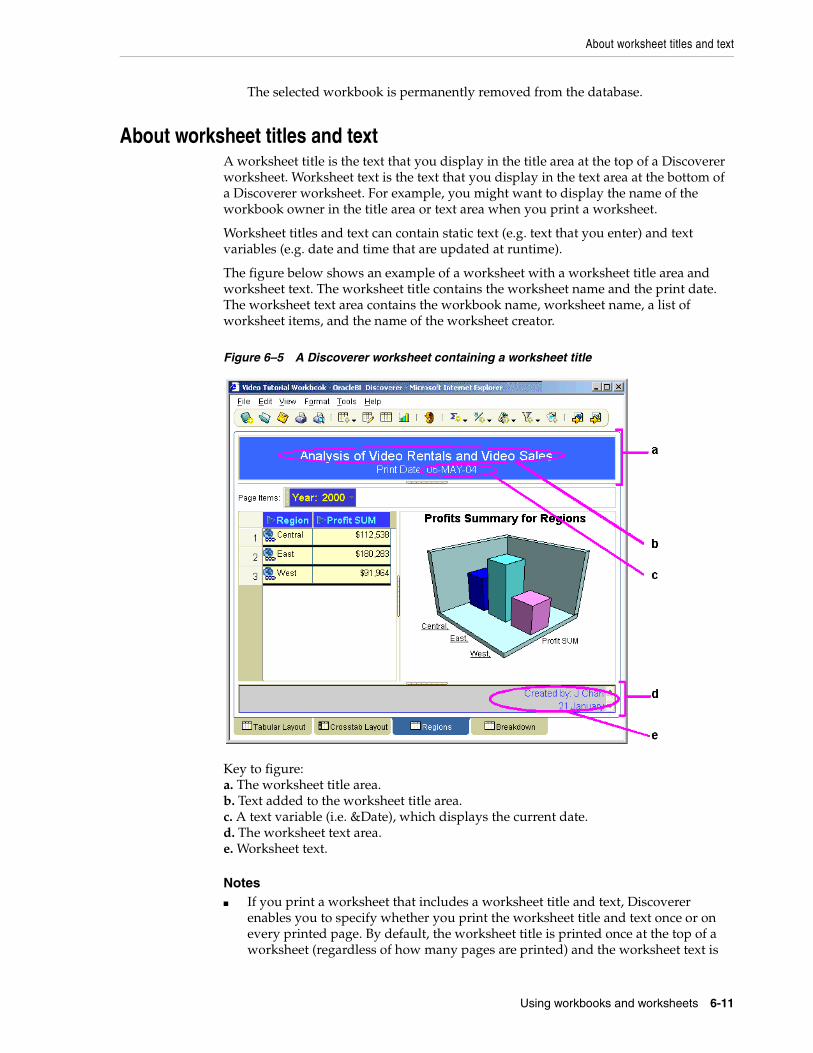
About worksheet titles and text
Using workbooks and worksheets 6-11
The selected workbook is permanently removed from the database.
About worksheet titles and textA worksheet title is the text that you display in the title area at the top of a Discoverer worksheet. Worksheet text is the text that you display in the text area at the bottom of a Discoverer worksheet. For example, you might want to display the name of the workbook owner in the title area or text area when you print a worksheet.
Worksheet titles and text can contain static text (e.g. text that you enter) and text variables (e.g. date and time that are updated at runtime).
The figure below shows an example of a worksheet with a worksheet title area and worksheet text. The worksheet title contains the worksheet name and the print date. The worksheet text area contains the workbook name, worksheet name, a list of worksheet items, and the name of the worksheet creator.
Figure 6–5 A Discoverer worksheet containing a worksheet title
Key to figure:a. The worksheet title area.b. Text added to the worksheet title area.c. A text variable (i.e. &Date), which displays the current date.d. The worksheet text area.e. Worksheet text.
Notes■ If you print a worksheet that includes a worksheet title and text, Discoverer
enables you to specify whether you print the worksheet title and text once or on every printed page. By default, the worksheet title is printed once at the top of a worksheet (regardless of how many pages are printed) and the worksheet text is
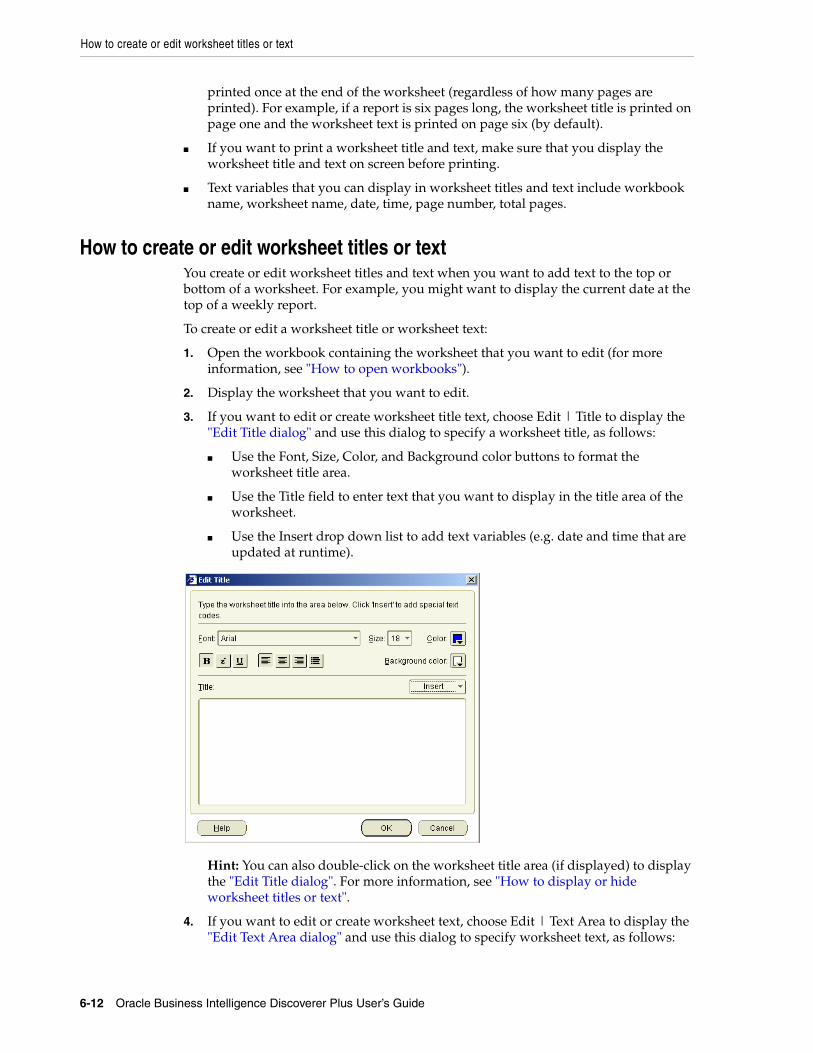
How to create or edit worksheet titles or text
6-12 Oracle Business Intelligence Discoverer Plus User’s Guide
printed once at the end of the worksheet (regardless of how many pages are printed). For example, if a report is six pages long, the worksheet title is printed on page one and the worksheet text is printed on page six (by default).
■ If you want to print a worksheet title and text, make sure that you display the worksheet title and text on screen before printing.
■ Text variables that you can display in worksheet titles and text include workbook name, worksheet name, date, time, page number, total pages.
How to create or edit worksheet titles or textYou create or edit worksheet titles and text when you want to add text to the top or bottom of a worksheet. For example, you might want to display the current date at the top of a weekly report.
To create or edit a worksheet title or worksheet text:
1. Open the workbook containing the worksheet that you want to edit (for more information, see "How to open workbooks").
2. Display the worksheet that you want to edit.
3. If you want to edit or create worksheet title text, choose Edit | Title to display the "Edit Title dialog" and use this dialog to specify a worksheet title, as follows:
■ Use the Font, Size, Color, and Background color buttons to format the worksheet title area.
■ Use the Title field to enter text that you want to display in the title area of the worksheet.
■ Use the Insert drop down list to add text variables (e.g. date and time that are updated at runtime).
Hint: You can also double-click on the worksheet title area (if displayed) to display the "Edit Title dialog". For more information, see "How to display or hide worksheet titles or text".
4. If you want to edit or create worksheet text, choose Edit | Text Area to display the "Edit Text Area dialog" and use this dialog to specify worksheet text, as follows:
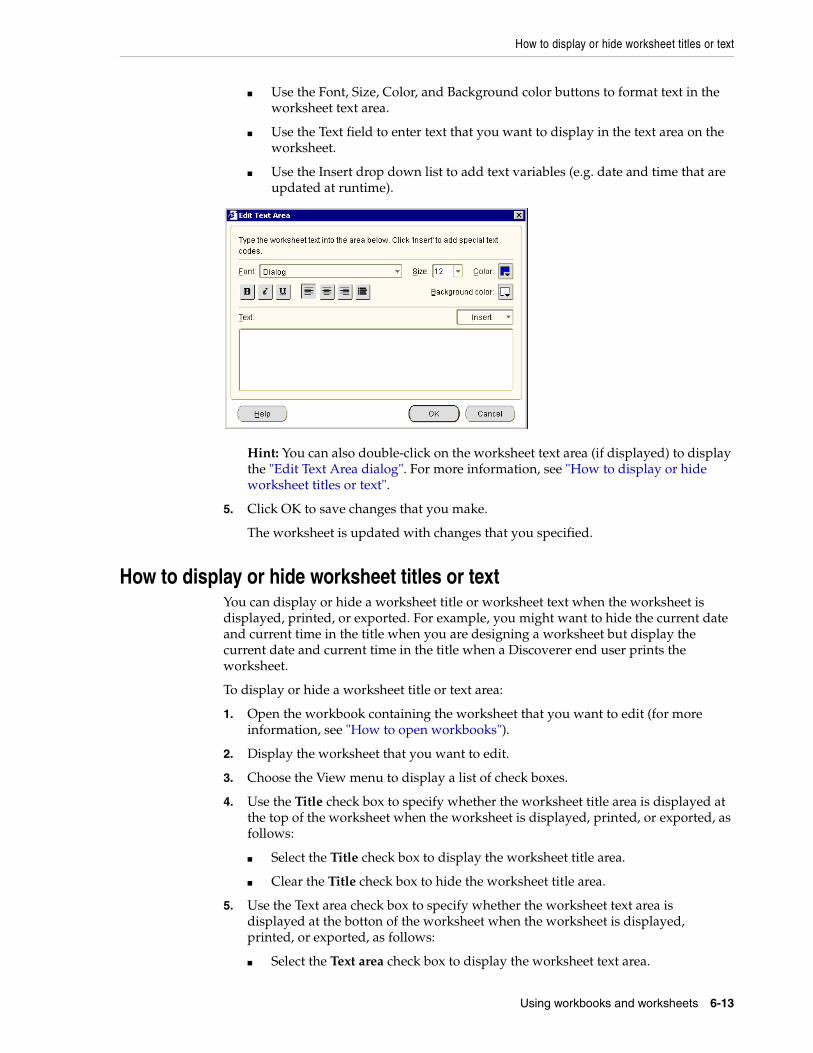
How to display or hide worksheet titles or text
Using workbooks and worksheets 6-13
■ Use the Font, Size, Color, and Background color buttons to format text in the worksheet text area.
■ Use the Text field to enter text that you want to display in the text area on the worksheet.
■ Use the Insert drop down list to add text variables (e.g. date and time that are updated at runtime).
Hint: You can also double-click on the worksheet text area (if displayed) to display the "Edit Text Area dialog". For more information, see "How to display or hide worksheet titles or text".
5. Click OK to save changes that you make.
The worksheet is updated with changes that you specified.
How to display or hide worksheet titles or textYou can display or hide a worksheet title or worksheet text when the worksheet is displayed, printed, or exported. For example, you might want to hide the current date and current time in the title when you are designing a worksheet but display the current date and current time in the title when a Discoverer end user prints the worksheet.
To display or hide a worksheet title or text area:
1. Open the workbook containing the worksheet that you want to edit (for more information, see "How to open workbooks").
2. Display the worksheet that you want to edit.
3. Choose the View menu to display a list of check boxes.
4. Use the Title check box to specify whether the worksheet title area is displayed at the top of the worksheet when the worksheet is displayed, printed, or exported, as follows:
■ Select the Title check box to display the worksheet title area.
■ Clear the Title check box to hide the worksheet title area.
5. Use the Text area check box to specify whether the worksheet text area is displayed at the botton of the worksheet when the worksheet is displayed, printed, or exported, as follows:
■ Select the Text area check box to display the worksheet text area.
How to rename worksheets and workbooks
6-14 Oracle Business Intelligence Discoverer Plus User’s Guide
■ Clear the Text area check box to hide the worksheet text area.
The worksheet is updated with the changes that you specified.
Notes■ To specify that Discoverer always displays the worksheet title area when you
create a new worksheet, choose Tools | Options and select the Show title check box on the "Options dialog: Sheet tab".
■ To specify that Discoverer always displays the worksheet text area when you create a new worksheet, choose Tools | Options and select the Show text area check box on the "Options dialog: Sheet tab".
How to rename worksheets and workbooksYou rename a workbook to change its name used in Discoverer. For example, you might want to create a more meaningful workbook name by changing a workbook name from My Workbook to Sales Reports.
You rename a worksheet when you want to change the name displayed in the worksheet tab. For example, you might want to change the default worksheet name created by Discoverer (e.g. Sheet 2) to something more meaningful (e.g. Sales Report).
To rename a workbook:
1. If it is not already open, open the workbook that you want to rename (for more information, see "How to open workbooks").
2. Choose File | Save As to display the "Save Workbook to Database dialog" and enter a new name in the New Name field.
Note: Do not include a colon (:) character.
3. Click Save to save the workbook.
4. (optional) Delete the original workbook (for more information, see "How to delete workbooks from the database").
The workbook’s new name is displayed at the top of the Discoverer work area.
To rename a worksheet:
1. If it is not already open, open the workbook that contains the worksheet you want to rename and display the worksheet.
2. Choose Edit | Worksheet Properties to display the "Worksheet Properties dialog: General tab".
Note: You can also display the worksheet properties dialog by double-clicking the worksheet name tab at the bottom of the worksheet.
3. Enter the new name for the worksheet in the Name field.
4. Click OK to rename the worksheet.
The worksheet’s new name is displayed at the bottom of the worksheet.
How to re-order worksheets within a workbookYou re-order worksheets within a workbook when you want to change the order that Discoverer displays worksheets in a workbook. For example, you might want to put the most commonly used worksheet at the front of a workbook to access information more easily.
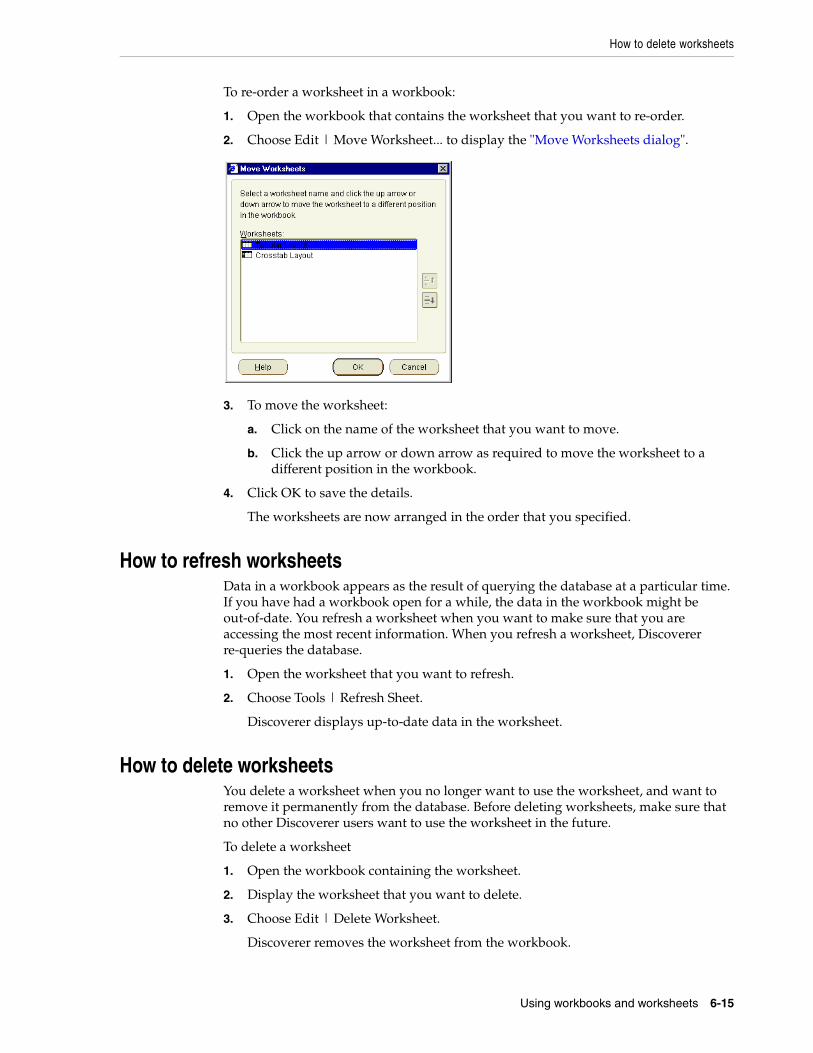
How to delete worksheets
Using workbooks and worksheets 6-15
To re-order a worksheet in a workbook:
1. Open the workbook that contains the worksheet that you want to re-order.
2. Choose Edit | Move Worksheet... to display the "Move Worksheets dialog".
3. To move the worksheet:
a. Click on the name of the worksheet that you want to move.
b. Click the up arrow or down arrow as required to move the worksheet to a different position in the workbook.
4. Click OK to save the details.
The worksheets are now arranged in the order that you specified.
How to refresh worksheetsData in a workbook appears as the result of querying the database at a particular time. If you have had a workbook open for a while, the data in the workbook might be out-of-date. You refresh a worksheet when you want to make sure that you are accessing the most recent information. When you refresh a worksheet, Discoverer re-queries the database.
1. Open the worksheet that you want to refresh.
2. Choose Tools | Refresh Sheet.
Discoverer displays up-to-date data in the worksheet.
How to delete worksheetsYou delete a worksheet when you no longer want to use the worksheet, and want to remove it permanently from the database. Before deleting worksheets, make sure that no other Discoverer users want to use the worksheet in the future.
To delete a worksheet
1. Open the workbook containing the worksheet.
2. Display the worksheet that you want to delete.
3. Choose Edit | Delete Worksheet.
Discoverer removes the worksheet from the workbook.
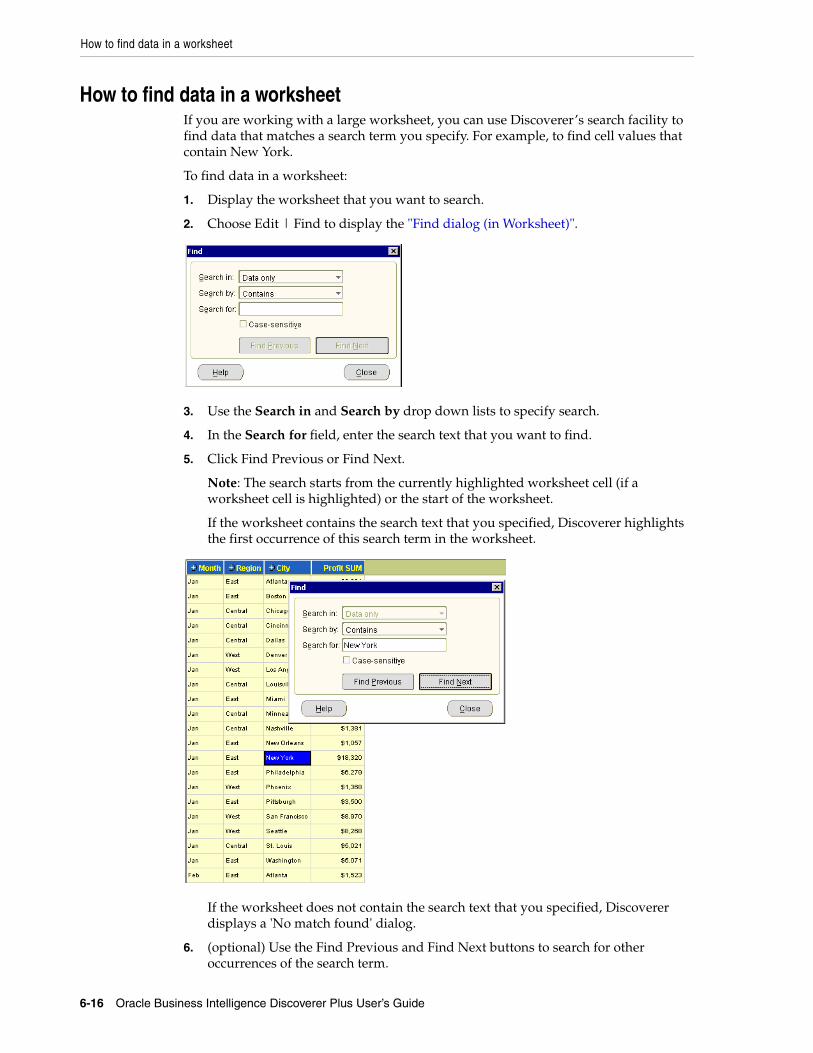
How to find data in a worksheet
6-16 Oracle Business Intelligence Discoverer Plus User’s Guide
How to find data in a worksheetIf you are working with a large worksheet, you can use Discoverer’s search facility to find data that matches a search term you specify. For example, to find cell values that contain New York.
To find data in a worksheet:
1. Display the worksheet that you want to search.
2. Choose Edit | Find to display the "Find dialog (in Worksheet)".
3. Use the Search in and Search by drop down lists to specify search.
4. In the Search for field, enter the search text that you want to find.
5. Click Find Previous or Find Next.
Note: The search starts from the currently highlighted worksheet cell (if a worksheet cell is highlighted) or the start of the worksheet.
If the worksheet contains the search text that you specified, Discoverer highlights the first occurrence of this search term in the worksheet.
If the worksheet does not contain the search text that you specified, Discoverer displays a 'No match found' dialog.
6. (optional) Use the Find Previous and Find Next buttons to search for other occurrences of the search term.
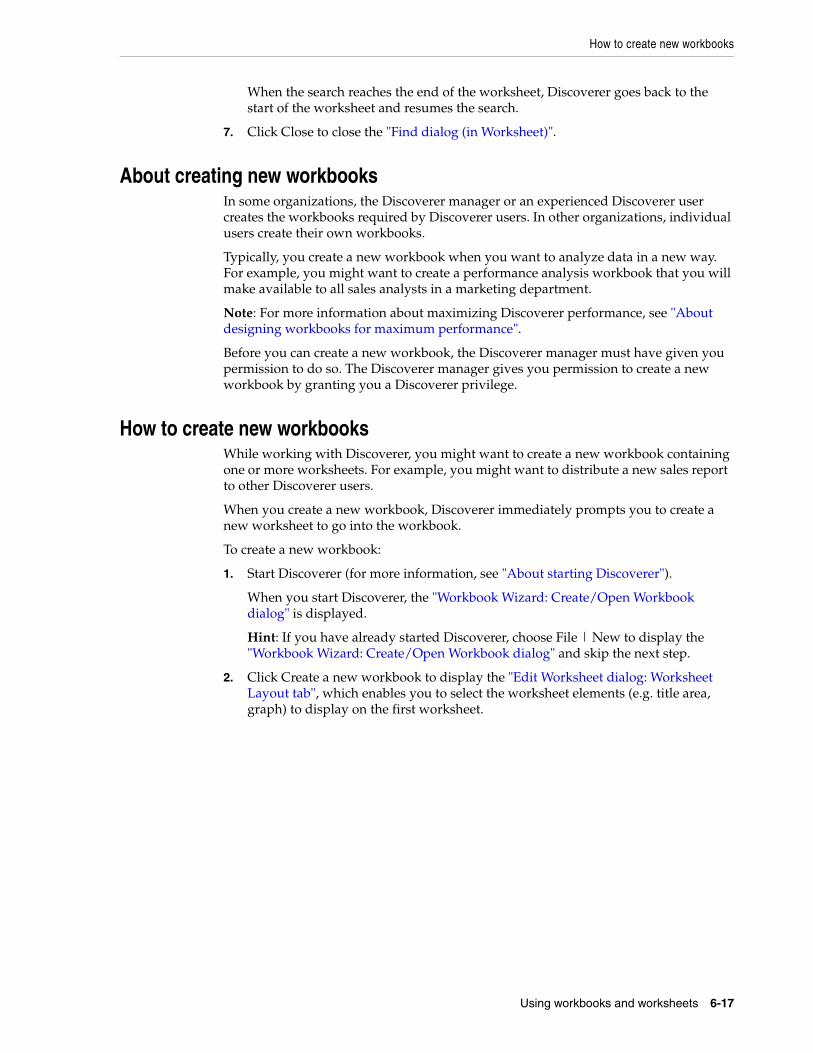
How to create new workbooks
Using workbooks and worksheets 6-17
When the search reaches the end of the worksheet, Discoverer goes back to the start of the worksheet and resumes the search.
7. Click Close to close the "Find dialog (in Worksheet)".
About creating new workbooksIn some organizations, the Discoverer manager or an experienced Discoverer user creates the workbooks required by Discoverer users. In other organizations, individual users create their own workbooks.
Typically, you create a new workbook when you want to analyze data in a new way. For example, you might want to create a performance analysis workbook that you will make available to all sales analysts in a marketing department.
Note: For more information about maximizing Discoverer performance, see "About designing workbooks for maximum performance".
Before you can create a new workbook, the Discoverer manager must have given you permission to do so. The Discoverer manager gives you permission to create a new workbook by granting you a Discoverer privilege.
How to create new workbooksWhile working with Discoverer, you might want to create a new workbook containing one or more worksheets. For example, you might want to distribute a new sales report to other Discoverer users.
When you create a new workbook, Discoverer immediately prompts you to create a new worksheet to go into the workbook.
To create a new workbook:
1. Start Discoverer (for more information, see "About starting Discoverer").
When you start Discoverer, the "Workbook Wizard: Create/Open Workbook dialog" is displayed.
Hint: If you have already started Discoverer, choose File | New to display the "Workbook Wizard: Create/Open Workbook dialog" and skip the next step.
2. Click Create a new workbook to display the "Edit Worksheet dialog: Worksheet Layout tab", which enables you to select the worksheet elements (e.g. title area, graph) to display on the first worksheet.
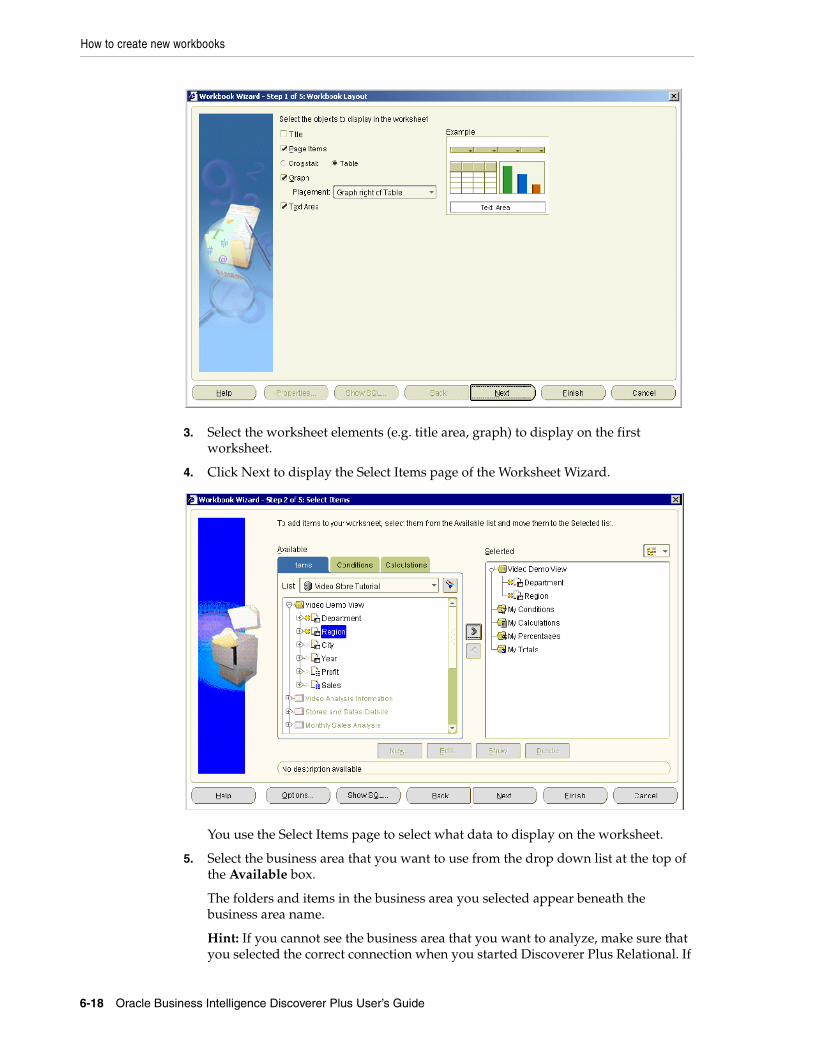
How to create new workbooks
6-18 Oracle Business Intelligence Discoverer Plus User’s Guide
3. Select the worksheet elements (e.g. title area, graph) to display on the first worksheet.
4. Click Next to display the Select Items page of the Worksheet Wizard.
You use the Select Items page to select what data to display on the worksheet.
5. Select the business area that you want to use from the drop down list at the top of the Available box.
The folders and items in the business area you selected appear beneath the business area name.
Hint: If you cannot see the business area that you want to analyze, make sure that you selected the correct connection when you started Discoverer Plus Relational. If
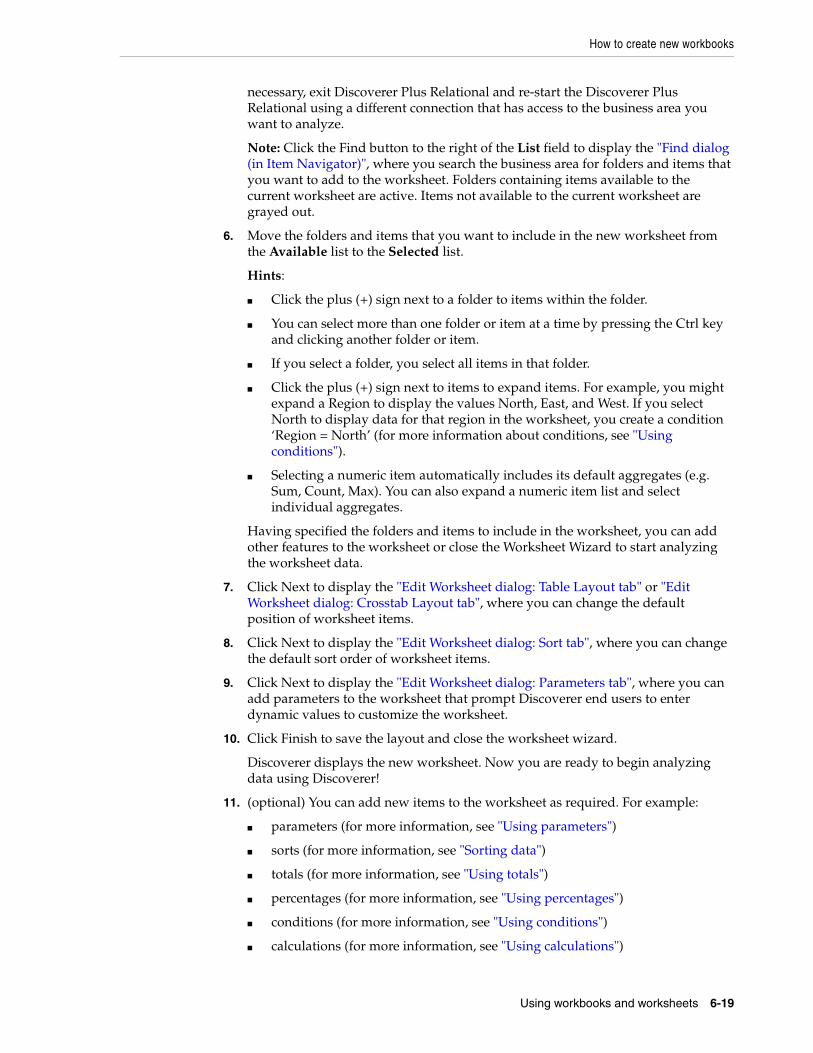
How to create new workbooks
Using workbooks and worksheets 6-19
necessary, exit Discoverer Plus Relational and re-start the Discoverer Plus Relational using a different connection that has access to the business area you want to analyze.
Note: Click the Find button to the right of the List field to display the "Find dialog (in Item Navigator)", where you search the business area for folders and items that you want to add to the worksheet. Folders containing items available to the current worksheet are active. Items not available to the current worksheet are grayed out.
6. Move the folders and items that you want to include in the new worksheet from the Available list to the Selected list.
Hints:
■ Click the plus (+) sign next to a folder to items within the folder.
■ You can select more than one folder or item at a time by pressing the Ctrl key and clicking another folder or item.
■ If you select a folder, you select all items in that folder.
■ Click the plus (+) sign next to items to expand items. For example, you might expand a Region to display the values North, East, and West. If you select North to display data for that region in the worksheet, you create a condition ‘Region = North’ (for more information about conditions, see "Using conditions").
■ Selecting a numeric item automatically includes its default aggregates (e.g. Sum, Count, Max). You can also expand a numeric item list and select individual aggregates.
Having specified the folders and items to include in the worksheet, you can add other features to the worksheet or close the Worksheet Wizard to start analyzing the worksheet data.
7. Click Next to display the "Edit Worksheet dialog: Table Layout tab" or "Edit Worksheet dialog: Crosstab Layout tab", where you can change the default position of worksheet items.
8. Click Next to display the "Edit Worksheet dialog: Sort tab", where you can change the default sort order of worksheet items.
9. Click Next to display the "Edit Worksheet dialog: Parameters tab", where you can add parameters to the worksheet that prompt Discoverer end users to enter dynamic values to customize the worksheet.
10. Click Finish to save the layout and close the worksheet wizard.
Discoverer displays the new worksheet. Now you are ready to begin analyzing data using Discoverer!
11. (optional) You can add new items to the worksheet as required. For example:
■ parameters (for more information, see "Using parameters")
■ sorts (for more information, see "Sorting data")
■ totals (for more information, see "Using totals")
■ percentages (for more information, see "Using percentages")
■ conditions (for more information, see "Using conditions")
■ calculations (for more information, see "Using calculations")
How to create new workbooks
6-20 Oracle Business Intelligence Discoverer Plus User’s Guide
Now that you have created a worksheet, you might want to do one or more of the following:
■ edit the worksheet using Oracle Portal (for more information, see "Editing worksheets and worksheet items"
■ print the worksheet (for more information, see "Printing worksheets and graphs"
■ share the workbook with other Discoverer users (for more information, see "Sharing workbooks"
■ export the worksheet to a different format (for more information, see "Exporting data to other applications"
■ create a graph for the worksheet data (for more information, see "Creating graphs in Discoverer"
■ publish the worksheet using Oracle Portal (for more information, see "Publishing worksheets in OracleAS Portal"
Notes■ Before you publish a Discoverer workbook, make sure that the workbook is
designed for maximum performance (for more information, see "About designing workbooks for maximum performance").
■ After creating a worksheet, you can always change default options later by choosing Edit | Worksheet... to display the "Edit Worksheet dialog". Here, you can change the worksheet layout and display formats, and add worksheet items (e.g. parameters, conditions, calculations).
■ If you select items from different folders (or multiple folders), you might be prompted by the Join Folders dialog to specify how to join folders. This means that information in folders can be associated in more than one way. For example, a product key item in a Products folder might be associated with a product key item in a Sales folder. The Products folder and Sales folder might also both contain an item called Location, which is an alternative item on which to associate the two folders.
Contact the Discoverer manager for more information about multiple join paths, or see "About multiple join paths".
In the figure below, the Join Folders dialog is displayed when Discoverer detects a multiple join path. In this instance, the Store item can be associated with the Sales Fact folder or the Sales Facts folder. The Please select the join or joins that you want to use list contains an entry for each of these options.

How to view and update a workbook’s properties
Using workbooks and worksheets 6-21
Figure 6–6 Join Folders dialog
How to add worksheets to a workbookYou add a worksheet to a workbook when you want to analyze data in a new way. For example, you might have a sales workbook to which you want to add a new worksheet on sales for a particular region.
You can add a worksheet in two ways:
■ by creating a copy of an existing worksheet in the current workbook and modifying the copy to meet your needs (see "How to duplicate a worksheet")
■ by creating a completely new worksheet using the Discoverer Worksheet Wizard to guide you through the process (as described below)
To create a completely new worksheet:
1. Start Discoverer and open the workbook to which you want to add a worksheet (for more information, see "How to open workbooks").
2. Choose Edit | Add Worksheet... to display the Worksheet Wizard.
3. Follow the instructions on the Worksheet Wizard.
The new worksheet is added to the workbook.
How to view and update a workbook’s propertiesYou update a workbook’s properties to store additional information about the workbook. For example, you might want to store information about what the workbook should be used for to help potential users of the workbook. You can only update the properties of a workbook that you own and currently have open.
You might also want to view a workbook’s properties to find out information about the workbook. For example, you might want to find out the name of the workbook owner or the date that the workbook was created.
To update a workbook’s properties:
1. Open the workbook.
2. Choose File | Workbook Properties to display the "Workbook Properties dialog".
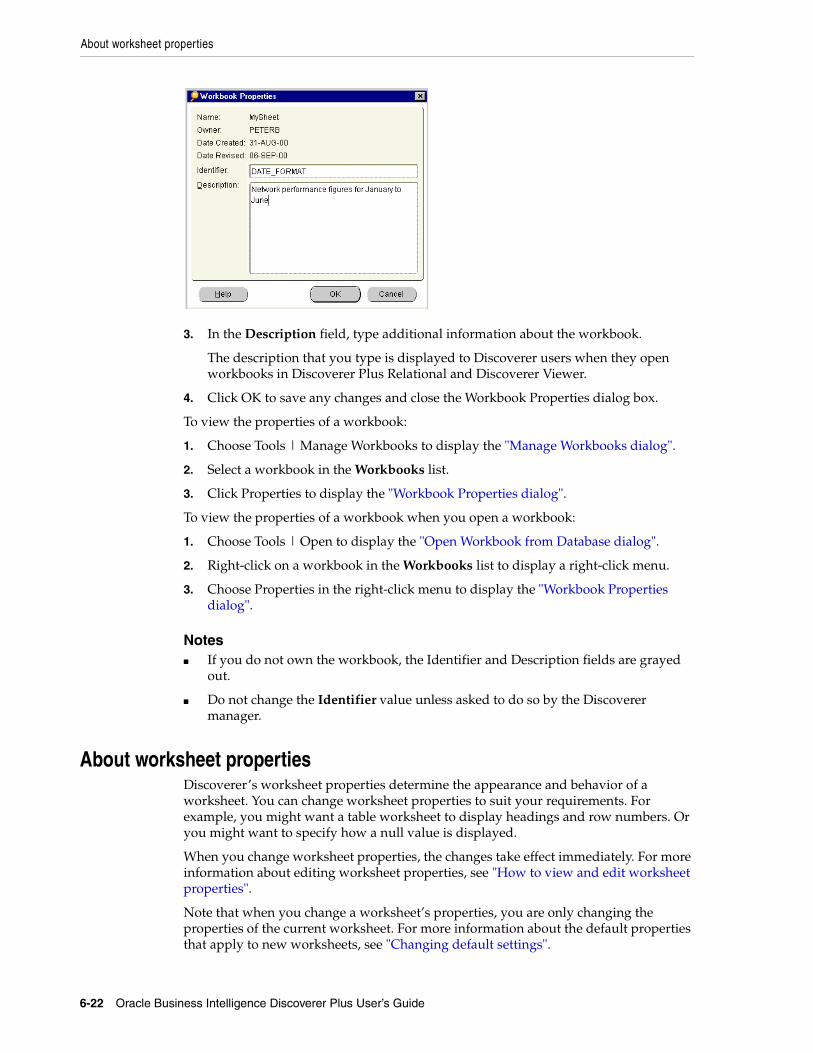
About worksheet properties
6-22 Oracle Business Intelligence Discoverer Plus User’s Guide
3. In the Description field, type additional information about the workbook.
The description that you type is displayed to Discoverer users when they open workbooks in Discoverer Plus Relational and Discoverer Viewer.
4. Click OK to save any changes and close the Workbook Properties dialog box.
To view the properties of a workbook:
1. Choose Tools | Manage Workbooks to display the "Manage Workbooks dialog".
2. Select a workbook in the Workbooks list.
3. Click Properties to display the "Workbook Properties dialog".
To view the properties of a workbook when you open a workbook:
1. Choose Tools | Open to display the "Open Workbook from Database dialog".
2. Right-click on a workbook in the Workbooks list to display a right-click menu.
3. Choose Properties in the right-click menu to display the "Workbook Properties dialog".
Notes■ If you do not own the workbook, the Identifier and Description fields are grayed
out.
■ Do not change the Identifier value unless asked to do so by the Discoverer manager.
About worksheet propertiesDiscoverer’s worksheet properties determine the appearance and behavior of a worksheet. You can change worksheet properties to suit your requirements. For example, you might want a table worksheet to display headings and row numbers. Or you might want to specify how a null value is displayed.
When you change worksheet properties, the changes take effect immediately. For more information about editing worksheet properties, see "How to view and edit worksheet properties".
Note that when you change a worksheet’s properties, you are only changing the properties of the current worksheet. For more information about the default properties that apply to new worksheets, see "Changing default settings".
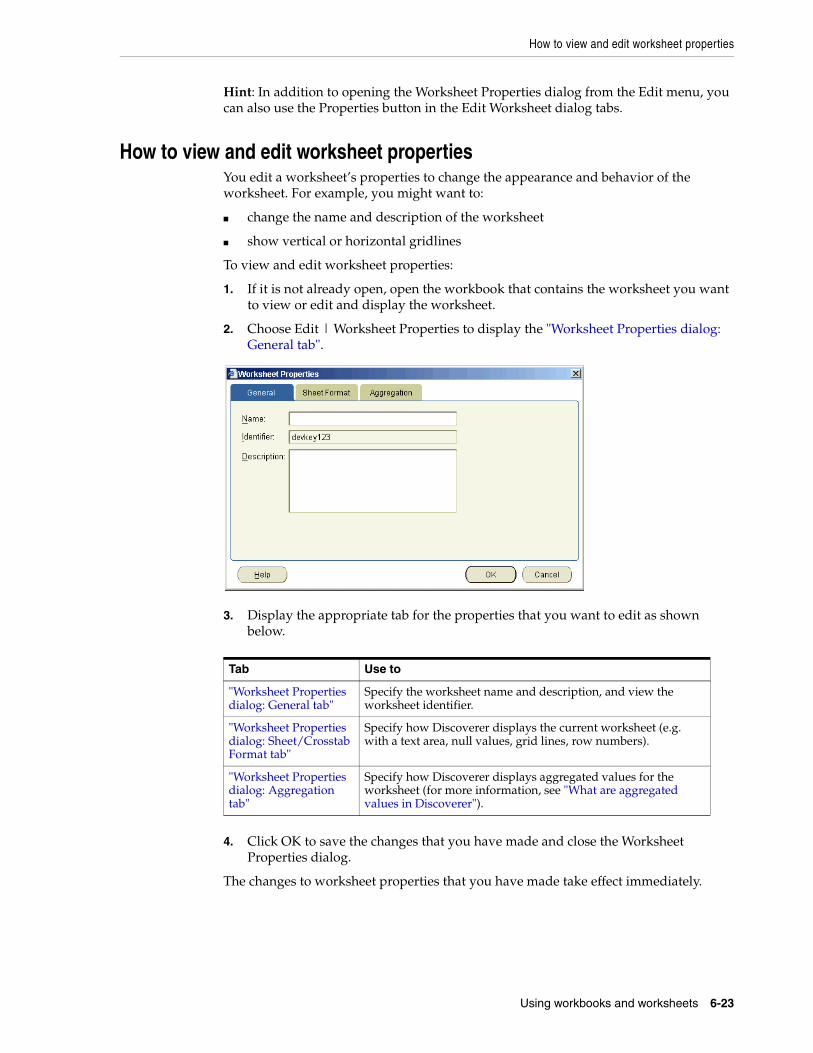
How to view and edit worksheet properties
Using workbooks and worksheets 6-23
Hint: In addition to opening the Worksheet Properties dialog from the Edit menu, you can also use the Properties button in the Edit Worksheet dialog tabs.
How to view and edit worksheet propertiesYou edit a worksheet’s properties to change the appearance and behavior of the worksheet. For example, you might want to:
■ change the name and description of the worksheet
■ show vertical or horizontal gridlines
To view and edit worksheet properties:
1. If it is not already open, open the workbook that contains the worksheet you want to view or edit and display the worksheet.
2. Choose Edit | Worksheet Properties to display the "Worksheet Properties dialog: General tab".
3. Display the appropriate tab for the properties that you want to edit as shown below.
4. Click OK to save the changes that you have made and close the Worksheet Properties dialog.
The changes to worksheet properties that you have made take effect immediately.
Tab Use to
"Worksheet Properties dialog: General tab"
Specify the worksheet name and description, and view the worksheet identifier.
"Worksheet Properties dialog: Sheet/Crosstab Format tab"
Specify how Discoverer displays the current worksheet (e.g. with a text area, null values, grid lines, row numbers).
"Worksheet Properties dialog: Aggregation tab"
Specify how Discoverer displays aggregated values for the worksheet (for more information, see "What are aggregated values in Discoverer").

How to view and edit worksheet properties
6-24 Oracle Business Intelligence Discoverer Plus User’s Guide
Editing worksheets and worksheet items 7-1
7Editing worksheets and worksheet items
This section explains how to edit Discoverer Plus Relational worksheets and format worksheet data, and contains the following topics:
■ "About editing worksheets"
■ "How to edit worksheets using the Edit Worksheet wizard"
■ "How to add items to worksheets"
■ "How to create new worksheet items"
■ "How to remove items from worksheets"
■ "How to duplicate a worksheet"
■ "How to change the format of worksheet items"
■ "How to set the currency symbol for numeric items"
■ "How to change the format of worksheet item headings"
■ "How to change the text in item headings"
About editing worksheetsWhen you create a new worksheet, Discoverer applies a default format (e.g. colors, fonts) to worksheet items. For more information about changing the default format that is applied to worksheet items, see "How to change default worksheet formats").
Discoverer’s powerful layout tools enable you to format worksheets exactly how you want them. For example, you might want to:
■ add items to a worksheet
■ remove items from a worksheet
■ change the color of rows and columns
■ change the background color or title of worksheets
■ change the format of text and numbers
■ change the column width on table worksheets (Discoverer automatically sets the column size on crosstab worksheets)
You can edit worksheets using any of the following methods:
■ by dragging and dropping a worksheet item from one area of a worksheet to another area (you can also resize worksheet columns using drag and drop)
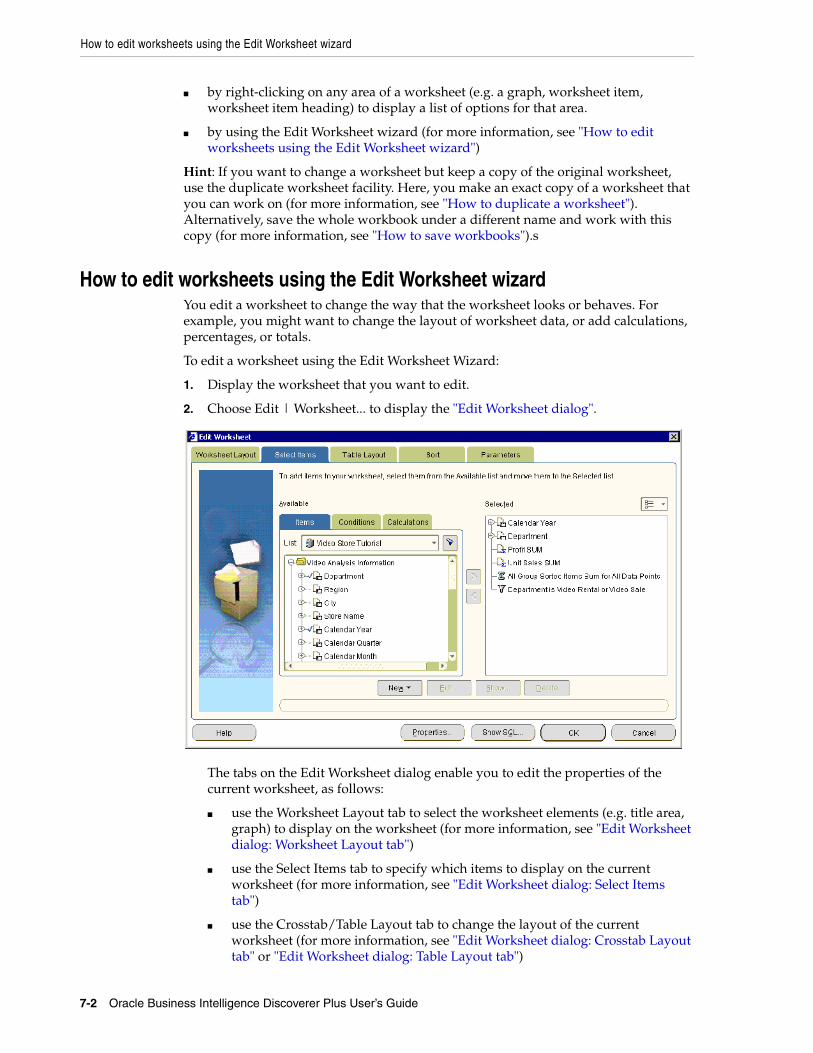
How to edit worksheets using the Edit Worksheet wizard
7-2 Oracle Business Intelligence Discoverer Plus User’s Guide
■ by right-clicking on any area of a worksheet (e.g. a graph, worksheet item, worksheet item heading) to display a list of options for that area.
■ by using the Edit Worksheet wizard (for more information, see "How to edit worksheets using the Edit Worksheet wizard")
Hint: If you want to change a worksheet but keep a copy of the original worksheet, use the duplicate worksheet facility. Here, you make an exact copy of a worksheet that you can work on (for more information, see "How to duplicate a worksheet"). Alternatively, save the whole workbook under a different name and work with this copy (for more information, see "How to save workbooks").s
How to edit worksheets using the Edit Worksheet wizardYou edit a worksheet to change the way that the worksheet looks or behaves. For example, you might want to change the layout of worksheet data, or add calculations, percentages, or totals.
To edit a worksheet using the Edit Worksheet Wizard:
1. Display the worksheet that you want to edit.
2. Choose Edit | Worksheet... to display the "Edit Worksheet dialog".
The tabs on the Edit Worksheet dialog enable you to edit the properties of the current worksheet, as follows:
■ use the Worksheet Layout tab to select the worksheet elements (e.g. title area, graph) to display on the worksheet (for more information, see "Edit Worksheet dialog: Worksheet Layout tab")
■ use the Select Items tab to specify which items to display on the current worksheet (for more information, see "Edit Worksheet dialog: Select Items tab")
■ use the Crosstab/Table Layout tab to change the layout of the current worksheet (for more information, see "Edit Worksheet dialog: Crosstab Layout tab" or "Edit Worksheet dialog: Table Layout tab")
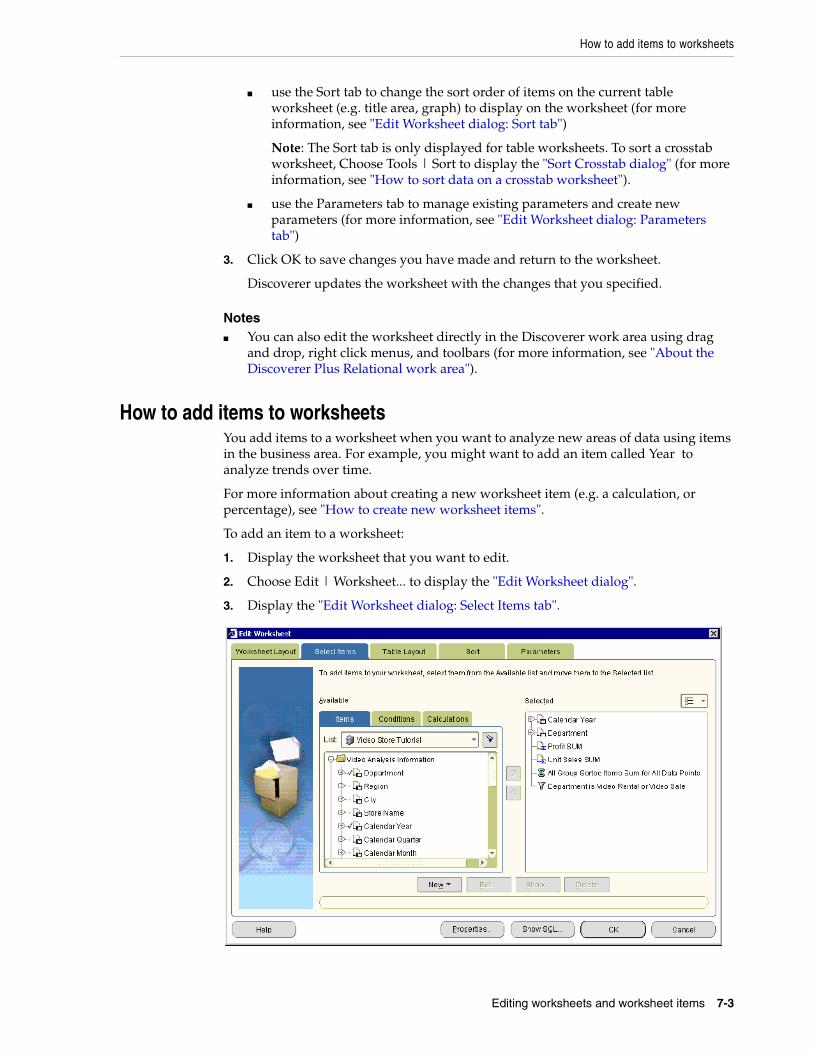
How to add items to worksheets
Editing worksheets and worksheet items 7-3
■ use the Sort tab to change the sort order of items on the current table worksheet (e.g. title area, graph) to display on the worksheet (for more information, see "Edit Worksheet dialog: Sort tab")
Note: The Sort tab is only displayed for table worksheets. To sort a crosstab worksheet, Choose Tools | Sort to display the "Sort Crosstab dialog" (for more information, see "How to sort data on a crosstab worksheet").
■ use the Parameters tab to manage existing parameters and create new parameters (for more information, see "Edit Worksheet dialog: Parameters tab")
3. Click OK to save changes you have made and return to the worksheet.
Discoverer updates the worksheet with the changes that you specified.
Notes■ You can also edit the worksheet directly in the Discoverer work area using drag
and drop, right click menus, and toolbars (for more information, see "About the Discoverer Plus Relational work area").
How to add items to worksheetsYou add items to a worksheet when you want to analyze new areas of data using items in the business area. For example, you might want to add an item called Year to analyze trends over time.
For more information about creating a new worksheet item (e.g. a calculation, or percentage), see "How to create new worksheet items".
To add an item to a worksheet:
1. Display the worksheet that you want to edit.
2. Choose Edit | Worksheet... to display the "Edit Worksheet dialog".
3. Display the "Edit Worksheet dialog: Select Items tab".
How to create new worksheet items
7-4 Oracle Business Intelligence Discoverer Plus User’s Guide
4. Use the Available list to locate and select the item you want to add to the worksheet.
Hint: Click the plus (+) sign next to folders and items to see items and values within them. Click the flashlight button above the Available box to display the "Find dialog (in Item Navigator)", where you can search for items.
5. Move items that you want to add to the worksheet from the Available list to the Selected list.
You can select more than one item at a time by pressing the Ctrl key and clicking another item.
6. Click OK to save the changes you have made and close the dialog.
Discoverer updates the worksheet with the changes that you specified.
Hint: To change the position of worksheet items, display the "Edit Worksheet dialog: Table Layout tab" or "Edit Worksheet dialog: Crosstab Layout tab" and drag and drop items to arrange them on the worksheet.
Notes■ To quickly add a worksheet item, simply drag and drop an item from the Available
Items pane to the worksheet area. To display the Available items pane, choose View | Available Items Pane. For more information, see "About dragging and dropping items in the Discoverer work area".
■ To move items from the Available list to the Selected list, do one of the following:
■ use the right arrow button to move selected items to the Selected list
■ use the cursor to drag and drop selected items from the Available list to the Selected list
How to create new worksheet itemsYou create new worksheet items when you want to analyze different data using items that might not be in the business area. For example, you might want to create a three month moving sales average.
For more information about adding an existing item to a worksheet, see "How to add items to worksheets".
To create a new worksheet item:
1. Display the worksheet that you want to edit.
2. Choose Edit | Worksheet to display the "Edit Worksheet dialog".
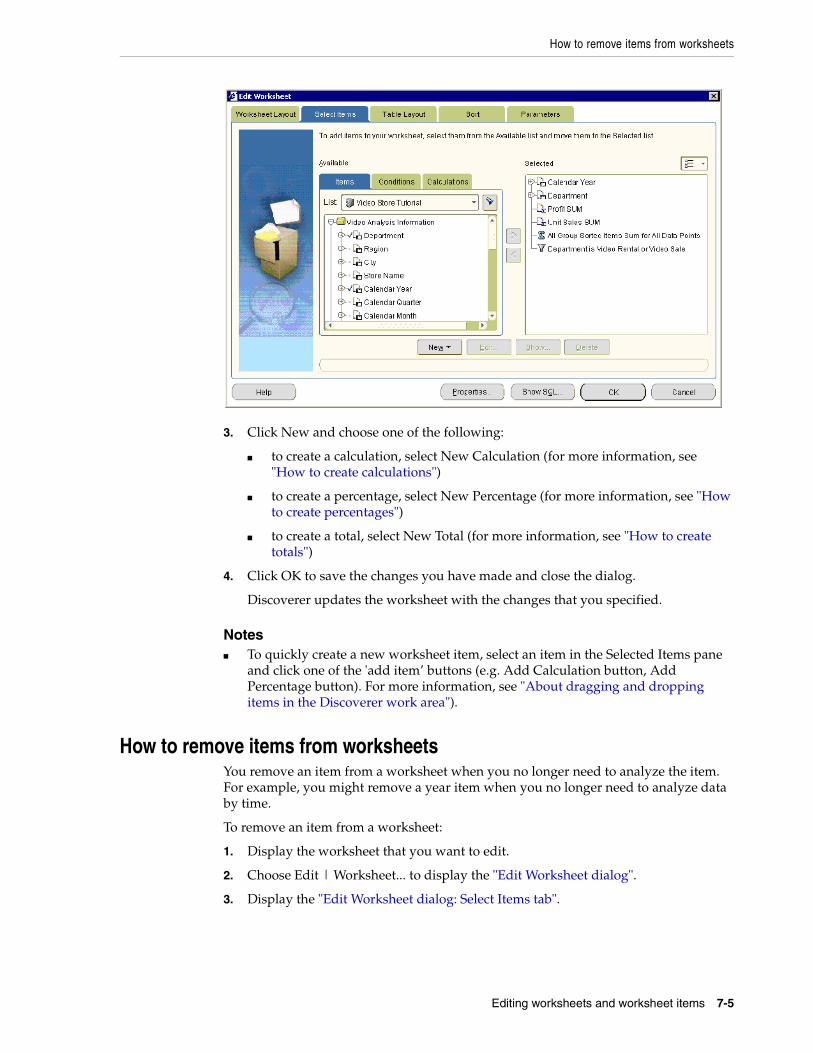
How to remove items from worksheets
Editing worksheets and worksheet items 7-5
3. Click New and choose one of the following:
■ to create a calculation, select New Calculation (for more information, see "How to create calculations")
■ to create a percentage, select New Percentage (for more information, see "How to create percentages")
■ to create a total, select New Total (for more information, see "How to create totals")
4. Click OK to save the changes you have made and close the dialog.
Discoverer updates the worksheet with the changes that you specified.
Notes■ To quickly create a new worksheet item, select an item in the Selected Items pane
and click one of the 'add item’ buttons (e.g. Add Calculation button, Add Percentage button). For more information, see "About dragging and dropping items in the Discoverer work area").
How to remove items from worksheetsYou remove an item from a worksheet when you no longer need to analyze the item. For example, you might remove a year item when you no longer need to analyze data by time.
To remove an item from a worksheet:
1. Display the worksheet that you want to edit.
2. Choose Edit | Worksheet... to display the "Edit Worksheet dialog".
3. Display the "Edit Worksheet dialog: Select Items tab".
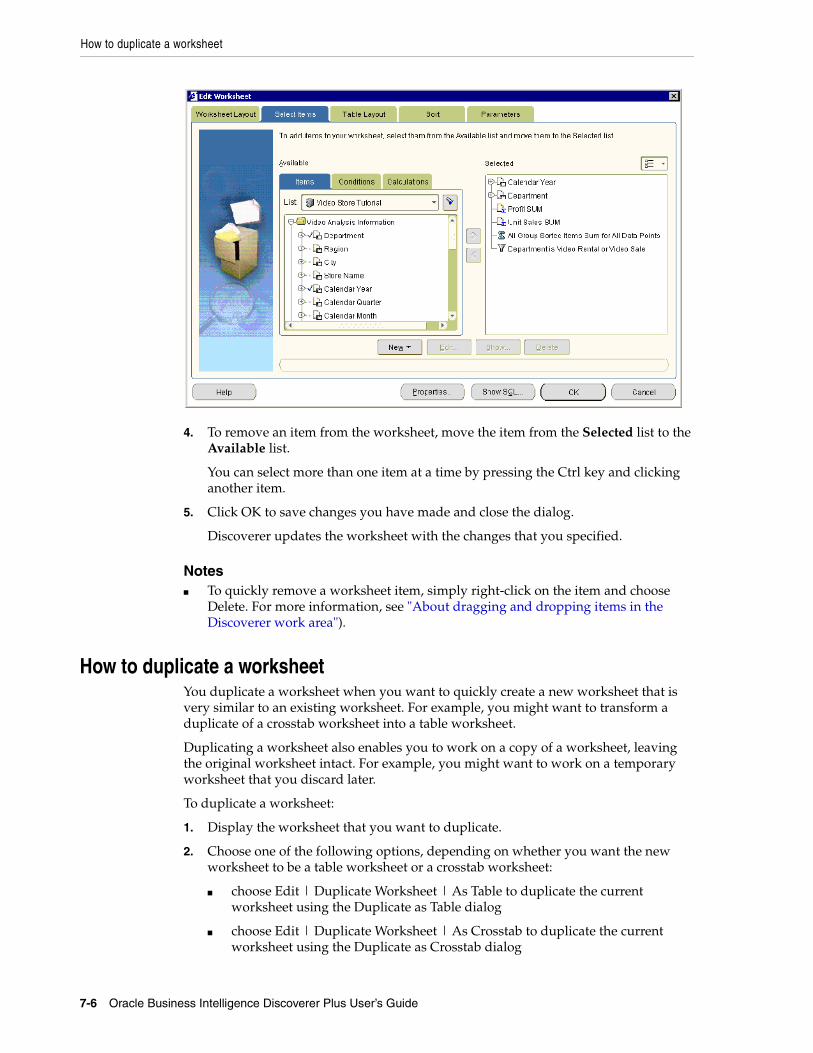
How to duplicate a worksheet
7-6 Oracle Business Intelligence Discoverer Plus User’s Guide
4. To remove an item from the worksheet, move the item from the Selected list to the Available list.
You can select more than one item at a time by pressing the Ctrl key and clicking another item.
5. Click OK to save changes you have made and close the dialog.
Discoverer updates the worksheet with the changes that you specified.
Notes■ To quickly remove a worksheet item, simply right-click on the item and choose
Delete. For more information, see "About dragging and dropping items in the Discoverer work area").
How to duplicate a worksheetYou duplicate a worksheet when you want to quickly create a new worksheet that is very similar to an existing worksheet. For example, you might want to transform a duplicate of a crosstab worksheet into a table worksheet.
Duplicating a worksheet also enables you to work on a copy of a worksheet, leaving the original worksheet intact. For example, you might want to work on a temporary worksheet that you discard later.
To duplicate a worksheet:
1. Display the worksheet that you want to duplicate.
2. Choose one of the following options, depending on whether you want the new worksheet to be a table worksheet or a crosstab worksheet:
■ choose Edit | Duplicate Worksheet | As Table to duplicate the current worksheet using the Duplicate as Table dialog
■ choose Edit | Duplicate Worksheet | As Crosstab to duplicate the current worksheet using the Duplicate as Crosstab dialog

How to change the format of worksheet items
Editing worksheets and worksheet items 7-7
Discoverer displays the Duplicate as Table dialog or Duplicate as Crosstab dialog, which enables you to change the default position of the new worksheet.
3. (optional) Use the tabs on the Duplicate as Table dialog or Duplicate as Crosstab dialog to change the default settings for items on the new worksheet.
For example, you might use the Select Items tab to add items to the duplicated worksheet, or you might use the Format tab to change the default display style of worksheet items.
4. Click OK to save the new worksheet and close the dialog.
The new worksheet is now displayed ready for you to analyze. The default worksheet name that Discoverer assigns is the original worksheet name appended with a unique number. For example, if you duplicate a worksheet named Sales Analysis, the new worksheet is named Sales Analysis 2.
You might want to change the default name of the new worksheet (for more information, see "How to rename worksheets and workbooks").
Hint: Use the tabs at the bottom of the Discoverer work area to navigate between the original worksheet and the new worksheet.
How to change the format of worksheet itemsYou change the format of worksheet items to change the default look and feel of a worksheet. For example, you might want to:
■ change the text color of worksheet values
■ modify the number of decimal places displayed
■ change the background color of headings and totals
To change the format of worksheet items:
1. Display the worksheet that you want to edit.
2. Select one or more worksheet items that you want to edit.
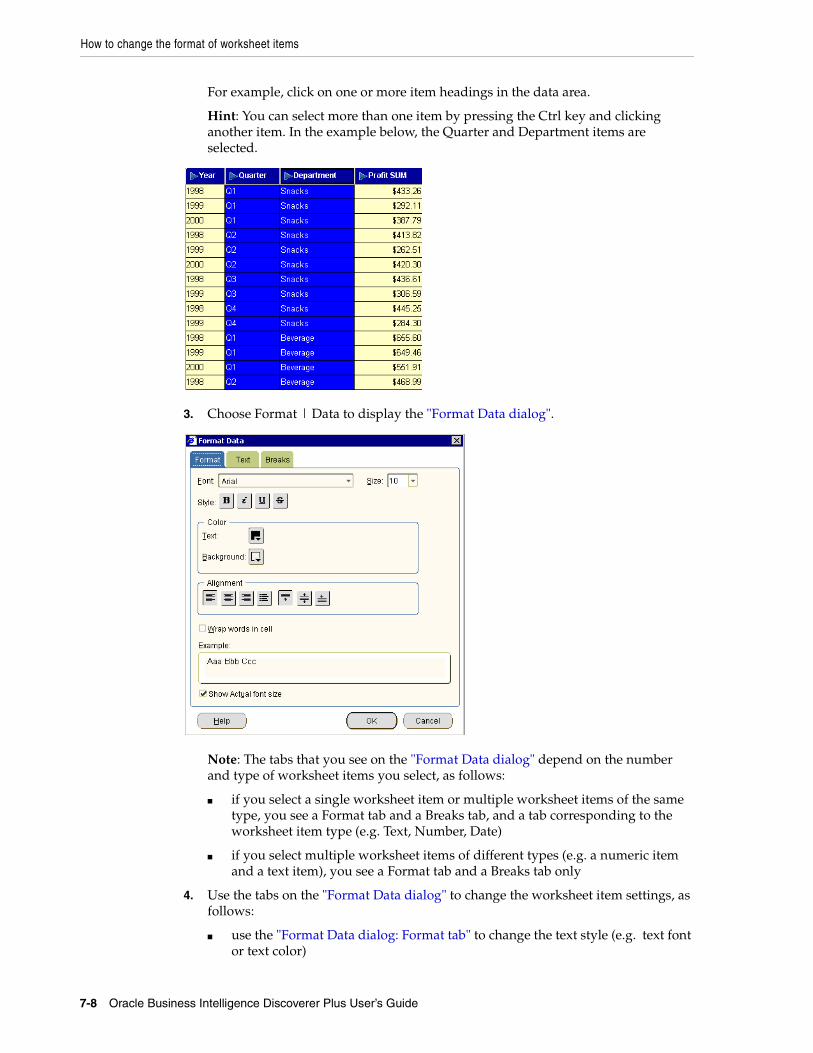
How to change the format of worksheet items
7-8 Oracle Business Intelligence Discoverer Plus User’s Guide
For example, click on one or more item headings in the data area.
Hint: You can select more than one item by pressing the Ctrl key and clicking another item. In the example below, the Quarter and Department items are selected.
3. Choose Format | Data to display the "Format Data dialog".
Note: The tabs that you see on the "Format Data dialog" depend on the number and type of worksheet items you select, as follows:
■ if you select a single worksheet item or multiple worksheet items of the same type, you see a Format tab and a Breaks tab, and a tab corresponding to the worksheet item type (e.g. Text, Number, Date)
■ if you select multiple worksheet items of different types (e.g. a numeric item and a text item), you see a Format tab and a Breaks tab only
4. Use the tabs on the "Format Data dialog" to change the worksheet item settings, as follows:
■ use the "Format Data dialog: Format tab" to change the text style (e.g. text font or text color)
How to set the currency symbol for numeric items
Editing worksheets and worksheet items 7-9
■ use the "Format Data dialog: Date tab" to change the format of date items (e.g. to change the date format for a Year item from YY to YYYY)
■ use the "Format Data dialog: Number tab" to change the format of numeric items (e.g. to add or remove decimal places, specify a currency symbol (e.g. $), or create a custom number format)
■ use the "Format Data dialog: Text tab" to change the format of text items (e.g. to change the text style to UPPERCASE, lowercase, or Capitalized)
■ use the "Format Data dialog: Breaks tab" to change the group sorting style (e.g. to insert a blank row after each set of rows to separate areas of the worksheet)
5. Click OK to save the changes you have made and return to the worksheet.
Discoverer updates the worksheet with the changes that you specified.
Notes■ You can also format worksheet items by choosing Format | Item Formats to
display the "Format dialog", and using the Format Data, Format Heading, and Edit Heading options.
■ You can also change the item heading (for more information, see "How to change the text in item headings") and change the format of item headings (for more information, see "How to change the format of worksheet item headings").
■ If you are formatting a single worksheet item (or multiple items of the same type), you can format all worksheet characteristics. For example, you can set the currently symbol for three numeric worksheet items at the same time. If you are formatting multiple worksheet items at the same time, you can format characteristics that are common to all items (e.g. text style and break settings).
■ For more information about applying a conditional format or stoplight format, see "Using conditional formatting".
■ To change the width of a column on a worksheet, drag and drop the column heading border to the required position. On a table worksheet, you can also choose Format | Columns | Column Width to display the "Column Width dialog".
How to set the currency symbol for numeric itemsYou can specify the currency symbol to use for numeric values on a worksheet. For example, you might want to display the dollar symbol next to sales figures.
To set the currency symbol for a numeric item:
1. Display the worksheet that you want to edit.
2. Select one or more numeric worksheet items to edit.
For example, click on one or more item headings in the data area.
Hint: You can select more than one item by pressing the Ctrl key and clicking another item. In the example below, the Profit SUM and Sales SUM items are selected.
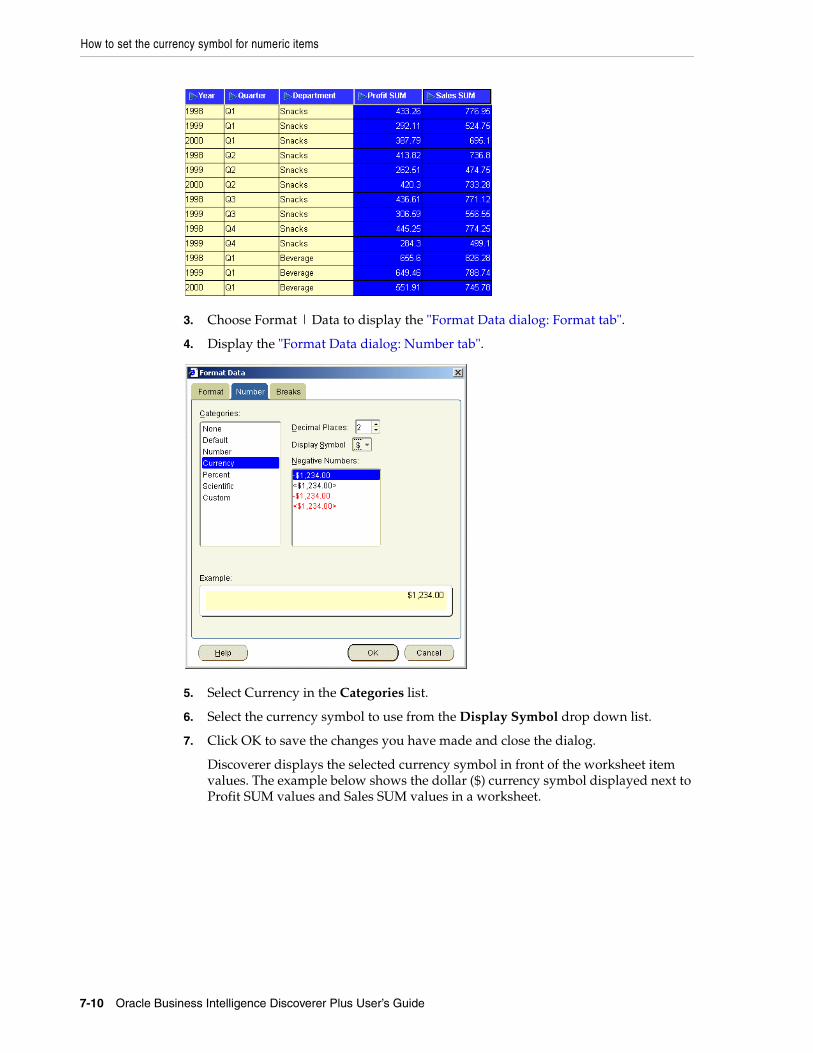
How to set the currency symbol for numeric items
7-10 Oracle Business Intelligence Discoverer Plus User’s Guide
3. Choose Format | Data to display the "Format Data dialog: Format tab".
4. Display the "Format Data dialog: Number tab".
5. Select Currency in the Categories list.
6. Select the currency symbol to use from the Display Symbol drop down list.
7. Click OK to save the changes you have made and close the dialog.
Discoverer displays the selected currency symbol in front of the worksheet item values. The example below shows the dollar ($) currency symbol displayed next to Profit SUM values and Sales SUM values in a worksheet.
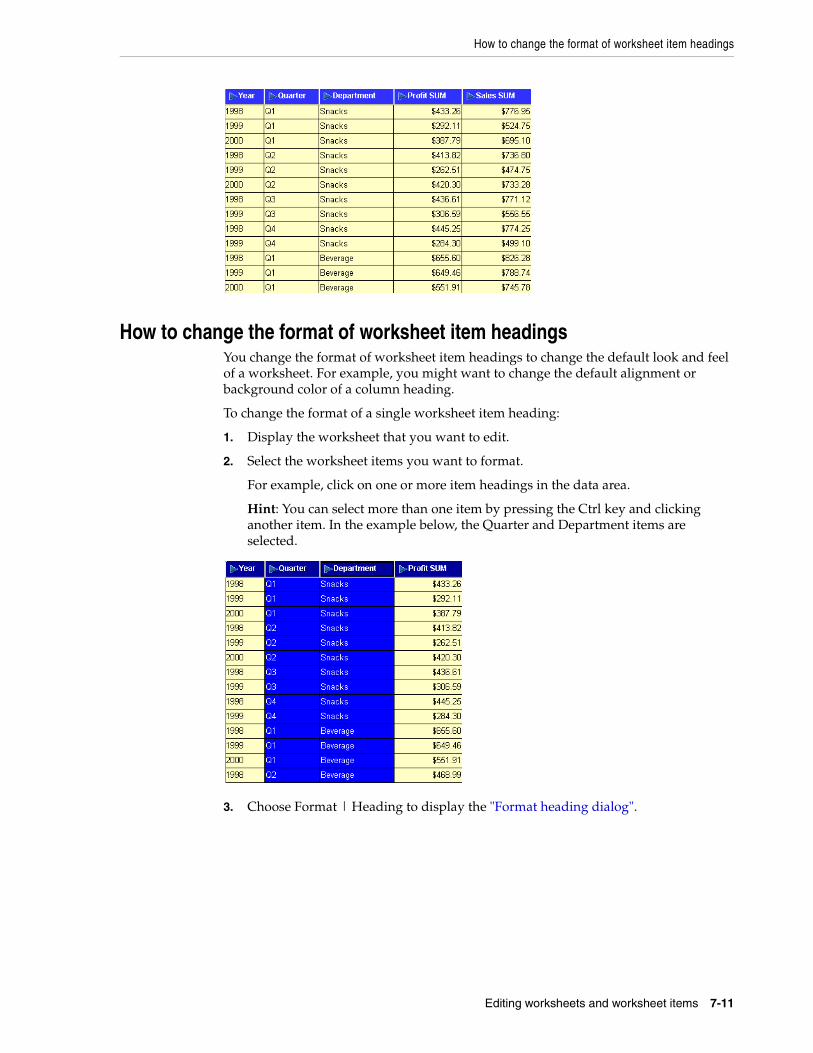
How to change the format of worksheet item headings
Editing worksheets and worksheet items 7-11
How to change the format of worksheet item headingsYou change the format of worksheet item headings to change the default look and feel of a worksheet. For example, you might want to change the default alignment or background color of a column heading.
To change the format of a single worksheet item heading:
1. Display the worksheet that you want to edit.
2. Select the worksheet items you want to format.
For example, click on one or more item headings in the data area.
Hint: You can select more than one item by pressing the Ctrl key and clicking another item. In the example below, the Quarter and Department items are selected.
3. Choose Format | Heading to display the "Format heading dialog".
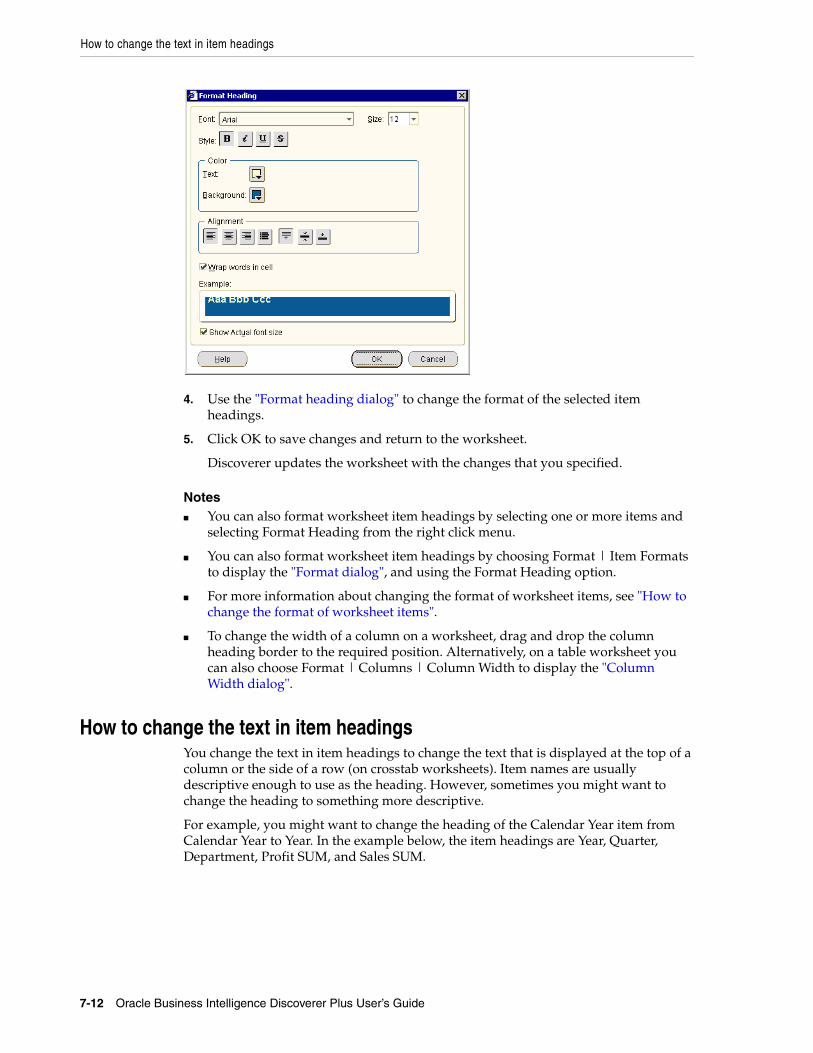
How to change the text in item headings
7-12 Oracle Business Intelligence Discoverer Plus User’s Guide
4. Use the "Format heading dialog" to change the format of the selected item headings.
5. Click OK to save changes and return to the worksheet.
Discoverer updates the worksheet with the changes that you specified.
Notes■ You can also format worksheet item headings by selecting one or more items and
selecting Format Heading from the right click menu.
■ You can also format worksheet item headings by choosing Format | Item Formats to display the "Format dialog", and using the Format Heading option.
■ For more information about changing the format of worksheet items, see "How to change the format of worksheet items".
■ To change the width of a column on a worksheet, drag and drop the column heading border to the required position. Alternatively, on a table worksheet you can also choose Format | Columns | Column Width to display the "Column Width dialog".
How to change the text in item headingsYou change the text in item headings to change the text that is displayed at the top of a column or the side of a row (on crosstab worksheets). Item names are usually descriptive enough to use as the heading. However, sometimes you might want to change the heading to something more descriptive.
For example, you might want to change the heading of the Calendar Year item from Calendar Year to Year. In the example below, the item headings are Year, Quarter, Department, Profit SUM, and Sales SUM.
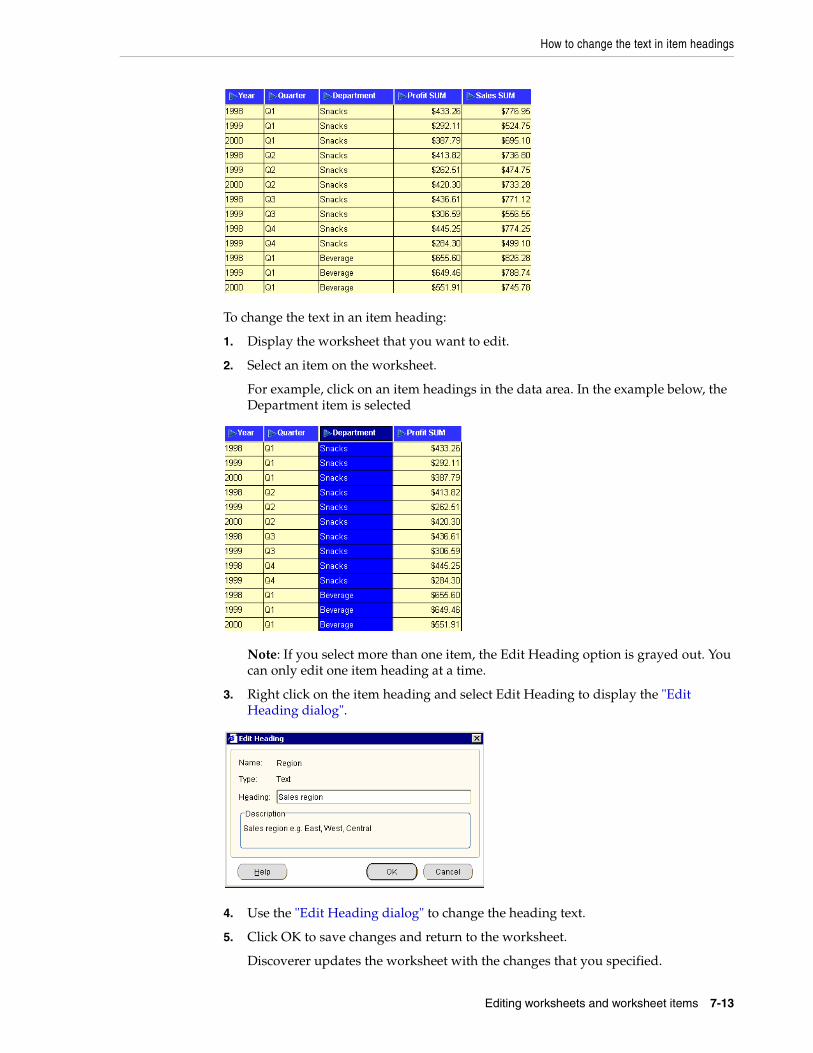
How to change the text in item headings
Editing worksheets and worksheet items 7-13
To change the text in an item heading:
1. Display the worksheet that you want to edit.
2. Select an item on the worksheet.
For example, click on an item headings in the data area. In the example below, the Department item is selected
Note: If you select more than one item, the Edit Heading option is grayed out. You can only edit one item heading at a time.
3. Right click on the item heading and select Edit Heading to display the "Edit Heading dialog".
4. Use the "Edit Heading dialog" to change the heading text.
5. Click OK to save changes and return to the worksheet.
Discoverer updates the worksheet with the changes that you specified.

How to change the text in item headings
7-14 Oracle Business Intelligence Discoverer Plus User’s Guide
Notes■ You can also change worksheet item headings by choosing Format | Item Formats
to display the "Format dialog", and using the Edit Heading option. If you select more than one item on the "Format dialog", the Edit Heading option is grayed out. You can only edit one item heading at a time.
Creating graphs in Discoverer 8-1
8Creating graphs in Discoverer
This chapter explains how to create graphs in Discoverer Plus Relational to answer typical business questions, and contains the following topics:
■ "What is a Discoverer graph?"
■ "About using graphs in Discoverer"
■ "About components of a Discoverer graph"
■ "About graph types and sub-types"
■ "About graph types available in Discoverer"
■ "Notes about creating bubble graphs"
■ "Notes about creating high-low-close stock graphs"
■ "Notes about creating dual-Y graphs"
■ "Notes about creating pie graphs"
■ "How to edit a graph"
■ "How to hide and display a graph"
■ "How to change the position of a graph"
What is a Discoverer graph?A Discoverer graph is an interactive pictorial representation of worksheet data. If is often easier to analyze trends in your data using a graph. The example below shows a three-dimensional bar graph of profit figures for regions.
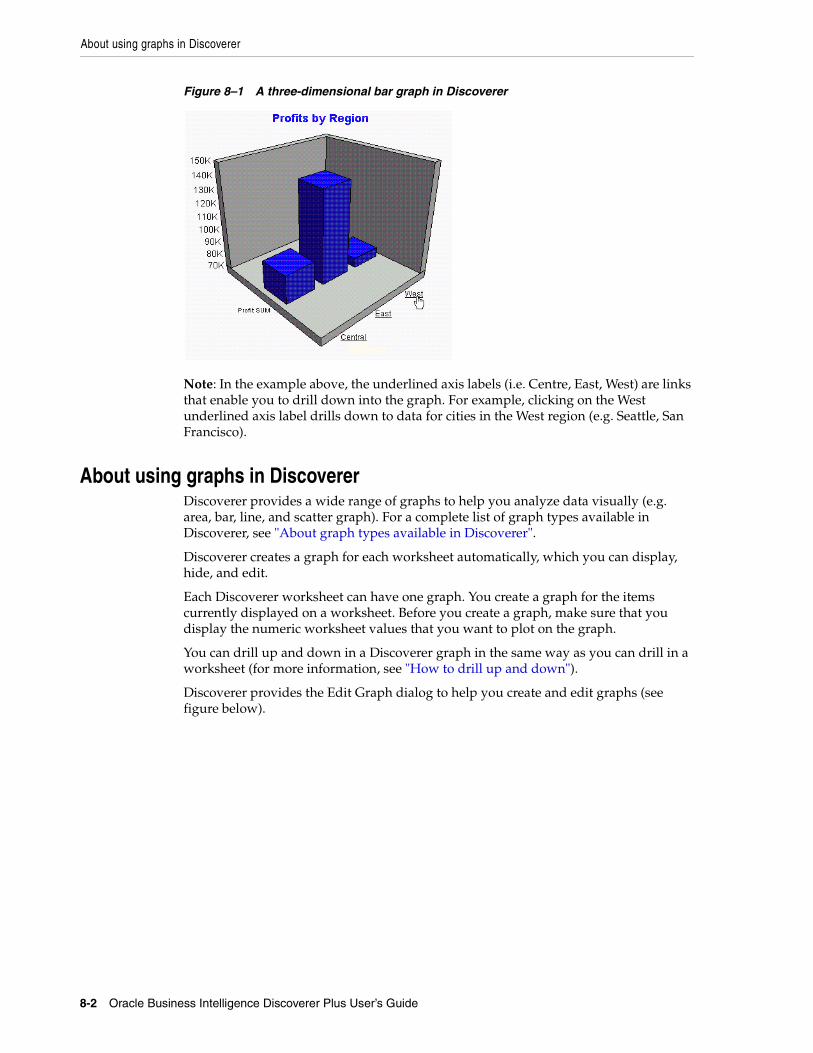
About using graphs in Discoverer
8-2 Oracle Business Intelligence Discoverer Plus User’s Guide
Figure 8–1 A three-dimensional bar graph in Discoverer
Note: In the example above, the underlined axis labels (i.e. Centre, East, West) are links that enable you to drill down into the graph. For example, clicking on the West underlined axis label drills down to data for cities in the West region (e.g. Seattle, San Francisco).
About using graphs in DiscovererDiscoverer provides a wide range of graphs to help you analyze data visually (e.g. area, bar, line, and scatter graph). For a complete list of graph types available in Discoverer, see "About graph types available in Discoverer".
Discoverer creates a graph for each worksheet automatically, which you can display, hide, and edit.
Each Discoverer worksheet can have one graph. You create a graph for the items currently displayed on a worksheet. Before you create a graph, make sure that you display the numeric worksheet values that you want to plot on the graph.
You can drill up and down in a Discoverer graph in the same way as you can drill in a worksheet (for more information, see "How to drill up and down").
Discoverer provides the Edit Graph dialog to help you create and edit graphs (see figure below).
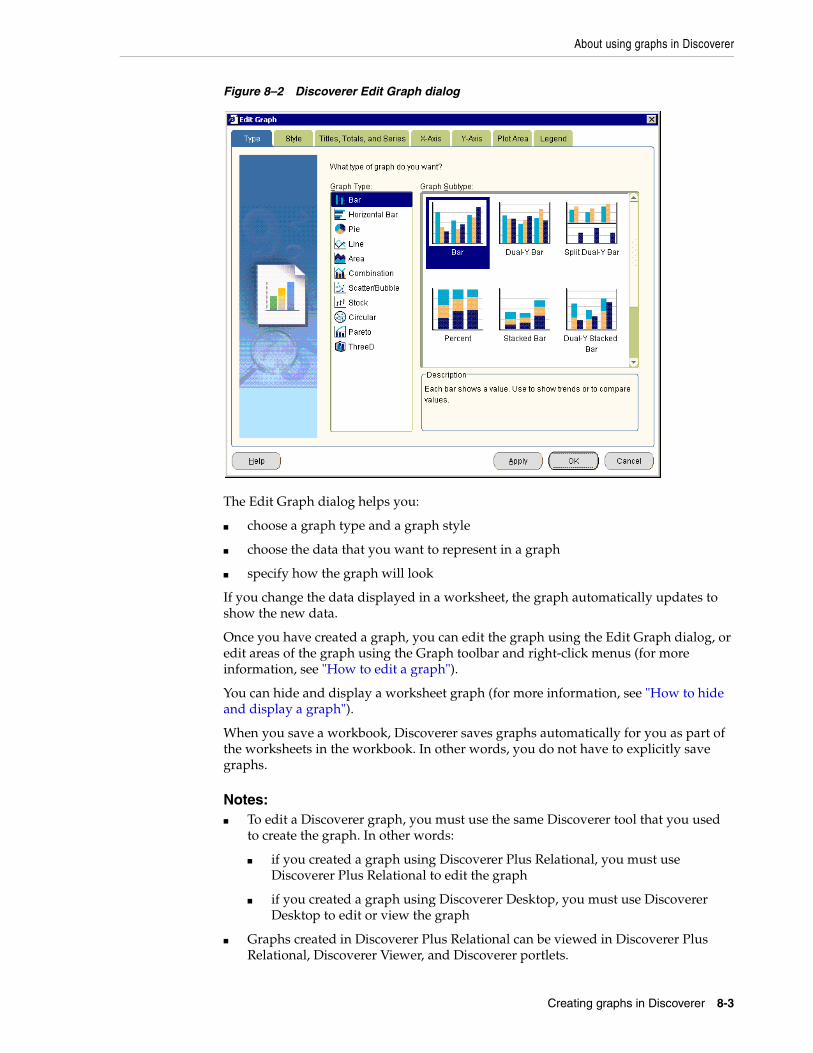
About using graphs in Discoverer
Creating graphs in Discoverer 8-3
Figure 8–2 Discoverer Edit Graph dialog
The Edit Graph dialog helps you:
■ choose a graph type and a graph style
■ choose the data that you want to represent in a graph
■ specify how the graph will look
If you change the data displayed in a worksheet, the graph automatically updates to show the new data.
Once you have created a graph, you can edit the graph using the Edit Graph dialog, or edit areas of the graph using the Graph toolbar and right-click menus (for more information, see "How to edit a graph").
You can hide and display a worksheet graph (for more information, see "How to hide and display a graph").
When you save a workbook, Discoverer saves graphs automatically for you as part of the worksheets in the workbook. In other words, you do not have to explicitly save graphs.
Notes:■ To edit a Discoverer graph, you must use the same Discoverer tool that you used
to create the graph. In other words:
■ if you created a graph using Discoverer Plus Relational, you must use Discoverer Plus Relational to edit the graph
■ if you created a graph using Discoverer Desktop, you must use Discoverer Desktop to edit or view the graph
■ Graphs created in Discoverer Plus Relational can be viewed in Discoverer Plus Relational, Discoverer Viewer, and Discoverer portlets.
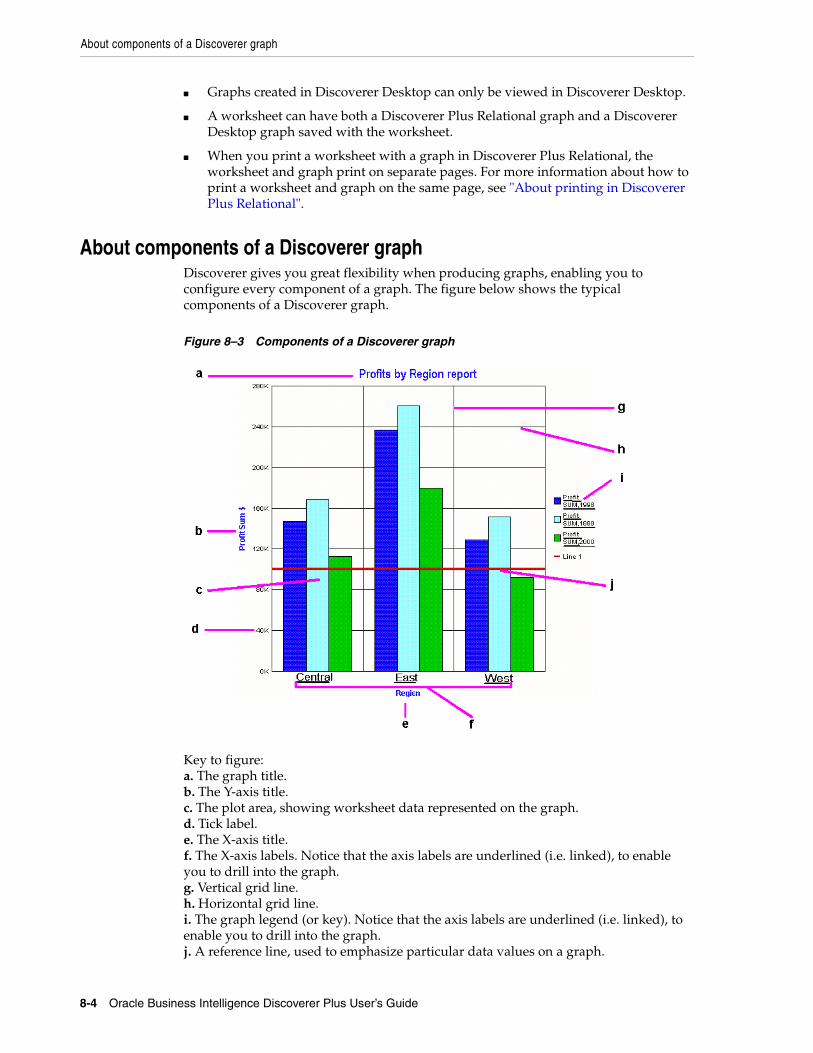
About components of a Discoverer graph
8-4 Oracle Business Intelligence Discoverer Plus User’s Guide
■ Graphs created in Discoverer Desktop can only be viewed in Discoverer Desktop.
■ A worksheet can have both a Discoverer Plus Relational graph and a Discoverer Desktop graph saved with the worksheet.
■ When you print a worksheet with a graph in Discoverer Plus Relational, the worksheet and graph print on separate pages. For more information about how to print a worksheet and graph on the same page, see "About printing in Discoverer Plus Relational".
About components of a Discoverer graphDiscoverer gives you great flexibility when producing graphs, enabling you to configure every component of a graph. The figure below shows the typical components of a Discoverer graph.
Figure 8–3 Components of a Discoverer graph
Key to figure:a. The graph title.b. The Y-axis title.c. The plot area, showing worksheet data represented on the graph.d. Tick label.e. The X-axis title.f. The X-axis labels. Notice that the axis labels are underlined (i.e. linked), to enable you to drill into the graph.g. Vertical grid line.h. Horizontal grid line.i. The graph legend (or key). Notice that the axis labels are underlined (i.e. linked), to enable you to drill into the graph.j. A reference line, used to emphasize particular data values on a graph.
About graph types available in Discoverer
Creating graphs in Discoverer 8-5
Discoverer enables you to change the font of each graph component.
About graph types and sub-typesTo present your worksheet data visually in Discoverer, you can choose from a wide range of graph types. For example:
■ bar graph
■ line graph
■ pie graph
Each graph type has one or more variations, or sub-types. For example, the sub-types for the Bar graph type include the following:
■ Bar
■ Dual-Y Bar
■ Percent
Some graphs also have dual-Y sub-types, which have two Y-axes. Dual-Y graphs are useful for showing the following types of data:
■ data of different measures (such as region sales on the Y1-axis and profit on the Y2-axis)
■ data of different scales (such as sales on the Y1-axis and percent of total sales on the Y2-axis)
About graph types available in DiscovererThe table below shows the graph types that are available in Discoverer.
Graph icon Graph category and description
Area - graphs to show trends or changes in data using filled-in areas. This graph is useful when showing accumulations or cumulative data.
Bar - graphs to compare values using vertical bars. Each value is represented by a single bar. Bar graphs shows variation over a period of time or illustrates comparisons between values. The stacked sub-type shows each value’s relationship to a whole. Bar graphs can have two Y axes (for more information, see "Notes about creating dual-Y graphs").
Circular - graphs to show directional data and cyclical patterns in data.
Combination - graphs that combines bars, lines, and areas. This graph type emphasizes one or more series of data. You must have at least two series to use this graph type. Shows the relationship of one series to another. Most often used as a Dual-Y graph, where different series correspond to different Y axes.
Horizontal Bar - graphs to compare values using horizontal bars. This graph type is identical to a bar graph except that the bars lie horizontally, rather than standing vertically. The stacked sub-type shows each value’s relationship to a whole. Bar graphs can have two Y axes (for more information, see "Notes about creating dual-Y graphs").
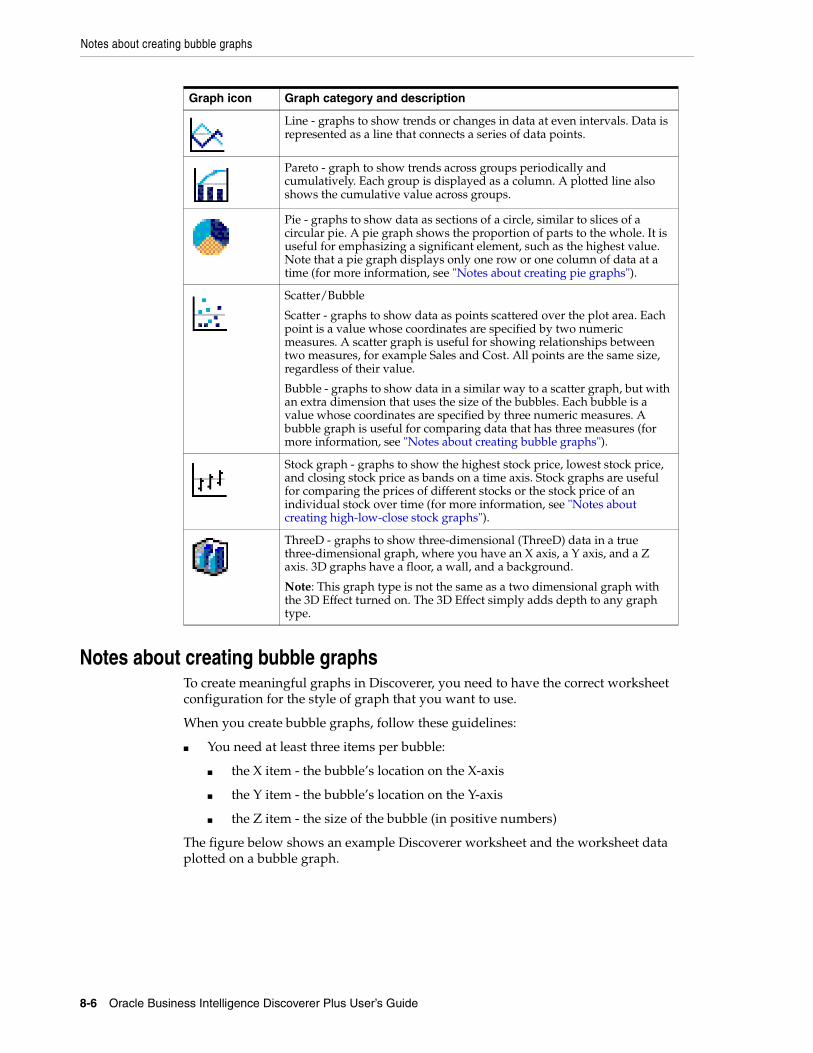
Notes about creating bubble graphs
8-6 Oracle Business Intelligence Discoverer Plus User’s Guide
Notes about creating bubble graphsTo create meaningful graphs in Discoverer, you need to have the correct worksheet configuration for the style of graph that you want to use.
When you create bubble graphs, follow these guidelines:
■ You need at least three items per bubble:
■ the X item - the bubble’s location on the X-axis
■ the Y item - the bubble’s location on the Y-axis
■ the Z item - the size of the bubble (in positive numbers)
The figure below shows an example Discoverer worksheet and the worksheet data plotted on a bubble graph.
Line - graphs to show trends or changes in data at even intervals. Data is represented as a line that connects a series of data points.
Pareto - graph to show trends across groups periodically and cumulatively. Each group is displayed as a column. A plotted line also shows the cumulative value across groups.
Pie - graphs to show data as sections of a circle, similar to slices of a circular pie. A pie graph shows the proportion of parts to the whole. It is useful for emphasizing a significant element, such as the highest value. Note that a pie graph displays only one row or one column of data at a time (for more information, see "Notes about creating pie graphs").
Scatter/Bubble
Scatter - graphs to show data as points scattered over the plot area. Each point is a value whose coordinates are specified by two numeric measures. A scatter graph is useful for showing relationships between two measures, for example Sales and Cost. All points are the same size, regardless of their value.
Bubble - graphs to show data in a similar way to a scatter graph, but with an extra dimension that uses the size of the bubbles. Each bubble is a value whose coordinates are specified by three numeric measures. A bubble graph is useful for comparing data that has three measures (for more information, see "Notes about creating bubble graphs").
Stock graph - graphs to show the highest stock price, lowest stock price, and closing stock price as bands on a time axis. Stock graphs are useful for comparing the prices of different stocks or the stock price of an individual stock over time (for more information, see "Notes about creating high-low-close stock graphs").
ThreeD - graphs to show three-dimensional (ThreeD) data in a true three-dimensional graph, where you have an X axis, a Y axis, and a Z axis. 3D graphs have a floor, a wall, and a background.
Note: This graph type is not the same as a two dimensional graph with the 3D Effect turned on. The 3D Effect simply adds depth to any graph type.
Graph icon Graph category and description
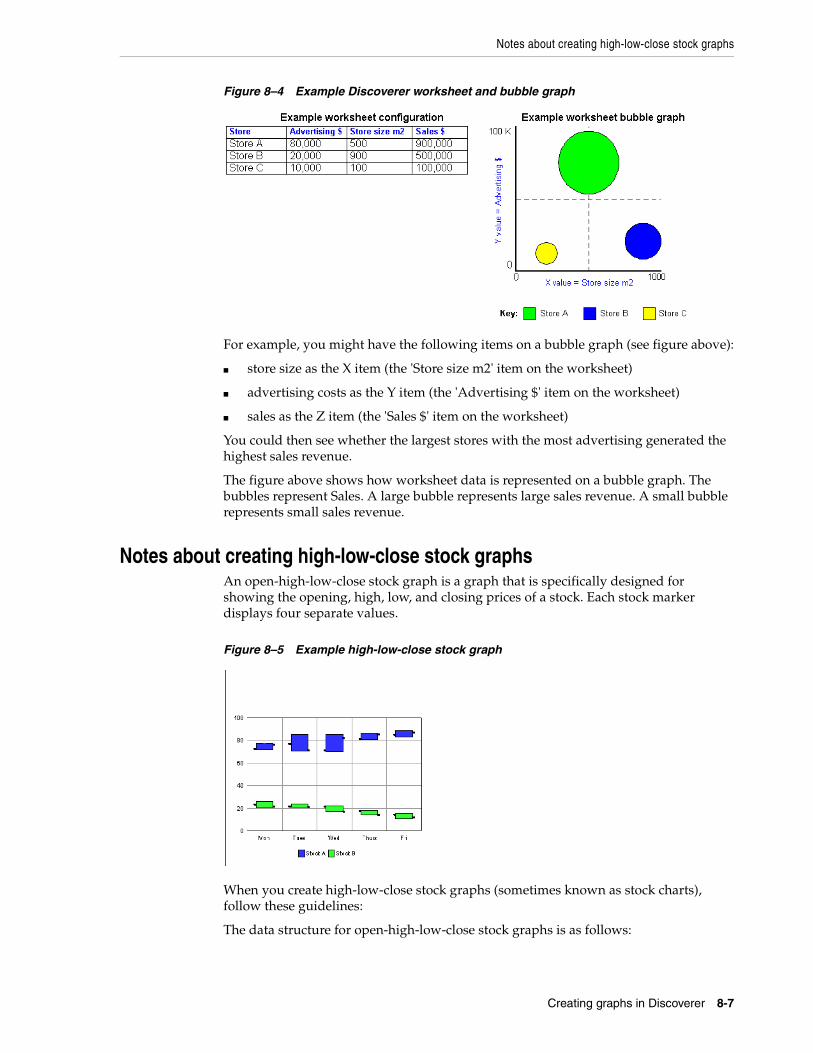
Notes about creating high-low-close stock graphs
Creating graphs in Discoverer 8-7
Figure 8–4 Example Discoverer worksheet and bubble graph
For example, you might have the following items on a bubble graph (see figure above):
■ store size as the X item (the 'Store size m2' item on the worksheet)
■ advertising costs as the Y item (the 'Advertising $' item on the worksheet)
■ sales as the Z item (the 'Sales $' item on the worksheet)
You could then see whether the largest stores with the most advertising generated the highest sales revenue.
The figure above shows how worksheet data is represented on a bubble graph. The bubbles represent Sales. A large bubble represents large sales revenue. A small bubble represents small sales revenue.
Notes about creating high-low-close stock graphsAn open-high-low-close stock graph is a graph that is specifically designed for showing the opening, high, low, and closing prices of a stock. Each stock marker displays four separate values.
Figure 8–5 Example high-low-close stock graph
When you create high-low-close stock graphs (sometimes known as stock charts), follow these guidelines:
The data structure for open-high-low-close stock graphs is as follows:
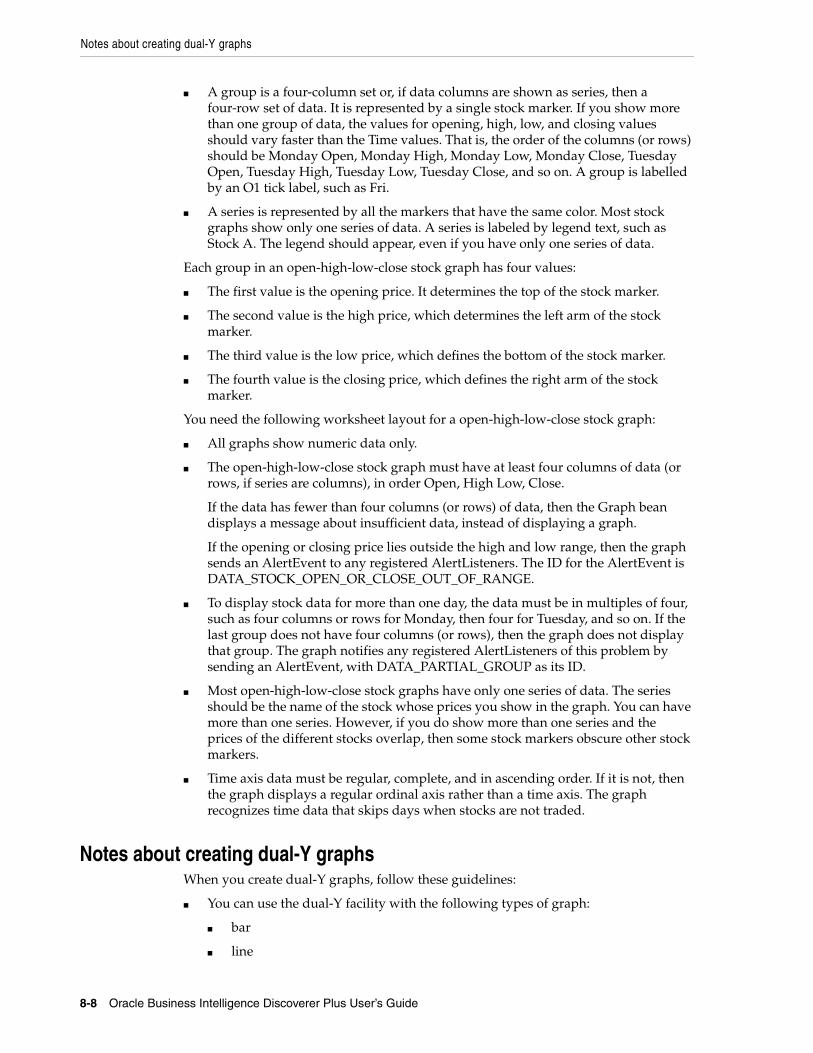
Notes about creating dual-Y graphs
8-8 Oracle Business Intelligence Discoverer Plus User’s Guide
■ A group is a four-column set or, if data columns are shown as series, then a four-row set of data. It is represented by a single stock marker. If you show more than one group of data, the values for opening, high, low, and closing values should vary faster than the Time values. That is, the order of the columns (or rows) should be Monday Open, Monday High, Monday Low, Monday Close, Tuesday Open, Tuesday High, Tuesday Low, Tuesday Close, and so on. A group is labelled by an O1 tick label, such as Fri.
■ A series is represented by all the markers that have the same color. Most stock graphs show only one series of data. A series is labeled by legend text, such as Stock A. The legend should appear, even if you have only one series of data.
Each group in an open-high-low-close stock graph has four values:
■ The first value is the opening price. It determines the top of the stock marker.
■ The second value is the high price, which determines the left arm of the stock marker.
■ The third value is the low price, which defines the bottom of the stock marker.
■ The fourth value is the closing price, which defines the right arm of the stock marker.
You need the following worksheet layout for a open-high-low-close stock graph:
■ All graphs show numeric data only.
■ The open-high-low-close stock graph must have at least four columns of data (or rows, if series are columns), in order Open, High Low, Close.
If the data has fewer than four columns (or rows) of data, then the Graph bean displays a message about insufficient data, instead of displaying a graph.
If the opening or closing price lies outside the high and low range, then the graph sends an AlertEvent to any registered AlertListeners. The ID for the AlertEvent is DATA_STOCK_OPEN_OR_CLOSE_OUT_OF_RANGE.
■ To display stock data for more than one day, the data must be in multiples of four, such as four columns or rows for Monday, then four for Tuesday, and so on. If the last group does not have four columns (or rows), then the graph does not display that group. The graph notifies any registered AlertListeners of this problem by sending an AlertEvent, with DATA_PARTIAL_GROUP as its ID.
■ Most open-high-low-close stock graphs have only one series of data. The series should be the name of the stock whose prices you show in the graph. You can have more than one series. However, if you do show more than one series and the prices of the different stocks overlap, then some stock markers obscure other stock markers.
■ Time axis data must be regular, complete, and in ascending order. If it is not, then the graph displays a regular ordinal axis rather than a time axis. The graph recognizes time data that skips days when stocks are not traded.
Notes about creating dual-Y graphsWhen you create dual-Y graphs, follow these guidelines:
■ You can use the dual-Y facility with the following types of graph:
■ bar
■ line
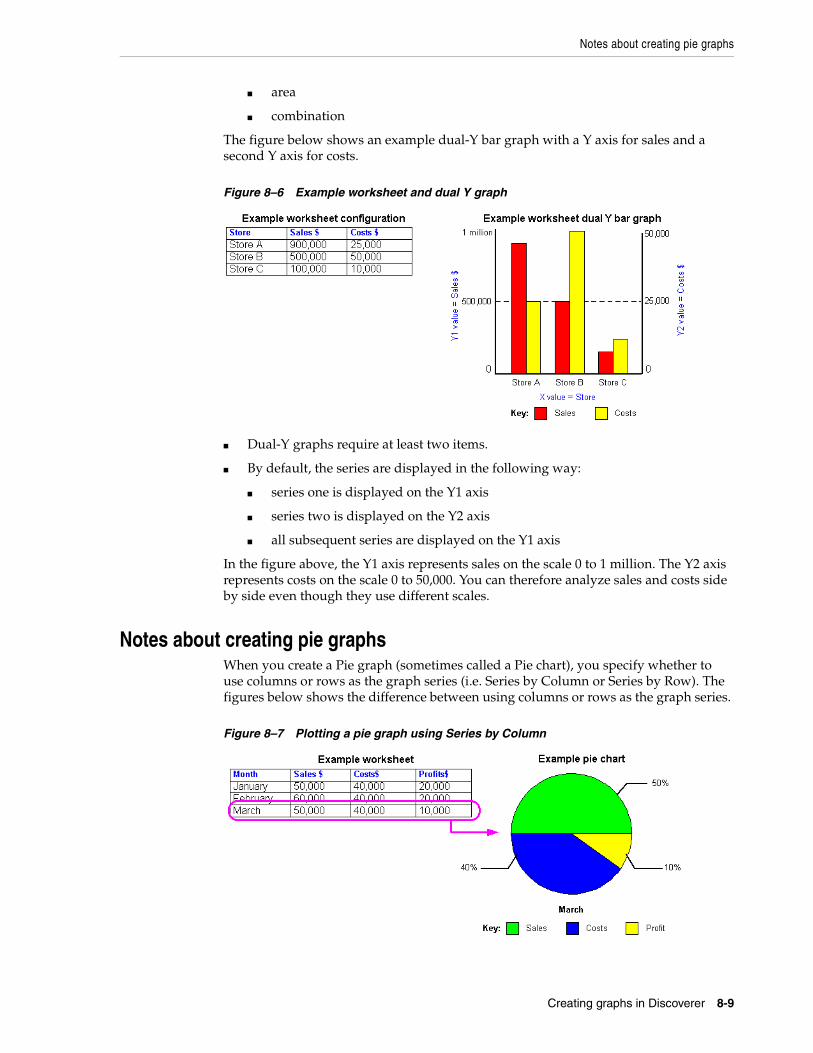
Notes about creating pie graphs
Creating graphs in Discoverer 8-9
■ area
■ combination
The figure below shows an example dual-Y bar graph with a Y axis for sales and a second Y axis for costs.
Figure 8–6 Example worksheet and dual Y graph
■ Dual-Y graphs require at least two items.
■ By default, the series are displayed in the following way:
■ series one is displayed on the Y1 axis
■ series two is displayed on the Y2 axis
■ all subsequent series are displayed on the Y1 axis
In the figure above, the Y1 axis represents sales on the scale 0 to 1 million. The Y2 axis represents costs on the scale 0 to 50,000. You can therefore analyze sales and costs side by side even though they use different scales.
Notes about creating pie graphsWhen you create a Pie graph (sometimes called a Pie chart), you specify whether to use columns or rows as the graph series (i.e. Series by Column or Series by Row). The figures below shows the difference between using columns or rows as the graph series.
Figure 8–7 Plotting a pie graph using Series by Column
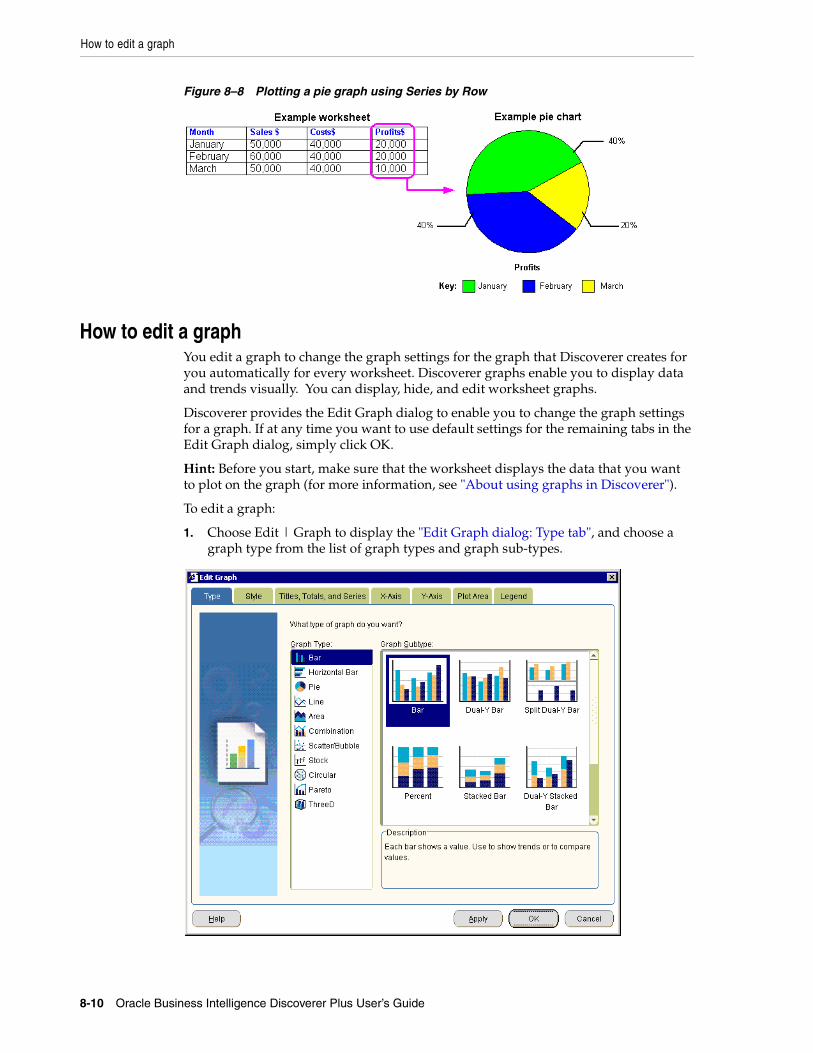
How to edit a graph
8-10 Oracle Business Intelligence Discoverer Plus User’s Guide
Figure 8–8 Plotting a pie graph using Series by Row
How to edit a graphYou edit a graph to change the graph settings for the graph that Discoverer creates for you automatically for every worksheet. Discoverer graphs enable you to display data and trends visually. You can display, hide, and edit worksheet graphs.
Discoverer provides the Edit Graph dialog to enable you to change the graph settings for a graph. If at any time you want to use default settings for the remaining tabs in the Edit Graph dialog, simply click OK.
Hint: Before you start, make sure that the worksheet displays the data that you want to plot on the graph (for more information, see "About using graphs in Discoverer").
To edit a graph:
1. Choose Edit | Graph to display the "Edit Graph dialog: Type tab", and choose a graph type from the list of graph types and graph sub-types.
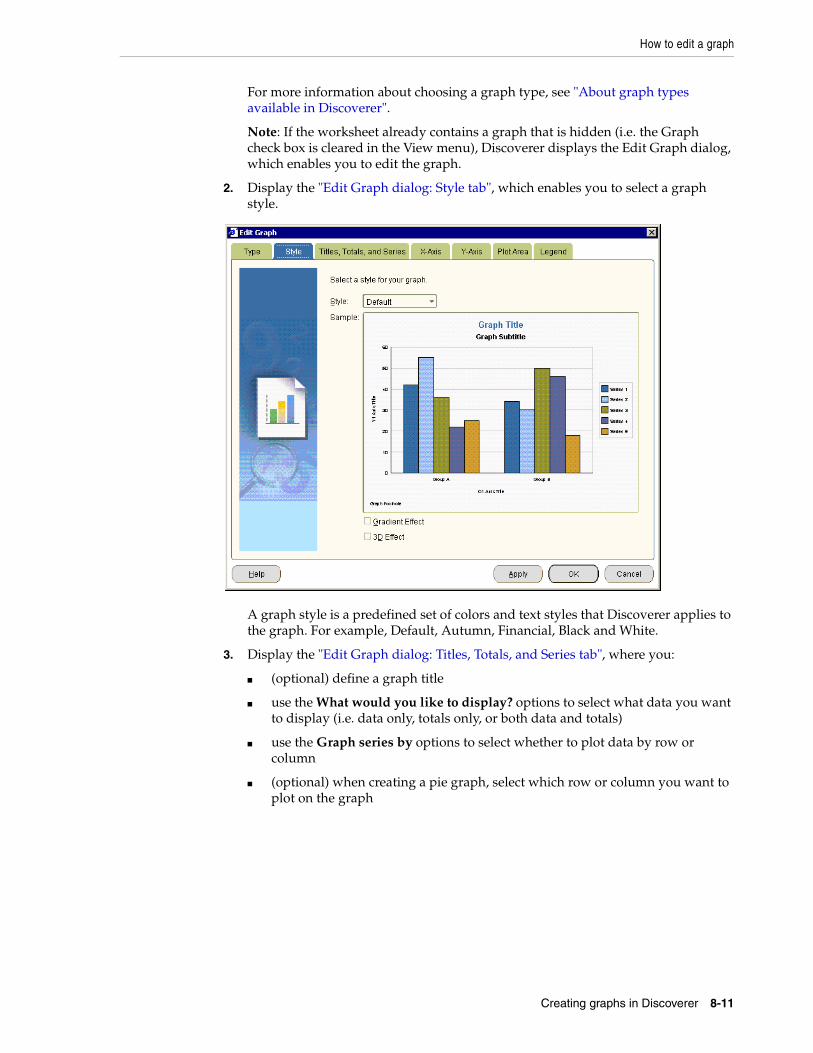
How to edit a graph
Creating graphs in Discoverer 8-11
For more information about choosing a graph type, see "About graph types available in Discoverer".
Note: If the worksheet already contains a graph that is hidden (i.e. the Graph check box is cleared in the View menu), Discoverer displays the Edit Graph dialog, which enables you to edit the graph.
2. Display the "Edit Graph dialog: Style tab", which enables you to select a graph style.
A graph style is a predefined set of colors and text styles that Discoverer applies to the graph. For example, Default, Autumn, Financial, Black and White.
3. Display the "Edit Graph dialog: Titles, Totals, and Series tab", where you:
■ (optional) define a graph title
■ use the What would you like to display? options to select what data you want to display (i.e. data only, totals only, or both data and totals)
■ use the Graph series by options to select whether to plot data by row or column
■ (optional) when creating a pie graph, select which row or column you want to plot on the graph
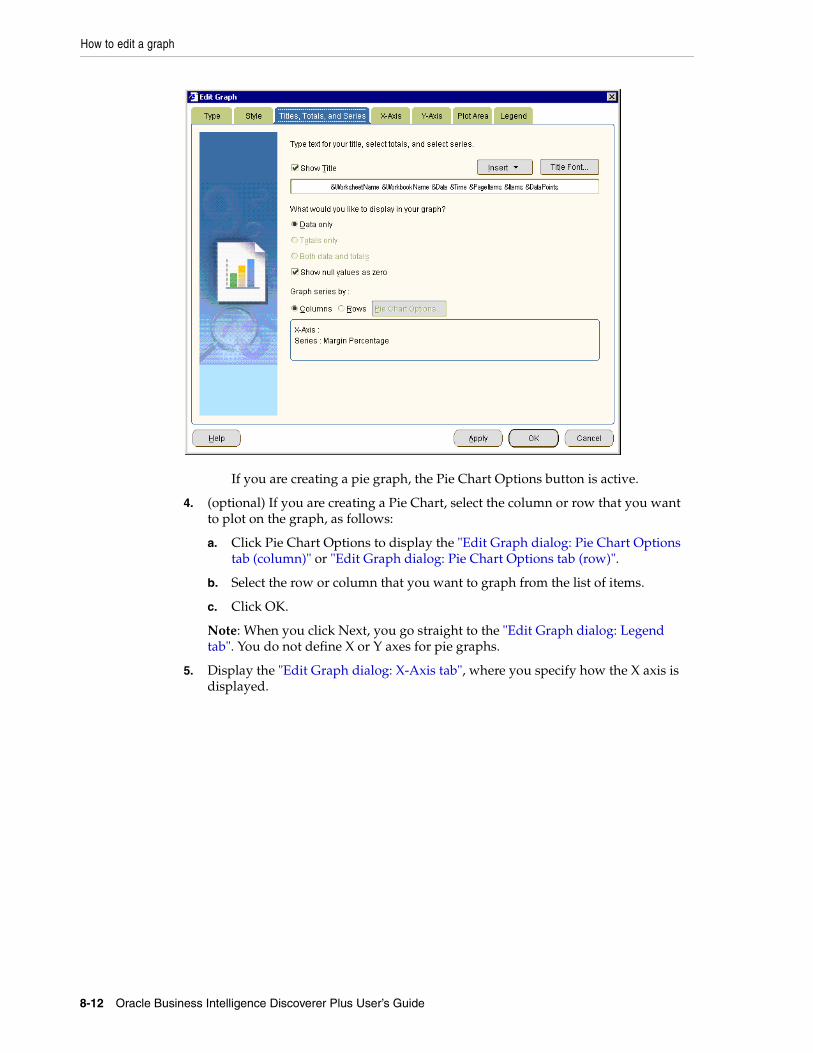
How to edit a graph
8-12 Oracle Business Intelligence Discoverer Plus User’s Guide
If you are creating a pie graph, the Pie Chart Options button is active.
4. (optional) If you are creating a Pie Chart, select the column or row that you want to plot on the graph, as follows:
a. Click Pie Chart Options to display the "Edit Graph dialog: Pie Chart Options tab (column)" or "Edit Graph dialog: Pie Chart Options tab (row)".
b. Select the row or column that you want to graph from the list of items.
c. Click OK.
Note: When you click Next, you go straight to the "Edit Graph dialog: Legend tab". You do not define X or Y axes for pie graphs.
5. Display the "Edit Graph dialog: X-Axis tab", where you specify how the X axis is displayed.
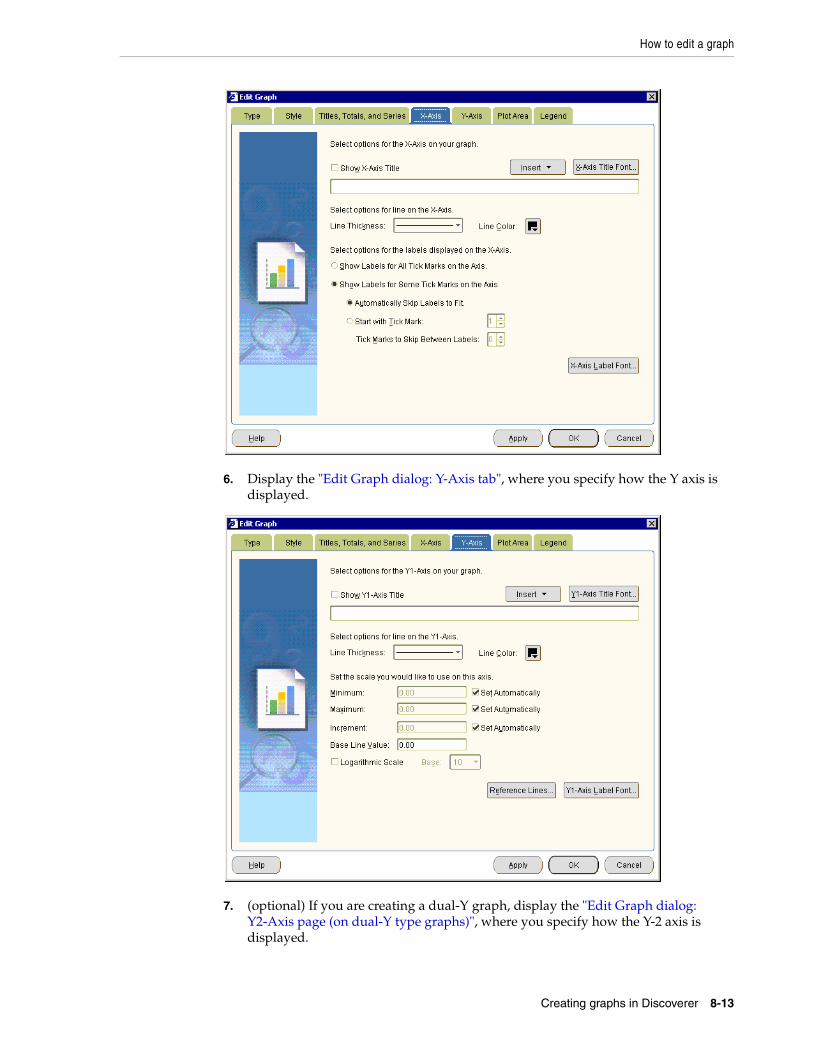
How to edit a graph
Creating graphs in Discoverer 8-13
6. Display the "Edit Graph dialog: Y-Axis tab", where you specify how the Y axis is displayed.
7. (optional) If you are creating a dual-Y graph, display the "Edit Graph dialog: Y2-Axis page (on dual-Y type graphs)", where you specify how the Y-2 axis is displayed.
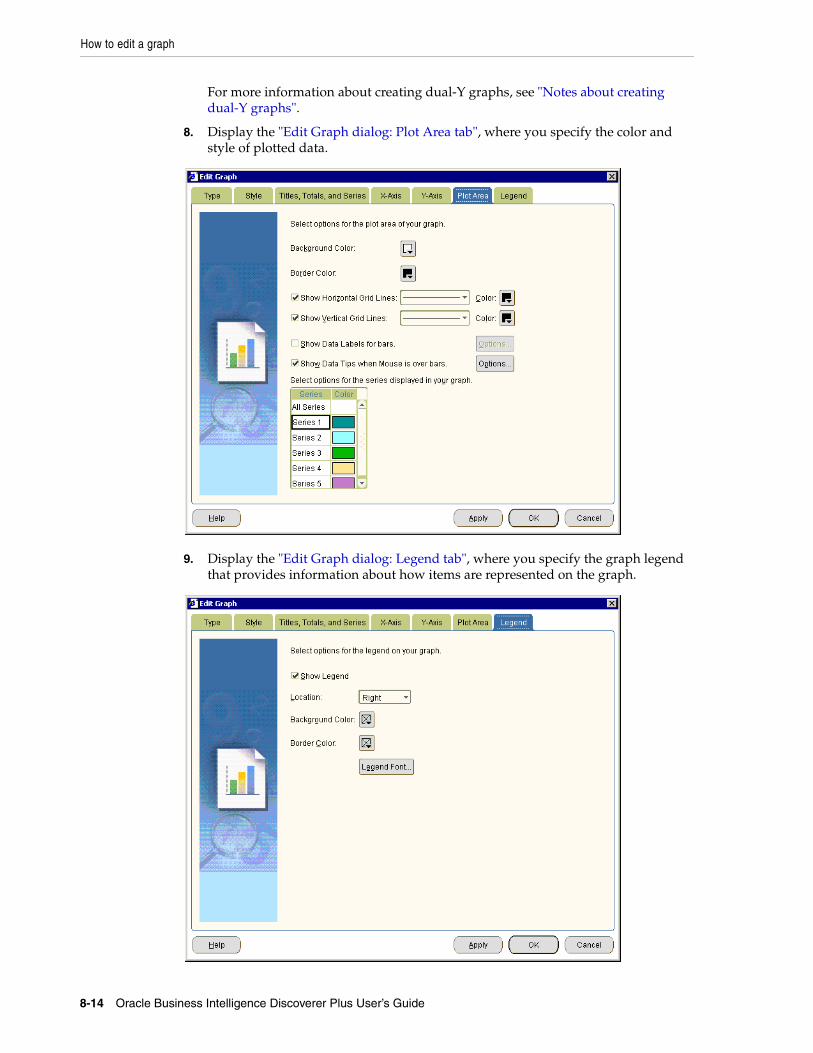
How to edit a graph
8-14 Oracle Business Intelligence Discoverer Plus User’s Guide
For more information about creating dual-Y graphs, see "Notes about creating dual-Y graphs".
8. Display the "Edit Graph dialog: Plot Area tab", where you specify the color and style of plotted data.
9. Display the "Edit Graph dialog: Legend tab", where you specify the graph legend that provides information about how items are represented on the graph.

How to hide and display a graph
Creating graphs in Discoverer 8-15
10. Click the Finish button to save the details and display the graph.
Discoverer displays the graph on the worksheet. By default, graphs are displayed at the right-hand side of worksheet data. To change where a graph is displayed, choose View | Graph Placement and choose a position from the list of options.
Notes■ To automatically arrange graph components, right-click on the graph border and
choose Auto Layout.
How to hide and display a graphYou hide a graph when you no longer need it. You display a graph when you want to display worksheet data visually or edit a graph.
Note: Hiding a graph does not remove the graph from the worksheet. You can always display the graph later if required.
To hide or display a graph:
1. Display the worksheet that contains the graph.
2. Choose View to display the View menu, and do one of the following:
■ Select the Graph check box to display the graph for the current worksheet
If this option is grayed out, to create a new graph choose Edit | Graph to display the Edit Graph dialog.
■ Clear the Graph check box to hide the graph for the current worksheet
Discoverer updates the worksheet with the changes that you specify.
How to change the position of a graph
8-16 Oracle Business Intelligence Discoverer Plus User’s Guide
How to change the position of a graphYou change the position of a graph when you want to change where it is displayed in relation to the worksheet data. For example, you might want to display a graph below worksheet data, or display a graph in a separate window.
To position a graph:
1. Choose View | Placement and choose one of the placement options.
For example, choose the Graph below Table/Crosstab option to position the graph beneath the data, or choose Separate Window to display the graph in a separate window.
Discoverer displays the graph in the position that you specified.
Notes■ When you change the position of a graph, you change how the graph is positioned
on screen. This does not affect how a worksheet and graph print out. For example, Discoverer always prints graphs on a separate page, after the worksheet data.
■ If you use Discoverer Viewer or OracleAS Portal to publish worksheets, Discoverer Viewer and OracleAS Portal display worksheet graphs above or below worksheet data.
Part IIAnalyzing data
This part explains the analysis tools available in Discoverer Plus Relational (e.g. pivoting, drilling, sorting) and explains how to create powerful worksheets using parameters, conditions, percentages, totals, and calculations.

Pivoting data 9-1
9Pivoting data
This chapter explains how to use Discoverer Plus Relational’s pivoting capabilities to arrange data on worksheets, and contains the following topics:
■ "About pivoting worksheet items"
■ "About pivoting data on a crosstab worksheet"
■ "How to pivot worksheet items in the Discoverer work area"
■ "How to pivot worksheet items using the Edit Worksheet dialog"
■ "About unexpected results with pivoting"
About pivoting worksheet itemsYou pivot worksheet items to arrange data on a crosstab worksheet for more effective analysis. For example, on a crosstab worksheet you might move an item from the left axis to the top axis to analyze new data relationships.
Pivoting is a powerful analysis tool enabling you to explore data relationships that might initially be hidden.
You can pivot worksheet data in the following ways:
■ in the Discoverer work area, you can drag and drop a worksheet item heading into a different position and see the new data layout instantly
In the example below, the Department item is dragged from the left axis to the top axis in the Discoverer work area.

About pivoting worksheet items
9-2 Oracle Business Intelligence Discoverer Plus User’s Guide
Figure 9–1 Pivoting in the Discoverer work area
For more information about pivoting worksheet items in the Discoverer work area, see "How to pivot worksheet items in the Discoverer work area".
■ in the Edit Worksheet dialog (i.e. in worksheet design mode), you can drag and drop a worksheet item into a different position and see the new data layout when you close the Edit Worksheet dialog and display the Discoverer work area.
In the example below, the Department item is dragged from the left axis to the top axis using the Edit Worksheet dialog: Table Layout tab.
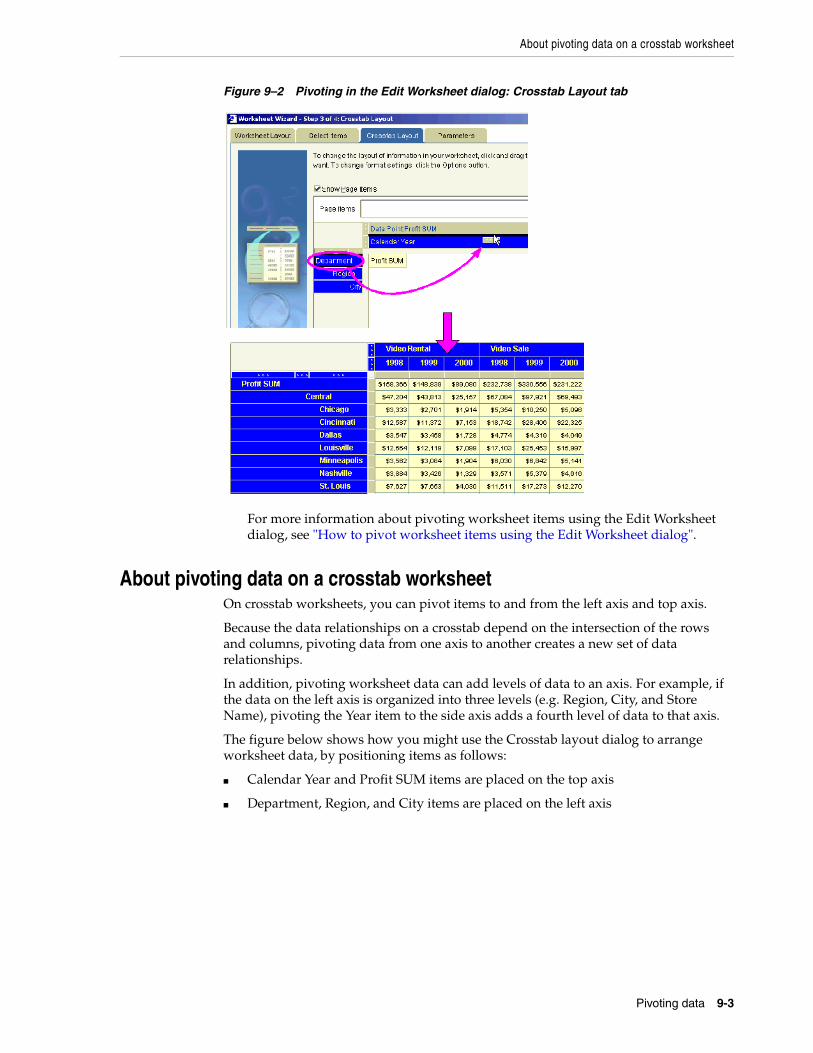
About pivoting data on a crosstab worksheet
Pivoting data 9-3
Figure 9–2 Pivoting in the Edit Worksheet dialog: Crosstab Layout tab
For more information about pivoting worksheet items using the Edit Worksheet dialog, see "How to pivot worksheet items using the Edit Worksheet dialog".
About pivoting data on a crosstab worksheetOn crosstab worksheets, you can pivot items to and from the left axis and top axis.
Because the data relationships on a crosstab depend on the intersection of the rows and columns, pivoting data from one axis to another creates a new set of data relationships.
In addition, pivoting worksheet data can add levels of data to an axis. For example, if the data on the left axis is organized into three levels (e.g. Region, City, and Store Name), pivoting the Year item to the side axis adds a fourth level of data to that axis.
The figure below shows how you might use the Crosstab layout dialog to arrange worksheet data, by positioning items as follows:
■ Calendar Year and Profit SUM items are placed on the top axis
■ Department, Region, and City items are placed on the left axis
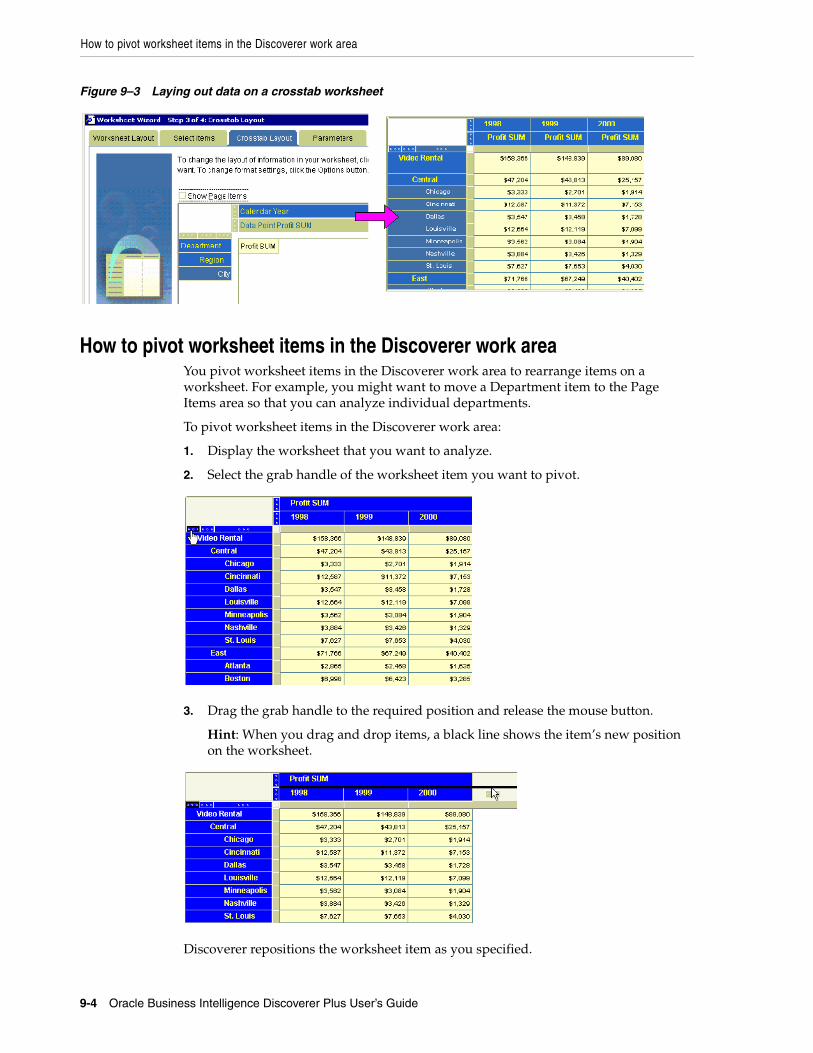
How to pivot worksheet items in the Discoverer work area
9-4 Oracle Business Intelligence Discoverer Plus User’s Guide
Figure 9–3 Laying out data on a crosstab worksheet
How to pivot worksheet items in the Discoverer work areaYou pivot worksheet items in the Discoverer work area to rearrange items on a worksheet. For example, you might want to move a Department item to the Page Items area so that you can analyze individual departments.
To pivot worksheet items in the Discoverer work area:
1. Display the worksheet that you want to analyze.
2. Select the grab handle of the worksheet item you want to pivot.
3. Drag the grab handle to the required position and release the mouse button.
Hint: When you drag and drop items, a black line shows the item’s new position on the worksheet.
Discoverer repositions the worksheet item as you specified.
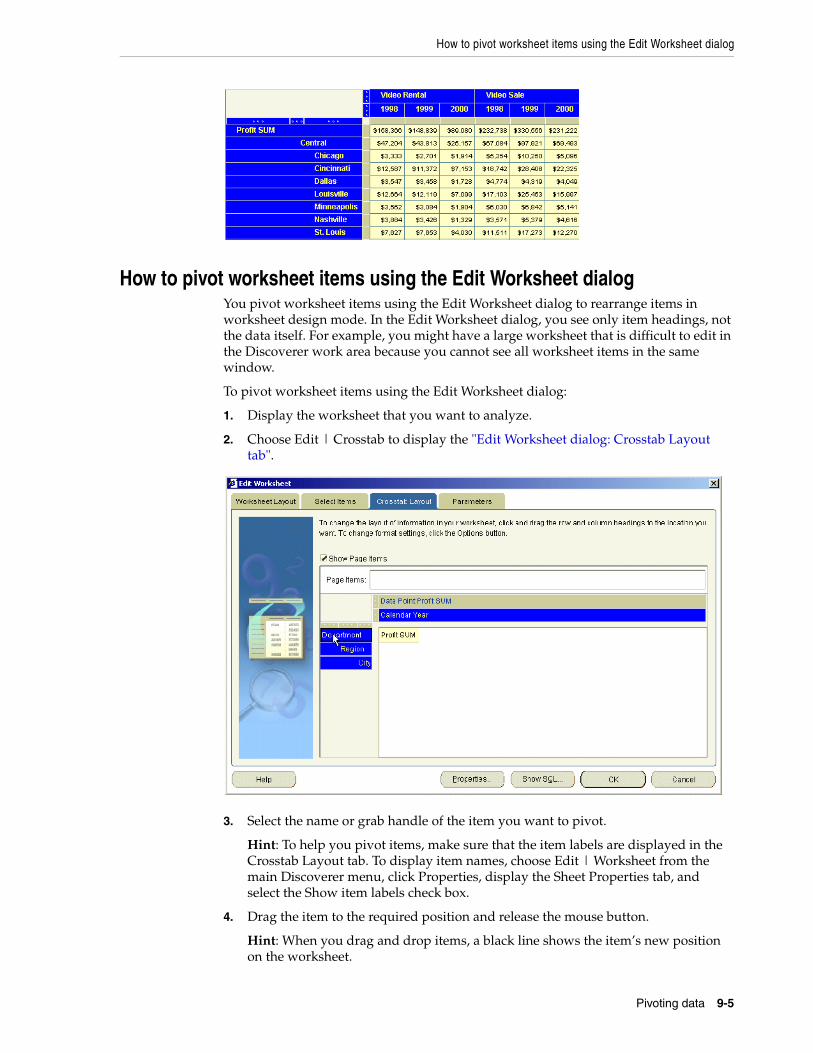
How to pivot worksheet items using the Edit Worksheet dialog
Pivoting data 9-5
How to pivot worksheet items using the Edit Worksheet dialogYou pivot worksheet items using the Edit Worksheet dialog to rearrange items in worksheet design mode. In the Edit Worksheet dialog, you see only item headings, not the data itself. For example, you might have a large worksheet that is difficult to edit in the Discoverer work area because you cannot see all worksheet items in the same window.
To pivot worksheet items using the Edit Worksheet dialog:
1. Display the worksheet that you want to analyze.
2. Choose Edit | Crosstab to display the "Edit Worksheet dialog: Crosstab Layout tab".
3. Select the name or grab handle of the item you want to pivot.
Hint: To help you pivot items, make sure that the item labels are displayed in the Crosstab Layout tab. To display item names, choose Edit | Worksheet from the main Discoverer menu, click Properties, display the Sheet Properties tab, and select the Show item labels check box.
4. Drag the item to the required position and release the mouse button.
Hint: When you drag and drop items, a black line shows the item’s new position on the worksheet.
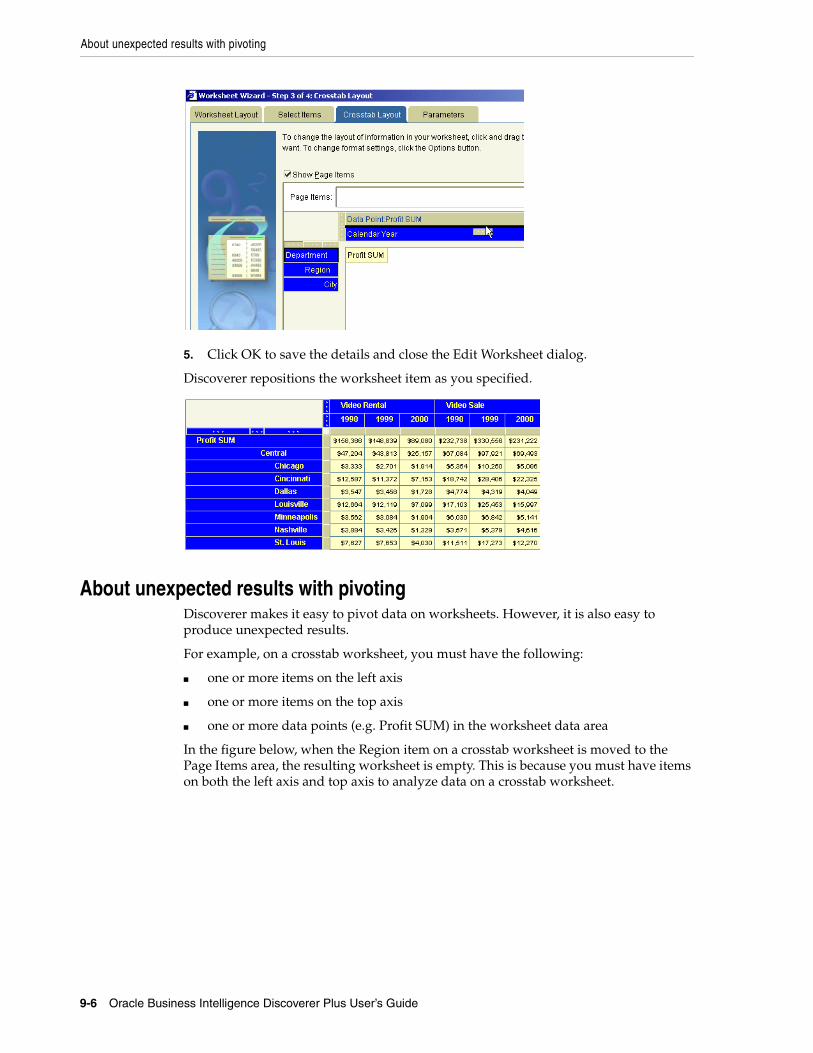
About unexpected results with pivoting
9-6 Oracle Business Intelligence Discoverer Plus User’s Guide
5. Click OK to save the details and close the Edit Worksheet dialog.
Discoverer repositions the worksheet item as you specified.
About unexpected results with pivotingDiscoverer makes it easy to pivot data on worksheets. However, it is also easy to produce unexpected results.
For example, on a crosstab worksheet, you must have the following:
■ one or more items on the left axis
■ one or more items on the top axis
■ one or more data points (e.g. Profit SUM) in the worksheet data area
In the figure below, when the Region item on a crosstab worksheet is moved to the Page Items area, the resulting worksheet is empty. This is because you must have items on both the left axis and top axis to analyze data on a crosstab worksheet.
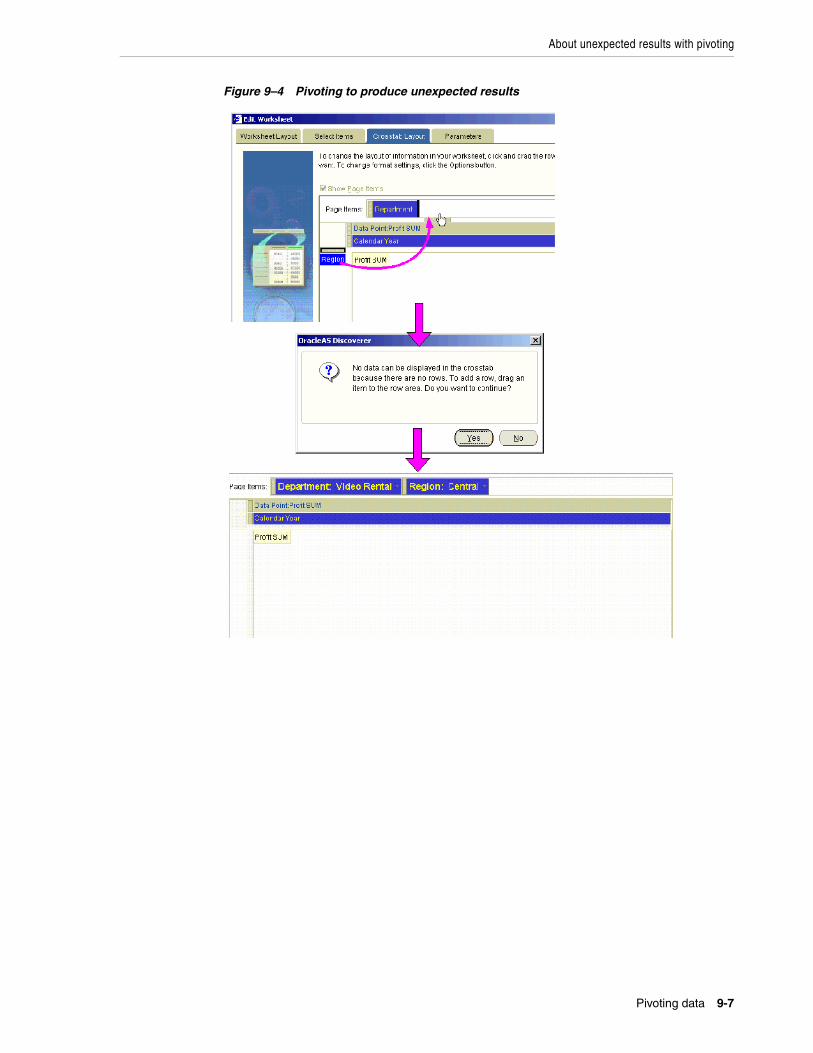
About unexpected results with pivoting
Pivoting data 9-7
Figure 9–4 Pivoting to produce unexpected results

About unexpected results with pivoting
9-8 Oracle Business Intelligence Discoverer Plus User’s Guide
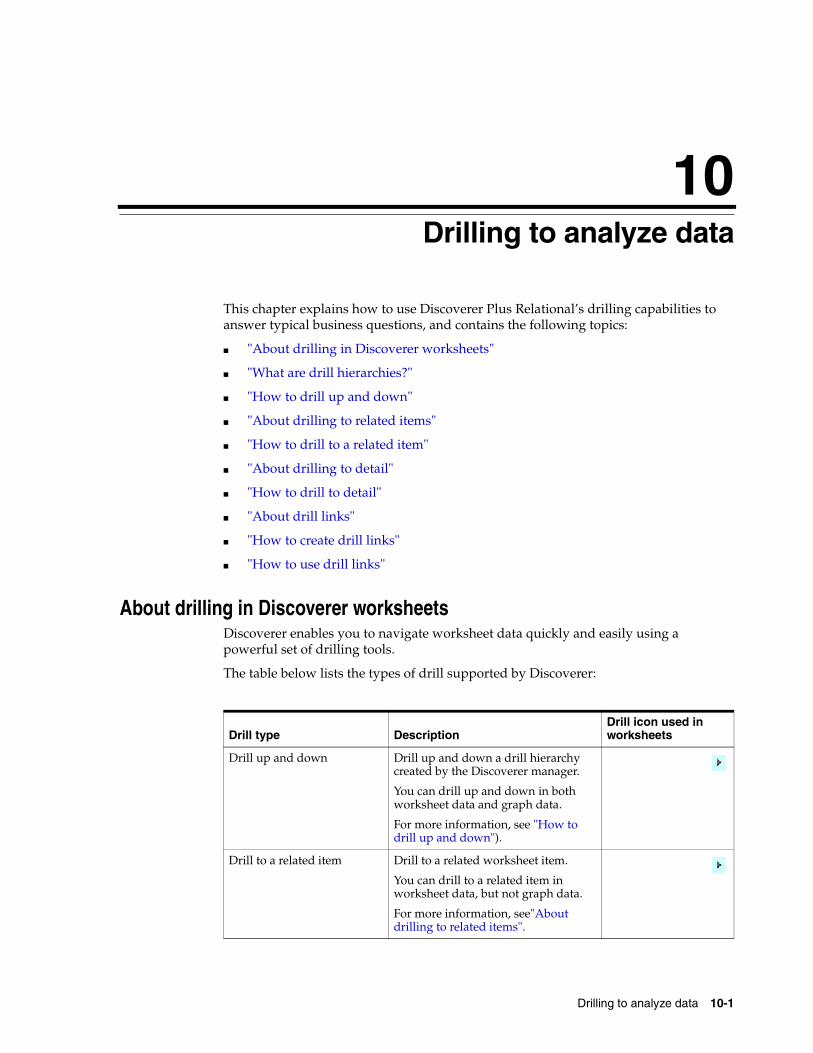
Drilling to analyze data 10-1
10Drilling to analyze data
This chapter explains how to use Discoverer Plus Relational’s drilling capabilities to answer typical business questions, and contains the following topics:
■ "About drilling in Discoverer worksheets"
■ "What are drill hierarchies?"
■ "How to drill up and down"
■ "About drilling to related items"
■ "How to drill to a related item"
■ "About drilling to detail"
■ "How to drill to detail"
■ "About drill links"
■ "How to create drill links"
■ "How to use drill links"
About drilling in Discoverer worksheetsDiscoverer enables you to navigate worksheet data quickly and easily using a powerful set of drilling tools.
The table below lists the types of drill supported by Discoverer:
Drill type DescriptionDrill icon used in worksheets
Drill up and down Drill up and down a drill hierarchy created by the Discoverer manager.
You can drill up and down in both worksheet data and graph data.
For more information, see "How to drill up and down").
Drill to a related item Drill to a related worksheet item.
You can drill to a related item in worksheet data, but not graph data.
For more information, see"About drilling to related items".
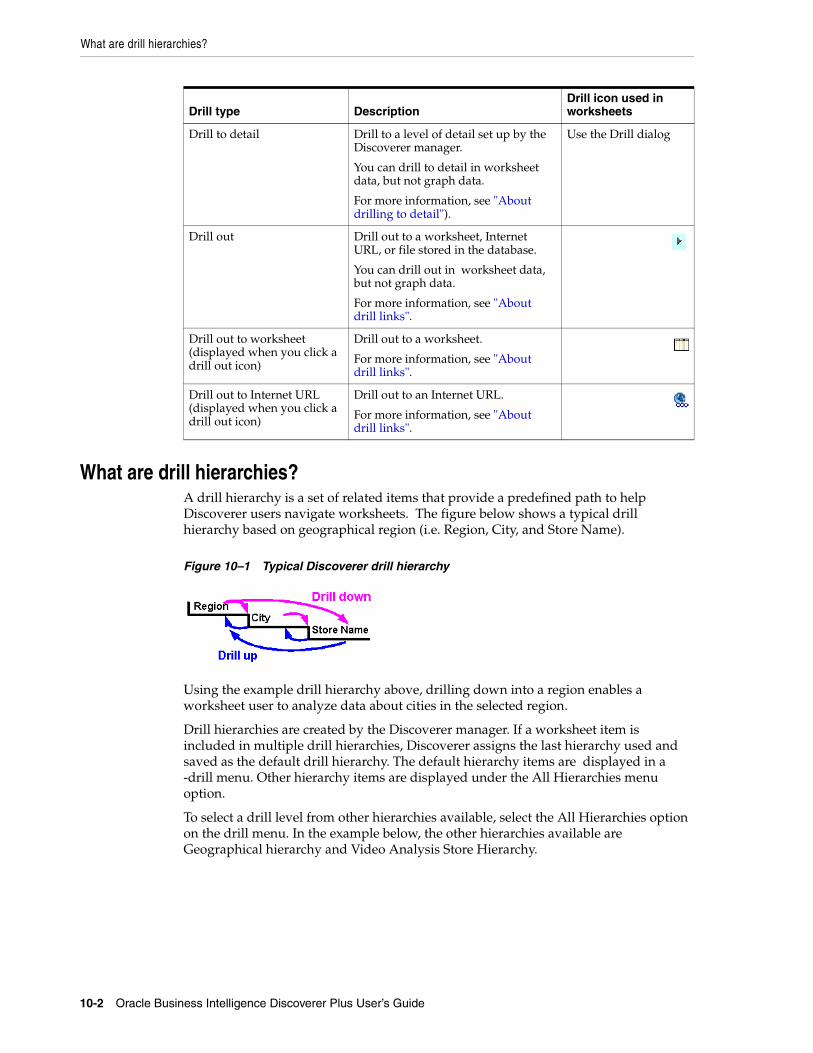
What are drill hierarchies?
10-2 Oracle Business Intelligence Discoverer Plus User’s Guide
What are drill hierarchies?A drill hierarchy is a set of related items that provide a predefined path to help Discoverer users navigate worksheets. The figure below shows a typical drill hierarchy based on geographical region (i.e. Region, City, and Store Name).
Figure 10–1 Typical Discoverer drill hierarchy
Using the example drill hierarchy above, drilling down into a region enables a worksheet user to analyze data about cities in the selected region.
Drill hierarchies are created by the Discoverer manager. If a worksheet item is included in multiple drill hierarchies, Discoverer assigns the last hierarchy used and saved as the default drill hierarchy. The default hierarchy items are displayed in a -drill menu. Other hierarchy items are displayed under the All Hierarchies menu option.
To select a drill level from other hierarchies available, select the All Hierarchies option on the drill menu. In the example below, the other hierarchies available are Geographical hierarchy and Video Analysis Store Hierarchy.
Drill to detail Drill to a level of detail set up by the Discoverer manager.
You can drill to detail in worksheet data, but not graph data.
For more information, see "About drilling to detail").
Use the Drill dialog
Drill out Drill out to a worksheet, Internet URL, or file stored in the database.
You can drill out in worksheet data, but not graph data.
For more information, see "About drill links".
Drill out to worksheet (displayed when you click a drill out icon)
Drill out to a worksheet.
For more information, see "About drill links".
Drill out to Internet URL (displayed when you click a drill out icon)
Drill out to an Internet URL.
For more information, see "About drill links".
Drill type DescriptionDrill icon used in worksheets
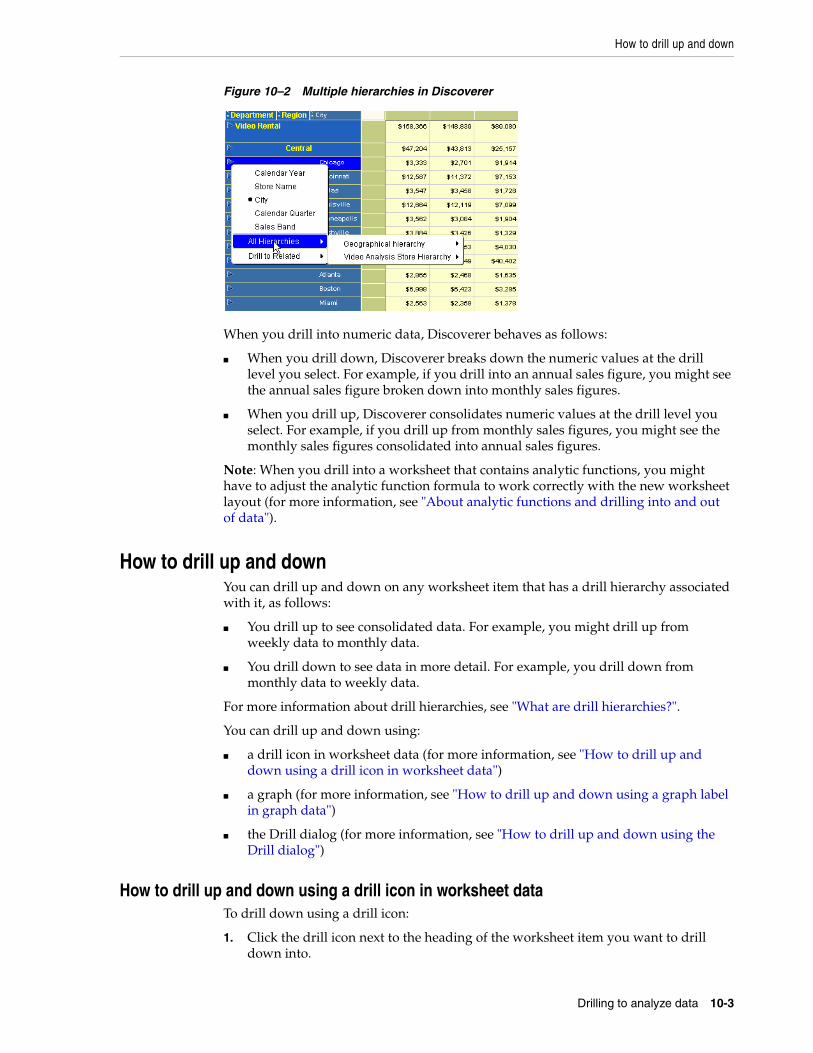
How to drill up and down
Drilling to analyze data 10-3
Figure 10–2 Multiple hierarchies in Discoverer
When you drill into numeric data, Discoverer behaves as follows:
■ When you drill down, Discoverer breaks down the numeric values at the drill level you select. For example, if you drill into an annual sales figure, you might see the annual sales figure broken down into monthly sales figures.
■ When you drill up, Discoverer consolidates numeric values at the drill level you select. For example, if you drill up from monthly sales figures, you might see the monthly sales figures consolidated into annual sales figures.
Note: When you drill into a worksheet that contains analytic functions, you might have to adjust the analytic function formula to work correctly with the new worksheet layout (for more information, see "About analytic functions and drilling into and out of data").
How to drill up and downYou can drill up and down on any worksheet item that has a drill hierarchy associated with it, as follows:
■ You drill up to see consolidated data. For example, you might drill up from weekly data to monthly data.
■ You drill down to see data in more detail. For example, you drill down from monthly data to weekly data.
For more information about drill hierarchies, see "What are drill hierarchies?".
You can drill up and down using:
■ a drill icon in worksheet data (for more information, see "How to drill up and down using a drill icon in worksheet data")
■ a graph (for more information, see "How to drill up and down using a graph label in graph data")
■ the Drill dialog (for more information, see "How to drill up and down using the Drill dialog")
How to drill up and down using a drill icon in worksheet dataTo drill down using a drill icon:
1. Click the drill icon next to the heading of the worksheet item you want to drill down into.
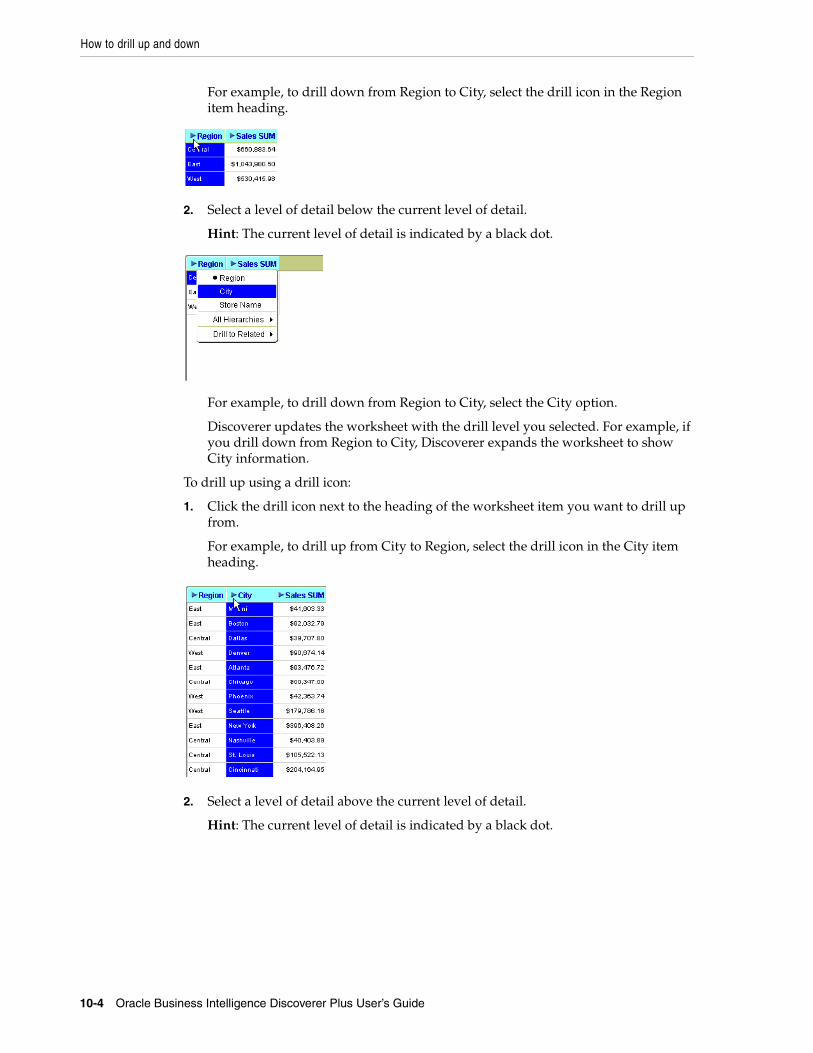
How to drill up and down
10-4 Oracle Business Intelligence Discoverer Plus User’s Guide
For example, to drill down from Region to City, select the drill icon in the Region item heading.
2. Select a level of detail below the current level of detail.
Hint: The current level of detail is indicated by a black dot.
For example, to drill down from Region to City, select the City option.
Discoverer updates the worksheet with the drill level you selected. For example, if you drill down from Region to City, Discoverer expands the worksheet to show City information.
To drill up using a drill icon:
1. Click the drill icon next to the heading of the worksheet item you want to drill up from.
For example, to drill up from City to Region, select the drill icon in the City item heading.
2. Select a level of detail above the current level of detail.
Hint: The current level of detail is indicated by a black dot.
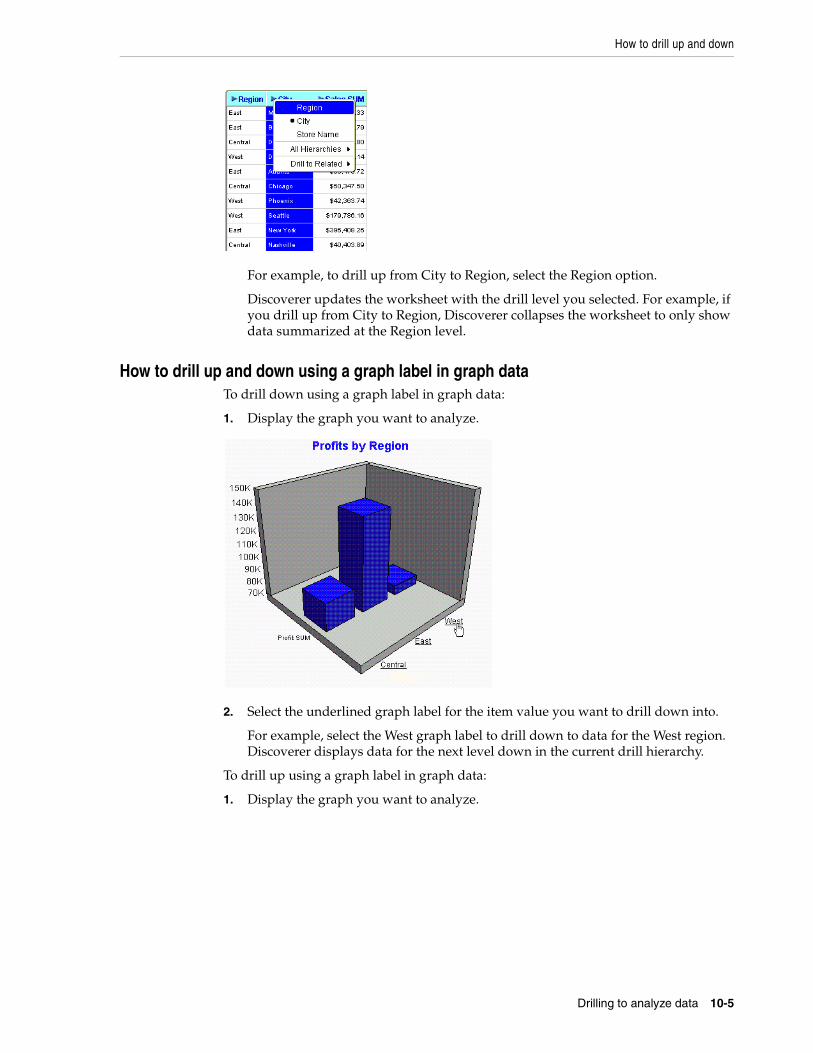
How to drill up and down
Drilling to analyze data 10-5
For example, to drill up from City to Region, select the Region option.
Discoverer updates the worksheet with the drill level you selected. For example, if you drill up from City to Region, Discoverer collapses the worksheet to only show data summarized at the Region level.
How to drill up and down using a graph label in graph dataTo drill down using a graph label in graph data:
1. Display the graph you want to analyze.
2. Select the underlined graph label for the item value you want to drill down into.
For example, select the West graph label to drill down to data for the West region. Discoverer displays data for the next level down in the current drill hierarchy.
To drill up using a graph label in graph data:
1. Display the graph you want to analyze.
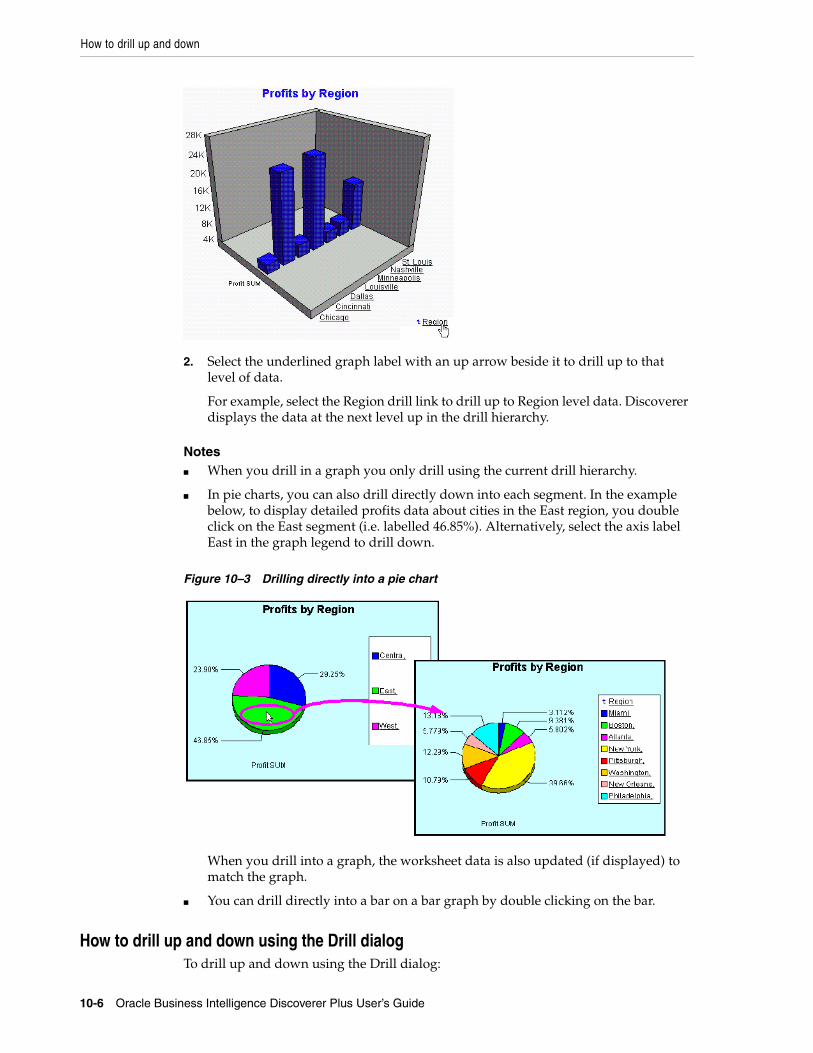
How to drill up and down
10-6 Oracle Business Intelligence Discoverer Plus User’s Guide
2. Select the underlined graph label with an up arrow beside it to drill up to that level of data.
For example, select the Region drill link to drill up to Region level data. Discoverer displays the data at the next level up in the drill hierarchy.
Notes■ When you drill in a graph you only drill using the current drill hierarchy.
■ In pie charts, you can also drill directly down into each segment. In the example below, to display detailed profits data about cities in the East region, you double click on the East segment (i.e. labelled 46.85%). Alternatively, select the axis label East in the graph legend to drill down.
Figure 10–3 Drilling directly into a pie chart
When you drill into a graph, the worksheet data is also updated (if displayed) to match the graph.
■ You can drill directly into a bar on a bar graph by double clicking on the bar.
How to drill up and down using the Drill dialogTo drill up and down using the Drill dialog:
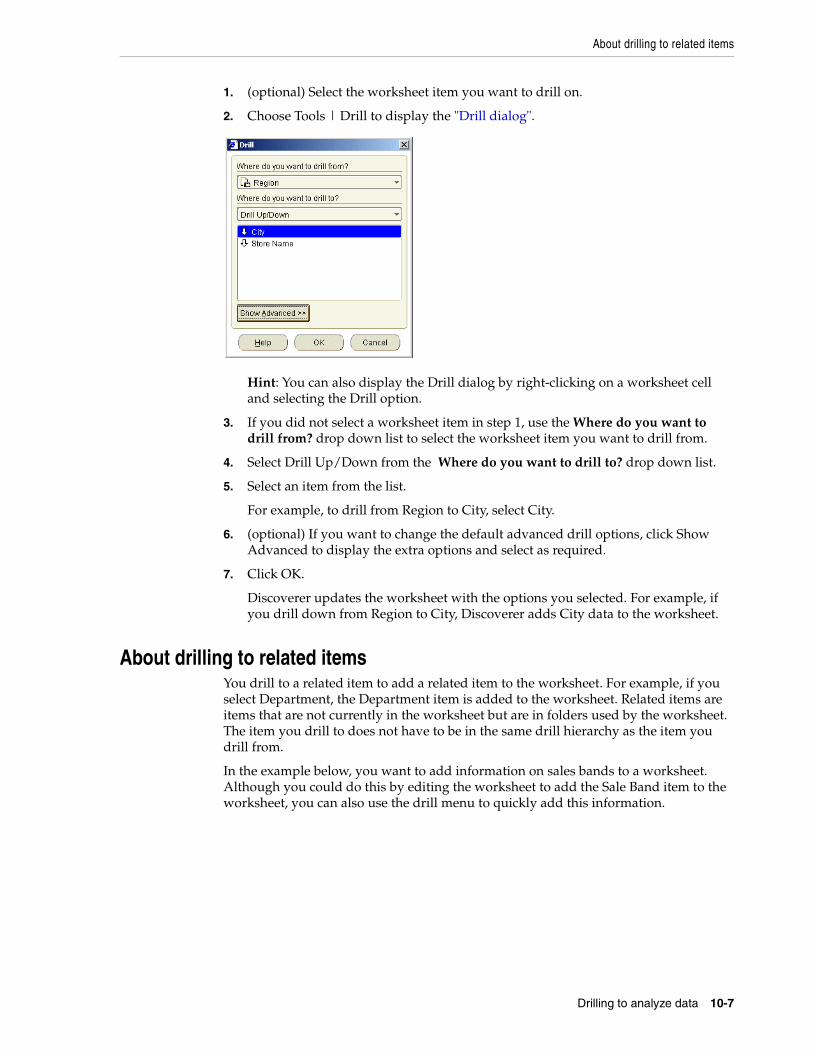
About drilling to related items
Drilling to analyze data 10-7
1. (optional) Select the worksheet item you want to drill on.
2. Choose Tools | Drill to display the "Drill dialog".
Hint: You can also display the Drill dialog by right-clicking on a worksheet cell and selecting the Drill option.
3. If you did not select a worksheet item in step 1, use the Where do you want to drill from? drop down list to select the worksheet item you want to drill from.
4. Select Drill Up/Down from the Where do you want to drill to? drop down list.
5. Select an item from the list.
For example, to drill from Region to City, select City.
6. (optional) If you want to change the default advanced drill options, click Show Advanced to display the extra options and select as required.
7. Click OK.
Discoverer updates the worksheet with the options you selected. For example, if you drill down from Region to City, Discoverer adds City data to the worksheet.
About drilling to related itemsYou drill to a related item to add a related item to the worksheet. For example, if you select Department, the Department item is added to the worksheet. Related items are items that are not currently in the worksheet but are in folders used by the worksheet. The item you drill to does not have to be in the same drill hierarchy as the item you drill from.
In the example below, you want to add information on sales bands to a worksheet. Although you could do this by editing the worksheet to add the Sale Band item to the worksheet, you can also use the drill menu to quickly add this information.
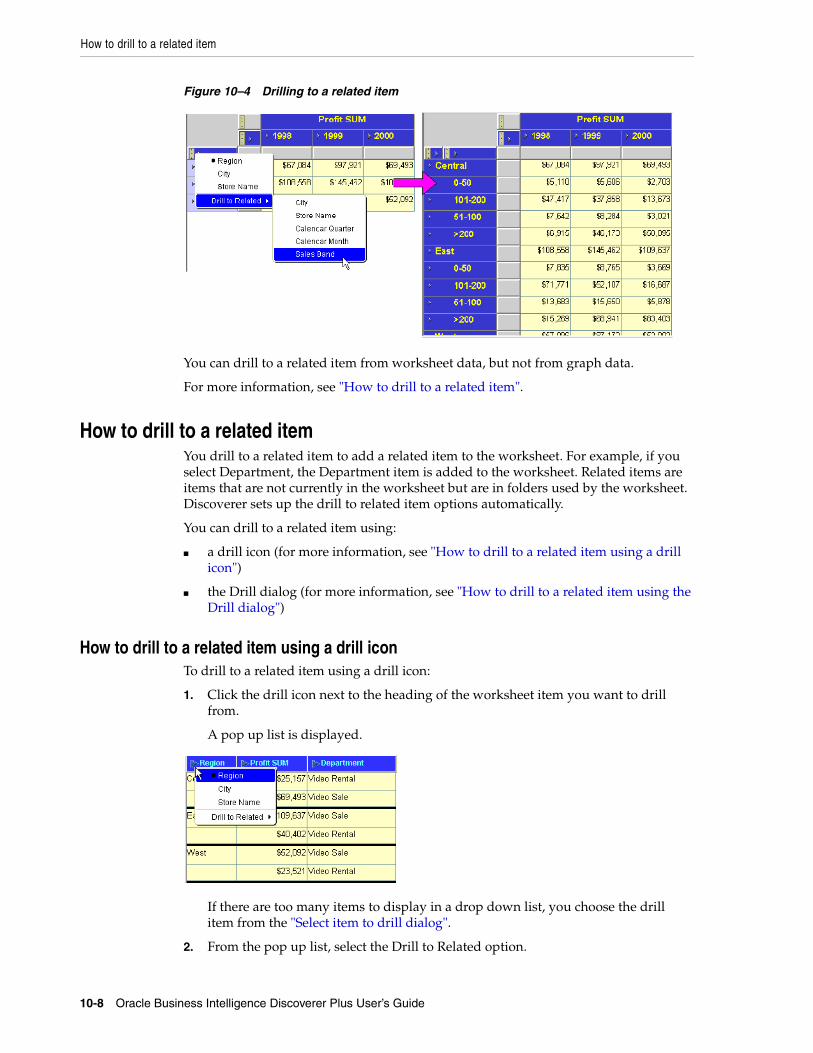
How to drill to a related item
10-8 Oracle Business Intelligence Discoverer Plus User’s Guide
Figure 10–4 Drilling to a related item
You can drill to a related item from worksheet data, but not from graph data.
For more information, see "How to drill to a related item".
How to drill to a related itemYou drill to a related item to add a related item to the worksheet. For example, if you select Department, the Department item is added to the worksheet. Related items are items that are not currently in the worksheet but are in folders used by the worksheet. Discoverer sets up the drill to related item options automatically.
You can drill to a related item using:
■ a drill icon (for more information, see "How to drill to a related item using a drill icon")
■ the Drill dialog (for more information, see "How to drill to a related item using the Drill dialog")
How to drill to a related item using a drill iconTo drill to a related item using a drill icon:
1. Click the drill icon next to the heading of the worksheet item you want to drill from.
A pop up list is displayed.
If there are too many items to display in a drop down list, you choose the drill item from the "Select item to drill dialog".
2. From the pop up list, select the Drill to Related option.
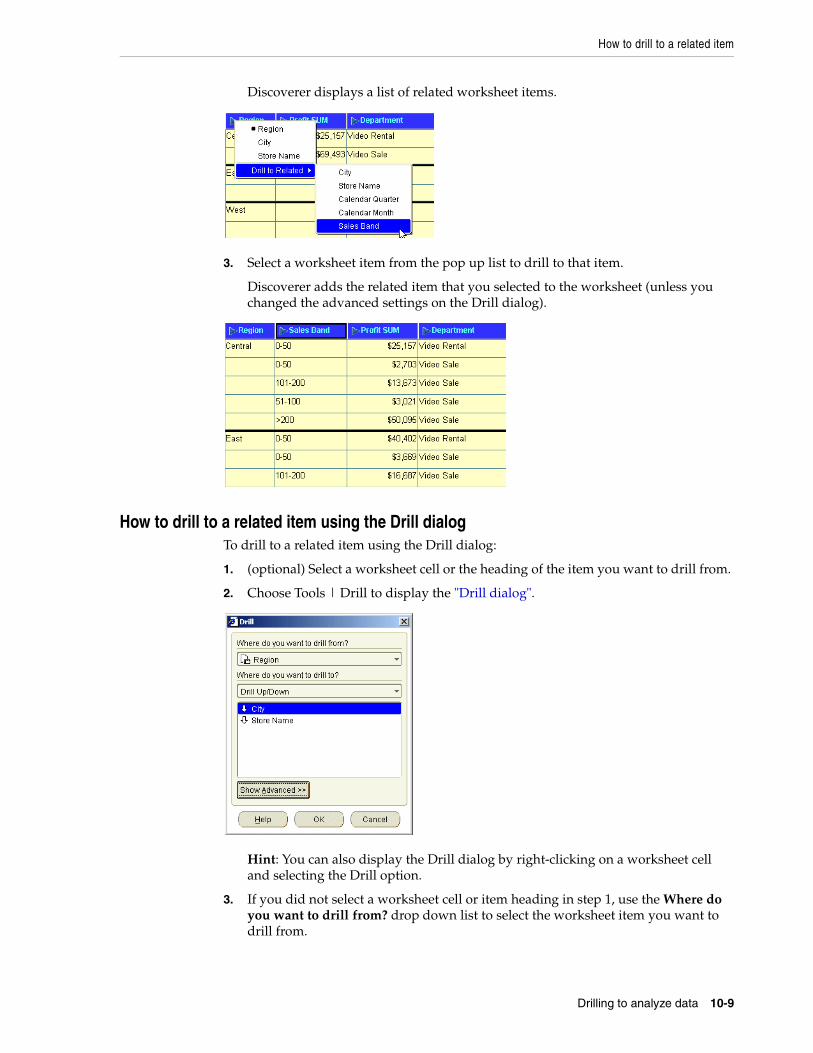
How to drill to a related item
Drilling to analyze data 10-9
Discoverer displays a list of related worksheet items.
3. Select a worksheet item from the pop up list to drill to that item.
Discoverer adds the related item that you selected to the worksheet (unless you changed the advanced settings on the Drill dialog).
How to drill to a related item using the Drill dialogTo drill to a related item using the Drill dialog:
1. (optional) Select a worksheet cell or the heading of the item you want to drill from.
2. Choose Tools | Drill to display the "Drill dialog".
Hint: You can also display the Drill dialog by right-clicking on a worksheet cell and selecting the Drill option.
3. If you did not select a worksheet cell or item heading in step 1, use the Where do you want to drill from? drop down list to select the worksheet item you want to drill from.
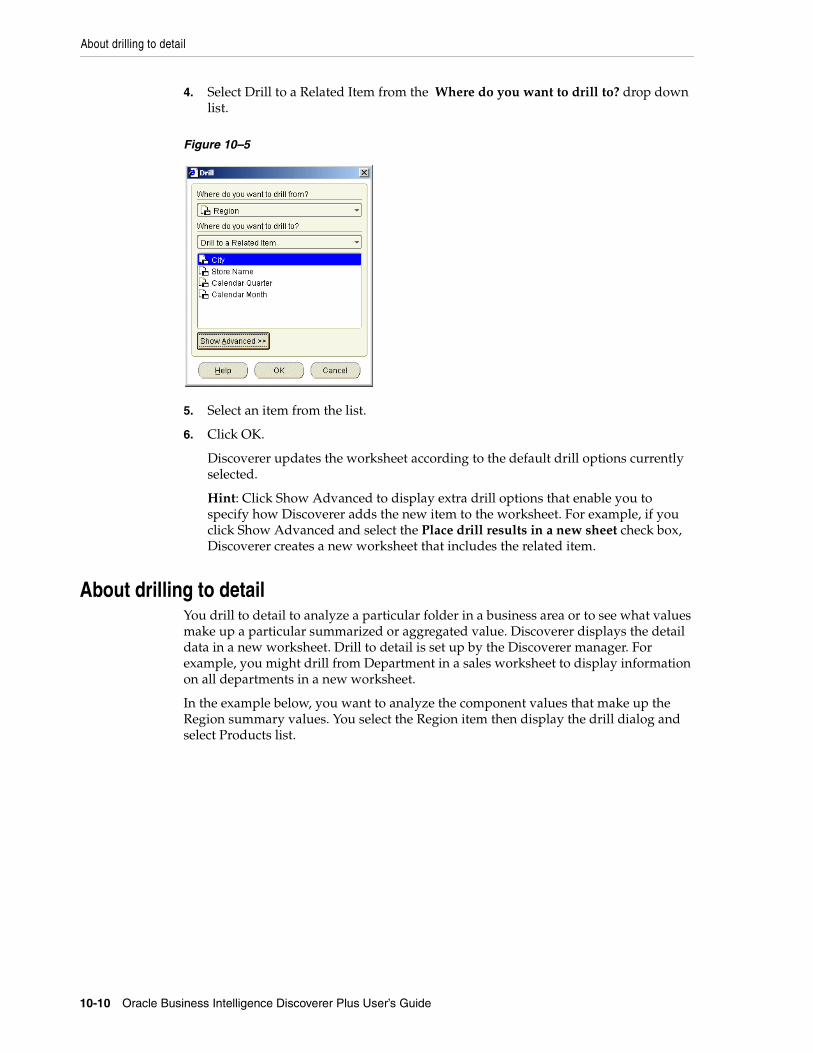
About drilling to detail
10-10 Oracle Business Intelligence Discoverer Plus User’s Guide
4. Select Drill to a Related Item from the Where do you want to drill to? drop down list.
Figure 10–5
5. Select an item from the list.
6. Click OK.
Discoverer updates the worksheet according to the default drill options currently selected.
Hint: Click Show Advanced to display extra drill options that enable you to specify how Discoverer adds the new item to the worksheet. For example, if you click Show Advanced and select the Place drill results in a new sheet check box, Discoverer creates a new worksheet that includes the related item.
About drilling to detailYou drill to detail to analyze a particular folder in a business area or to see what values make up a particular summarized or aggregated value. Discoverer displays the detail data in a new worksheet. Drill to detail is set up by the Discoverer manager. For example, you might drill from Department in a sales worksheet to display information on all departments in a new worksheet.
In the example below, you want to analyze the component values that make up the Region summary values. You select the Region item then display the drill dialog and select Products list.
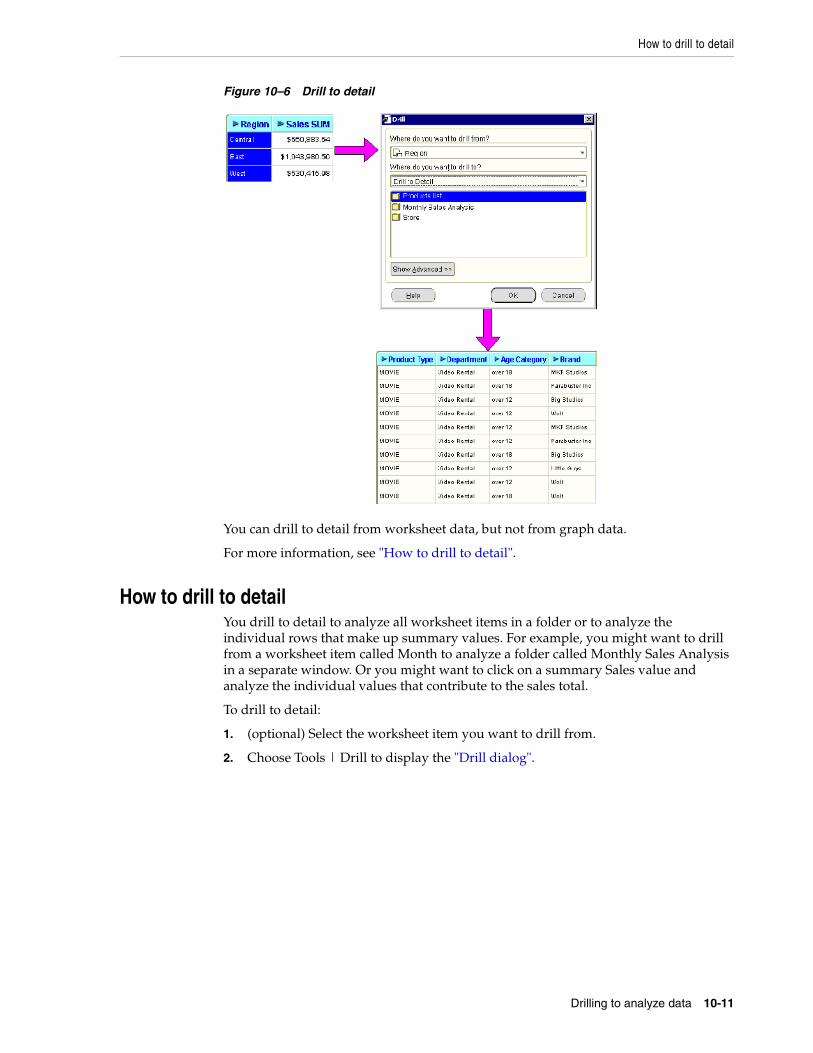
How to drill to detail
Drilling to analyze data 10-11
Figure 10–6 Drill to detail
You can drill to detail from worksheet data, but not from graph data.
For more information, see "How to drill to detail".
How to drill to detailYou drill to detail to analyze all worksheet items in a folder or to analyze the individual rows that make up summary values. For example, you might want to drill from a worksheet item called Month to analyze a folder called Monthly Sales Analysis in a separate window. Or you might want to click on a summary Sales value and analyze the individual values that contribute to the sales total.
To drill to detail:
1. (optional) Select the worksheet item you want to drill from.
2. Choose Tools | Drill to display the "Drill dialog".
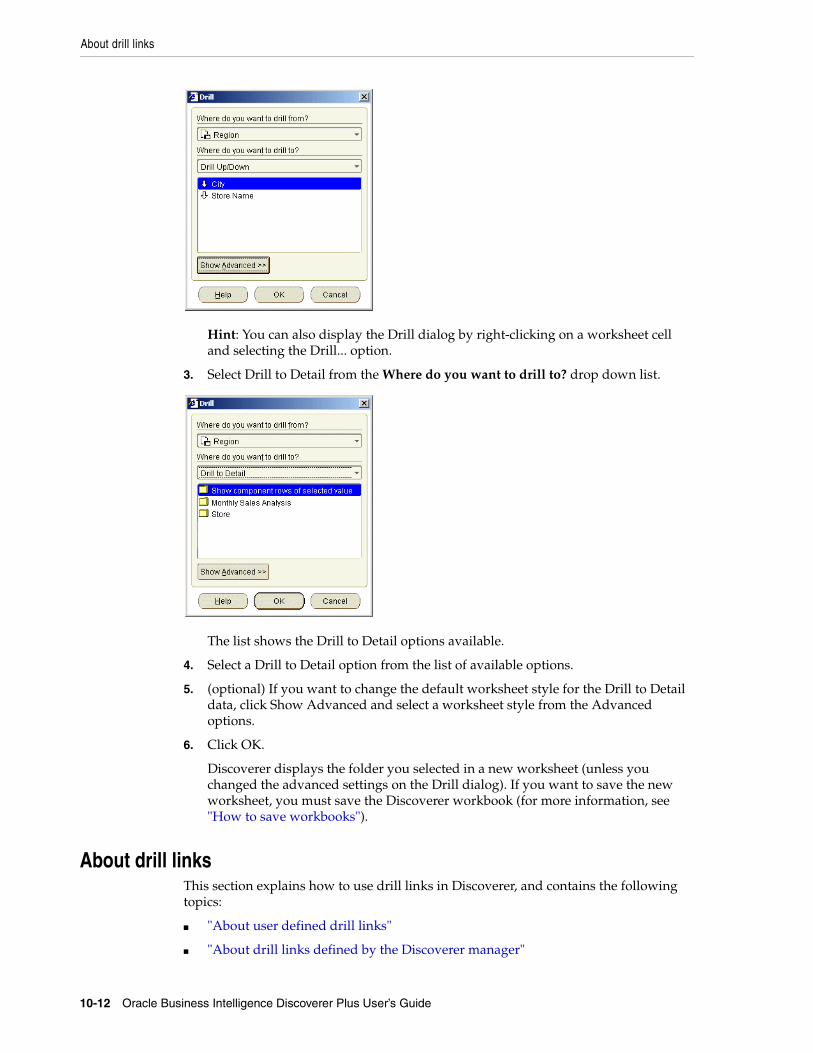
About drill links
10-12 Oracle Business Intelligence Discoverer Plus User’s Guide
Hint: You can also display the Drill dialog by right-clicking on a worksheet cell and selecting the Drill... option.
3. Select Drill to Detail from the Where do you want to drill to? drop down list.
The list shows the Drill to Detail options available.
4. Select a Drill to Detail option from the list of available options.
5. (optional) If you want to change the default worksheet style for the Drill to Detail data, click Show Advanced and select a worksheet style from the Advanced options.
6. Click OK.
Discoverer displays the folder you selected in a new worksheet (unless you changed the advanced settings on the Drill dialog). If you want to save the new worksheet, you must save the Discoverer workbook (for more information, see "How to save workbooks").
About drill linksThis section explains how to use drill links in Discoverer, and contains the following topics:
■ "About user defined drill links"
■ "About drill links defined by the Discoverer manager"
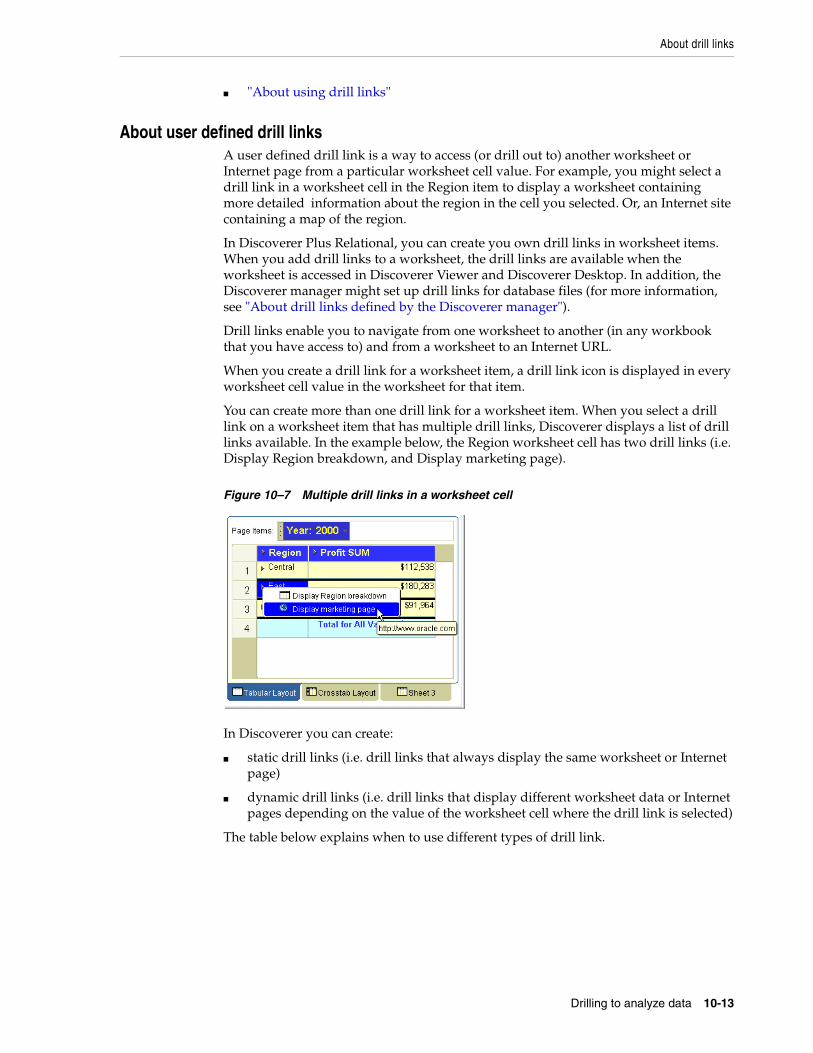
About drill links
Drilling to analyze data 10-13
■ "About using drill links"
About user defined drill linksA user defined drill link is a way to access (or drill out to) another worksheet or Internet page from a particular worksheet cell value. For example, you might select a drill link in a worksheet cell in the Region item to display a worksheet containing more detailed information about the region in the cell you selected. Or, an Internet site containing a map of the region.
In Discoverer Plus Relational, you can create you own drill links in worksheet items. When you add drill links to a worksheet, the drill links are available when the worksheet is accessed in Discoverer Viewer and Discoverer Desktop. In addition, the Discoverer manager might set up drill links for database files (for more information, see "About drill links defined by the Discoverer manager").
Drill links enable you to navigate from one worksheet to another (in any workbook that you have access to) and from a worksheet to an Internet URL.
When you create a drill link for a worksheet item, a drill link icon is displayed in every worksheet cell value in the worksheet for that item.
You can create more than one drill link for a worksheet item. When you select a drill link on a worksheet item that has multiple drill links, Discoverer displays a list of drill links available. In the example below, the Region worksheet cell has two drill links (i.e. Display Region breakdown, and Display marketing page).
Figure 10–7 Multiple drill links in a worksheet cell
In Discoverer you can create:
■ static drill links (i.e. drill links that always display the same worksheet or Internet page)
■ dynamic drill links (i.e. drill links that display different worksheet data or Internet pages depending on the value of the worksheet cell where the drill link is selected)
The table below explains when to use different types of drill link.
About drill links
10-14 Oracle Business Intelligence Discoverer Plus User’s Guide
About drill links defined by the Discoverer managerWhen files are stored on the middle tier machine, the Discoverer manager can make drill links available in worksheets to drill out to the file. The example below shows how clicking the drill link displays the report in the default text editor (in this case Microsoft Word) inside an Internet browser.
Drill link type Use when:
Static drill link to a worksheet
The worksheet data displayed in the second worksheet is the same for each cell in the item.
For example, you might select a drill link in a cell of a worksheet item called Year to display a worksheet showing a sales summary for all years.
For more information, see "How to create drill links to Discoverer worksheets".
Dynamic drill link to a worksheet
The worksheet data displayed in the second worksheet depends on the value in the cell where the drill link was selected (i.e. the target worksheet is filtered by a parameter).
For example, you might select a drill link in a cell of a worksheet item called Year to display sales information for that particular year. The value of the worksheet cell is passed to the target worksheet using a worksheet parameter.
For more information, see "How to create drill links to Discoverer worksheets".
Static drill link to an Internet URL
The Internet URL opened is the same for each cell in the item.
For example, you might select a drill link in a cell of a worksheet item called Region to display an Internet page containing a map of all regions.
For more information, see "How to create drill links to Internet URLs".
Dynamic drill link to an Internet URL
The Internet page displayed is different for each cell in the item (i.e. the Internet URL can accept the value of the cell).
For example, you might select a drill link in a cell of a worksheet item called Region to display an Internet page containing a map of the region in the selected cell.
For more information, see "How to create drill links to Internet URLs".
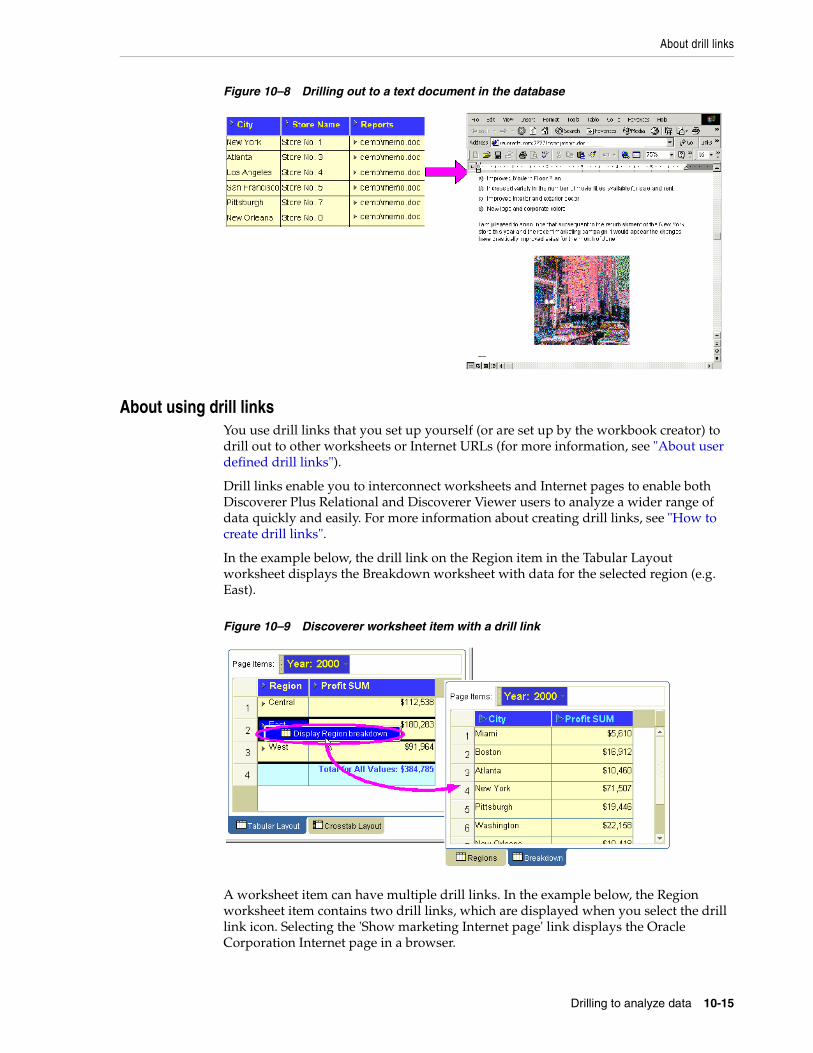
About drill links
Drilling to analyze data 10-15
Figure 10–8 Drilling out to a text document in the database
About using drill linksYou use drill links that you set up yourself (or are set up by the workbook creator) to drill out to other worksheets or Internet URLs (for more information, see "About user defined drill links").
Drill links enable you to interconnect worksheets and Internet pages to enable both Discoverer Plus Relational and Discoverer Viewer users to analyze a wider range of data quickly and easily. For more information about creating drill links, see "How to create drill links".
In the example below, the drill link on the Region item in the Tabular Layout worksheet displays the Breakdown worksheet with data for the selected region (e.g. East).
Figure 10–9 Discoverer worksheet item with a drill link
A worksheet item can have multiple drill links. In the example below, the Region worksheet item contains two drill links, which are displayed when you select the drill link icon. Selecting the 'Show marketing Internet page' link displays the Oracle Corporation Internet page in a browser.
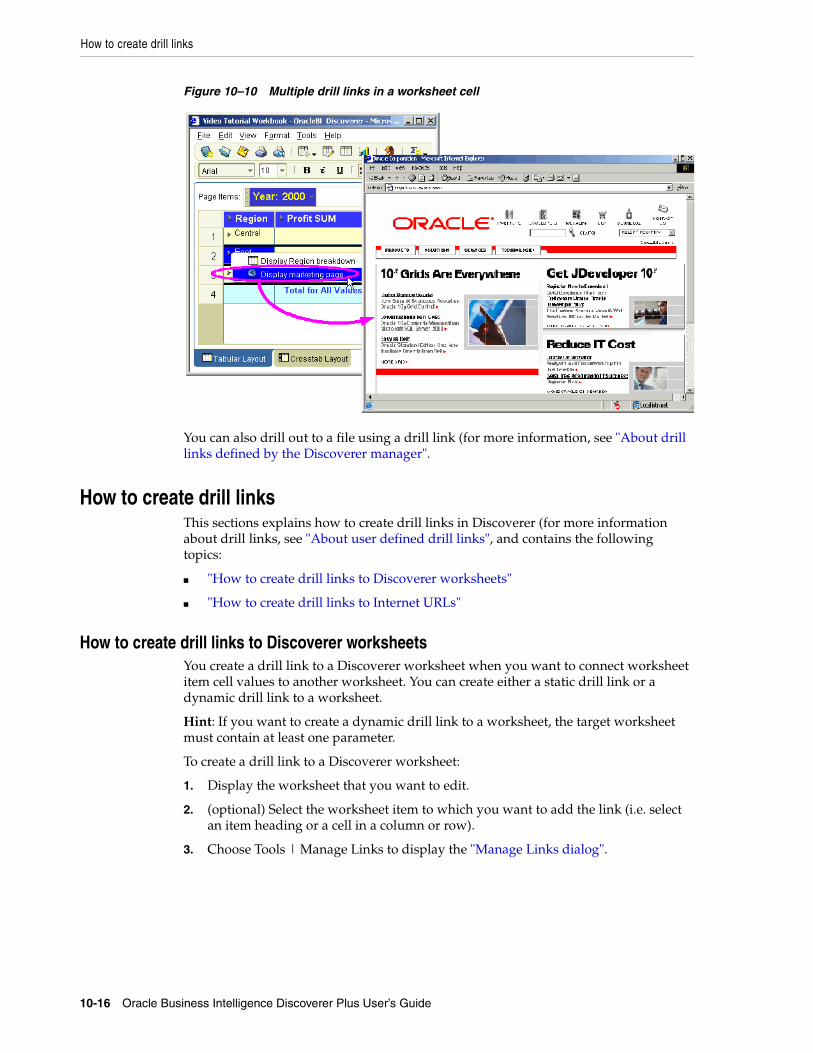
How to create drill links
10-16 Oracle Business Intelligence Discoverer Plus User’s Guide
Figure 10–10 Multiple drill links in a worksheet cell
You can also drill out to a file using a drill link (for more information, see "About drill links defined by the Discoverer manager".
How to create drill linksThis sections explains how to create drill links in Discoverer (for more information about drill links, see "About user defined drill links", and contains the following topics:
■ "How to create drill links to Discoverer worksheets"
■ "How to create drill links to Internet URLs"
How to create drill links to Discoverer worksheetsYou create a drill link to a Discoverer worksheet when you want to connect worksheet item cell values to another worksheet. You can create either a static drill link or a dynamic drill link to a worksheet.
Hint: If you want to create a dynamic drill link to a worksheet, the target worksheet must contain at least one parameter.
To create a drill link to a Discoverer worksheet:
1. Display the worksheet that you want to edit.
2. (optional) Select the worksheet item to which you want to add the link (i.e. select an item heading or a cell in a column or row).
3. Choose Tools | Manage Links to display the "Manage Links dialog".
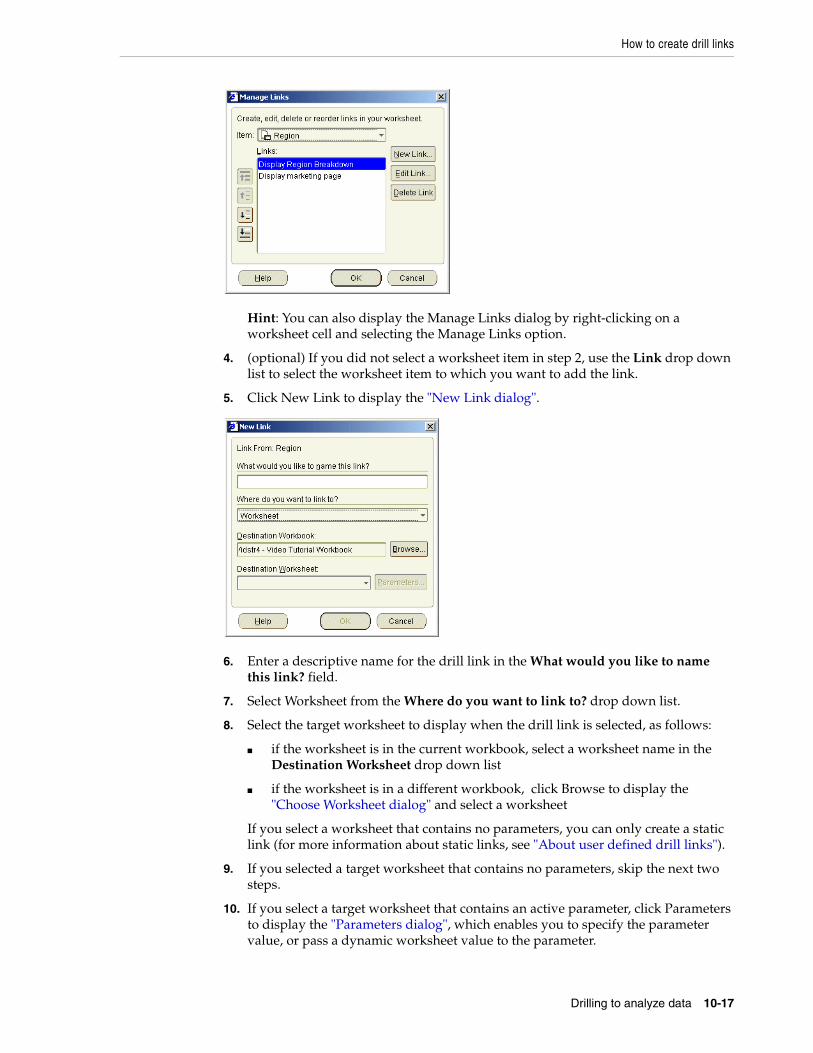
How to create drill links
Drilling to analyze data 10-17
Hint: You can also display the Manage Links dialog by right-clicking on a worksheet cell and selecting the Manage Links option.
4. (optional) If you did not select a worksheet item in step 2, use the Link drop down list to select the worksheet item to which you want to add the link.
5. Click New Link to display the "New Link dialog".
6. Enter a descriptive name for the drill link in the What would you like to name this link? field.
7. Select Worksheet from the Where do you want to link to? drop down list.
8. Select the target worksheet to display when the drill link is selected, as follows:
■ if the worksheet is in the current workbook, select a worksheet name in the Destination Worksheet drop down list
■ if the worksheet is in a different workbook, click Browse to display the "Choose Worksheet dialog" and select a worksheet
If you select a worksheet that contains no parameters, you can only create a static link (for more information about static links, see "About user defined drill links").
9. If you selected a target worksheet that contains no parameters, skip the next two steps.
10. If you select a target worksheet that contains an active parameter, click Parameters to display the "Parameters dialog", which enables you to specify the parameter value, or pass a dynamic worksheet value to the parameter.
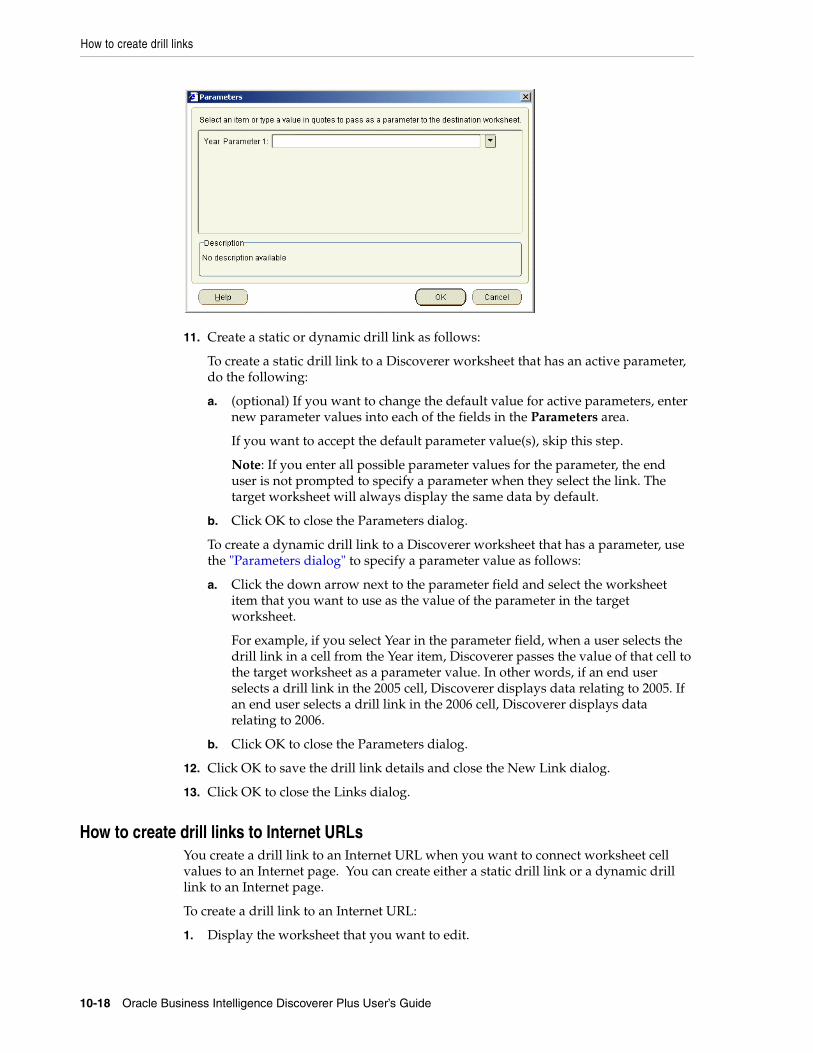
How to create drill links
10-18 Oracle Business Intelligence Discoverer Plus User’s Guide
11. Create a static or dynamic drill link as follows:
To create a static drill link to a Discoverer worksheet that has an active parameter, do the following:
a. (optional) If you want to change the default value for active parameters, enter new parameter values into each of the fields in the Parameters area.
If you want to accept the default parameter value(s), skip this step.
Note: If you enter all possible parameter values for the parameter, the end user is not prompted to specify a parameter when they select the link. The target worksheet will always display the same data by default.
b. Click OK to close the Parameters dialog.
To create a dynamic drill link to a Discoverer worksheet that has a parameter, use the "Parameters dialog" to specify a parameter value as follows:
a. Click the down arrow next to the parameter field and select the worksheet item that you want to use as the value of the parameter in the target worksheet.
For example, if you select Year in the parameter field, when a user selects the drill link in a cell from the Year item, Discoverer passes the value of that cell to the target worksheet as a parameter value. In other words, if an end user selects a drill link in the 2005 cell, Discoverer displays data relating to 2005. If an end user selects a drill link in the 2006 cell, Discoverer displays data relating to 2006.
b. Click OK to close the Parameters dialog.
12. Click OK to save the drill link details and close the New Link dialog.
13. Click OK to close the Links dialog.
How to create drill links to Internet URLsYou create a drill link to an Internet URL when you want to connect worksheet cell values to an Internet page. You can create either a static drill link or a dynamic drill link to an Internet page.
To create a drill link to an Internet URL:
1. Display the worksheet that you want to edit.
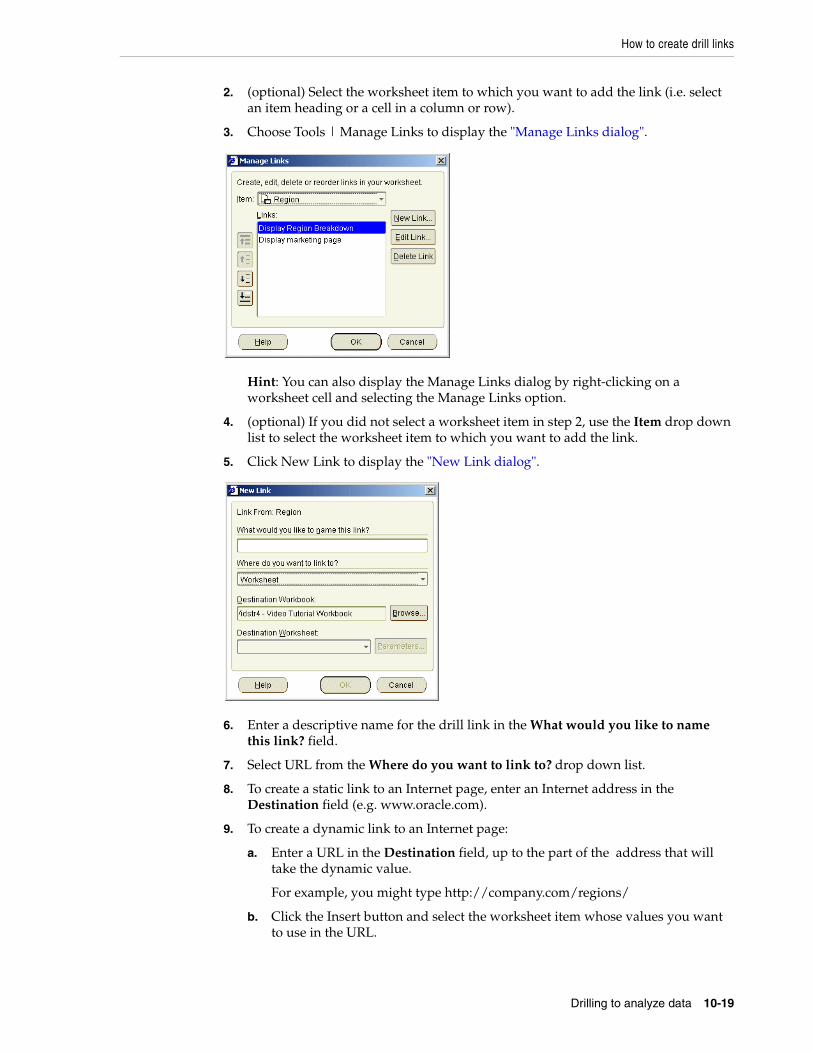
How to create drill links
Drilling to analyze data 10-19
2. (optional) Select the worksheet item to which you want to add the link (i.e. select an item heading or a cell in a column or row).
3. Choose Tools | Manage Links to display the "Manage Links dialog".
Hint: You can also display the Manage Links dialog by right-clicking on a worksheet cell and selecting the Manage Links option.
4. (optional) If you did not select a worksheet item in step 2, use the Item drop down list to select the worksheet item to which you want to add the link.
5. Click New Link to display the "New Link dialog".
6. Enter a descriptive name for the drill link in the What would you like to name this link? field.
7. Select URL from the Where do you want to link to? drop down list.
8. To create a static link to an Internet page, enter an Internet address in the Destination field (e.g. www.oracle.com).
9. To create a dynamic link to an Internet page:
a. Enter a URL in the Destination field, up to the part of the address that will take the dynamic value.
For example, you might type http://company.com/regions/
b. Click the Insert button and select the worksheet item whose values you want to use in the URL.
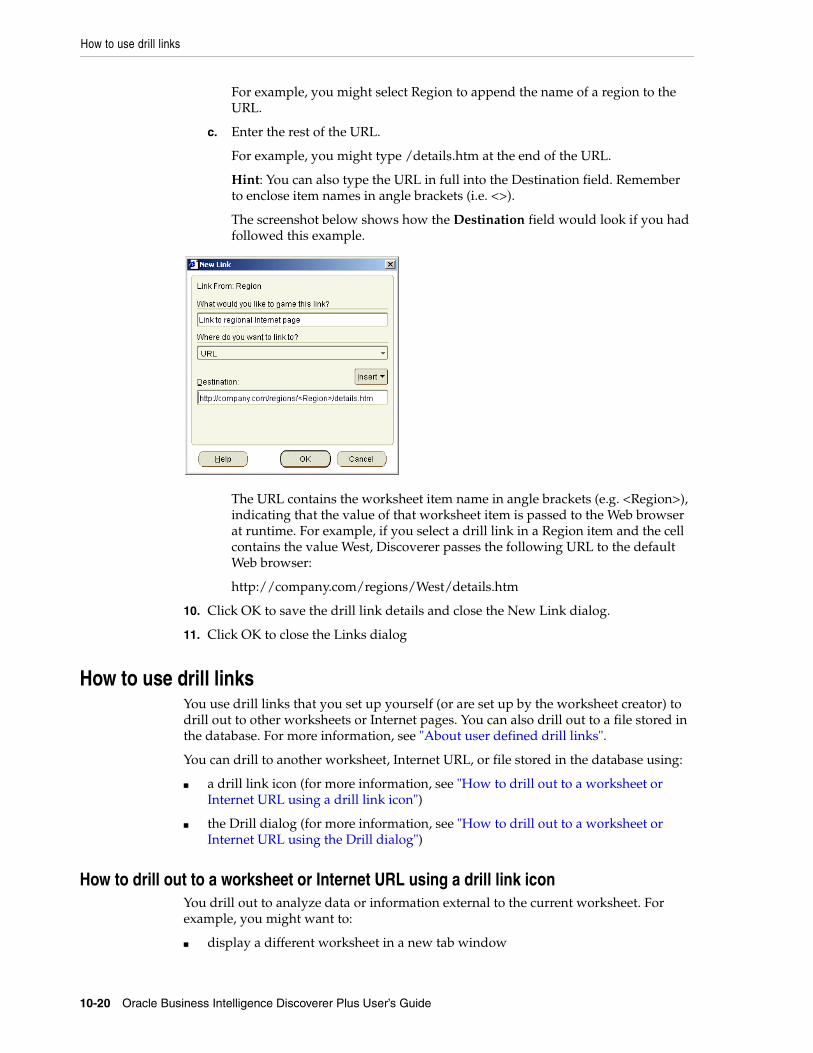
How to use drill links
10-20 Oracle Business Intelligence Discoverer Plus User’s Guide
For example, you might select Region to append the name of a region to the URL.
c. Enter the rest of the URL.
For example, you might type /details.htm at the end of the URL.
Hint: You can also type the URL in full into the Destination field. Remember to enclose item names in angle brackets (i.e. <>).
The screenshot below shows how the Destination field would look if you had followed this example.
The URL contains the worksheet item name in angle brackets (e.g. <Region>), indicating that the value of that worksheet item is passed to the Web browser at runtime. For example, if you select a drill link in a Region item and the cell contains the value West, Discoverer passes the following URL to the default Web browser:
http://company.com/regions/West/details.htm
10. Click OK to save the drill link details and close the New Link dialog.
11. Click OK to close the Links dialog
How to use drill linksYou use drill links that you set up yourself (or are set up by the worksheet creator) to drill out to other worksheets or Internet pages. You can also drill out to a file stored in the database. For more information, see "About user defined drill links".
You can drill to another worksheet, Internet URL, or file stored in the database using:
■ a drill link icon (for more information, see "How to drill out to a worksheet or Internet URL using a drill link icon")
■ the Drill dialog (for more information, see "How to drill out to a worksheet or Internet URL using the Drill dialog")
How to drill out to a worksheet or Internet URL using a drill link iconYou drill out to analyze data or information external to the current worksheet. For example, you might want to:
■ display a different worksheet in a new tab window
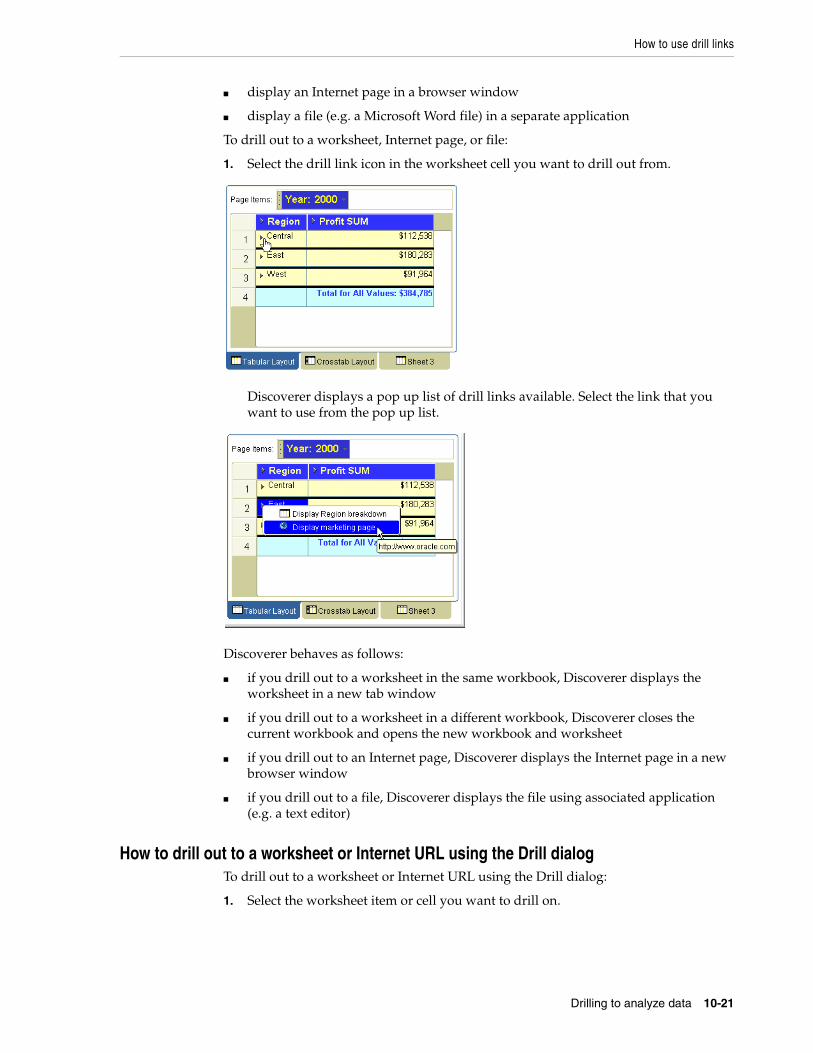
How to use drill links
Drilling to analyze data 10-21
■ display an Internet page in a browser window
■ display a file (e.g. a Microsoft Word file) in a separate application
To drill out to a worksheet, Internet page, or file:
1. Select the drill link icon in the worksheet cell you want to drill out from.
Discoverer displays a pop up list of drill links available. Select the link that you want to use from the pop up list.
Discoverer behaves as follows:
■ if you drill out to a worksheet in the same workbook, Discoverer displays the worksheet in a new tab window
■ if you drill out to a worksheet in a different workbook, Discoverer closes the current workbook and opens the new workbook and worksheet
■ if you drill out to an Internet page, Discoverer displays the Internet page in a new browser window
■ if you drill out to a file, Discoverer displays the file using associated application (e.g. a text editor)
How to drill out to a worksheet or Internet URL using the Drill dialogTo drill out to a worksheet or Internet URL using the Drill dialog:
1. Select the worksheet item or cell you want to drill on.
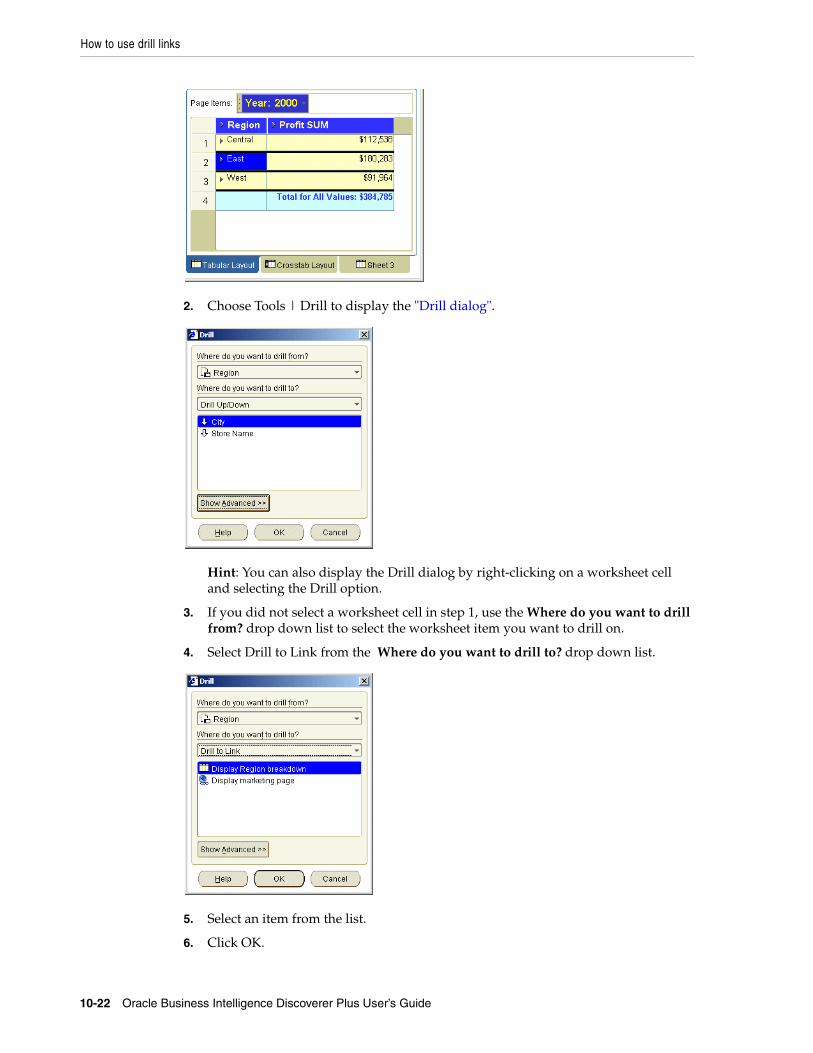
How to use drill links
10-22 Oracle Business Intelligence Discoverer Plus User’s Guide
2. Choose Tools | Drill to display the "Drill dialog".
Hint: You can also display the Drill dialog by right-clicking on a worksheet cell and selecting the Drill option.
3. If you did not select a worksheet cell in step 1, use the Where do you want to drill from? drop down list to select the worksheet item you want to drill on.
4. Select Drill to Link from the Where do you want to drill to? drop down list.
5. Select an item from the list.
6. Click OK.

How to use drill links
Drilling to analyze data 10-23
Discoverer behaves as follows:
■ if you drill out to a worksheet in the same workbook, Discoverer displays the worksheet in a new tab window
■ if you drill out to a worksheet in a different workbook, Discoverer closes the current workbook and opens the new workbook and worksheet
■ if you drill out to an Internet URL, Discoverer displays the Internet page in a new browser window

How to use drill links
10-24 Oracle Business Intelligence Discoverer Plus User’s Guide
Using parameters 11-1
11Using parameters
This chapter explains how to use Discoverer Plus Relational parameters to answer typical business questions, and contains the following topics:
■ "What are parameters?"
■ "What are the benefits of using parameters?"
■ "About using parameters"
■ "About creating parameters"
■ "About using parameters to collect dynamic user input"
■ "About filtering lists of parameter values based on selected conditions"
■ "How to set parameters"
■ "How to activate parameters"
■ "How to deactivate parameters"
■ "How to create parameters"
■ "How to delete parameters"
■ "Examples of parameters"
What are parameters?Parameters are workbook items that allow Discoverer users to analyze worksheets by entering dynamic input values (see figure below). Input values are typically used to:
■ provide input to conditions that are used to filter worksheets - for example, when a workbook or worksheet is opened or refreshed, the parameter is used to first ask the worksheet user 'What month do you want to analyze?'. A worksheet user can choose to look at data for the month of January only.
■ provide input to calculations - for example, a worksheet user can enter the value '3' when prompted, which is then used to divide data into three bands using a predefined calculation containing a banding function (see "About using parameters to collect dynamic user input")
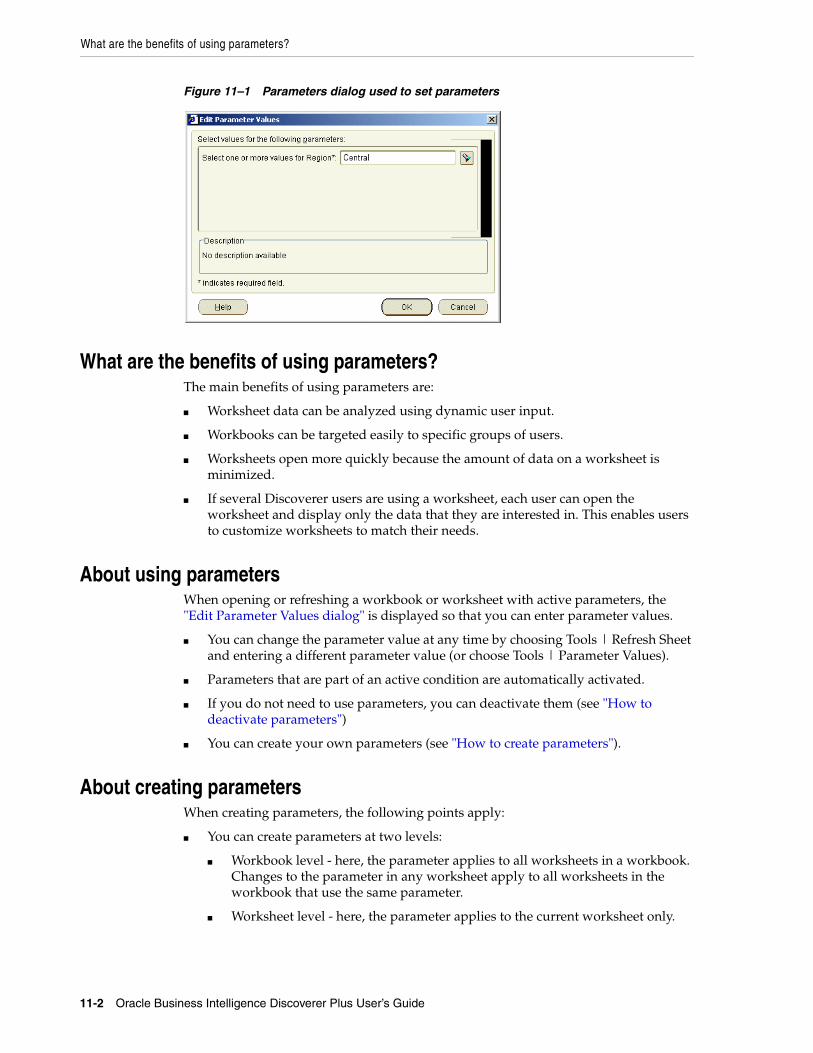
What are the benefits of using parameters?
11-2 Oracle Business Intelligence Discoverer Plus User’s Guide
Figure 11–1 Parameters dialog used to set parameters
What are the benefits of using parameters?The main benefits of using parameters are:
■ Worksheet data can be analyzed using dynamic user input.
■ Workbooks can be targeted easily to specific groups of users.
■ Worksheets open more quickly because the amount of data on a worksheet is minimized.
■ If several Discoverer users are using a worksheet, each user can open the worksheet and display only the data that they are interested in. This enables users to customize worksheets to match their needs.
About using parametersWhen opening or refreshing a workbook or worksheet with active parameters, the "Edit Parameter Values dialog" is displayed so that you can enter parameter values.
■ You can change the parameter value at any time by choosing Tools | Refresh Sheet and entering a different parameter value (or choose Tools | Parameter Values).
■ Parameters that are part of an active condition are automatically activated.
■ If you do not need to use parameters, you can deactivate them (see "How to deactivate parameters")
■ You can create your own parameters (see "How to create parameters").
About creating parametersWhen creating parameters, the following points apply:
■ You can create parameters at two levels:
■ Workbook level - here, the parameter applies to all worksheets in a workbook. Changes to the parameter in any worksheet apply to all worksheets in the workbook that use the same parameter.
■ Worksheet level - here, the parameter applies to the current worksheet only.

About filtering lists of parameter values based on selected conditions
Using parameters 11-3
■ When you create a parameter for filtering worksheets, you typically create a condition also. The Create condition with operator check box is selected by default on the "New Parameter dialog".
■ When a condition is created with a parameter, you can deactivate the parameter by deactivating the condition. Deleting the condition deletes the parameter and vice versa.
■ If you select the Create Condition with operator check box in the "New Parameter dialog", a new condition is created and activated. Therefore, the parameter is also activated.
About using parameters to collect dynamic user inputSometimes you want worksheet users to enter a dynamic value, typically for use in calculations. For example, to enter a value to specify the number of bands in which to group data (for more information, see "Examples of parameters").
To collect dynamic user input, do the following:
■ Create a new parameter, and choose the following:
■ choose <NONE> from the Which item do you want to base your parameter on? drop down list (for more information, see "New Parameter dialog")
■ clear the Let other users select multiple values check box
Note: If a Discoverer end user enters more than one parameter value, only the first parameter value is used.
Notice that you cannot activate the parameter. Before it can be activated, a parameter not based on a worksheet item must be used in a calculation or condition.
■ Create a calculation and insert the parameter name as an argument.
For example, if you create a parameter called Band Value for use in a sales banding function, you might create a calculation called Banded Sales based on the following function:
NTILE(:Band Value) OVER(ORDER BY SUM(Sales))
Notice that the Band Value parameter is prefixed with a colon ':' to indicate that it is a parameter value (e.g. :Band Value).
When the worksheet is opened or refreshed, the worksheet user is prompted to enter a banding value. If they enter the parameter value '3', the Sales SUM values on the worksheet are grouped into three bands.
For an example of a parameter being used in a calculation, see "Example: Calculate hypothetical rank".
About filtering lists of parameter values based on selected conditionsWhen you create or edit a parameter that is based on an item with a list of values (LOV), Discoverer enables you to filter the LOV by associating the parameter with one or more conditions. Discoverer displays the filtered LOV when you select parameter values to use in a worksheet. If you do not associate a condition with a parameter, then all parameter values are shown.
You could create a parameter based on the item City and associate a previously created condition Region = :Region with the City parameter. Notice that the Region condition
How to set parameters
11-4 Oracle Business Intelligence Discoverer Plus User’s Guide
includes a parameter value (Region) prefixed with a colon (:) indicating that it is a parameter value. The LOV for the City parameter will only display the Cities that satisfy the Region = :Region condition. In other words, if the end user has entered East for the parameter :Region, Discoverer will only display cities that belong to the East Region.
When you create a new parameter, by default, Discoverer selects active conditions associated with the parameter based on an item higher in the hierarchy. For example, if you create a Parameter on City Discoverer will associate the Region =:Region condition with the parameter. When Discoverer is unable to select any active conditions to associate with a parameter, you can manually select one or more conditions to associate with the parameter.
Notes■ The conditions associated with a parameter are of worksheet scope, that is for a
given parameter, you can associate different conditions for different sheets. For example, a parameter based on City could be associated with two conditions based on Region and State in one sheet, and with only one condition based on Region in another sheet.
■ You will not be able to associate a condition with a new parameter, where the condition includes a parameter value (e.g. Region =:Region), unless you create the condition before you create the parameter. For example, if you create a parameter City and want to associate the condition Region =:Region with the parameter City, you must create the condition before you create the parameter. This rule only applies to conditions that include a parameter. For example, if you create a parameter called City, then create a new condition Region =’East’ (i.e. a condition without a parameter), you can associate this condition with the parameter City.
For more information, see:
■ "How to create parameters"
■ "Edit Parameter dialog"
How to set parametersWhen you open or refresh a worksheet that contains active parameters, you must enter parameter values to set the parameters. If default values are defined, you might also accept default values. The values entered are typically used to filter the data displayed on the worksheet, or are used to provide dynamic input to calculations.
To set parameters:
1. Open a worksheet.
If the worksheet has active parameters, these are displayed automatically by the "Edit Parameter Values dialog". If defined, a default value is displayed in the text field next to each parameter.
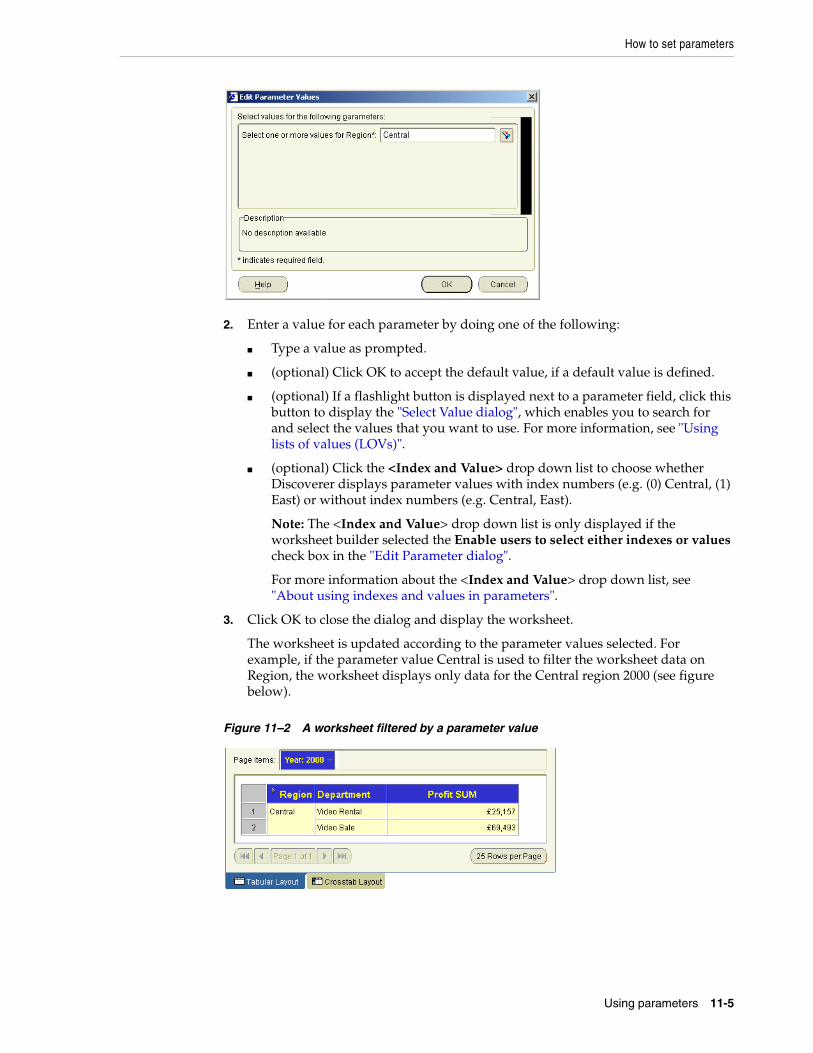
How to set parameters
Using parameters 11-5
2. Enter a value for each parameter by doing one of the following:
■ Type a value as prompted.
■ (optional) Click OK to accept the default value, if a default value is defined.
■ (optional) If a flashlight button is displayed next to a parameter field, click this button to display the "Select Value dialog", which enables you to search for and select the values that you want to use. For more information, see "Using lists of values (LOVs)".
■ (optional) Click the <Index and Value> drop down list to choose whether Discoverer displays parameter values with index numbers (e.g. (0) Central, (1) East) or without index numbers (e.g. Central, East).
Note: The <Index and Value> drop down list is only displayed if the worksheet builder selected the Enable users to select either indexes or values check box in the "Edit Parameter dialog".
For more information about the <Index and Value> drop down list, see "About using indexes and values in parameters".
3. Click OK to close the dialog and display the worksheet.
The worksheet is updated according to the parameter values selected. For example, if the parameter value Central is used to filter the worksheet data on Region, the worksheet displays only data for the Central region 2000 (see figure below).
Figure 11–2 A worksheet filtered by a parameter value
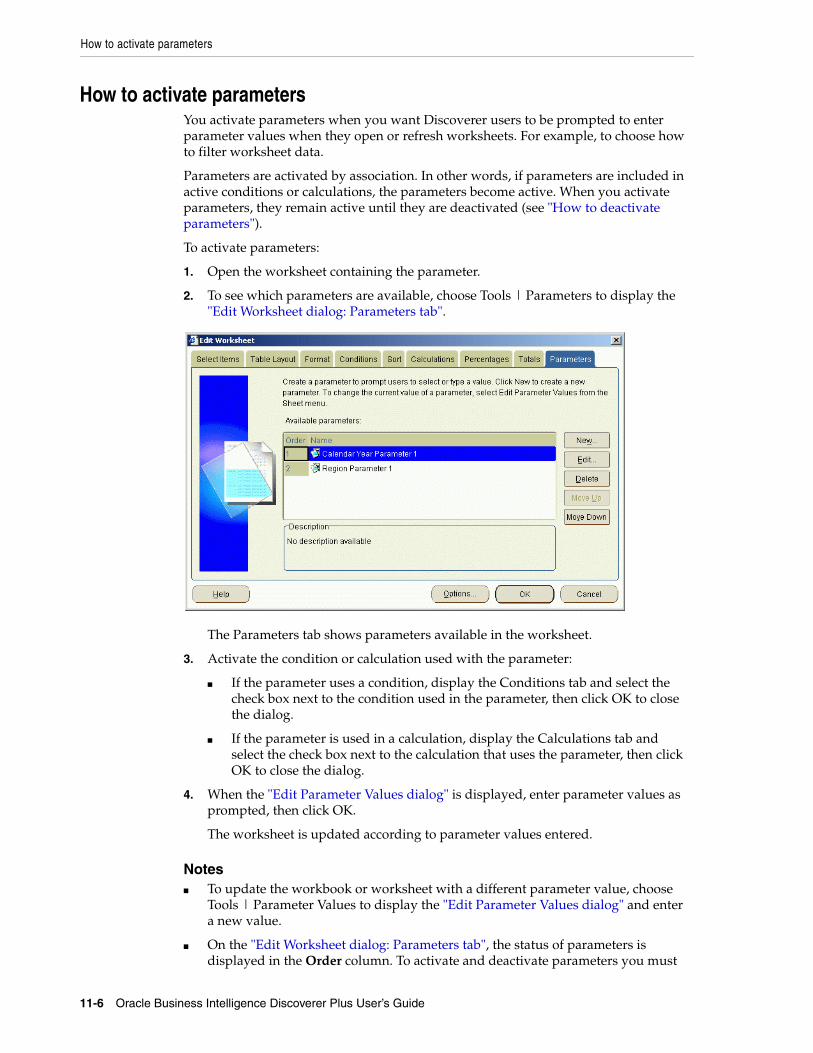
How to activate parameters
11-6 Oracle Business Intelligence Discoverer Plus User’s Guide
How to activate parametersYou activate parameters when you want Discoverer users to be prompted to enter parameter values when they open or refresh worksheets. For example, to choose how to filter worksheet data.
Parameters are activated by association. In other words, if parameters are included in active conditions or calculations, the parameters become active. When you activate parameters, they remain active until they are deactivated (see "How to deactivate parameters").
To activate parameters:
1. Open the worksheet containing the parameter.
2. To see which parameters are available, choose Tools | Parameters to display the "Edit Worksheet dialog: Parameters tab".
The Parameters tab shows parameters available in the worksheet.
3. Activate the condition or calculation used with the parameter:
■ If the parameter uses a condition, display the Conditions tab and select the check box next to the condition used in the parameter, then click OK to close the dialog.
■ If the parameter is used in a calculation, display the Calculations tab and select the check box next to the calculation that uses the parameter, then click OK to close the dialog.
4. When the "Edit Parameter Values dialog" is displayed, enter parameter values as prompted, then click OK.
The worksheet is updated according to parameter values entered.
Notes■ To update the workbook or worksheet with a different parameter value, choose
Tools | Parameter Values to display the "Edit Parameter Values dialog" and enter a new value.
■ On the "Edit Worksheet dialog: Parameters tab", the status of parameters is displayed in the Order column. To activate and deactivate parameters you must
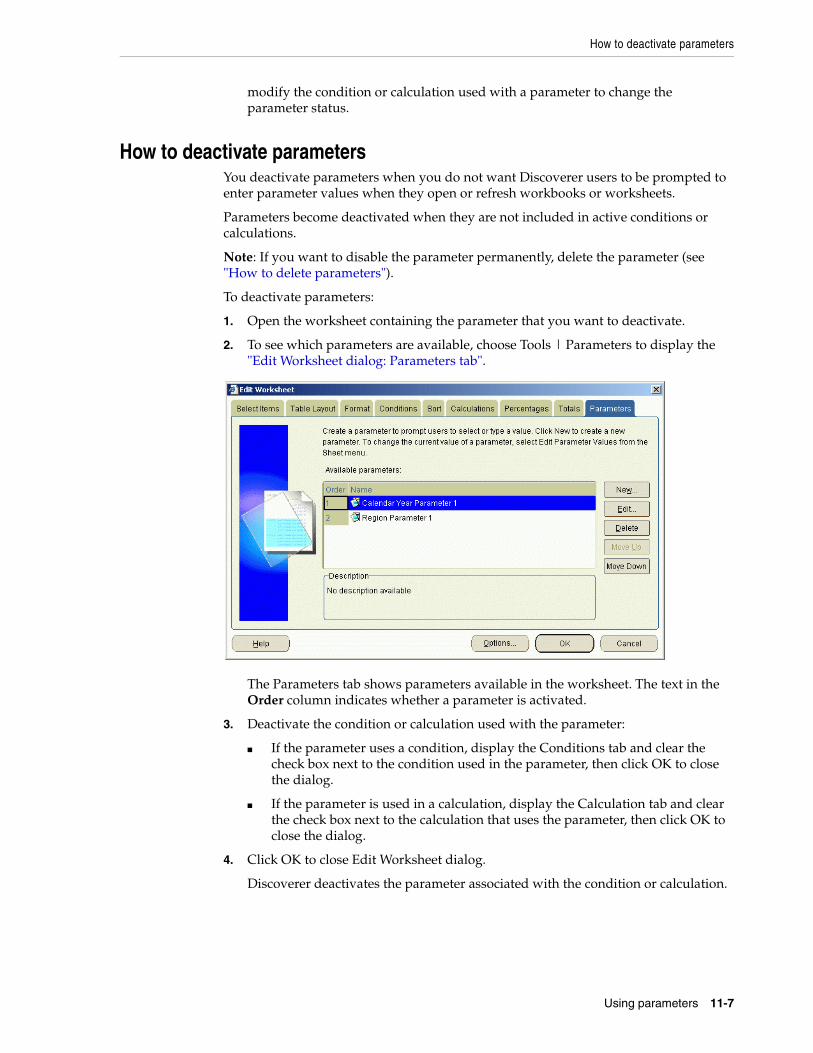
How to deactivate parameters
Using parameters 11-7
modify the condition or calculation used with a parameter to change the parameter status.
How to deactivate parametersYou deactivate parameters when you do not want Discoverer users to be prompted to enter parameter values when they open or refresh workbooks or worksheets.
Parameters become deactivated when they are not included in active conditions or calculations.
Note: If you want to disable the parameter permanently, delete the parameter (see "How to delete parameters").
To deactivate parameters:
1. Open the worksheet containing the parameter that you want to deactivate.
2. To see which parameters are available, choose Tools | Parameters to display the "Edit Worksheet dialog: Parameters tab".
The Parameters tab shows parameters available in the worksheet. The text in the Order column indicates whether a parameter is activated.
3. Deactivate the condition or calculation used with the parameter:
■ If the parameter uses a condition, display the Conditions tab and clear the check box next to the condition used in the parameter, then click OK to close the dialog.
■ If the parameter is used in a calculation, display the Calculation tab and clear the check box next to the calculation that uses the parameter, then click OK to close the dialog.
4. Click OK to close Edit Worksheet dialog.
Discoverer deactivates the parameter associated with the condition or calculation.

How to create parameters
11-8 Oracle Business Intelligence Discoverer Plus User’s Guide
Notes■ To update the workbook or worksheet with a different parameter value, choose
Tools | Parameter Values to display the "Edit Parameter Values dialog" and enter a new value.
■ On the "Edit Worksheet dialog: Parameters tab", the status of parameters is displayed in the Order column. To activate and deactivate parameters you must modify the condition or calculation used with a parameter to change the parameter status.
How to create parametersYou create parameters to enable Discoverer users to enter input values when a worksheet is opened or refreshed. For example, to provide dynamic input to a condition or calculation.
To create a parameter:
1. Open the Discoverer workbook containing the worksheet to which you want apply a parameter.
2. Choose Tools | Parameters to display the "Edit Worksheet dialog: Parameters tab".
3. Click New to display the "New Parameter dialog".
4. Enter a parameter name into the What do you want to name this Parameter? field. If you do not enter a name, Discoverer creates a default Parameter name for you.
5. Choose the item on which to base the parameter from the Which item do you want to base your parameter on? list, as follows:
■ If you want the parameter to use a condition to filter the worksheet, select the item that you want to filter on. Make sure that the Create condition with operator check box is selected so that a condition is automatically created to filter the worksheet using the item selected. For example, to filter a worksheet on calendar year, you might choose Calendar Year here.
How to create parameters
Using parameters 11-9
■ If you want to use the parameter to provide input to a calculation, select the <NONE> option. For example, to enable worksheet users to choose how much percentage increase they want to display on a worksheet (for more information, see "About using parameters to collect dynamic user input".
6. Use the Create condition with operator check box to specify whether Discoverer creates a condition to use with this parameter as follows:
■ Select the Create condition with operator check box to create a condition based on the item that you selected for this parameter. Select an operator to use with the condition from the drop down list (e.g. =, <, >).
When a parameter uses a condition it enables you to filter worksheets according to parameter values that you enter when you run the worksheet. For example, if you create a parameter based on year called Choose Year and select the > operator, a condition is created: Year > :Choose Year. The :Choose Year value is the value entered by the worksheet user.
■ Clear the Create condition with operator check box not to create a condition to use with this parameter.
7. (optional) Enter an instruction or question into the What prompt do you want to show for this parameter? field.
Discoverer displays this prompt to users when they open or refresh the worksheet, and tells them what value to enter.
8. (optional) Enter a brief description into the What description do you want to show for this parameter? field.
Discoverer displays this text on the Edit Parameter Values dialog to help users decide what parameter value to enter.
9. (optional) Click one of the following radio buttons:
Click the Allow only one set of parameter values for all worksheets radio button to apply the same set of parameter values to all worksheets in the workbook.
Click the Allow different parameter values for each worksheet radio button to enable different parameter values to be specified for each worksheet.
10. (optional) Select the Require users to enter a value check box to make worksheet users enter a parameter value.
When you select this check box, users must enter a value for the parameter to display the worksheet.
11. (optional) Select the Enable users to select multiple values check box to enable worksheet users to select multiple parameter values for the parameter.
For example, if a parameter is used to filter a worksheet on year, a user might want to look at data for 2001 and 2002.
12. (optional) Select the Enable users to select either indexes or values check box to enable users to choose whether they want Discoverer to display parameter values with index numbers (e.g. (1) January, (2) February) or without index numbers (e.g. January, February) in the "Edit Parameter Values dialog".
Note: The Enable users to select either indexes or values check box is only displayed if the item that is used as a parameter has been set up by the Discoverer Manager to reference an indexed item.
For more information about the <Index and Value> drop down list, see the "About using indexes and values in parameters".
How to delete parameters
11-10 Oracle Business Intelligence Discoverer Plus User’s Guide
13. (optional) If required, enter a default value in the What default value do you want to give this Parameter? field.
Here, you can do the following:
■ Select either Index or Value from the drop down list (only displayed if you selected the Enable users to select either indexes or values check box) to display parameter values with or without index numbers.
■ Enter a default value directly into the <values> field.
■ If a list of values is available for this parameter, click the drop down arrow and select a parameter value from the list.
If the list of values in the drop down list is too long to display on screen, the "Select Value dialog" or "Select Values dialog" is displayed. These dialogs enable you to search for and select the values that you want to use. For more information, see "Using lists of values (LOVs)".
14. (optional) Click one of the following radio buttons:
Click the Show all available values radio button to display all parameter values to the user.
Click the Filter the list of values based on the selected conditions radio button to activate a list of conditions that can be used to filter the parameter values displayed to the user.
Note: You might use this setting if you have very long lists of parameter values, and you want to improve performance by reducing the number of values that are displayed to the user.
Select a check box for each condition that you want to use to filter the list of parameter values displayed to the user (only available if you clicked the Filter the list of values based on the selected conditions radio button).
For more information, see "About filtering lists of parameter values based on selected conditions".
15. Click OK to save the details and display the "Edit Worksheet dialog".
If you created a parameter to filter the worksheet, the check box next to the parameter is selected (i.e. parameter is active).
16. Click OK to close the Edit Worksheet dialog and return to the worksheet.
If the new parameter is active, Discoverer displays the "Edit Parameter Values dialog", which enables you to specify parameter values for active parameters. The worksheet is updated according to parameter values entered (for more information, see "How to set parameters").
Notes■ You can also create a parameter in the following ways:
– Select the New Parameter option on the Standard toolbar to display the "New Parameter dialog". For more information about the Standard toolbar, see "About the Standard toolbar".
How to delete parametersYou delete a parameter when you no longer want to use it, and want to remove it permanently from the worksheet.
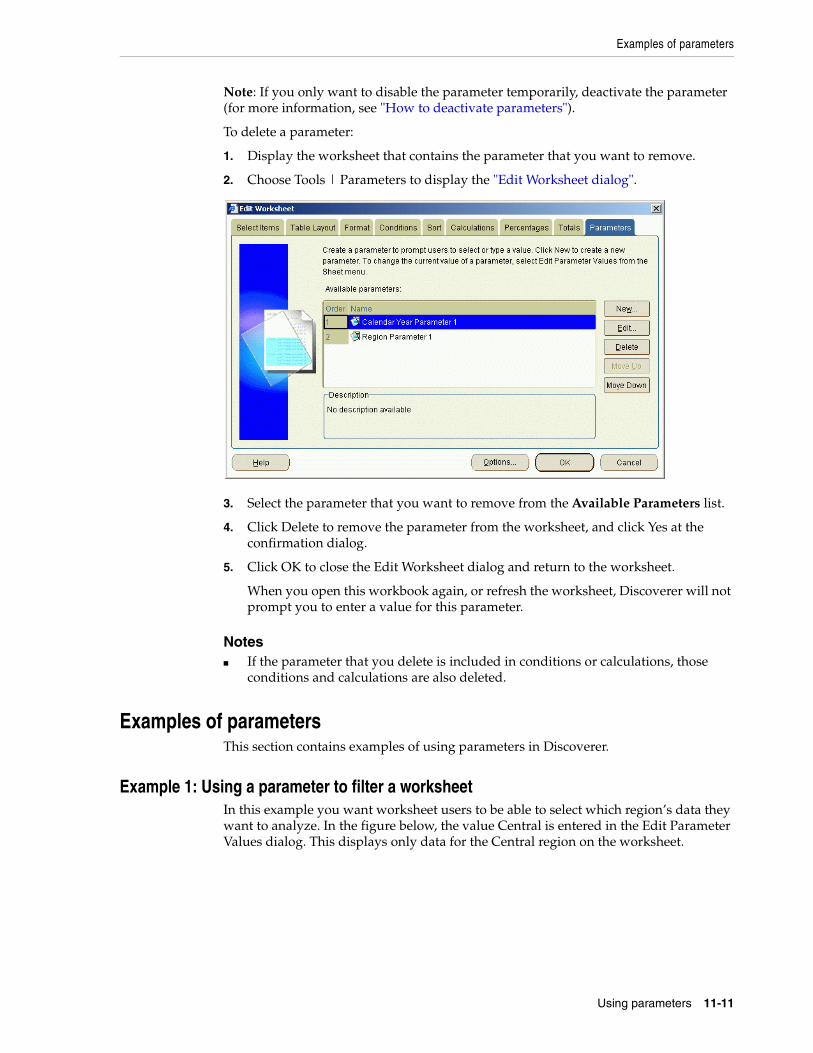
Examples of parameters
Using parameters 11-11
Note: If you only want to disable the parameter temporarily, deactivate the parameter (for more information, see "How to deactivate parameters").
To delete a parameter:
1. Display the worksheet that contains the parameter that you want to remove.
2. Choose Tools | Parameters to display the "Edit Worksheet dialog".
3. Select the parameter that you want to remove from the Available Parameters list.
4. Click Delete to remove the parameter from the worksheet, and click Yes at the confirmation dialog.
5. Click OK to close the Edit Worksheet dialog and return to the worksheet.
When you open this workbook again, or refresh the worksheet, Discoverer will not prompt you to enter a value for this parameter.
Notes■ If the parameter that you delete is included in conditions or calculations, those
conditions and calculations are also deleted.
Examples of parametersThis section contains examples of using parameters in Discoverer.
Example 1: Using a parameter to filter a worksheetIn this example you want worksheet users to be able to select which region’s data they want to analyze. In the figure below, the value Central is entered in the Edit Parameter Values dialog. This displays only data for the Central region on the worksheet.
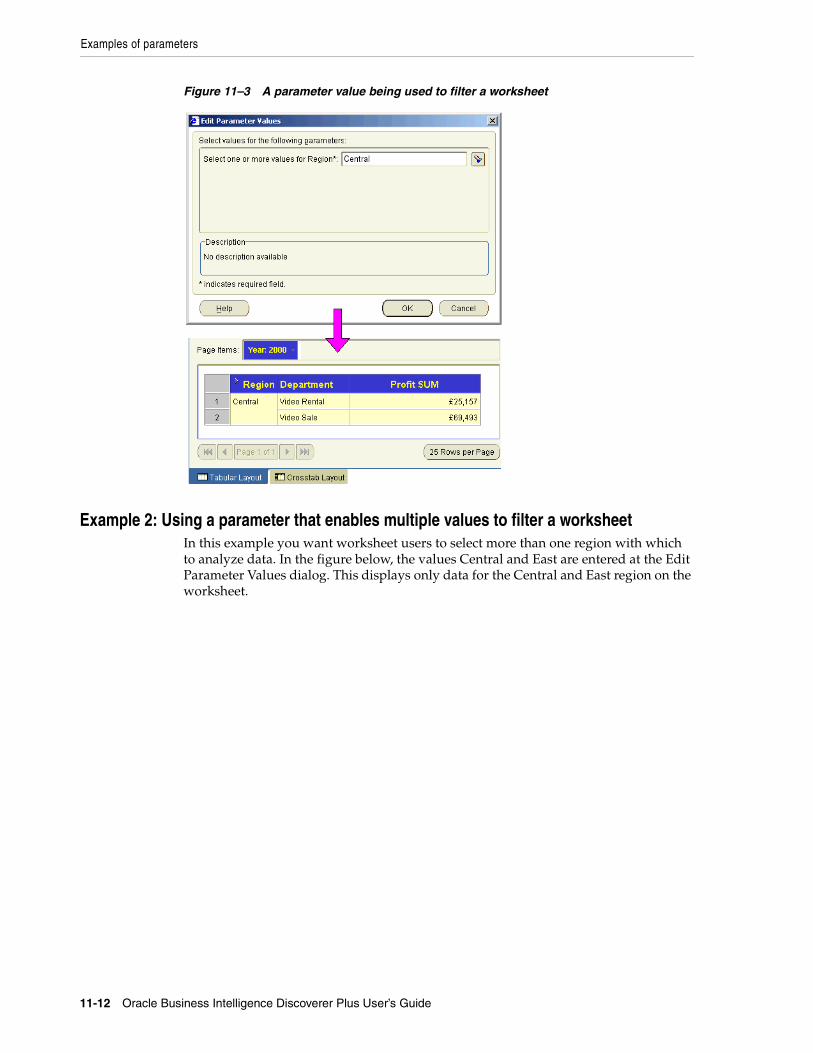
Examples of parameters
11-12 Oracle Business Intelligence Discoverer Plus User’s Guide
Figure 11–3 A parameter value being used to filter a worksheet
Example 2: Using a parameter that enables multiple values to filter a worksheet In this example you want worksheet users to select more than one region with which to analyze data. In the figure below, the values Central and East are entered at the Edit Parameter Values dialog. This displays only data for the Central and East region on the worksheet.
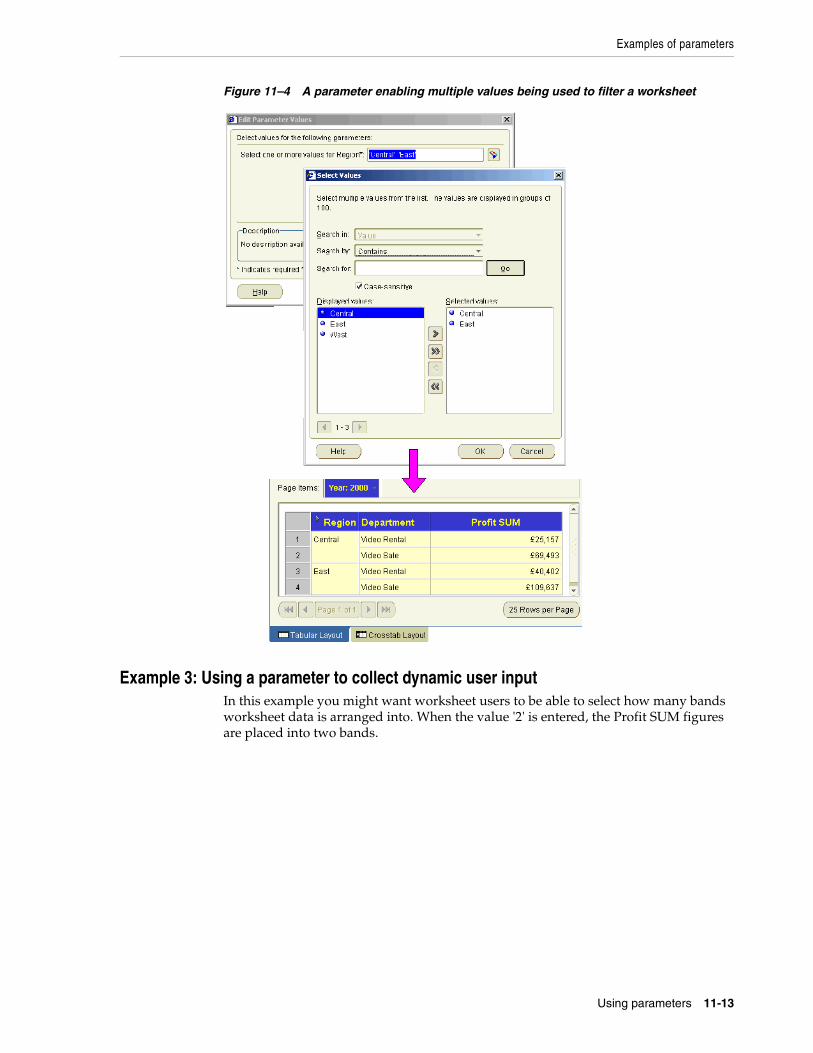
Examples of parameters
Using parameters 11-13
Figure 11–4 A parameter enabling multiple values being used to filter a worksheet
Example 3: Using a parameter to collect dynamic user inputIn this example you might want worksheet users to be able to select how many bands worksheet data is arranged into. When the value '2' is entered, the Profit SUM figures are placed into two bands.
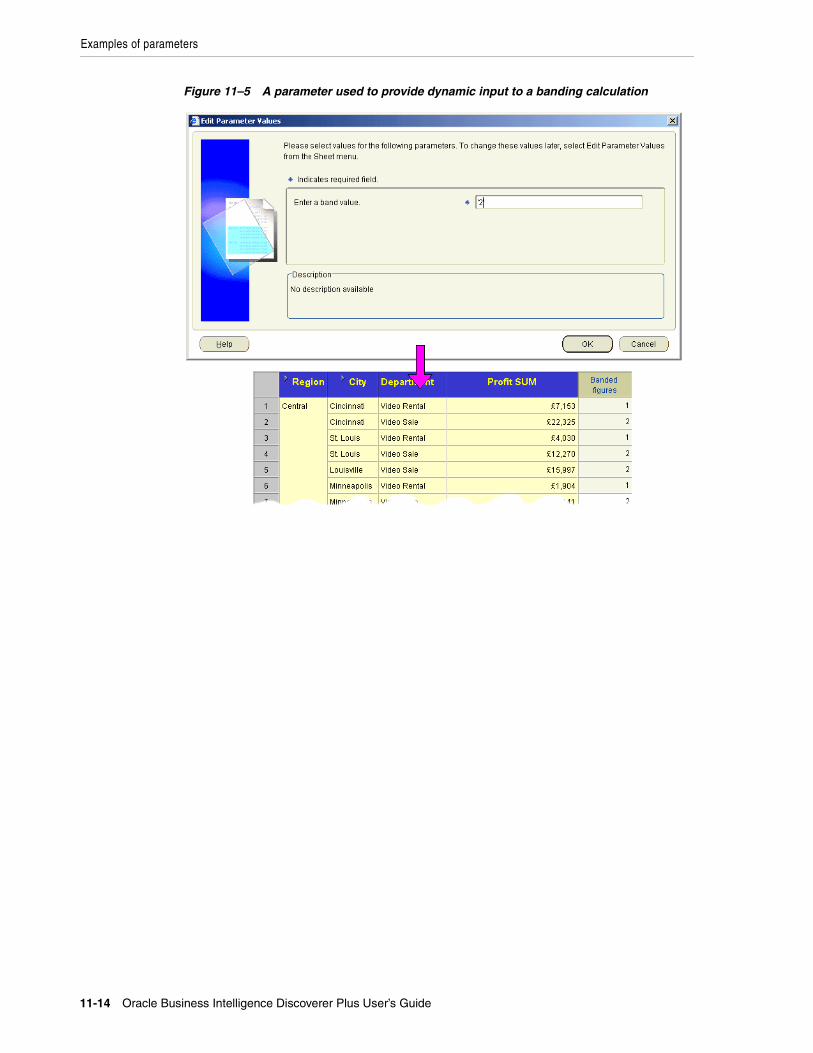
Examples of parameters
11-14 Oracle Business Intelligence Discoverer Plus User’s Guide
Figure 11–5 A parameter used to provide dynamic input to a banding calculation
Using conditional formatting 12-1
12Using conditional formatting
This chapter explains how to use Discoverer Plus Relational’s conditional formatting to answer typical business questions, and contains the following topics:
■ "What is conditional formatting?"
■ "About managing conditional formatting"
■ "Notes on using conditional formats and stoplight formats"
■ "About managing conditional formatting"
■ "How to activate and deactivate conditional formats and stoplight formats"
■ "How to create conditional formats"
■ "How to create stoplight formats"
■ "How to edit conditional formats and stoplight formats"
■ "How to delete conditional formats and stoplight formats"
■ "How to change the color of stoplight formats"
■ "Examples of conditional formatting"
What is conditional formatting?Conditional formatting is the use of conditional formats and stoplight formats or (or traffic light formats) to highlight worksheet values.
What is a conditional format?A conditional format enables you to highlight worksheet values that meet a specific condition. For example, you might want to highlight profit values greater than 30,000.
Note: In Discoverer Desktop, conditional formats are known as exceptions.
In the example below, a conditional format highlights Profit SUM values greater than 30,000. The Profit SUM figures for Cincinnati and Louisville are displayed with a blue background because they are greater than 30,000.
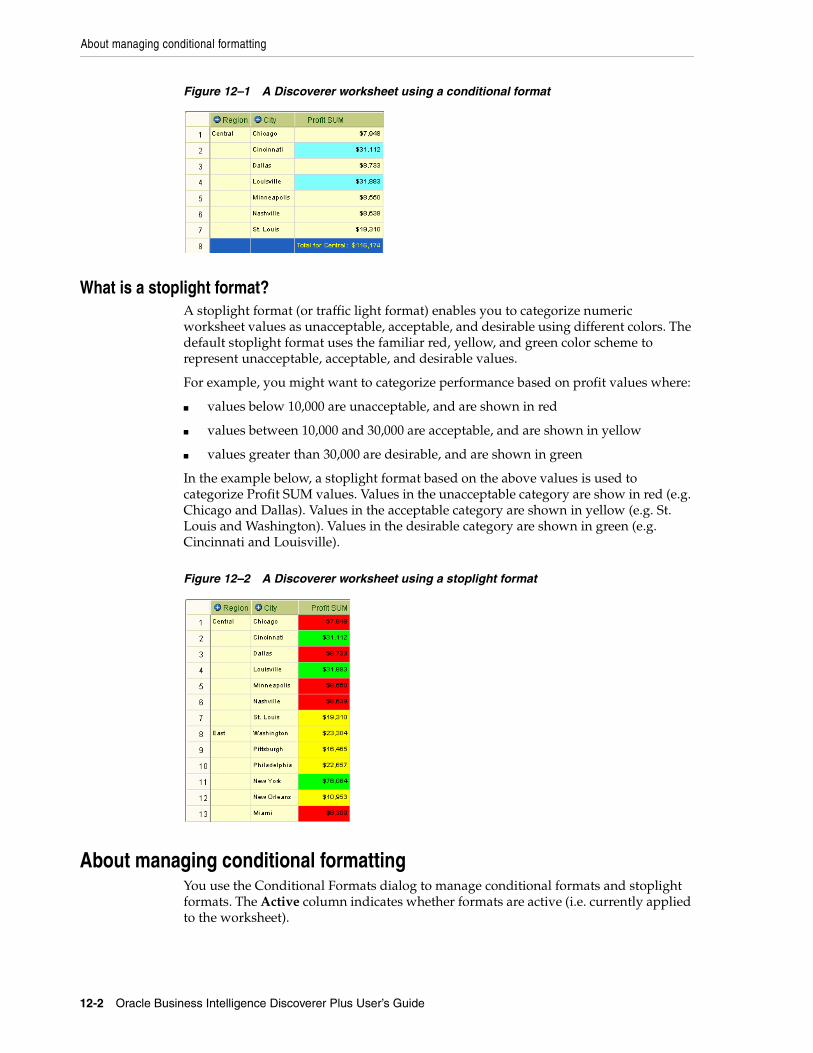
About managing conditional formatting
12-2 Oracle Business Intelligence Discoverer Plus User’s Guide
Figure 12–1 A Discoverer worksheet using a conditional format
What is a stoplight format?A stoplight format (or traffic light format) enables you to categorize numeric worksheet values as unacceptable, acceptable, and desirable using different colors. The default stoplight format uses the familiar red, yellow, and green color scheme to represent unacceptable, acceptable, and desirable values.
For example, you might want to categorize performance based on profit values where:
■ values below 10,000 are unacceptable, and are shown in red
■ values between 10,000 and 30,000 are acceptable, and are shown in yellow
■ values greater than 30,000 are desirable, and are shown in green
In the example below, a stoplight format based on the above values is used to categorize Profit SUM values. Values in the unacceptable category are show in red (e.g. Chicago and Dallas). Values in the acceptable category are shown in yellow (e.g. St. Louis and Washington). Values in the desirable category are shown in green (e.g. Cincinnati and Louisville).
Figure 12–2 A Discoverer worksheet using a stoplight format
About managing conditional formattingYou use the Conditional Formats dialog to manage conditional formats and stoplight formats. The Active column indicates whether formats are active (i.e. currently applied to the worksheet).
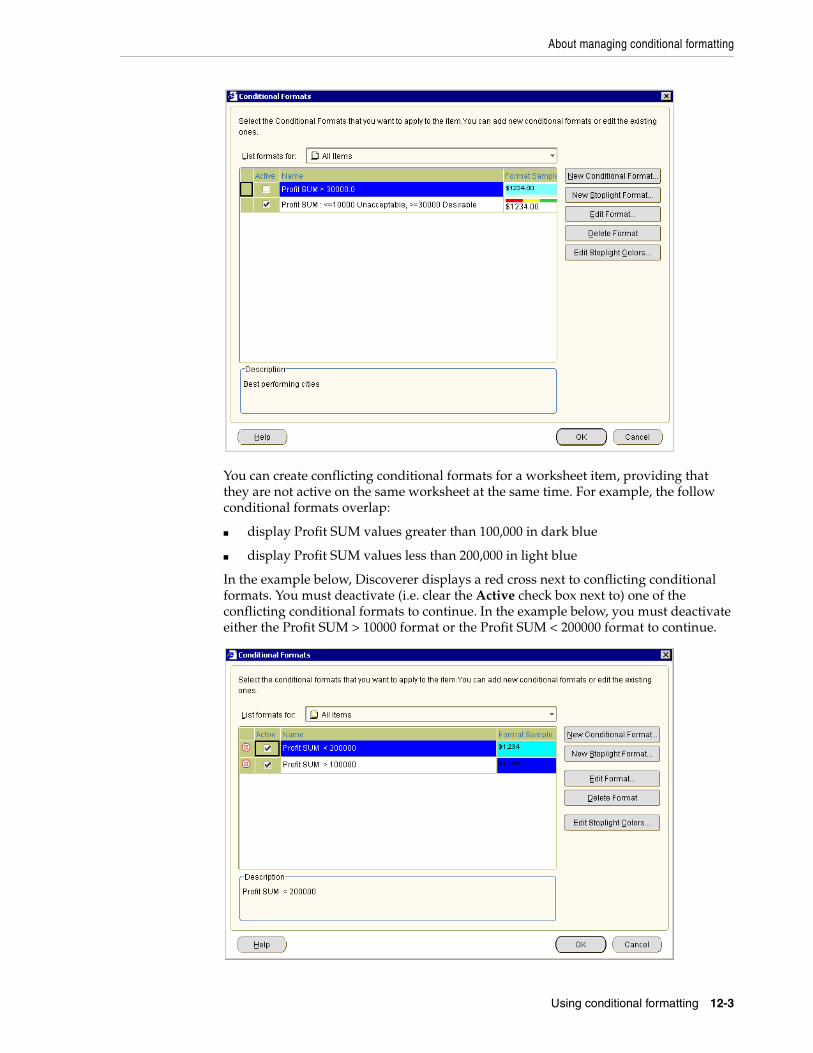
About managing conditional formatting
Using conditional formatting 12-3
You can create conflicting conditional formats for a worksheet item, providing that they are not active on the same worksheet at the same time. For example, the follow conditional formats overlap:
■ display Profit SUM values greater than 100,000 in dark blue
■ display Profit SUM values less than 200,000 in light blue
In the example below, Discoverer displays a red cross next to conflicting conditional formats. You must deactivate (i.e. clear the Active check box next to) one of the conflicting conditional formats to continue. In the example below, you must deactivate either the Profit SUM > 10000 format or the Profit SUM < 200000 format to continue.
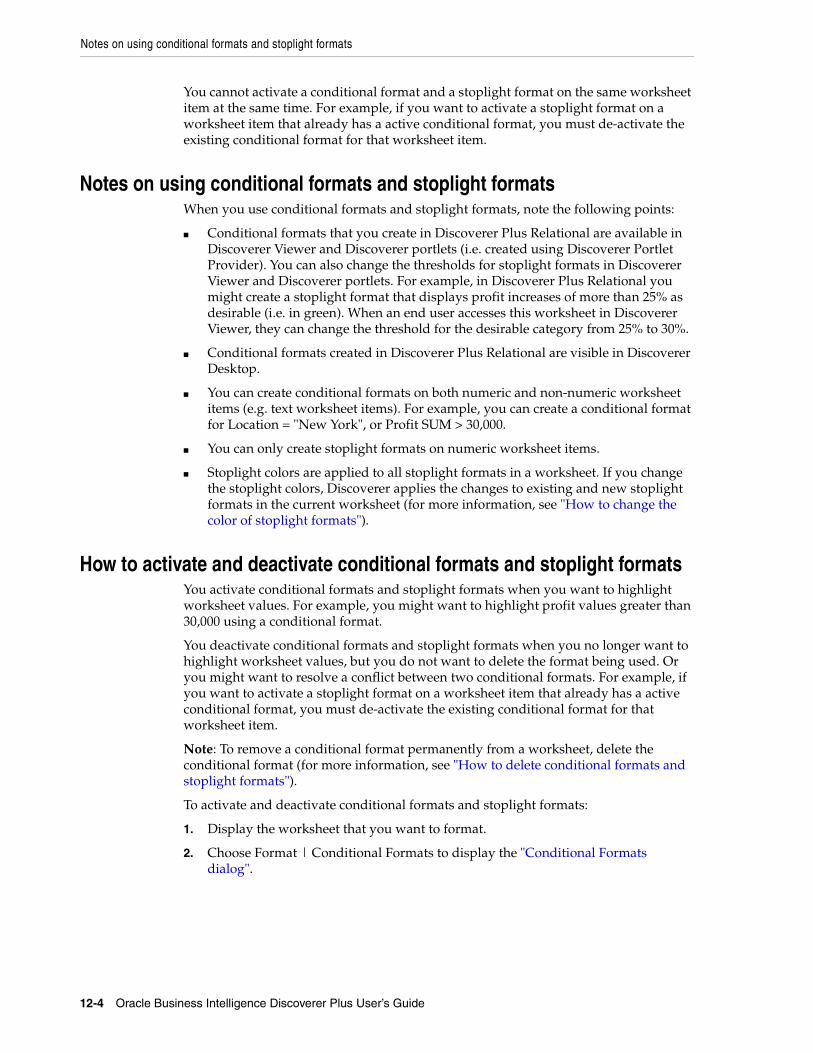
Notes on using conditional formats and stoplight formats
12-4 Oracle Business Intelligence Discoverer Plus User’s Guide
You cannot activate a conditional format and a stoplight format on the same worksheet item at the same time. For example, if you want to activate a stoplight format on a worksheet item that already has a active conditional format, you must de-activate the existing conditional format for that worksheet item.
Notes on using conditional formats and stoplight formatsWhen you use conditional formats and stoplight formats, note the following points:
■ Conditional formats that you create in Discoverer Plus Relational are available in Discoverer Viewer and Discoverer portlets (i.e. created using Discoverer Portlet Provider). You can also change the thresholds for stoplight formats in Discoverer Viewer and Discoverer portlets. For example, in Discoverer Plus Relational you might create a stoplight format that displays profit increases of more than 25% as desirable (i.e. in green). When an end user accesses this worksheet in Discoverer Viewer, they can change the threshold for the desirable category from 25% to 30%.
■ Conditional formats created in Discoverer Plus Relational are visible in Discoverer Desktop.
■ You can create conditional formats on both numeric and non-numeric worksheet items (e.g. text worksheet items). For example, you can create a conditional format for Location = "New York", or Profit SUM > 30,000.
■ You can only create stoplight formats on numeric worksheet items.
■ Stoplight colors are applied to all stoplight formats in a worksheet. If you change the stoplight colors, Discoverer applies the changes to existing and new stoplight formats in the current worksheet (for more information, see "How to change the color of stoplight formats").
How to activate and deactivate conditional formats and stoplight formatsYou activate conditional formats and stoplight formats when you want to highlight worksheet values. For example, you might want to highlight profit values greater than 30,000 using a conditional format.
You deactivate conditional formats and stoplight formats when you no longer want to highlight worksheet values, but you do not want to delete the format being used. Or you might want to resolve a conflict between two conditional formats. For example, if you want to activate a stoplight format on a worksheet item that already has a active conditional format, you must de-activate the existing conditional format for that worksheet item.
Note: To remove a conditional format permanently from a worksheet, delete the conditional format (for more information, see "How to delete conditional formats and stoplight formats").
To activate and deactivate conditional formats and stoplight formats:
1. Display the worksheet that you want to format.
2. Choose Format | Conditional Formats to display the "Conditional Formats dialog".
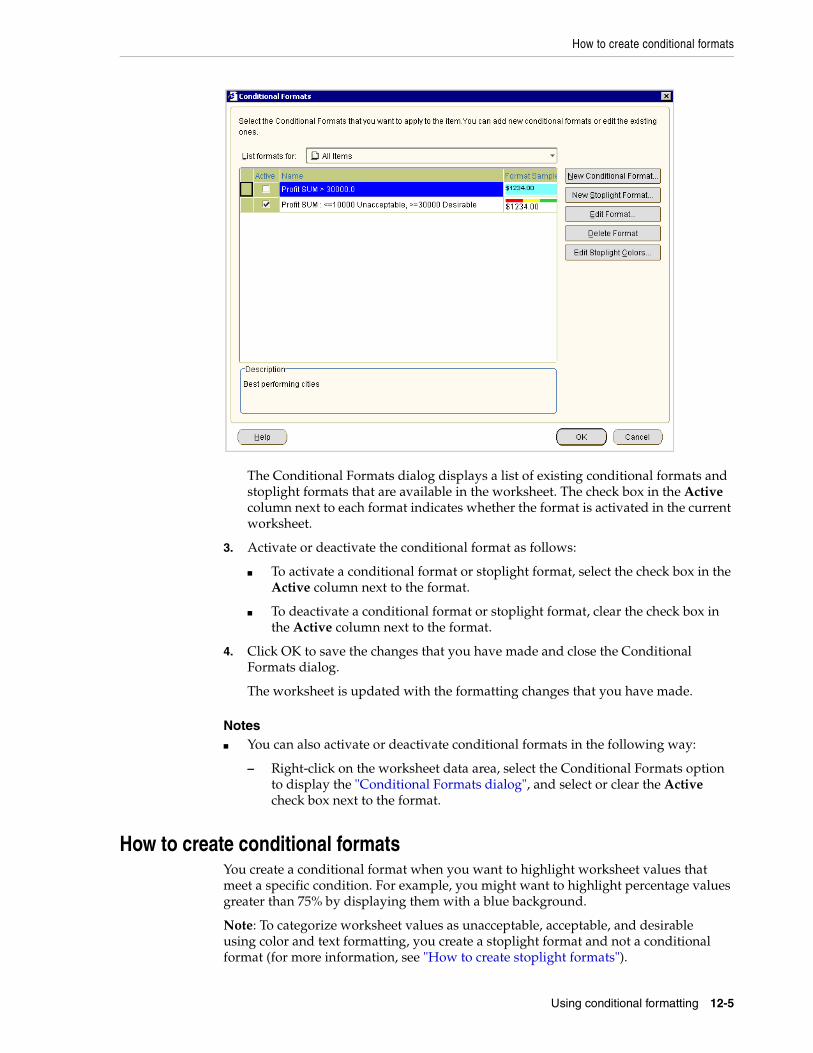
How to create conditional formats
Using conditional formatting 12-5
The Conditional Formats dialog displays a list of existing conditional formats and stoplight formats that are available in the worksheet. The check box in the Active column next to each format indicates whether the format is activated in the current worksheet.
3. Activate or deactivate the conditional format as follows:
■ To activate a conditional format or stoplight format, select the check box in the Active column next to the format.
■ To deactivate a conditional format or stoplight format, clear the check box in the Active column next to the format.
4. Click OK to save the changes that you have made and close the Conditional Formats dialog.
The worksheet is updated with the formatting changes that you have made.
Notes■ You can also activate or deactivate conditional formats in the following way:
– Right-click on the worksheet data area, select the Conditional Formats option to display the "Conditional Formats dialog", and select or clear the Active check box next to the format.
How to create conditional formatsYou create a conditional format when you want to highlight worksheet values that meet a specific condition. For example, you might want to highlight percentage values greater than 75% by displaying them with a blue background.
Note: To categorize worksheet values as unacceptable, acceptable, and desirable using color and text formatting, you create a stoplight format and not a conditional format (for more information, see "How to create stoplight formats").

How to create conditional formats
12-6 Oracle Business Intelligence Discoverer Plus User’s Guide
To create a conditional format:
1. Display the worksheet that you want to format.
2. (optional) Select the worksheet item that you want to format by clicking on the worksheet column or row.
3. Choose Format | Conditional Formats to display the "Conditional Formats dialog".
4. Click New Conditional Format to display the "New Conditional Format dialog".
How to create stoplight formats
Using conditional formatting 12-7
Note: If you first selected a worksheet item in step 2, the worksheet item is selected by default in the Item field.
5. Specify how you want to highlight worksheet values, as follows:
■ (Optional) Use the What would you like to name your Conditional Format? field to create a user-friendly name for the format that will be used throughout Discoverer.
■ Use the When should the Conditional Format be applied? fields (i.e. Item, Condition, and Value) to create the condition that you want to apply.
Hint: Use the Item field to select the worksheet item you want to format. Use the Format field to select the conditional operator (e.g. = for equals, > for greater than, < for less than) you want to use. Use the Value field to enter the value that you want to match against. For example, choose Profit SUM > 30,000 to highlight Profit SUM values that are greater than 30,000.
■ Click Format to display the "Format Data dialog: Format tab" dialog, which enables you to change the color of and text style for the worksheet value specified in the Item field.
6. Click OK to save changes that you have made and close the New Conditional Format dialog.
7. Click OK to close the Conditional Formats dialog.
The worksheet is updated with the formatting changes that you have made.
Notes■ You can also create a conditional format in the following ways:
– Select the Conditional Format option on the Formatting toolbar to display the "New Conditional Format dialog". For more information about toolbars, see "About the Formatting toolbar".
– Right-click on the worksheet data area, and select the Conditional Format option to display the "Conditional Formats dialog", and click New Conditional Format.
How to create stoplight formatsYou create a stoplight format when you want to categorize numeric worksheet values as unacceptable, acceptable, and desirable using text and color formatting. For example, you might want to display low cost values in green, medium cost values in yellow, and high cost values in red.
To create a stoplight format:
1. Display the worksheet that you want to format.
2. (optional) Select the worksheet item that you want to format by clicking on the worksheet column or row.
3. Choose Format | Conditional Formats to display the "Conditional Formats dialog".
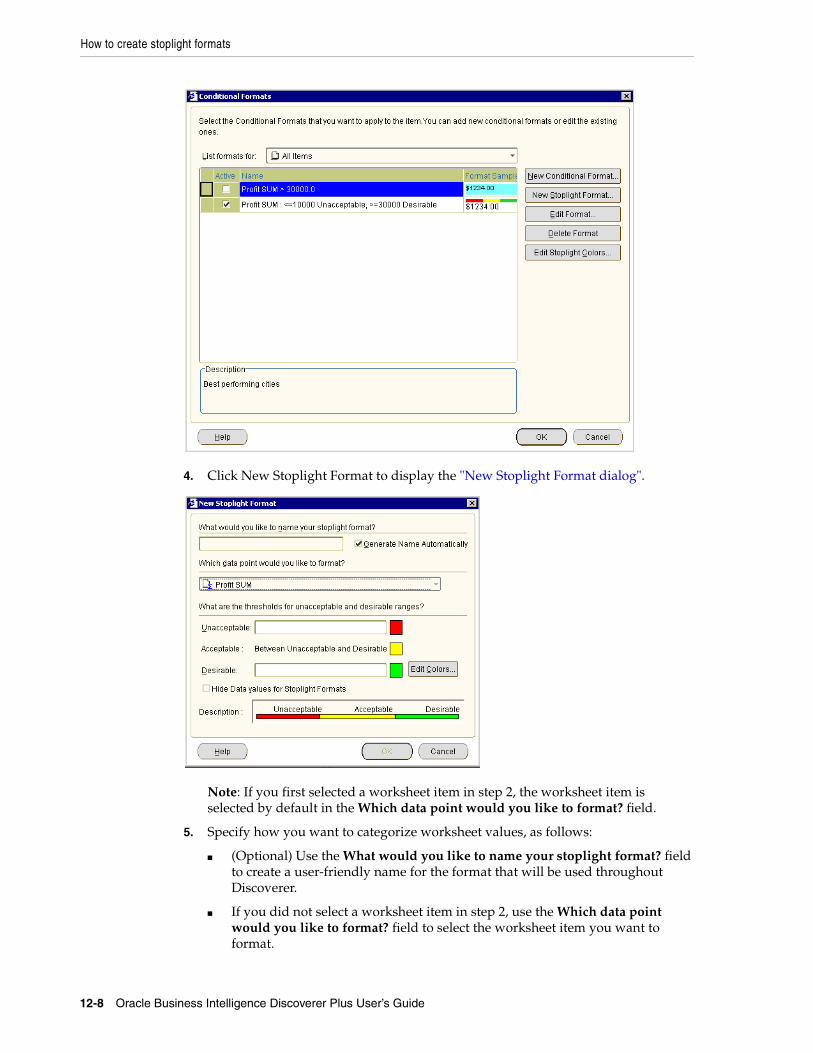
How to create stoplight formats
12-8 Oracle Business Intelligence Discoverer Plus User’s Guide
4. Click New Stoplight Format to display the "New Stoplight Format dialog".
Note: If you first selected a worksheet item in step 2, the worksheet item is selected by default in the Which data point would you like to format? field.
5. Specify how you want to categorize worksheet values, as follows:
■ (Optional) Use the What would you like to name your stoplight format? field to create a user-friendly name for the format that will be used throughout Discoverer.
■ If you did not select a worksheet item in step 2, use the Which data point would you like to format? field to select the worksheet item you want to format.
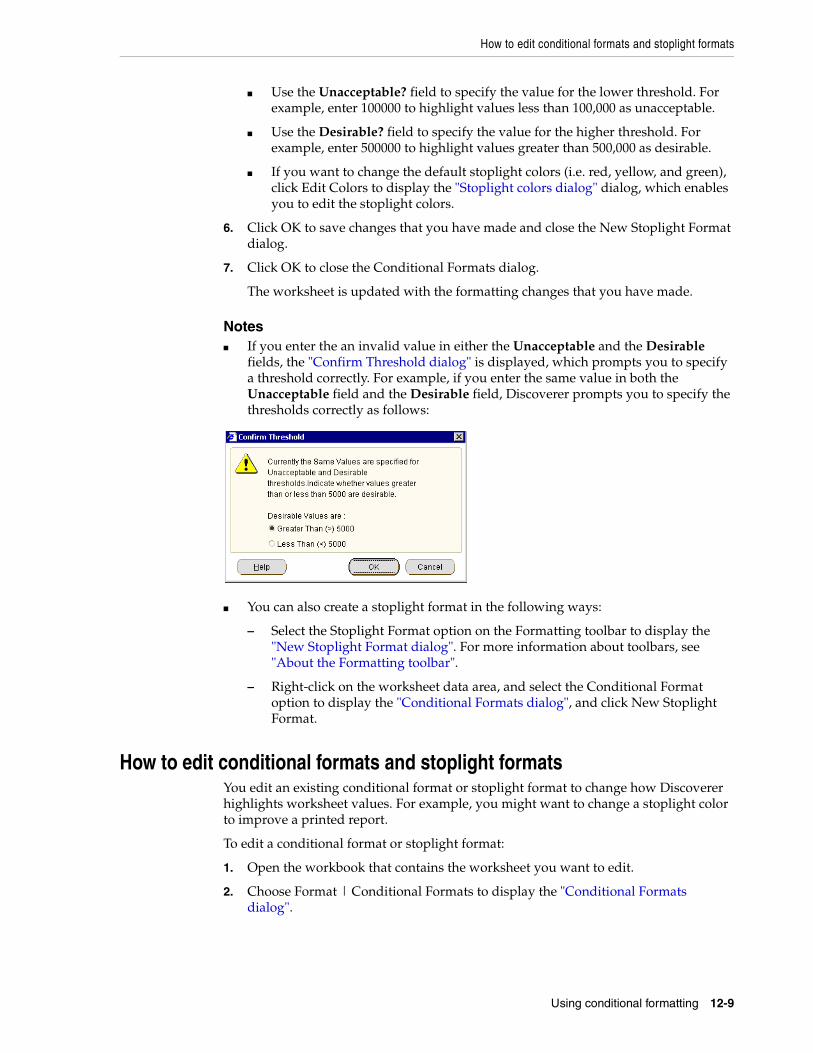
How to edit conditional formats and stoplight formats
Using conditional formatting 12-9
■ Use the Unacceptable? field to specify the value for the lower threshold. For example, enter 100000 to highlight values less than 100,000 as unacceptable.
■ Use the Desirable? field to specify the value for the higher threshold. For example, enter 500000 to highlight values greater than 500,000 as desirable.
■ If you want to change the default stoplight colors (i.e. red, yellow, and green), click Edit Colors to display the "Stoplight colors dialog" dialog, which enables you to edit the stoplight colors.
6. Click OK to save changes that you have made and close the New Stoplight Format dialog.
7. Click OK to close the Conditional Formats dialog.
The worksheet is updated with the formatting changes that you have made.
Notes■ If you enter the an invalid value in either the Unacceptable and the Desirable
fields, the "Confirm Threshold dialog" is displayed, which prompts you to specify a threshold correctly. For example, if you enter the same value in both the Unacceptable field and the Desirable field, Discoverer prompts you to specify the thresholds correctly as follows:
■ You can also create a stoplight format in the following ways:
– Select the Stoplight Format option on the Formatting toolbar to display the "New Stoplight Format dialog". For more information about toolbars, see "About the Formatting toolbar".
– Right-click on the worksheet data area, and select the Conditional Format option to display the "Conditional Formats dialog", and click New Stoplight Format.
How to edit conditional formats and stoplight formatsYou edit an existing conditional format or stoplight format to change how Discoverer highlights worksheet values. For example, you might want to change a stoplight color to improve a printed report.
To edit a conditional format or stoplight format:
1. Open the workbook that contains the worksheet you want to edit.
2. Choose Format | Conditional Formats to display the "Conditional Formats dialog".
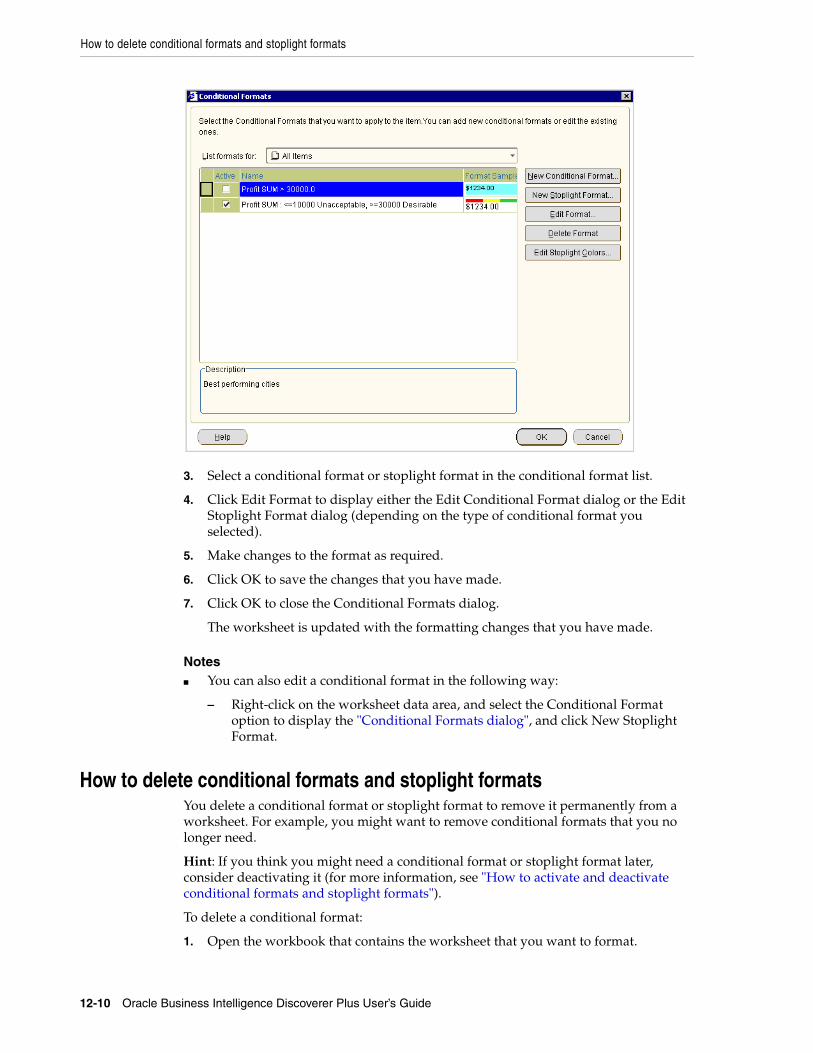
How to delete conditional formats and stoplight formats
12-10 Oracle Business Intelligence Discoverer Plus User’s Guide
3. Select a conditional format or stoplight format in the conditional format list.
4. Click Edit Format to display either the Edit Conditional Format dialog or the Edit Stoplight Format dialog (depending on the type of conditional format you selected).
5. Make changes to the format as required.
6. Click OK to save the changes that you have made.
7. Click OK to close the Conditional Formats dialog.
The worksheet is updated with the formatting changes that you have made.
Notes■ You can also edit a conditional format in the following way:
– Right-click on the worksheet data area, and select the Conditional Format option to display the "Conditional Formats dialog", and click New Stoplight Format.
How to delete conditional formats and stoplight formatsYou delete a conditional format or stoplight format to remove it permanently from a worksheet. For example, you might want to remove conditional formats that you no longer need.
Hint: If you think you might need a conditional format or stoplight format later, consider deactivating it (for more information, see "How to activate and deactivate conditional formats and stoplight formats").
To delete a conditional format:
1. Open the workbook that contains the worksheet that you want to format.
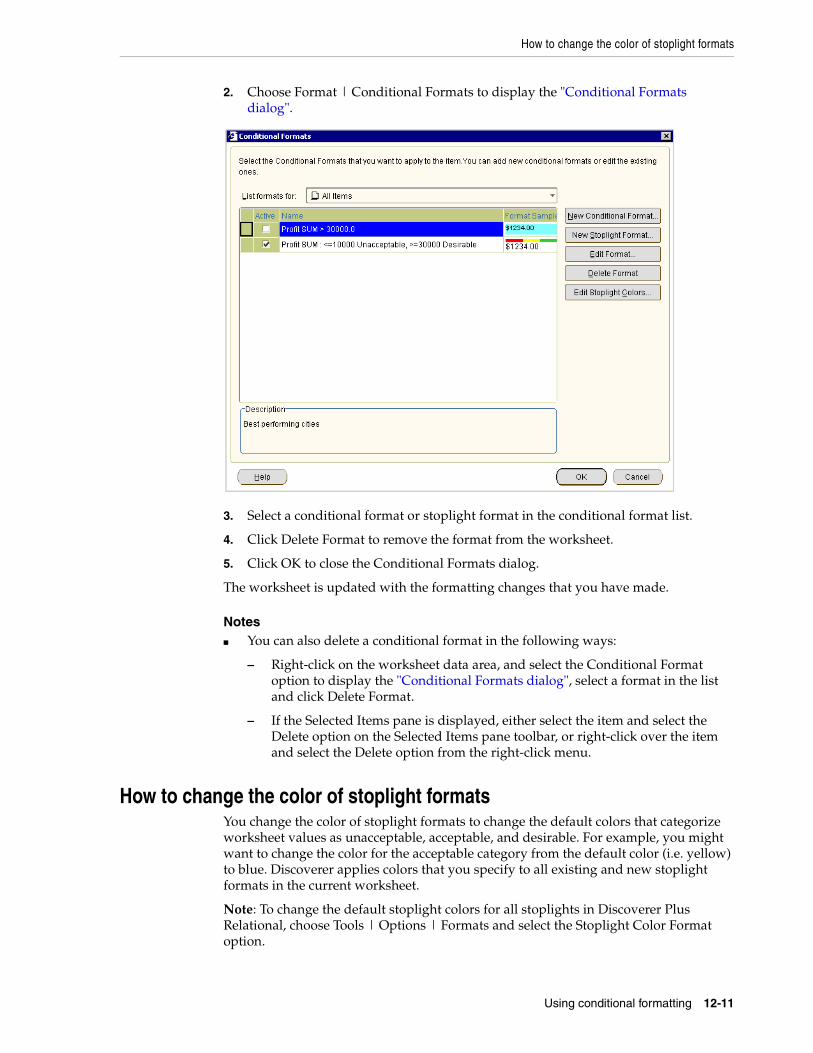
How to change the color of stoplight formats
Using conditional formatting 12-11
2. Choose Format | Conditional Formats to display the "Conditional Formats dialog".
3. Select a conditional format or stoplight format in the conditional format list.
4. Click Delete Format to remove the format from the worksheet.
5. Click OK to close the Conditional Formats dialog.
The worksheet is updated with the formatting changes that you have made.
Notes■ You can also delete a conditional format in the following ways:
– Right-click on the worksheet data area, and select the Conditional Format option to display the "Conditional Formats dialog", select a format in the list and click Delete Format.
– If the Selected Items pane is displayed, either select the item and select the Delete option on the Selected Items pane toolbar, or right-click over the item and select the Delete option from the right-click menu.
How to change the color of stoplight formatsYou change the color of stoplight formats to change the default colors that categorize worksheet values as unacceptable, acceptable, and desirable. For example, you might want to change the color for the acceptable category from the default color (i.e. yellow) to blue. Discoverer applies colors that you specify to all existing and new stoplight formats in the current worksheet.
Note: To change the default stoplight colors for all stoplights in Discoverer Plus Relational, choose Tools | Options | Formats and select the Stoplight Color Format option.
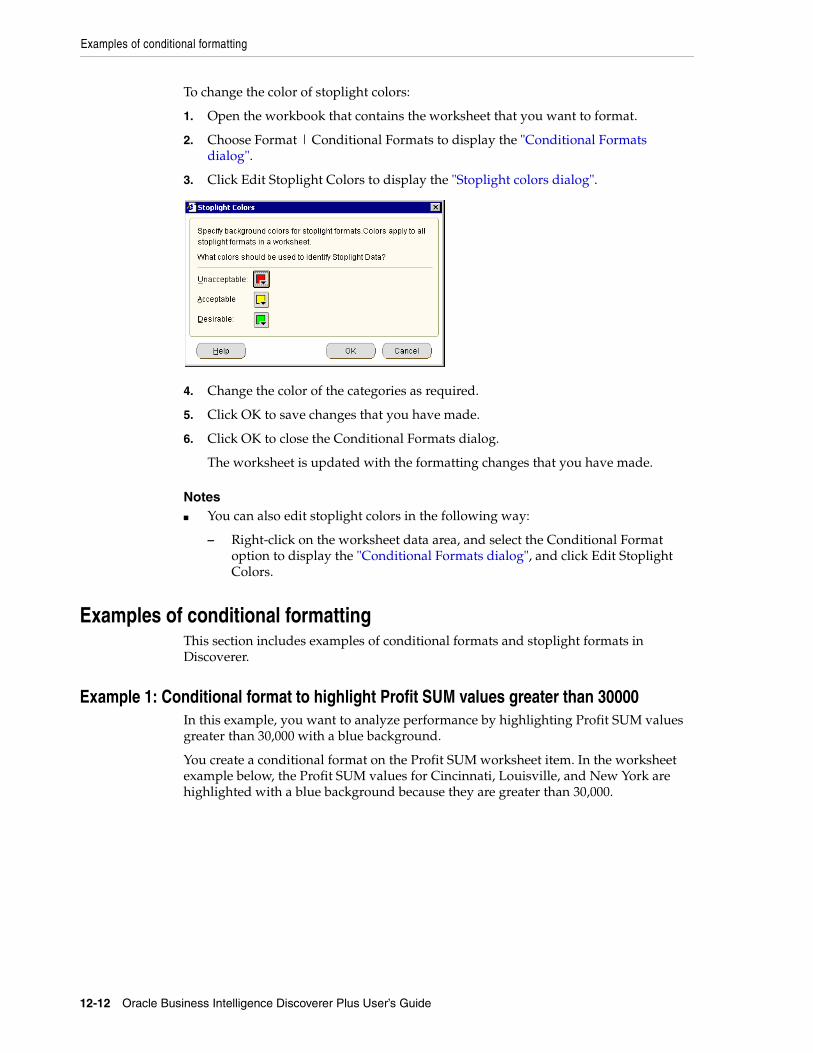
Examples of conditional formatting
12-12 Oracle Business Intelligence Discoverer Plus User’s Guide
To change the color of stoplight colors:
1. Open the workbook that contains the worksheet that you want to format.
2. Choose Format | Conditional Formats to display the "Conditional Formats dialog".
3. Click Edit Stoplight Colors to display the "Stoplight colors dialog".
4. Change the color of the categories as required.
5. Click OK to save changes that you have made.
6. Click OK to close the Conditional Formats dialog.
The worksheet is updated with the formatting changes that you have made.
Notes■ You can also edit stoplight colors in the following way:
– Right-click on the worksheet data area, and select the Conditional Format option to display the "Conditional Formats dialog", and click Edit Stoplight Colors.
Examples of conditional formattingThis section includes examples of conditional formats and stoplight formats in Discoverer.
Example 1: Conditional format to highlight Profit SUM values greater than 30000In this example, you want to analyze performance by highlighting Profit SUM values greater than 30,000 with a blue background.
You create a conditional format on the Profit SUM worksheet item. In the worksheet example below, the Profit SUM values for Cincinnati, Louisville, and New York are highlighted with a blue background because they are greater than 30,000.
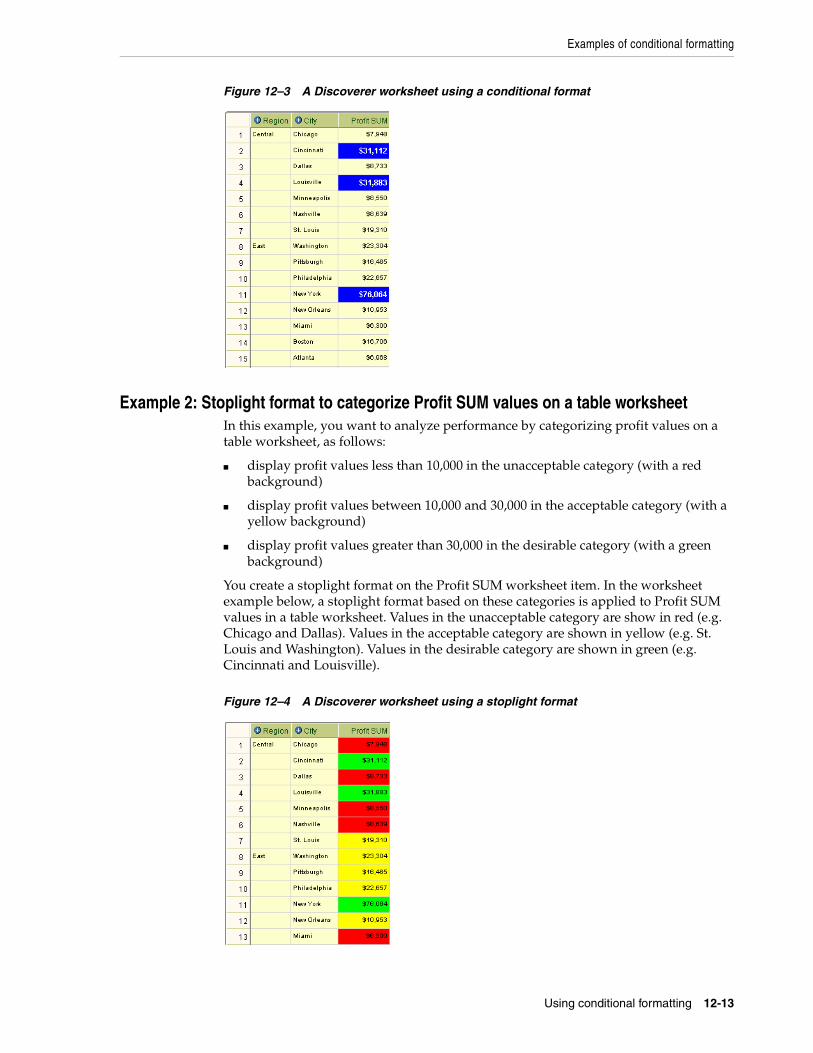
Examples of conditional formatting
Using conditional formatting 12-13
Figure 12–3 A Discoverer worksheet using a conditional format
Example 2: Stoplight format to categorize Profit SUM values on a table worksheetIn this example, you want to analyze performance by categorizing profit values on a table worksheet, as follows:
■ display profit values less than 10,000 in the unacceptable category (with a red background)
■ display profit values between 10,000 and 30,000 in the acceptable category (with a yellow background)
■ display profit values greater than 30,000 in the desirable category (with a green background)
You create a stoplight format on the Profit SUM worksheet item. In the worksheet example below, a stoplight format based on these categories is applied to Profit SUM values in a table worksheet. Values in the unacceptable category are show in red (e.g. Chicago and Dallas). Values in the acceptable category are shown in yellow (e.g. St. Louis and Washington). Values in the desirable category are shown in green (e.g. Cincinnati and Louisville).
Figure 12–4 A Discoverer worksheet using a stoplight format
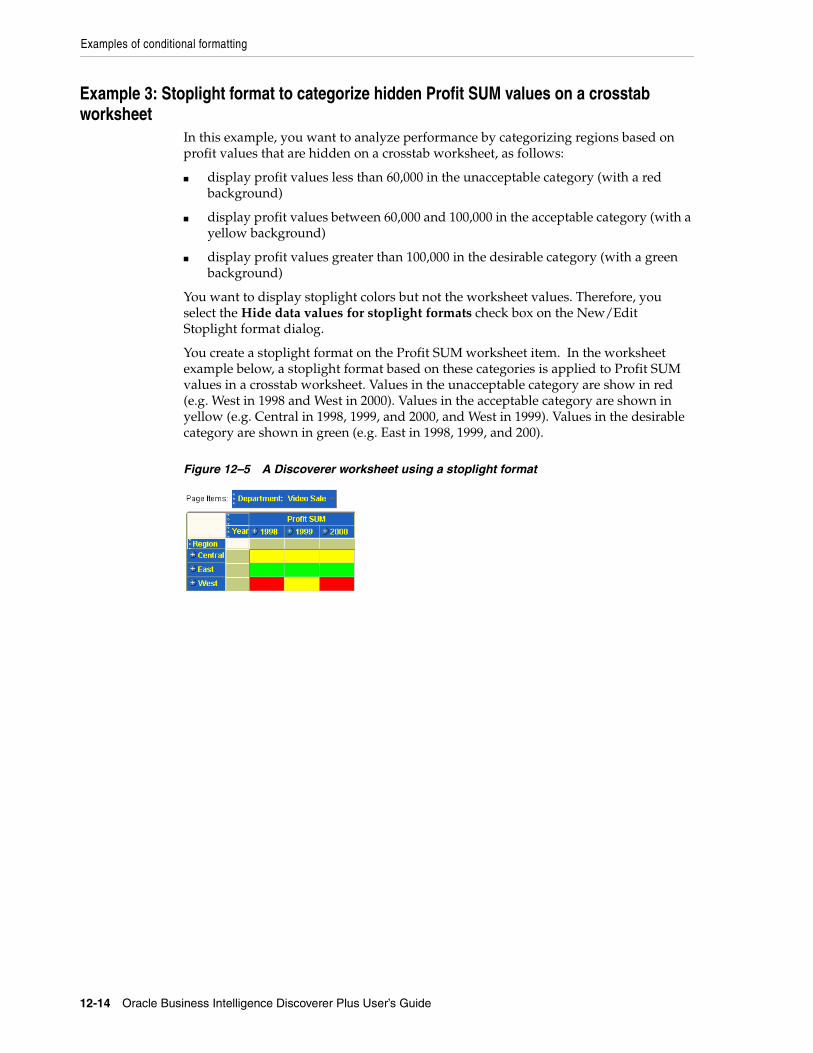
Examples of conditional formatting
12-14 Oracle Business Intelligence Discoverer Plus User’s Guide
Example 3: Stoplight format to categorize hidden Profit SUM values on a crosstab worksheet
In this example, you want to analyze performance by categorizing regions based on profit values that are hidden on a crosstab worksheet, as follows:
■ display profit values less than 60,000 in the unacceptable category (with a red background)
■ display profit values between 60,000 and 100,000 in the acceptable category (with a yellow background)
■ display profit values greater than 100,000 in the desirable category (with a green background)
You want to display stoplight colors but not the worksheet values. Therefore, you select the Hide data values for stoplight formats check box on the New/Edit Stoplight format dialog.
You create a stoplight format on the Profit SUM worksheet item. In the worksheet example below, a stoplight format based on these categories is applied to Profit SUM values in a crosstab worksheet. Values in the unacceptable category are show in red (e.g. West in 1998 and West in 2000). Values in the acceptable category are shown in yellow (e.g. Central in 1998, 1999, and 2000, and West in 1999). Values in the desirable category are shown in green (e.g. East in 1998, 1999, and 200).
Figure 12–5 A Discoverer worksheet using a stoplight format
Using conditions 13-1
13Using conditions
This chapter explains how to use Discoverer Plus Relational’s conditions to answer typical business questions. For example, which product items sell more than 10,000 each week? This section contains the following topics:
■ "What are conditions?"
■ "What are multiple conditions?"
■ "What are nested conditions?"
■ "About using conditions"
■ "About applying more than one condition"
■ "How to activate and deactivate existing conditions"
■ "How to create single conditions"
■ "How to create multiple conditions"
■ "How to create nested conditions"
■ "How to edit conditions"
■ "How to delete conditions"
■ "Notes on how Discoverer applies conditions to roll-ups"
■ "Example of how Discoverer applies conditions to roll-ups"
■ "Examples of conditions"
What are conditions?Conditions are worksheet items that enable you to choose what data to display on worksheets. Conditions filter out data that you are not interested in, enabling you to concentrate on data that you want to analyze. For example, in the figure below, the "Edit Worksheet dialog: Select Items tab: Conditions tab" shows that a condition is active that only displays 2000 data (i.e. Calendar Year = 2000).
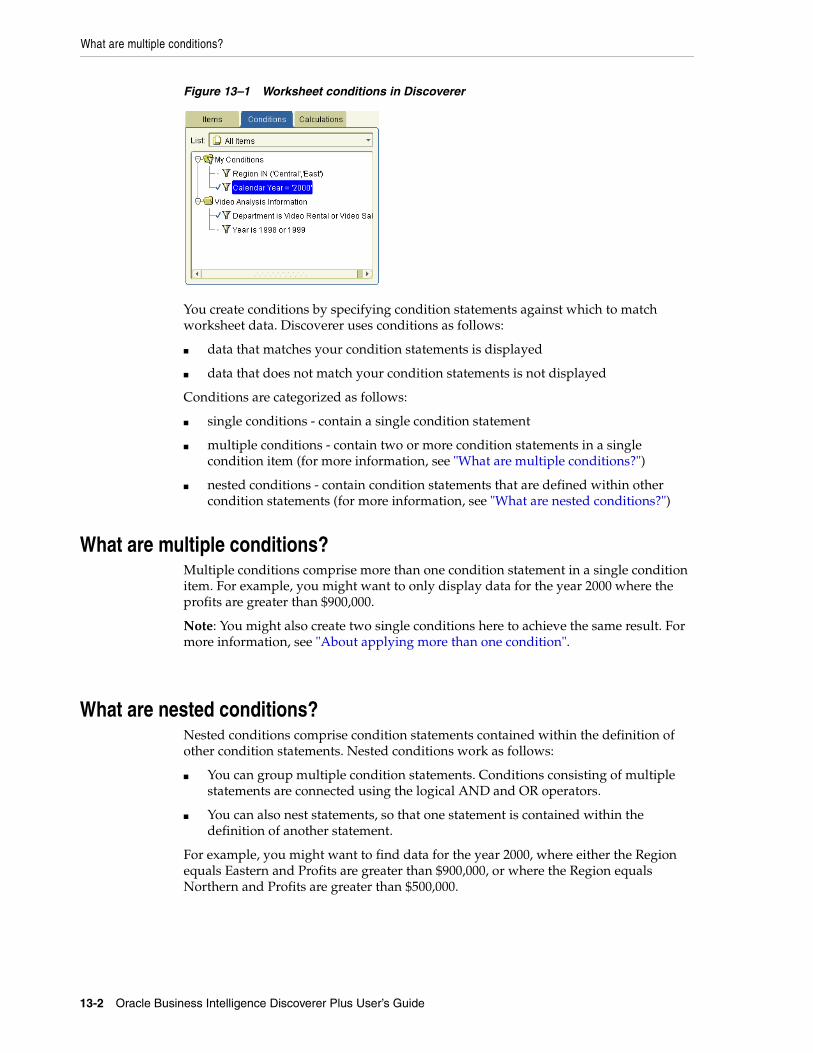
What are multiple conditions?
13-2 Oracle Business Intelligence Discoverer Plus User’s Guide
Figure 13–1 Worksheet conditions in Discoverer
You create conditions by specifying condition statements against which to match worksheet data. Discoverer uses conditions as follows:
■ data that matches your condition statements is displayed
■ data that does not match your condition statements is not displayed
Conditions are categorized as follows:
■ single conditions - contain a single condition statement
■ multiple conditions - contain two or more condition statements in a single condition item (for more information, see "What are multiple conditions?")
■ nested conditions - contain condition statements that are defined within other condition statements (for more information, see "What are nested conditions?")
What are multiple conditions?Multiple conditions comprise more than one condition statement in a single condition item. For example, you might want to only display data for the year 2000 where the profits are greater than $900,000.
Note: You might also create two single conditions here to achieve the same result. For more information, see "About applying more than one condition".
What are nested conditions?Nested conditions comprise condition statements contained within the definition of other condition statements. Nested conditions work as follows:
■ You can group multiple condition statements. Conditions consisting of multiple statements are connected using the logical AND and OR operators.
■ You can also nest statements, so that one statement is contained within the definition of another statement.
For example, you might want to find data for the year 2000, where either the Region equals Eastern and Profits are greater than $900,000, or where the Region equals Northern and Profits are greater than $500,000.
How to activate and deactivate existing conditions
Using conditions 13-3
About using conditionsWorksheets can contain conditions defined by you, by the Discoverer manager, or by other Discoverer users. Conditions work as follows:
■ If you have the privileges to edit a worksheet, you select which conditions to apply to the worksheet.
■ When you create a condition, the condition is available to all worksheets in the workbook. You apply the condition to individual worksheets.
■ If none of the existing conditions filter the data exactly as you want, you can create your own conditions and apply them to the worksheet.
■ To apply conditions more flexibly, you can use parameters to give workbook users a choice of what data to display on a worksheet (for more information, see "Using parameters").
■ Conditions created when a parameter is added to a worksheet are automatically selected when the parameter is turned on, and automatically deselected when the parameter is turned off.
About applying more than one conditionApplying more than one single condition at the same time can have the same effect as creating a multiple condition. This can keep your condition statements short and make them easier to understand by other Discoverer users. Single condition statements also enable you to selectively apply individual condition statements.
For example, you apply the following two single conditions:
■ Year = 2001
■ Sales SUM > $100,000
This has the same effect as one multiple condition containing two condition statements:
■ Year = 2001 AND Sales SUM > $100,000
Note: When filtering certain types of data, using a multiple condition produces different results from using more than one single condition. For example, when using analytic functions (for more information, see "About analytic functions and sequencing").
How to activate and deactivate existing conditionsYou activate an existing condition when you want to filter worksheet data according to that condition statement. For example, to turn on the condition Year = 2001 to display only data for the year 2001.
You deactivate a condition when you no longer want to filter the worksheet according to that condition. For example, you might turn off the condition Year = 2001 to display data for all years available. If you need to filter the data later using the condition, you can always reactivate the condition.
To activate or deactivate a condition:
1. Choose Tools | Conditions to display the "Edit Worksheet dialog: Select Items tab: Conditions tab".
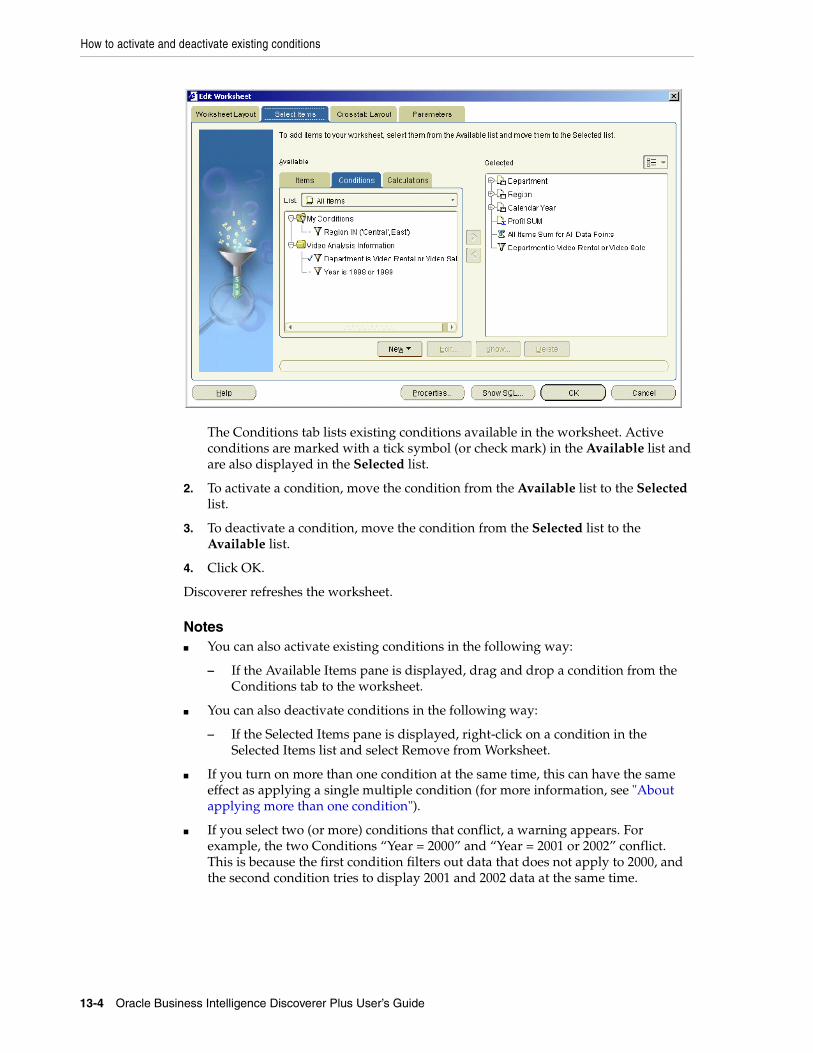
How to activate and deactivate existing conditions
13-4 Oracle Business Intelligence Discoverer Plus User’s Guide
The Conditions tab lists existing conditions available in the worksheet. Active conditions are marked with a tick symbol (or check mark) in the Available list and are also displayed in the Selected list.
2. To activate a condition, move the condition from the Available list to the Selected list.
3. To deactivate a condition, move the condition from the Selected list to the Available list.
4. Click OK.
Discoverer refreshes the worksheet.
Notes■ You can also activate existing conditions in the following way:
– If the Available Items pane is displayed, drag and drop a condition from the Conditions tab to the worksheet.
■ You can also deactivate conditions in the following way:
– If the Selected Items pane is displayed, right-click on a condition in the Selected Items list and select Remove from Worksheet.
■ If you turn on more than one condition at the same time, this can have the same effect as applying a single multiple condition (for more information, see "About applying more than one condition").
■ If you select two (or more) conditions that conflict, a warning appears. For example, the two Conditions “Year = 2000” and “Year = 2001 or 2002” conflict. This is because the first condition filters out data that does not apply to 2000, and the second condition tries to display 2001 and 2002 data at the same time.
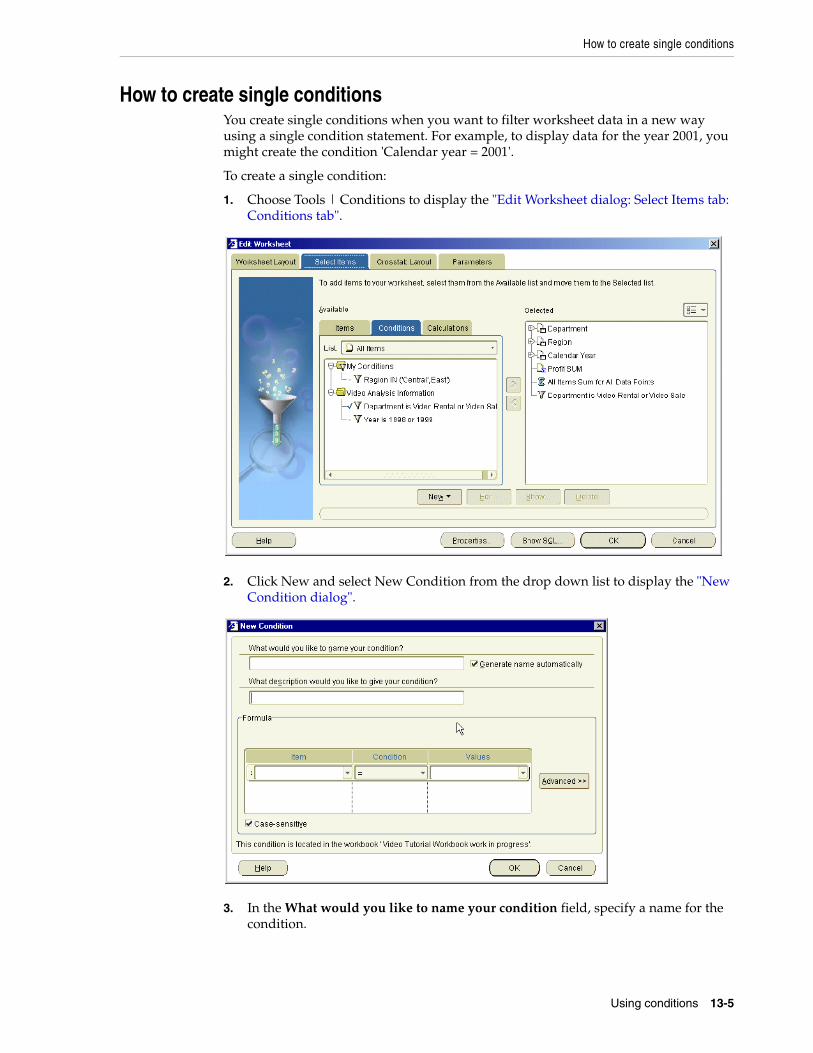
How to create single conditions
Using conditions 13-5
How to create single conditionsYou create single conditions when you want to filter worksheet data in a new way using a single condition statement. For example, to display data for the year 2001, you might create the condition 'Calendar year = 2001'.
To create a single condition:
1. Choose Tools | Conditions to display the "Edit Worksheet dialog: Select Items tab: Conditions tab".
2. Click New and select New Condition from the drop down list to display the "New Condition dialog".
3. In the What would you like to name your condition field, specify a name for the condition.
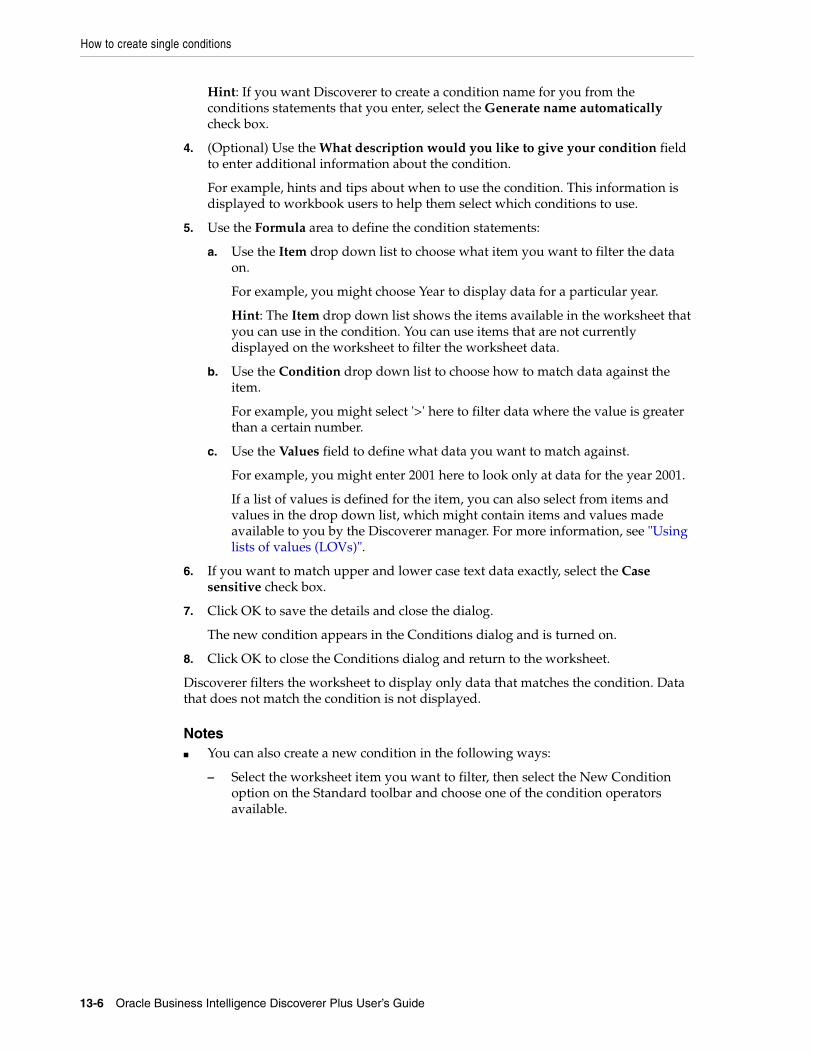
How to create single conditions
13-6 Oracle Business Intelligence Discoverer Plus User’s Guide
Hint: If you want Discoverer to create a condition name for you from the conditions statements that you enter, select the Generate name automatically check box.
4. (Optional) Use the What description would you like to give your condition field to enter additional information about the condition.
For example, hints and tips about when to use the condition. This information is displayed to workbook users to help them select which conditions to use.
5. Use the Formula area to define the condition statements:
a. Use the Item drop down list to choose what item you want to filter the data on.
For example, you might choose Year to display data for a particular year.
Hint: The Item drop down list shows the items available in the worksheet that you can use in the condition. You can use items that are not currently displayed on the worksheet to filter the worksheet data.
b. Use the Condition drop down list to choose how to match data against the item.
For example, you might select '>' here to filter data where the value is greater than a certain number.
c. Use the Values field to define what data you want to match against.
For example, you might enter 2001 here to look only at data for the year 2001.
If a list of values is defined for the item, you can also select from items and values in the drop down list, which might contain items and values made available to you by the Discoverer manager. For more information, see "Using lists of values (LOVs)".
6. If you want to match upper and lower case text data exactly, select the Case sensitive check box.
7. Click OK to save the details and close the dialog.
The new condition appears in the Conditions dialog and is turned on.
8. Click OK to close the Conditions dialog and return to the worksheet.
Discoverer filters the worksheet to display only data that matches the condition. Data that does not match the condition is not displayed.
Notes■ You can also create a new condition in the following ways:
– Select the worksheet item you want to filter, then select the New Condition option on the Standard toolbar and choose one of the condition operators available.
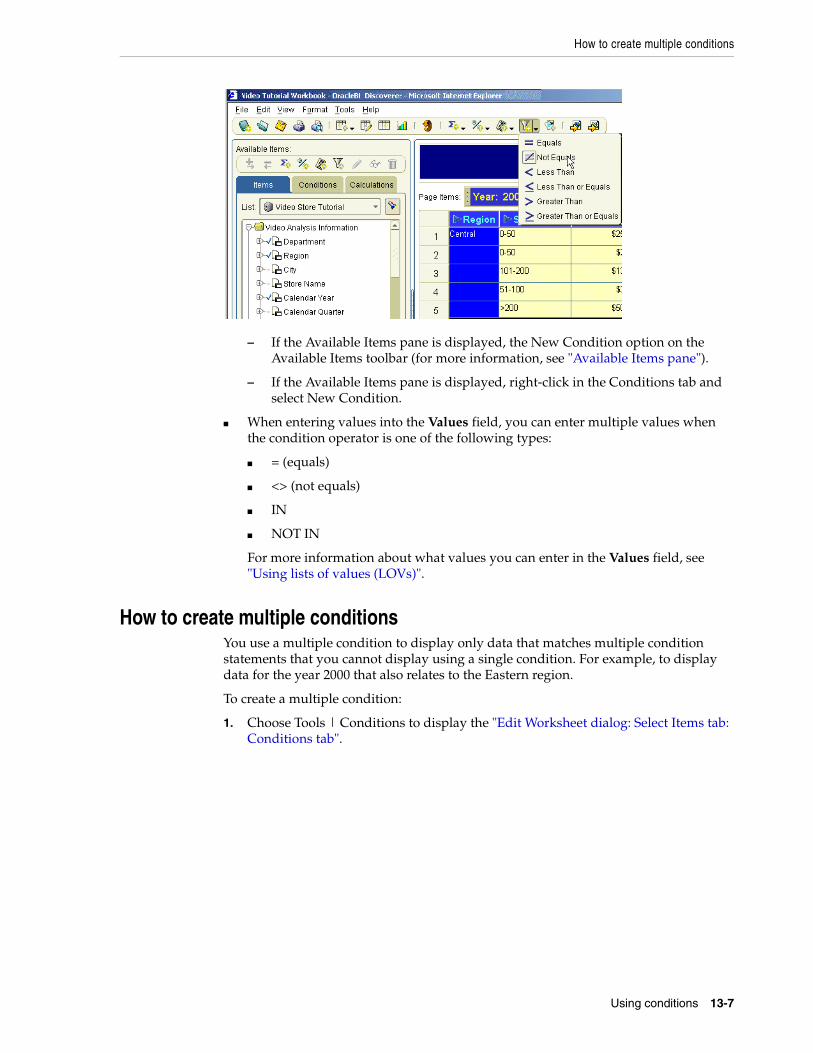
How to create multiple conditions
Using conditions 13-7
– If the Available Items pane is displayed, the New Condition option on the Available Items toolbar (for more information, see "Available Items pane").
– If the Available Items pane is displayed, right-click in the Conditions tab and select New Condition.
■ When entering values into the Values field, you can enter multiple values when the condition operator is one of the following types:
■ = (equals)
■ <> (not equals)
■ IN
■ NOT IN
For more information about what values you can enter in the Values field, see "Using lists of values (LOVs)".
How to create multiple conditionsYou use a multiple condition to display only data that matches multiple condition statements that you cannot display using a single condition. For example, to display data for the year 2000 that also relates to the Eastern region.
To create a multiple condition:
1. Choose Tools | Conditions to display the "Edit Worksheet dialog: Select Items tab: Conditions tab".
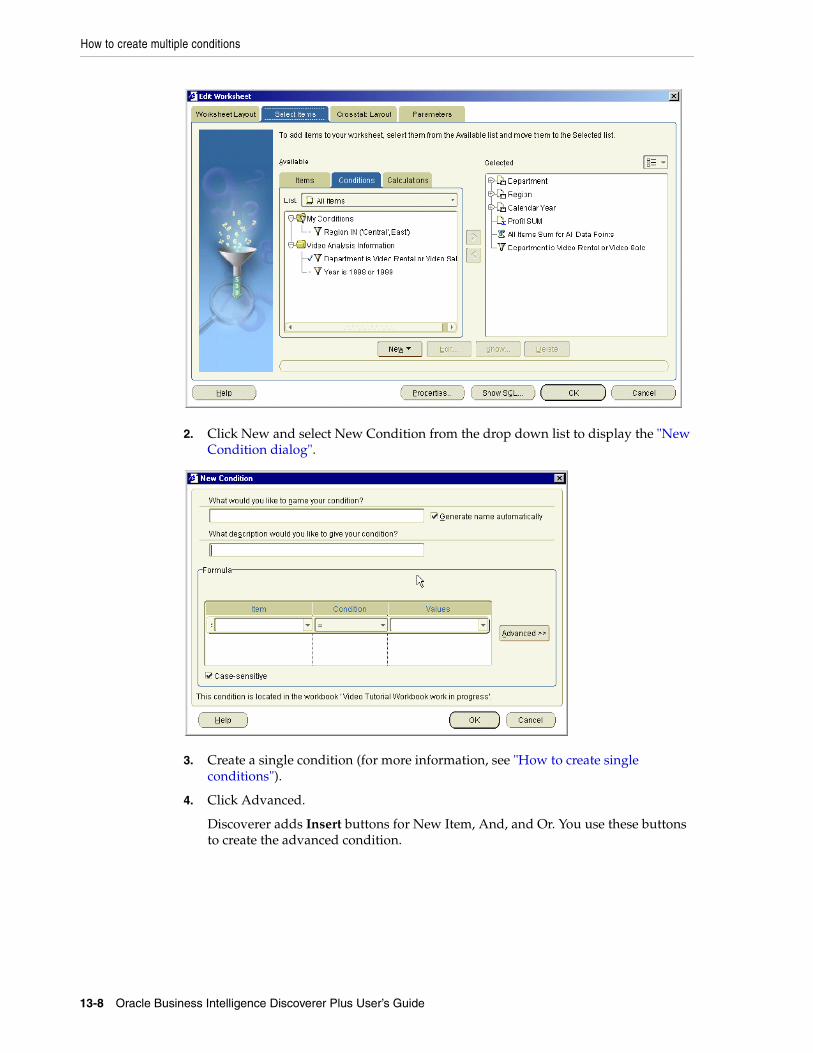
How to create multiple conditions
13-8 Oracle Business Intelligence Discoverer Plus User’s Guide
2. Click New and select New Condition from the drop down list to display the "New Condition dialog".
3. Create a single condition (for more information, see "How to create single conditions").
4. Click Advanced.
Discoverer adds Insert buttons for New Item, And, and Or. You use these buttons to create the advanced condition.
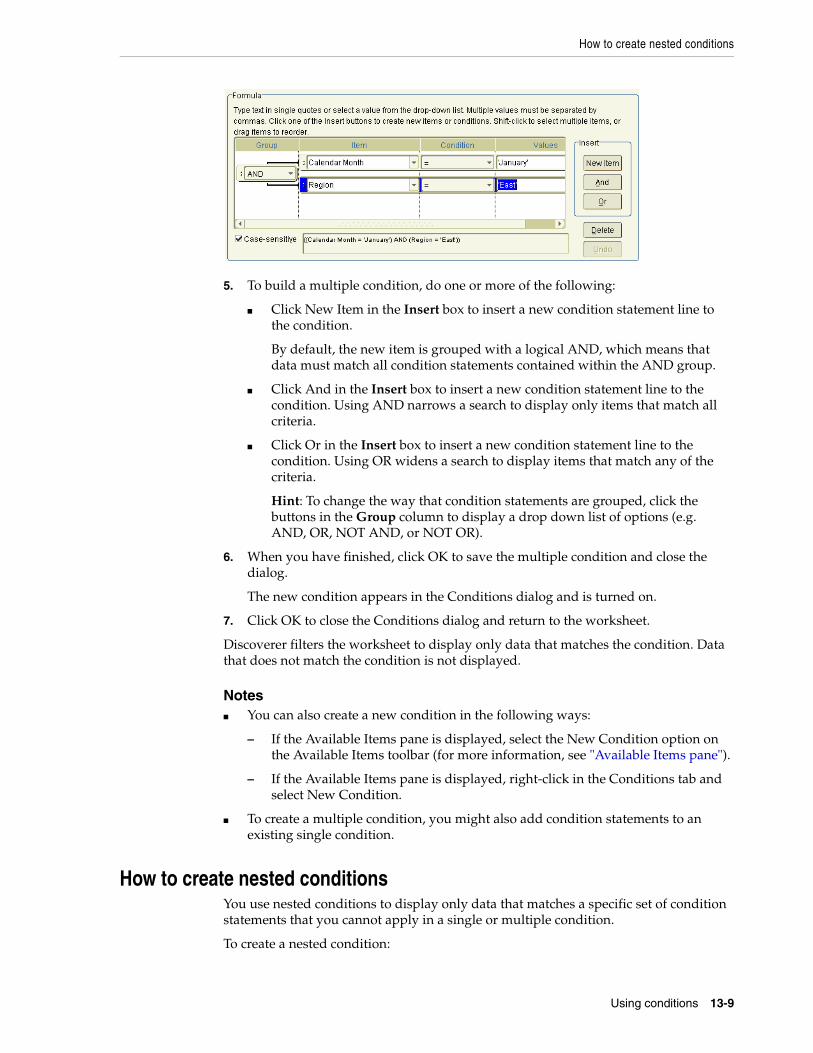
How to create nested conditions
Using conditions 13-9
5. To build a multiple condition, do one or more of the following:
■ Click New Item in the Insert box to insert a new condition statement line to the condition.
By default, the new item is grouped with a logical AND, which means that data must match all condition statements contained within the AND group.
■ Click And in the Insert box to insert a new condition statement line to the condition. Using AND narrows a search to display only items that match all criteria.
■ Click Or in the Insert box to insert a new condition statement line to the condition. Using OR widens a search to display items that match any of the criteria.
Hint: To change the way that condition statements are grouped, click the buttons in the Group column to display a drop down list of options (e.g. AND, OR, NOT AND, or NOT OR).
6. When you have finished, click OK to save the multiple condition and close the dialog.
The new condition appears in the Conditions dialog and is turned on.
7. Click OK to close the Conditions dialog and return to the worksheet.
Discoverer filters the worksheet to display only data that matches the condition. Data that does not match the condition is not displayed.
Notes■ You can also create a new condition in the following ways:
– If the Available Items pane is displayed, select the New Condition option on the Available Items toolbar (for more information, see "Available Items pane").
– If the Available Items pane is displayed, right-click in the Conditions tab and select New Condition.
■ To create a multiple condition, you might also add condition statements to an existing single condition.
How to create nested conditionsYou use nested conditions to display only data that matches a specific set of condition statements that you cannot apply in a single or multiple condition.
To create a nested condition:
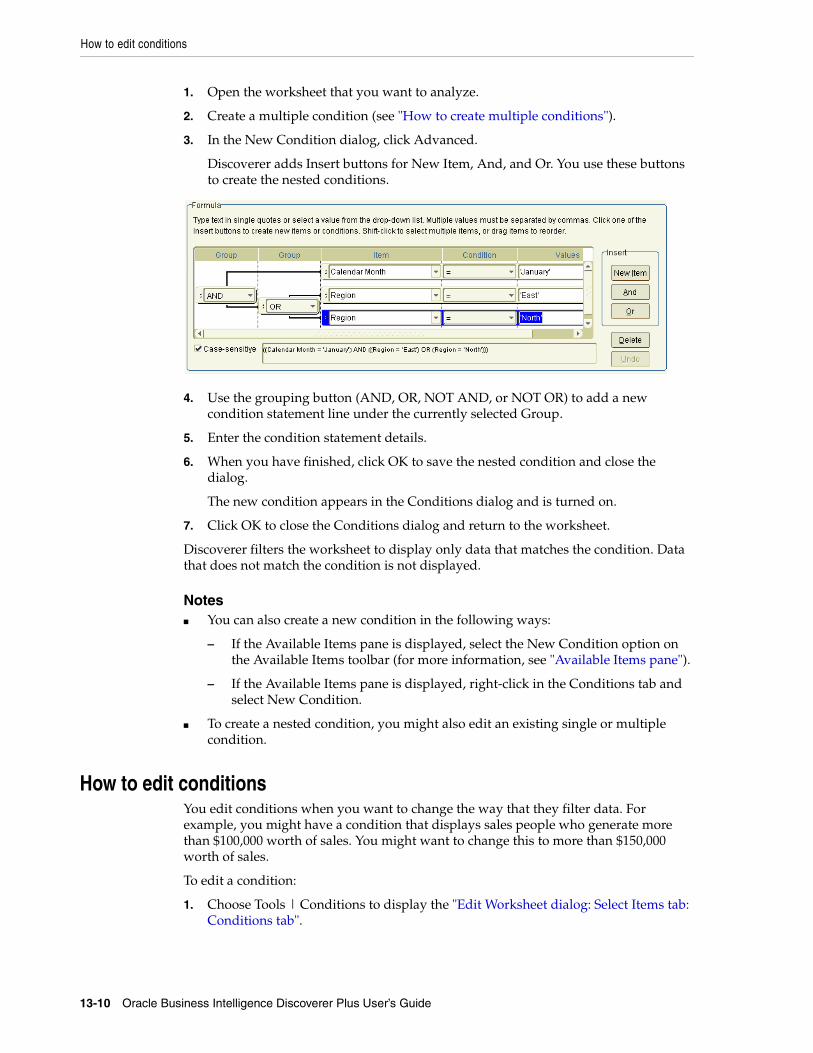
How to edit conditions
13-10 Oracle Business Intelligence Discoverer Plus User’s Guide
1. Open the worksheet that you want to analyze.
2. Create a multiple condition (see "How to create multiple conditions").
3. In the New Condition dialog, click Advanced.
Discoverer adds Insert buttons for New Item, And, and Or. You use these buttons to create the nested conditions.
4. Use the grouping button (AND, OR, NOT AND, or NOT OR) to add a new condition statement line under the currently selected Group.
5. Enter the condition statement details.
6. When you have finished, click OK to save the nested condition and close the dialog.
The new condition appears in the Conditions dialog and is turned on.
7. Click OK to close the Conditions dialog and return to the worksheet.
Discoverer filters the worksheet to display only data that matches the condition. Data that does not match the condition is not displayed.
Notes■ You can also create a new condition in the following ways:
– If the Available Items pane is displayed, select the New Condition option on the Available Items toolbar (for more information, see "Available Items pane").
– If the Available Items pane is displayed, right-click in the Conditions tab and select New Condition.
■ To create a nested condition, you might also edit an existing single or multiple condition.
How to edit conditionsYou edit conditions when you want to change the way that they filter data. For example, you might have a condition that displays sales people who generate more than $100,000 worth of sales. You might want to change this to more than $150,000 worth of sales.
To edit a condition:
1. Choose Tools | Conditions to display the "Edit Worksheet dialog: Select Items tab: Conditions tab".
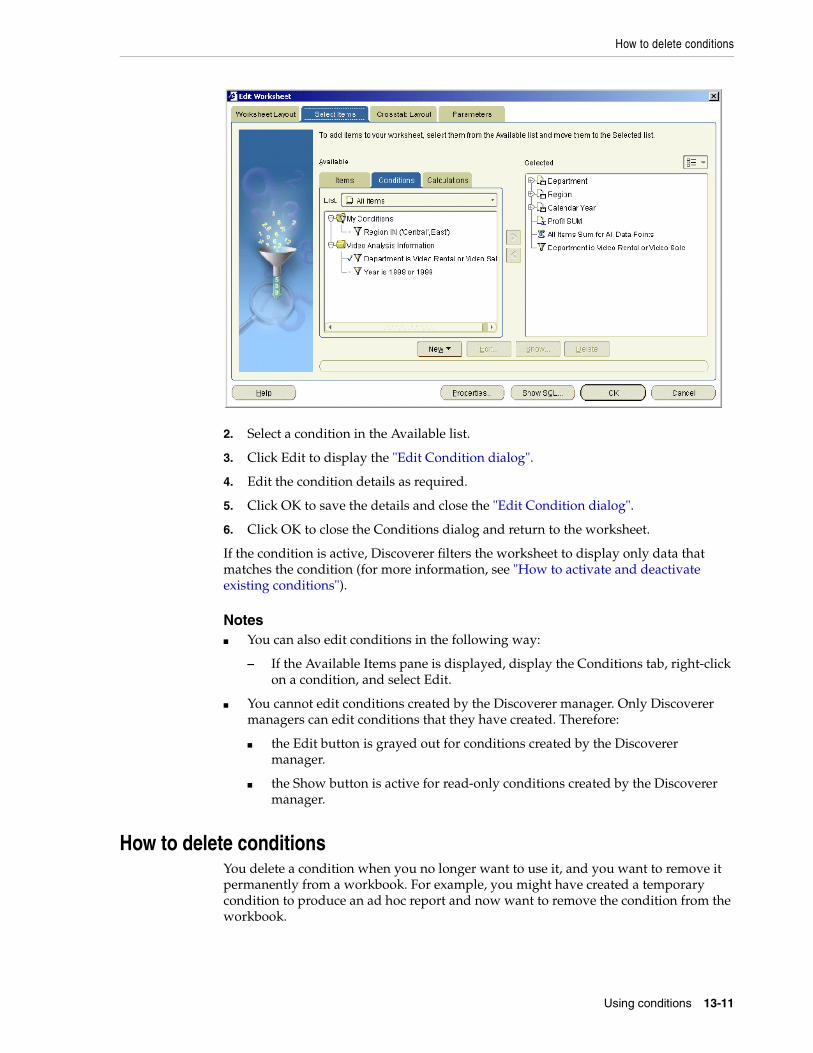
How to delete conditions
Using conditions 13-11
2. Select a condition in the Available list.
3. Click Edit to display the "Edit Condition dialog".
4. Edit the condition details as required.
5. Click OK to save the details and close the "Edit Condition dialog".
6. Click OK to close the Conditions dialog and return to the worksheet.
If the condition is active, Discoverer filters the worksheet to display only data that matches the condition (for more information, see "How to activate and deactivate existing conditions").
Notes■ You can also edit conditions in the following way:
– If the Available Items pane is displayed, display the Conditions tab, right-click on a condition, and select Edit.
■ You cannot edit conditions created by the Discoverer manager. Only Discoverer managers can edit conditions that they have created. Therefore:
■ the Edit button is grayed out for conditions created by the Discoverer manager.
■ the Show button is active for read-only conditions created by the Discoverer manager.
How to delete conditionsYou delete a condition when you no longer want to use it, and you want to remove it permanently from a workbook. For example, you might have created a temporary condition to produce an ad hoc report and now want to remove the condition from the workbook.
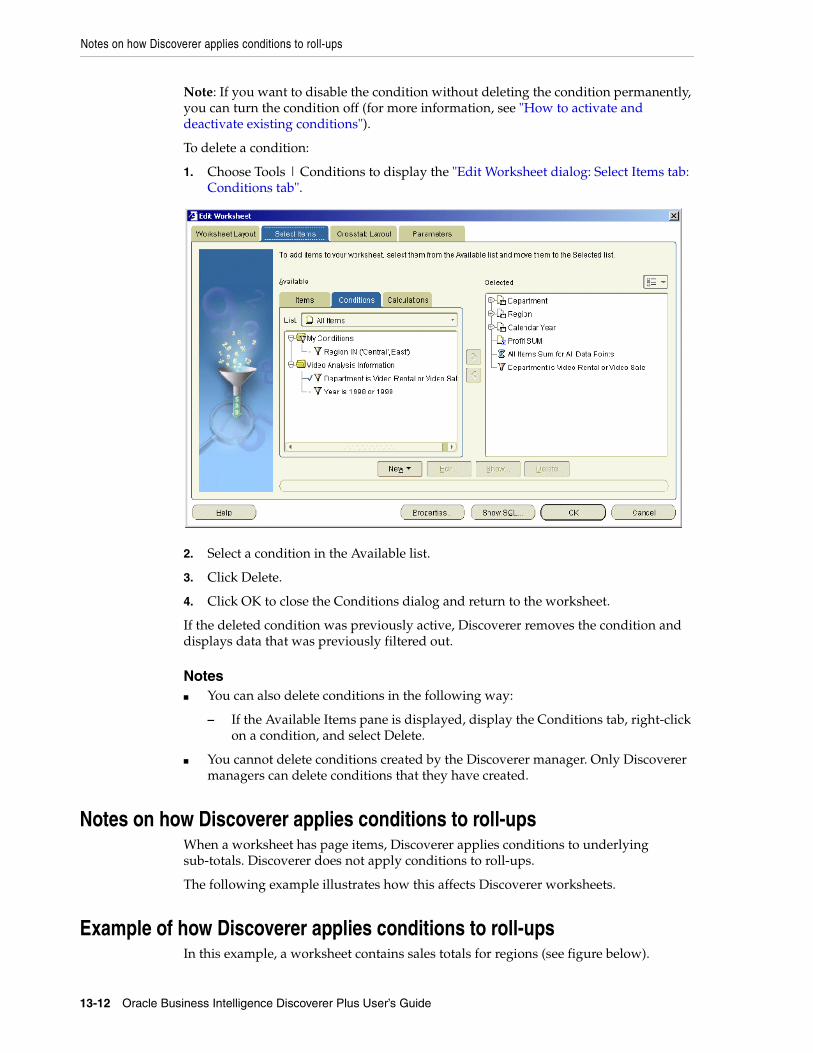
Notes on how Discoverer applies conditions to roll-ups
13-12 Oracle Business Intelligence Discoverer Plus User’s Guide
Note: If you want to disable the condition without deleting the condition permanently, you can turn the condition off (for more information, see "How to activate and deactivate existing conditions").
To delete a condition:
1. Choose Tools | Conditions to display the "Edit Worksheet dialog: Select Items tab: Conditions tab".
2. Select a condition in the Available list.
3. Click Delete.
4. Click OK to close the Conditions dialog and return to the worksheet.
If the deleted condition was previously active, Discoverer removes the condition and displays data that was previously filtered out.
Notes■ You can also delete conditions in the following way:
– If the Available Items pane is displayed, display the Conditions tab, right-click on a condition, and select Delete.
■ You cannot delete conditions created by the Discoverer manager. Only Discoverer managers can delete conditions that they have created.
Notes on how Discoverer applies conditions to roll-upsWhen a worksheet has page items, Discoverer applies conditions to underlying sub-totals. Discoverer does not apply conditions to roll-ups.
The following example illustrates how this affects Discoverer worksheets.
Example of how Discoverer applies conditions to roll-upsIn this example, a worksheet contains sales totals for regions (see figure below).
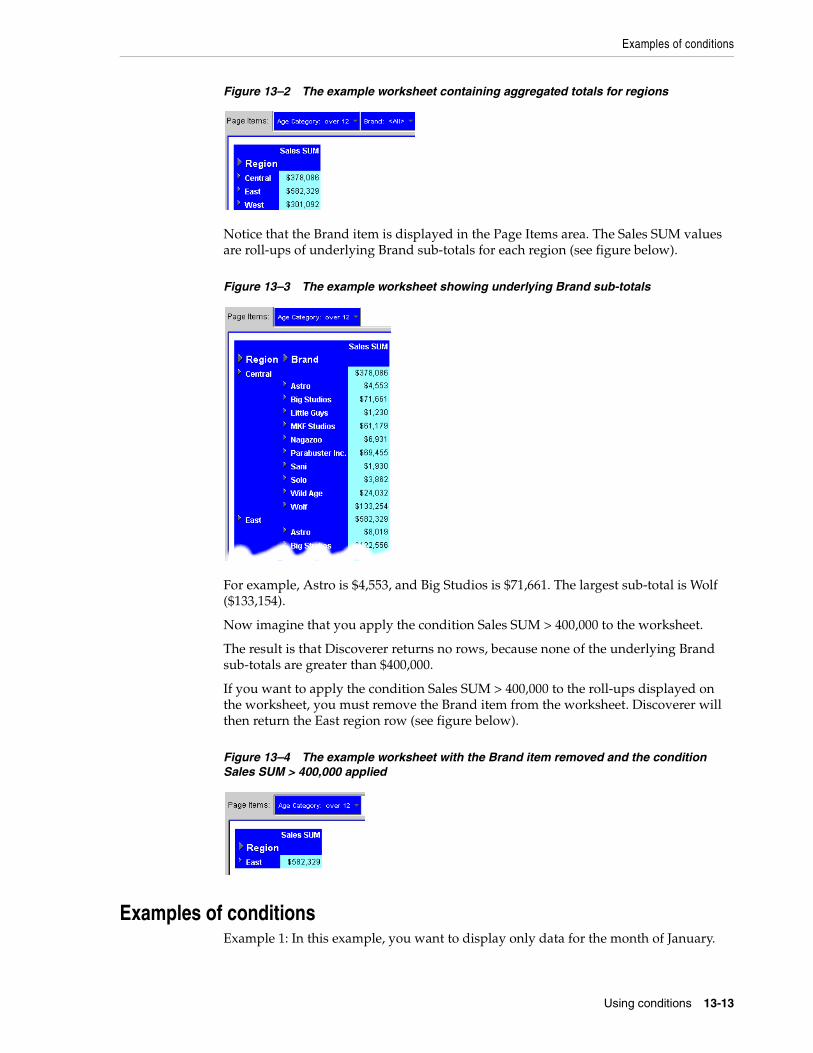
Examples of conditions
Using conditions 13-13
Figure 13–2 The example worksheet containing aggregated totals for regions
Notice that the Brand item is displayed in the Page Items area. The Sales SUM values are roll-ups of underlying Brand sub-totals for each region (see figure below).
Figure 13–3 The example worksheet showing underlying Brand sub-totals
For example, Astro is $4,553, and Big Studios is $71,661. The largest sub-total is Wolf ($133,154).
Now imagine that you apply the condition Sales SUM > 400,000 to the worksheet.
The result is that Discoverer returns no rows, because none of the underlying Brand sub-totals are greater than $400,000.
If you want to apply the condition Sales SUM > 400,000 to the roll-ups displayed on the worksheet, you must remove the Brand item from the worksheet. Discoverer will then return the East region row (see figure below).
Figure 13–4 The example worksheet with the Brand item removed and the condition Sales SUM > 400,000 applied
Examples of conditionsExample 1: In this example, you want to display only data for the month of January.

Examples of conditions
13-14 Oracle Business Intelligence Discoverer Plus User’s Guide
Figure 13–5 A single condition to return data for the month of January
In the figure above, a single condition statement is defined (Calendar Month = January).
Example 2: In this example, you want to display only data for the month of January and the East region.
Figure 13–6 A multiple condition to return data for the month of January for the East region
In the figure above, a multiple condition statement is defined (Calendar Month = January AND Region = East).
Example 3: In this example, you want to display only data for the month of January, and data for the East region or data for the North region.
Figure 13–7 A nested condition to return data for the month of January and the East region or the North region
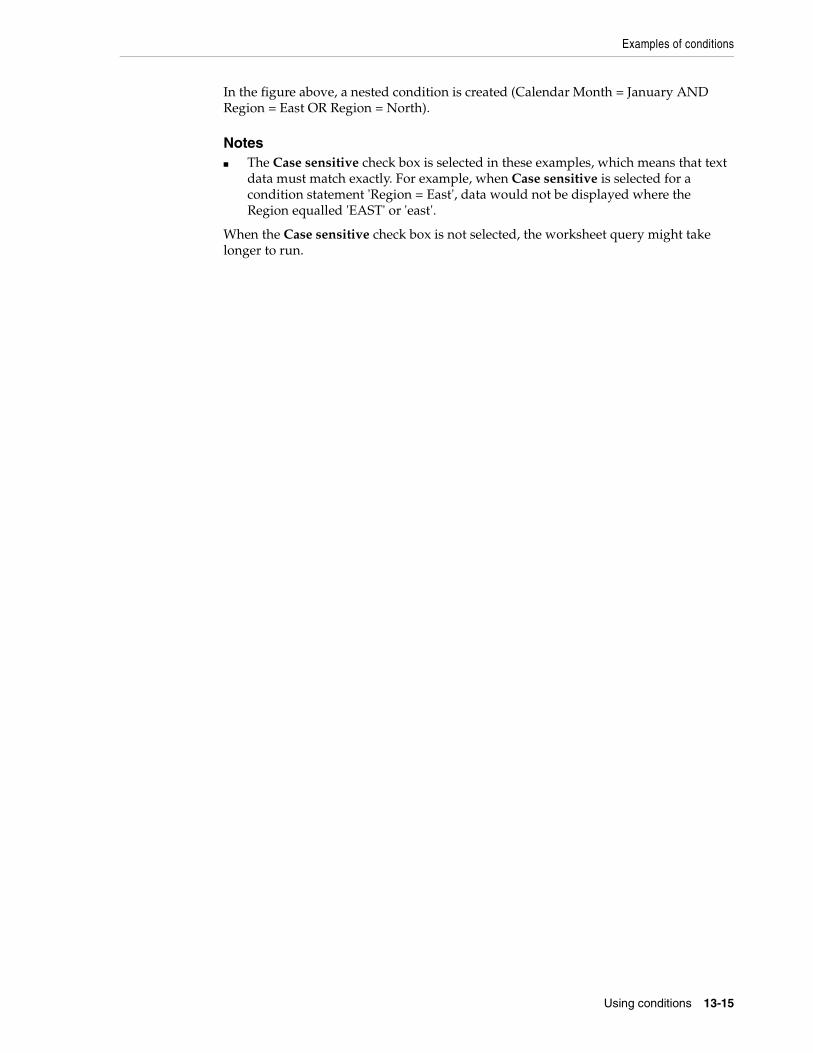
Examples of conditions
Using conditions 13-15
In the figure above, a nested condition is created (Calendar Month = January AND Region = East OR Region = North).
Notes■ The Case sensitive check box is selected in these examples, which means that text
data must match exactly. For example, when Case sensitive is selected for a condition statement 'Region = East', data would not be displayed where the Region equalled 'EAST' or 'east'.
When the Case sensitive check box is not selected, the worksheet query might take longer to run.

Examples of conditions
13-16 Oracle Business Intelligence Discoverer Plus User’s Guide
Using totals 14-1
14Using totals
This chapter explains how to use Discoverer Plus Relational’s totals to answer typical business questions. For example, what is the total sales figure for January? This section contains the following topics:
■ "What are totals?"
■ "About totals on worksheets"
■ "About SUM and Cell SUM"
■ "When to use SUM instead of Cell SUM"
■ "When to use Cell SUM instead of SUM"
■ "About migrating workbook totals to OracleBI Discoverer"
■ "What are aggregated values in Discoverer"
■ "What are linear and non-linear totals"
■ "How to display or hide totals"
■ "How to create totals"
■ "How to edit totals"
■ "How to delete totals"
■ "Examples of totals"
■ "Examples of worksheet aggregation in Discoverer"
What are totals?Totals are worksheet items that enable you to quickly and easily summarize rows and columns. For example, to calculate the sum of a column of profit figures, or to calculate the average of a row of sales figures. You can then use the totals to analyze the worksheet data.
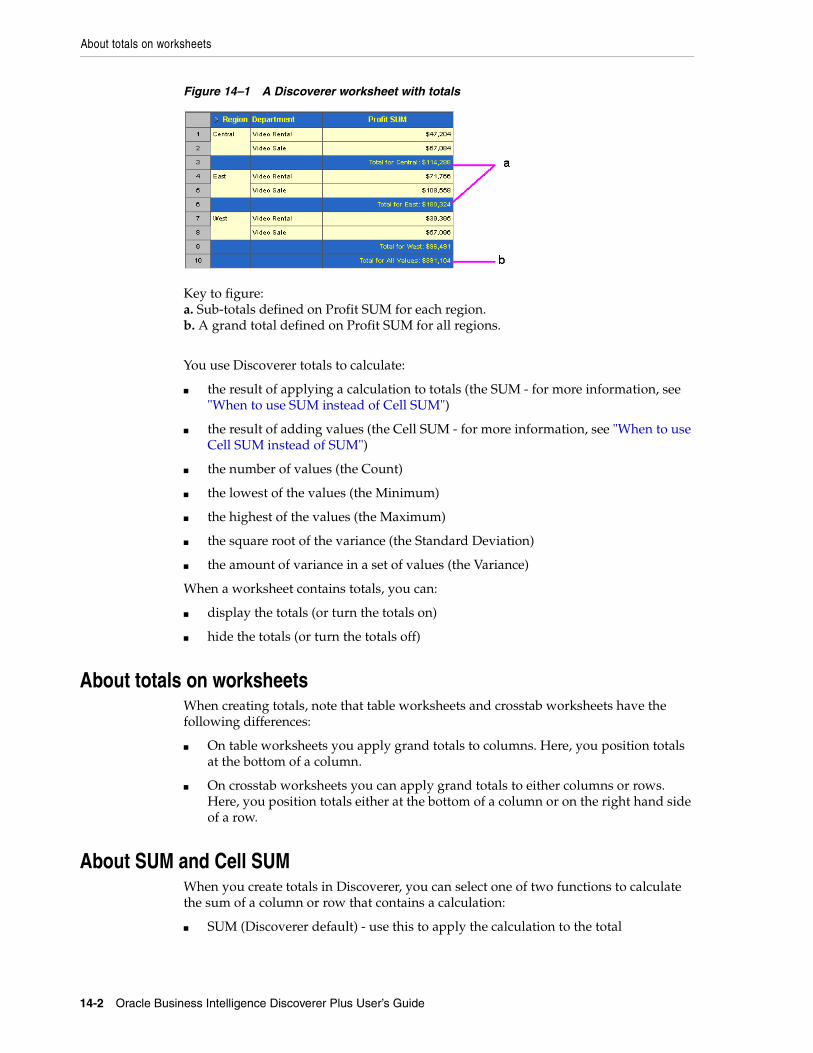
About totals on worksheets
14-2 Oracle Business Intelligence Discoverer Plus User’s Guide
Figure 14–1 A Discoverer worksheet with totals
Key to figure:a. Sub-totals defined on Profit SUM for each region.b. A grand total defined on Profit SUM for all regions.
You use Discoverer totals to calculate:
■ the result of applying a calculation to totals (the SUM - for more information, see "When to use SUM instead of Cell SUM")
■ the result of adding values (the Cell SUM - for more information, see "When to use Cell SUM instead of SUM")
■ the number of values (the Count)
■ the lowest of the values (the Minimum)
■ the highest of the values (the Maximum)
■ the square root of the variance (the Standard Deviation)
■ the amount of variance in a set of values (the Variance)
When a worksheet contains totals, you can:
■ display the totals (or turn the totals on)
■ hide the totals (or turn the totals off)
About totals on worksheetsWhen creating totals, note that table worksheets and crosstab worksheets have the following differences:
■ On table worksheets you apply grand totals to columns. Here, you position totals at the bottom of a column.
■ On crosstab worksheets you can apply grand totals to either columns or rows. Here, you position totals either at the bottom of a column or on the right hand side of a row.
About SUM and Cell SUMWhen you create totals in Discoverer, you can select one of two functions to calculate the sum of a column or row that contains a calculation:
■ SUM (Discoverer default) - use this to apply the calculation to the total
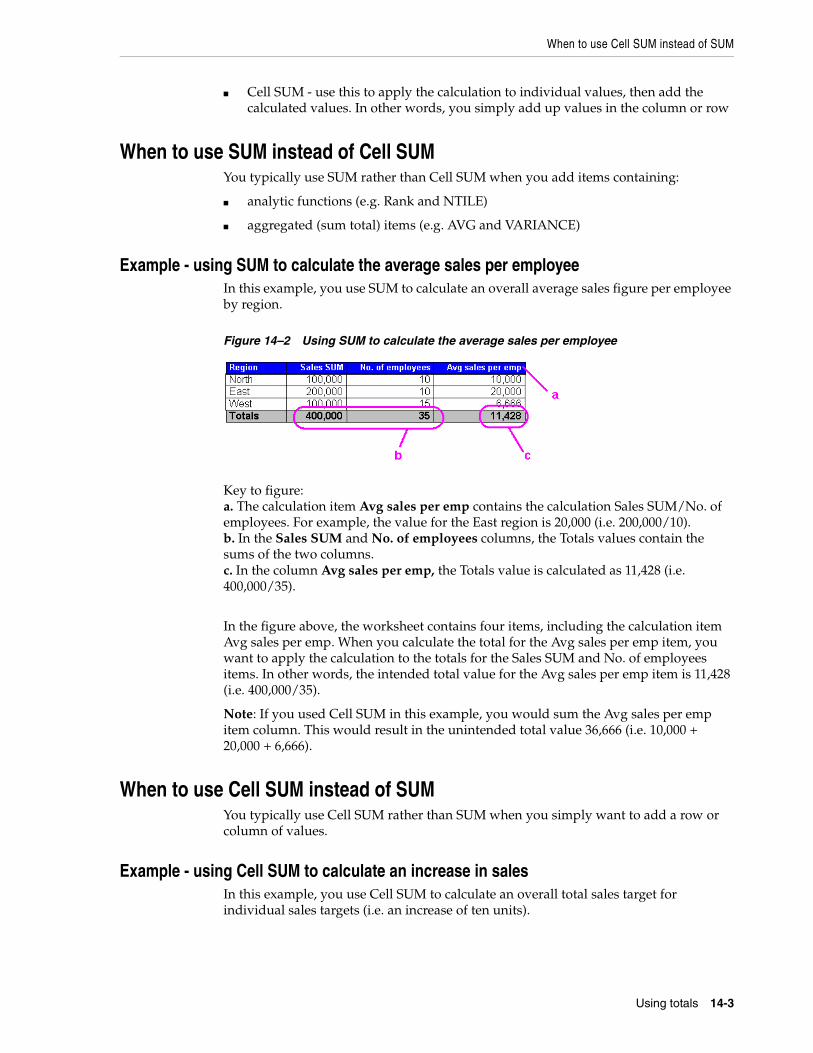
When to use Cell SUM instead of SUM
Using totals 14-3
■ Cell SUM - use this to apply the calculation to individual values, then add the calculated values. In other words, you simply add up values in the column or row
When to use SUM instead of Cell SUMYou typically use SUM rather than Cell SUM when you add items containing:
■ analytic functions (e.g. Rank and NTILE)
■ aggregated (sum total) items (e.g. AVG and VARIANCE)
Example - using SUM to calculate the average sales per employeeIn this example, you use SUM to calculate an overall average sales figure per employee by region.
Figure 14–2 Using SUM to calculate the average sales per employee
Key to figure:a. The calculation item Avg sales per emp contains the calculation Sales SUM/No. of employees. For example, the value for the East region is 20,000 (i.e. 200,000/10).b. In the Sales SUM and No. of employees columns, the Totals values contain the sums of the two columns.c. In the column Avg sales per emp, the Totals value is calculated as 11,428 (i.e. 400,000/35).
In the figure above, the worksheet contains four items, including the calculation item Avg sales per emp. When you calculate the total for the Avg sales per emp item, you want to apply the calculation to the totals for the Sales SUM and No. of employees items. In other words, the intended total value for the Avg sales per emp item is 11,428 (i.e. 400,000/35).
Note: If you used Cell SUM in this example, you would sum the Avg sales per emp item column. This would result in the unintended total value 36,666 (i.e. 10,000 + 20,000 + 6,666).
When to use Cell SUM instead of SUMYou typically use Cell SUM rather than SUM when you simply want to add a row or column of values.
Example - using Cell SUM to calculate an increase in salesIn this example, you use Cell SUM to calculate an overall total sales target for individual sales targets (i.e. an increase of ten units).
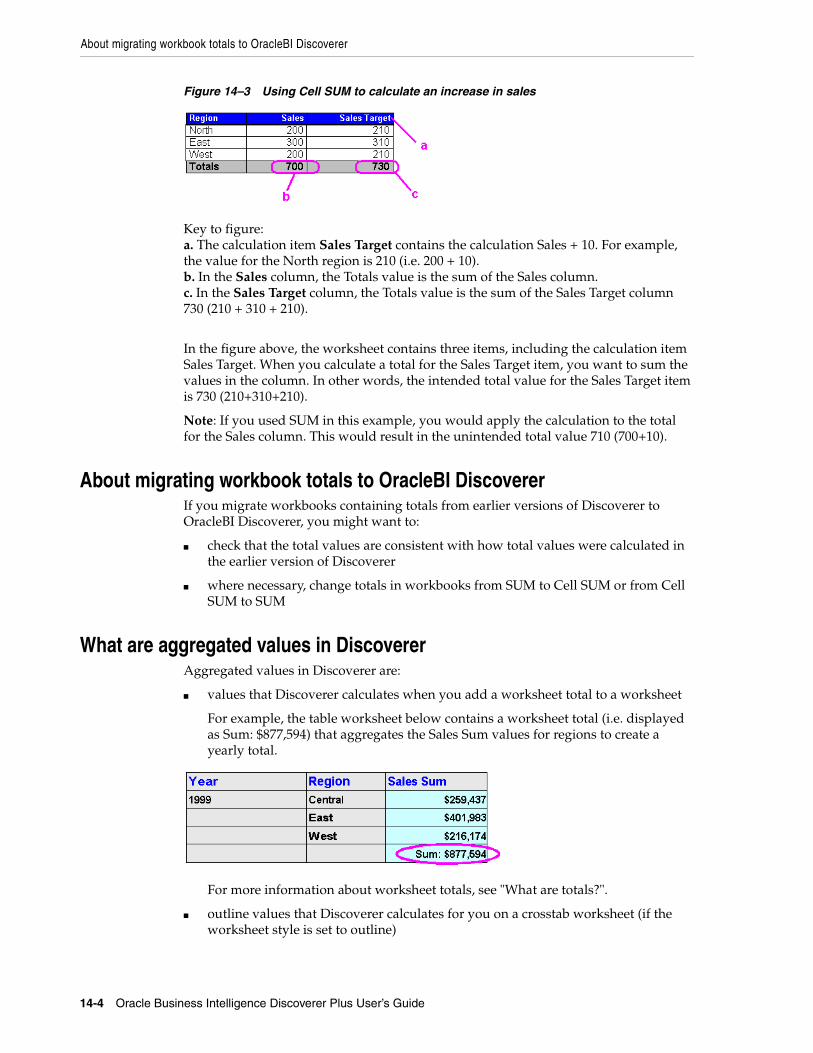
About migrating workbook totals to OracleBI Discoverer
14-4 Oracle Business Intelligence Discoverer Plus User’s Guide
Figure 14–3 Using Cell SUM to calculate an increase in sales
Key to figure:a. The calculation item Sales Target contains the calculation Sales + 10. For example, the value for the North region is 210 (i.e. 200 + 10).b. In the Sales column, the Totals value is the sum of the Sales column.c. In the Sales Target column, the Totals value is the sum of the Sales Target column 730 (210 + 310 + 210).
In the figure above, the worksheet contains three items, including the calculation item Sales Target. When you calculate a total for the Sales Target item, you want to sum the values in the column. In other words, the intended total value for the Sales Target item is 730 (210+310+210).
Note: If you used SUM in this example, you would apply the calculation to the total for the Sales column. This would result in the unintended total value 710 (700+10).
About migrating workbook totals to OracleBI DiscovererIf you migrate workbooks containing totals from earlier versions of Discoverer to OracleBI Discoverer, you might want to:
■ check that the total values are consistent with how total values were calculated in the earlier version of Discoverer
■ where necessary, change totals in workbooks from SUM to Cell SUM or from Cell SUM to SUM
What are aggregated values in DiscovererAggregated values in Discoverer are:
■ values that Discoverer calculates when you add a worksheet total to a worksheet
For example, the table worksheet below contains a worksheet total (i.e. displayed as Sum: $877,594) that aggregates the Sales Sum values for regions to create a yearly total.
For more information about worksheet totals, see "What are totals?".
■ outline values that Discoverer calculates for you on a crosstab worksheet (if the worksheet style is set to outline)
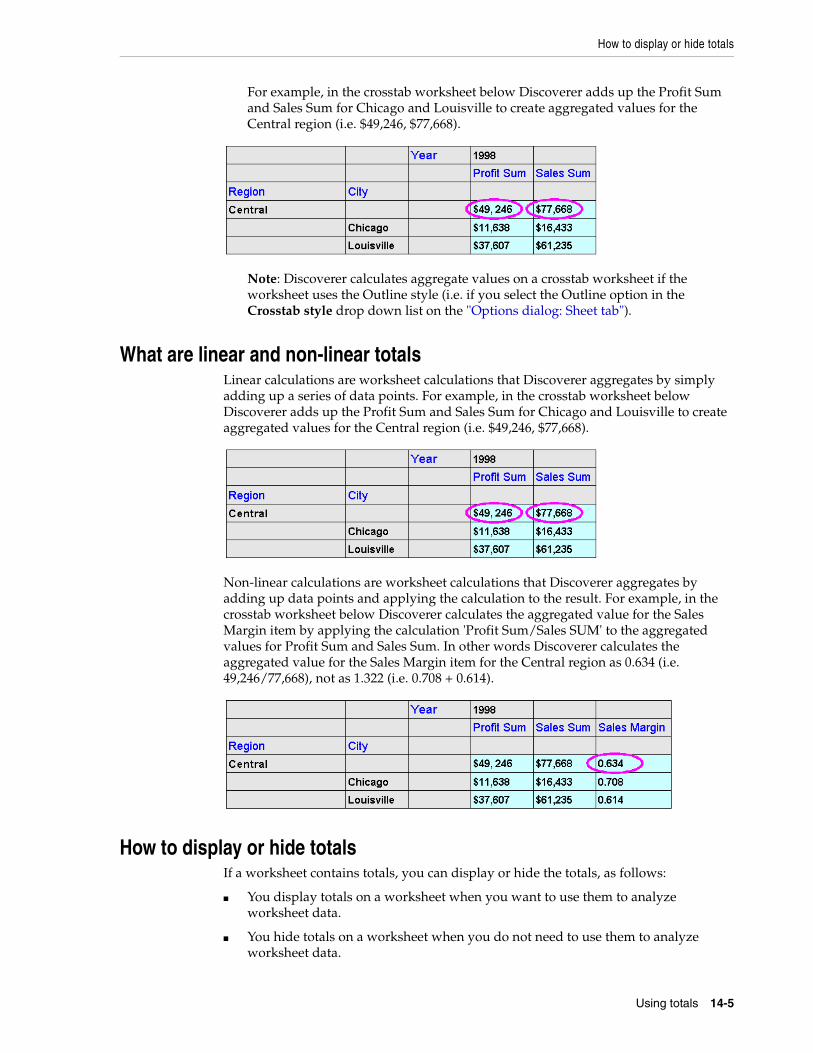
How to display or hide totals
Using totals 14-5
For example, in the crosstab worksheet below Discoverer adds up the Profit Sum and Sales Sum for Chicago and Louisville to create aggregated values for the Central region (i.e. $49,246, $77,668).
Note: Discoverer calculates aggregate values on a crosstab worksheet if the worksheet uses the Outline style (i.e. if you select the Outline option in the Crosstab style drop down list on the "Options dialog: Sheet tab").
What are linear and non-linear totalsLinear calculations are worksheet calculations that Discoverer aggregates by simply adding up a series of data points. For example, in the crosstab worksheet below Discoverer adds up the Profit Sum and Sales Sum for Chicago and Louisville to create aggregated values for the Central region (i.e. $49,246, $77,668).
Non-linear calculations are worksheet calculations that Discoverer aggregates by adding up data points and applying the calculation to the result. For example, in the crosstab worksheet below Discoverer calculates the aggregated value for the Sales Margin item by applying the calculation 'Profit Sum/Sales SUM' to the aggregated values for Profit Sum and Sales Sum. In other words Discoverer calculates the aggregated value for the Sales Margin item for the Central region as 0.634 (i.e. 49,246/77,668), not as 1.322 (i.e. 0.708 + 0.614).
How to display or hide totalsIf a worksheet contains totals, you can display or hide the totals, as follows:
■ You display totals on a worksheet when you want to use them to analyze worksheet data.
■ You hide totals on a worksheet when you do not need to use them to analyze worksheet data.
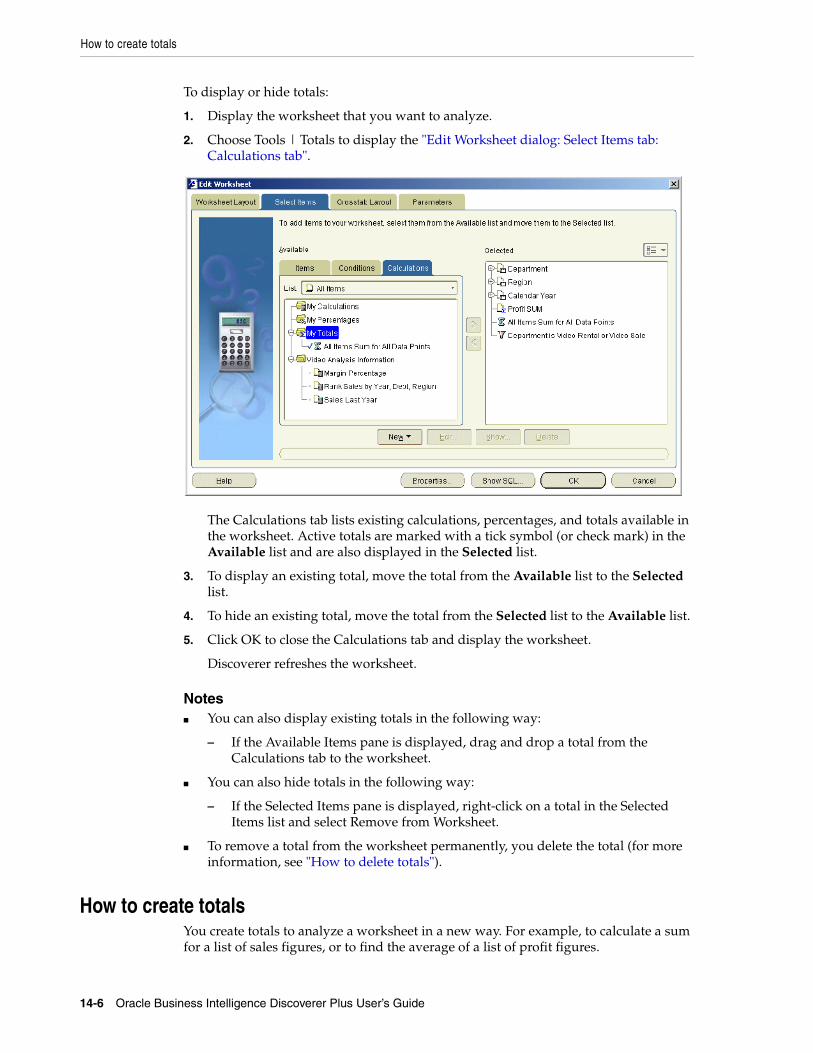
How to create totals
14-6 Oracle Business Intelligence Discoverer Plus User’s Guide
To display or hide totals:
1. Display the worksheet that you want to analyze.
2. Choose Tools | Totals to display the "Edit Worksheet dialog: Select Items tab: Calculations tab".
The Calculations tab lists existing calculations, percentages, and totals available in the worksheet. Active totals are marked with a tick symbol (or check mark) in the Available list and are also displayed in the Selected list.
3. To display an existing total, move the total from the Available list to the Selected list.
4. To hide an existing total, move the total from the Selected list to the Available list.
5. Click OK to close the Calculations tab and display the worksheet.
Discoverer refreshes the worksheet.
Notes■ You can also display existing totals in the following way:
– If the Available Items pane is displayed, drag and drop a total from the Calculations tab to the worksheet.
■ You can also hide totals in the following way:
– If the Selected Items pane is displayed, right-click on a total in the Selected Items list and select Remove from Worksheet.
■ To remove a total from the worksheet permanently, you delete the total (for more information, see "How to delete totals").
How to create totalsYou create totals to analyze a worksheet in a new way. For example, to calculate a sum for a list of sales figures, or to find the average of a list of profit figures.
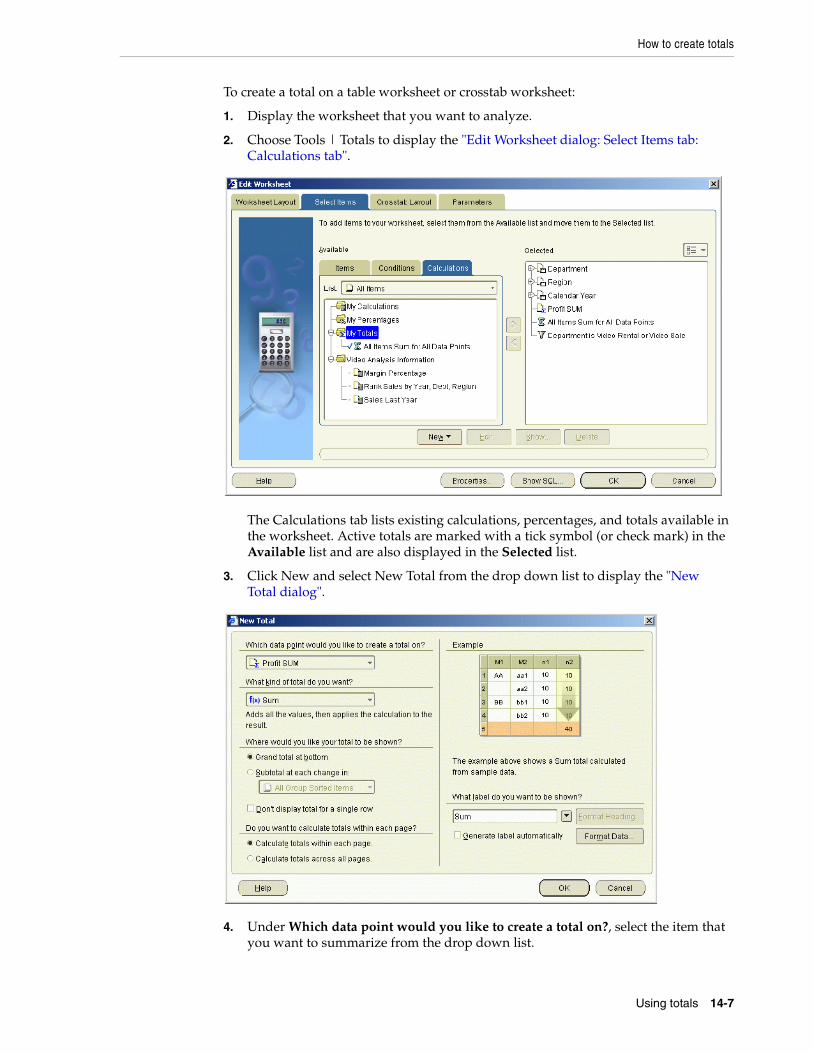
How to create totals
Using totals 14-7
To create a total on a table worksheet or crosstab worksheet:
1. Display the worksheet that you want to analyze.
2. Choose Tools | Totals to display the "Edit Worksheet dialog: Select Items tab: Calculations tab".
The Calculations tab lists existing calculations, percentages, and totals available in the worksheet. Active totals are marked with a tick symbol (or check mark) in the Available list and are also displayed in the Selected list.
3. Click New and select New Total from the drop down list to display the "New Total dialog".
4. Under Which data point would you like to create a total on?, select the item that you want to summarize from the drop down list.
How to create totals
14-8 Oracle Business Intelligence Discoverer Plus User’s Guide
Note: You can also create totals for all numeric items on the worksheet by selecting All Data Points from the drop-down list.
5. Under What kind of total do you want?, select a total type from the drop down list.
For example, choose Sum to add the values, or choose Average to calculate a mean.
6. Under Where would you like your total to be shown?, choose where you want to display the total.
For example, select the Grand total at bottom radio button to calculate a grand total for a column and place it after the last row of the table.
Note: Positioning options are different depending on the type of worksheet, as follows:
■ on table worksheets, you can position the total at the bottom of the worksheet
■ on crosstab worksheets, you can position the total at the bottom of the worksheet or on the right of the worksheet
7. If you select the Subtotal at each change in radio button, select the item on which to group the data from the drop down list.
For example, if you sort the data by region you might want to see profits by region. If so, select region as the data item and Discoverer will display the total profit for each region on a separate line.
8. Under What label do you want to be shown?, do one of the following:
■ type in a label for the total
■ use the drop down list to insert variable values into the label.
Note: Select the Generate label automatically? check box if you want Discoverer to generate a label for you.
9. Click OK to save the details and close the dialog.
10. Click OK to close the Calculations tab and return to the worksheet.
Discoverer calculates the total and displays it on the worksheet.
Notes■ You can also create a new total in the following ways:
– Select the worksheet item for which you want to create a total, then select the New Total option on the Standard toolbar and choose one of the total types available.
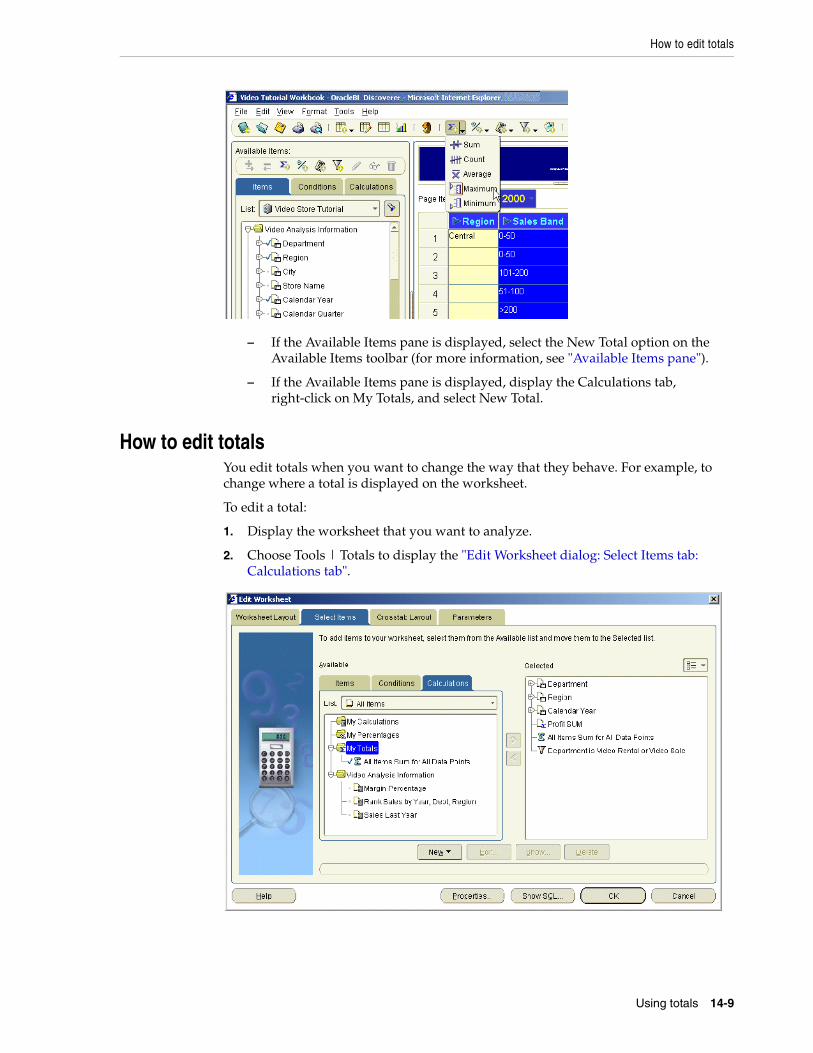
How to edit totals
Using totals 14-9
– If the Available Items pane is displayed, select the New Total option on the Available Items toolbar (for more information, see "Available Items pane").
– If the Available Items pane is displayed, display the Calculations tab, right-click on My Totals, and select New Total.
How to edit totalsYou edit totals when you want to change the way that they behave. For example, to change where a total is displayed on the worksheet.
To edit a total:
1. Display the worksheet that you want to analyze.
2. Choose Tools | Totals to display the "Edit Worksheet dialog: Select Items tab: Calculations tab".
How to delete totals
14-10 Oracle Business Intelligence Discoverer Plus User’s Guide
The Calculations tab lists existing calculations, percentages, and totals available in the worksheet. Active totals are marked with a tick symbol (or check mark) in the Available list and are also displayed in the Selected list.
3. Select a total in the Available list.
4. Click Edit to display the "Edit Total dialog".
5. Edit the total details as required.
6. Click OK to save the details and close the Edit Total dialog.
7. Click OK to close the Calculations tab and return to the worksheet.
Discoverer refreshes the worksheet.
Notes■ You can also edit totals in the following way:
– If the Available Items pane is displayed, display the Calculations tab, right-click on a total, and select Edit.
■ You can change the format of totals on a worksheet using Format | Item Formats to display the "Format dialog". Then, select the total from the item list and choose Format Heading or Format Data.
How to delete totals You delete totals when you no longer want to use them, and want to remove them permanently from a worksheet. For example, you might have created a temporary total to produce an ad hoc report and now want to remove this total from the worksheet.
Note: If you want to remove the total from the worksheet without deleting it permanently, you can hide the total (see "How to display or hide totals").
To delete a total:
1. Display the worksheet that you want to analyze.
2. Choose Tools | Totals to display the "Edit Worksheet dialog: Select Items tab: Calculations tab".
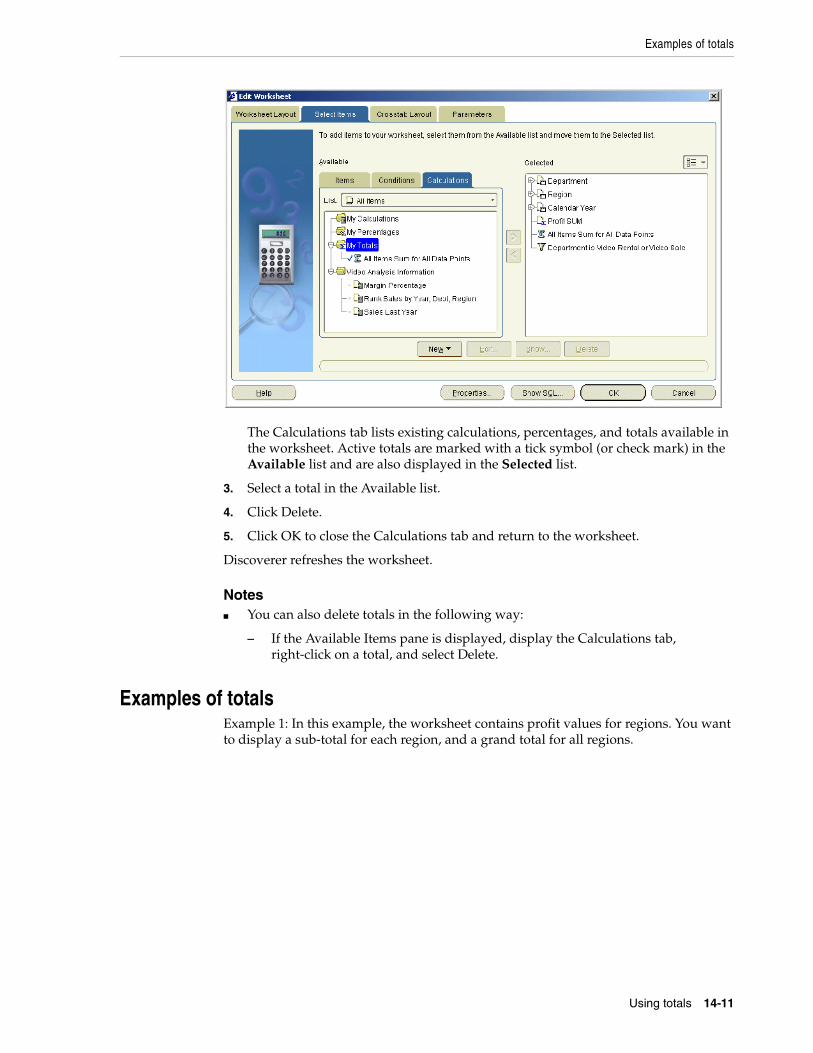
Examples of totals
Using totals 14-11
The Calculations tab lists existing calculations, percentages, and totals available in the worksheet. Active totals are marked with a tick symbol (or check mark) in the Available list and are also displayed in the Selected list.
3. Select a total in the Available list.
4. Click Delete.
5. Click OK to close the Calculations tab and return to the worksheet.
Discoverer refreshes the worksheet.
Notes■ You can also delete totals in the following way:
– If the Available Items pane is displayed, display the Calculations tab, right-click on a total, and select Delete.
Examples of totalsExample 1: In this example, the worksheet contains profit values for regions. You want to display a sub-total for each region, and a grand total for all regions.

Examples of totals
14-12 Oracle Business Intelligence Discoverer Plus User’s Guide
Figure 14–4 Displaying a total on a table worksheet
Key to figure:a. A sub-total for each region (Total for Central: £94,651).b. A grand total for all regions (Total for All Values: £320,301).
Example 2: In this example, a crosstab worksheet contains profit values for regions in different years. You want to display a profit total of all three years for each region.
Figure 14–5 Displaying a total on a crosstab worksheet
Key to figure:a. A total item named 'Sum' on rows, which calculates a total for each Region. For example, the total for the Central region is £234,498.
Example 3: In this example, the worksheet contains profit and sales values for each quarter in the Central region. You want to display a total profit figure and a total sales figure.
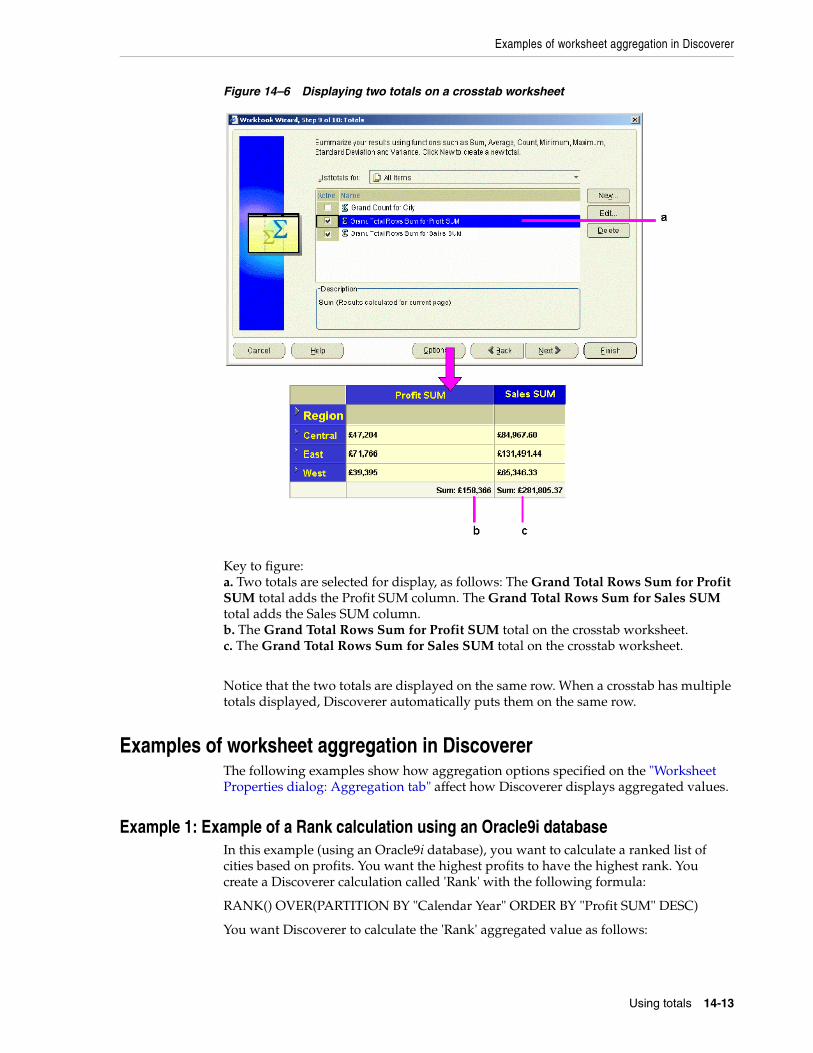
Examples of worksheet aggregation in Discoverer
Using totals 14-13
Figure 14–6 Displaying two totals on a crosstab worksheet
Key to figure:a. Two totals are selected for display, as follows: The Grand Total Rows Sum for Profit SUM total adds the Profit SUM column. The Grand Total Rows Sum for Sales SUM total adds the Sales SUM column.b. The Grand Total Rows Sum for Profit SUM total on the crosstab worksheet.c. The Grand Total Rows Sum for Sales SUM total on the crosstab worksheet.
Notice that the two totals are displayed on the same row. When a crosstab has multiple totals displayed, Discoverer automatically puts them on the same row.
Examples of worksheet aggregation in DiscovererThe following examples show how aggregation options specified on the "Worksheet Properties dialog: Aggregation tab" affect how Discoverer displays aggregated values.
Example 1: Example of a Rank calculation using an Oracle9i databaseIn this example (using an Oracle9i database), you want to calculate a ranked list of cities based on profits. You want the highest profits to have the highest rank. You create a Discoverer calculation called 'Rank' with the following formula:
RANK() OVER(PARTITION BY "Calendar Year" ORDER BY "Profit SUM" DESC)
You want Discoverer to calculate the 'Rank' aggregated value as follows:
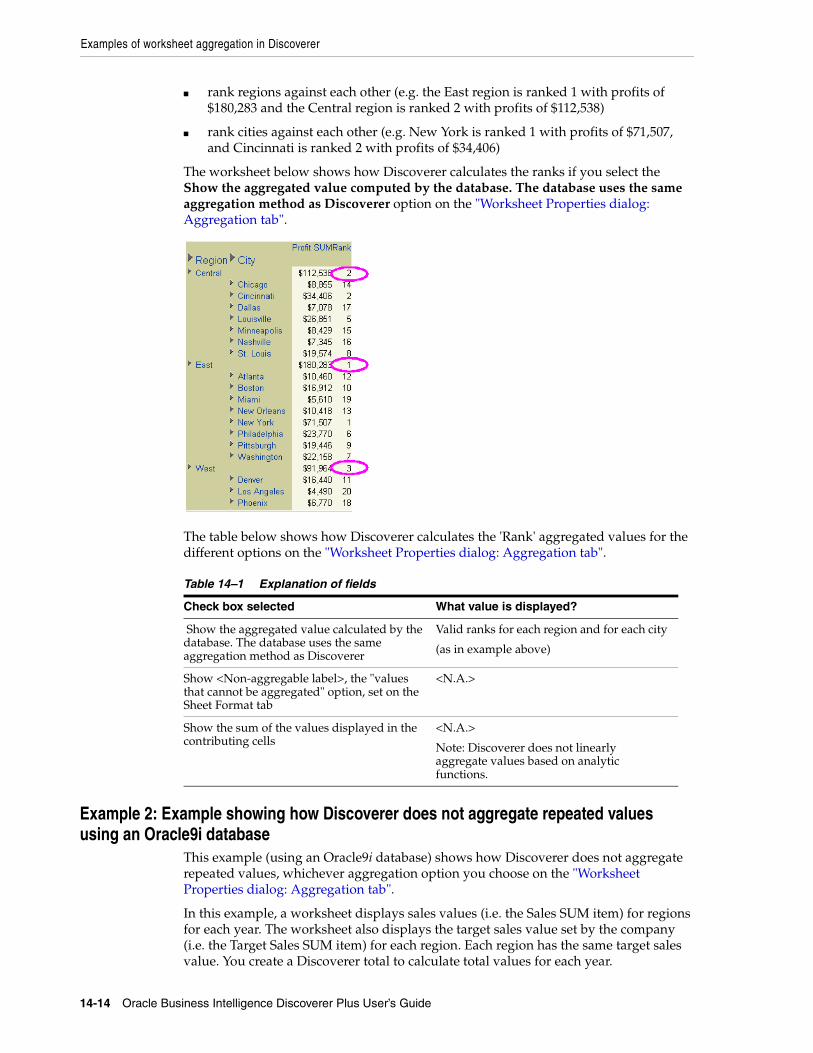
Examples of worksheet aggregation in Discoverer
14-14 Oracle Business Intelligence Discoverer Plus User’s Guide
■ rank regions against each other (e.g. the East region is ranked 1 with profits of $180,283 and the Central region is ranked 2 with profits of $112,538)
■ rank cities against each other (e.g. New York is ranked 1 with profits of $71,507, and Cincinnati is ranked 2 with profits of $34,406)
The worksheet below shows how Discoverer calculates the ranks if you select the Show the aggregated value computed by the database. The database uses the same aggregation method as Discoverer option on the "Worksheet Properties dialog: Aggregation tab".
The table below shows how Discoverer calculates the 'Rank' aggregated values for the different options on the "Worksheet Properties dialog: Aggregation tab".
Example 2: Example showing how Discoverer does not aggregate repeated values using an Oracle9i database
This example (using an Oracle9i database) shows how Discoverer does not aggregate repeated values, whichever aggregation option you choose on the "Worksheet Properties dialog: Aggregation tab".
In this example, a worksheet displays sales values (i.e. the Sales SUM item) for regions for each year. The worksheet also displays the target sales value set by the company (i.e. the Target Sales SUM item) for each region. Each region has the same target sales value. You create a Discoverer total to calculate total values for each year.
Table 14–1 Explanation of fields
Check box selected What value is displayed?
Show the aggregated value calculated by the database. The database uses the same aggregation method as Discoverer
Valid ranks for each region and for each city
(as in example above)
Show <Non-aggregable label>, the "values that cannot be aggregated" option, set on the Sheet Format tab
<N.A.>
Show the sum of the values displayed in the contributing cells
<N.A.>
Note: Discoverer does not linearly aggregate values based on analytic functions.

Examples of worksheet aggregation in Discoverer
Using totals 14-15
It is not meaningful to aggregate Target Sales Sum values at the Year level because there is no logical relationship between the Sales item and the Target Sales item. If you are familiar with entity-relationship diagrams, the figure below shows that this is because the Sales SUM item is dimensioned by store (i.e. in the Sales Facts table) but the Target Sales Sum item is dimensioned by date (i.e. in the Date table).
Therefore, you want Discoverer to display a non-aggregable label (e.g. N.A.) for the yearly total values for the Target Sales Sum item. The worksheet below shows how Discoverer displays a non-aggregable label (i.e. N.A.) for the yearly totals for the Target Sales Sum item (regardless of which aggregation option you choose on the "Worksheet Properties dialog: Aggregation tab".
The table below shows how Discoverer the Target Sales Sum aggregates are calculated for the different radio button options on the "Worksheet Properties dialog: Aggregation tab".
Table 14–2 Explanation of fields
Check box selected What value is displayed?
Show the aggregated value calculated by the database. The database uses the same aggregation method as Discoverer
N.A.
Show <Non-aggregable label>, the "values that cannot be aggregated" option, set on the Sheet Format tab
N.A.
Show the sum of the values displayed in the contributing cells
N.A.

Examples of worksheet aggregation in Discoverer
14-16 Oracle Business Intelligence Discoverer Plus User’s Guide
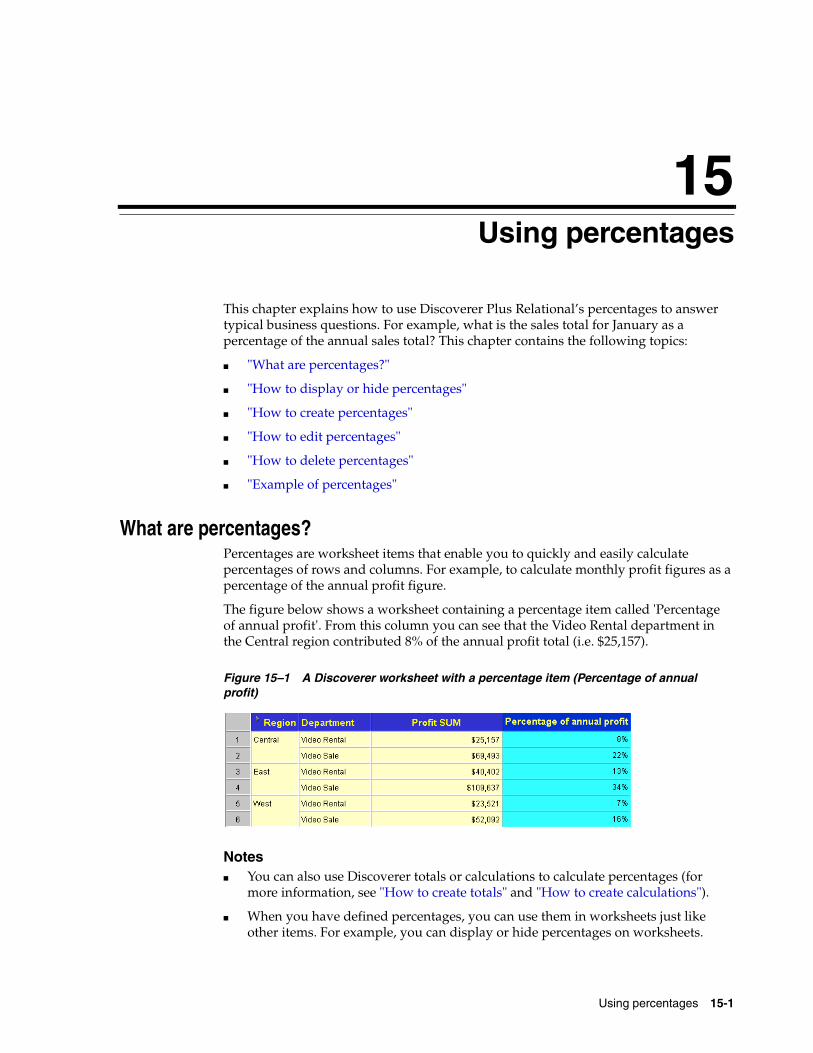
Using percentages 15-1
15 Using percentages
This chapter explains how to use Discoverer Plus Relational’s percentages to answer typical business questions. For example, what is the sales total for January as a percentage of the annual sales total? This chapter contains the following topics:
■ "What are percentages?"
■ "How to display or hide percentages"
■ "How to create percentages"
■ "How to edit percentages"
■ "How to delete percentages"
■ "Example of percentages"
What are percentages?Percentages are worksheet items that enable you to quickly and easily calculate percentages of rows and columns. For example, to calculate monthly profit figures as a percentage of the annual profit figure.
The figure below shows a worksheet containing a percentage item called 'Percentage of annual profit'. From this column you can see that the Video Rental department in the Central region contributed 8% of the annual profit total (i.e. $25,157).
Figure 15–1 A Discoverer worksheet with a percentage item (Percentage of annual profit)
Notes■ You can also use Discoverer totals or calculations to calculate percentages (for
more information, see "How to create totals" and "How to create calculations").
■ When you have defined percentages, you can use them in worksheets just like other items. For example, you can display or hide percentages on worksheets.
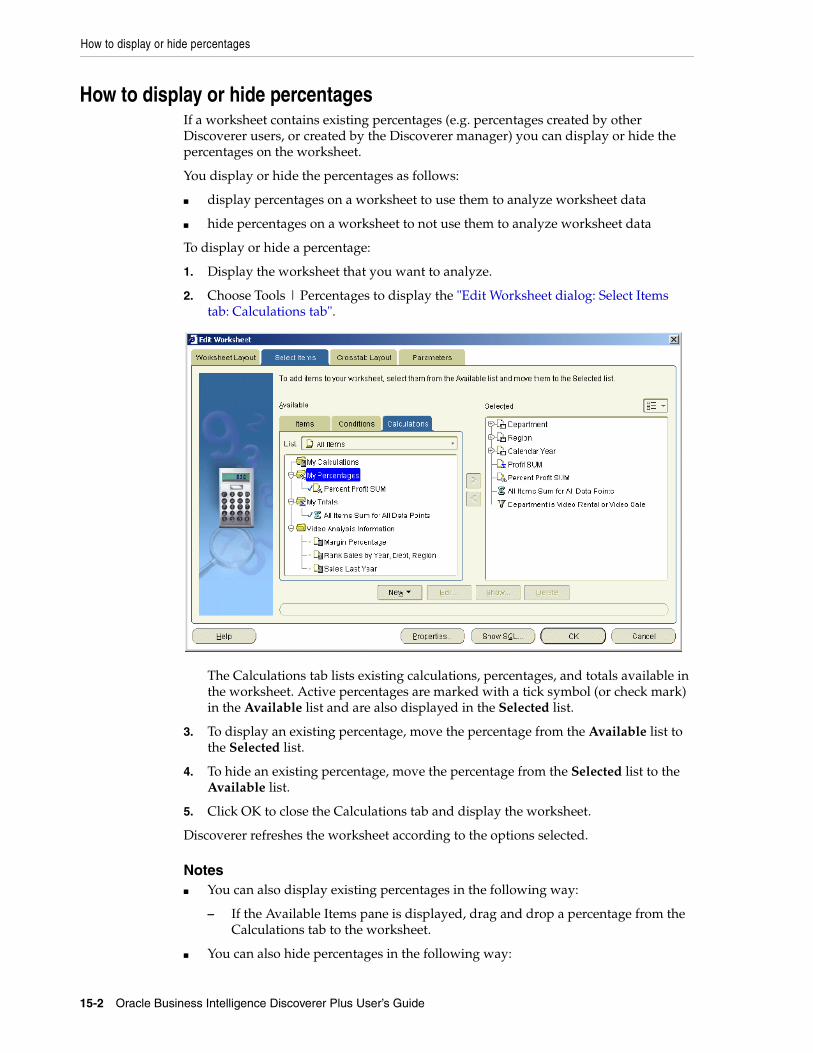
How to display or hide percentages
15-2 Oracle Business Intelligence Discoverer Plus User’s Guide
How to display or hide percentagesIf a worksheet contains existing percentages (e.g. percentages created by other Discoverer users, or created by the Discoverer manager) you can display or hide the percentages on the worksheet.
You display or hide the percentages as follows:
■ display percentages on a worksheet to use them to analyze worksheet data
■ hide percentages on a worksheet to not use them to analyze worksheet data
To display or hide a percentage:
1. Display the worksheet that you want to analyze.
2. Choose Tools | Percentages to display the "Edit Worksheet dialog: Select Items tab: Calculations tab".
The Calculations tab lists existing calculations, percentages, and totals available in the worksheet. Active percentages are marked with a tick symbol (or check mark) in the Available list and are also displayed in the Selected list.
3. To display an existing percentage, move the percentage from the Available list to the Selected list.
4. To hide an existing percentage, move the percentage from the Selected list to the Available list.
5. Click OK to close the Calculations tab and display the worksheet.
Discoverer refreshes the worksheet according to the options selected.
Notes■ You can also display existing percentages in the following way:
– If the Available Items pane is displayed, drag and drop a percentage from the Calculations tab to the worksheet.
■ You can also hide percentages in the following way:
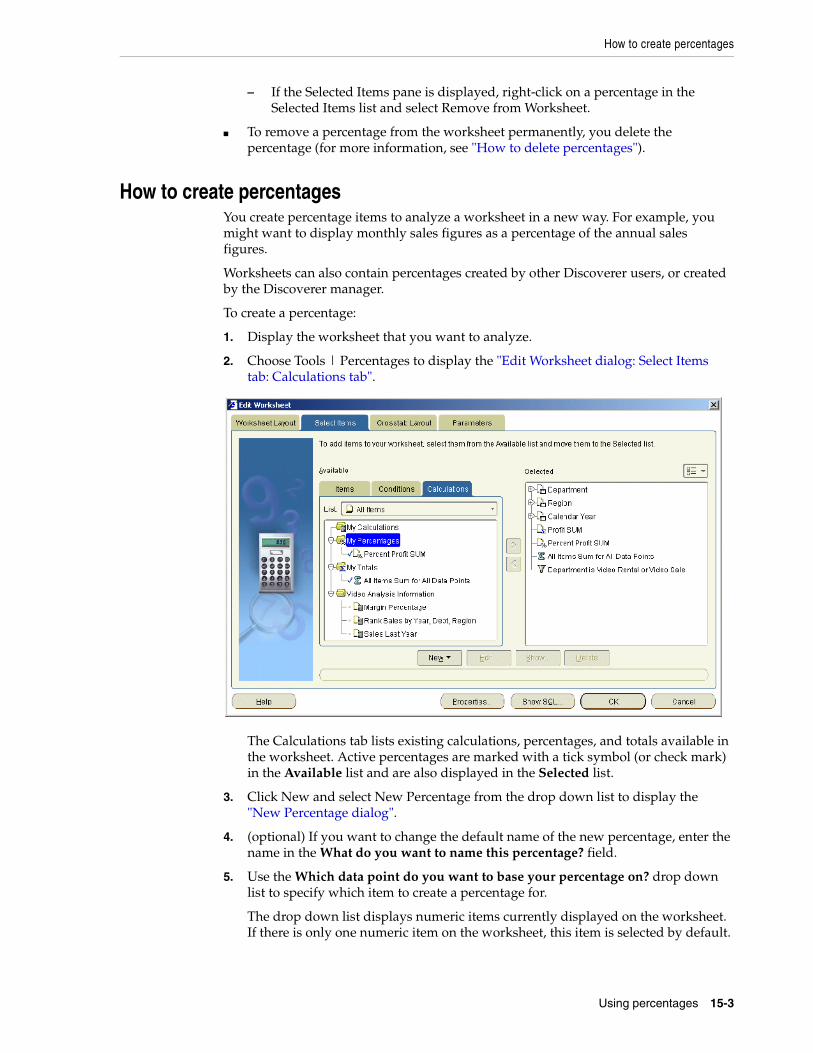
How to create percentages
Using percentages 15-3
– If the Selected Items pane is displayed, right-click on a percentage in the Selected Items list and select Remove from Worksheet.
■ To remove a percentage from the worksheet permanently, you delete the percentage (for more information, see "How to delete percentages").
How to create percentagesYou create percentage items to analyze a worksheet in a new way. For example, you might want to display monthly sales figures as a percentage of the annual sales figures.
Worksheets can also contain percentages created by other Discoverer users, or created by the Discoverer manager.
To create a percentage:
1. Display the worksheet that you want to analyze.
2. Choose Tools | Percentages to display the "Edit Worksheet dialog: Select Items tab: Calculations tab".
The Calculations tab lists existing calculations, percentages, and totals available in the worksheet. Active percentages are marked with a tick symbol (or check mark) in the Available list and are also displayed in the Selected list.
3. Click New and select New Percentage from the drop down list to display the "New Percentage dialog".
4. (optional) If you want to change the default name of the new percentage, enter the name in the What do you want to name this percentage? field.
5. Use the Which data point do you want to base your percentage on? drop down list to specify which item to create a percentage for.
The drop down list displays numeric items currently displayed on the worksheet. If there is only one numeric item on the worksheet, this item is selected by default.
How to create percentages
15-4 Oracle Business Intelligence Discoverer Plus User’s Guide
6. Use the Calculate as a percentage of radio buttons to choose where to display the percentage, as follows:
■ Select the Grand total of all values radio button to calculate the values as a percentage of the whole column.
■ Select the Subtotal at each change in radio button, then choose the item on which to group the data from the drop down list below.
For example, if the worksheet data is grouped by region, select region here to calculate a percentage sub-total for each region.
7. Use the Do you want to calculate percentages within each page? radio buttons to choose whether to calculate percentages for each page, or for all pages.
8. Use the Which totals do you want to be shown? check boxes to specify how to display grand totals and subtotals.
The options available depend on whether you have selected the Grand total of all values radio button, or the Subtotal at each change in radio button.
■ (optional) If you selected the Grand total of all values radio button, select the Show grand total and grand total percentage check box to calculate total values at the bottom of the worksheet.
You can also specify a label for the total, and click Format Heading and Format Data to specify how it looks on the worksheet.
■ (optional) If you selected the Subtotal at each change in radio button, select the Show subtotal and subtotal percentage check box to calculate subtotal values for each data sub-group.
■ (optional) If you selected the Subtotal at each change in radio button, select the Show the percentage of the grand total for each subtotal option to display the sub-group total as a percentage of the total value for all groups.
9. Click OK to save the details and display the Percentages dialog.
10. Click OK to close the Calculations tab and return to the worksheet.
Discoverer calculates the percentages and displays them on the worksheet.
Notes■ You can also create a new percentage in the following ways:
– Select the worksheet item for which you want to create a percentage, then select the New Percentage option on the Standard toolbar and choose one of the percentage types available.
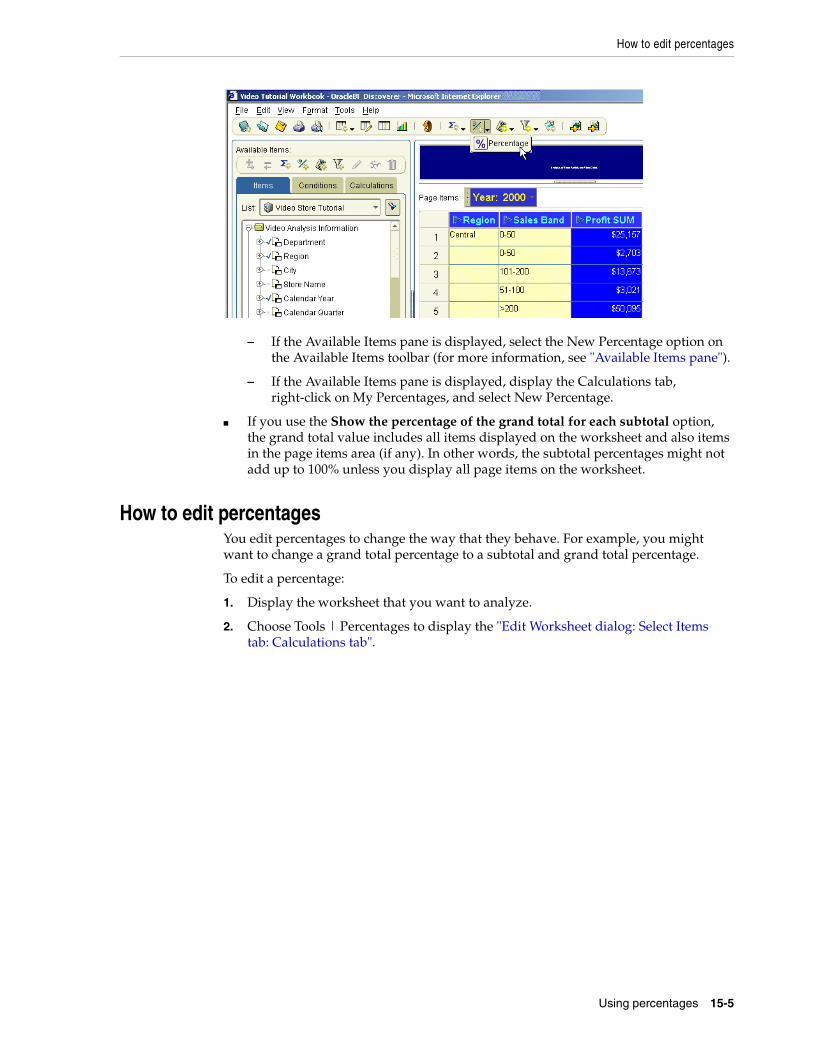
How to edit percentages
Using percentages 15-5
– If the Available Items pane is displayed, select the New Percentage option on the Available Items toolbar (for more information, see "Available Items pane").
– If the Available Items pane is displayed, display the Calculations tab, right-click on My Percentages, and select New Percentage.
■ If you use the Show the percentage of the grand total for each subtotal option, the grand total value includes all items displayed on the worksheet and also items in the page items area (if any). In other words, the subtotal percentages might not add up to 100% unless you display all page items on the worksheet.
How to edit percentagesYou edit percentages to change the way that they behave. For example, you might want to change a grand total percentage to a subtotal and grand total percentage.
To edit a percentage:
1. Display the worksheet that you want to analyze.
2. Choose Tools | Percentages to display the "Edit Worksheet dialog: Select Items tab: Calculations tab".
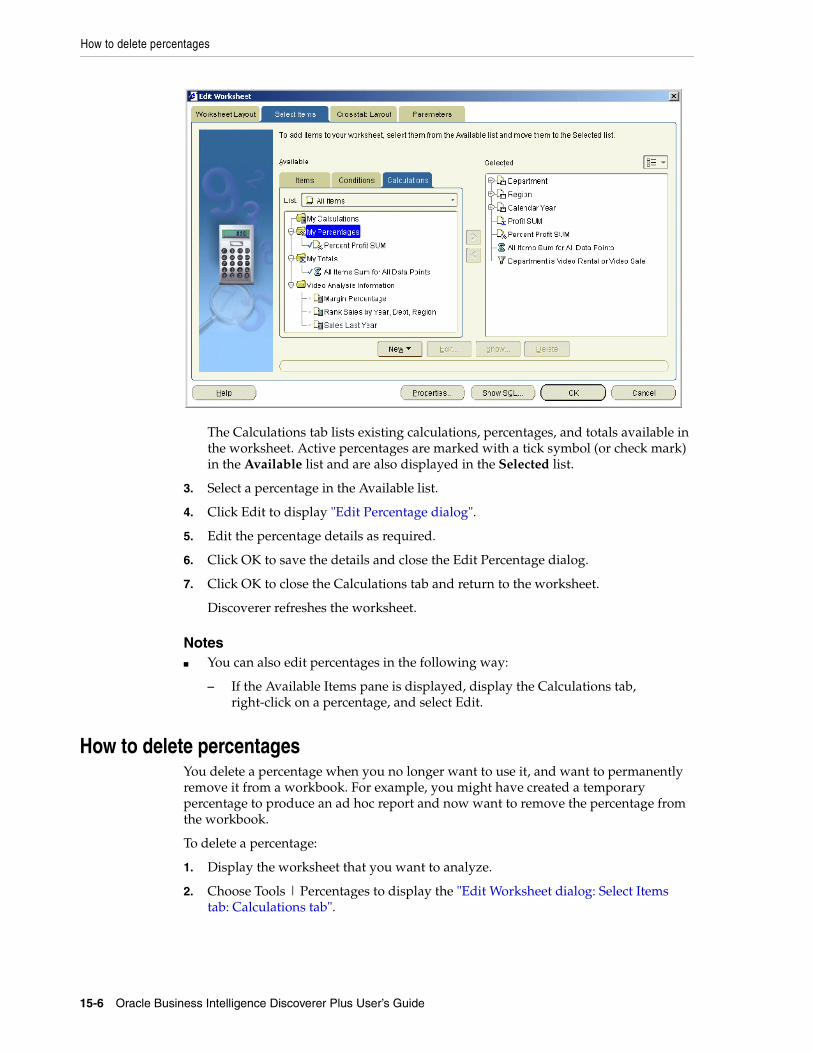
How to delete percentages
15-6 Oracle Business Intelligence Discoverer Plus User’s Guide
The Calculations tab lists existing calculations, percentages, and totals available in the worksheet. Active percentages are marked with a tick symbol (or check mark) in the Available list and are also displayed in the Selected list.
3. Select a percentage in the Available list.
4. Click Edit to display "Edit Percentage dialog".
5. Edit the percentage details as required.
6. Click OK to save the details and close the Edit Percentage dialog.
7. Click OK to close the Calculations tab and return to the worksheet.
Discoverer refreshes the worksheet.
Notes■ You can also edit percentages in the following way:
– If the Available Items pane is displayed, display the Calculations tab, right-click on a percentage, and select Edit.
How to delete percentagesYou delete a percentage when you no longer want to use it, and want to permanently remove it from a workbook. For example, you might have created a temporary percentage to produce an ad hoc report and now want to remove the percentage from the workbook.
To delete a percentage:
1. Display the worksheet that you want to analyze.
2. Choose Tools | Percentages to display the "Edit Worksheet dialog: Select Items tab: Calculations tab".
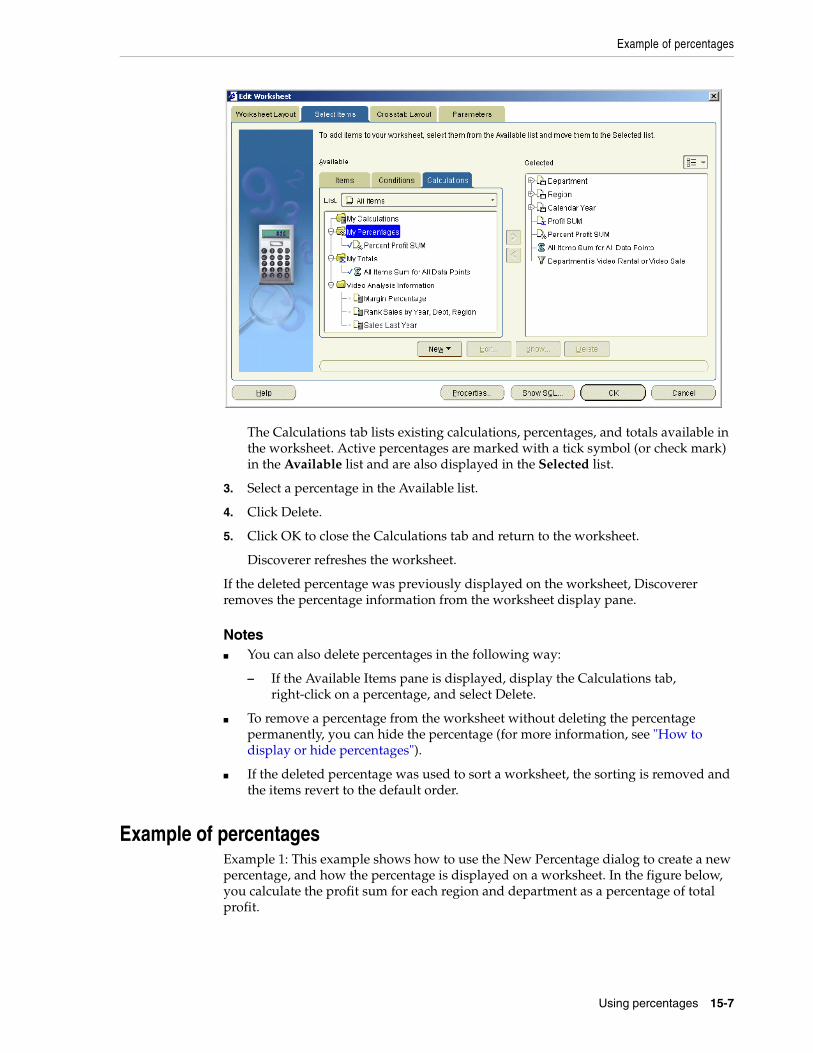
Example of percentages
Using percentages 15-7
The Calculations tab lists existing calculations, percentages, and totals available in the worksheet. Active percentages are marked with a tick symbol (or check mark) in the Available list and are also displayed in the Selected list.
3. Select a percentage in the Available list.
4. Click Delete.
5. Click OK to close the Calculations tab and return to the worksheet.
Discoverer refreshes the worksheet.
If the deleted percentage was previously displayed on the worksheet, Discoverer removes the percentage information from the worksheet display pane.
Notes■ You can also delete percentages in the following way:
– If the Available Items pane is displayed, display the Calculations tab, right-click on a percentage, and select Delete.
■ To remove a percentage from the worksheet without deleting the percentage permanently, you can hide the percentage (for more information, see "How to display or hide percentages").
■ If the deleted percentage was used to sort a worksheet, the sorting is removed and the items revert to the default order.
Example of percentagesExample 1: This example shows how to use the New Percentage dialog to create a new percentage, and how the percentage is displayed on a worksheet. In the figure below, you calculate the profit sum for each region and department as a percentage of total profit.
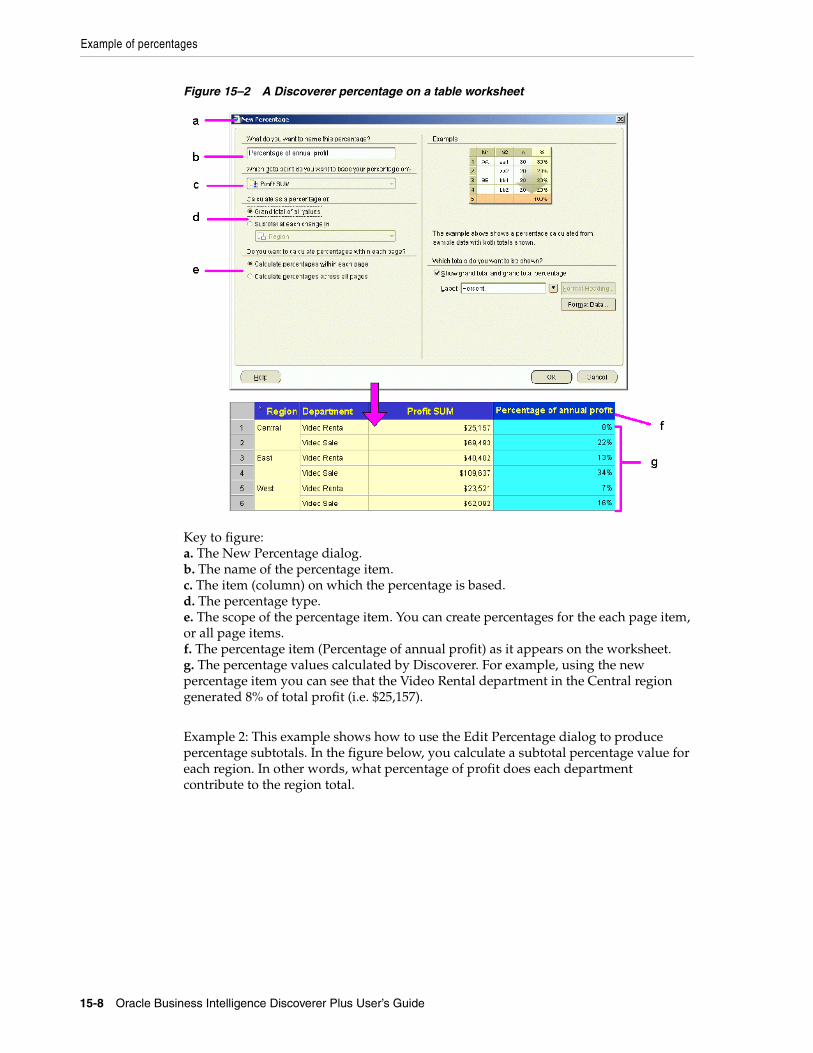
Example of percentages
15-8 Oracle Business Intelligence Discoverer Plus User’s Guide
Figure 15–2 A Discoverer percentage on a table worksheet
Key to figure:a. The New Percentage dialog.b. The name of the percentage item.c. The item (column) on which the percentage is based.d. The percentage type.e. The scope of the percentage item. You can create percentages for the each page item, or all page items.f. The percentage item (Percentage of annual profit) as it appears on the worksheet.g. The percentage values calculated by Discoverer. For example, using the new percentage item you can see that the Video Rental department in the Central region generated 8% of total profit (i.e. $25,157).
Example 2: This example shows how to use the Edit Percentage dialog to produce percentage subtotals. In the figure below, you calculate a subtotal percentage value for each region. In other words, what percentage of profit does each department contribute to the region total.
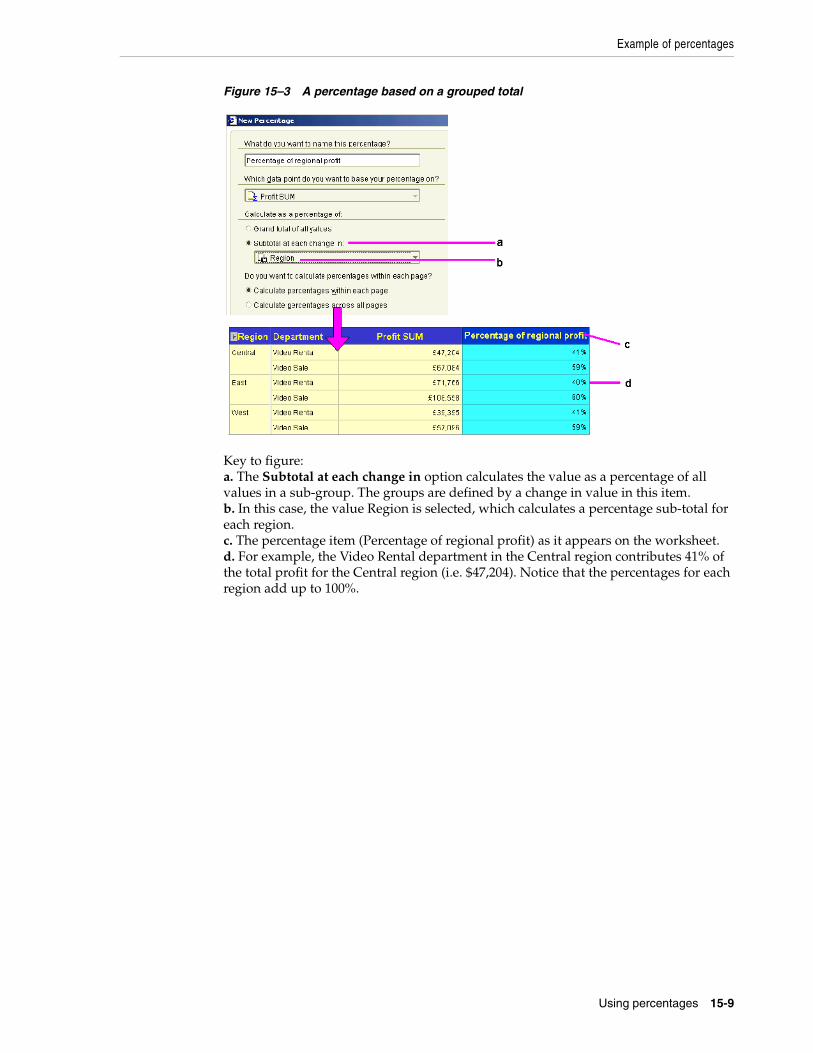
Example of percentages
Using percentages 15-9
Figure 15–3 A percentage based on a grouped total
Key to figure:a. The Subtotal at each change in option calculates the value as a percentage of all values in a sub-group. The groups are defined by a change in value in this item.b. In this case, the value Region is selected, which calculates a percentage sub-total for each region.c. The percentage item (Percentage of regional profit) as it appears on the worksheet.d. For example, the Video Rental department in the Central region contributes 41% of the total profit for the Central region (i.e. $47,204). Notice that the percentages for each region add up to 100%.

Example of percentages
15-10 Oracle Business Intelligence Discoverer Plus User’s Guide
Sorting data 16-1
16Sorting data
This chapter explains how to use Discoverer Plus Relational’s sorting capabilities such as alphabetical, numeric, and group sorting. This section contains the following topics:
■ "What is sorting?"
■ "About sorting on table worksheets"
■ "About sorting on crosstab worksheets"
■ "What is group sorting?"
■ "How to sort data on a table worksheet"
■ "How to sort data on a crosstab worksheet"
■ "How to change how worksheet data is sorted"
■ "How to remove sorting from a worksheet"
■ "Examples of sorting"
What is sorting?Sorting is the process of arranging data into meaningful order so that you can analyze it more effectively. For example, you might want to order sales data by calendar month so that you can produce a graph of sales performance. You can use Discoverer to sort data as follows:
■ sort text data into alphabetical order
■ sort numeric data into numerical order
■ group sort data to many levels, for example, you can sort on City within Month within Year
Sorting worksheet data also makes it easier to analyze. For example, you might want to sort sales data from most profitable sales to least profitable sales to show the relative position of your company’s best selling products.
Discoverer offers great flexibility when sorting data within data. You can do this to many different levels. For example, you can sort by City within Region.
Note: Discoverer sorts data according to the alphabetical or numeric sequence most appropriate for the local language. For more information about choosing a language when you start Discoverer, contact the Discoverer manager.
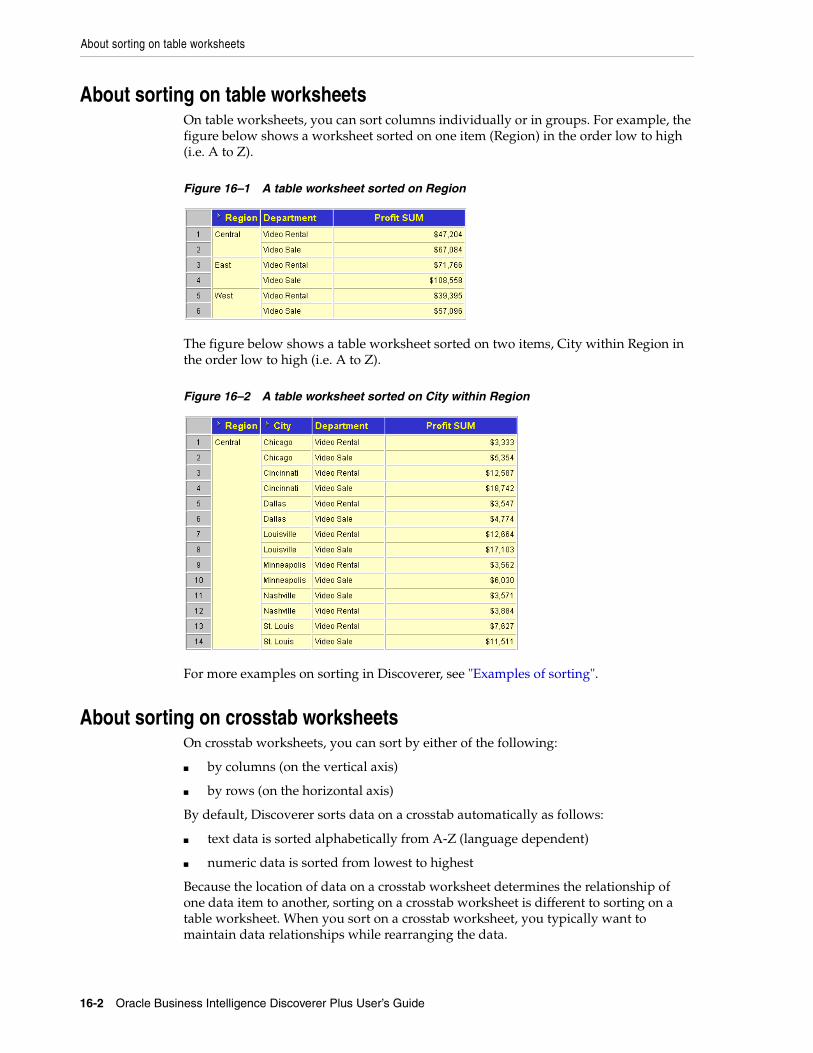
About sorting on table worksheets
16-2 Oracle Business Intelligence Discoverer Plus User’s Guide
About sorting on table worksheetsOn table worksheets, you can sort columns individually or in groups. For example, the figure below shows a worksheet sorted on one item (Region) in the order low to high (i.e. A to Z).
Figure 16–1 A table worksheet sorted on Region
The figure below shows a table worksheet sorted on two items, City within Region in the order low to high (i.e. A to Z).
Figure 16–2 A table worksheet sorted on City within Region
For more examples on sorting in Discoverer, see "Examples of sorting".
About sorting on crosstab worksheetsOn crosstab worksheets, you can sort by either of the following:
■ by columns (on the vertical axis)
■ by rows (on the horizontal axis)
By default, Discoverer sorts data on a crosstab automatically as follows:
■ text data is sorted alphabetically from A-Z (language dependent)
■ numeric data is sorted from lowest to highest
Because the location of data on a crosstab worksheet determines the relationship of one data item to another, sorting on a crosstab worksheet is different to sorting on a table worksheet. When you sort on a crosstab worksheet, you typically want to maintain data relationships while rearranging the data.
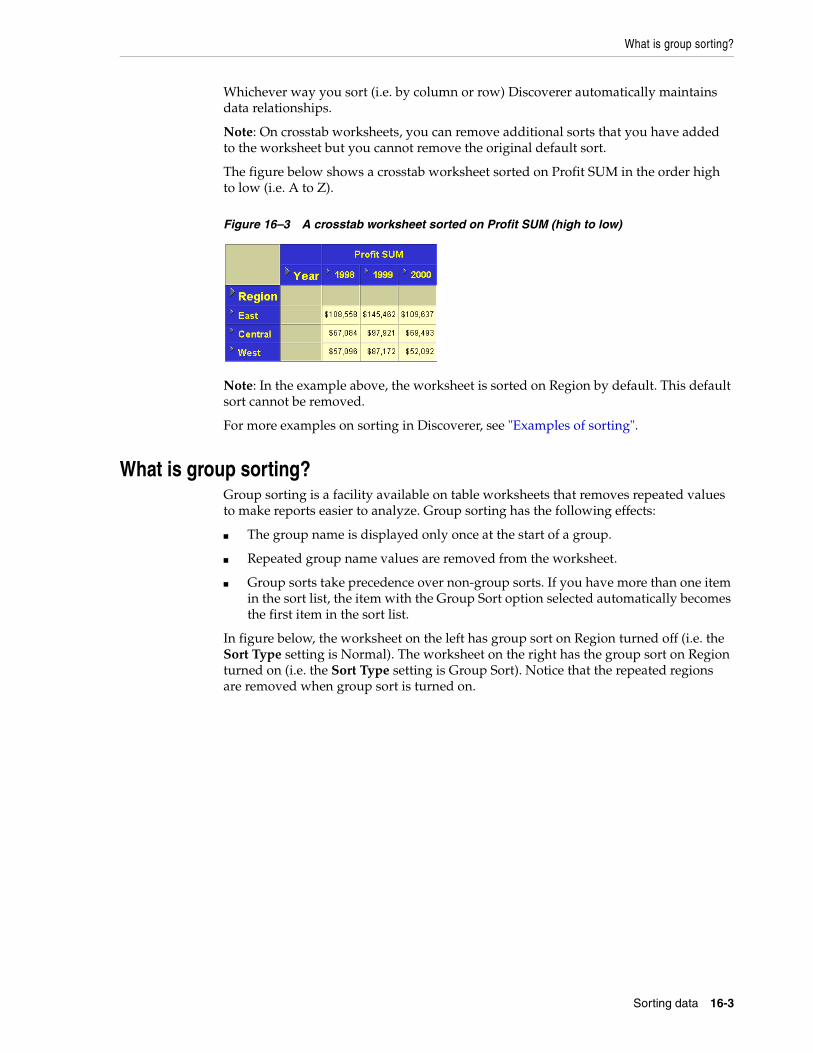
What is group sorting?
Sorting data 16-3
Whichever way you sort (i.e. by column or row) Discoverer automatically maintains data relationships.
Note: On crosstab worksheets, you can remove additional sorts that you have added to the worksheet but you cannot remove the original default sort.
The figure below shows a crosstab worksheet sorted on Profit SUM in the order high to low (i.e. A to Z).
Figure 16–3 A crosstab worksheet sorted on Profit SUM (high to low)
Note: In the example above, the worksheet is sorted on Region by default. This default sort cannot be removed.
For more examples on sorting in Discoverer, see "Examples of sorting".
What is group sorting?Group sorting is a facility available on table worksheets that removes repeated values to make reports easier to analyze. Group sorting has the following effects:
■ The group name is displayed only once at the start of a group.
■ Repeated group name values are removed from the worksheet.
■ Group sorts take precedence over non-group sorts. If you have more than one item in the sort list, the item with the Group Sort option selected automatically becomes the first item in the sort list.
In figure below, the worksheet on the left has group sort on Region turned off (i.e. the Sort Type setting is Normal). The worksheet on the right has the group sort on Region turned on (i.e. the Sort Type setting is Group Sort). Notice that the repeated regions are removed when group sort is turned on.
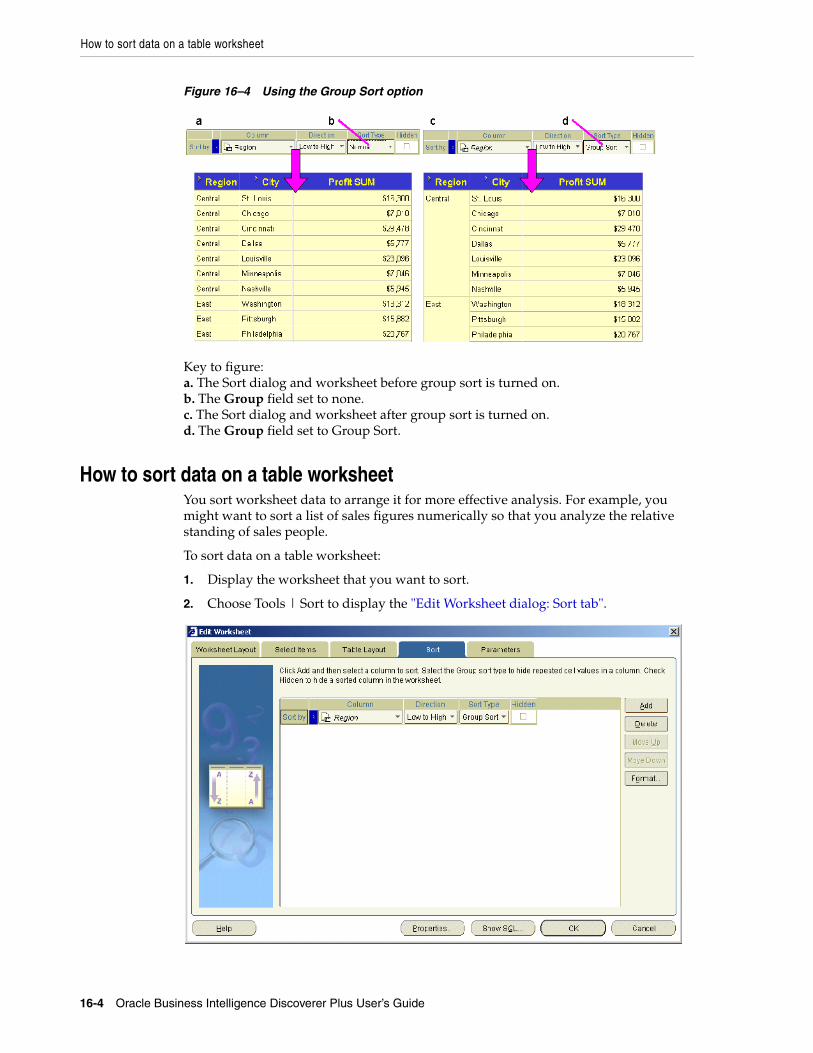
How to sort data on a table worksheet
16-4 Oracle Business Intelligence Discoverer Plus User’s Guide
Figure 16–4 Using the Group Sort option
Key to figure:a. The Sort dialog and worksheet before group sort is turned on.b. The Group field set to none.c. The Sort dialog and worksheet after group sort is turned on.d. The Group field set to Group Sort.
How to sort data on a table worksheetYou sort worksheet data to arrange it for more effective analysis. For example, you might want to sort a list of sales figures numerically so that you analyze the relative standing of sales people.
To sort data on a table worksheet:
1. Display the worksheet that you want to sort.
2. Choose Tools | Sort to display the "Edit Worksheet dialog: Sort tab".
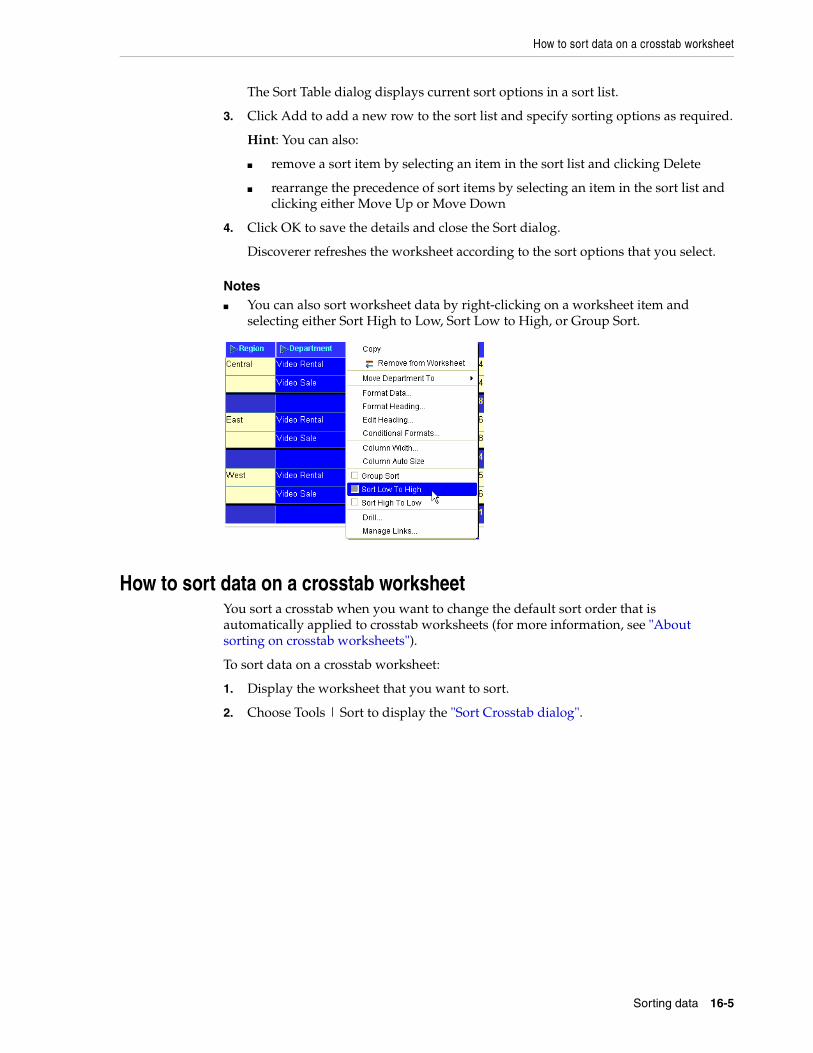
How to sort data on a crosstab worksheet
Sorting data 16-5
The Sort Table dialog displays current sort options in a sort list.
3. Click Add to add a new row to the sort list and specify sorting options as required.
Hint: You can also:
■ remove a sort item by selecting an item in the sort list and clicking Delete
■ rearrange the precedence of sort items by selecting an item in the sort list and clicking either Move Up or Move Down
4. Click OK to save the details and close the Sort dialog.
Discoverer refreshes the worksheet according to the sort options that you select.
Notes■ You can also sort worksheet data by right-clicking on a worksheet item and
selecting either Sort High to Low, Sort Low to High, or Group Sort.
How to sort data on a crosstab worksheetYou sort a crosstab when you want to change the default sort order that is automatically applied to crosstab worksheets (for more information, see "About sorting on crosstab worksheets").
To sort data on a crosstab worksheet:
1. Display the worksheet that you want to sort.
2. Choose Tools | Sort to display the "Sort Crosstab dialog".
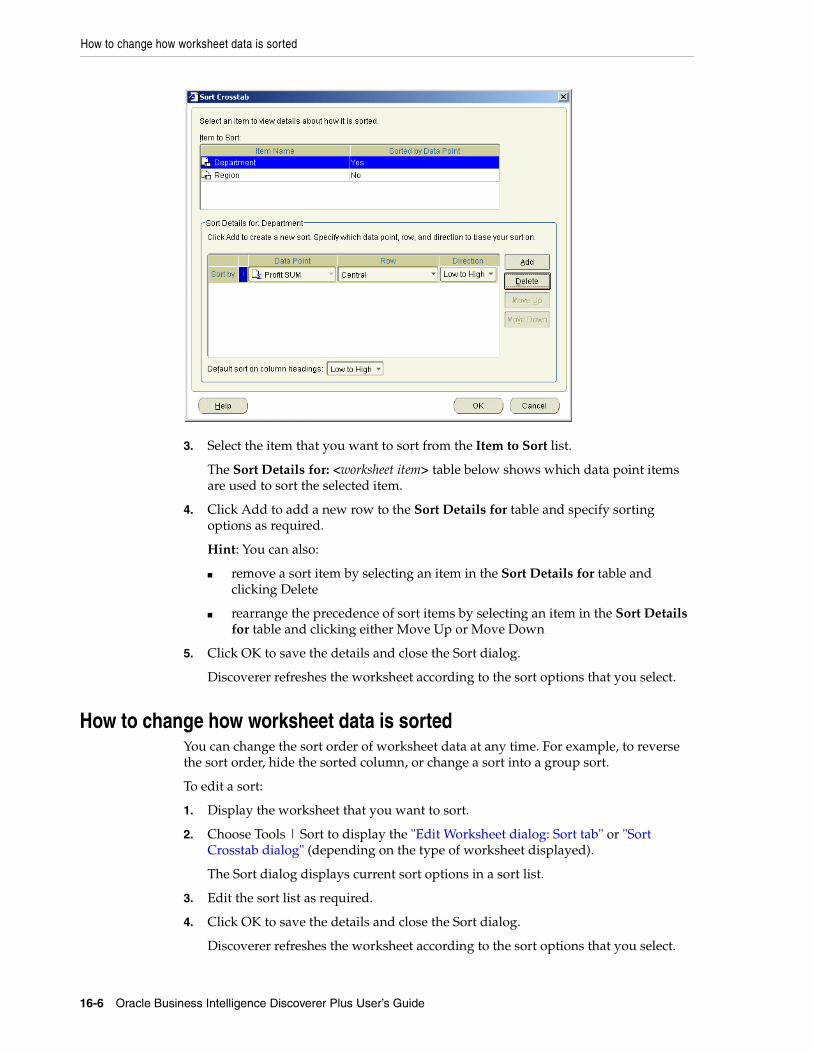
How to change how worksheet data is sorted
16-6 Oracle Business Intelligence Discoverer Plus User’s Guide
3. Select the item that you want to sort from the Item to Sort list.
The Sort Details for: <worksheet item> table below shows which data point items are used to sort the selected item.
4. Click Add to add a new row to the Sort Details for table and specify sorting options as required.
Hint: You can also:
■ remove a sort item by selecting an item in the Sort Details for table and clicking Delete
■ rearrange the precedence of sort items by selecting an item in the Sort Details for table and clicking either Move Up or Move Down
5. Click OK to save the details and close the Sort dialog.
Discoverer refreshes the worksheet according to the sort options that you select.
How to change how worksheet data is sortedYou can change the sort order of worksheet data at any time. For example, to reverse the sort order, hide the sorted column, or change a sort into a group sort.
To edit a sort:
1. Display the worksheet that you want to sort.
2. Choose Tools | Sort to display the "Edit Worksheet dialog: Sort tab" or "Sort Crosstab dialog" (depending on the type of worksheet displayed).
The Sort dialog displays current sort options in a sort list.
3. Edit the sort list as required.
4. Click OK to save the details and close the Sort dialog.
Discoverer refreshes the worksheet according to the sort options that you select.
Examples of sorting
Sorting data 16-7
How to remove sorting from a worksheetWhen you no longer want to sort a worksheet, you can remove the sort(s) from the worksheet. For example, you might have created a temporary sort to produce an ad hoc report that you now want to remove.
Table worksheets and crosstab worksheets behave differently, as follows:
■ On table worksheets, you can remove all sorts to display data in the order in which it is stored in the database.
■ On crosstab worksheets, you can remove additional sorts that you have added to the worksheet but you cannot remove the original default sort.
Note: Crosstab worksheets are group sorted automatically (for more information, see "About sorting on crosstab worksheets").
To delete a sort:
1. Display the sorted worksheet that you want to edit.
2. Choose Tools | Sort to display the Sort dialog (see "Edit Worksheet dialog" or "Edit Worksheet dialog".
The Sort dialog displays current sort options in a sort list.
3. Select the item that you want to remove.
4. Click Delete to remove it from the sort list.
Note: On crosstab worksheets, you cannot remove the original default sort (see "About sorting on crosstab worksheets").
5. Click OK to save the details and close the Sort dialog.
Discoverer refreshes the worksheet according to the sort options that you select.
Examples of sortingExample 1: This example shows how to use the Sort Crosstab dialog to sort a crosstab worksheet horizontally. In this example, you want to sort data on Profit SUM down the column for the 1999 year. In the figure below, Region (on the left axis) is selected in the Item to Sort list. Profit SUM is selected in the Data Point list and 1999 is selected in the Column list.
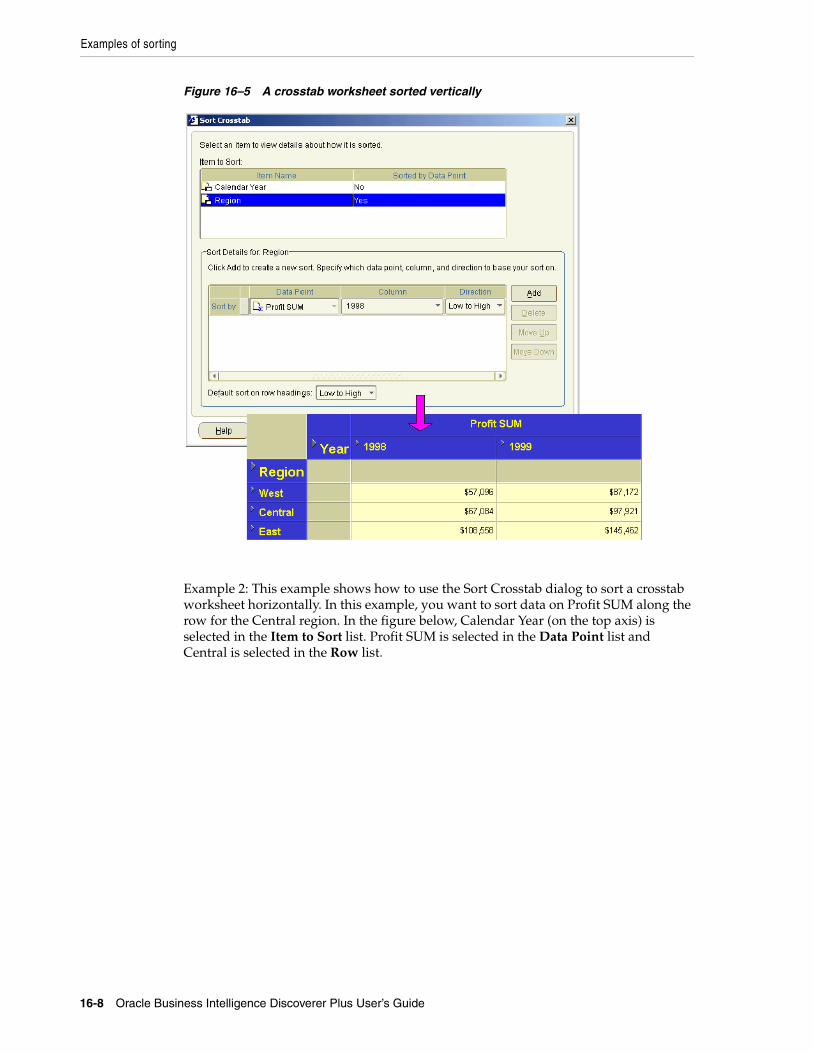
Examples of sorting
16-8 Oracle Business Intelligence Discoverer Plus User’s Guide
Figure 16–5 A crosstab worksheet sorted vertically
Example 2: This example shows how to use the Sort Crosstab dialog to sort a crosstab worksheet horizontally. In this example, you want to sort data on Profit SUM along the row for the Central region. In the figure below, Calendar Year (on the top axis) is selected in the Item to Sort list. Profit SUM is selected in the Data Point list and Central is selected in the Row list.
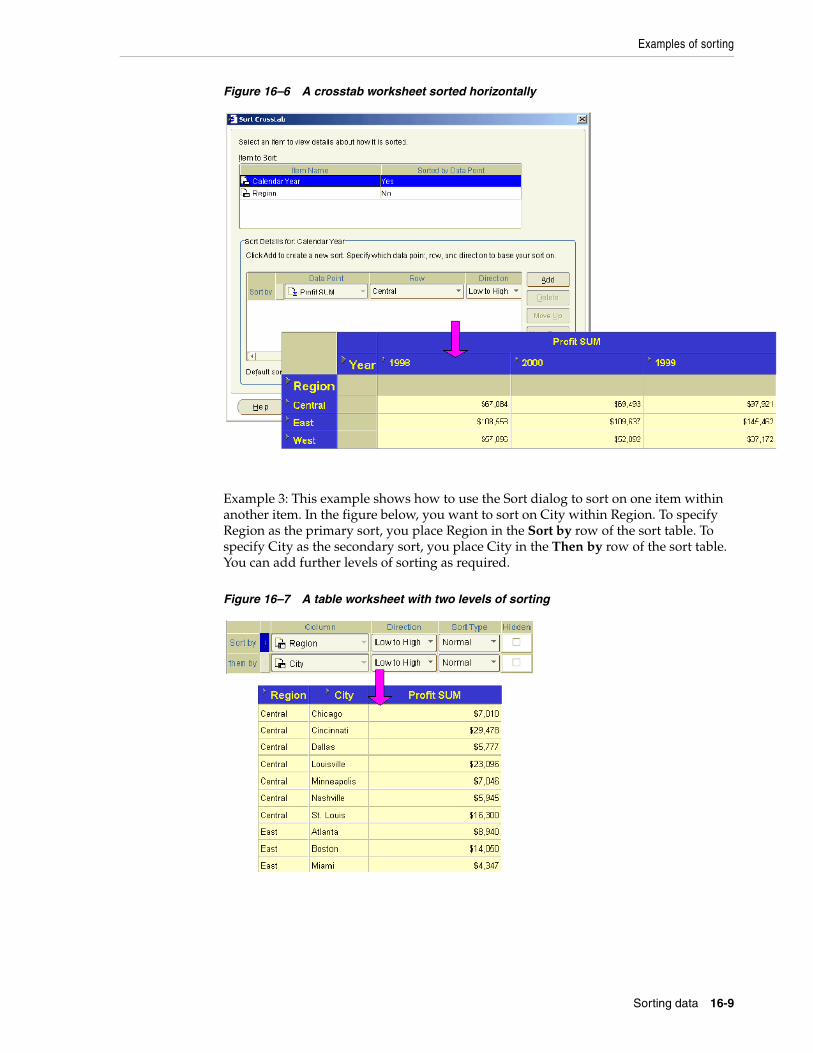
Examples of sorting
Sorting data 16-9
Figure 16–6 A crosstab worksheet sorted horizontally
Example 3: This example shows how to use the Sort dialog to sort on one item within another item. In the figure below, you want to sort on City within Region. To specify Region as the primary sort, you place Region in the Sort by row of the sort table. To specify City as the secondary sort, you place City in the Then by row of the sort table. You can add further levels of sorting as required.
Figure 16–7 A table worksheet with two levels of sorting

Examples of sorting
16-10 Oracle Business Intelligence Discoverer Plus User’s Guide
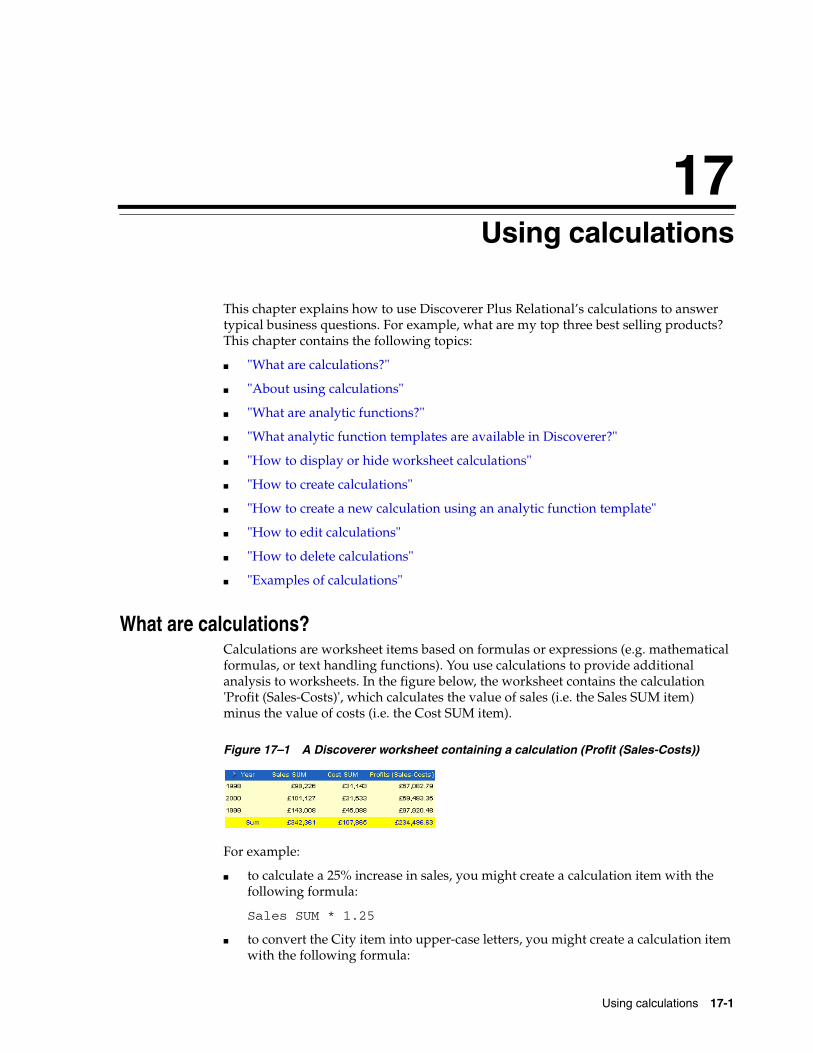
Using calculations 17-1
17Using calculations
This chapter explains how to use Discoverer Plus Relational’s calculations to answer typical business questions. For example, what are my top three best selling products? This chapter contains the following topics:
■ "What are calculations?"
■ "About using calculations"
■ "What are analytic functions?"
■ "What analytic function templates are available in Discoverer?"
■ "How to display or hide worksheet calculations"
■ "How to create calculations"
■ "How to create a new calculation using an analytic function template"
■ "How to edit calculations"
■ "How to delete calculations"
■ "Examples of calculations"
What are calculations?Calculations are worksheet items based on formulas or expressions (e.g. mathematical formulas, or text handling functions). You use calculations to provide additional analysis to worksheets. In the figure below, the worksheet contains the calculation 'Profit (Sales-Costs)', which calculates the value of sales (i.e. the Sales SUM item) minus the value of costs (i.e. the Cost SUM item).
Figure 17–1 A Discoverer worksheet containing a calculation (Profit (Sales-Costs))
For example:
■ to calculate a 25% increase in sales, you might create a calculation item with the following formula:
Sales SUM * 1.25
■ to convert the City item into upper-case letters, you might create a calculation item with the following formula:
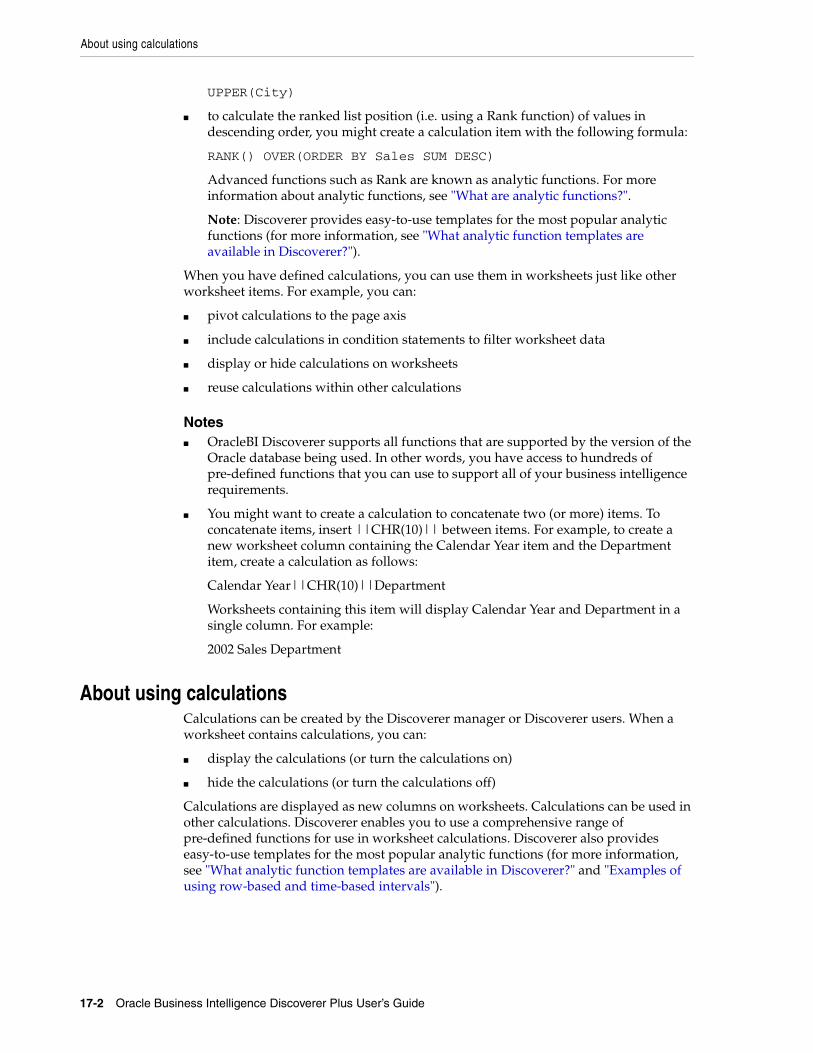
About using calculations
17-2 Oracle Business Intelligence Discoverer Plus User’s Guide
UPPER(City)
■ to calculate the ranked list position (i.e. using a Rank function) of values in descending order, you might create a calculation item with the following formula:
RANK() OVER(ORDER BY Sales SUM DESC)
Advanced functions such as Rank are known as analytic functions. For more information about analytic functions, see "What are analytic functions?".
Note: Discoverer provides easy-to-use templates for the most popular analytic functions (for more information, see "What analytic function templates are available in Discoverer?").
When you have defined calculations, you can use them in worksheets just like other worksheet items. For example, you can:
■ pivot calculations to the page axis
■ include calculations in condition statements to filter worksheet data
■ display or hide calculations on worksheets
■ reuse calculations within other calculations
Notes■ OracleBI Discoverer supports all functions that are supported by the version of the
Oracle database being used. In other words, you have access to hundreds of pre-defined functions that you can use to support all of your business intelligence requirements.
■ You might want to create a calculation to concatenate two (or more) items. To concatenate items, insert ||CHR(10)|| between items. For example, to create a new worksheet column containing the Calendar Year item and the Department item, create a calculation as follows:
Calendar Year||CHR(10)||Department
Worksheets containing this item will display Calendar Year and Department in a single column. For example:
2002 Sales Department
About using calculationsCalculations can be created by the Discoverer manager or Discoverer users. When a worksheet contains calculations, you can:
■ display the calculations (or turn the calculations on)
■ hide the calculations (or turn the calculations off)
Calculations are displayed as new columns on worksheets. Calculations can be used in other calculations. Discoverer enables you to use a comprehensive range of pre-defined functions for use in worksheet calculations. Discoverer also provides easy-to-use templates for the most popular analytic functions (for more information, see "What analytic function templates are available in Discoverer?" and "Examples of using row-based and time-based intervals").
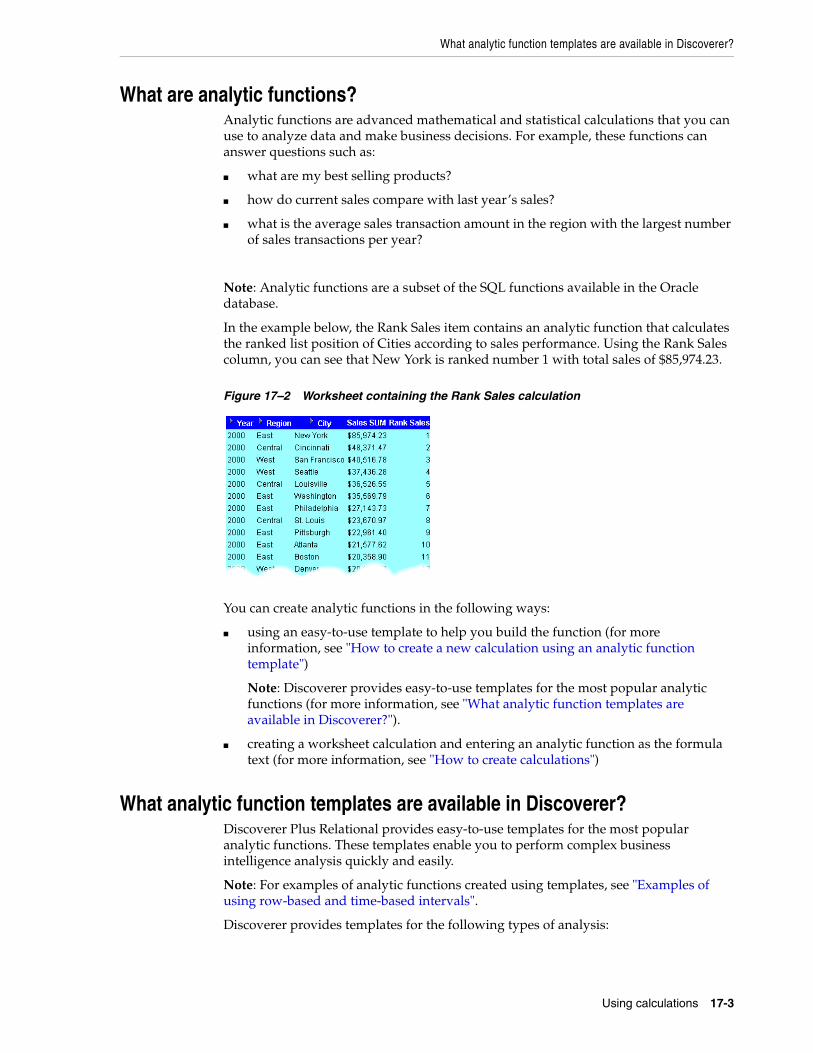
What analytic function templates are available in Discoverer?
Using calculations 17-3
What are analytic functions?Analytic functions are advanced mathematical and statistical calculations that you can use to analyze data and make business decisions. For example, these functions can answer questions such as:
■ what are my best selling products?
■ how do current sales compare with last year’s sales?
■ what is the average sales transaction amount in the region with the largest number of sales transactions per year?
Note: Analytic functions are a subset of the SQL functions available in the Oracle database.
In the example below, the Rank Sales item contains an analytic function that calculates the ranked list position of Cities according to sales performance. Using the Rank Sales column, you can see that New York is ranked number 1 with total sales of $85,974.23.
Figure 17–2 Worksheet containing the Rank Sales calculation
You can create analytic functions in the following ways:
■ using an easy-to-use template to help you build the function (for more information, see "How to create a new calculation using an analytic function template")
Note: Discoverer provides easy-to-use templates for the most popular analytic functions (for more information, see "What analytic function templates are available in Discoverer?").
■ creating a worksheet calculation and entering an analytic function as the formula text (for more information, see "How to create calculations")
What analytic function templates are available in Discoverer?Discoverer Plus Relational provides easy-to-use templates for the most popular analytic functions. These templates enable you to perform complex business intelligence analysis quickly and easily.
Note: For examples of analytic functions created using templates, see "Examples of using row-based and time-based intervals".
Discoverer provides templates for the following types of analysis:
How to display or hide worksheet calculations
17-4 Oracle Business Intelligence Discoverer Plus User’s Guide
■ Band by rank - creates a number of bands (e.g. quartiles) and places each value into one of the bands according to its ranked list position (for more information, see "Band by Rank dialog")
■ Band by value - creates a number of bands (sometimes referred to as buckets) and places each value into one of the bands according to the value (for more information, see "Band by Value dialog")
■ Difference - typically calculates the change in values across time (for more information, see "Difference dialog")
■ Following value - returns the value that is a specified number of rows or a specified time period after each value (for more information, see "Following Value dialog")
■ Group total - aggregates values within a group (for more information, see "Group Total dialog")
■ Moving total - calculates a total for the specified number of rows or a specified time period before each value (for more information, see "Moving Total dialog")
■ Percent contribution - calculates the ratio of a value to the sum of a set of values (for more information, see "Percent Contribution dialog")
■ Percent difference - typically calculates the change in values across time as a percentage (for more information, see "Percent Difference dialog")
■ Percent rank - calculates the relative position of a value in a group of values (for more information, see "Percent Rank dialog")
■ Percent running contribution - can be used in 80-20 analysis (for more information, see "Percent Running Contribution dialog")
■ Preceding value - returns the value that is a specified number of rows or a specified time period before each value (for more information, see "Preceding Value dialog")
■ Rank - calculates the ranked list position of values (for more information, see "Rank dialog")
■ Running total - calculates the total from the value at the start of the group to each value (for more information, see "Running Total dialog")
Notes■ When you use an analytic function template, you populate the Calculation field
with the SQL statement for the analytic function formula. You can manually edit the SQL statement at any time in the Calculation field.
■ For more information about analytic functions, see "What are analytic functions?".
■ For more information about using analytic function templates, see "How to create a new calculation using an analytic function template".
How to display or hide worksheet calculationsWhen a worksheet contains calculations, you can display or hide the calculations. You display calculations on a worksheet when you want to use them to analyze worksheet data. You hide calculations on a worksheet when you do not need to use them to analyze worksheet data. For example, you might display a calculation when you export a worksheet.
To display or hide calculations:
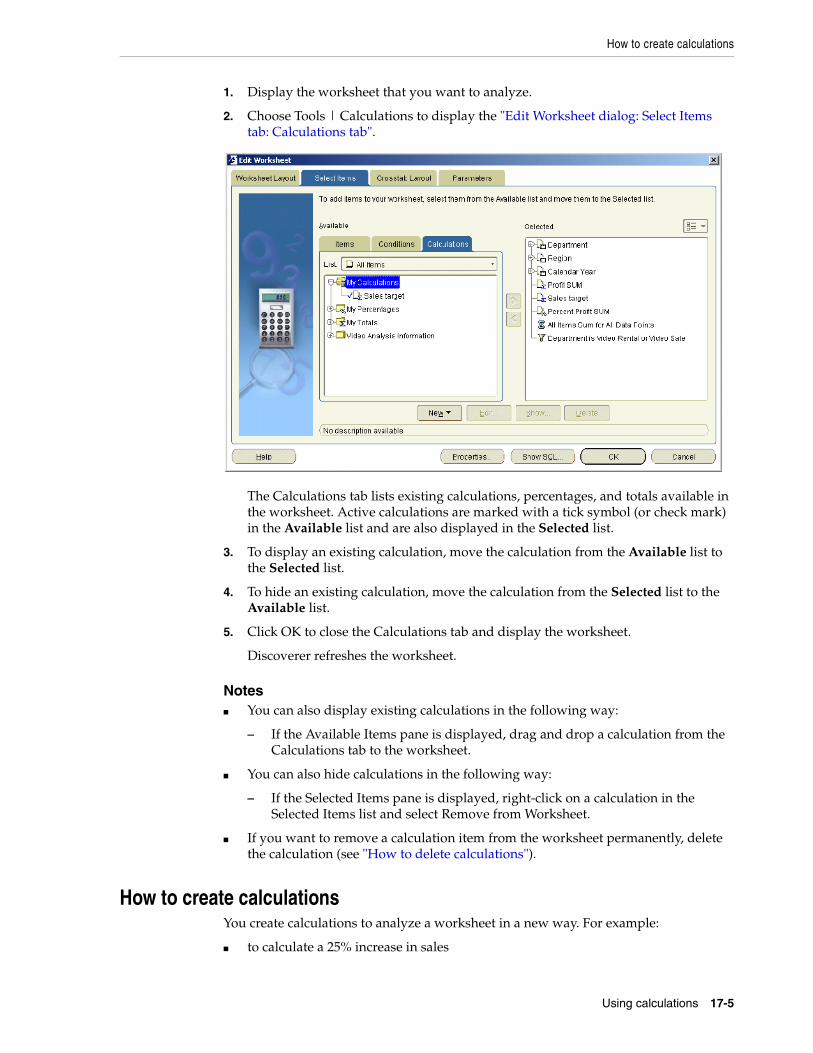
How to create calculations
Using calculations 17-5
1. Display the worksheet that you want to analyze.
2. Choose Tools | Calculations to display the "Edit Worksheet dialog: Select Items tab: Calculations tab".
The Calculations tab lists existing calculations, percentages, and totals available in the worksheet. Active calculations are marked with a tick symbol (or check mark) in the Available list and are also displayed in the Selected list.
3. To display an existing calculation, move the calculation from the Available list to the Selected list.
4. To hide an existing calculation, move the calculation from the Selected list to the Available list.
5. Click OK to close the Calculations tab and display the worksheet.
Discoverer refreshes the worksheet.
Notes■ You can also display existing calculations in the following way:
– If the Available Items pane is displayed, drag and drop a calculation from the Calculations tab to the worksheet.
■ You can also hide calculations in the following way:
– If the Selected Items pane is displayed, right-click on a calculation in the Selected Items list and select Remove from Worksheet.
■ If you want to remove a calculation item from the worksheet permanently, delete the calculation (see "How to delete calculations").
How to create calculationsYou create calculations to analyze a worksheet in a new way. For example:
■ to calculate a 25% increase in sales
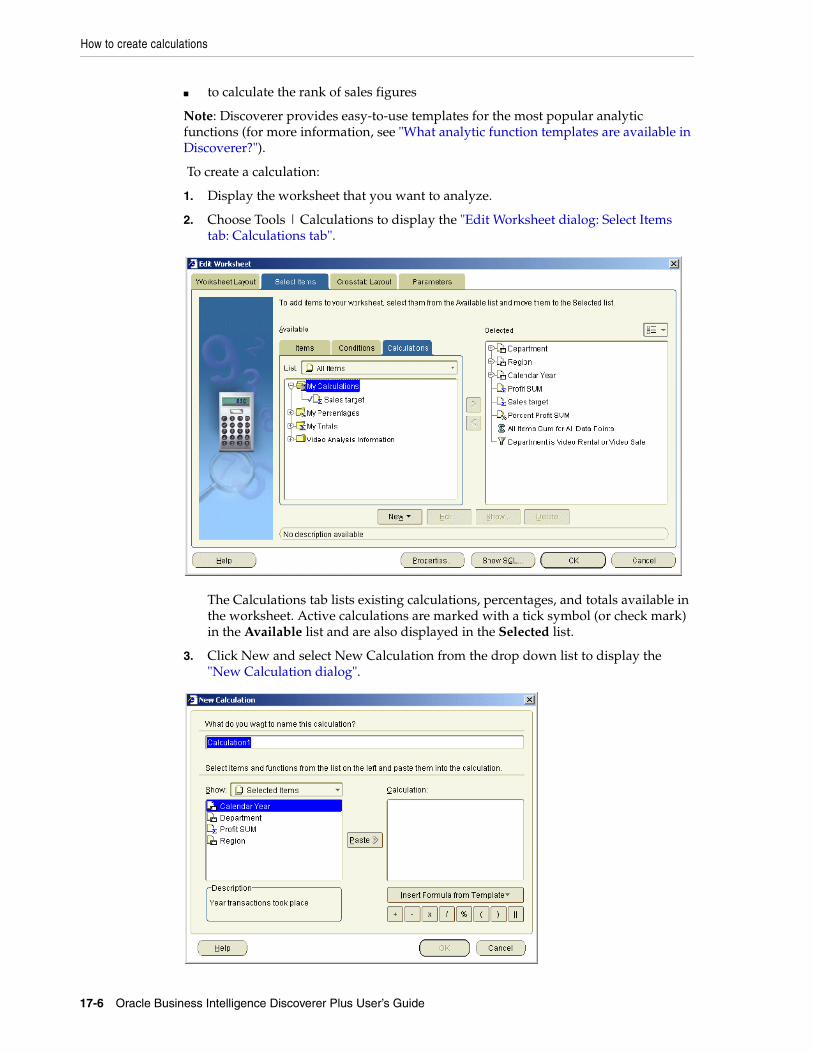
How to create calculations
17-6 Oracle Business Intelligence Discoverer Plus User’s Guide
■ to calculate the rank of sales figures
Note: Discoverer provides easy-to-use templates for the most popular analytic functions (for more information, see "What analytic function templates are available in Discoverer?").
To create a calculation:
1. Display the worksheet that you want to analyze.
2. Choose Tools | Calculations to display the "Edit Worksheet dialog: Select Items tab: Calculations tab".
The Calculations tab lists existing calculations, percentages, and totals available in the worksheet. Active calculations are marked with a tick symbol (or check mark) in the Available list and are also displayed in the Selected list.
3. Click New and select New Calculation from the drop down list to display the "New Calculation dialog".
How to create calculations
Using calculations 17-7
4. Enter a name for the calculation in the What do you want to name this calculation? field.
Hint: Use a short descriptive name, which will be displayed on the worksheet.
5. Enter the calculation formula in the Calculation field.
If you are familiar with calculation syntax, you can type the formula in the Calculation field.
Note: If you type a formula in the Calculation field, you must prefix the formula with an equals sign (i.e. =).
If you prefer, you can build the calculation in stages using any of the following methods:
■ To add an item from the business area to the calculation, choose Selected Items or Available Items from the Show drop down list, select an item from the item list below, then click Paste to copy the item into the Calculation field.
■ To add a function to the calculation, choose Functions from the Show drop down list, select a function from the list below, then click Paste to copy the function into the Calculation field.
■ To add existing calculations to the calculation, choose Calculations from the Show drop down list, select a calculation from the list below, then click Paste to copy the calculation into the Calculation field.
■ To include a mathematical operator in the calculation, click the appropriate operator button below the Calculation field.
Hint: Before pasting items in the Calculation field, position the cursor in the Calculation field where you want to insert the item.
■ To use an analytic function template to create the formula, click Insert Formula from Template to display a pop-up list of templates and choose a template (for more information about using analytic function templates, see "How to create a new calculation using an analytic function template").
Note: Calculations follow the standard Oracle calculation syntax. For a full description of this syntax, see the Oracle9i SQL Language Reference Manual.
6. Click OK to save the details and close the New Calculation dialog.
7. Click OK to close the Calculations tab and return to the worksheet.
Discoverer adds the calculation to the worksheet.
Notes■ You can also create a new calculation in the following ways:
– Select the worksheet item to use in the calculation, then select the New Calculation option on the Standard toolbar and choose one of the calculation types available.
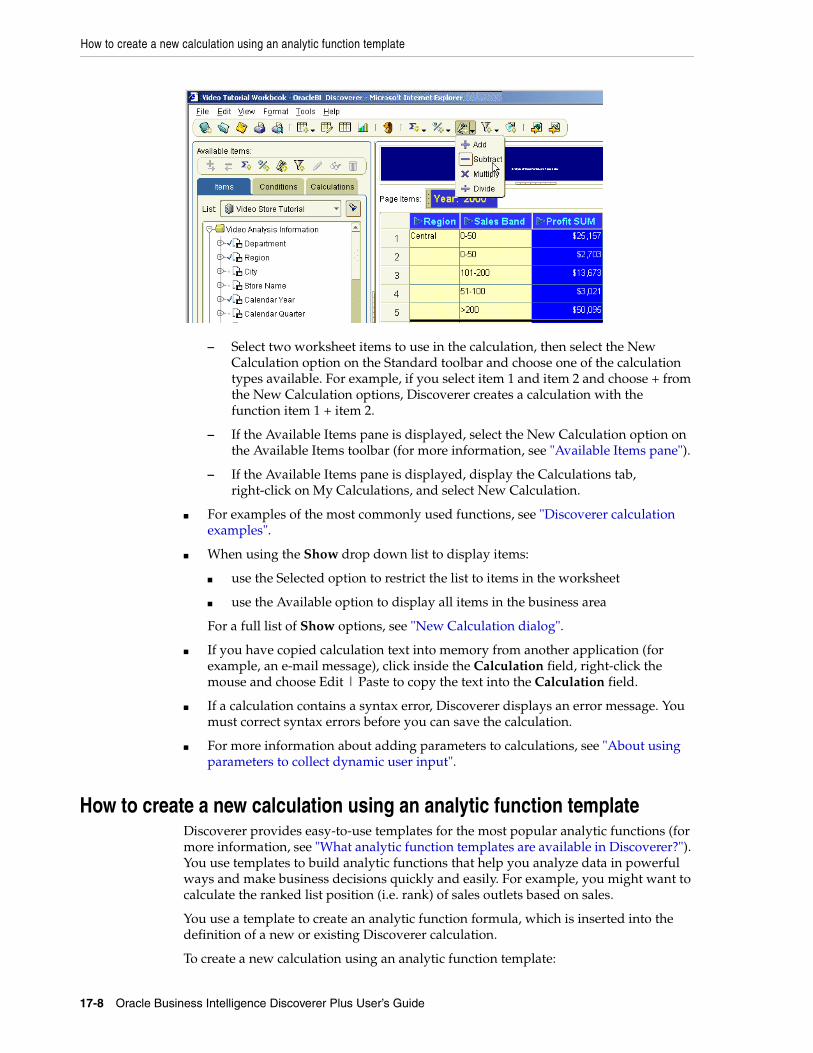
How to create a new calculation using an analytic function template
17-8 Oracle Business Intelligence Discoverer Plus User’s Guide
– Select two worksheet items to use in the calculation, then select the New Calculation option on the Standard toolbar and choose one of the calculation types available. For example, if you select item 1 and item 2 and choose + from the New Calculation options, Discoverer creates a calculation with the function item 1 + item 2.
– If the Available Items pane is displayed, select the New Calculation option on the Available Items toolbar (for more information, see "Available Items pane").
– If the Available Items pane is displayed, display the Calculations tab, right-click on My Calculations, and select New Calculation.
■ For examples of the most commonly used functions, see "Discoverer calculation examples".
■ When using the Show drop down list to display items:
■ use the Selected option to restrict the list to items in the worksheet
■ use the Available option to display all items in the business area
For a full list of Show options, see "New Calculation dialog".
■ If you have copied calculation text into memory from another application (for example, an e-mail message), click inside the Calculation field, right-click the mouse and choose Edit | Paste to copy the text into the Calculation field.
■ If a calculation contains a syntax error, Discoverer displays an error message. You must correct syntax errors before you can save the calculation.
■ For more information about adding parameters to calculations, see "About using parameters to collect dynamic user input".
How to create a new calculation using an analytic function templateDiscoverer provides easy-to-use templates for the most popular analytic functions (for more information, see "What analytic function templates are available in Discoverer?"). You use templates to build analytic functions that help you analyze data in powerful ways and make business decisions quickly and easily. For example, you might want to calculate the ranked list position (i.e. rank) of sales outlets based on sales.
You use a template to create an analytic function formula, which is inserted into the definition of a new or existing Discoverer calculation.
To create a new calculation using an analytic function template:
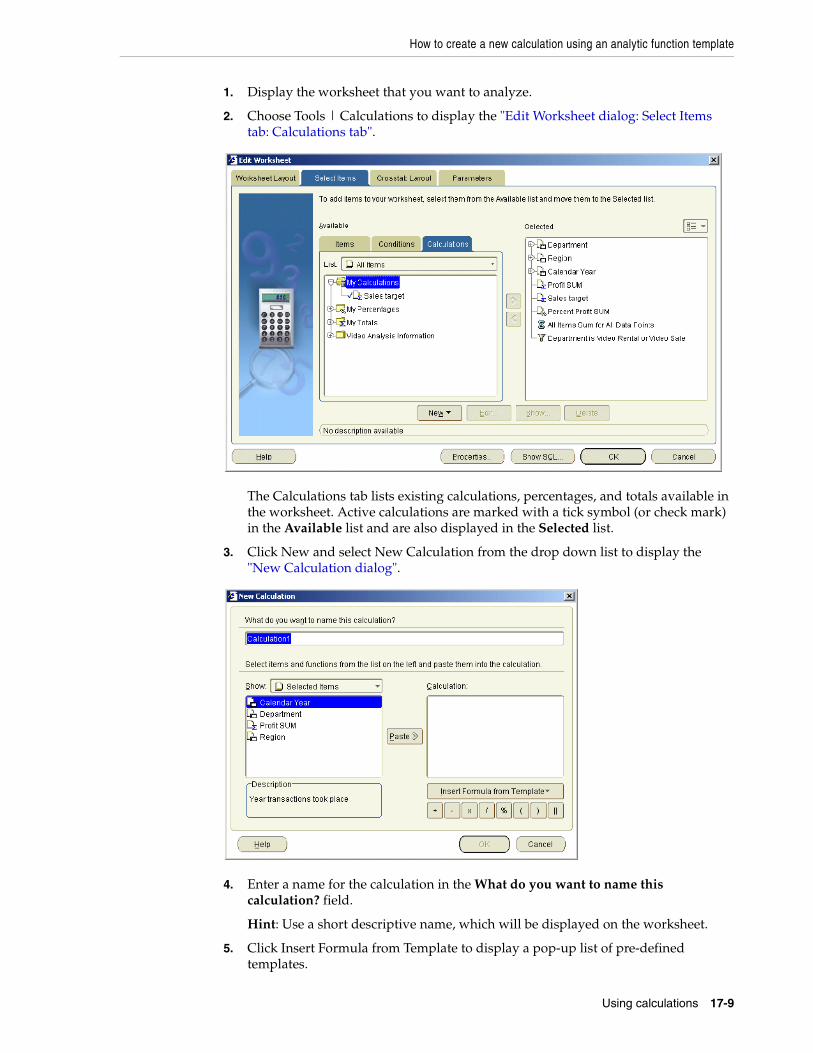
How to create a new calculation using an analytic function template
Using calculations 17-9
1. Display the worksheet that you want to analyze.
2. Choose Tools | Calculations to display the "Edit Worksheet dialog: Select Items tab: Calculations tab".
The Calculations tab lists existing calculations, percentages, and totals available in the worksheet. Active calculations are marked with a tick symbol (or check mark) in the Available list and are also displayed in the Selected list.
3. Click New and select New Calculation from the drop down list to display the "New Calculation dialog".
4. Enter a name for the calculation in the What do you want to name this calculation? field.
Hint: Use a short descriptive name, which will be displayed on the worksheet.
5. Click Insert Formula from Template to display a pop-up list of pre-defined templates.
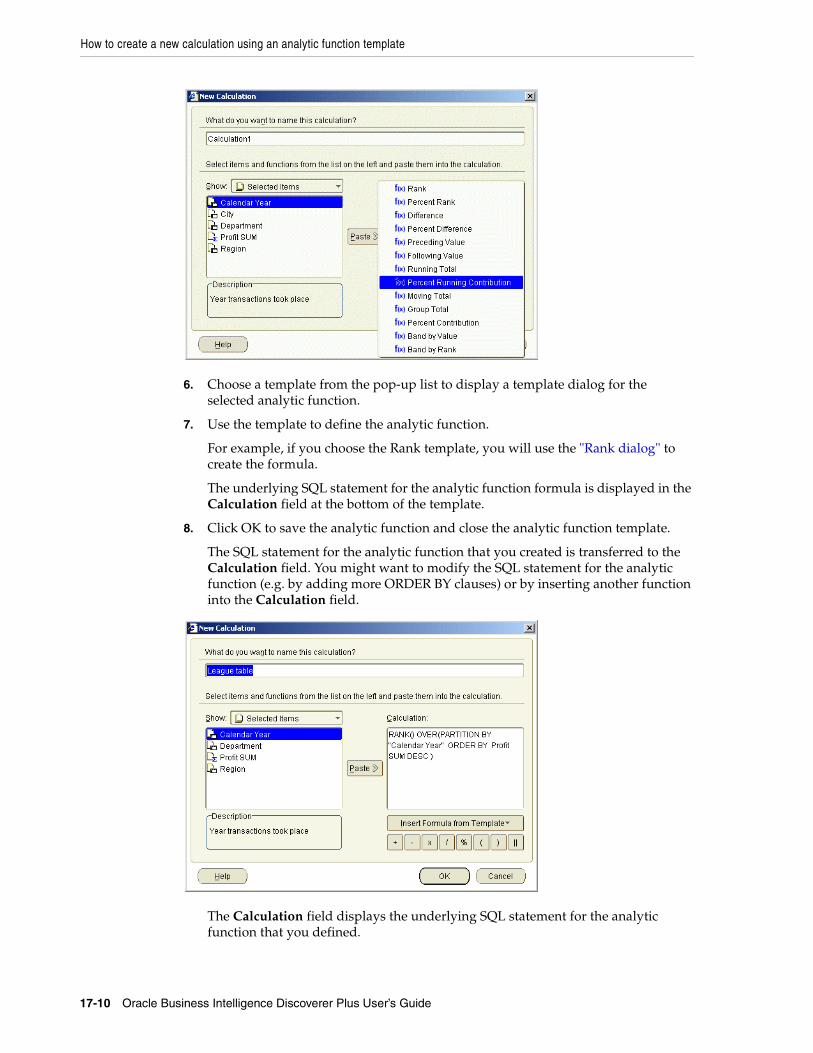
How to create a new calculation using an analytic function template
17-10 Oracle Business Intelligence Discoverer Plus User’s Guide
6. Choose a template from the pop-up list to display a template dialog for the selected analytic function.
7. Use the template to define the analytic function.
For example, if you choose the Rank template, you will use the "Rank dialog" to create the formula.
The underlying SQL statement for the analytic function formula is displayed in the Calculation field at the bottom of the template.
8. Click OK to save the analytic function and close the analytic function template.
The SQL statement for the analytic function that you created is transferred to the Calculation field. You might want to modify the SQL statement for the analytic function (e.g. by adding more ORDER BY clauses) or by inserting another function into the Calculation field.
The Calculation field displays the underlying SQL statement for the analytic function that you defined.
How to edit calculations
Using calculations 17-11
Note: You can subsequently modify the calculation (e.g. to add more PARTITION BY clauses) in any of the following ways:
■ by manually editing the formula in the Calculation field
■ by first deleting the formula in the Calculation field, then clicking Insert Formula from Template and recreating the formula
■ by clicking Insert Formula from Template and appending a new formula to the existing formula in the Calculation field
Note: If you have more than one function in the Calculation field, you must associate the functions (e.g. using + or -).
9. Click OK to save the details and close the New Calculation dialog.
10. Click OK to close the Calculations tab and return to the worksheet.
Discoverer adds the calculation to the worksheet.
Notes■ You can also create a new calculation in the following ways:
– If the Available Items pane is displayed, select the New Calculation option on the Available Items toolbar (for more information, see "Available Items pane").
– If the Available Items pane is displayed, display the Calculations tab, right-click on My Calculations, and select New Calculation.
■ For more information about analytic functions, see "What are analytic functions?" and "Examples of using row-based and time-based intervals".
■ If you want to use parameter values in analytic functions to collect dynamic input, you must manually prefix the item name with a ':' (i.e. colon) character in the Calculation field (for more information, see "About using parameters to collect dynamic user input").
For example, you might create a Band by rank formula based on the Profit SUM item (e.g. NTILE(4) OVER (ORDER BY Profit SUM DESC). If you want end users to select the number of bands at runtime, you might create a worksheet parameter called Band number. To use the Band number in the Band by rank formula you must manually change the formula to:
NTILE(:Band number) OVER (ORDER BY Profit SUM DESC)
■ Analytic functions follow the standard Oracle function syntax. For a full description of this syntax, see the Oracle9i SQL Reference Manual.
How to edit calculationsYou edit calculations to change the way that they behave. For example, to change a percentage increase calculation from 25% to 30%.
To edit a calculation:
1. Display the worksheet that you want to analyze.
2. Choose Tools | Calculations to display the "Edit Worksheet dialog: Select Items tab: Calculations tab".
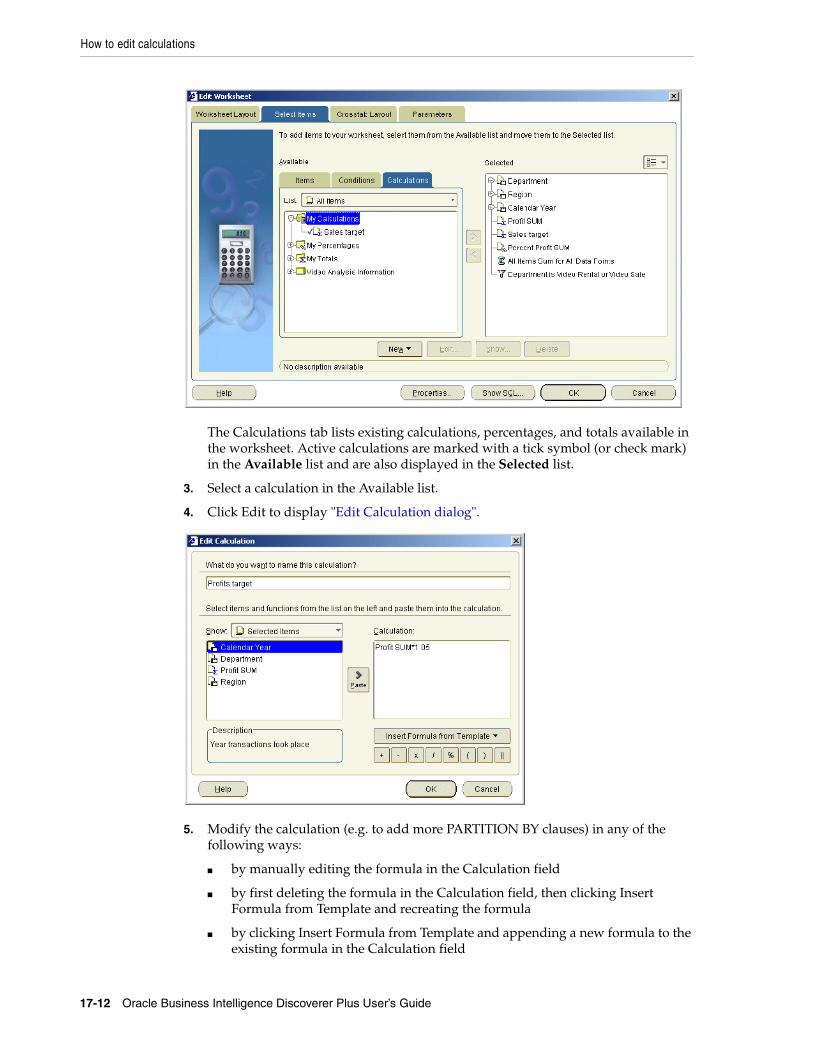
How to edit calculations
17-12 Oracle Business Intelligence Discoverer Plus User’s Guide
The Calculations tab lists existing calculations, percentages, and totals available in the worksheet. Active calculations are marked with a tick symbol (or check mark) in the Available list and are also displayed in the Selected list.
3. Select a calculation in the Available list.
4. Click Edit to display "Edit Calculation dialog".
5. Modify the calculation (e.g. to add more PARTITION BY clauses) in any of the following ways:
■ by manually editing the formula in the Calculation field
■ by first deleting the formula in the Calculation field, then clicking Insert Formula from Template and recreating the formula
■ by clicking Insert Formula from Template and appending a new formula to the existing formula in the Calculation field
How to delete calculations
Using calculations 17-13
Note: If you have more than one function in the Calculation field, you must associate the functions (e.g. using + or -).
6. Click OK to save the details and close the Edit Calculation dialog.
7. Click OK to close the Calculations tab and return to the worksheet.
Discoverer updates the calculation.
Notes■ You can also edit calculations in the following way:
– If the Available Items pane is displayed, display the Calculations tab, right-click on a calculation, and select Edit.
■ You cannot edit calculations created by the Discoverer manager. Only the Discoverer manager can edit calculations that they have created. If you want to use a similar calculation, do the following:
1. Create a new calculation.
2. Cut and paste the calculation text from the Discoverer manager’s calculation into the new calculation.
3. Modify the calculation formula as required.
■ If a calculation contains a syntax error, Discoverer displays an error message. You must correct syntax errors before you can save the calculation.
How to delete calculationsYou delete a calculation when you no longer need it and want to remove it permanently from a worksheet. For example, you might have created a temporary calculation to answer a question from a colleague. After printing the report, you want to remove the calculation from the worksheet.
To delete a calculation:
1. Display the worksheet that you want to analyze.
2. Choose Tools | Calculations to display the "Edit Worksheet dialog: Select Items tab: Calculations tab".
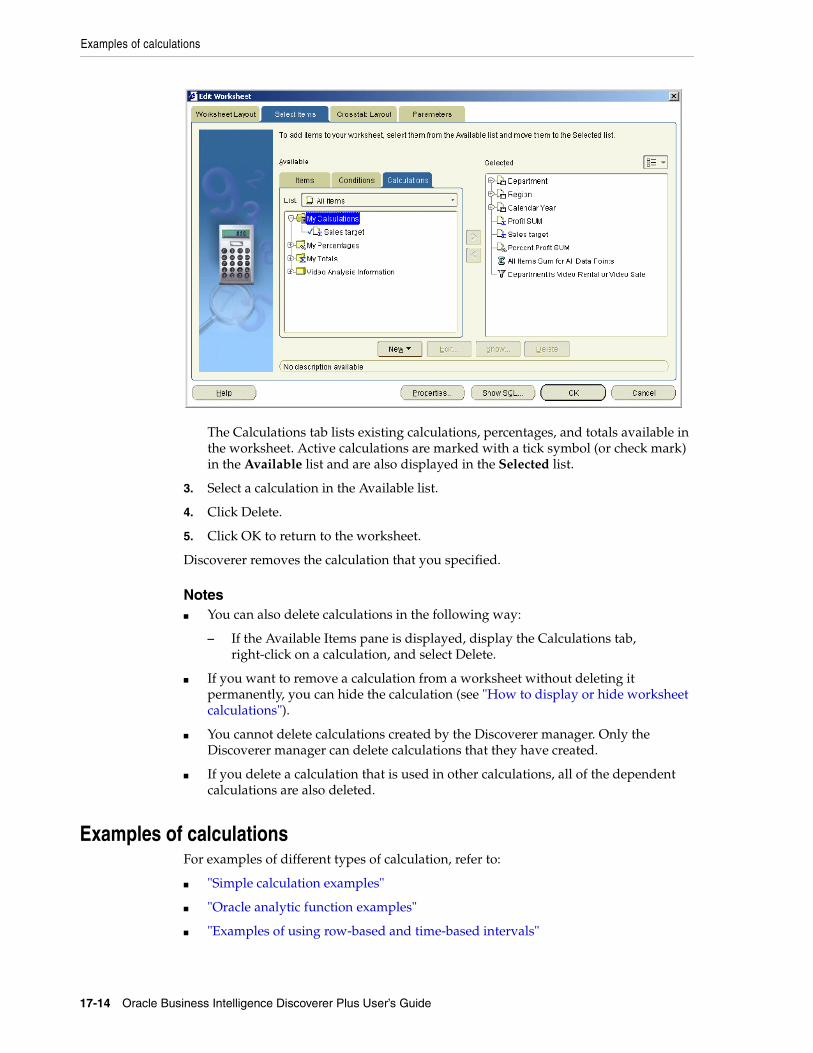
Examples of calculations
17-14 Oracle Business Intelligence Discoverer Plus User’s Guide
The Calculations tab lists existing calculations, percentages, and totals available in the worksheet. Active calculations are marked with a tick symbol (or check mark) in the Available list and are also displayed in the Selected list.
3. Select a calculation in the Available list.
4. Click Delete.
5. Click OK to return to the worksheet.
Discoverer removes the calculation that you specified.
Notes■ You can also delete calculations in the following way:
– If the Available Items pane is displayed, display the Calculations tab, right-click on a calculation, and select Delete.
■ If you want to remove a calculation from a worksheet without deleting it permanently, you can hide the calculation (see "How to display or hide worksheet calculations").
■ You cannot delete calculations created by the Discoverer manager. Only the Discoverer manager can delete calculations that they have created.
■ If you delete a calculation that is used in other calculations, all of the dependent calculations are also deleted.
Examples of calculationsFor examples of different types of calculation, refer to:
■ "Simple calculation examples"
■ "Oracle analytic function examples"
■ "Examples of using row-based and time-based intervals"
Part IIISharing results with others
This part covers Discoverer Plus Relational’s printing, export, and sharing features. These features enable you to share Discoverer worksheet data with other Discoverer users electronically on the web, or using printed reports.
For example, your manager requests a very important detailed report in half an hour!
■ Using Discoverer, you might generate a report, save it in HTML format, and e-mail it to your manager.
■ Alternatively, you might create a worksheet that your manager can access instantly using Discoverer Viewer on the other side of the world.
Discoverer makes it easy to share data between Discoverer and other application formats. Having used Discoverer to identify and analyze information, you will often want to share your results with other users.
You can share your Discoverer results in a number of ways:
■ by printing reports on paper or in PDF (Portable Document Format) format (for more information, see "Printing worksheets and graphs")
■ by giving other Discoverer users access to your workbooks (for more information, see "Sharing workbooks")
■ by exporting data in a number of different application formats (for more information, see "About exporting Discoverer data to other applications")
■ by exporting data to Oracle Reports format (for more information, see "About exporting worksheets to Oracle Reports")
■ by publishing information on your company’s intranet using Oracle Portal (for more information, see "Publishing worksheets in OracleAS Portal", or Oracle Discoverer Business Intelligence Administration Guide or Oracle Portal documentation)

Printing worksheets and graphs 18-1
18Printing worksheets and graphs
This chapter explains how to print worksheets and graphs in Discoverer Plus Relational, and contains the following topics:
■ "About printing in Discoverer Plus Relational"
■ "About elements of a printed worksheet in Discoverer Plus Relational"
■ "What are Page Setup options"
■ "About Page Setup options for graphs"
■ "How to change Page Setup options for a worksheet"
■ "How to print Discoverer workbooks"
■ "How to print Discoverer worksheets"
■ "How to print Discoverer workbooks and worksheets to PDF files"
About printing in Discoverer Plus RelationalDiscoverer enables you to print worksheet data and graphs. For example, you might want to mail a printed copy of a Discoverer worksheet to a colleague. Or, if you have Adobe Acrobat installed, you might want to create an Adobe Acrobat Portable Document Format (PDF) file that you can send to colleagues using e-mail.
When you print a worksheet that contains page items, you can either print the current page item values (i.e. exactly what you see on the screen), or all page item values. For example, if you display Month in the page item area and you are currently displaying January data, you can print the January data or data for all months.
If you print worksheets that contain active parameters, Discoverer prompts you to enter parameter values to refine the data that you print.
When you print a worksheet with a graph in Discoverer Plus Relational, the worksheet and graph print on separate pages. To print a worksheet with a graph on the same printed page, you can do one of the following:
■ print the worksheet and graph in Discoverer Viewer
■ use Discoverer Portlet Provider to display multiple worksheets and graphs as portlets on a single portal page, and print the portal page (for more information, see "Publishing worksheets in OracleAS Portal")
■ export the worksheet and graph to an external application (e.g. HTML) and print the page
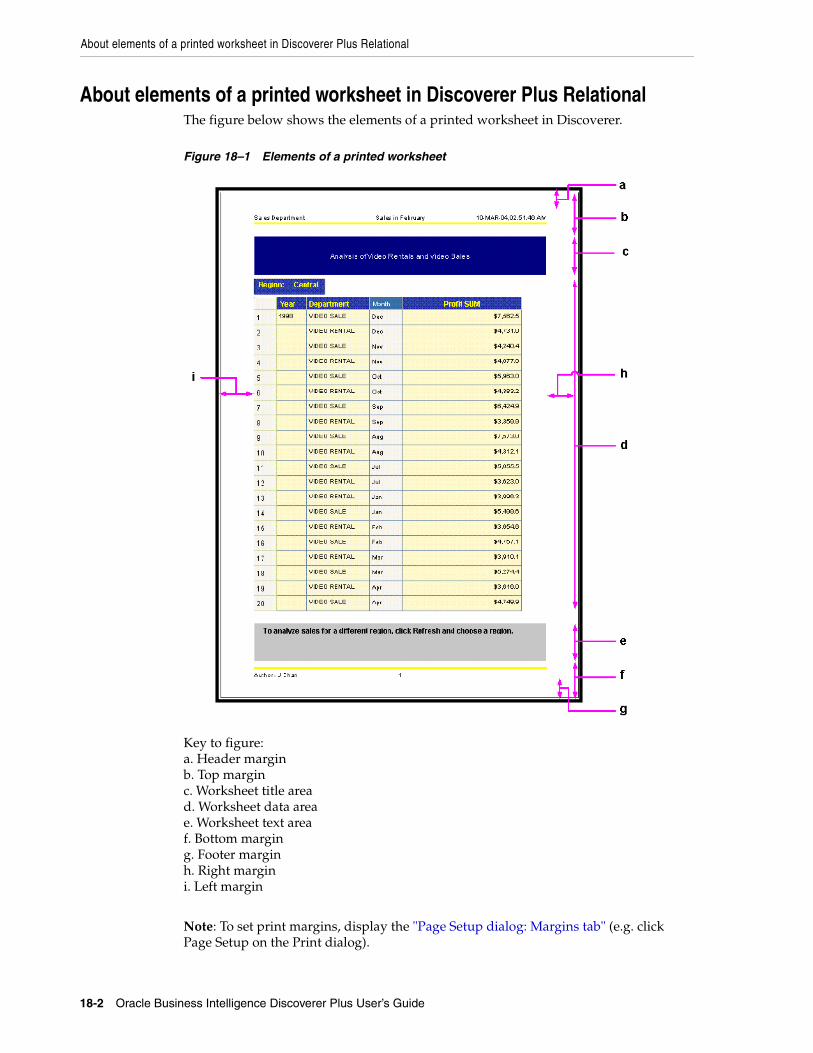
About elements of a printed worksheet in Discoverer Plus Relational
18-2 Oracle Business Intelligence Discoverer Plus User’s Guide
About elements of a printed worksheet in Discoverer Plus RelationalThe figure below shows the elements of a printed worksheet in Discoverer.
Figure 18–1 Elements of a printed worksheet
Key to figure:a. Header marginb. Top marginc. Worksheet title aread. Worksheet data areae. Worksheet text areaf. Bottom marging. Footer marginh. Right margini. Left margin
Note: To set print margins, display the "Page Setup dialog: Margins tab" (e.g. click Page Setup on the Print dialog).
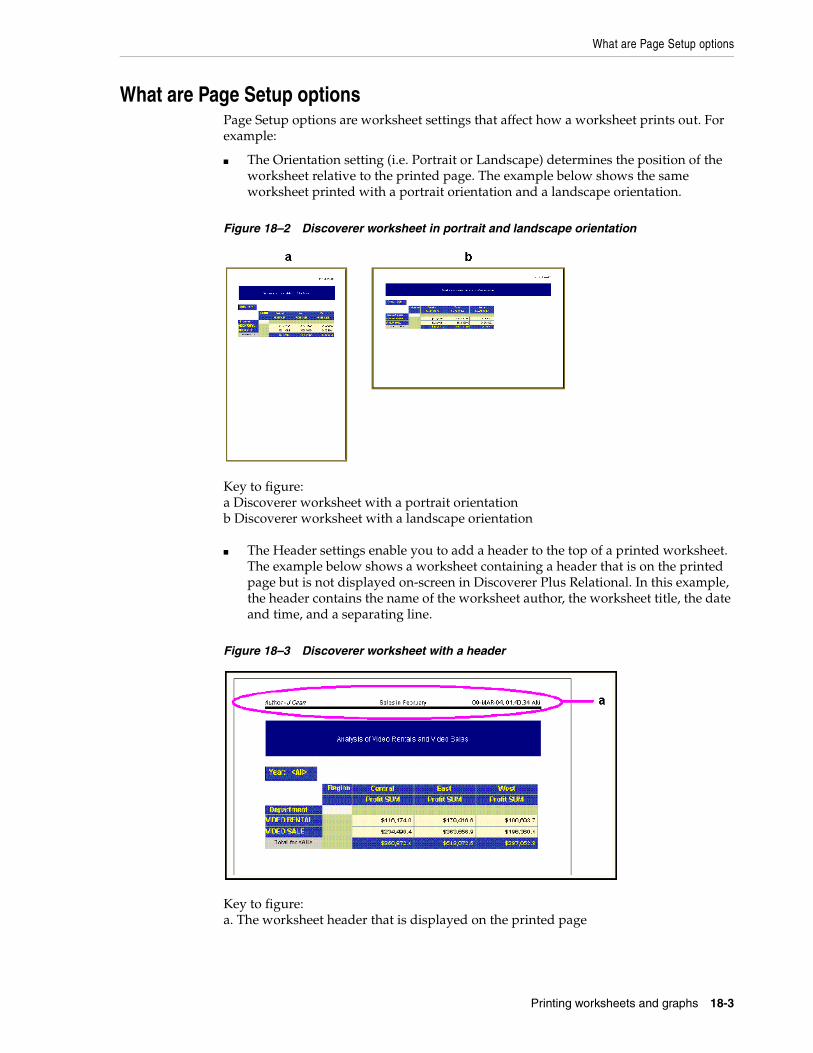
What are Page Setup options
Printing worksheets and graphs 18-3
What are Page Setup optionsPage Setup options are worksheet settings that affect how a worksheet prints out. For example:
■ The Orientation setting (i.e. Portrait or Landscape) determines the position of the worksheet relative to the printed page. The example below shows the same worksheet printed with a portrait orientation and a landscape orientation.
Figure 18–2 Discoverer worksheet in portrait and landscape orientation
Key to figure:a Discoverer worksheet with a portrait orientationb Discoverer worksheet with a landscape orientation
■ The Header settings enable you to add a header to the top of a printed worksheet. The example below shows a worksheet containing a header that is on the printed page but is not displayed on-screen in Discoverer Plus Relational. In this example, the header contains the name of the worksheet author, the worksheet title, the date and time, and a separating line.
Figure 18–3 Discoverer worksheet with a header
Key to figure:a. The worksheet header that is displayed on the printed page
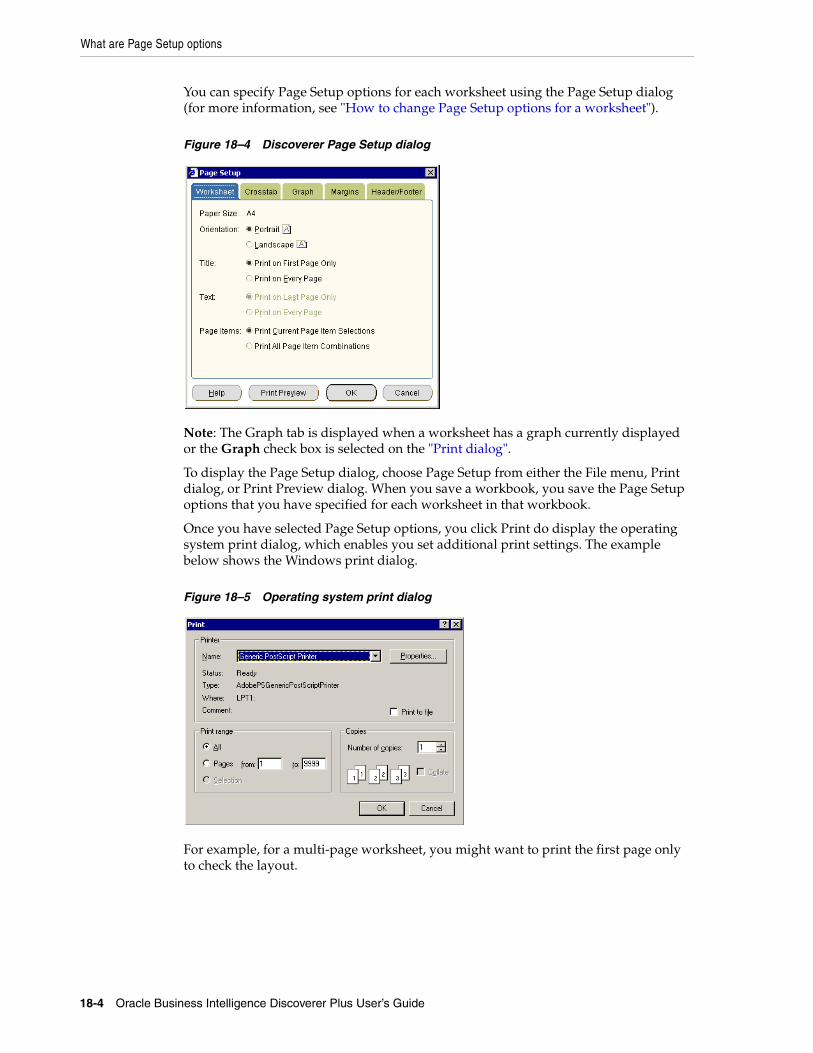
What are Page Setup options
18-4 Oracle Business Intelligence Discoverer Plus User’s Guide
You can specify Page Setup options for each worksheet using the Page Setup dialog (for more information, see "How to change Page Setup options for a worksheet").
Figure 18–4 Discoverer Page Setup dialog
Note: The Graph tab is displayed when a worksheet has a graph currently displayed or the Graph check box is selected on the "Print dialog".
To display the Page Setup dialog, choose Page Setup from either the File menu, Print dialog, or Print Preview dialog. When you save a workbook, you save the Page Setup options that you have specified for each worksheet in that workbook.
Once you have selected Page Setup options, you click Print do display the operating system print dialog, which enables you set additional print settings. The example below shows the Windows print dialog.
Figure 18–5 Operating system print dialog
For example, for a multi-page worksheet, you might want to print the first page only to check the layout.
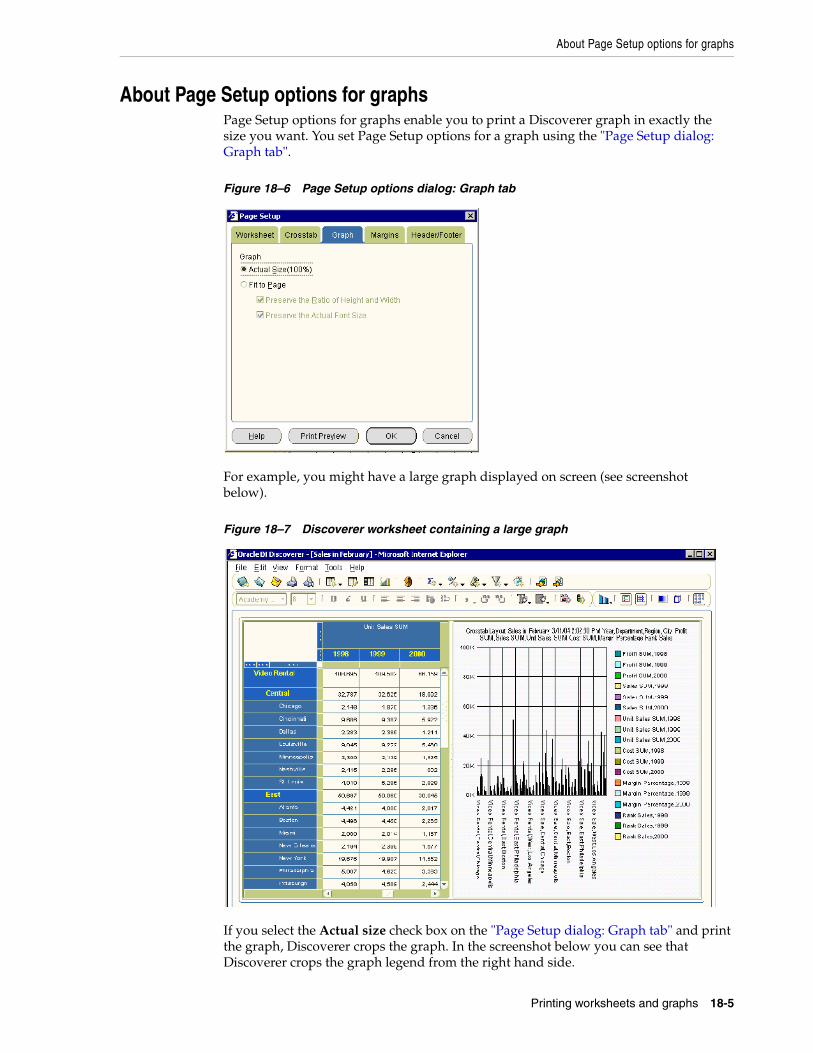
About Page Setup options for graphs
Printing worksheets and graphs 18-5
About Page Setup options for graphsPage Setup options for graphs enable you to print a Discoverer graph in exactly the size you want. You set Page Setup options for a graph using the "Page Setup dialog: Graph tab".
Figure 18–6 Page Setup options dialog: Graph tab
For example, you might have a large graph displayed on screen (see screenshot below).
Figure 18–7 Discoverer worksheet containing a large graph
If you select the Actual size check box on the "Page Setup dialog: Graph tab" and print the graph, Discoverer crops the graph. In the screenshot below you can see that Discoverer crops the graph legend from the right hand side.
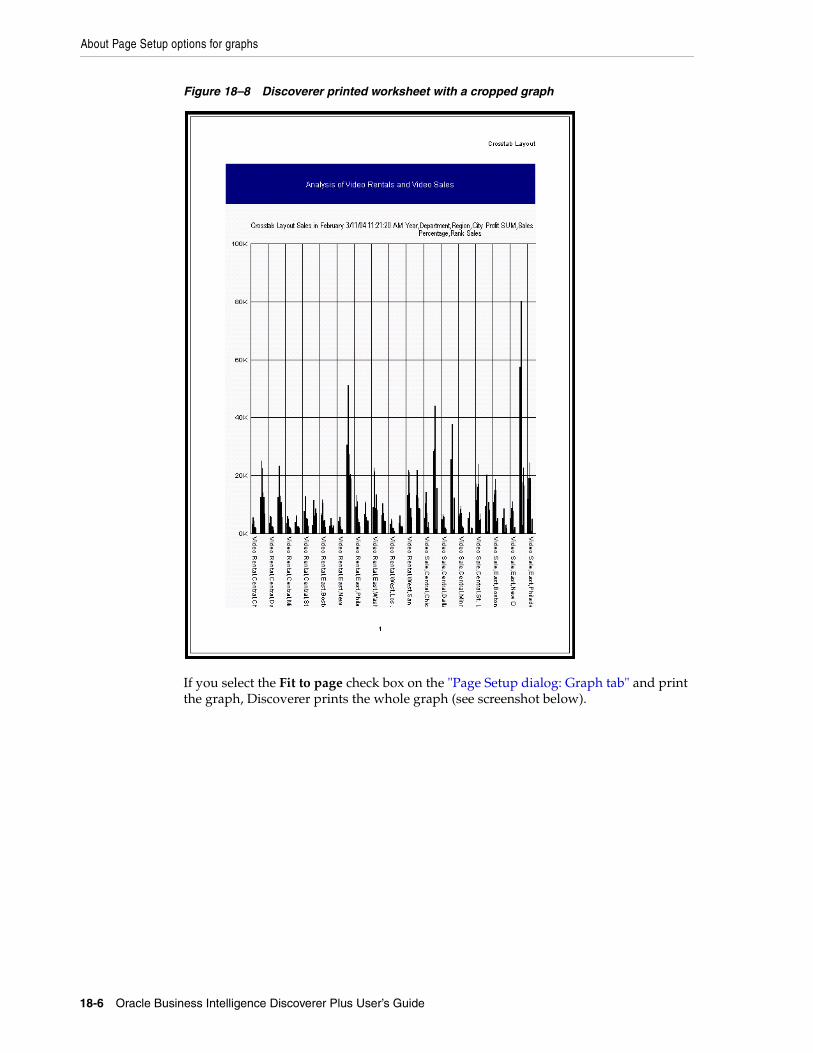
About Page Setup options for graphs
18-6 Oracle Business Intelligence Discoverer Plus User’s Guide
Figure 18–8 Discoverer printed worksheet with a cropped graph
If you select the Fit to page check box on the "Page Setup dialog: Graph tab" and print the graph, Discoverer prints the whole graph (see screenshot below).
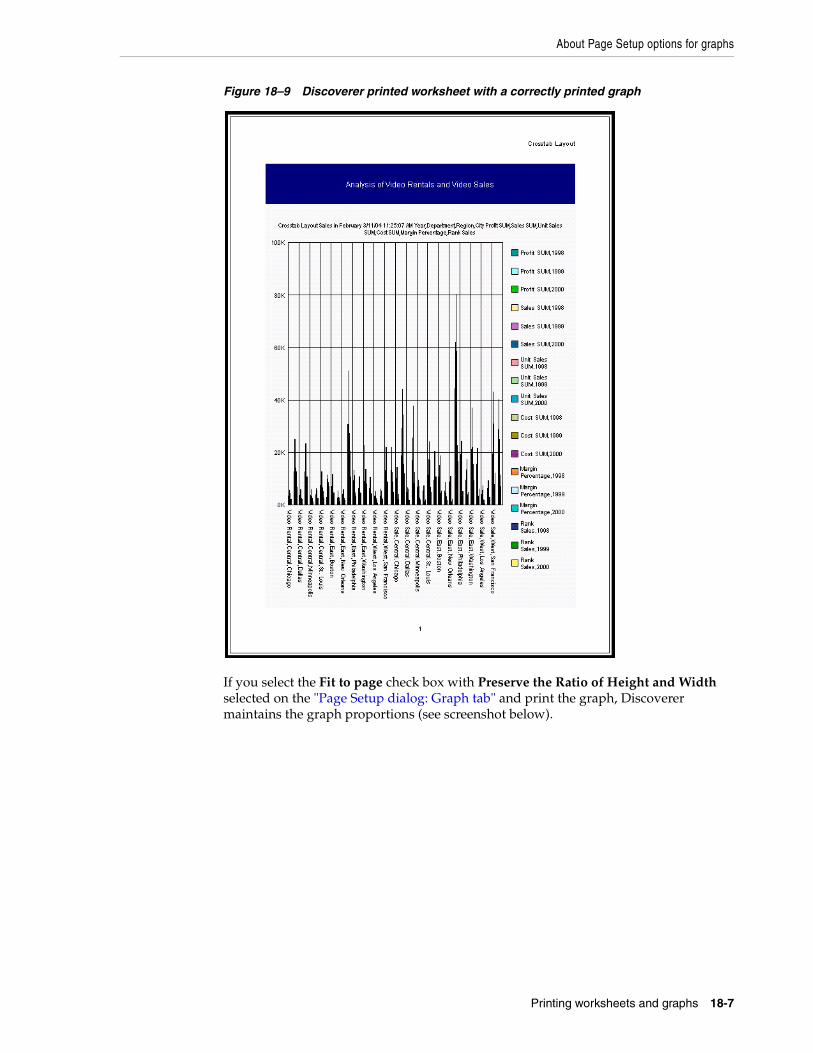
About Page Setup options for graphs
Printing worksheets and graphs 18-7
Figure 18–9 Discoverer printed worksheet with a correctly printed graph
If you select the Fit to page check box with Preserve the Ratio of Height and Width selected on the "Page Setup dialog: Graph tab" and print the graph, Discoverer maintains the graph proportions (see screenshot below).
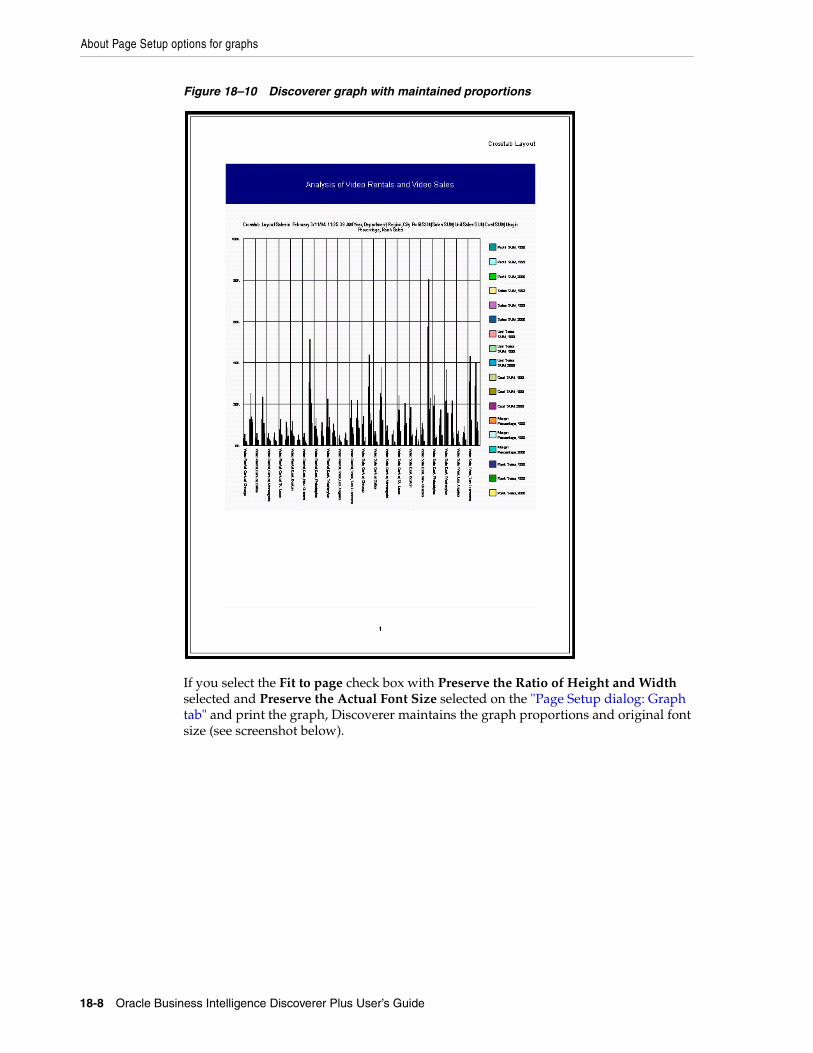
About Page Setup options for graphs
18-8 Oracle Business Intelligence Discoverer Plus User’s Guide
Figure 18–10 Discoverer graph with maintained proportions
If you select the Fit to page check box with Preserve the Ratio of Height and Width selected and Preserve the Actual Font Size selected on the "Page Setup dialog: Graph tab" and print the graph, Discoverer maintains the graph proportions and original font size (see screenshot below).
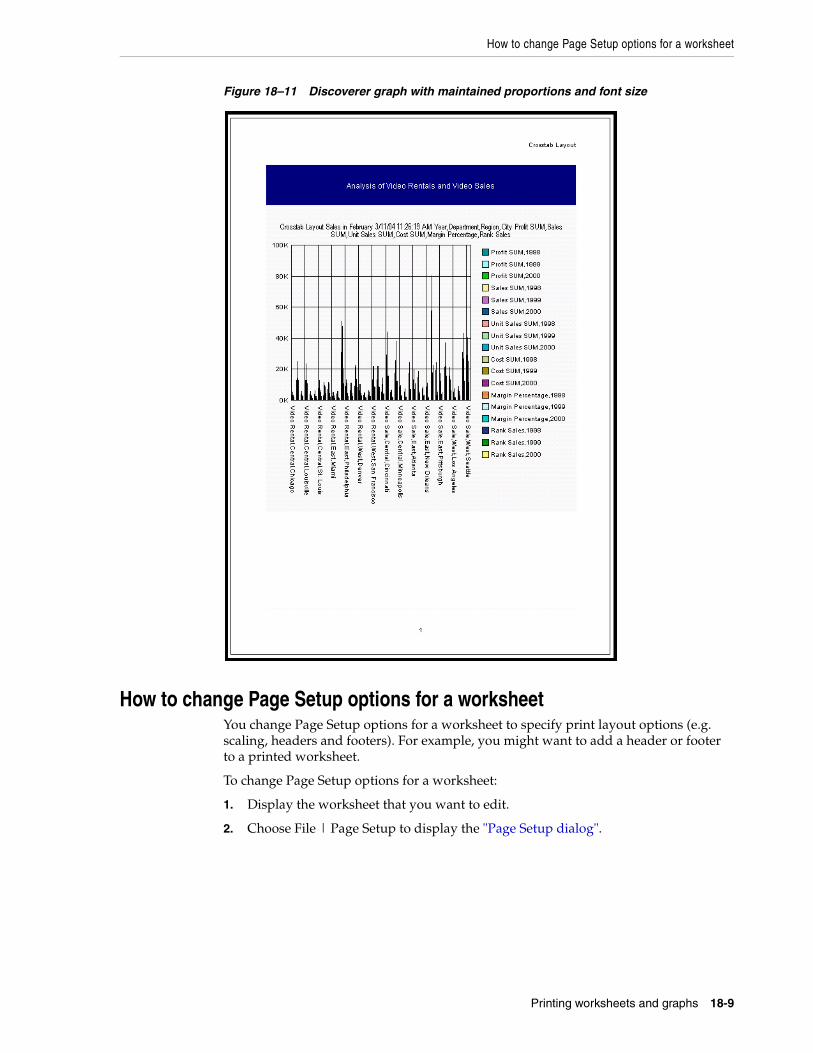
How to change Page Setup options for a worksheet
Printing worksheets and graphs 18-9
Figure 18–11 Discoverer graph with maintained proportions and font size
How to change Page Setup options for a worksheetYou change Page Setup options for a worksheet to specify print layout options (e.g. scaling, headers and footers). For example, you might want to add a header or footer to a printed worksheet.
To change Page Setup options for a worksheet:
1. Display the worksheet that you want to edit.
2. Choose File | Page Setup to display the "Page Setup dialog".
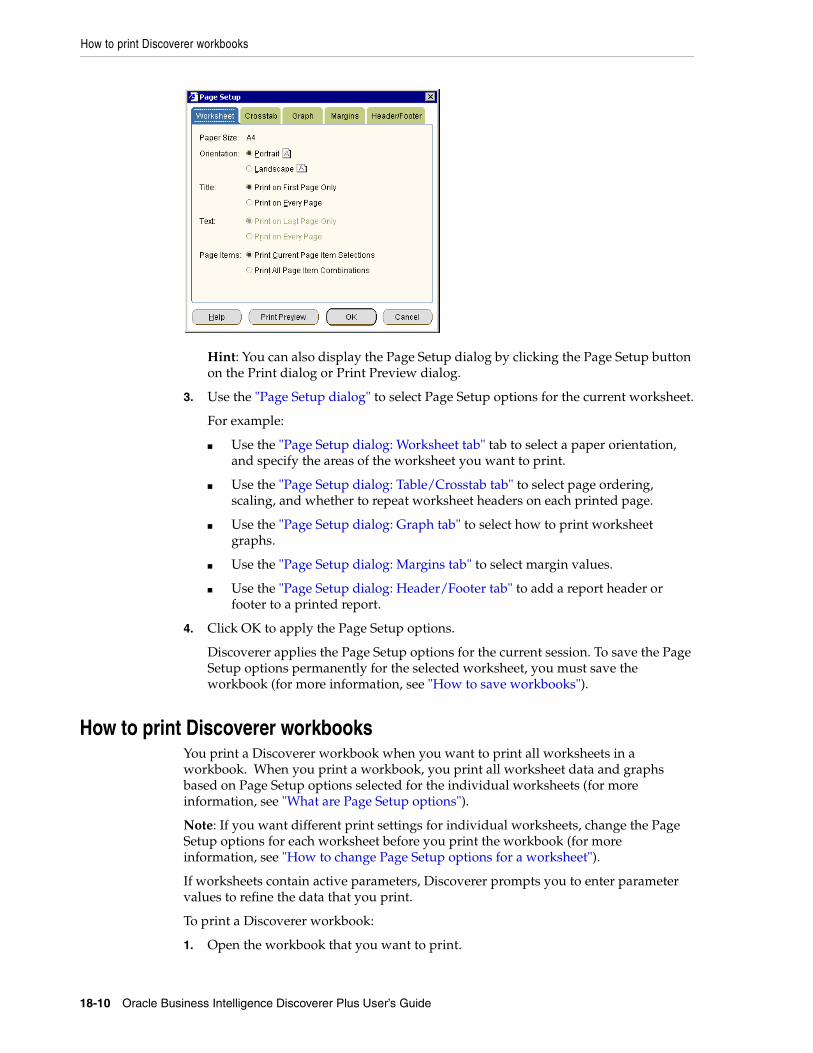
How to print Discoverer workbooks
18-10 Oracle Business Intelligence Discoverer Plus User’s Guide
Hint: You can also display the Page Setup dialog by clicking the Page Setup button on the Print dialog or Print Preview dialog.
3. Use the "Page Setup dialog" to select Page Setup options for the current worksheet.
For example:
■ Use the "Page Setup dialog: Worksheet tab" tab to select a paper orientation, and specify the areas of the worksheet you want to print.
■ Use the "Page Setup dialog: Table/Crosstab tab" to select page ordering, scaling, and whether to repeat worksheet headers on each printed page.
■ Use the "Page Setup dialog: Graph tab" to select how to print worksheet graphs.
■ Use the "Page Setup dialog: Margins tab" to select margin values.
■ Use the "Page Setup dialog: Header/Footer tab" to add a report header or footer to a printed report.
4. Click OK to apply the Page Setup options.
Discoverer applies the Page Setup options for the current session. To save the Page Setup options permanently for the selected worksheet, you must save the workbook (for more information, see "How to save workbooks").
How to print Discoverer workbooksYou print a Discoverer workbook when you want to print all worksheets in a workbook. When you print a workbook, you print all worksheet data and graphs based on Page Setup options selected for the individual worksheets (for more information, see "What are Page Setup options").
Note: If you want different print settings for individual worksheets, change the Page Setup options for each worksheet before you print the workbook (for more information, see "How to change Page Setup options for a worksheet").
If worksheets contain active parameters, Discoverer prompts you to enter parameter values to refine the data that you print.
To print a Discoverer workbook:
1. Open the workbook that you want to print.
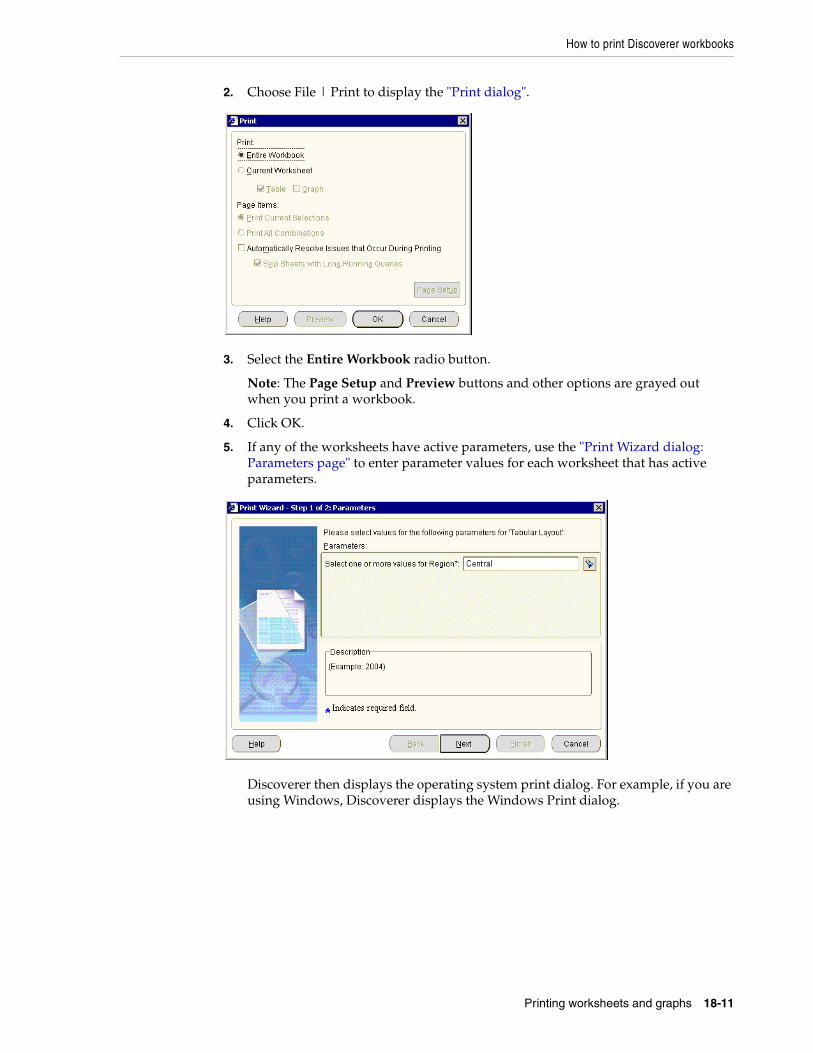
How to print Discoverer workbooks
Printing worksheets and graphs 18-11
2. Choose File | Print to display the "Print dialog".
3. Select the Entire Workbook radio button.
Note: The Page Setup and Preview buttons and other options are grayed out when you print a workbook.
4. Click OK.
5. If any of the worksheets have active parameters, use the "Print Wizard dialog: Parameters page" to enter parameter values for each worksheet that has active parameters.
Discoverer then displays the operating system print dialog. For example, if you are using Windows, Discoverer displays the Windows Print dialog.
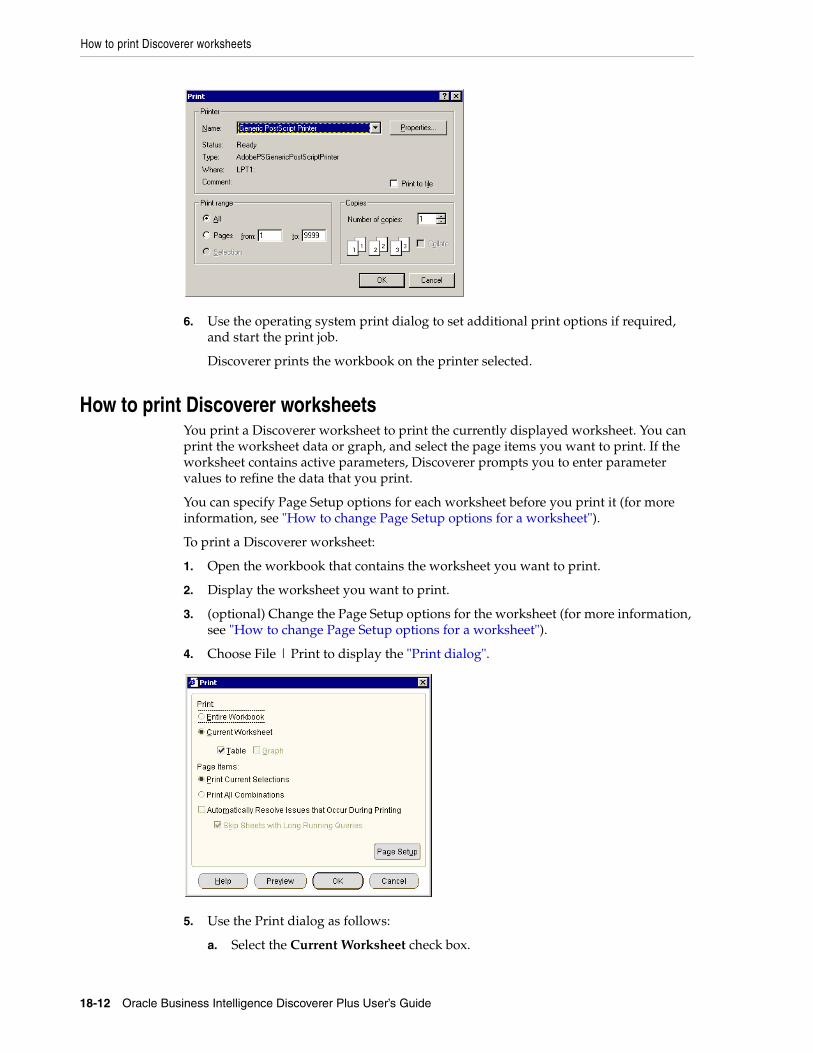
How to print Discoverer worksheets
18-12 Oracle Business Intelligence Discoverer Plus User’s Guide
6. Use the operating system print dialog to set additional print options if required, and start the print job.
Discoverer prints the workbook on the printer selected.
How to print Discoverer worksheetsYou print a Discoverer worksheet to print the currently displayed worksheet. You can print the worksheet data or graph, and select the page items you want to print. If the worksheet contains active parameters, Discoverer prompts you to enter parameter values to refine the data that you print.
You can specify Page Setup options for each worksheet before you print it (for more information, see "How to change Page Setup options for a worksheet").
To print a Discoverer worksheet:
1. Open the workbook that contains the worksheet you want to print.
2. Display the worksheet you want to print.
3. (optional) Change the Page Setup options for the worksheet (for more information, see "How to change Page Setup options for a worksheet").
4. Choose File | Print to display the "Print dialog".
5. Use the Print dialog as follows:
a. Select the Current Worksheet check box.
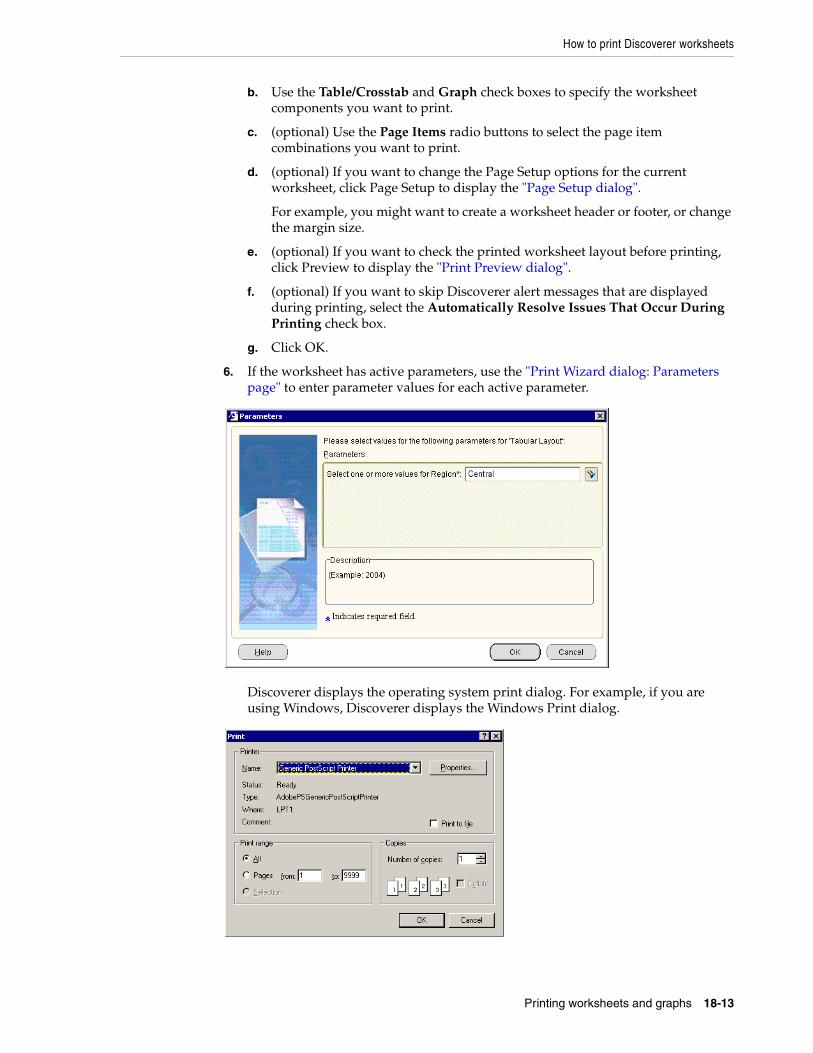
How to print Discoverer worksheets
Printing worksheets and graphs 18-13
b. Use the Table/Crosstab and Graph check boxes to specify the worksheet components you want to print.
c. (optional) Use the Page Items radio buttons to select the page item combinations you want to print.
d. (optional) If you want to change the Page Setup options for the current worksheet, click Page Setup to display the "Page Setup dialog".
For example, you might want to create a worksheet header or footer, or change the margin size.
e. (optional) If you want to check the printed worksheet layout before printing, click Preview to display the "Print Preview dialog".
f. (optional) If you want to skip Discoverer alert messages that are displayed during printing, select the Automatically Resolve Issues That Occur During Printing check box.
g. Click OK.
6. If the worksheet has active parameters, use the "Print Wizard dialog: Parameters page" to enter parameter values for each active parameter.
Discoverer displays the operating system print dialog. For example, if you are using Windows, Discoverer displays the Windows Print dialog.
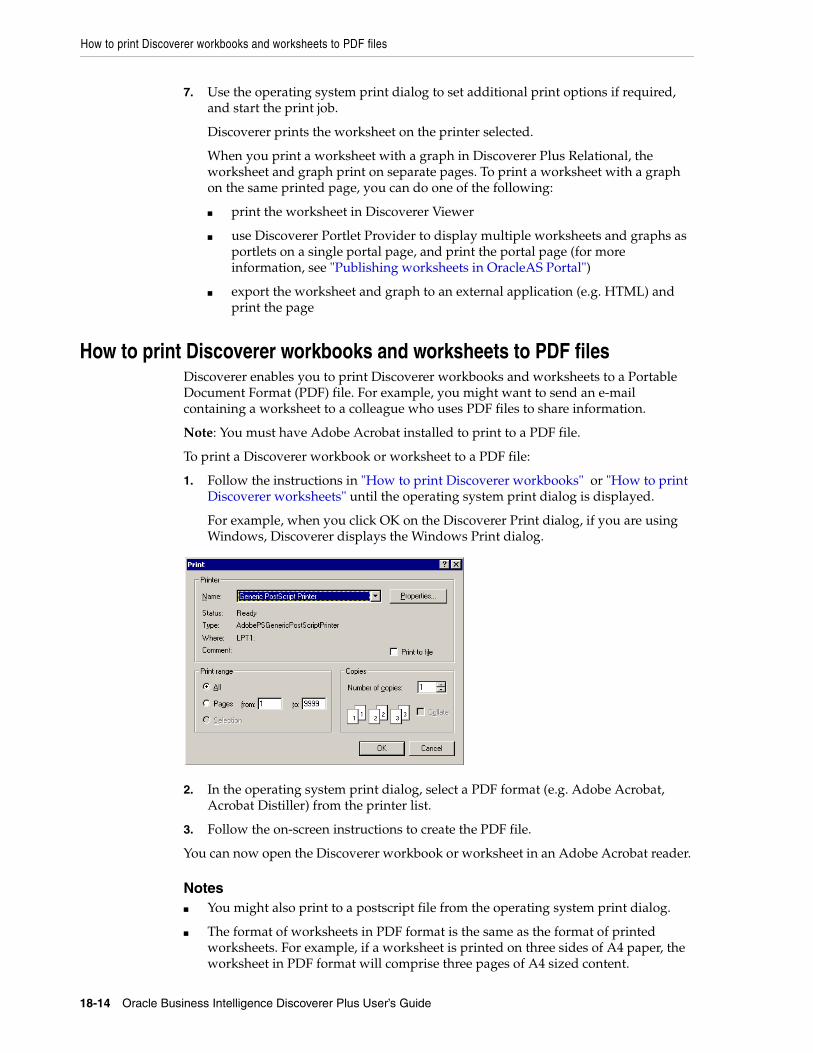
How to print Discoverer workbooks and worksheets to PDF files
18-14 Oracle Business Intelligence Discoverer Plus User’s Guide
7. Use the operating system print dialog to set additional print options if required, and start the print job.
Discoverer prints the worksheet on the printer selected.
When you print a worksheet with a graph in Discoverer Plus Relational, the worksheet and graph print on separate pages. To print a worksheet with a graph on the same printed page, you can do one of the following:
■ print the worksheet in Discoverer Viewer
■ use Discoverer Portlet Provider to display multiple worksheets and graphs as portlets on a single portal page, and print the portal page (for more information, see "Publishing worksheets in OracleAS Portal")
■ export the worksheet and graph to an external application (e.g. HTML) and print the page
How to print Discoverer workbooks and worksheets to PDF filesDiscoverer enables you to print Discoverer workbooks and worksheets to a Portable Document Format (PDF) file. For example, you might want to send an e-mail containing a worksheet to a colleague who uses PDF files to share information.
Note: You must have Adobe Acrobat installed to print to a PDF file.
To print a Discoverer workbook or worksheet to a PDF file:
1. Follow the instructions in "How to print Discoverer workbooks" or "How to print Discoverer worksheets" until the operating system print dialog is displayed.
For example, when you click OK on the Discoverer Print dialog, if you are using Windows, Discoverer displays the Windows Print dialog.
2. In the operating system print dialog, select a PDF format (e.g. Adobe Acrobat, Acrobat Distiller) from the printer list.
3. Follow the on-screen instructions to create the PDF file.
You can now open the Discoverer workbook or worksheet in an Adobe Acrobat reader.
Notes■ You might also print to a postscript file from the operating system print dialog.
■ The format of worksheets in PDF format is the same as the format of printed worksheets. For example, if a worksheet is printed on three sides of A4 paper, the worksheet in PDF format will comprise three pages of A4 sized content.
Exporting data to other applications 19-1
19Exporting data to other applications
This chapter explains how to export worksheet data and graphs in Discoverer Plus Relational, and contains the following topics:
■ "About exporting Discoverer data to other applications"
■ "About exporting worksheets to Oracle Reports"
■ "About exporting worksheets to Microsoft Excel"
■ "About exporting worksheets to Microsoft Excel Web Query format"
■ "About how worksheets and graphs are exported"
■ "About exporting worksheets that contain page items"
■ "About accessing exported files"
■ "How to export Discoverer data"
About exporting Discoverer data to other applicationsYou can share your worksheets and graphs with other people by exporting the worksheets to popular application formats (e.g. Oracle Reports, Microsoft Excel). For example, you might want to:
■ e-mail a Discoverer worksheet in HTML format to your manager
■ use the power of Oracle Reports to customize a Discoverer worksheet
You can use Discoverer’s Export Wizard to export worksheets and graphs in other formats (for more information, see "How to export Discoverer data"). You can also use buttons on the toolbar to export Discoverer data to Microsoft Excel and HTML formats.
When you export a worksheet, you export the data in the worksheet. Depending on the export format you choose, the exported worksheet might also contain its formatting and layout information. In some application formats, the exported worksheet might also contain Discoverer items. For example, if you export to Oracle Reports you export Discoverer calculations and totals. In other words, you can view the exported data in another application, but you cannot apply all Discoverer features to the data in that application.
In Discoverer, you export data for items currently displayed on the worksheet. If you want to export data that is not currently displayed, make sure that you display the items on the worksheet before you start. If you do not want to export data displayed on the worksheet, make sure that you remove the items from the worksheet before you start.
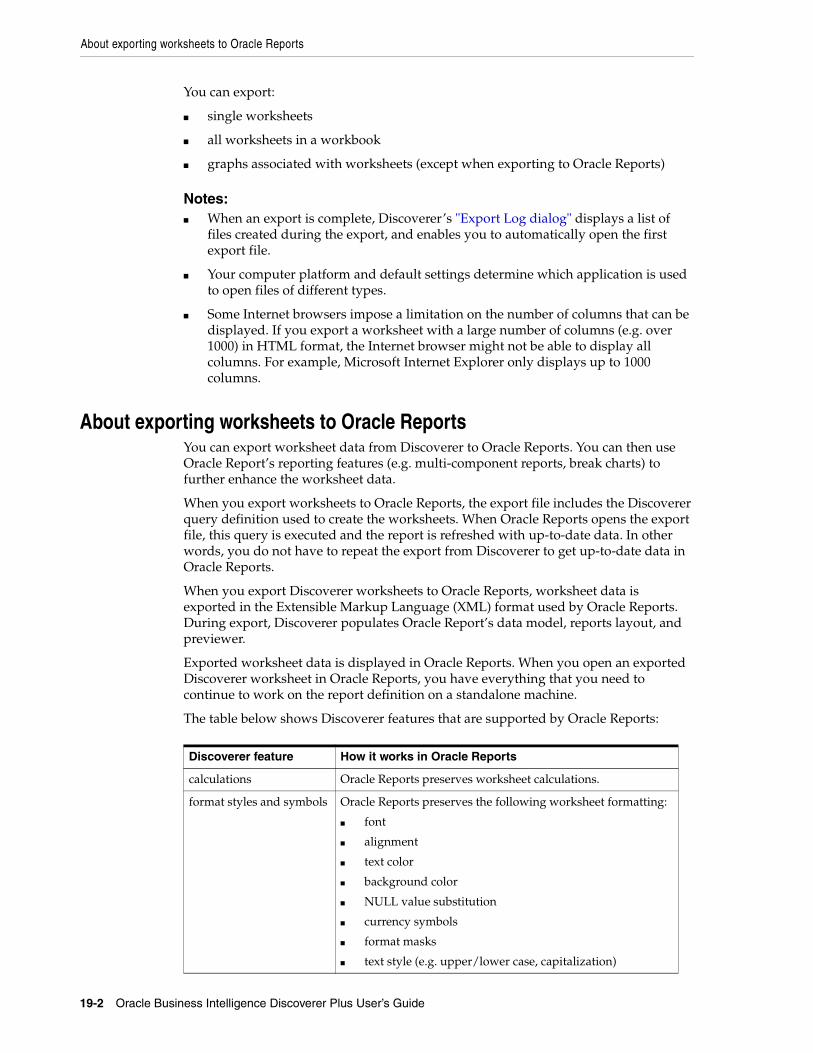
About exporting worksheets to Oracle Reports
19-2 Oracle Business Intelligence Discoverer Plus User’s Guide
You can export:
■ single worksheets
■ all worksheets in a workbook
■ graphs associated with worksheets (except when exporting to Oracle Reports)
Notes:■ When an export is complete, Discoverer’s "Export Log dialog" displays a list of
files created during the export, and enables you to automatically open the first export file.
■ Your computer platform and default settings determine which application is used to open files of different types.
■ Some Internet browsers impose a limitation on the number of columns that can be displayed. If you export a worksheet with a large number of columns (e.g. over 1000) in HTML format, the Internet browser might not be able to display all columns. For example, Microsoft Internet Explorer only displays up to 1000 columns.
About exporting worksheets to Oracle ReportsYou can export worksheet data from Discoverer to Oracle Reports. You can then use Oracle Report’s reporting features (e.g. multi-component reports, break charts) to further enhance the worksheet data.
When you export worksheets to Oracle Reports, the export file includes the Discoverer query definition used to create the worksheets. When Oracle Reports opens the export file, this query is executed and the report is refreshed with up-to-date data. In other words, you do not have to repeat the export from Discoverer to get up-to-date data in Oracle Reports.
When you export Discoverer worksheets to Oracle Reports, worksheet data is exported in the Extensible Markup Language (XML) format used by Oracle Reports. During export, Discoverer populates Oracle Report’s data model, reports layout, and previewer.
Exported worksheet data is displayed in Oracle Reports. When you open an exported Discoverer worksheet in Oracle Reports, you have everything that you need to continue to work on the report definition on a standalone machine.
The table below shows Discoverer features that are supported by Oracle Reports:
Discoverer feature How it works in Oracle Reports
calculations Oracle Reports preserves worksheet calculations.
format styles and symbols Oracle Reports preserves the following worksheet formatting:
■ font
■ alignment
■ text color
■ background color
■ NULL value substitution
■ currency symbols
■ format masks
■ text style (e.g. upper/lower case, capitalization)
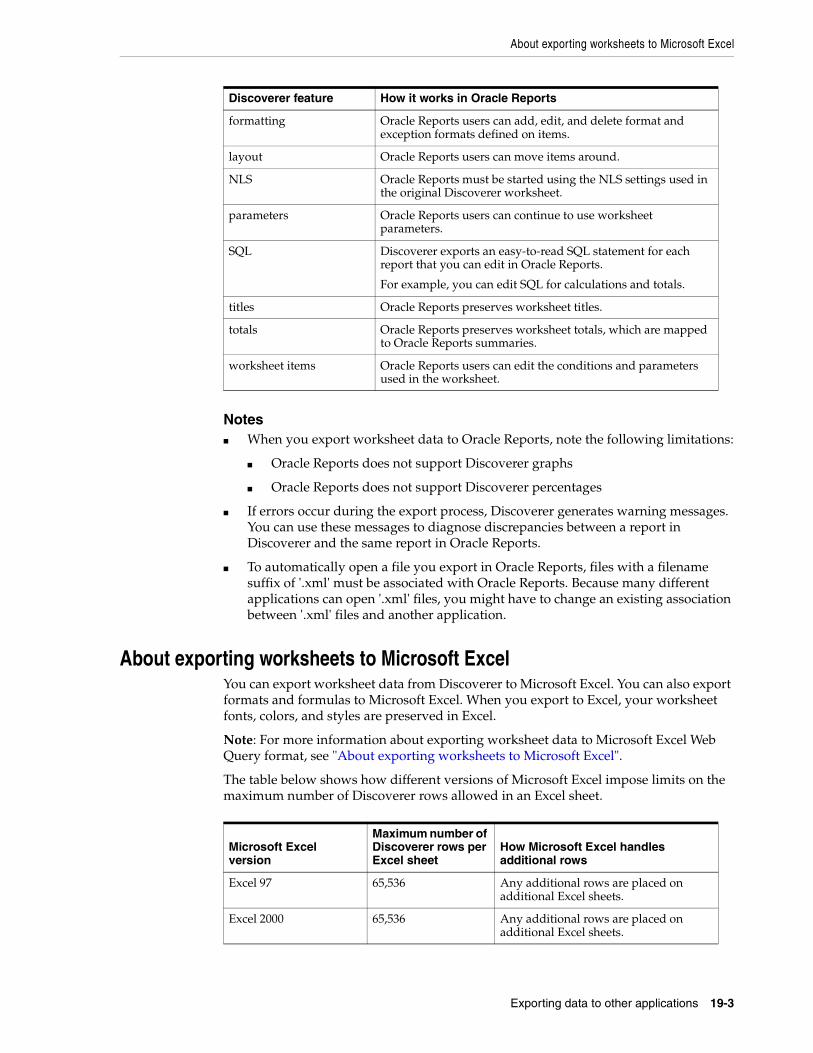
About exporting worksheets to Microsoft Excel
Exporting data to other applications 19-3
Notes■ When you export worksheet data to Oracle Reports, note the following limitations:
■ Oracle Reports does not support Discoverer graphs
■ Oracle Reports does not support Discoverer percentages
■ If errors occur during the export process, Discoverer generates warning messages. You can use these messages to diagnose discrepancies between a report in Discoverer and the same report in Oracle Reports.
■ To automatically open a file you export in Oracle Reports, files with a filename suffix of '.xml' must be associated with Oracle Reports. Because many different applications can open '.xml' files, you might have to change an existing association between '.xml' files and another application.
About exporting worksheets to Microsoft ExcelYou can export worksheet data from Discoverer to Microsoft Excel. You can also export formats and formulas to Microsoft Excel. When you export to Excel, your worksheet fonts, colors, and styles are preserved in Excel.
Note: For more information about exporting worksheet data to Microsoft Excel Web Query format, see "About exporting worksheets to Microsoft Excel".
The table below shows how different versions of Microsoft Excel impose limits on the maximum number of Discoverer rows allowed in an Excel sheet.
formatting Oracle Reports users can add, edit, and delete format and exception formats defined on items.
layout Oracle Reports users can move items around.
NLS Oracle Reports must be started using the NLS settings used in the original Discoverer worksheet.
parameters Oracle Reports users can continue to use worksheet parameters.
SQL Discoverer exports an easy-to-read SQL statement for each report that you can edit in Oracle Reports.
For example, you can edit SQL for calculations and totals.
titles Oracle Reports preserves worksheet titles.
totals Oracle Reports preserves worksheet totals, which are mapped to Oracle Reports summaries.
worksheet items Oracle Reports users can edit the conditions and parameters used in the worksheet.
Microsoft Excel version
Maximum number of Discoverer rows per Excel sheet
How Microsoft Excel handles additional rows
Excel 97 65,536 Any additional rows are placed on additional Excel sheets.
Excel 2000 65,536 Any additional rows are placed on additional Excel sheets.
Discoverer feature How it works in Oracle Reports
About exporting worksheets to Microsoft Excel Web Query format
19-4 Oracle Business Intelligence Discoverer Plus User’s Guide
Notes■ When you export a worksheet and a graph to Excel format, the worksheet data is
displayed in the spreadsheet. The graph file (a PNG format file by default) is placed in the default drive location, and can be inserted manually into the spreadsheet using Excel’s Insert | Picture | From File option.
■ Contact the Discoverer manager to find out whether Discoverer is configured to export to Microsoft Excel 97.
■ When export worksheets to Microsoft Excel, you must export to a version of Microsoft Excel in the same local language as Discoverer Plus Relational.
About using Internet Explorer v6.0 when exporting to Microsoft Excel formatIf you are exporting from Discoverer Plus Relational to Microsoft Excel using Internet Explorer v6.0, a separate browser window might not launch as expected. This problem is due to a change in behavior in Internet Explorer v6.0.
Follow these instructions to work around the problem by specifying the Discoverer middle tier as a trusted site in Internet Explorer:
1. Select Tools | Internet Options from the Internet Explorer menu bar to display the Internet Options dialog.
2. Display the Security tab.
3. Select the Trusted Sites icon and click the Sites button to display the Trusted sites dialog.
4. Enter the URL of the Discoverer middle tier in the format: http://<host.domain>:<port>, where:
■ <host.domain> is the server name and domain on which the Oracle HTTP Server is installed
■ <port> is the port number (typically 7777 or 7778) on which Discoverer is installed
Note: If you do not know the host.domain or port details, contact the Discoverer manager.
About exporting worksheets to Microsoft Excel Web Query formatThis section explains how to export worksheet data from Discoverer to Microsoft Excel Web Query format.
Note: Web Query for Microsoft Excel (*.iqy) format is not available in a Single Sign-On environment. Contact the Discoverer manager or Oracle administrator for more information.
About Discoverer support for Microsoft Excel Web Query formatMicrosoft Excel Web Query is an external data format in Microsoft Excel that enables you to include dynamic data from an Internet or Intranet URL (e.g. a Discoverer worksheet) in a Microsoft Excel worksheet. For example, you might want to create a Microsoft Excel worksheet that contains a Discoverer sales report for a range of dates that you specify when you open the worksheet in Microsoft Excel. The Microsoft Excel worksheet stores the query used to obtain the Discoverer data, so that the data can be refreshed automatically.
About how worksheets and graphs are exported
Exporting data to other applications 19-5
Discoverer enables you to export Discoverer data to Microsoft Excel Web Query format by selecting Web Query for Microsoft Excel 2000+ (*.iqy) from the list of export types. End users can then access dynamic Discoverer worksheets in Microsoft Excel. You can export data to Microsoft Excel Web Query format from both Discoverer Plus Relational and Discoverer Viewer.
Notes■ To access Discoverer reports exported to Microsoft Excel Web Query format,
Microsoft Excel end users require Microsoft Excel 2000 (or later) and Microsoft Internet Explorer 5.5 (or later).
■ You can only export numeric and textual data into Microsoft Excel Web Query format. You cannot export Discoverer graphs into Microsoft Excel Web Query format.
■ Once you have imported a Discoverer report to Microsoft Excel, refresh the sheet in Excel when you want to display up-to-date data. Please refer to Microsoft Excel documentation for more information about how to refresh data in Microsoft Excel.
About Microsoft Excel Web Query format and Discoverer securityMicrosoft Excel end users are always prompted for a database password or Oracle Applications password.
If you export data from Discoverer when connecting using a private connection or temporary connection to Microsoft Excel Web Query format, you can specify that you want Microsoft Excel end users to be prompted to enter login details, which include:
■ database user name
■ database name
■ Oracle Applications user name (if in an Oracle Applications environment)
■ Oracle Applications Responsibility (if in an Applications environment)
■ Oracle Applications Security Group (if in an Oracle Applications environment)
When you export data from Discoverer Plus Relational or Discoverer Viewer to Microsoft Excel Web Query format using a public connection, you do not get the prompt Connection Information? in the Export Wizard (i.e. on the "Export Wizard dialog: Format and Name page"). Excel end users accessing the Excel sheet will simply be prompted for a database password. Therefore, you must supply a database password to Excel end users when you export Discoverer worksheet data to Web Query format using a public connection, to enable them to access the Discoverer worksheet data.
If you export Discoverer data in Oracle Applications Suite Secure Invocation mode (e.g. from an Oracle Applications personal home page within Oracle Business Intelligence System or Embedded Data Warehouse), the Discoverer query stored in the Excel sheet runs in 'standalone' Oracle Applications mode.
About how worksheets and graphs are exportedWhen you export a workbook containing worksheets with associated graphs, Discoverer creates worksheets and their graphs as separate files:
■ one export file for each worksheet in the workbook
■ one export file for each graph (in PNG format by default)
About exporting worksheets that contain page items
19-6 Oracle Business Intelligence Discoverer Plus User’s Guide
For example, if you export a worksheet called Sales and its graph in HTML format, Discoverer creates the following files (by default):
■ Sales.html - this file contains a HTML version of the worksheet
■ Sales.png - this file contains the graph in PNG format
Notes■ Discoverer exports graphs in PNG format by default. PNG format is an image file
format that is common on the Web and supported by many business applications. Graph files in PNG format are of better quality that files in GIF format, which are limited to 256 colors.
■ You can also choose to export graphs at different sizes. You can export a graph as the same size that you see it on the screen, or you can resize the graph to make it larger or smaller (for more information, see "Export Wizard dialog: Format and Name page").
About exporting worksheets that contain page itemsWhen you export a worksheet that contains page items, you export exactly what you see on the screen. In other words, you export data for the currently selected page item.
To export other combinations of page items, first pivot the page items and then export the modified worksheet.
If you want to export all page items, pivot the page item to the body of the worksheet so that all page items are visible on the worksheet.
About accessing exported filesWhen you export data from Discoverer, you can start the application associated with the format of exported data. For example, when you export to Excel format, you can start Microsoft Excel (for more information, see the "Export Wizard dialog: Format and Name page").
How to export Discoverer dataYou export worksheet data so that you can use the data in a Discoverer worksheet in a different application. For example, you might want to produce a Discoverer worksheet and graph in HTML format.
To export worksheet data:
1. Open the worksheet that you want to export.
2. Choose File | Export to display the "Export Wizard dialog: Select page", which enables you to specify the parts of the workbook you want to export.
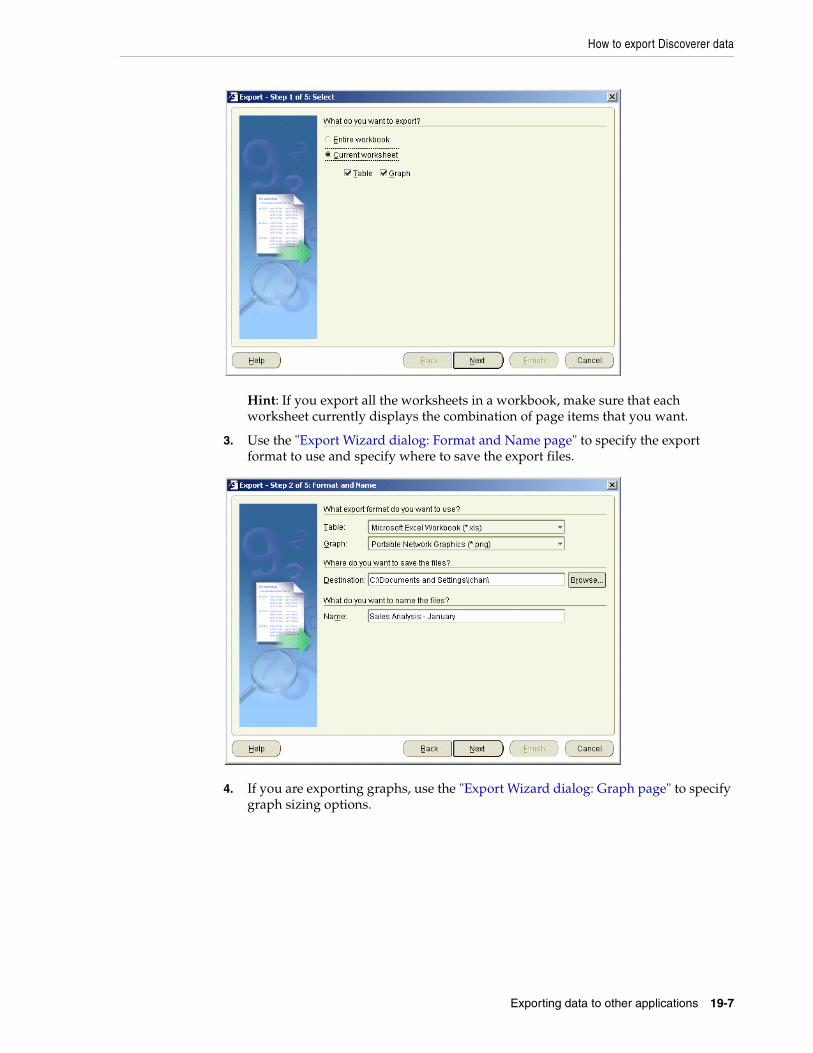
How to export Discoverer data
Exporting data to other applications 19-7
Hint: If you export all the worksheets in a workbook, make sure that each worksheet currently displays the combination of page items that you want.
3. Use the "Export Wizard dialog: Format and Name page" to specify the export format to use and specify where to save the export files.
4. If you are exporting graphs, use the "Export Wizard dialog: Graph page" to specify graph sizing options.
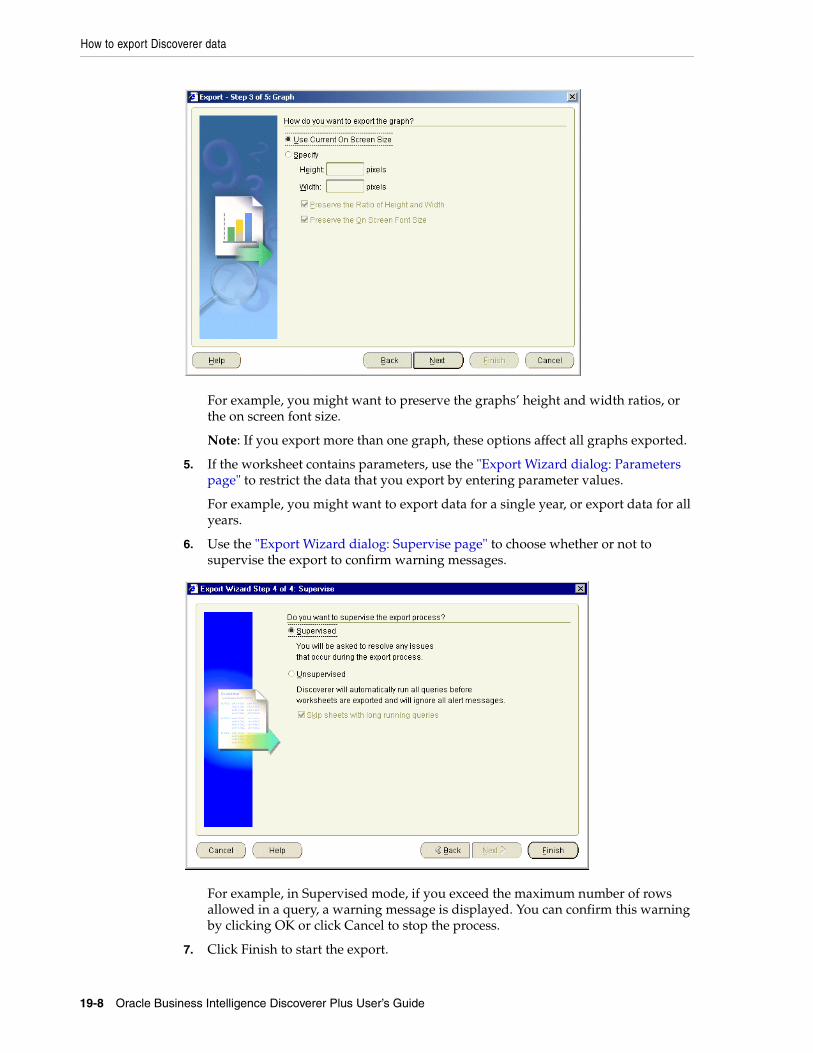
How to export Discoverer data
19-8 Oracle Business Intelligence Discoverer Plus User’s Guide
For example, you might want to preserve the graphs’ height and width ratios, or the on screen font size.
Note: If you export more than one graph, these options affect all graphs exported.
5. If the worksheet contains parameters, use the "Export Wizard dialog: Parameters page" to restrict the data that you export by entering parameter values.
For example, you might want to export data for a single year, or export data for all years.
6. Use the "Export Wizard dialog: Supervise page" to choose whether or not to supervise the export to confirm warning messages.
For example, in Supervised mode, if you exceed the maximum number of rows allowed in a query, a warning message is displayed. You can confirm this warning by clicking OK or click Cancel to stop the process.
7. Click Finish to start the export.
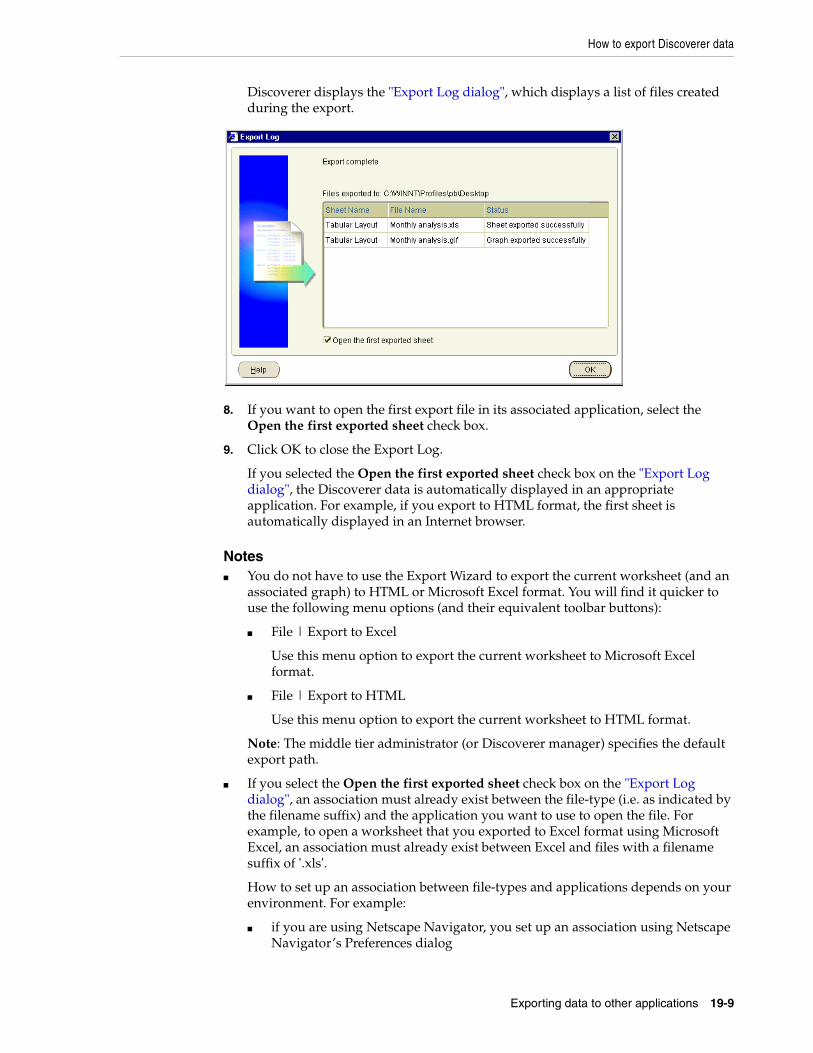
How to export Discoverer data
Exporting data to other applications 19-9
Discoverer displays the "Export Log dialog", which displays a list of files created during the export.
8. If you want to open the first export file in its associated application, select the Open the first exported sheet check box.
9. Click OK to close the Export Log.
If you selected the Open the first exported sheet check box on the "Export Log dialog", the Discoverer data is automatically displayed in an appropriate application. For example, if you export to HTML format, the first sheet is automatically displayed in an Internet browser.
Notes■ You do not have to use the Export Wizard to export the current worksheet (and an
associated graph) to HTML or Microsoft Excel format. You will find it quicker to use the following menu options (and their equivalent toolbar buttons):
■ File | Export to Excel
Use this menu option to export the current worksheet to Microsoft Excel format.
■ File | Export to HTML
Use this menu option to export the current worksheet to HTML format.
Note: The middle tier administrator (or Discoverer manager) specifies the default export path.
■ If you select the Open the first exported sheet check box on the "Export Log dialog", an association must already exist between the file-type (i.e. as indicated by the filename suffix) and the application you want to use to open the file. For example, to open a worksheet that you exported to Excel format using Microsoft Excel, an association must already exist between Excel and files with a filename suffix of '.xls'.
How to set up an association between file-types and applications depends on your environment. For example:
■ if you are using Netscape Navigator, you set up an association using Netscape Navigator’s Preferences dialog

How to export Discoverer data
19-10 Oracle Business Intelligence Discoverer Plus User’s Guide
■ if you are using Internet Explorer, you set up an association using the Windows Explorer Options dialog
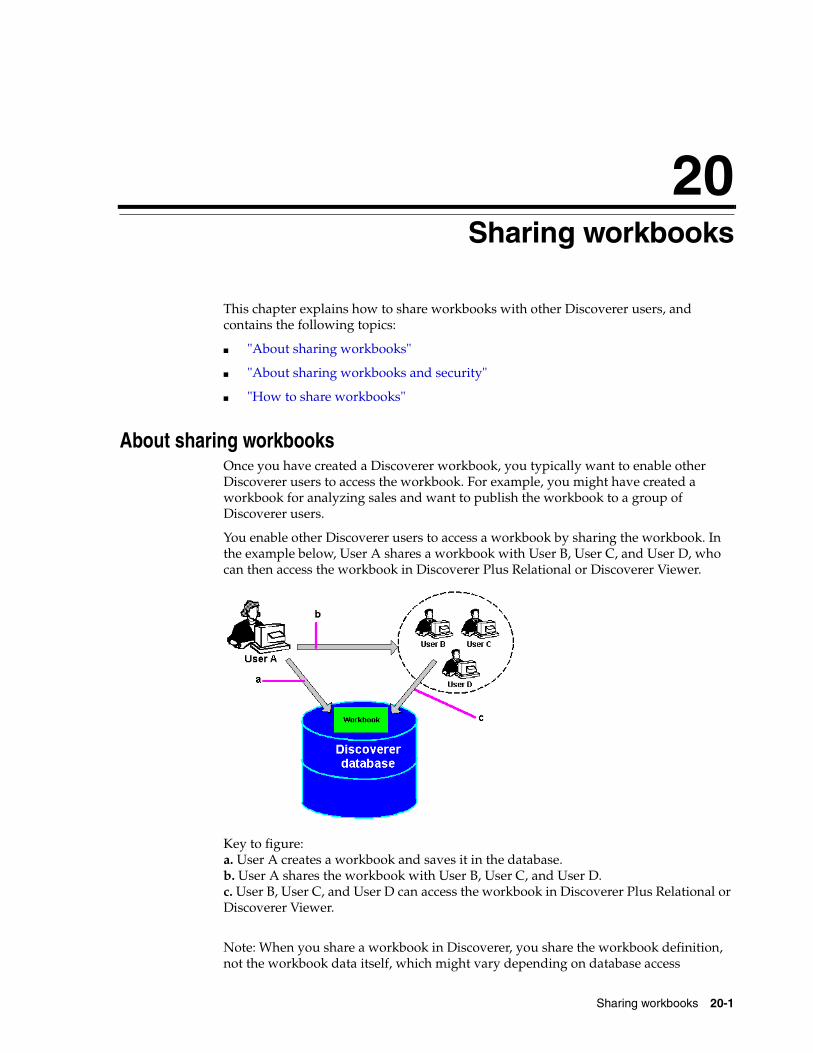
Sharing workbooks 20-1
20Sharing workbooks
This chapter explains how to share workbooks with other Discoverer users, and contains the following topics:
■ "About sharing workbooks"
■ "About sharing workbooks and security"
■ "How to share workbooks"
About sharing workbooksOnce you have created a Discoverer workbook, you typically want to enable other Discoverer users to access the workbook. For example, you might have created a workbook for analyzing sales and want to publish the workbook to a group of Discoverer users.
You enable other Discoverer users to access a workbook by sharing the workbook. In the example below, User A shares a workbook with User B, User C, and User D, who can then access the workbook in Discoverer Plus Relational or Discoverer Viewer.
Key to figure:a. User A creates a workbook and saves it in the database.b. User A shares the workbook with User B, User C, and User D.c. User B, User C, and User D can access the workbook in Discoverer Plus Relational or Discoverer Viewer.
Note: When you share a workbook in Discoverer, you share the workbook definition, not the workbook data itself, which might vary depending on database access
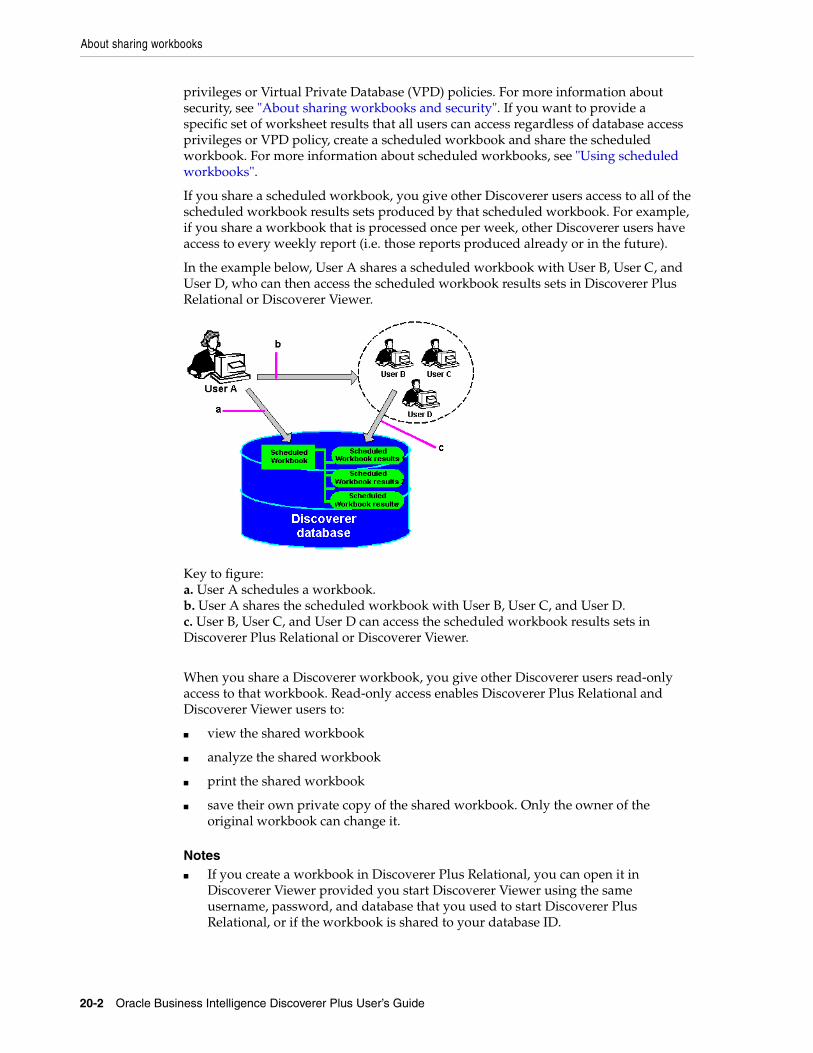
About sharing workbooks
20-2 Oracle Business Intelligence Discoverer Plus User’s Guide
privileges or Virtual Private Database (VPD) policies. For more information about security, see "About sharing workbooks and security". If you want to provide a specific set of worksheet results that all users can access regardless of database access privileges or VPD policy, create a scheduled workbook and share the scheduled workbook. For more information about scheduled workbooks, see "Using scheduled workbooks".
If you share a scheduled workbook, you give other Discoverer users access to all of the scheduled workbook results sets produced by that scheduled workbook. For example, if you share a workbook that is processed once per week, other Discoverer users have access to every weekly report (i.e. those reports produced already or in the future).
In the example below, User A shares a scheduled workbook with User B, User C, and User D, who can then access the scheduled workbook results sets in Discoverer Plus Relational or Discoverer Viewer.
Key to figure:a. User A schedules a workbook.b. User A shares the scheduled workbook with User B, User C, and User D.c. User B, User C, and User D can access the scheduled workbook results sets in Discoverer Plus Relational or Discoverer Viewer.
When you share a Discoverer workbook, you give other Discoverer users read-only access to that workbook. Read-only access enables Discoverer Plus Relational and Discoverer Viewer users to:
■ view the shared workbook
■ analyze the shared workbook
■ print the shared workbook
■ save their own private copy of the shared workbook. Only the owner of the original workbook can change it.
Notes■ If you create a workbook in Discoverer Plus Relational, you can open it in
Discoverer Viewer provided you start Discoverer Viewer using the same username, password, and database that you used to start Discoverer Plus Relational, or if the workbook is shared to your database ID.
How to share workbooks
Sharing workbooks 20-3
About sharing workbooks and securityDiscoverer uses database usernames and database roles (and Applications user ID and responsibilities) to manage workbook security. You can share a workbook with:
■ all Discoverer users (by sharing the workbook with the PUBLIC database user)
■ individual Discoverer users (by sharing the workbook with named database users (and/or roles))
Note: Many Discoverer users might connect to Discoverer using the same database username via a public connection (for more information, see "What are public connections?").
You can only share workbooks that you own (i.e. workbooks created with the database username that you are connected as).
How Discoverer controls access to data depends on whether you share an ordinary workbook or a scheduled workbook, as follows:
■ When you share a workbook in Discoverer, you share the workbook definition, not the workbook data itself. The workbook data that a user can access is dependent on the users’ database access privileges. Discoverer users can only access data to which they have database access privileges. For example, if you share a workbook with a group of Discoverer users, each user will only see the worksheets containing data to which they have been granted database access. In other words, the database administrator (i.e. DBA) controls database access for you.
■ When you share a scheduled workbook in Discoverer, you share the workbook definition and the workbook data of all scheduled workbook results sets produced by that scheduled workbook. For example, if you share a workbook with a group of Discoverer users, each user can see all of the data, regardless of what database access they have been granted.
In other words, this gives you a powerful way to publish Discoverer data. Therefore, you need to make sure that you only share scheduled workbook data with Discoverer users who are allowed access to that data. For more information about sharing scheduled workbooks, see "About sharing workbooks and security").
How to share workbooksYou share Discoverer workbooks in the following ways:
■ You can share a single workbook with multiple database users (and/or roles) in one operation. Use this option when you have a small number of workbooks that you want to share with a large number of Discoverer users (for more information, see "How to share the currently open workbook with other Discoverer users").
■ You can share multiple workbooks with a single database user (and/or role) in one operation. Use this option when you have a large number of workbooks that you want to share with a small number of Discoverer users (for more information, see "How to share multiple workbooks with a single Discoverer user").
How to share the currently open workbook with other Discoverer usersYou share the currently open workbook with other Discoverer users to enable other users to access a workbook using Discoverer Plus Relational or Discoverer Viewer. For example, you might want to enable other Discoverer users to access a sales workbook that you have created.
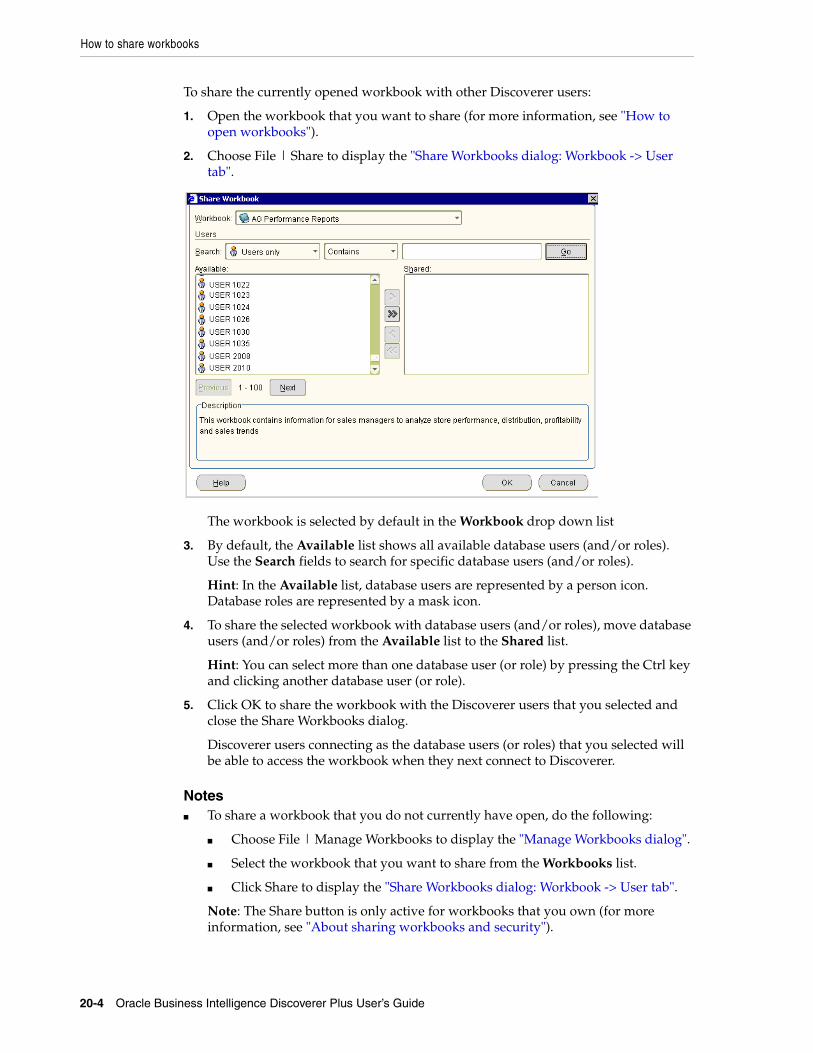
How to share workbooks
20-4 Oracle Business Intelligence Discoverer Plus User’s Guide
To share the currently opened workbook with other Discoverer users:
1. Open the workbook that you want to share (for more information, see "How to open workbooks").
2. Choose File | Share to display the "Share Workbooks dialog: Workbook -> User tab".
The workbook is selected by default in the Workbook drop down list
3. By default, the Available list shows all available database users (and/or roles). Use the Search fields to search for specific database users (and/or roles).
Hint: In the Available list, database users are represented by a person icon. Database roles are represented by a mask icon.
4. To share the selected workbook with database users (and/or roles), move database users (and/or roles) from the Available list to the Shared list.
Hint: You can select more than one database user (or role) by pressing the Ctrl key and clicking another database user (or role).
5. Click OK to share the workbook with the Discoverer users that you selected and close the Share Workbooks dialog.
Discoverer users connecting as the database users (or roles) that you selected will be able to access the workbook when they next connect to Discoverer.
Notes■ To share a workbook that you do not currently have open, do the following:
■ Choose File | Manage Workbooks to display the "Manage Workbooks dialog".
■ Select the workbook that you want to share from the Workbooks list.
■ Click Share to display the "Share Workbooks dialog: Workbook -> User tab".
Note: The Share button is only active for workbooks that you own (for more information, see "About sharing workbooks and security").
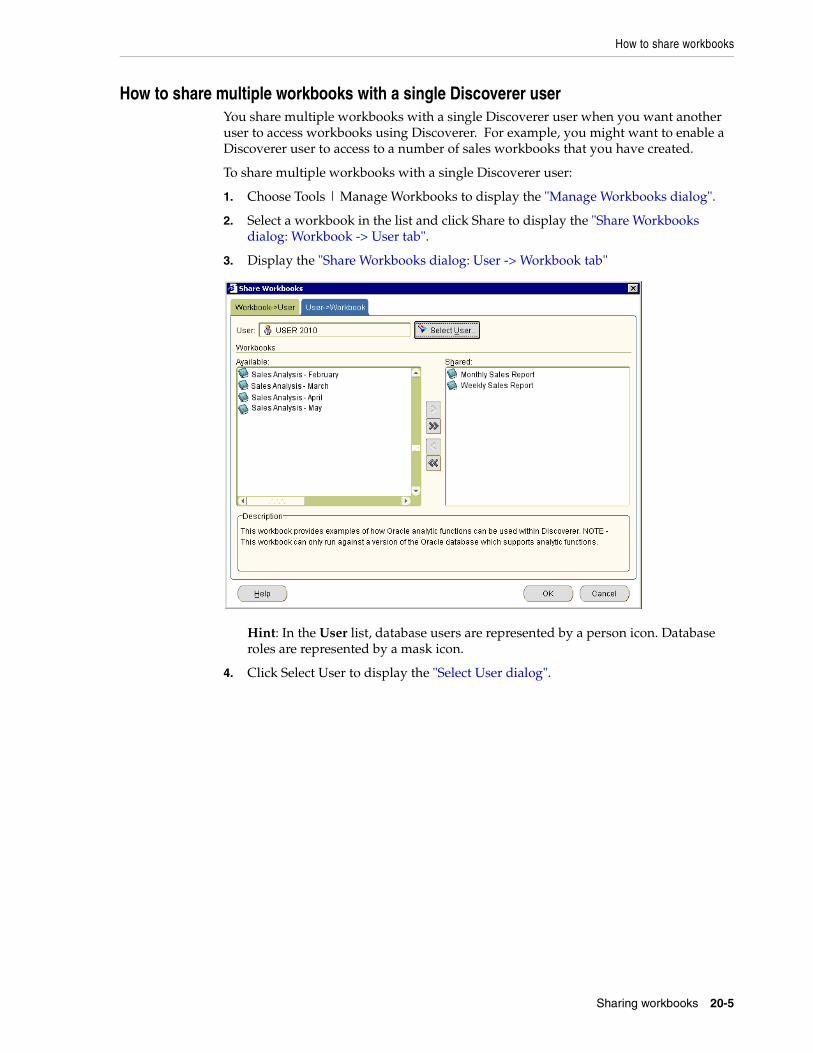
How to share workbooks
Sharing workbooks 20-5
How to share multiple workbooks with a single Discoverer userYou share multiple workbooks with a single Discoverer user when you want another user to access workbooks using Discoverer. For example, you might want to enable a Discoverer user to access to a number of sales workbooks that you have created.
To share multiple workbooks with a single Discoverer user:
1. Choose Tools | Manage Workbooks to display the "Manage Workbooks dialog".
2. Select a workbook in the list and click Share to display the "Share Workbooks dialog: Workbook -> User tab".
3. Display the "Share Workbooks dialog: User -> Workbook tab"
Hint: In the User list, database users are represented by a person icon. Database roles are represented by a mask icon.
4. Click Select User to display the "Select User dialog".
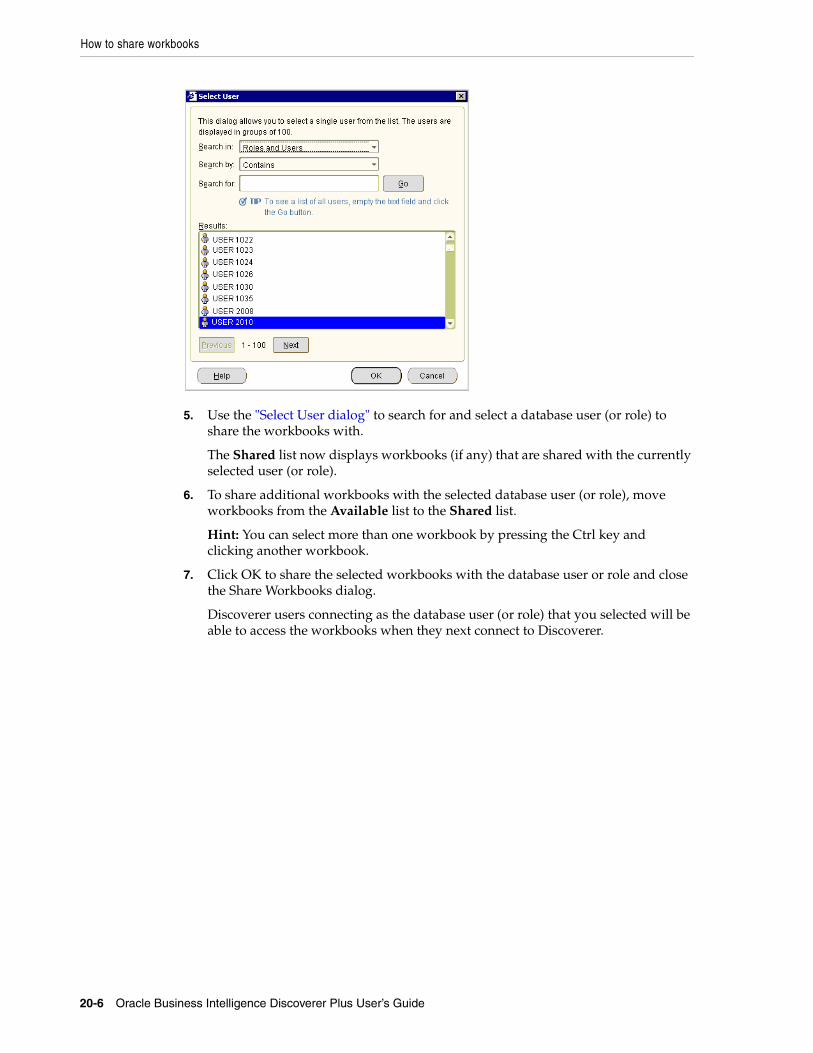
How to share workbooks
20-6 Oracle Business Intelligence Discoverer Plus User’s Guide
5. Use the "Select User dialog" to search for and select a database user (or role) to share the workbooks with.
The Shared list now displays workbooks (if any) that are shared with the currently selected user (or role).
6. To share additional workbooks with the selected database user (or role), move workbooks from the Available list to the Shared list.
Hint: You can select more than one workbook by pressing the Ctrl key and clicking another workbook.
7. Click OK to share the selected workbooks with the database user or role and close the Share Workbooks dialog.
Discoverer users connecting as the database user (or role) that you selected will be able to access the workbooks when they next connect to Discoverer.
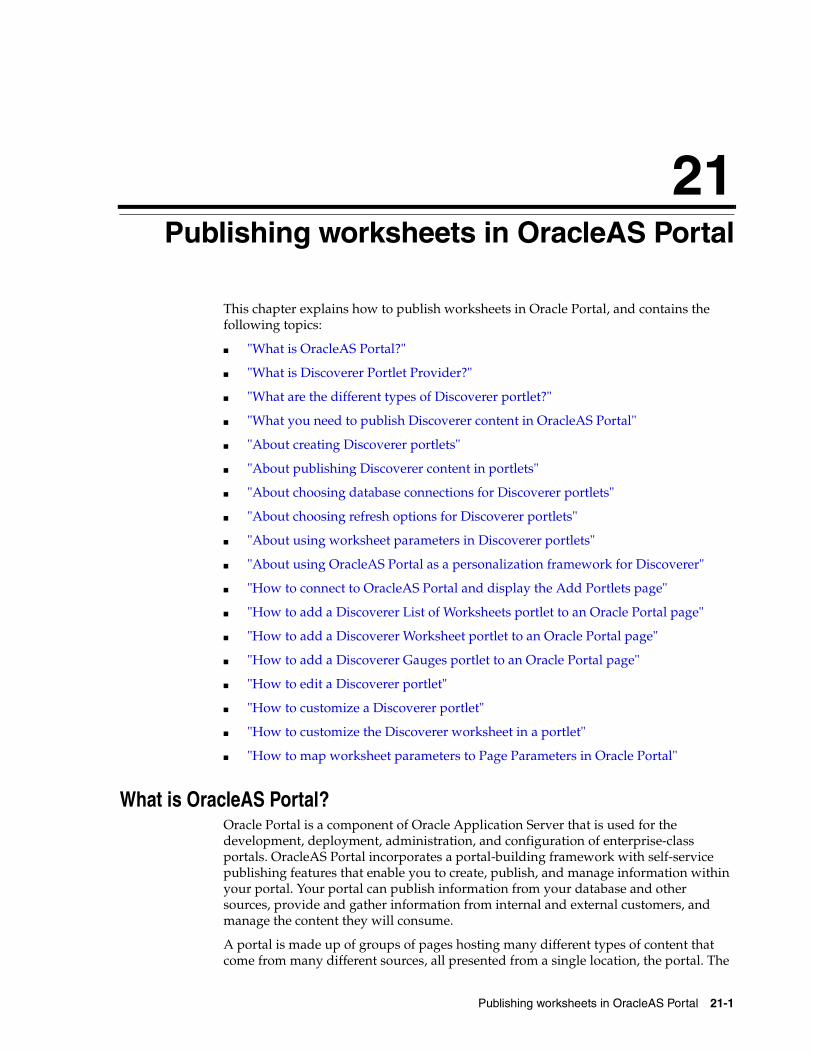
Publishing worksheets in OracleAS Portal 21-1
21Publishing worksheets in OracleAS Portal
This chapter explains how to publish worksheets in Oracle Portal, and contains the following topics:
■ "What is OracleAS Portal?"
■ "What is Discoverer Portlet Provider?"
■ "What are the different types of Discoverer portlet?"
■ "What you need to publish Discoverer content in OracleAS Portal"
■ "About creating Discoverer portlets"
■ "About publishing Discoverer content in portlets"
■ "About choosing database connections for Discoverer portlets"
■ "About choosing refresh options for Discoverer portlets"
■ "About using worksheet parameters in Discoverer portlets"
■ "About using OracleAS Portal as a personalization framework for Discoverer"
■ "How to connect to OracleAS Portal and display the Add Portlets page"
■ "How to add a Discoverer List of Worksheets portlet to an Oracle Portal page"
■ "How to add a Discoverer Worksheet portlet to an Oracle Portal page"
■ "How to add a Discoverer Gauges portlet to an Oracle Portal page"
■ "How to edit a Discoverer portlet"
■ "How to customize a Discoverer portlet"
■ "How to customize the Discoverer worksheet in a portlet"
■ "How to map worksheet parameters to Page Parameters in Oracle Portal"
What is OracleAS Portal?Oracle Portal is a component of Oracle Application Server that is used for the development, deployment, administration, and configuration of enterprise-class portals. OracleAS Portal incorporates a portal-building framework with self-service publishing features that enable you to create, publish, and manage information within your portal. Your portal can publish information from your database and other sources, provide and gather information from internal and external customers, and manage the content they will consume.
A portal is made up of groups of pages hosting many different types of content that come from many different sources, all presented from a single location, the portal. The
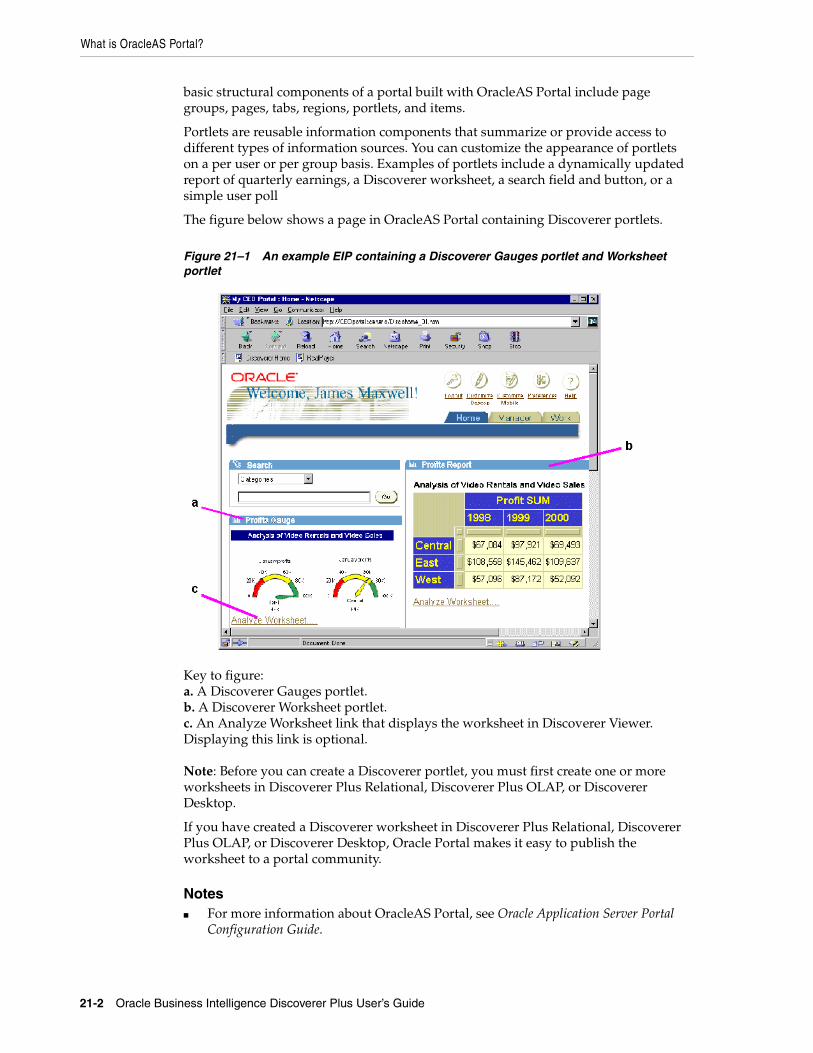
What is OracleAS Portal?
21-2 Oracle Business Intelligence Discoverer Plus User’s Guide
basic structural components of a portal built with OracleAS Portal include page groups, pages, tabs, regions, portlets, and items.
Portlets are reusable information components that summarize or provide access to different types of information sources. You can customize the appearance of portlets on a per user or per group basis. Examples of portlets include a dynamically updated report of quarterly earnings, a Discoverer worksheet, a search field and button, or a simple user poll
The figure below shows a page in OracleAS Portal containing Discoverer portlets.
Figure 21–1 An example EIP containing a Discoverer Gauges portlet and Worksheet portlet
Key to figure:a. A Discoverer Gauges portlet.b. A Discoverer Worksheet portlet.c. An Analyze Worksheet link that displays the worksheet in Discoverer Viewer. Displaying this link is optional.
Note: Before you can create a Discoverer portlet, you must first create one or more worksheets in Discoverer Plus Relational, Discoverer Plus OLAP, or Discoverer Desktop.
If you have created a Discoverer worksheet in Discoverer Plus Relational, Discoverer Plus OLAP, or Discoverer Desktop, Oracle Portal makes it easy to publish the worksheet to a portal community.
Notes■ For more information about OracleAS Portal, see Oracle Application Server Portal
Configuration Guide.
What are the different types of Discoverer portlet?
Publishing worksheets in OracleAS Portal 21-3
What is Discoverer Portlet Provider?Providers act as containers for portlets. Providers manage the portlets they own and handle the communication between the portlets and OracleAS Portal.
Discoverer Portlet Provider is a Discoverer portal component that provides a number of Discoverer portlets for publishing Discoverer content. For more information about portlet styles available for Discoverer content, see "What are the different types of Discoverer portlet?".
Figure 21–2 Discoverer Portlet Provider in relation to the Discoverer BI toolset
What are the different types of Discoverer portlet?OracleAS Portal publishers can create the following types of Discoverer portlets:
■ List of Worksheets portlet (for more information, see "About the Discoverer List of Worksheets portlet")
■ Worksheet portlet (for more information, see "About the Discoverer Worksheet portlet")
■ Gauges portlet (for more information, see "About the Discoverer Gauges portlet")
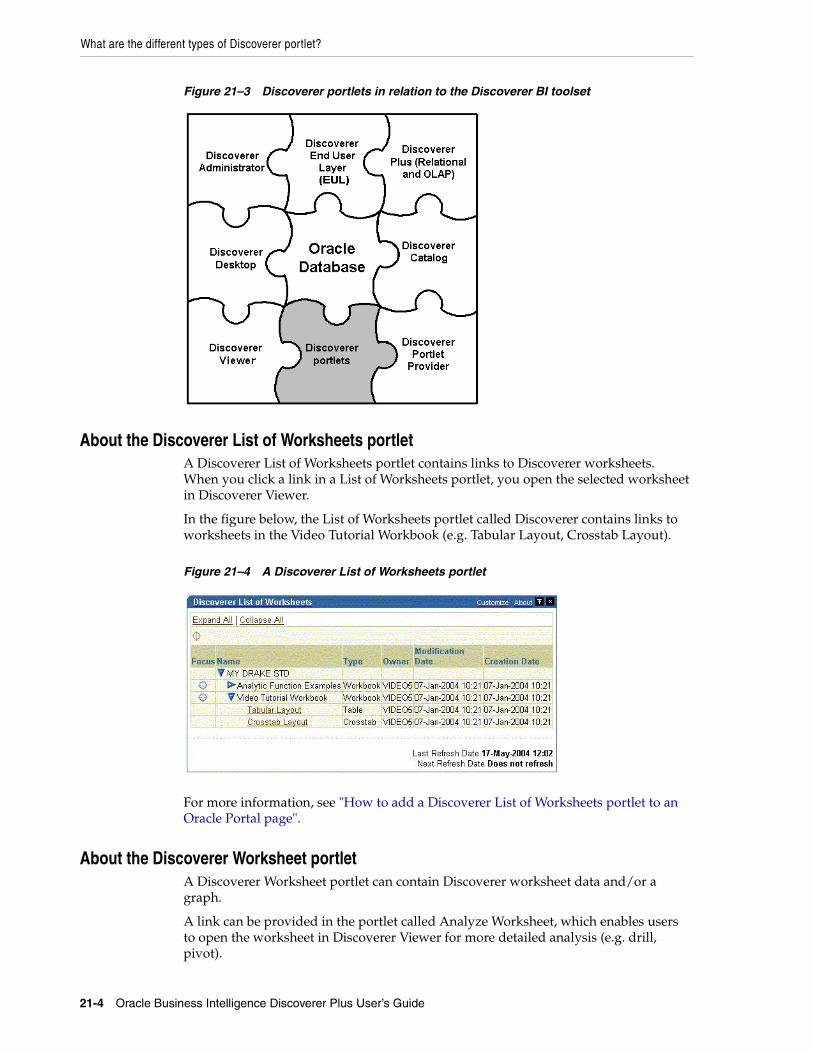
What are the different types of Discoverer portlet?
21-4 Oracle Business Intelligence Discoverer Plus User’s Guide
Figure 21–3 Discoverer portlets in relation to the Discoverer BI toolset
About the Discoverer List of Worksheets portletA Discoverer List of Worksheets portlet contains links to Discoverer worksheets. When you click a link in a List of Worksheets portlet, you open the selected worksheet in Discoverer Viewer.
In the figure below, the List of Worksheets portlet called Discoverer contains links to worksheets in the Video Tutorial Workbook (e.g. Tabular Layout, Crosstab Layout).
Figure 21–4 A Discoverer List of Worksheets portlet
For more information, see "How to add a Discoverer List of Worksheets portlet to an Oracle Portal page".
About the Discoverer Worksheet portletA Discoverer Worksheet portlet can contain Discoverer worksheet data and/or a graph.
A link can be provided in the portlet called Analyze Worksheet, which enables users to open the worksheet in Discoverer Viewer for more detailed analysis (e.g. drill, pivot).
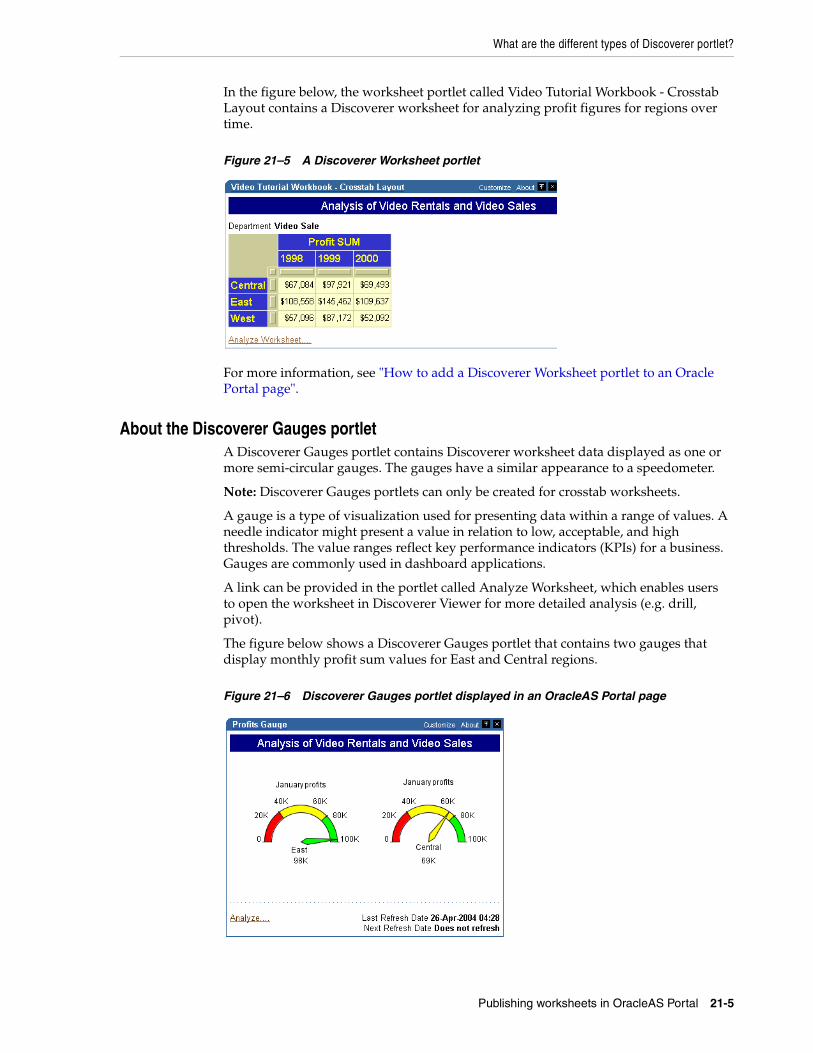
What are the different types of Discoverer portlet?
Publishing worksheets in OracleAS Portal 21-5
In the figure below, the worksheet portlet called Video Tutorial Workbook - Crosstab Layout contains a Discoverer worksheet for analyzing profit figures for regions over time.
Figure 21–5 A Discoverer Worksheet portlet
For more information, see "How to add a Discoverer Worksheet portlet to an Oracle Portal page".
About the Discoverer Gauges portletA Discoverer Gauges portlet contains Discoverer worksheet data displayed as one or more semi-circular gauges. The gauges have a similar appearance to a speedometer.
Note: Discoverer Gauges portlets can only be created for crosstab worksheets.
A gauge is a type of visualization used for presenting data within a range of values. A needle indicator might present a value in relation to low, acceptable, and high thresholds. The value ranges reflect key performance indicators (KPIs) for a business. Gauges are commonly used in dashboard applications.
A link can be provided in the portlet called Analyze Worksheet, which enables users to open the worksheet in Discoverer Viewer for more detailed analysis (e.g. drill, pivot).
The figure below shows a Discoverer Gauges portlet that contains two gauges that display monthly profit sum values for East and Central regions.
Figure 21–6 Discoverer Gauges portlet displayed in an OracleAS Portal page
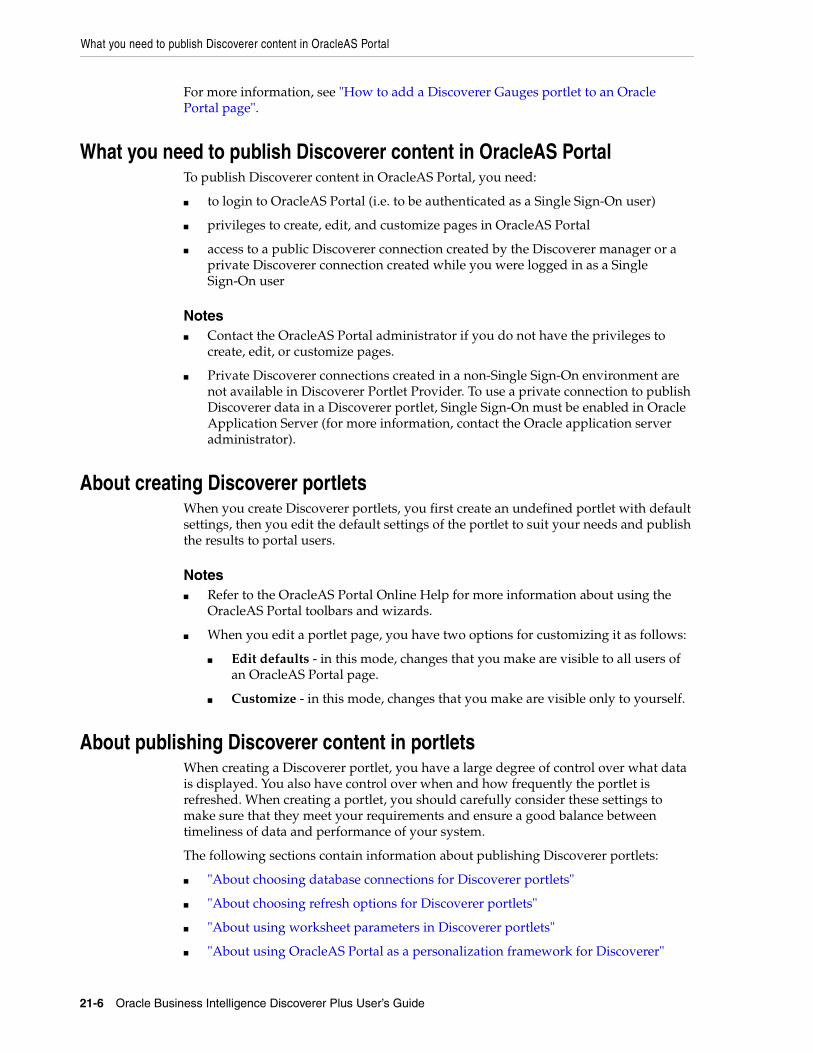
What you need to publish Discoverer content in OracleAS Portal
21-6 Oracle Business Intelligence Discoverer Plus User’s Guide
For more information, see "How to add a Discoverer Gauges portlet to an Oracle Portal page".
What you need to publish Discoverer content in OracleAS PortalTo publish Discoverer content in OracleAS Portal, you need:
■ to login to OracleAS Portal (i.e. to be authenticated as a Single Sign-On user)
■ privileges to create, edit, and customize pages in OracleAS Portal
■ access to a public Discoverer connection created by the Discoverer manager or a private Discoverer connection created while you were logged in as a Single Sign-On user
Notes■ Contact the OracleAS Portal administrator if you do not have the privileges to
create, edit, or customize pages.
■ Private Discoverer connections created in a non-Single Sign-On environment are not available in Discoverer Portlet Provider. To use a private connection to publish Discoverer data in a Discoverer portlet, Single Sign-On must be enabled in Oracle Application Server (for more information, contact the Oracle application server administrator).
About creating Discoverer portletsWhen you create Discoverer portlets, you first create an undefined portlet with default settings, then you edit the default settings of the portlet to suit your needs and publish the results to portal users.
Notes■ Refer to the OracleAS Portal Online Help for more information about using the
OracleAS Portal toolbars and wizards.
■ When you edit a portlet page, you have two options for customizing it as follows:
■ Edit defaults - in this mode, changes that you make are visible to all users of an OracleAS Portal page.
■ Customize - in this mode, changes that you make are visible only to yourself.
About publishing Discoverer content in portletsWhen creating a Discoverer portlet, you have a large degree of control over what data is displayed. You also have control over when and how frequently the portlet is refreshed. When creating a portlet, you should carefully consider these settings to make sure that they meet your requirements and ensure a good balance between timeliness of data and performance of your system.
The following sections contain information about publishing Discoverer portlets:
■ "About choosing database connections for Discoverer portlets"
■ "About choosing refresh options for Discoverer portlets"
■ "About using worksheet parameters in Discoverer portlets"
■ "About using OracleAS Portal as a personalization framework for Discoverer"
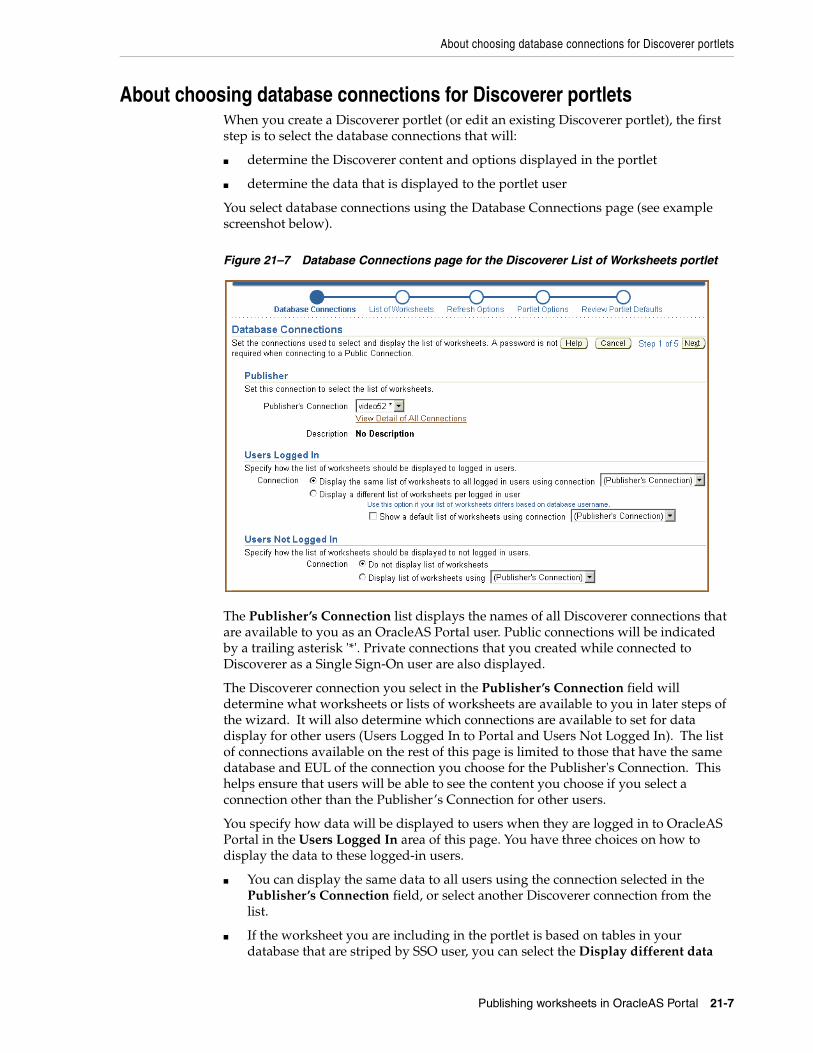
About choosing database connections for Discoverer portlets
Publishing worksheets in OracleAS Portal 21-7
About choosing database connections for Discoverer portletsWhen you create a Discoverer portlet (or edit an existing Discoverer portlet), the first step is to select the database connections that will:
■ determine the Discoverer content and options displayed in the portlet
■ determine the data that is displayed to the portlet user
You select database connections using the Database Connections page (see example screenshot below).
Figure 21–7 Database Connections page for the Discoverer List of Worksheets portlet
The Publisher’s Connection list displays the names of all Discoverer connections that are available to you as an OracleAS Portal user. Public connections will be indicated by a trailing asterisk '*'. Private connections that you created while connected to Discoverer as a Single Sign-On user are also displayed.
The Discoverer connection you select in the Publisher’s Connection field will determine what worksheets or lists of worksheets are available to you in later steps of the wizard. It will also determine which connections are available to set for data display for other users (Users Logged In to Portal and Users Not Logged In). The list of connections available on the rest of this page is limited to those that have the same database and EUL of the connection you choose for the Publisher's Connection. This helps ensure that users will be able to see the content you choose if you select a connection other than the Publisher’s Connection for other users.
You specify how data will be displayed to users when they are logged in to OracleAS Portal in the Users Logged In area of this page. You have three choices on how to display the data to these logged-in users.
■ You can display the same data to all users using the connection selected in the Publisher’s Connection field, or select another Discoverer connection from the list.
■ If the worksheet you are including in the portlet is based on tables in your database that are striped by SSO user, you can select the Display different data
About choosing database connections for Discoverer portlets
21-8 Oracle Business Intelligence Discoverer Plus User’s Guide
using the Publisher's Connection option. Choosing this option enables the portlet to use the Publisher's Connection to get access to the worksheet and passes the Portal/SSO username to the database to return only data that the logged in, Portal/SSO user has access to.
■ If the worksheet you are displaying in the portlet is based on tables in your database that are striped by database user, you can select the Allow Users to Customize Database Connection option. Choosing this option enables the user to determine which connection they want to use to get access to the worksheet and the data. In this case the user will only see the worksheet/list of worksheets/gauge if they have access to the published worksheet. You can also optionally select a connection to determine what data will be displayed by default before the user customizes a portlet.
You specify how data will be displayed to users who do not log in to OracleAS Portal but still have access to the page that contains your portlet. These users are sometimes referred to as Public users. You have two choices for these users, as follows:
■ You can choose to not display data.
■ You can choose to display data using the Publisher’s Connection or one of the other available connections in the list.
Note: If you choose connections other than the Publisher’s Connection to display data or allow users to choose their own connection, only those connections that have access to the worksheet defined in the portlet will be able to see it. For example, you create a worksheet portlet using worksheet MyWorkbook.sheet1 and choose the Publisher’s Connection to be user SCOTT and you allow users to customize their database connection. The user SCOTT has shared the MyWorkbook workbook to user MARY but not to user FRED. When user MARY customizes the portlet to use her connection, she will see the contents of MyWorkbook.sheet1. If user FRED customizes the portlet to use his connection he will get an error stating that he does not have access to the worksheet. For more information about sharing, see "About sharing workbooks".
For a Discoverer List of Worksheets portlet, you have two choices on how to display the data to users that are logged in (i.e. in the Users Logged In area on the Database Connections page), as follows:
■ You can choose to display the same list to all logged in users using a Discoverer connection that you select. If you select this option, all users will see the same list and will not be able to customize this list.
■ You can choose to display a different list to each user by allowing them to customize their own Discoverer connection. In choosing this option, users might or might not see the list of worksheets that you select, depending on the Discoverer connection that they select.
Note: If you want users to be able to customize a Discoverer List of Worksheets portlet to include their own list of worksheets, be sure to select the Allow users to change selected worksheets option in the List of Worksheets page.
In the Users Not Logged In area of the Database Connections page, you specify how data is displayed to users who have not logged into OracleAS Portal, but who still have access to a page that contains your portlet (i.e. public users). You can choose to either display no data, or display data or worksheets using a Discoverer connection that you specify.
About using worksheet parameters in Discoverer portlets
Publishing worksheets in OracleAS Portal 21-9
About choosing refresh options for Discoverer portletsWhen you create a Discoverer portlet, you specify how often to refresh the data in the portlet. Each time a portlet is refreshed, it requires at least one Discoverer session on the middle tier machine. If different users are using different connections for viewing the same portlet, a different Discoverer session is required for each user.
The number of portlet instances that OracleAS Portal will refresh is restricted. The maximum number is determined by the Discoverer manager or Oracle administrator (for more information about the number of sessions in the Discoverer Portlet Provider's pool, see the Oracle Business Intelligence Discoverer Configuration Guide). If the number of refresh jobs exceeds the number of sessions at any given time, the refresh jobs are queued until a session becomes available.
It is recommended that you select the lowest frequency possible that will still provide your users with data that meets their timeliness requirements. Values for last refresh time and next refresh time are displayed in each portlet so that users will know how recent the data is. If you allow users to analyze the data by selecting an Analyze Worksheet link, a new query will be run and they will see the current data in Discoverer Viewer.
You can choose to not refresh the portlet, which is the default setting. In this case, the portlet will require a Discoverer session when it is published, when a new user accesses it for the first time, or when a user changes the set of parameter values (only applies to Worksheet or Gauges portlets based on worksheets with parameters). You will not be able to set the refresh schedule of a Discoverer List of Worksheets portlet that contains a static list of worksheets.
As the publisher of a portlet, you can go to the Edit Defaults page of a portlet at any time and select the Refresh Portlet Now option to manually refresh the portlet.
About using worksheet parameters in Discoverer portletsIf you create Discoverer portlets that contain worksheet parameters, you can map the worksheet parameters to page parameters. This enables a portlet user to specify a parameter value for a page level parameter to update many different Discoverer portlets at the same time. To accomplish this you must map the Discoverer worksheet parameter to a generic Discoverer portlet parameter. Then you create the OracleAS Portal page parameter and map it to the generic Discoverer portlet parameter.
For example, you create three Discoverer portlets, each one containing a worksheet with a parameter called City_WS_param. While editing the defaults of each portlet, you map City_WS_param to a generic Discoverer portal parameter, say DiscoParameter1. Make a note of each generic Discoverer portal parameter and which worksheet parameters they map to so that you can correctly set up the OracleAS Portal page parameters.
When you get all three portlets on a page, click the Edit button and go to Page: Properties. Go to the Parameters tab of the Edit Page screen. If there is no suitable page parameter available, add a new page parameter called City_Page_Param. In the Page Parameter Properties section, you will probably want to make the parameter Customizable and may optionally set Display Name, Default Value and Description. In the Portlet Parameter Values section, for each appropriate portlet, map DiscoParameter1 to use Page Parameter City_Page_Param.
You can map parameters in both Worksheet portlets and Gauges portlets. In other words, you can update both Gauges portlets and Worksheet portlets at the same time with a single parameter value.
About using OracleAS Portal as a personalization framework for Discoverer
21-10 Oracle Business Intelligence Discoverer Plus User’s Guide
Users can set the value for a Page Level parameter either on the URL for the page (by following the Customize link for the page and going to the Parameters tab on the Customize Page screen) or by using a Simple Parameters Form Portlet if one has been added to the page and configured correctly.
For more information about mapping worksheet parameters to portal page level parameters, see "How to map worksheet parameters to Generic Page Parameters".
About using OracleAS Portal as a personalization framework for Discoverer
All authenticated/logged in users will be able to customize particular properties of each Discoverer portlet you create. For example, they will be able to change the portlet title and other portlet options and set formatting customizations for a Discoverer Worksheet portlet. You may also allow them to customize additional properties of the portlet such as the database connection used, parameter values, or the list of worksheets.
You can also allow users to analyze the worksheet that is used as the basis for a Discoverer Worksheet or Gauges portlet in the Single Worksheet Viewer. The Single Worksheet Viewer is a special instance of the Discoverer Viewer that is available only through a Discoverer portlet. When a user opens a worksheet from a Discoverer List of Worksheets portlet they also use the Single Worksheet Viewer. The Single Worksheet Viewer will not allow users to change the worksheet they have opened and will not allow them to change the connection used. It is specifically designed to restrict the user to access to one worksheet from a Discoverer portlet.
Note that when an authenticated user launches the Single Worksheet Viewer (whether from an Analyze link in a Worksheet or Gauges portlet or opening a worksheet from a Discoverer List of Worksheets portlet) the SSO username is passed through to the query being executed to return data to Single Worksheet Viewer. In this way, if data differs by Single Sign-On user, the user will only see the data they are supposed to see.
Once in Single Worksheet Viewer, the user will have access to additional customizations and actions that are not available within the portlet customizations page. For example, in the Single Worksheet Viewer the user will be able to change layout by moving or swapping columns and change page item values to change the data displayed. In addition to extended customizations, Single Worksheet Viewer gives the user access to the following actions that are not available directly in the portlet:
■ Rerun query
■ Revert to original
■ Export
■ Send as email
The following table summarizes customizations and specifies whether they are available through the portlet customization page or through the Single Worksheet Viewer.
Table 21–1 Customizations in Discoverer Portlet Provider and Single Worksheet Viewer
Customization Customize Portlet Analyze Worksheet
Database Connection Yes No
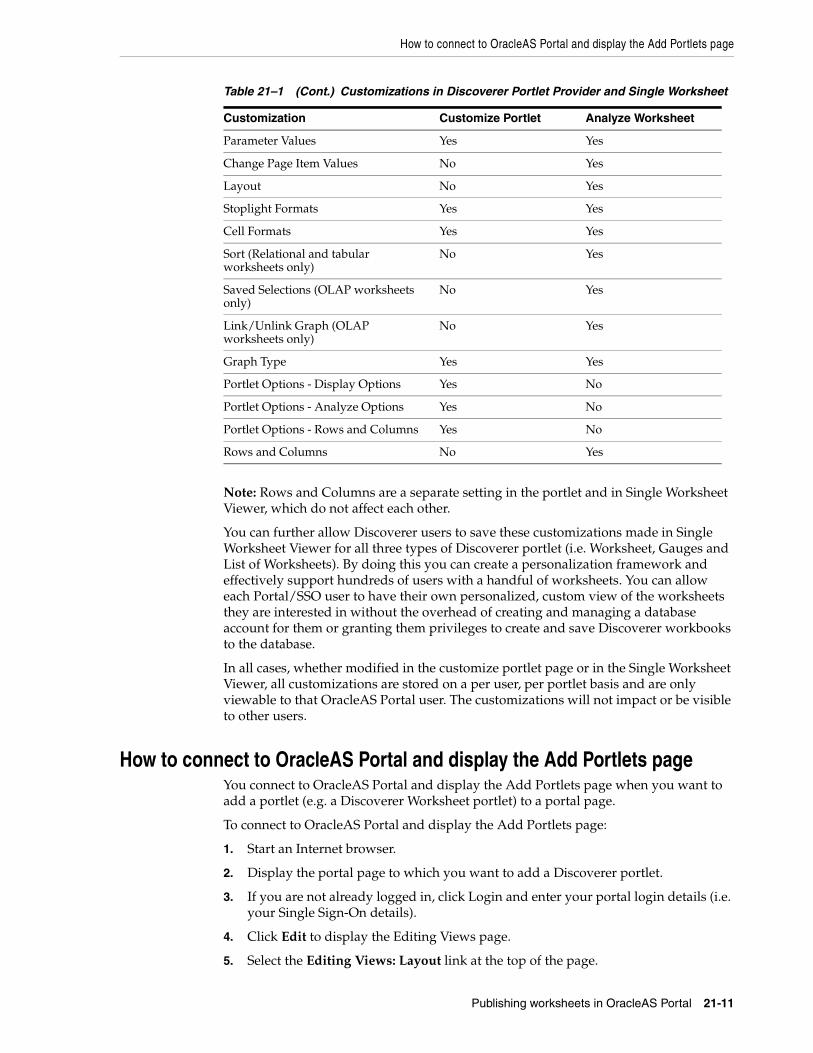
How to connect to OracleAS Portal and display the Add Portlets page
Publishing worksheets in OracleAS Portal 21-11
Note: Rows and Columns are a separate setting in the portlet and in Single Worksheet Viewer, which do not affect each other.
You can further allow Discoverer users to save these customizations made in Single Worksheet Viewer for all three types of Discoverer portlet (i.e. Worksheet, Gauges and List of Worksheets). By doing this you can create a personalization framework and effectively support hundreds of users with a handful of worksheets. You can allow each Portal/SSO user to have their own personalized, custom view of the worksheets they are interested in without the overhead of creating and managing a database account for them or granting them privileges to create and save Discoverer workbooks to the database.
In all cases, whether modified in the customize portlet page or in the Single Worksheet Viewer, all customizations are stored on a per user, per portlet basis and are only viewable to that OracleAS Portal user. The customizations will not impact or be visible to other users.
How to connect to OracleAS Portal and display the Add Portlets pageYou connect to OracleAS Portal and display the Add Portlets page when you want to add a portlet (e.g. a Discoverer Worksheet portlet) to a portal page.
To connect to OracleAS Portal and display the Add Portlets page:
1. Start an Internet browser.
2. Display the portal page to which you want to add a Discoverer portlet.
3. If you are not already logged in, click Login and enter your portal login details (i.e. your Single Sign-On details).
4. Click Edit to display the Editing Views page.
5. Select the Editing Views: Layout link at the top of the page.
Parameter Values Yes Yes
Change Page Item Values No Yes
Layout No Yes
Stoplight Formats Yes Yes
Cell Formats Yes Yes
Sort (Relational and tabular worksheets only)
No Yes
Saved Selections (OLAP worksheets only)
No Yes
Link/Unlink Graph (OLAP worksheets only)
No Yes
Graph Type Yes Yes
Portlet Options - Display Options Yes No
Portlet Options - Analyze Options Yes No
Portlet Options - Rows and Columns Yes No
Rows and Columns No Yes
Table 21–1 (Cont.) Customizations in Discoverer Portlet Provider and Single Worksheet
Customization Customize Portlet Analyze Worksheet
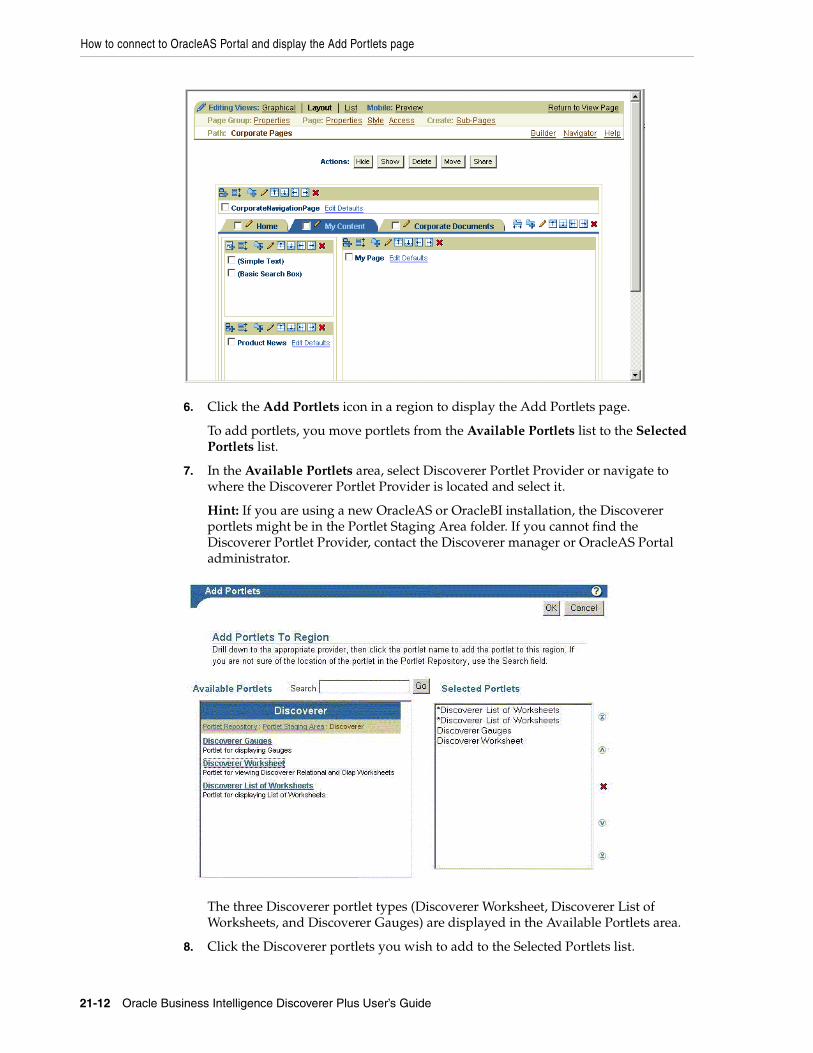
How to connect to OracleAS Portal and display the Add Portlets page
21-12 Oracle Business Intelligence Discoverer Plus User’s Guide
6. Click the Add Portlets icon in a region to display the Add Portlets page.
To add portlets, you move portlets from the Available Portlets list to the Selected Portlets list.
7. In the Available Portlets area, select Discoverer Portlet Provider or navigate to where the Discoverer Portlet Provider is located and select it.
Hint: If you are using a new OracleAS or OracleBI installation, the Discoverer portlets might be in the Portlet Staging Area folder. If you cannot find the Discoverer Portlet Provider, contact the Discoverer manager or OracleAS Portal administrator.
The three Discoverer portlet types (Discoverer Worksheet, Discoverer List of Worksheets, and Discoverer Gauges) are displayed in the Available Portlets area.
8. Click the Discoverer portlets you wish to add to the Selected Portlets list.
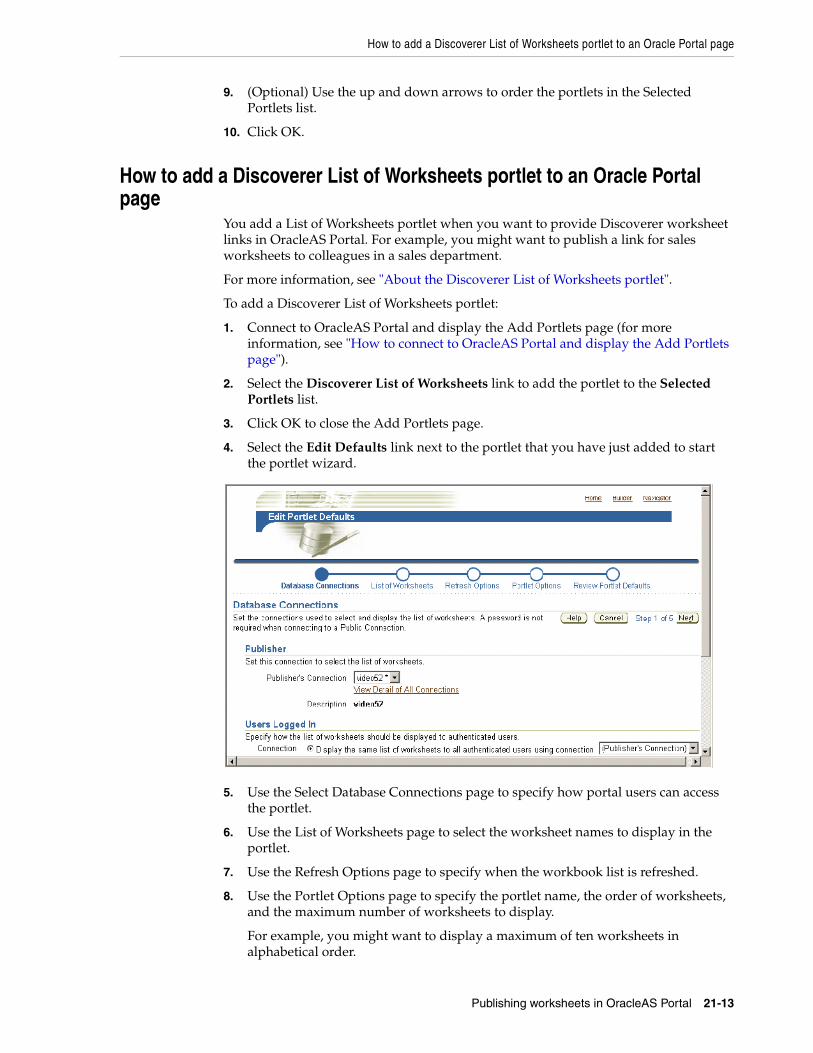
How to add a Discoverer List of Worksheets portlet to an Oracle Portal page
Publishing worksheets in OracleAS Portal 21-13
9. (Optional) Use the up and down arrows to order the portlets in the Selected Portlets list.
10. Click OK.
How to add a Discoverer List of Worksheets portlet to an Oracle Portal page
You add a List of Worksheets portlet when you want to provide Discoverer worksheet links in OracleAS Portal. For example, you might want to publish a link for sales worksheets to colleagues in a sales department.
For more information, see "About the Discoverer List of Worksheets portlet".
To add a Discoverer List of Worksheets portlet:
1. Connect to OracleAS Portal and display the Add Portlets page (for more information, see "How to connect to OracleAS Portal and display the Add Portlets page").
2. Select the Discoverer List of Worksheets link to add the portlet to the Selected Portlets list.
3. Click OK to close the Add Portlets page.
4. Select the Edit Defaults link next to the portlet that you have just added to start the portlet wizard.
5. Use the Select Database Connections page to specify how portal users can access the portlet.
6. Use the List of Worksheets page to select the worksheet names to display in the portlet.
7. Use the Refresh Options page to specify when the workbook list is refreshed.
8. Use the Portlet Options page to specify the portlet name, the order of worksheets, and the maximum number of worksheets to display.
For example, you might want to display a maximum of ten worksheets in alphabetical order.
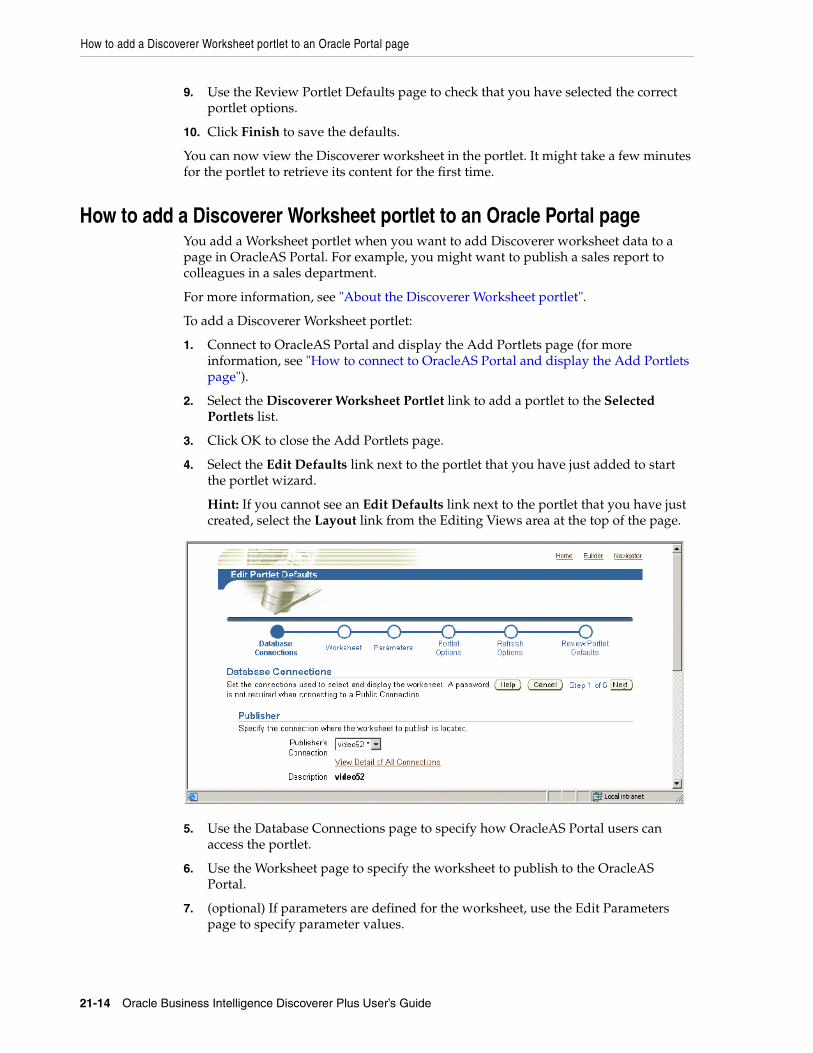
How to add a Discoverer Worksheet portlet to an Oracle Portal page
21-14 Oracle Business Intelligence Discoverer Plus User’s Guide
9. Use the Review Portlet Defaults page to check that you have selected the correct portlet options.
10. Click Finish to save the defaults.
You can now view the Discoverer worksheet in the portlet. It might take a few minutes for the portlet to retrieve its content for the first time.
How to add a Discoverer Worksheet portlet to an Oracle Portal pageYou add a Worksheet portlet when you want to add Discoverer worksheet data to a page in OracleAS Portal. For example, you might want to publish a sales report to colleagues in a sales department.
For more information, see "About the Discoverer Worksheet portlet".
To add a Discoverer Worksheet portlet:
1. Connect to OracleAS Portal and display the Add Portlets page (for more information, see "How to connect to OracleAS Portal and display the Add Portlets page").
2. Select the Discoverer Worksheet Portlet link to add a portlet to the Selected Portlets list.
3. Click OK to close the Add Portlets page.
4. Select the Edit Defaults link next to the portlet that you have just added to start the portlet wizard.
Hint: If you cannot see an Edit Defaults link next to the portlet that you have just created, select the Layout link from the Editing Views area at the top of the page.
5. Use the Database Connections page to specify how OracleAS Portal users can access the portlet.
6. Use the Worksheet page to specify the worksheet to publish to the OracleAS Portal.
7. (optional) If parameters are defined for the worksheet, use the Edit Parameters page to specify parameter values.
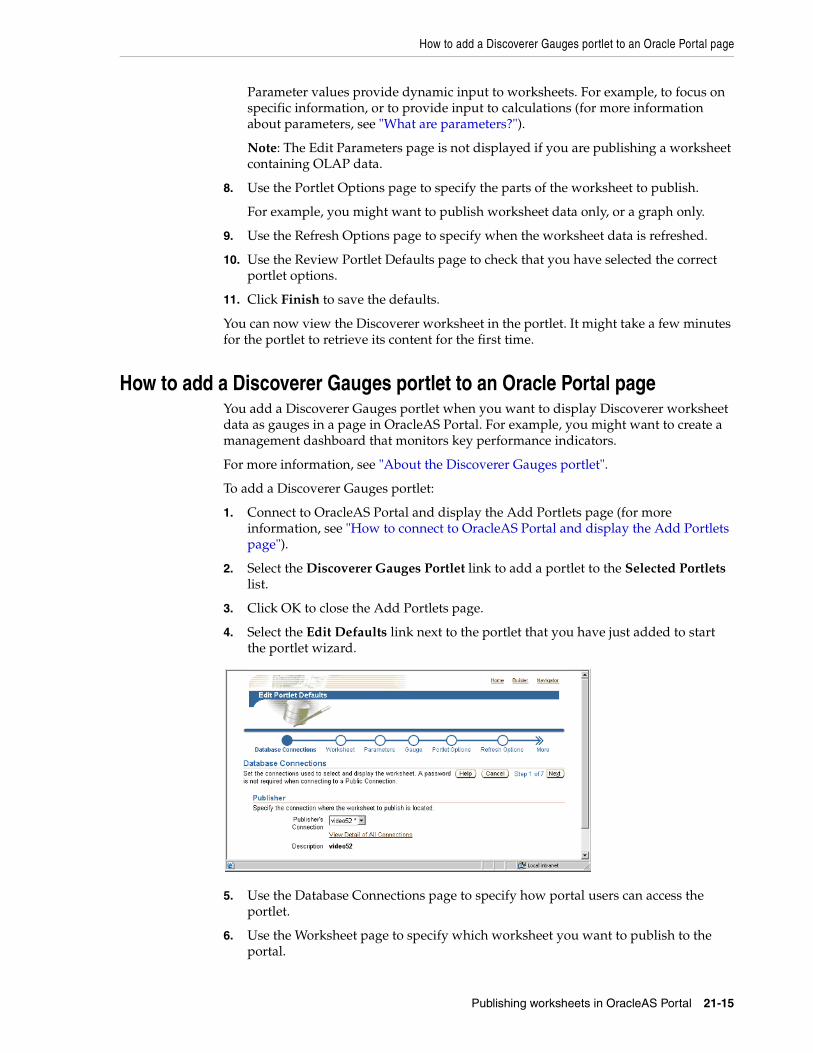
How to add a Discoverer Gauges portlet to an Oracle Portal page
Publishing worksheets in OracleAS Portal 21-15
Parameter values provide dynamic input to worksheets. For example, to focus on specific information, or to provide input to calculations (for more information about parameters, see "What are parameters?").
Note: The Edit Parameters page is not displayed if you are publishing a worksheet containing OLAP data.
8. Use the Portlet Options page to specify the parts of the worksheet to publish.
For example, you might want to publish worksheet data only, or a graph only.
9. Use the Refresh Options page to specify when the worksheet data is refreshed.
10. Use the Review Portlet Defaults page to check that you have selected the correct portlet options.
11. Click Finish to save the defaults.
You can now view the Discoverer worksheet in the portlet. It might take a few minutes for the portlet to retrieve its content for the first time.
How to add a Discoverer Gauges portlet to an Oracle Portal pageYou add a Discoverer Gauges portlet when you want to display Discoverer worksheet data as gauges in a page in OracleAS Portal. For example, you might want to create a management dashboard that monitors key performance indicators.
For more information, see "About the Discoverer Gauges portlet".
To add a Discoverer Gauges portlet:
1. Connect to OracleAS Portal and display the Add Portlets page (for more information, see "How to connect to OracleAS Portal and display the Add Portlets page").
2. Select the Discoverer Gauges Portlet link to add a portlet to the Selected Portlets list.
3. Click OK to close the Add Portlets page.
4. Select the Edit Defaults link next to the portlet that you have just added to start the portlet wizard.
5. Use the Database Connections page to specify how portal users can access the portlet.
6. Use the Worksheet page to specify which worksheet you want to publish to the portal.
How to edit a Discoverer portlet
21-16 Oracle Business Intelligence Discoverer Plus User’s Guide
7. (optional) If parameters are defined for the worksheet, use the Edit Parameters page to specify parameter values.
Parameter values provide dynamic input to worksheets. For example, to focus on specific information, or provide input to calculations (for more information about parameters, see "What are parameters?").
Note: The Edit Parameters page is not displayed if you are publishing a worksheet containing OLAP data.
8. Use the Gauge page to specify the rows and columns to publish, and specify threshold values for the gauges.
9. Use the Portlet Options page to specify the parts of the worksheet to publish.
For example, you might want to publish the worksheet data only, the worksheet’s graph only, or worksheet data and a worksheet’s graph.
10. Use the Refresh Options page to specify when the worksheet data is refreshed.
11. Use the Review Portlet Defaults page to check that you have selected the correct portlet options.
12. Click Finish to save the defaults.
You can now view the Discoverer Gauges portlet. It might take a few moments for the portlet to retrieve its content for the first time.
How to edit a Discoverer portletYou edit a Discoverer portlet when you want to change how a portlet is displayed to portal users. For example, you might want to display a different worksheet in a Discoverer Gauges portlet.
You edit a Discoverer portlet when you want to change how a portlet is displayed to OracleAS Portal users. For example, you might want to display a different worksheet in a Discoverer Gauges portlet.
To edit a Discoverer portlet:
1. Start an Internet browser.
2. Display the OracleAS Portal page containing the Discoverer portlet that you want to edit.
3. If you are not already logged in, click Login and enter your OracleAS Portal login details (i.e. your Single Sign-On details).
4. Click Edit to display the page in edit mode.
5. Select the Layout link from the Editing Views area at the top of the page.
6. Select the Edit Defaults link next to the portlet that you want to edit to display the Edit Defaults page.
For example, for a Discoverer Worksheet portlet, the Edit Worksheet Portlet Defaults page is displayed.
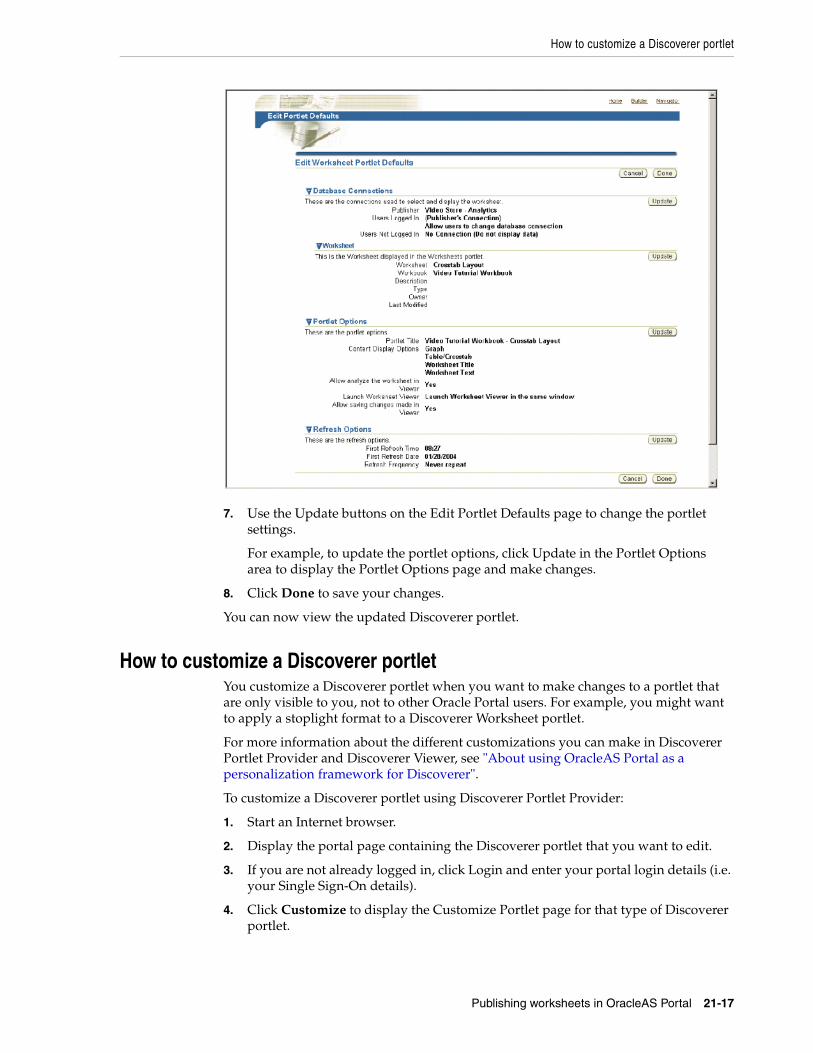
How to customize a Discoverer portlet
Publishing worksheets in OracleAS Portal 21-17
7. Use the Update buttons on the Edit Portlet Defaults page to change the portlet settings.
For example, to update the portlet options, click Update in the Portlet Options area to display the Portlet Options page and make changes.
8. Click Done to save your changes.
You can now view the updated Discoverer portlet.
How to customize a Discoverer portletYou customize a Discoverer portlet when you want to make changes to a portlet that are only visible to you, not to other Oracle Portal users. For example, you might want to apply a stoplight format to a Discoverer Worksheet portlet.
For more information about the different customizations you can make in Discoverer Portlet Provider and Discoverer Viewer, see "About using OracleAS Portal as a personalization framework for Discoverer".
To customize a Discoverer portlet using Discoverer Portlet Provider:
1. Start an Internet browser.
2. Display the portal page containing the Discoverer portlet that you want to edit.
3. If you are not already logged in, click Login and enter your portal login details (i.e. your Single Sign-On details).
4. Click Customize to display the Customize Portlet page for that type of Discoverer portlet.
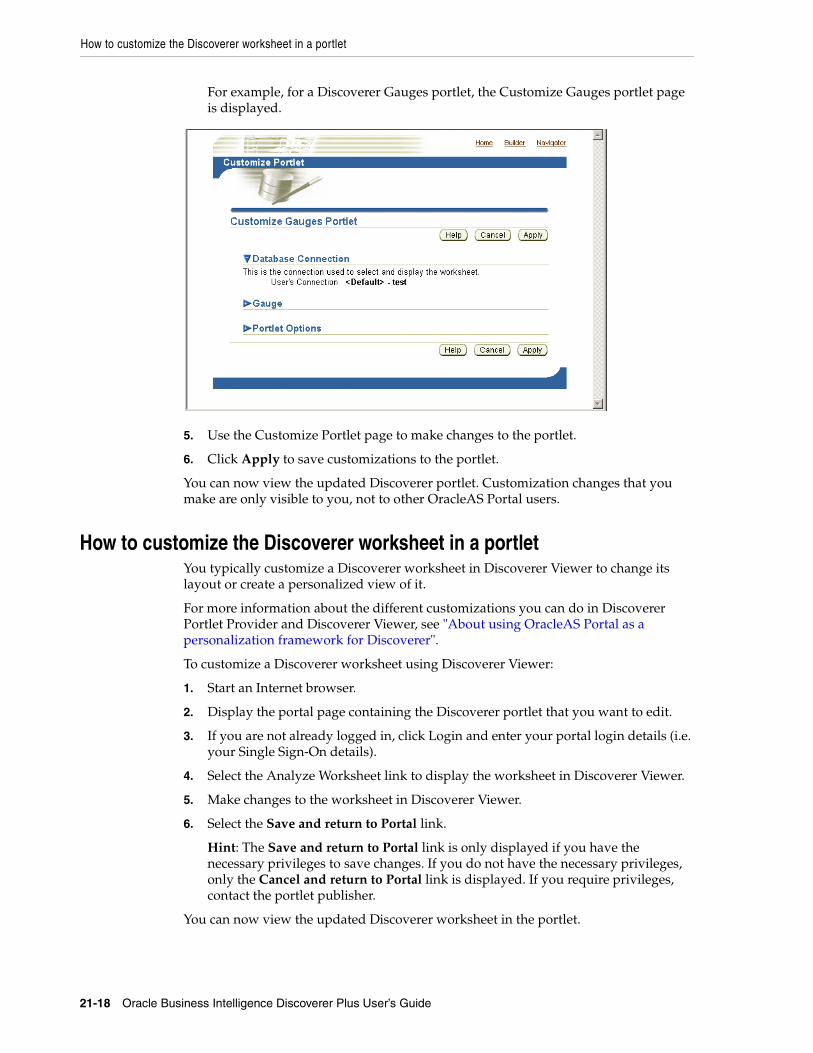
How to customize the Discoverer worksheet in a portlet
21-18 Oracle Business Intelligence Discoverer Plus User’s Guide
For example, for a Discoverer Gauges portlet, the Customize Gauges portlet page is displayed.
5. Use the Customize Portlet page to make changes to the portlet.
6. Click Apply to save customizations to the portlet.
You can now view the updated Discoverer portlet. Customization changes that you make are only visible to you, not to other OracleAS Portal users.
How to customize the Discoverer worksheet in a portletYou typically customize a Discoverer worksheet in Discoverer Viewer to change its layout or create a personalized view of it.
For more information about the different customizations you can do in Discoverer Portlet Provider and Discoverer Viewer, see "About using OracleAS Portal as a personalization framework for Discoverer".
To customize a Discoverer worksheet using Discoverer Viewer:
1. Start an Internet browser.
2. Display the portal page containing the Discoverer portlet that you want to edit.
3. If you are not already logged in, click Login and enter your portal login details (i.e. your Single Sign-On details).
4. Select the Analyze Worksheet link to display the worksheet in Discoverer Viewer.
5. Make changes to the worksheet in Discoverer Viewer.
6. Select the Save and return to Portal link.
Hint: The Save and return to Portal link is only displayed if you have the necessary privileges to save changes. If you do not have the necessary privileges, only the Cancel and return to Portal link is displayed. If you require privileges, contact the portlet publisher.
You can now view the updated Discoverer worksheet in the portlet.
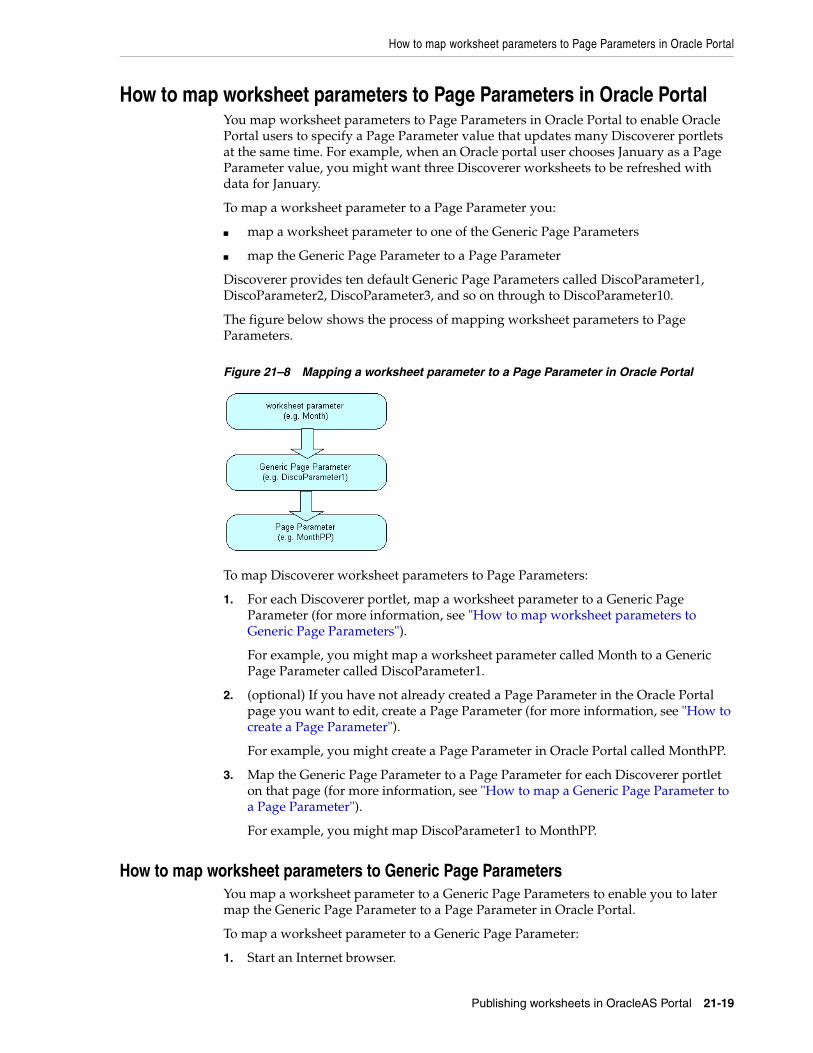
How to map worksheet parameters to Page Parameters in Oracle Portal
Publishing worksheets in OracleAS Portal 21-19
How to map worksheet parameters to Page Parameters in Oracle PortalYou map worksheet parameters to Page Parameters in Oracle Portal to enable Oracle Portal users to specify a Page Parameter value that updates many Discoverer portlets at the same time. For example, when an Oracle portal user chooses January as a Page Parameter value, you might want three Discoverer worksheets to be refreshed with data for January.
To map a worksheet parameter to a Page Parameter you:
■ map a worksheet parameter to one of the Generic Page Parameters
■ map the Generic Page Parameter to a Page Parameter
Discoverer provides ten default Generic Page Parameters called DiscoParameter1, DiscoParameter2, DiscoParameter3, and so on through to DiscoParameter10.
The figure below shows the process of mapping worksheet parameters to Page Parameters.
Figure 21–8 Mapping a worksheet parameter to a Page Parameter in Oracle Portal
To map Discoverer worksheet parameters to Page Parameters:
1. For each Discoverer portlet, map a worksheet parameter to a Generic Page Parameter (for more information, see "How to map worksheet parameters to Generic Page Parameters").
For example, you might map a worksheet parameter called Month to a Generic Page Parameter called DiscoParameter1.
2. (optional) If you have not already created a Page Parameter in the Oracle Portal page you want to edit, create a Page Parameter (for more information, see "How to create a Page Parameter").
For example, you might create a Page Parameter in Oracle Portal called MonthPP.
3. Map the Generic Page Parameter to a Page Parameter for each Discoverer portlet on that page (for more information, see "How to map a Generic Page Parameter to a Page Parameter").
For example, you might map DiscoParameter1 to MonthPP.
How to map worksheet parameters to Generic Page ParametersYou map a worksheet parameter to a Generic Page Parameters to enable you to later map the Generic Page Parameter to a Page Parameter in Oracle Portal.
To map a worksheet parameter to a Generic Page Parameter:
1. Start an Internet browser.
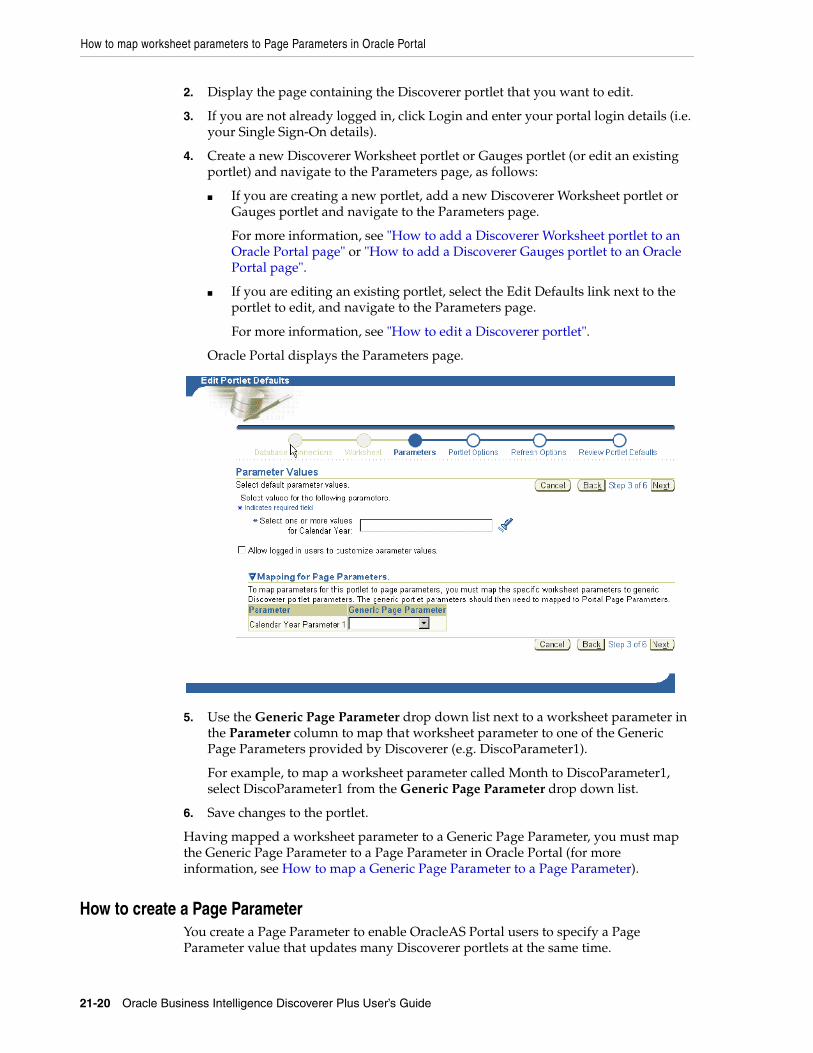
How to map worksheet parameters to Page Parameters in Oracle Portal
21-20 Oracle Business Intelligence Discoverer Plus User’s Guide
2. Display the page containing the Discoverer portlet that you want to edit.
3. If you are not already logged in, click Login and enter your portal login details (i.e. your Single Sign-On details).
4. Create a new Discoverer Worksheet portlet or Gauges portlet (or edit an existing portlet) and navigate to the Parameters page, as follows:
■ If you are creating a new portlet, add a new Discoverer Worksheet portlet or Gauges portlet and navigate to the Parameters page.
For more information, see "How to add a Discoverer Worksheet portlet to an Oracle Portal page" or "How to add a Discoverer Gauges portlet to an Oracle Portal page".
■ If you are editing an existing portlet, select the Edit Defaults link next to the portlet to edit, and navigate to the Parameters page.
For more information, see "How to edit a Discoverer portlet".
Oracle Portal displays the Parameters page.
5. Use the Generic Page Parameter drop down list next to a worksheet parameter in the Parameter column to map that worksheet parameter to one of the Generic Page Parameters provided by Discoverer (e.g. DiscoParameter1).
For example, to map a worksheet parameter called Month to DiscoParameter1, select DiscoParameter1 from the Generic Page Parameter drop down list.
6. Save changes to the portlet.
Having mapped a worksheet parameter to a Generic Page Parameter, you must map the Generic Page Parameter to a Page Parameter in Oracle Portal (for more information, see How to map a Generic Page Parameter to a Page Parameter).
How to create a Page ParameterYou create a Page Parameter to enable OracleAS Portal users to specify a Page Parameter value that updates many Discoverer portlets at the same time.
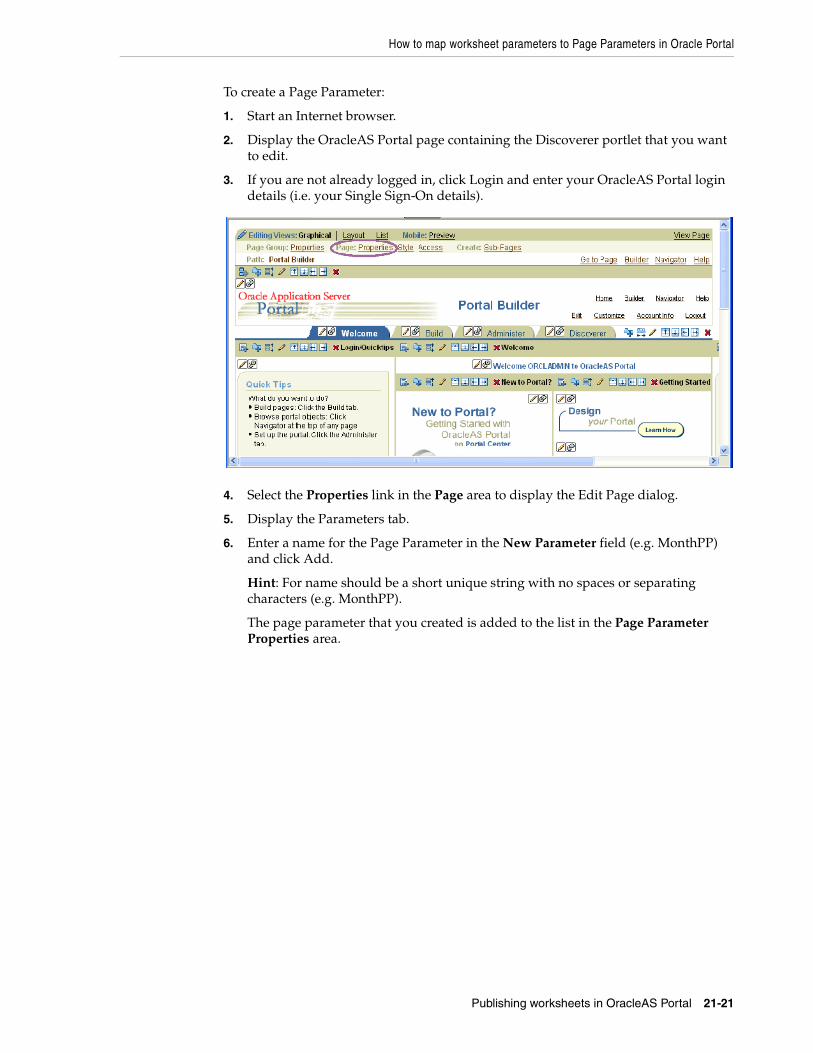
How to map worksheet parameters to Page Parameters in Oracle Portal
Publishing worksheets in OracleAS Portal 21-21
To create a Page Parameter:
1. Start an Internet browser.
2. Display the OracleAS Portal page containing the Discoverer portlet that you want to edit.
3. If you are not already logged in, click Login and enter your OracleAS Portal login details (i.e. your Single Sign-On details).
4. Select the Properties link in the Page area to display the Edit Page dialog.
5. Display the Parameters tab.
6. Enter a name for the Page Parameter in the New Parameter field (e.g. MonthPP) and click Add.
Hint: For name should be a short unique string with no spaces or separating characters (e.g. MonthPP).
The page parameter that you created is added to the list in the Page Parameter Properties area.
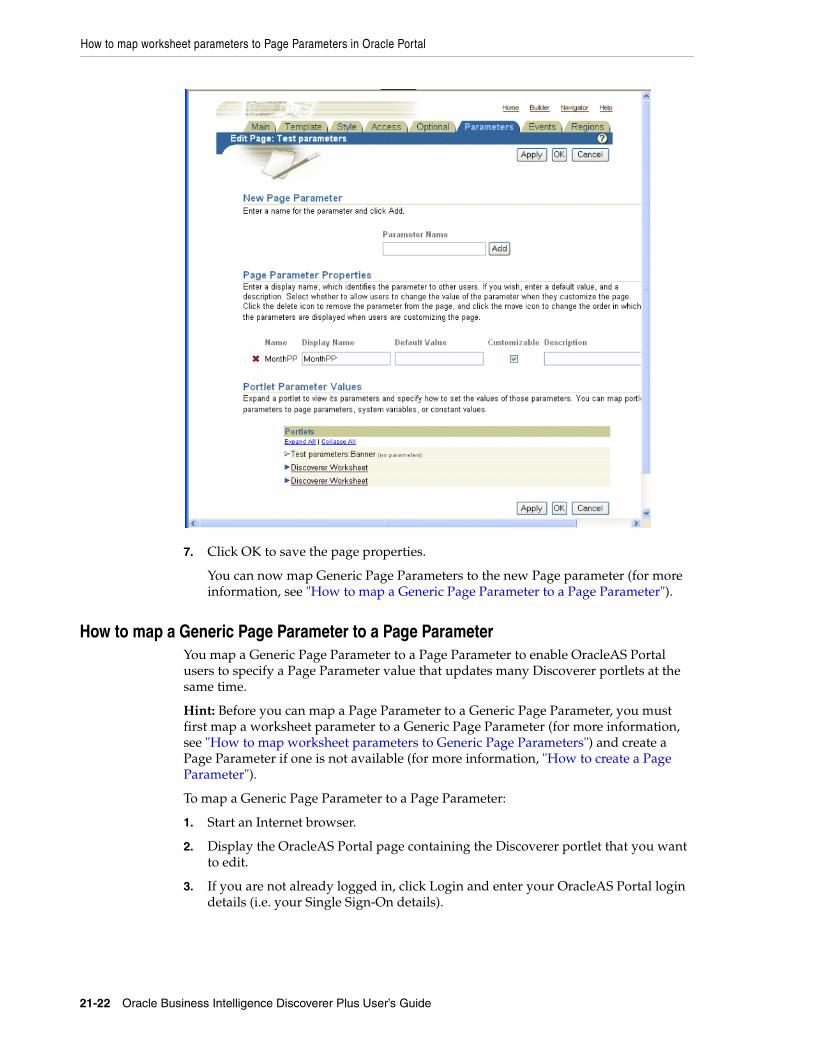
How to map worksheet parameters to Page Parameters in Oracle Portal
21-22 Oracle Business Intelligence Discoverer Plus User’s Guide
7. Click OK to save the page properties.
You can now map Generic Page Parameters to the new Page parameter (for more information, see "How to map a Generic Page Parameter to a Page Parameter").
How to map a Generic Page Parameter to a Page ParameterYou map a Generic Page Parameter to a Page Parameter to enable OracleAS Portal users to specify a Page Parameter value that updates many Discoverer portlets at the same time.
Hint: Before you can map a Page Parameter to a Generic Page Parameter, you must first map a worksheet parameter to a Generic Page Parameter (for more information, see "How to map worksheet parameters to Generic Page Parameters") and create a Page Parameter if one is not available (for more information, "How to create a Page Parameter").
To map a Generic Page Parameter to a Page Parameter:
1. Start an Internet browser.
2. Display the OracleAS Portal page containing the Discoverer portlet that you want to edit.
3. If you are not already logged in, click Login and enter your OracleAS Portal login details (i.e. your Single Sign-On details).
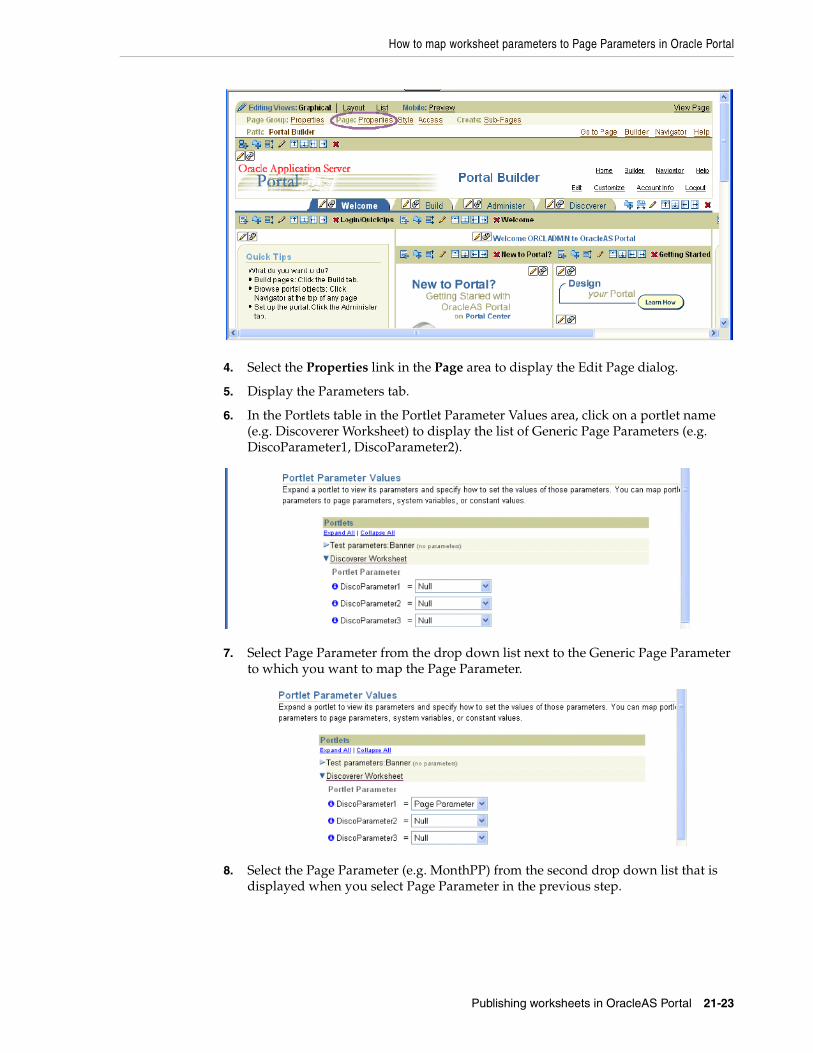
How to map worksheet parameters to Page Parameters in Oracle Portal
Publishing worksheets in OracleAS Portal 21-23
4. Select the Properties link in the Page area to display the Edit Page dialog.
5. Display the Parameters tab.
6. In the Portlets table in the Portlet Parameter Values area, click on a portlet name (e.g. Discoverer Worksheet) to display the list of Generic Page Parameters (e.g. DiscoParameter1, DiscoParameter2).
7. Select Page Parameter from the drop down list next to the Generic Page Parameter to which you want to map the Page Parameter.
8. Select the Page Parameter (e.g. MonthPP) from the second drop down list that is displayed when you select Page Parameter in the previous step.
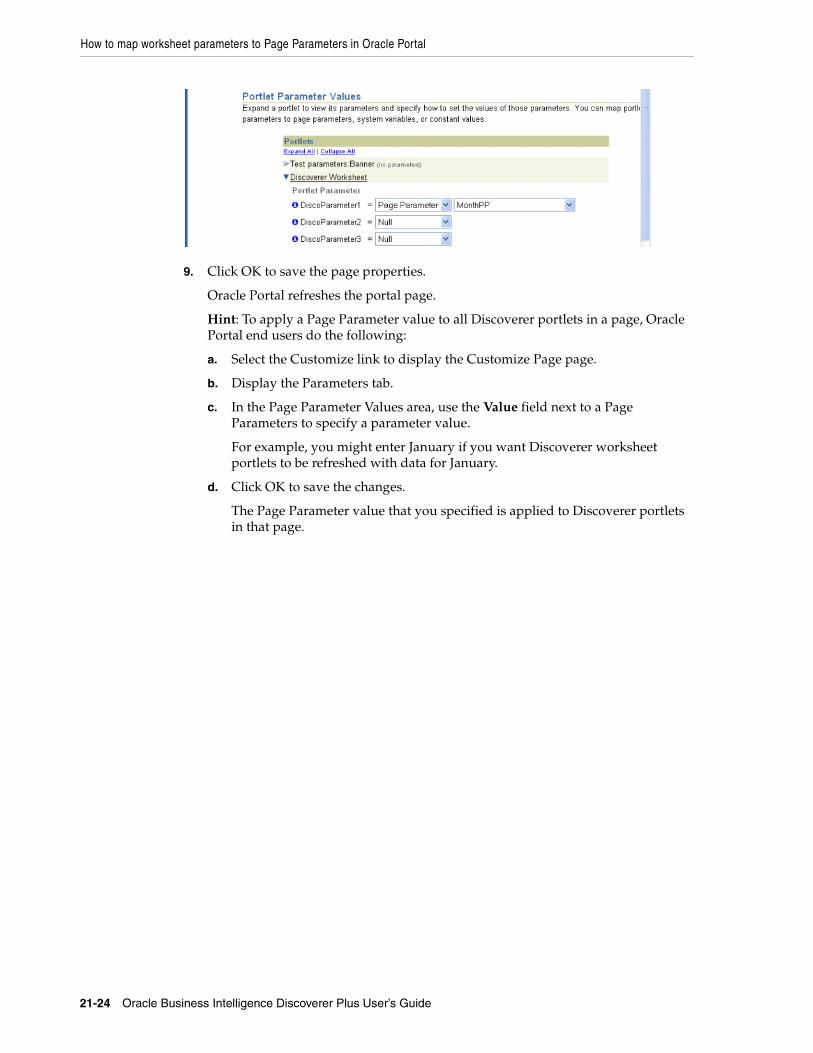
How to map worksheet parameters to Page Parameters in Oracle Portal
21-24 Oracle Business Intelligence Discoverer Plus User’s Guide
9. Click OK to save the page properties.
Oracle Portal refreshes the portal page.
Hint: To apply a Page Parameter value to all Discoverer portlets in a page, Oracle Portal end users do the following:
a. Select the Customize link to display the Customize Page page.
b. Display the Parameters tab.
c. In the Page Parameter Values area, use the Value field next to a Page Parameters to specify a parameter value.
For example, you might enter January if you want Discoverer worksheet portlets to be refreshed with data for January.
d. Click OK to save the changes.
The Page Parameter value that you specified is applied to Discoverer portlets in that page.
Part IVAdvanced Discoverer Plus Relational
features
This part covers Discoverer Plus Relational’s advanced features, such as scheduling, lists of values, SQL, and changing default settings.

Advanced Discoverer Plus Relational Features 22-1
22Advanced Discoverer Plus Relational
Features
This chapter explains how to use some of Discoverer Plus Relational’s advanced features, and includes the following topics:
■ "Using scheduled workbooks"
■ "Using lists of values (LOVs)"
■ "Changing default settings"
■ "Using SQL"
Using scheduled workbooksThis section describes how to improve productivity using Discoverer’s scheduling facilities, and includes the following topics:
■ "What are scheduled workbooks?"
■ "When to use scheduled workbooks"
■ "An example of using a scheduled workbook"
■ "About accessing scheduled workbook results sets"
■ "About how scheduled workbooks are processed"
■ "How to schedule workbooks"
■ "How to edit scheduled workbooks"
■ "How to copy a scheduled workbook"
■ "How to unschedule a scheduled workbook"
■ "How to delete scheduled workbooks and scheduled workbook results sets"
What are scheduled workbooks?A scheduled workbook is a read-only copy of a workbook that Discoverer processes at a particular time and frequency. For example, you might want to process worksheets in a workbook called Monthly Sales Report at midnight on the first day of each month.
You typically use scheduled workbooks to produce regular reports or to produce complex reports that must be processed at off-peak times.
Each time a scheduled workbook is processed (or run), Discoverer produces a scheduled workbook results set. A scheduled workbook results set is a version (or
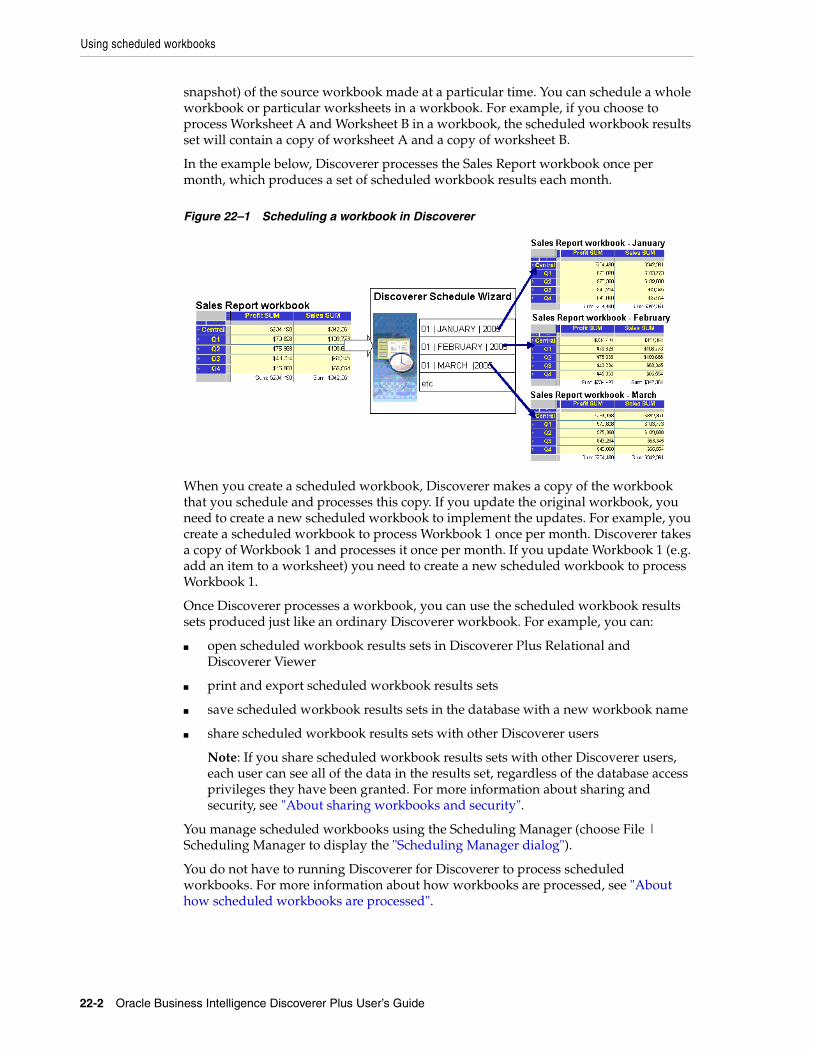
Using scheduled workbooks
22-2 Oracle Business Intelligence Discoverer Plus User’s Guide
snapshot) of the source workbook made at a particular time. You can schedule a whole workbook or particular worksheets in a workbook. For example, if you choose to process Worksheet A and Worksheet B in a workbook, the scheduled workbook results set will contain a copy of worksheet A and a copy of worksheet B.
In the example below, Discoverer processes the Sales Report workbook once per month, which produces a set of scheduled workbook results each month.
Figure 22–1 Scheduling a workbook in Discoverer
When you create a scheduled workbook, Discoverer makes a copy of the workbook that you schedule and processes this copy. If you update the original workbook, you need to create a new scheduled workbook to implement the updates. For example, you create a scheduled workbook to process Workbook 1 once per month. Discoverer takes a copy of Workbook 1 and processes it once per month. If you update Workbook 1 (e.g. add an item to a worksheet) you need to create a new scheduled workbook to process Workbook 1.
Once Discoverer processes a workbook, you can use the scheduled workbook results sets produced just like an ordinary Discoverer workbook. For example, you can:
■ open scheduled workbook results sets in Discoverer Plus Relational and Discoverer Viewer
■ print and export scheduled workbook results sets
■ save scheduled workbook results sets in the database with a new workbook name
■ share scheduled workbook results sets with other Discoverer users
Note: If you share scheduled workbook results sets with other Discoverer users, each user can see all of the data in the results set, regardless of the database access privileges they have been granted. For more information about sharing and security, see "About sharing workbooks and security".
You manage scheduled workbooks using the Scheduling Manager (choose File | Scheduling Manager to display the "Scheduling Manager dialog").
You do not have to running Discoverer for Discoverer to process scheduled workbooks. For more information about how workbooks are processed, see "About how scheduled workbooks are processed".
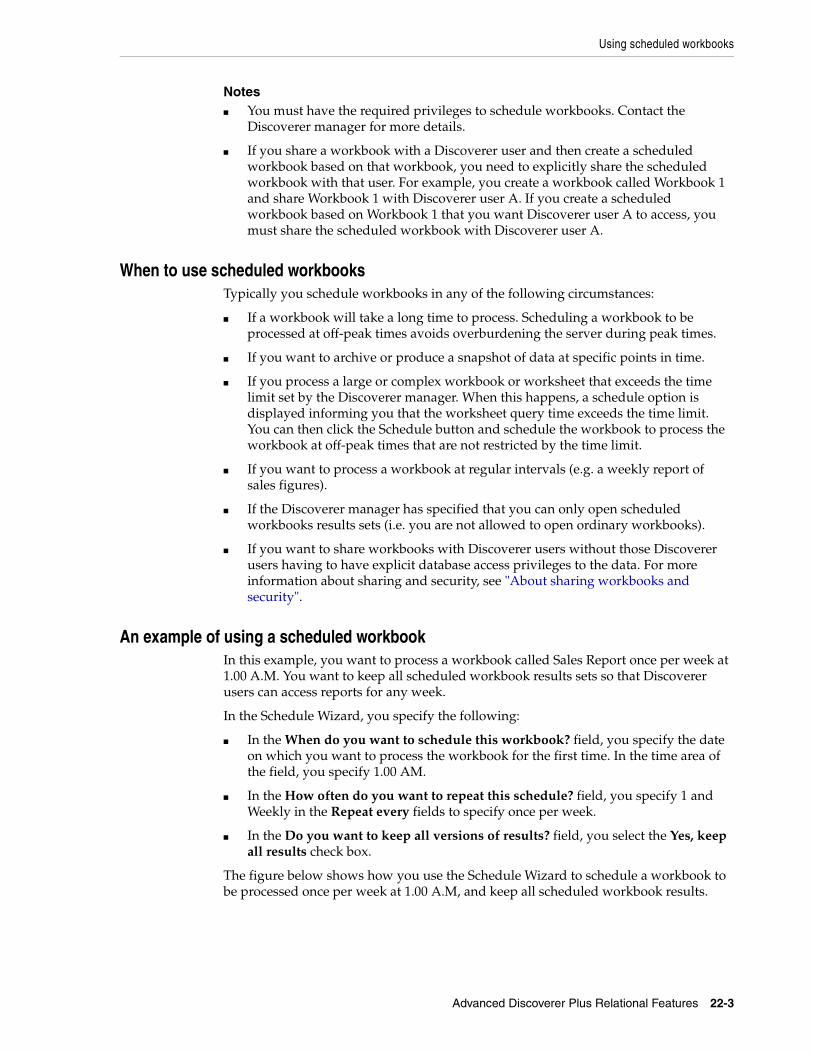
Using scheduled workbooks
Advanced Discoverer Plus Relational Features 22-3
Notes■ You must have the required privileges to schedule workbooks. Contact the
Discoverer manager for more details.
■ If you share a workbook with a Discoverer user and then create a scheduled workbook based on that workbook, you need to explicitly share the scheduled workbook with that user. For example, you create a workbook called Workbook 1 and share Workbook 1 with Discoverer user A. If you create a scheduled workbook based on Workbook 1 that you want Discoverer user A to access, you must share the scheduled workbook with Discoverer user A.
When to use scheduled workbooksTypically you schedule workbooks in any of the following circumstances:
■ If a workbook will take a long time to process. Scheduling a workbook to be processed at off-peak times avoids overburdening the server during peak times.
■ If you want to archive or produce a snapshot of data at specific points in time.
■ If you process a large or complex workbook or worksheet that exceeds the time limit set by the Discoverer manager. When this happens, a schedule option is displayed informing you that the worksheet query time exceeds the time limit. You can then click the Schedule button and schedule the workbook to process the workbook at off-peak times that are not restricted by the time limit.
■ If you want to process a workbook at regular intervals (e.g. a weekly report of sales figures).
■ If the Discoverer manager has specified that you can only open scheduled workbooks results sets (i.e. you are not allowed to open ordinary workbooks).
■ If you want to share workbooks with Discoverer users without those Discoverer users having to have explicit database access privileges to the data. For more information about sharing and security, see "About sharing workbooks and security".
An example of using a scheduled workbookIn this example, you want to process a workbook called Sales Report once per week at 1.00 A.M. You want to keep all scheduled workbook results sets so that Discoverer users can access reports for any week.
In the Schedule Wizard, you specify the following:
■ In the When do you want to schedule this workbook? field, you specify the date on which you want to process the workbook for the first time. In the time area of the field, you specify 1.00 AM.
■ In the How often do you want to repeat this schedule? field, you specify 1 and Weekly in the Repeat every fields to specify once per week.
■ In the Do you want to keep all versions of results? field, you select the Yes, keep all results check box.
The figure below shows how you use the Schedule Wizard to schedule a workbook to be processed once per week at 1.00 A.M, and keep all scheduled workbook results.
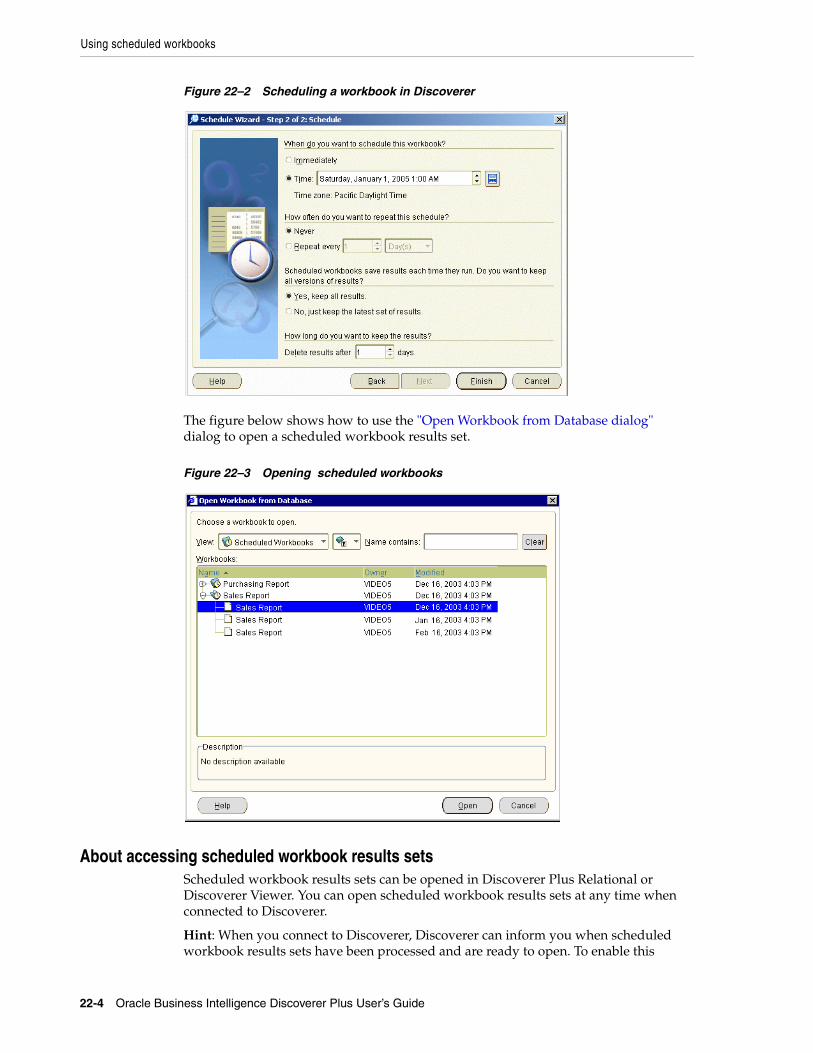
Using scheduled workbooks
22-4 Oracle Business Intelligence Discoverer Plus User’s Guide
Figure 22–2 Scheduling a workbook in Discoverer
The figure below shows how to use the "Open Workbook from Database dialog" dialog to open a scheduled workbook results set.
Figure 22–3 Opening scheduled workbooks
About accessing scheduled workbook results setsScheduled workbook results sets can be opened in Discoverer Plus Relational or Discoverer Viewer. You can open scheduled workbook results sets at any time when connected to Discoverer.
Hint: When you connect to Discoverer, Discoverer can inform you when scheduled workbook results sets have been processed and are ready to open. To enable this
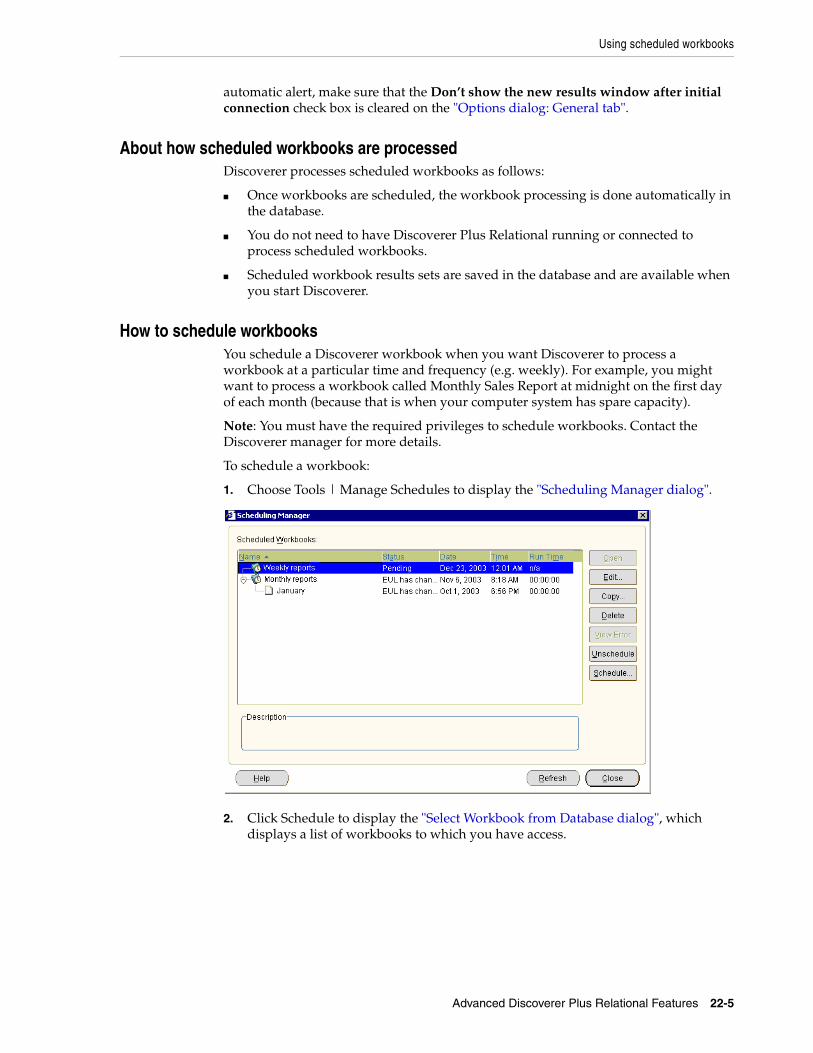
Using scheduled workbooks
Advanced Discoverer Plus Relational Features 22-5
automatic alert, make sure that the Don’t show the new results window after initial connection check box is cleared on the "Options dialog: General tab".
About how scheduled workbooks are processedDiscoverer processes scheduled workbooks as follows:
■ Once workbooks are scheduled, the workbook processing is done automatically in the database.
■ You do not need to have Discoverer Plus Relational running or connected to process scheduled workbooks.
■ Scheduled workbook results sets are saved in the database and are available when you start Discoverer.
How to schedule workbooksYou schedule a Discoverer workbook when you want Discoverer to process a workbook at a particular time and frequency (e.g. weekly). For example, you might want to process a workbook called Monthly Sales Report at midnight on the first day of each month (because that is when your computer system has spare capacity).
Note: You must have the required privileges to schedule workbooks. Contact the Discoverer manager for more details.
To schedule a workbook:
1. Choose Tools | Manage Schedules to display the "Scheduling Manager dialog".
2. Click Schedule to display the "Select Workbook from Database dialog", which displays a list of workbooks to which you have access.
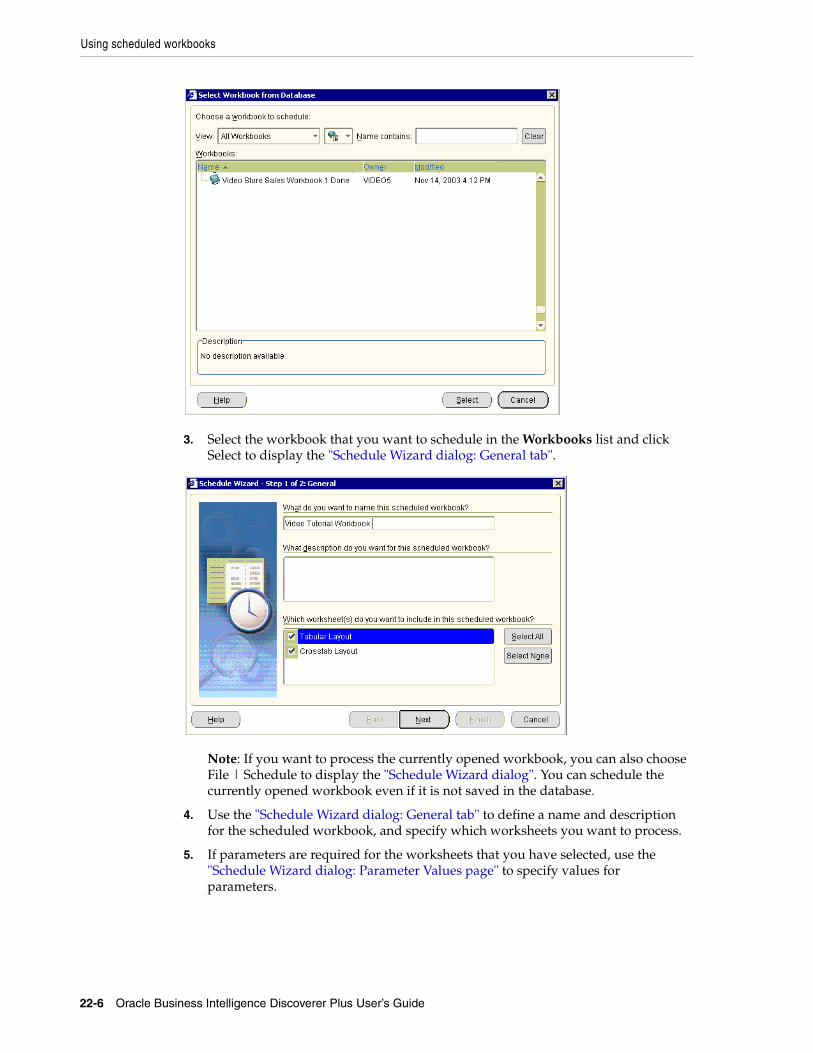
Using scheduled workbooks
22-6 Oracle Business Intelligence Discoverer Plus User’s Guide
3. Select the workbook that you want to schedule in the Workbooks list and click Select to display the "Schedule Wizard dialog: General tab".
Note: If you want to process the currently opened workbook, you can also choose File | Schedule to display the "Schedule Wizard dialog". You can schedule the currently opened workbook even if it is not saved in the database.
4. Use the "Schedule Wizard dialog: General tab" to define a name and description for the scheduled workbook, and specify which worksheets you want to process.
5. If parameters are required for the worksheets that you have selected, use the "Schedule Wizard dialog: Parameter Values page" to specify values for parameters.
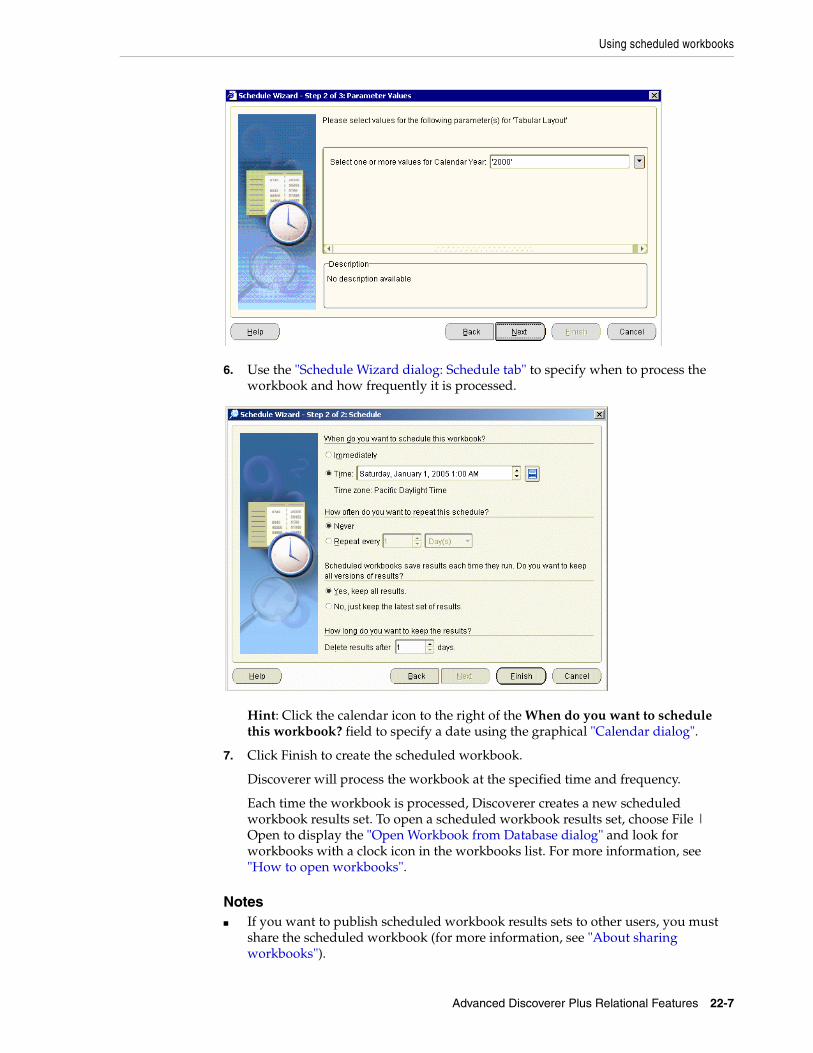
Using scheduled workbooks
Advanced Discoverer Plus Relational Features 22-7
6. Use the "Schedule Wizard dialog: Schedule tab" to specify when to process the workbook and how frequently it is processed.
Hint: Click the calendar icon to the right of the When do you want to schedule this workbook? field to specify a date using the graphical "Calendar dialog".
7. Click Finish to create the scheduled workbook.
Discoverer will process the workbook at the specified time and frequency.
Each time the workbook is processed, Discoverer creates a new scheduled workbook results set. To open a scheduled workbook results set, choose File | Open to display the "Open Workbook from Database dialog" and look for workbooks with a clock icon in the workbooks list. For more information, see "How to open workbooks".
Notes■ If you want to publish scheduled workbook results sets to other users, you must
share the scheduled workbook (for more information, see "About sharing workbooks").
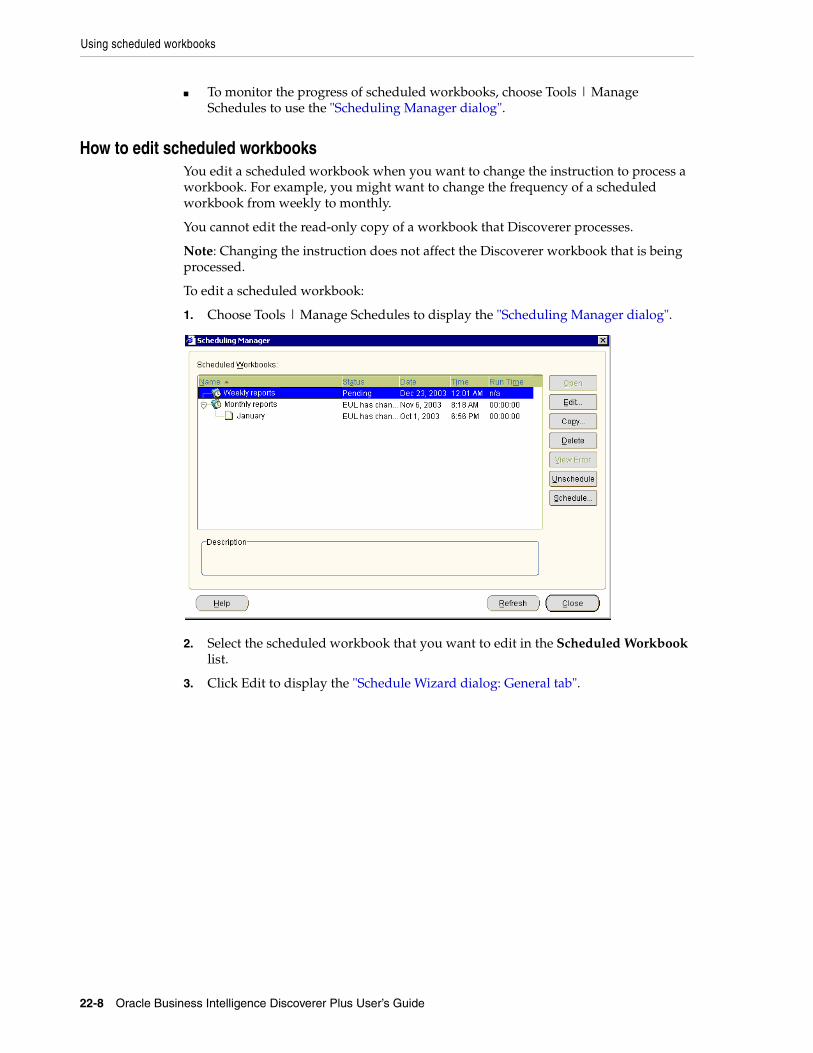
Using scheduled workbooks
22-8 Oracle Business Intelligence Discoverer Plus User’s Guide
■ To monitor the progress of scheduled workbooks, choose Tools | Manage Schedules to use the "Scheduling Manager dialog".
How to edit scheduled workbooksYou edit a scheduled workbook when you want to change the instruction to process a workbook. For example, you might want to change the frequency of a scheduled workbook from weekly to monthly.
You cannot edit the read-only copy of a workbook that Discoverer processes.
Note: Changing the instruction does not affect the Discoverer workbook that is being processed.
To edit a scheduled workbook:
1. Choose Tools | Manage Schedules to display the "Scheduling Manager dialog".
2. Select the scheduled workbook that you want to edit in the Scheduled Workbook list.
3. Click Edit to display the "Schedule Wizard dialog: General tab".

Using scheduled workbooks
Advanced Discoverer Plus Relational Features 22-9
4. (optional) Use the "Schedule Wizard dialog: General tab" to change the description of the scheduled workbook.
5. If parameters are required for the worksheets that you specify, use the "Schedule Wizard dialog: Parameter Values page" Values tab page to specify values for parameters.
6. Use the "Schedule Wizard dialog: Schedule tab" to change the instruction to process the workbook (e.g. change the time or frequency).
7. Click OK to save changes to the scheduled workbook.
Hint: To monitor the progress of scheduled workbooks, choose Tools | Manage Schedules to use the "Scheduling Manager dialog".
How to copy a scheduled workbookYou copy a scheduled workbook when you want to quickly create a new instruction to process a workbook based on an existing scheduled workbook. For example, if you want to process the same workbook and worksheets as an existing scheduled workbook.
To copy a scheduled workbook:
1. Choose File | Scheduling Manager to display the "Scheduling Manager dialog".
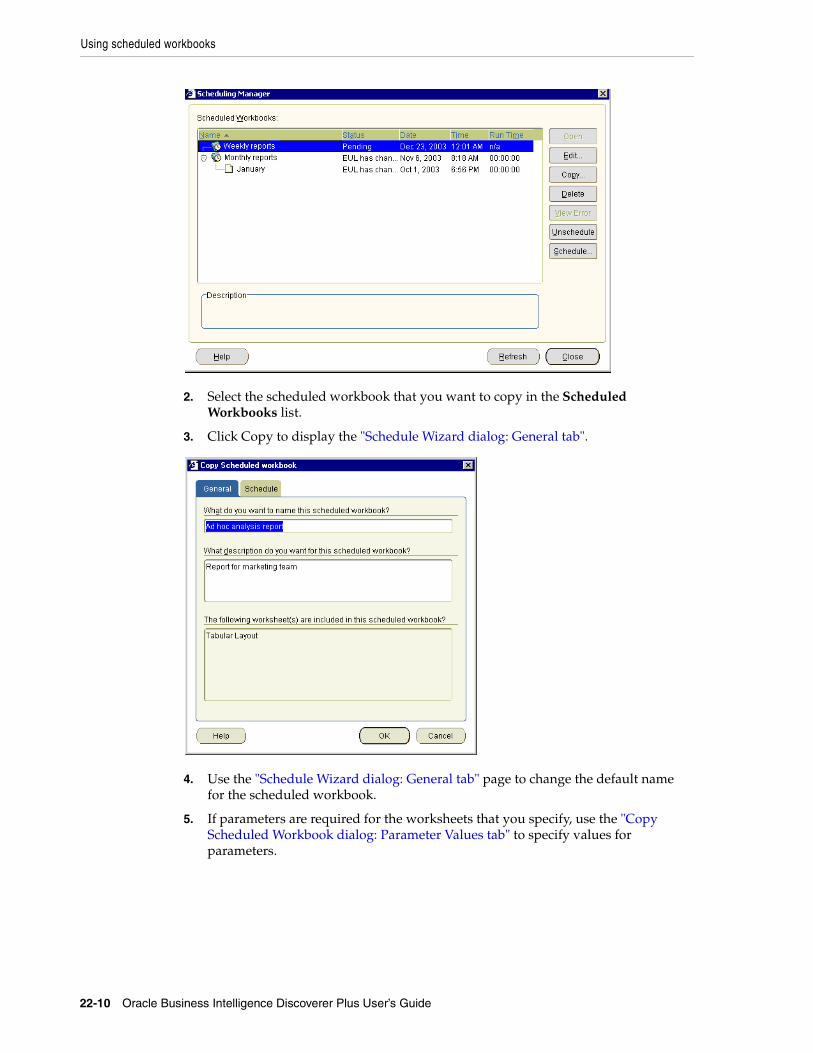
Using scheduled workbooks
22-10 Oracle Business Intelligence Discoverer Plus User’s Guide
2. Select the scheduled workbook that you want to copy in the Scheduled Workbooks list.
3. Click Copy to display the "Schedule Wizard dialog: General tab".
4. Use the "Schedule Wizard dialog: General tab" page to change the default name for the scheduled workbook.
5. If parameters are required for the worksheets that you specify, use the "Copy Scheduled Workbook dialog: Parameter Values tab" to specify values for parameters.
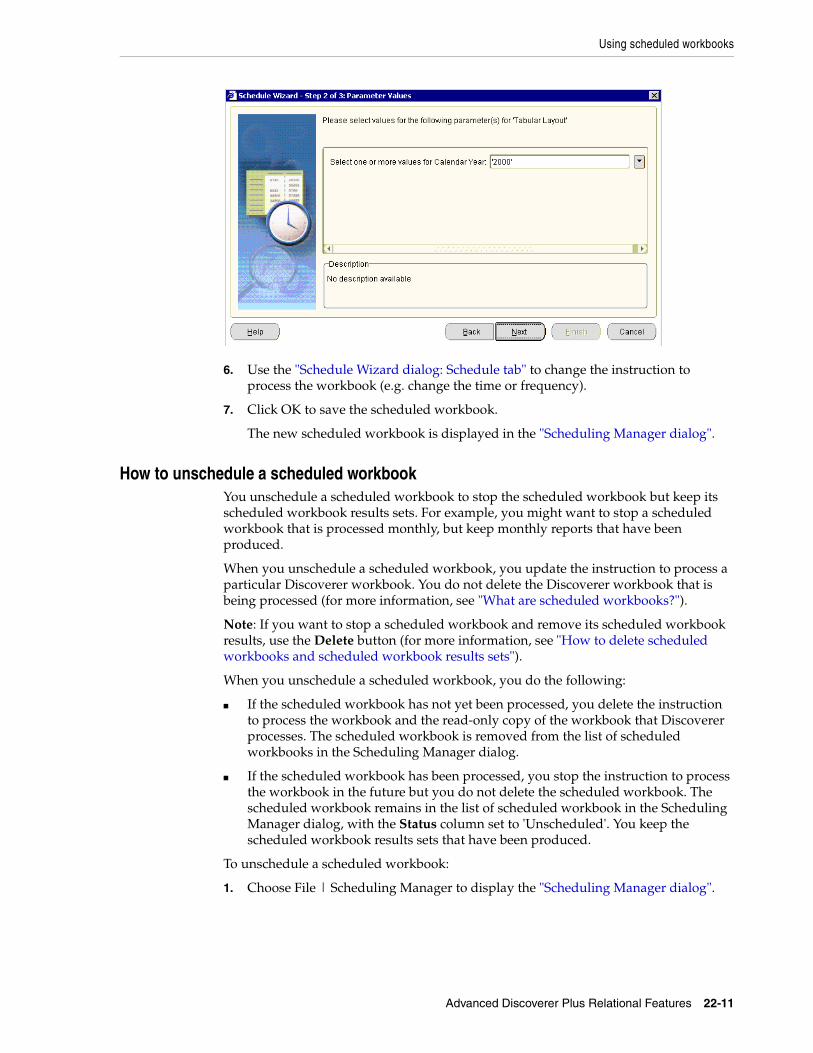
Using scheduled workbooks
Advanced Discoverer Plus Relational Features 22-11
6. Use the "Schedule Wizard dialog: Schedule tab" to change the instruction to process the workbook (e.g. change the time or frequency).
7. Click OK to save the scheduled workbook.
The new scheduled workbook is displayed in the "Scheduling Manager dialog".
How to unschedule a scheduled workbookYou unschedule a scheduled workbook to stop the scheduled workbook but keep its scheduled workbook results sets. For example, you might want to stop a scheduled workbook that is processed monthly, but keep monthly reports that have been produced.
When you unschedule a scheduled workbook, you update the instruction to process a particular Discoverer workbook. You do not delete the Discoverer workbook that is being processed (for more information, see "What are scheduled workbooks?").
Note: If you want to stop a scheduled workbook and remove its scheduled workbook results, use the Delete button (for more information, see "How to delete scheduled workbooks and scheduled workbook results sets").
When you unschedule a scheduled workbook, you do the following:
■ If the scheduled workbook has not yet been processed, you delete the instruction to process the workbook and the read-only copy of the workbook that Discoverer processes. The scheduled workbook is removed from the list of scheduled workbooks in the Scheduling Manager dialog.
■ If the scheduled workbook has been processed, you stop the instruction to process the workbook in the future but you do not delete the scheduled workbook. The scheduled workbook remains in the list of scheduled workbook in the Scheduling Manager dialog, with the Status column set to 'Unscheduled'. You keep the scheduled workbook results sets that have been produced.
To unschedule a scheduled workbook:
1. Choose File | Scheduling Manager to display the "Scheduling Manager dialog".
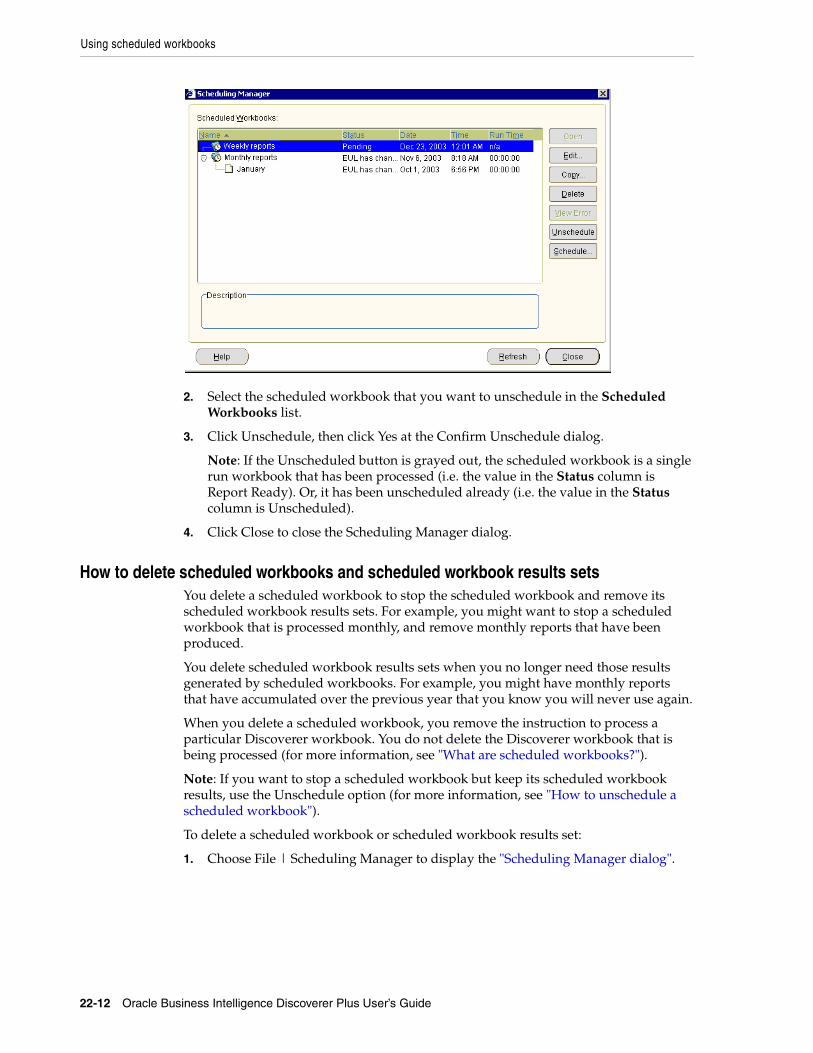
Using scheduled workbooks
22-12 Oracle Business Intelligence Discoverer Plus User’s Guide
2. Select the scheduled workbook that you want to unschedule in the Scheduled Workbooks list.
3. Click Unschedule, then click Yes at the Confirm Unschedule dialog.
Note: If the Unscheduled button is grayed out, the scheduled workbook is a single run workbook that has been processed (i.e. the value in the Status column is Report Ready). Or, it has been unscheduled already (i.e. the value in the Status column is Unscheduled).
4. Click Close to close the Scheduling Manager dialog.
How to delete scheduled workbooks and scheduled workbook results setsYou delete a scheduled workbook to stop the scheduled workbook and remove its scheduled workbook results sets. For example, you might want to stop a scheduled workbook that is processed monthly, and remove monthly reports that have been produced.
You delete scheduled workbook results sets when you no longer need those results generated by scheduled workbooks. For example, you might have monthly reports that have accumulated over the previous year that you know you will never use again.
When you delete a scheduled workbook, you remove the instruction to process a particular Discoverer workbook. You do not delete the Discoverer workbook that is being processed (for more information, see "What are scheduled workbooks?").
Note: If you want to stop a scheduled workbook but keep its scheduled workbook results, use the Unschedule option (for more information, see "How to unschedule a scheduled workbook").
To delete a scheduled workbook or scheduled workbook results set:
1. Choose File | Scheduling Manager to display the "Scheduling Manager dialog".
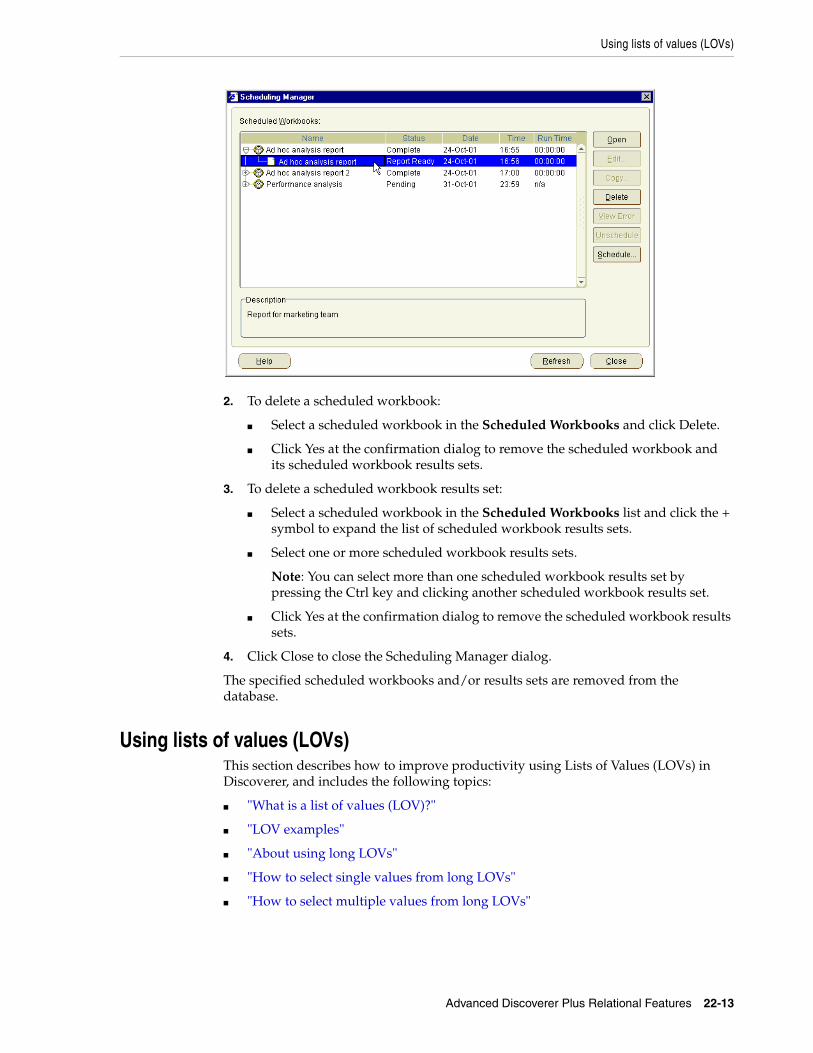
Using lists of values (LOVs)
Advanced Discoverer Plus Relational Features 22-13
2. To delete a scheduled workbook:
■ Select a scheduled workbook in the Scheduled Workbooks and click Delete.
■ Click Yes at the confirmation dialog to remove the scheduled workbook and its scheduled workbook results sets.
3. To delete a scheduled workbook results set:
■ Select a scheduled workbook in the Scheduled Workbooks list and click the + symbol to expand the list of scheduled workbook results sets.
■ Select one or more scheduled workbook results sets.
Note: You can select more than one scheduled workbook results set by pressing the Ctrl key and clicking another scheduled workbook results set.
■ Click Yes at the confirmation dialog to remove the scheduled workbook results sets.
4. Click Close to close the Scheduling Manager dialog.
The specified scheduled workbooks and/or results sets are removed from the database.
Using lists of values (LOVs)This section describes how to improve productivity using Lists of Values (LOVs) in Discoverer, and includes the following topics:
■ "What is a list of values (LOV)?"
■ "LOV examples"
■ "About using long LOVs"
■ "How to select single values from long LOVs"
■ "How to select multiple values from long LOVs"
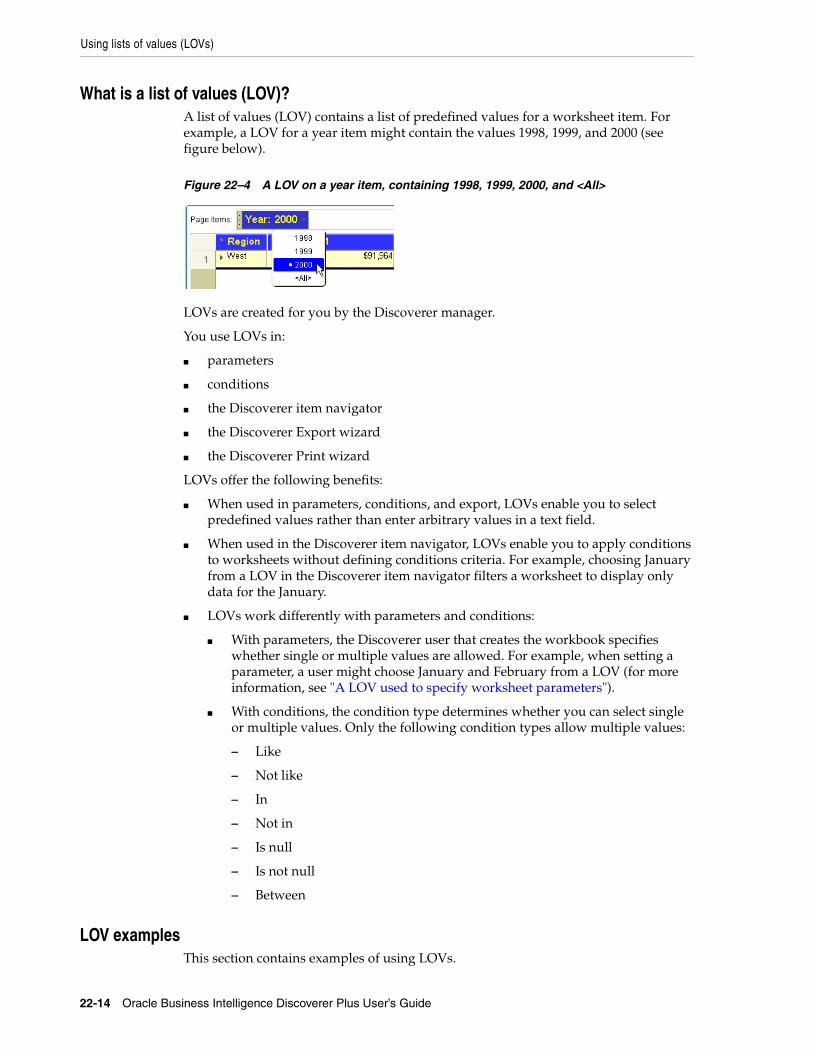
Using lists of values (LOVs)
22-14 Oracle Business Intelligence Discoverer Plus User’s Guide
What is a list of values (LOV)?A list of values (LOV) contains a list of predefined values for a worksheet item. For example, a LOV for a year item might contain the values 1998, 1999, and 2000 (see figure below).
Figure 22–4 A LOV on a year item, containing 1998, 1999, 2000, and <All>
LOVs are created for you by the Discoverer manager.
You use LOVs in:
■ parameters
■ conditions
■ the Discoverer item navigator
■ the Discoverer Export wizard
■ the Discoverer Print wizard
LOVs offer the following benefits:
■ When used in parameters, conditions, and export, LOVs enable you to select predefined values rather than enter arbitrary values in a text field.
■ When used in the Discoverer item navigator, LOVs enable you to apply conditions to worksheets without defining conditions criteria. For example, choosing January from a LOV in the Discoverer item navigator filters a worksheet to display only data for the January.
■ LOVs work differently with parameters and conditions:
■ With parameters, the Discoverer user that creates the workbook specifies whether single or multiple values are allowed. For example, when setting a parameter, a user might choose January and February from a LOV (for more information, see "A LOV used to specify worksheet parameters").
■ With conditions, the condition type determines whether you can select single or multiple values. Only the following condition types allow multiple values:
– Like
– Not like
– In
– Not in
– Is null
– Is not null
– Between
LOV examplesThis section contains examples of using LOVs.
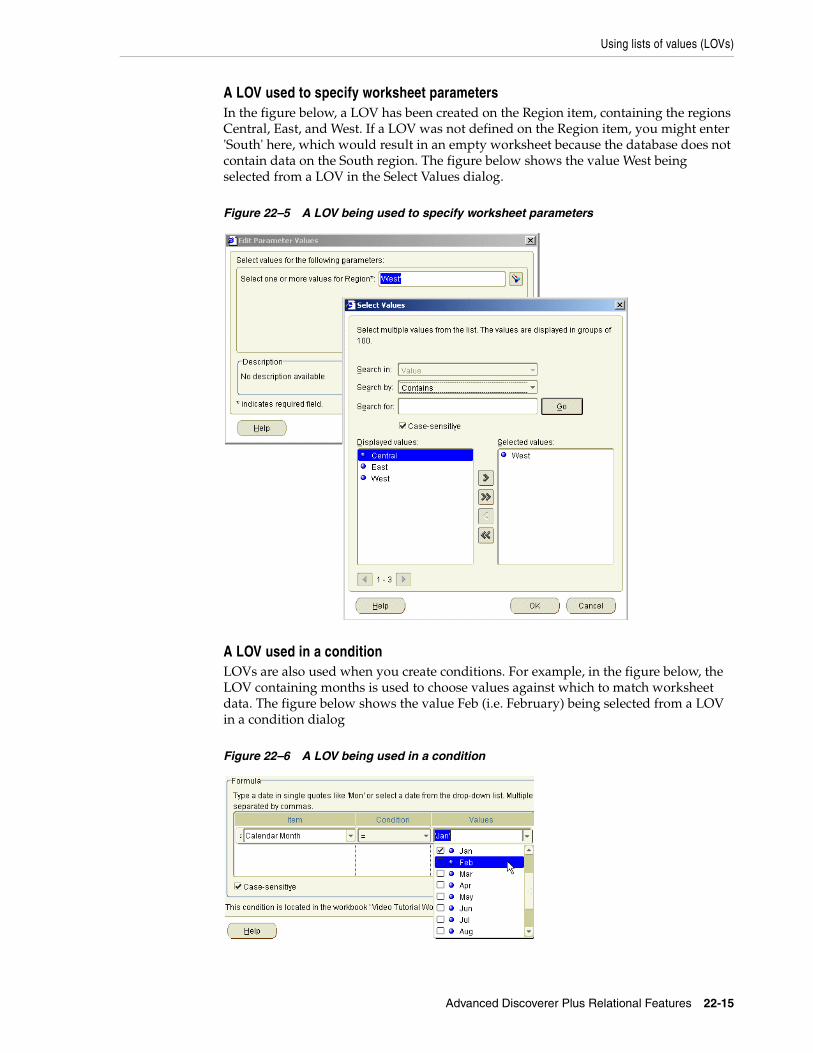
Using lists of values (LOVs)
Advanced Discoverer Plus Relational Features 22-15
A LOV used to specify worksheet parametersIn the figure below, a LOV has been created on the Region item, containing the regions Central, East, and West. If a LOV was not defined on the Region item, you might enter 'South' here, which would result in an empty worksheet because the database does not contain data on the South region. The figure below shows the value West being selected from a LOV in the Select Values dialog.
Figure 22–5 A LOV being used to specify worksheet parameters
A LOV used in a conditionLOVs are also used when you create conditions. For example, in the figure below, the LOV containing months is used to choose values against which to match worksheet data. The figure below shows the value Feb (i.e. February) being selected from a LOV in a condition dialog
Figure 22–6 A LOV being used in a condition
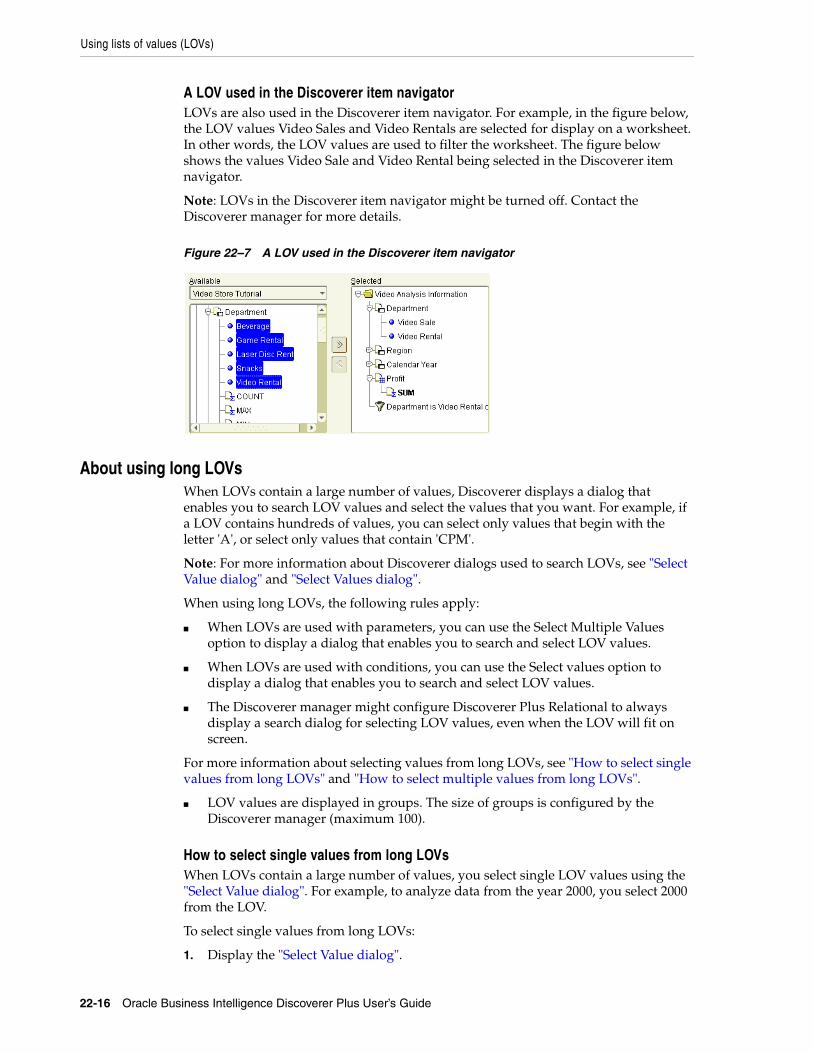
Using lists of values (LOVs)
22-16 Oracle Business Intelligence Discoverer Plus User’s Guide
A LOV used in the Discoverer item navigatorLOVs are also used in the Discoverer item navigator. For example, in the figure below, the LOV values Video Sales and Video Rentals are selected for display on a worksheet. In other words, the LOV values are used to filter the worksheet. The figure below shows the values Video Sale and Video Rental being selected in the Discoverer item navigator.
Note: LOVs in the Discoverer item navigator might be turned off. Contact the Discoverer manager for more details.
Figure 22–7 A LOV used in the Discoverer item navigator
About using long LOVsWhen LOVs contain a large number of values, Discoverer displays a dialog that enables you to search LOV values and select the values that you want. For example, if a LOV contains hundreds of values, you can select only values that begin with the letter 'A', or select only values that contain 'CPM'.
Note: For more information about Discoverer dialogs used to search LOVs, see "Select Value dialog" and "Select Values dialog".
When using long LOVs, the following rules apply:
■ When LOVs are used with parameters, you can use the Select Multiple Values option to display a dialog that enables you to search and select LOV values.
■ When LOVs are used with conditions, you can use the Select values option to display a dialog that enables you to search and select LOV values.
■ The Discoverer manager might configure Discoverer Plus Relational to always display a search dialog for selecting LOV values, even when the LOV will fit on screen.
For more information about selecting values from long LOVs, see "How to select single values from long LOVs" and "How to select multiple values from long LOVs".
■ LOV values are displayed in groups. The size of groups is configured by the Discoverer manager (maximum 100).
How to select single values from long LOVsWhen LOVs contain a large number of values, you select single LOV values using the "Select Value dialog". For example, to analyze data from the year 2000, you select 2000 from the LOV.
To select single values from long LOVs:
1. Display the "Select Value dialog".
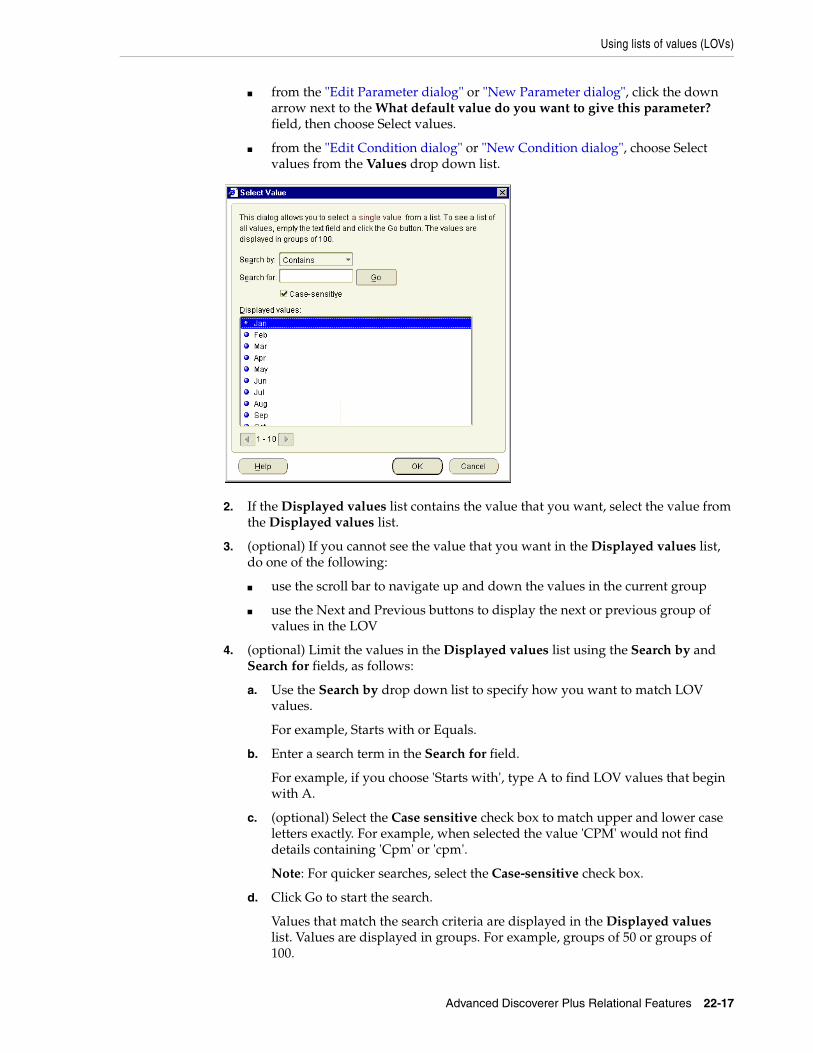
Using lists of values (LOVs)
Advanced Discoverer Plus Relational Features 22-17
■ from the "Edit Parameter dialog" or "New Parameter dialog", click the down arrow next to the What default value do you want to give this parameter? field, then choose Select values.
■ from the "Edit Condition dialog" or "New Condition dialog", choose Select values from the Values drop down list.
2. If the Displayed values list contains the value that you want, select the value from the Displayed values list.
3. (optional) If you cannot see the value that you want in the Displayed values list, do one of the following:
■ use the scroll bar to navigate up and down the values in the current group
■ use the Next and Previous buttons to display the next or previous group of values in the LOV
4. (optional) Limit the values in the Displayed values list using the Search by and Search for fields, as follows:
a. Use the Search by drop down list to specify how you want to match LOV values.
For example, Starts with or Equals.
b. Enter a search term in the Search for field.
For example, if you choose 'Starts with', type A to find LOV values that begin with A.
c. (optional) Select the Case sensitive check box to match upper and lower case letters exactly. For example, when selected the value 'CPM' would not find details containing 'Cpm' or 'cpm'.
Note: For quicker searches, select the Case-sensitive check box.
d. Click Go to start the search.
Values that match the search criteria are displayed in the Displayed values list. Values are displayed in groups. For example, groups of 50 or groups of 100.
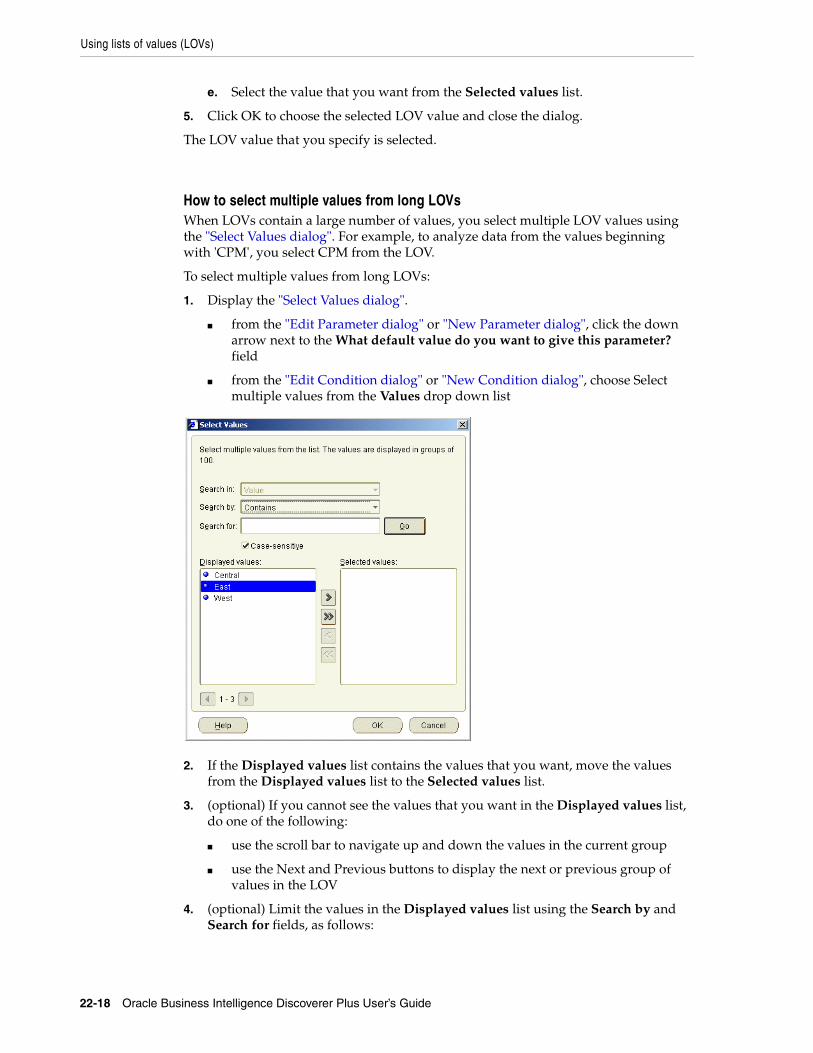
Using lists of values (LOVs)
22-18 Oracle Business Intelligence Discoverer Plus User’s Guide
e. Select the value that you want from the Selected values list.
5. Click OK to choose the selected LOV value and close the dialog.
The LOV value that you specify is selected.
How to select multiple values from long LOVsWhen LOVs contain a large number of values, you select multiple LOV values using the "Select Values dialog". For example, to analyze data from the values beginning with 'CPM', you select CPM from the LOV.
To select multiple values from long LOVs:
1. Display the "Select Values dialog".
■ from the "Edit Parameter dialog" or "New Parameter dialog", click the down arrow next to the What default value do you want to give this parameter? field
■ from the "Edit Condition dialog" or "New Condition dialog", choose Select multiple values from the Values drop down list
2. If the Displayed values list contains the values that you want, move the values from the Displayed values list to the Selected values list.
3. (optional) If you cannot see the values that you want in the Displayed values list, do one of the following:
■ use the scroll bar to navigate up and down the values in the current group
■ use the Next and Previous buttons to display the next or previous group of values in the LOV
4. (optional) Limit the values in the Displayed values list using the Search by and Search for fields, as follows:
Changing default settings
Advanced Discoverer Plus Relational Features 22-19
a. Use the Search by drop down list to specify how you want to match LOV values.
For example, Starts with or Equals.
b. Enter a search term in the Search for field.
For example, if you choose 'Starts with', type A to find LOV values that begin with A.
c. (optional) Select the Case-sensitive check box to match upper and lower case letters exactly. For example, when selected the value 'CPM' would not find details containing 'Cpm' or 'cpm'.
Note: For quicker searches, select the Case-sensitive check box.
d. Click Go to start the search.
Values that match the search criteria are displayed in the Displayed values list. Values are displayed in groups. For example, groups of 50 or groups of 100.
e. To select the values that you want in the Displayed values list, move LOV values from the Displayed values list to the Selected values list.
5. Click OK to choose the selected LOV values and close the dialog.
The LOV values that you choose are selected.
Notes■ To deselect LOV values, move LOV values from the Selected list to the Displayed
list.
Changing default settingsThis section explains how to use Discoverer’s default settings, and contains the following topics:
■ "About default Discoverer settings"
■ "How to change default Discoverer settings"
■ "How to revert to the default format settings"
■ "How to change default worksheet formats"
■ "Notes on setting Advanced options"
About default Discoverer settingsDiscoverer’s default settings determine the appearance and behavior of Discoverer worksheets. You can change the default settings for new worksheets to suit your requirements. For example, you might want new worksheets to have a grey background and blue text. Or you might want to limit the amount of data returned by a query so that worksheets are not too large.
You are advised to only change your default settings in one of the following circumstances:
■ you want to change only the default color and style of headings and data in your worksheets
■ you are an experienced Discoverer user
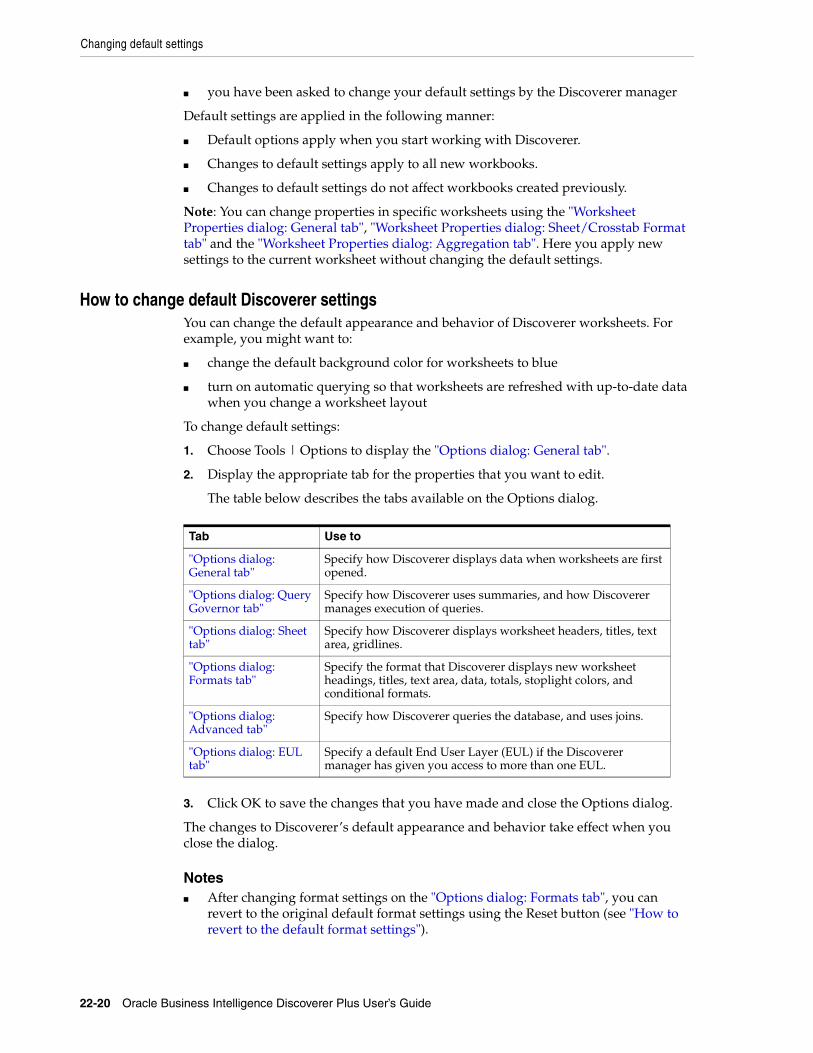
Changing default settings
22-20 Oracle Business Intelligence Discoverer Plus User’s Guide
■ you have been asked to change your default settings by the Discoverer manager
Default settings are applied in the following manner:
■ Default options apply when you start working with Discoverer.
■ Changes to default settings apply to all new workbooks.
■ Changes to default settings do not affect workbooks created previously.
Note: You can change properties in specific worksheets using the "Worksheet Properties dialog: General tab", "Worksheet Properties dialog: Sheet/Crosstab Format tab" and the "Worksheet Properties dialog: Aggregation tab". Here you apply new settings to the current worksheet without changing the default settings.
How to change default Discoverer settingsYou can change the default appearance and behavior of Discoverer worksheets. For example, you might want to:
■ change the default background color for worksheets to blue
■ turn on automatic querying so that worksheets are refreshed with up-to-date data when you change a worksheet layout
To change default settings:
1. Choose Tools | Options to display the "Options dialog: General tab".
2. Display the appropriate tab for the properties that you want to edit.
The table below describes the tabs available on the Options dialog.
3. Click OK to save the changes that you have made and close the Options dialog.
The changes to Discoverer’s default appearance and behavior take effect when you close the dialog.
Notes■ After changing format settings on the "Options dialog: Formats tab", you can
revert to the original default format settings using the Reset button (see "How to revert to the default format settings").
Tab Use to
"Options dialog: General tab"
Specify how Discoverer displays data when worksheets are first opened.
"Options dialog: Query Governor tab"
Specify how Discoverer uses summaries, and how Discoverer manages execution of queries.
"Options dialog: Sheet tab"
Specify how Discoverer displays worksheet headers, titles, text area, gridlines.
"Options dialog: Formats tab"
Specify the format that Discoverer displays new worksheet headings, titles, text area, data, totals, stoplight colors, and conditional formats.
"Options dialog: Advanced tab"
Specify how Discoverer queries the database, and uses joins.
"Options dialog: EUL tab"
Specify a default End User Layer (EUL) if the Discoverer manager has given you access to more than one EUL.
Changing default settings
Advanced Discoverer Plus Relational Features 22-21
■ Do not change settings on the "Options dialog: Advanced tab" or "Options dialog: EUL tab" unless asked to do so by the Discoverer manager.
How to revert to the default format settingsSometimes, after changing the default formats for a workbook, you might want to revert to the original default format settings. For example, if you change default text fonts to produce a particular style of report, you might want to set the text fonts back to their original default style.
Instead of changing each format setting individually, you can use the Reset facility.
Note: Default formats apply to all worksheets in a workbook.
To revert to original default format settings:
1. Choose Tools | Options to display the Options dialog.
2. Display the "Options dialog: Formats tab".
3. Select the default format that you want to reset.
For example, Data Format or Heading Format.
4. Click the Reset button to revert back to the default settings for the selected default format.
5. Click OK to close the Options dialog.
If you reset the default formats, these original default formats apply when you close the Options dialog.
How to change default worksheet formatsYou change default worksheet formats when you want to change how new worksheets are formatted. For example, you might want to display all new worksheet items in blue text with a yellow background.
Note: Changing the default worksheet format does not affect the format of existing worksheet items. Only items that you add to the worksheet have the new default format.
To change the default worksheet format:
1. Choose Tools | Options to display the Options dialog.
2. Display the "Options dialog: Formats tab"
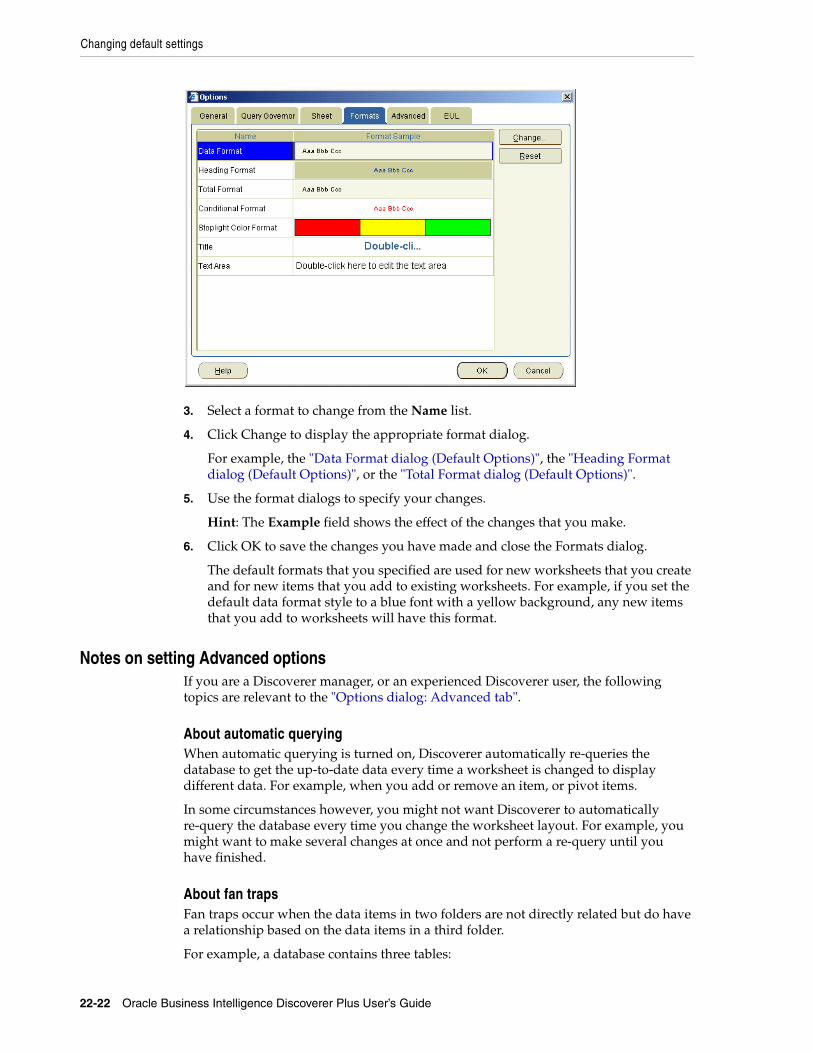
Changing default settings
22-22 Oracle Business Intelligence Discoverer Plus User’s Guide
3. Select a format to change from the Name list.
4. Click Change to display the appropriate format dialog.
For example, the "Data Format dialog (Default Options)", the "Heading Format dialog (Default Options)", or the "Total Format dialog (Default Options)".
5. Use the format dialogs to specify your changes.
Hint: The Example field shows the effect of the changes that you make.
6. Click OK to save the changes you have made and close the Formats dialog.
The default formats that you specified are used for new worksheets that you create and for new items that you add to existing worksheets. For example, if you set the default data format style to a blue font with a yellow background, any new items that you add to worksheets will have this format.
Notes on setting Advanced optionsIf you are a Discoverer manager, or an experienced Discoverer user, the following topics are relevant to the "Options dialog: Advanced tab".
About automatic queryingWhen automatic querying is turned on, Discoverer automatically re-queries the database to get the up-to-date data every time a worksheet is changed to display different data. For example, when you add or remove an item, or pivot items.
In some circumstances however, you might not want Discoverer to automatically re-query the database every time you change the worksheet layout. For example, you might want to make several changes at once and not perform a re-query until you have finished.
About fan trapsFan traps occur when the data items in two folders are not directly related but do have a relationship based on the data items in a third folder.
For example, a database contains three tables:
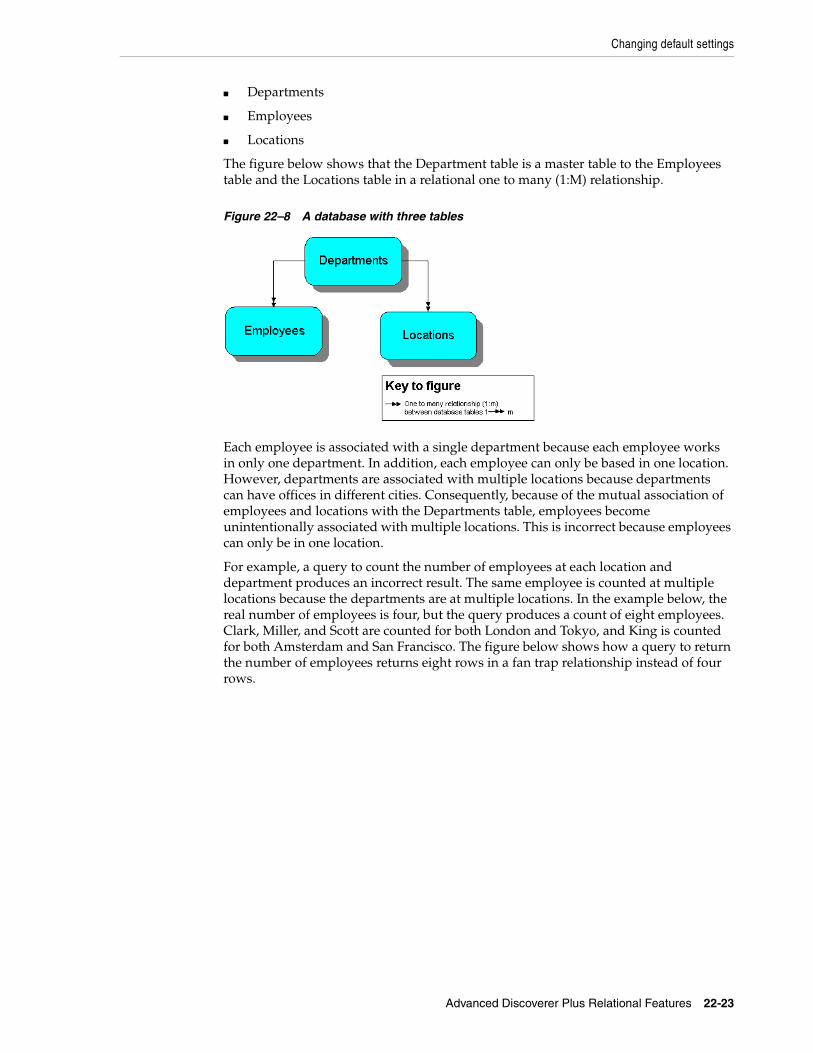
Changing default settings
Advanced Discoverer Plus Relational Features 22-23
■ Departments
■ Employees
■ Locations
The figure below shows that the Department table is a master table to the Employees table and the Locations table in a relational one to many (1:M) relationship.
Figure 22–8 A database with three tables
Each employee is associated with a single department because each employee works in only one department. In addition, each employee can only be based in one location. However, departments are associated with multiple locations because departments can have offices in different cities. Consequently, because of the mutual association of employees and locations with the Departments table, employees become unintentionally associated with multiple locations. This is incorrect because employees can only be in one location.
For example, a query to count the number of employees at each location and department produces an incorrect result. The same employee is counted at multiple locations because the departments are at multiple locations. In the example below, the real number of employees is four, but the query produces a count of eight employees. Clark, Miller, and Scott are counted for both London and Tokyo, and King is counted for both Amsterdam and San Francisco. The figure below shows how a query to return the number of employees returns eight rows in a fan trap relationship instead of four rows.
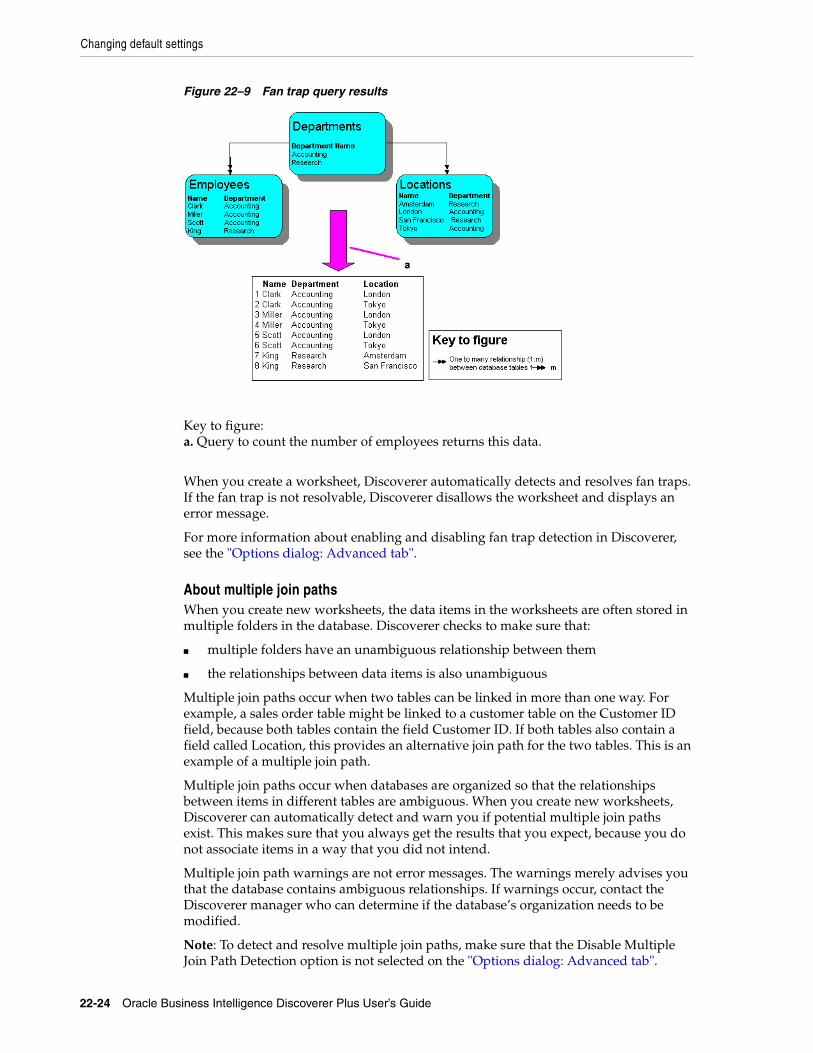
Changing default settings
22-24 Oracle Business Intelligence Discoverer Plus User’s Guide
Figure 22–9 Fan trap query results
Key to figure:a. Query to count the number of employees returns this data.
When you create a worksheet, Discoverer automatically detects and resolves fan traps. If the fan trap is not resolvable, Discoverer disallows the worksheet and displays an error message.
For more information about enabling and disabling fan trap detection in Discoverer, see the "Options dialog: Advanced tab".
About multiple join pathsWhen you create new worksheets, the data items in the worksheets are often stored in multiple folders in the database. Discoverer checks to make sure that:
■ multiple folders have an unambiguous relationship between them
■ the relationships between data items is also unambiguous
Multiple join paths occur when two tables can be linked in more than one way. For example, a sales order table might be linked to a customer table on the Customer ID field, because both tables contain the field Customer ID. If both tables also contain a field called Location, this provides an alternative join path for the two tables. This is an example of a multiple join path.
Multiple join paths occur when databases are organized so that the relationships between items in different tables are ambiguous. When you create new worksheets, Discoverer can automatically detect and warn you if potential multiple join paths exist. This makes sure that you always get the results that you expect, because you do not associate items in a way that you did not intend.
Multiple join path warnings are not error messages. The warnings merely advises you that the database contains ambiguous relationships. If warnings occur, contact the Discoverer manager who can determine if the database’s organization needs to be modified.
Note: To detect and resolve multiple join paths, make sure that the Disable Multiple Join Path Detection option is not selected on the "Options dialog: Advanced tab".
Using SQL
Advanced Discoverer Plus Relational Features 22-25
Using SQLThis section is aimed at experienced Discoverer users who are familiar with SQL (Structured Query Language) and who are interested in Discoverer’s advanced facilities. Discoverer managers will also find this section useful.
This section contains the following topics:
■ "What is SQL"
■ "Why should I be interested in SQL?"
■ "About the Discoverer execution plan"
■ "How to view SQL"
■ "How to view a SQL execution plan"
What is SQLSQL is a generic programming language used to extract and manipulate data in a database. In other words, SQL enables you to ask a question (known as a query) of the database that the database answers by displaying data.
For example, you might use SQL to ask the question 'Which products sell more than 10,000 per year?'. The database uses SQL to return a list of products that sell more than 10,000, and might also perform other analysis such as sorting, grouping, and totalling of the data.
SQL is a powerful language, but is difficult to learn and use. Although Discoverer itself uses SQL to display and analyze worksheet data, Discoverer users are shielded from underlying SQL.
Why should I be interested in SQL?Because Discoverer shields Discoverer users from underlying SQL, they do not need to know how SQL works. This enables users with no technical database experience and no knowledge of underlying database structures to perform sophisticated data analysis.
However, in some circumstances, you might want to look at SQL being used by Discoverer. For example, to improve Discoverer performance you might need to look at underlying SQL to make sure that queries are being run efficiently.
What are summaries?Summaries are database tables that contain commonly accessed, pre-processed data, which gives the following benefits:
■ because data is pre-joined and pre-aggregated, Discoverer can access this data more quickly than by using ad hoc query
■ this also means that the data is processed once and accessed many times, rather than re-processed every time it is needed
What are summary foldersA summary folder is how Discoverer represents an underlying summary or materialized view. Summaries and materialized views pre-compute and store aggregated data for use in SQL queries.
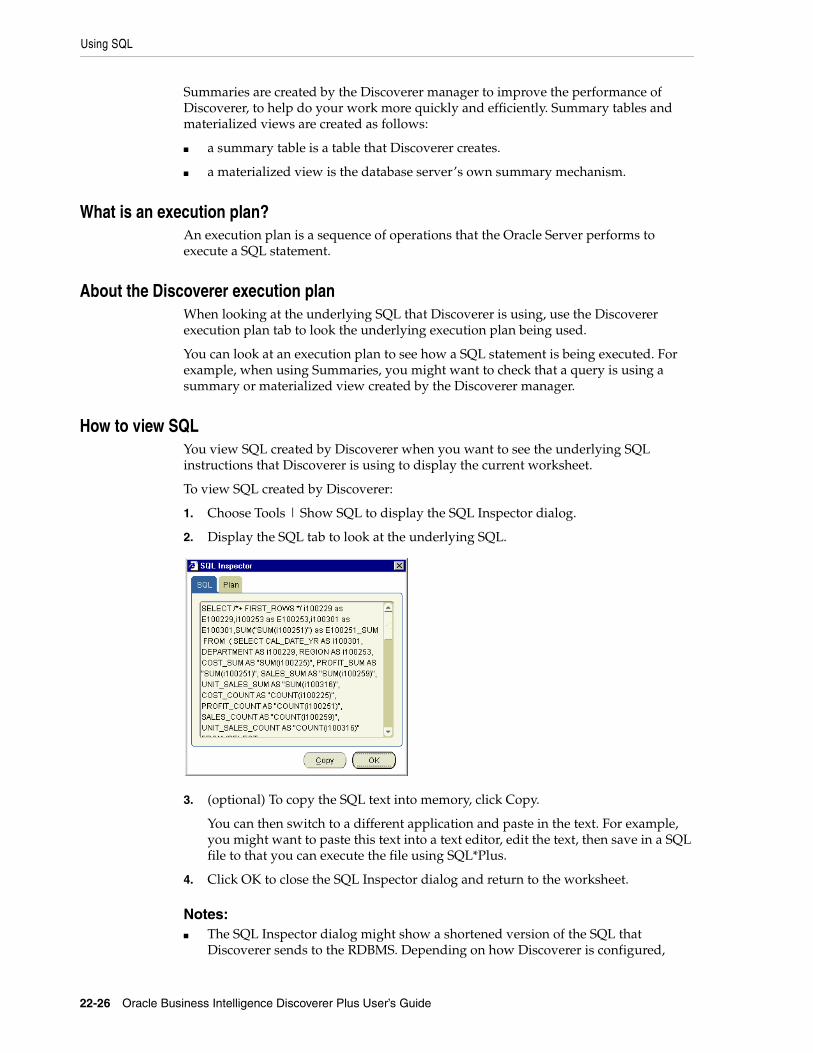
Using SQL
22-26 Oracle Business Intelligence Discoverer Plus User’s Guide
Summaries are created by the Discoverer manager to improve the performance of Discoverer, to help do your work more quickly and efficiently. Summary tables and materialized views are created as follows:
■ a summary table is a table that Discoverer creates.
■ a materialized view is the database server’s own summary mechanism.
What is an execution plan?An execution plan is a sequence of operations that the Oracle Server performs to execute a SQL statement.
About the Discoverer execution planWhen looking at the underlying SQL that Discoverer is using, use the Discoverer execution plan tab to look the underlying execution plan being used.
You can look at an execution plan to see how a SQL statement is being executed. For example, when using Summaries, you might want to check that a query is using a summary or materialized view created by the Discoverer manager.
How to view SQLYou view SQL created by Discoverer when you want to see the underlying SQL instructions that Discoverer is using to display the current worksheet.
To view SQL created by Discoverer:
1. Choose Tools | Show SQL to display the SQL Inspector dialog.
2. Display the SQL tab to look at the underlying SQL.
3. (optional) To copy the SQL text into memory, click Copy.
You can then switch to a different application and paste in the text. For example, you might want to paste this text into a text editor, edit the text, then save in a SQL file to that you can execute the file using SQL*Plus.
4. Click OK to close the SQL Inspector dialog and return to the worksheet.
Notes:■ The SQL Inspector dialog might show a shortened version of the SQL that
Discoverer sends to the RDBMS. Depending on how Discoverer is configured,
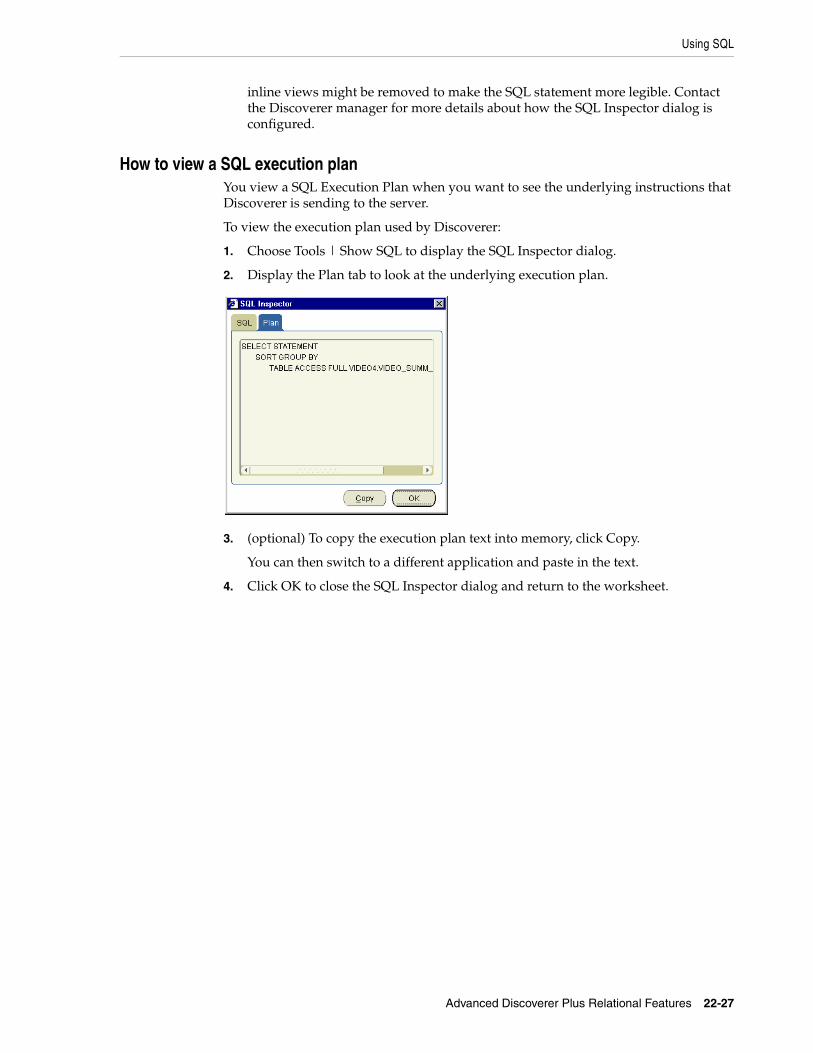
Using SQL
Advanced Discoverer Plus Relational Features 22-27
inline views might be removed to make the SQL statement more legible. Contact the Discoverer manager for more details about how the SQL Inspector dialog is configured.
How to view a SQL execution planYou view a SQL Execution Plan when you want to see the underlying instructions that Discoverer is sending to the server.
To view the execution plan used by Discoverer:
1. Choose Tools | Show SQL to display the SQL Inspector dialog.
2. Display the Plan tab to look at the underlying execution plan.
3. (optional) To copy the execution plan text into memory, click Copy.
You can then switch to a different application and paste in the text.
4. Click OK to close the SQL Inspector dialog and return to the worksheet.

Using SQL
22-28 Oracle Business Intelligence Discoverer Plus User’s Guide
Part VDiscoverer Plus Relational Reference
This part contains reference information about each Discoverer Plus Relational dialog.

Dialog reference 23-1
23Dialog reference
This chapter contains comprehensive reference information for each dialog in Discoverer Plus Relational. Dialogs are listed in alphabetical order:
■ "Available Items pane"
■ "Available Items pane: Calculations tab"
■ "Available Items pane: Conditions area"
■ "Available Items pane: Items tab"
■ "Band by Rank dialog"
■ "Band by Value dialog"
■ "Calendar dialog"
■ "Choose a responsibility dialog"
■ "Color Chooser dialog"
■ "Color Palette Editor dialog"
■ "Choose Worksheet dialog"
■ "Column Width dialog"
■ "Conditional Formats dialog"
■ "Confirm Threshold dialog"
■ "Data Format dialog (Default Options)"
■ "Data/graph pane"
■ "Delete Scheduled Workbook Results dialog"
■ "Delete Workbooks from Database dialog"
■ "Difference dialog"
■ "Drill dialog"
■ "Edit Calculation dialog"
■ "Edit Condition dialog"
■ "Edit Graph dialog: Font dialog tab"
■ "Edit Graph dialog: Legend tab"
■ "Edit Graph dialog: Pie Chart Options tab (column)"
■ "Edit Graph dialog: Pie Chart Options tab (row)"
23-2 Oracle Business Intelligence Discoverer Plus User’s Guide
■ "Edit Graph dialog: Plot Area tab"
■ "Edit Graph dialog: Style tab"
■ "Edit Graph dialog: Titles, Totals, and Series tab"
■ "Edit Graph dialog: Type tab"
■ "Edit Graph dialog: X-Axis tab"
■ "Edit Graph dialog: Y-Axis tab"
■ "Edit Heading dialog"
■ "Edit Parameter dialog"
■ "Edit Parameter Values dialog"
■ "Edit Percentage dialog"
■ "Edit Text Area dialog"
■ "Edit Title dialog"
■ "Edit Total dialog"
■ "Edit Worksheet dialog"
■ "Edit Worksheet dialog: Crosstab Layout tab"
■ "Edit Worksheet dialog: Parameters tab"
■ "Edit Worksheet dialog: Select Items tab"
■ "Edit Worksheet dialog: Sort tab"
■ "Edit Worksheet dialog: Table Layout tab"
■ "Edit Worksheet dialog: Worksheet Layout tab"
■ "Export Log dialog"
■ "Export Wizard dialog: Format and Name page"
■ "Export Wizard dialog: Graph page"
■ "Export Wizard dialog: Page Item Prompts page"
■ "Export Wizard dialog: Parameter Prompts page"
■ "Export Wizard dialog: Select page"
■ "Export Wizard dialog: Supervise page"
■ "Find dialog (in Item Navigator)"
■ "Find dialog (in Worksheet)"
■ "Following Value dialog"
■ "Format dialog"
■ "Format Data dialog"
■ "Format Data dialog: Breaks tab"
■ "Format Data dialog: Date tab"
■ "Format Data dialog: Format tab"
■ "Format Data dialog: Number tab"
■ "Format Data dialog: Text tab"
Dialog reference 23-3
■ "Format heading dialog"
■ "Group Total dialog"
■ "Header/Footer Font dialog"
■ "Heading Format dialog (Default Options)"
■ "Join folders dialog"
■ "Manage Links dialog"
■ "Manage Workbooks dialog"
■ "Move Worksheets dialog"
■ "Moving Total dialog"
■ "New Calculation dialog"
■ "New Condition dialog"
■ "New Conditional Format dialog"
■ "New Link dialog"
■ "New Parameter dialog"
■ "New Percentage dialog"
■ "New Scheduled Workbook Results dialog"
■ "New Stoplight Format dialog"
■ "New Total dialog"
■ "Open Workbook from Database dialog"
■ "Options dialog: Advanced tab"
■ "Options dialog: EUL tab"
■ "Options dialog: Formats tab"
■ "Options dialog: General tab"
■ "Options dialog: Query Governor tab"
■ "Options dialog: Sheet tab"
■ "Page Setup dialog"
■ "Page Setup dialog: Graph tab"
■ "Page Setup dialog: Header/Footer tab"
■ "Page Setup dialog: Margins tab"
■ "Page Setup dialog: Table/Crosstab tab"
■ "Page Setup dialog: Worksheet tab"
■ "Parameters dialog"
■ "Percent Contribution dialog"
■ "Percent Difference dialog"
■ "Percent Rank dialog"
■ "Percent Running Contribution dialog"
■ "Preceding Value dialog"
23-4 Oracle Business Intelligence Discoverer Plus User’s Guide
■ "Print dialog"
■ "Print Preview dialog"
■ "Rank dialog"
■ "Reference Lines dialog"
■ "Running Total dialog"
■ "Save Workbook to Database dialog"
■ "Schedule Wizard dialog"
■ "Schedule Wizard dialog: General tab"
■ "Schedule Wizard dialog: Schedule tab"
■ "Scheduling Manager dialog"
■ "Select Condition dialog"
■ "Select Item dialog"
■ "Select item to drill dialog"
■ "Selected items pane"
■ "Select Parameter dialog"
■ "Select User dialog"
■ "Select Value dialog"
■ "Select Values dialog"
■ "Select Workbook from Database dialog"
■ "Share Workbooks dialog: User -> Workbook tab"
■ "Share Workbooks dialog: Workbook -> User tab"
■ "Show Condition dialog"
■ "Sort Crosstab dialog"
■ "Stoplight colors dialog"
■ "Text area"
■ "Title area"
■ "Total Format dialog (Default Options)"
■ "Workbook Properties dialog"
■ "Workbook Wizard: Create/Open Workbook dialog"
■ "Worksheet Properties dialog: Aggregation tab"
■ "Worksheet Properties dialog: General tab"
■ "Worksheet Properties dialog: Sheet/Crosstab Format tab"
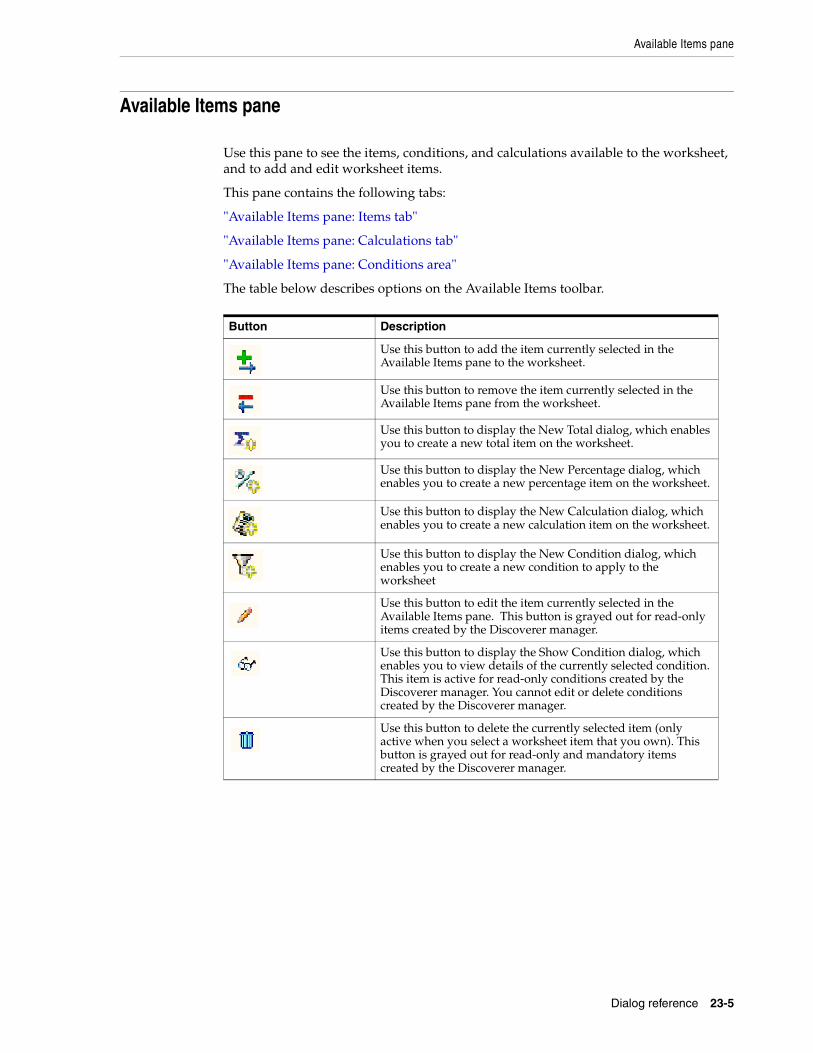
Available Items pane
Dialog reference 23-5
Available Items pane
Use this pane to see the items, conditions, and calculations available to the worksheet, and to add and edit worksheet items.
This pane contains the following tabs:
"Available Items pane: Items tab"
"Available Items pane: Calculations tab"
"Available Items pane: Conditions area"
The table below describes options on the Available Items toolbar.
Button Description
Use this button to add the item currently selected in the Available Items pane to the worksheet.
Use this button to remove the item currently selected in the Available Items pane from the worksheet.
Use this button to display the New Total dialog, which enables you to create a new total item on the worksheet.
Use this button to display the New Percentage dialog, which enables you to create a new percentage item on the worksheet.
Use this button to display the New Calculation dialog, which enables you to create a new calculation item on the worksheet.
Use this button to display the New Condition dialog, which enables you to create a new condition to apply to the worksheet
Use this button to edit the item currently selected in the Available Items pane. This button is grayed out for read-only items created by the Discoverer manager.
Use this button to display the Show Condition dialog, which enables you to view details of the currently selected condition. This item is active for read-only conditions created by the Discoverer manager. You cannot edit or delete conditions created by the Discoverer manager.
Use this button to delete the currently selected item (only active when you select a worksheet item that you own). This button is grayed out for read-only and mandatory items created by the Discoverer manager.
Available Items pane: Calculations tab
23-6 Oracle Business Intelligence Discoverer Plus User’s Guide
Available Items pane: Calculations tab
Use this tab to see the calculations, percentages, and totals available for use in the worksheet, and to create and edit calculations, percentages, and totals. For example, you might want to add an existing calculation to the worksheet. For more information about options on the Available Items toolbar, see "Available Items pane".
For more information, see:
"Using calculations"
"Using percentages"
"Using totals"
"About Discoverer’s drag and drop features"
ListUse this drop down list to select the type of calculations to display in the <Items list> below, as follows:
■ choose 'All Items' to see all available calculations, percentages, and totals
■ choose 'Selected Items' to see calculations, percentages, and totals related to items currently included in the worksheet
■ choose a particular worksheet item (e.g. Profit SUM) to see calculations, percentages, and totals active on that item
<Items list>Use this list to see the calculations, percentages, and totals available for use in the worksheet, and to add and to remove calculations, percentages, and totals to and from the worksheet.
Click the plus (+) and minus (-) buttons next to a calculation category (e.g. My Calculations, My Percentages, My Totals) to expand and collapse the category.
The categories prefixed with 'My...' contain worksheet items that you own and that you can edit and delete. Categories prefixed with the business area name are read-only items created by the Discoverer manager that you can use but not edit or delete.
To add a calculation to the worksheet, do one of the following:
■ drag and drop a calculation from the Calculations tab into the worksheet area
■ drag and drop a calculation from the Calculations tab into the Selected Items pane (if displayed)
■ select a calculation and click the Add to Worksheet button on the Available Items toolbar (for more information, see "Available Items pane"). Or right-click on an item and select Add to Worksheet from the right-click menu
To edit or remove a calculation, do one of the following:
■ select a calculation and click the Edit button on the Available Items toolbar (for more information, see "Available Items pane").
■ select a calculation and click the Remove from Worksheet button on the Available Items toolbar (for more information, see "Available Items pane").

Available Items pane: Calculations tab
Dialog reference 23-7
To select more than one item at a time, hold down the control key (Ctrl) when you select items. Items currently displayed on the worksheet are marked with a tick symbol (or check mark).
For descriptions of icons used in the <Items list>, see "About icons used in the Discoverer item navigator".
Available Items pane: Conditions area
23-8 Oracle Business Intelligence Discoverer Plus User’s Guide
Available Items pane: Conditions area
Use this tab to see the conditions available for use in the worksheet, to edit conditions, and to apply conditions to the worksheet. For example, you might want to apply an existing condition to the worksheet to display only sales figures for a particular city (e.g. New York). For more information about options on the Available Items toolbar, see "Available Items pane".
For more information, see:
"What are conditions?"
"About Discoverer’s drag and drop features"
ListUse this drop down list to select the type of conditions to display in the <Items list> below, as follows:
■ choose 'All Items' to see all available conditions
■ choose 'Selected Items' to see conditions related to worksheet items
■ choose a particular worksheet item (e.g. Profit SUM) to see conditions active on that item
<Items list>Use this list to see the conditions available for use in the worksheet, to apply conditions to the worksheet, and to remove conditions from the worksheet.
Click the plus (+) and minus (-) buttons next to a condition category (e.g. My Conditions) to expand and collapse the category.
The categories prefixed with 'My...' contain worksheet items that you own and that you can edit and delete. Categories prefixed with the business area name are read-only items created by the Discoverer manager that you can use but not edit or delete.
To apply a condition to the worksheet, do one of the following:
■ drag and drop a condition from the Conditions tab into the worksheet area
■ drag and drop a condition from the Conditions tab into the Selected Items pane (if displayed)
■ select a condition and click the Add to Worksheet button on the Available Items toolbar (for more information, see "Available Items pane")
■ right-click on a condition and select Add to Worksheet from the right-click menu
To select more than one condition at a time, hold down the control key (Ctrl) when you select items. Conditions currently applied to the worksheet are marked with a tick symbol (or check mark).
For descriptions of icons used in the <Items list>, see "About icons used in the Discoverer item navigator".
Available Items pane: Items tab
Dialog reference 23-9
Available Items pane: Items tab
Use this tab to see items in the current business area and see which items are selected or not selected in the current worksheet. You can also add items to the currently displayed worksheet. For more information about options on the Available Items toolbar, see "Available Items pane". For more information, see:
"What are items?"
"About Discoverer’s drag and drop features"
ListUse this drop down list to select a different business area (for more information about business areas, see "What are business areas?"). This drop down list is only active when you have access to more than one business area.
Hint: If you cannot see the business area that you want to analyze, make sure that you selected the correct connection when you started Discoverer Plus Relational. If necessary, exit Discoverer Plus Relational and re-start Discoverer Plus Relational using a different connection that has access to the business area you want to analyze.
<Flashlight button>Click the flashlight button next to the List field to display the "Find dialog (in Item Navigator)", which enables you to search any business area for items that you want to add to the worksheet.
<Items list>Use this list to see the items available for use in the worksheet, and to add and remove items to and from the worksheet. You can also use options on the Available Items toolbar to create new items (e.g. new calculations or conditions) and edit existing items. For more information about options on the Available Items toolbar, see "Available Items pane".
Hint: To locate an item quickly when the focus is on the <Items list>, type the first letter of the item or folder that you want to locate. The next item or folder beginning with the typed letter is highlighted. For example, type 'r' to locate the Region item.
Click the plus (+) and minus (-) buttons next to folders and items to expand and collapse them.
To add an item to the worksheet, do one of the following:
■ drag and drop an item from the Items tab into the worksheet area
■ drag and drop an item from the Items tab into the Selected Items pane (if displayed)
■ select an item and click the Add to Worksheet button on the Available Items toolbar (for more information, see "Available Items pane").
■ right-click on an item and select Add to Worksheet from the right-click menu
■ drag and drop an item from the Available Items pane to the Selected Items pane (if both panes are displayed)
To edit or remove an item, do one of the following:
■ select an item and click the Edit button on the Available Items toolbar (for more information, see "Available Items pane").
Available Items pane: Items tab
23-10 Oracle Business Intelligence Discoverer Plus User’s Guide
■ select an item and click the Remove from Worksheet button on the Available Items toolbar (for more information, see "Available Items pane").
To select more than one item at a time, hold down the control key (Ctrl) when you select items. Items currently displayed on the worksheet are marked with a tick symbol (or check mark).
For descriptions of icons used in the <Items list>, see "About icons used in the Discoverer item navigator".
Band by Rank dialog
Dialog reference 23-11
Band by Rank dialog
Use this dialog to create a band by rank calculation. A band by rank calculation creates a number of bands (e.g. quartiles) and places each value into one of the bands according to its ranked list position. In other words, each band contains the same number of values. For example, if you have 1000 values you might want to create four bands (i.e. quartiles), each containing 250 values.
Note: If you want to analyze the distribution of values, you might want to use a band by value calculation instead (for more information, see "Band by Value dialog").
For more information, see:
"What are analytic functions?"
"How to create a new calculation using an analytic function template"
"Banding function examples"
Number of bandsUse this field to enter the number of bands into which you want to assign values. For example, type 4 to assign values into quartiles.
Rank based onUse this drop down list to choose the item for which want to calculate the rank. For example, to calculate the relative position of sales outlets based on sales, you might choose Sales SUM.
Use the adjacent drop down list to specify the ranking order. For example, you might choose Highest Value Ranked 1 if you want sales outlets with the highest sales to be in band 1.
Then rank based onUse this drop down list to choose an item for which you want to calculate a secondary rank, which is used to determine the rank when two values have the same primary rank (i.e. based on the item specified in the Rank based on field).
Use the adjacent drop down list to specify the ranking order. For example, you might choose Lowest Value Ranked 1 if you want sales outlets with the highest sales and the lowest costs to have the highest ranked list positions.
Restart banding at each change inUse this list to specify which groups to use if you want to arrange results into groups (sometimes referred to as partitions).
For example, if you want quartiles for each year, you might choose Calendar Year. In other words, if you have Sales SUM values spanning two years, you will have four bands for each year.
If you do not specify a group, Discoverer treats all worksheet values as a single group.
CalculationThis read-only field displays the underlying formula that you are building as you specify values for the fields above. This formula is updated each time you change one of the values in the fields above. When you click OK, the formula is transferred to the Calculation field in the "New Calculation dialog" or the "Edit Calculation dialog".
Band by Value dialog
23-12 Oracle Business Intelligence Discoverer Plus User’s Guide
Band by Value dialog
Use this dialog to create a band by value calculation. A band by value calculation creates a number of bands (sometimes referred to as buckets) and places each value into one of the bands according to the value. In other words, each band can contain a different number of values. For example, you might want to know how sales values are distributed over bands $0 to $49, $50 to $99, $100 to $150.
This type of analysis is sometimes referred to as frequency distribution.
Note: If you want to create bands containing an equal number of values (e.g. quartiles), you might want to use a band by rank calculation instead (for more information, see "Band by Rank dialog").
For more information, see:
"What are analytic functions?"
"How to create a new calculation using an analytic function template"
"Banding function examples"
Number of bandsUse this field to enter the number of bands into which you want to assign values. For example, type 4 to assign values into four bands.
Note: The range of each band is calculated as the maximum value in the group minus the minimum value in the group divided by the number of bands.
You can override the default maximum and minimum values using the Highest value and Lowest value fields.
Band values ofUse this drop down list to specify which worksheet values you want to put into bands. For example, choose Sales SUM to divide sales totals into a number of bands.
Use the adjacent drop down list to specify the banding order. For example, you might choose Highest Value in Band 1 if you want stores with the highest sales to be in band 1.
Lowest valueUse this field to specify a minimum value that is different from the minimum value in the group. You must clear the Use minimum value check box to activate the Lowest value field.
For example, you might have a wide range of sales figure with a minimum value that is exceptionally low. You might want to exclude the exceptionally low value from the lowest band.
If you select the Use minimum value check box, Discoverer specifies the minimum value for you.
Highest valueUse this field to specify a maximum value that is different from the maximum value in the group. You must clear the Use maximum value check box to activate the Highest value field.
Band by Value dialog
Dialog reference 23-13
For example, you might have a wide range of sales figures with a maximum value that is exceptionally high. You might want to exclude the exceptionally high value from the highest band.
If you select the Use maximum value check box, Discoverer specifies the maximum value for you.
Restart banding at each change inUse this list to specify which groups to use if you want to arrange results into groups (sometimes referred to as partitions).
For example, to analyze the distribution of sales across each year, you might choose Calendar Year. In other words, if you have Sales SUM values spanning two years, you will have a set of bands for each year.
If you do not specify a group, Discoverer treats all worksheet values as a single group.
CalculationThis read-only field displays the underlying formula that you are building as you specify values for the fields above. This formula is updated each time you change one of the values in the fields above. When you click OK, the formula is transferred to the Calculation field in the "New Calculation dialog" or the "Edit Calculation dialog".
Calendar dialog
23-14 Oracle Business Intelligence Discoverer Plus User’s Guide
Calendar dialog
Use this dialog to specify a date value or values. For example, to analyze sales on a particular day you might use this dialog to specify the day for a worksheet parameter.
Alternatively, you can close this dialog and type a date directly into the date field, or manually edit an existing date in the date field.
<Year area>Use this area to select a year.
<Month area>Use this area to select a month.
<Date area>Use this area to select a date (or a set of dates).
Notes■ If the list of allowable dates is restricted, some areas of the calendar might be
grayed out.
■ If multiple dates are allowed, you can also use the multi-select keys available (platform dependent) to select more than one date or range of dates. For example:
■ To select more than one date, press the Ctrl key and click another date.
■ To select a range of adjacent dates, click on the first date in a range, press the [Shift] key, then click on the last date in the range. All dates between the two are selected.
■ To select more than one range of dates. do the following:
a. Click on the first date in a range, press the [Shift] key, then click on the last date in the range.
All dates between are selected.
b. Release the [Shift] key and press the [Ctrl] key.
c. Click on the first date in the next range, press the [Shift] key, then click on the last date in the range.
All dates between are selected in addition to the existing ranges selected.
Choose a responsibility dialog
Dialog reference 23-15
Choose a responsibility dialog
Use this dialog to choose which responsibility you want to connect as when you connect to Discoverer as an Oracle Applications user. Discoverer displays this dialog when the Oracle Applications username that you are using has more than one responsibility assigned to it.
For more information, see:
"What are Oracle Applications?"
You can connect as any of the following responsibilities. Please choose one.Use this list to select the responsibility that you want to connect as.
Notes■ For more information about responsibilities available in your organization, contact
the Discoverer manager.
Color Chooser dialog
23-16 Oracle Business Intelligence Discoverer Plus User’s Guide
Color Chooser dialog
Use this dialog to create a custom color to use in the worksheet that you are editing. For example, you might want to use a color that is not part of the default set of colors available in Discoverer.
Custom colors that you create are available to all worksheets in the current workbook, and are displayed on the Custom Colors pane on the "Color Palette Editor dialog".
You create a custom color in one of the following ways:
■ using the Color Selector pane to select a color from the color spectrum
■ using the HTML Hex field to enter the hexadecimal number of the color you want to create
■ using the R, G, B fields to enter the red, blue, and green (RGB) number of the color you want to create, and the and Hue, Sat, and Bri fields to specify hue, saturation, and brilliance settings
For more information, see:
"Color Palette Editor dialog"
Color SelectorUse this pane to select a color by to placing the X marker in an area of the color spectrum. You can also change the brilliance and hue of a color by dragging the arrow up and down the color bar to the right of the Color Selected pane.
Original ColorThis pane displays the original color of the selected color button. Click this pane to revert to the original color.
Selected ColorThis pane displays the selected color, as specified in the Color Selected pane, HTML Hex field, or RGB settings.
HTML HexUse this field to view or enter the hexadecimal value of a color. For example, #C0C0C0 is the hexadecimal value for the color Silver.
Note: Silver is one of the 16 colors in the basic Windows VGA color palette.
Hint: Hexademimal color numbers must be prefixed with the hash symbol (#).
Refer to any HTML reference manual for more information about hexadecimal color values.
R,G,BUse these fields to view or enter the red (R), green (G), and blue (B) values of a color. For example, 255, 255, 255 is the RGB value for the color white.
Refer to any HTML reference manual for more information about RGB color values.
Color Chooser dialog
Dialog reference 23-17
HueUse this field to specify a color hue (or shade) value. For example, you might want to make a dark blue color warmer (e.g. to a purple shade) or cooler (e.g. to a light blue shade). You can also change the brilliance and hue of a color by dragging the arrow up and down the color bar to the right of the Color Selected pane.
SatUse this field to specify a color saturation (or intensity) percentage value.
BriUse this field to specify a color brilliance (or brightness) percentage value. You can also change the brilliance and hue of a color by dragging the arrow up and down the color bar to the right of the Color Selected pane.
Color Palette Editor dialog
23-18 Oracle Business Intelligence Discoverer Plus User’s Guide
Color Palette Editor dialog
Use this dialog to select a color for the worksheet component that you are editing. For example, you might want to select the text color for a worksheet item.
For more information, see:
"How to change the format of worksheet items"
This dialog is also displayed as:Plot Area Color dialogSeries Color dialog
Available ColorsUse this pane to select a color from the default set of colors available in Discoverer. To select a color, click once on a color button and click OK.
Custom ColorsUse this pane to select a custom color that you might have created by clicking Edit Custom Color. To select a custom color, click once on a color button and click OK. To create a new custom color, select a color button and click Edit Custom Color to display the "Color Chooser dialog".
Edit Custom ColorUse this button to display the "Color Chooser dialog", which enables you create a custom color.
This button is only active if you have first selected one of the buttons in the Custom Colors pane above.
TransparentUse this button to remove the graph’s current plot area color and make the plot area transparent.
Note: This button is only available when you edit the color of the plot area on a graph (i.e. on the Plot Area Color dialog).
Notes■ The tooltip for color buttons shows the red, blue, and green (RGB) value for a color
(for more information about RGB values, see "Color Chooser dialog").
Choose Worksheet dialog
Dialog reference 23-19
Choose Worksheet dialog
Use this dialog to choose a worksheet to display to when you are creating a drill link to a worksheet. For example, if you want to create a drill link from a worksheet item to a worksheet called Sales Details, you use this dialog to select the Sales Details worksheet.
For more information, see:
"What are worksheets?"
"About user defined drill links"
ViewUse this list to specify the type of workbooks you want to display in the Workbooks list. For example, you might choose My Workbooks to display only workbooks owned by the database user that you are logged in as.
<View as button>Use this drop down list to select how to view the Workbooks list. For example, you might choose the User Tree option to display workbooks grouped by database user.
Name containsUse this field to restrict the Workbooks list to those workbooks with names that contain the character(s) that you specify. For example, enter 'January' to display only those workbooks with names that contain January in the Workbooks list.
ClearUse this button to clear any text in the Name contains field and display the names of all workbooks in the Workbooks list.
WorkbooksUse this list to select the workbook and worksheet that you want to display when a drill link is selected. First select a workbook (represented by a book icon). To display worksheets in a workbook, click the + icon next to the workbook. Select a worksheet in a workbook to create a drill link to that worksheet.
Hint: Click on a column name to sort the Workbooks list on that column. Click on the arrow in a column name to reverse the sort order. You can also re-position and re-size the columns.
DescriptionThis field displays additional information about the workbook, which was entered using the "Workbook Properties dialog". Use this information to help you decide which workbook you want to analyze. This area is blank if no description is available.
Hint: To add or edit the description, update the workbook’s properties (for more information, see "How to view and update a workbook’s properties").
SelectUse this button to create a drill link to the worksheet currently selected in the Workbooks list.
Column Width dialog
23-20 Oracle Business Intelligence Discoverer Plus User’s Guide
Column Width dialog
Use this dialog to specify the column width of the currently selected worksheet item in centimetres, inches, or pixels. For example, you might want to reduce the width of a column to fit a worksheet onto a printed page.
If the content of a column is too wide to fit in the specified width, Discoverer does the following:
■ If a numeric value is too large to display in a column, Discoverer displays a value truncated with ellipses (...). For example, if you set the Column Width value to 1 cm (with text right aligned), the value '$1000.00' is displayed as '...00.00' both on screen and on the printed page. The text alignment determines whether ellipses are added before or after the number.
■ If an item heading or text value fit is too large to display in a column, Discoverer truncates the text. For example, if you set the Column Width value to 1 cm, the value 'VIDEO STORES' is displayed as 'VIDE' both on screen and on the printed page.
Auto sizeUse this check box if you want Discoverer to set the column width for you (typically using the width of the largest column heading or cell value).
Hint: To select auto size for multiple worksheet items, select the items in the worksheet data area and choose Format | Columns | Autosize.
Column WidthUse these fields to specify the width of the currently selected column in either pixels, centimetres, or inches. For example, you might want the column to be 90 pixels wide. These fields are only active when the Auto size check box is cleared.
Notes■ Discoverer automatically sets the column width on crosstab worksheets (i.e. the
Format | Columns | Width and Auto size menu options are grayed out for crosstab worksheets).
■ 1 inch is equivalent to 2.54 centimetres and 72 pixels.
■ To control whether column headings are displayed on the current worksheet, choose Tools | Options to display the Options dialog, display the "Options dialog: Sheet tab", and use the Show column headings check box.
■ Discoverer exports item values in full, even if the values are truncated on screen and on the printed page as a result of adjustments to the column width. For example, if you set the Column Width value to 1 cm, the value 'VIDEO STORES' is exported as 'VIDEO STORES’ even if it is displayed as 'VIDE' on screen and on the printed page.
Conditional Formats dialog
Dialog reference 23-21
Conditional Formats dialog
Use this dialog to manage conditional formats and stoplight formats. For example, you might want to activate a conditional format that highlights costs that are greater than 100,000.
For more information, see:
"What is a stoplight format?"
"What is a conditional format?"
"About managing conditional formatting"
"Examples of conditional formatting"
List formats forUse this list to specify the conditional formats you want to show in the <Conditional formats list>. For example, you might want to show only active conditional formats and stoplight formats.
<Conditional formats list>Use this list to see the existing conditional formats and stoplight formats that are available, and to select and edit formats.
Hint: Use the check box in the Active column to activate and deactivate a format. You cannot have an active conditional format and an active stoplight format on the same worksheet item at the same time.
Note: A red cross symbol is displayed next to a conditional format if it conflicts with another active conditional format. To resolve the conflict, either deactivate or delete one of the format that have a red cross next to them (for more information, see "About managing conditional formatting").
New Conditional FormatUse this button to display the "New Conditional Format dialog", which enables you to create a new conditional format to highlight worksheet values.
New Stoplight FormatUse this button to display the "New Stoplight Format dialog", which enables you to create a new stoplight format to categorize worksheet values.
Edit FormatUse this button to display either the Edit Conditional Format dialog or the Edit Stoplight Format dialog, which enable you to edit the currently selected format in the <Conditional formats list>.
Delete FormatUse this button to remove the currently selected format in the <Conditional formats list> from the worksheet.

Conditional Formats dialog
23-22 Oracle Business Intelligence Discoverer Plus User’s Guide
Edit Stoplight ColorsUse this button to display the "Stoplight colors dialog", which enables you to change the default color of unacceptable, acceptable, and desirable values for new and existing stoplight formats in the current worksheet.
DescriptionThis field displays additional information about the format. Use this information to help you decide which format you want to use. The default description is the condition part of the exception format syntax (e.g. Profit SUM > 10,000).
Confirm Threshold dialog
Dialog reference 23-23
Confirm Threshold dialog
Use this dialog to resolve overlaps in stoplight format categories that you are trying to create. For example, if you enter the same value in both the Unacceptable and the Desirable fields, Discoverer uses this dialog to prompt you to specify a threshold for the Desirable category.
For more information, see:
"What is a stoplight format?"
"Notes on using conditional formats and stoplight formats"
Desirable Values areUse these radio buttons to choose which threshold (or limit) you want to specify for the desirable category. For example, if you enter the 5000 in both the Unacceptable and the Desirable fields, you are prompted to specify whether Desirable values are greater than 5000 or less than 5000.
Data Format dialog (Default Options)
23-24 Oracle Business Intelligence Discoverer Plus User’s Guide
Data Format dialog (Default Options)
Use this tab to change the default text style for new worksheet items.
Note: Changing the default text style does not change the text style for existing worksheet items. Choose Format | Item Formats to change the format of existing worksheet items.
For more information, see:
"About Discoverer worksheet types"
FontUse this drop down list to specify a text font.
SizeUse this drop down list to specify a font size.
StyleUse this drop down list to specify a font style (for example bold, italic, underlined, or sans-serif).
Color
TextUse this color pane to specify a color for the item text.
AlignmentUse these buttons to set the horizontal text alignment (where applicable).
Actual font sizeUse this check box to display text in the example area in the font size and style selected.
Data/graph pane
Dialog reference 23-25
Data/graph pane
Use this pane to edit the worksheet and graph (if displayed). For example, you might want to rearrange worksheet items, sort worksheet items, or create a worksheet title.
For more information, see:
"Getting started"
"Analyzing data"
"Sharing results with others"
"About editing worksheets"
"About Discoverer’s drag and drop features"
You can edit the worksheet as follows:
■ to rearrange a worksheet item, click on the worksheet item heading and drag and drop the item to the required position
■ to drill into data, use drill icons (for more information, see "About drilling in Discoverer worksheets")
■ to display right-click options for a worksheet cell, right-click on the cell (e.g. format a worksheet item, sort data, drill).
■ to display right-click options for a graph element, right click on the element (e.g. edit the graph style or set the background color).
■ to display a different worksheet, click another tab at the bottom of the Data/graph area (if available)
Delete Scheduled Workbook Results dialog
23-26 Oracle Business Intelligence Discoverer Plus User’s Guide
Delete Scheduled Workbook Results dialog
Use this dialog to see which scheduled workbook results sets will be removed permanently from the database. These scheduled workbook results sets are produced when scheduled workbooks are processed, according to the schedule defined. For example, a daily report is produced once per day.
For more information, see:
"What are scheduled workbooks?"
"About how scheduled workbooks are processed"
The scheduled workbook results below will be deleted:Use this list to look at which workbook results will be deleted, and the date and time that the workbook results will be deleted.
Don’t show this window again, and delete results automatically on exit.Use this check box when you want Discoverer to delete expired workbook results automatically without displaying this dialog.
Notes■ The Delete results after _ days field on the "Schedule Wizard dialog: Schedule
tab" is used to specify when to delete results.
■ Unless a scheduled workbook is configured to run only once, a new set of results will be recreated when the workbook is next processed according to the schedule defined. For example, a weekly report will be processed in the following week.
Delete Workbooks from Database dialog
Dialog reference 23-27
Delete Workbooks from Database dialog
Use this dialog to remove workbooks that you no longer need. You cannot undo this procedure to retrieve deleted workbooks. Before removing workbooks, check that workbooks are not being used by other Discoverer users.
For more information, see:
"What are workbooks?"
Choose workbooks to deleteUse this list to specify which workbooks to delete.
DeleteUse this button to remove the selected workbooks permanently from the Discoverer database.
Notes■ If you delete the workbook that you currently have open, the workbook is
removed from the database but remains in your Discoverer session. Close the workbook without saving if you no longer need the workbook.
■ You can select more than one workbook by pressing the Ctrl key and clicking another workbook.
Difference dialog
23-28 Oracle Business Intelligence Discoverer Plus User’s Guide
Difference dialog
Use this dialog to create a difference calculation. A difference calculation typically calculates the change in values across time. For example, you might want to calculate the change in sales from the previous month.
This type of analysis is sometimes referred to as LAG/LEAD analysis.
Note: If you want to calculate the change in value over time as a percentage, use the Percent Difference calculation (for more information, see "Percent Difference dialog").
For more information, see:
"What are analytic functions?"
"Examples of using row-based and time-based intervals"
"How to create a new calculation using an analytic function template"
"LAG/LEAD function examples"
Compare values ofUse this drop down list to choose which item you want to analyze. For example, you might choose Sales SUM to calculate the change in sales totals over time.
Preceding valueUse this drop down list to specify the number of rows or the number of time periods in which you want to compare the values. For example, you might choose '3' to calculate the difference in sales compared to three months previously.
Use the adjacent drop down list to choose a row-based interval or a time-based interval. For example, you might choose 'Months Before Current Value' to compare sales values with earlier sales values.
Hint: If you have time-based data, use time-based groups (e.g. Days/Weeks/Months Before Current Value). If you do not have time-based data, use row-based groups (e.g. Rows Before Current Value). For more information about types of group, see "About windowing".
For examples of specifying row-based and time-based intervals, see "Examples of using row-based and time-based intervals".
Order rows byUse this drop down list to specify how to order the worksheet values. For example, you might choose Calendar Month to compare sales with the previous months sales.
Use the adjacent drop down list to specify whether to order values in ascending order (i.e. Lowest to Highest) or descending order (i.e. Highest to Lowest).
Hint: If you have specified a time-based group in the Preceding value drop down list, specify a time-based item (e.g. Calendar Month) in the Order rows by field.
Then order rows byUse this drop down list to specify a secondary order for the values. For example, you might choose City to sort values on city within month. Then use the adjacent drop down list to specify whether to order values in ascending order (i.e. Lowest to Highest) or descending order (i.e. Highest to Lowest).
Difference dialog
Dialog reference 23-29
Note: This drop down list is only enabled if you specified a row-based group in the Preceding value drop down list. This drop down list is only disabled if you specified a time-based group in the Preceding value drop down list.
Restart calculation at each change inUse this list to specify which groups to use if you want to arrange results into groups (sometimes referred to as partitions).
For example, to calculate the difference in Sales SUM values within year, you might choose Calendar Year.
If you do not specify a group, Discoverer treats all worksheet values as a single group.
CalculationThis read-only field displays the underlying formula that you are building as you specify values for the fields above. This formula is updated each time you change one of the values in the fields above. When you click OK, the formula is transferred to the Calculation field in the "New Calculation dialog" or the "Edit Calculation dialog".
Notes■ A difference calculation will return a null value if there is no preceding value with
which to compare.
Drill dialog
23-30 Oracle Business Intelligence Discoverer Plus User’s Guide
Drill dialog
Use this dialog to drill from anywhere in the current worksheet to one of the following:
■ a different level of data (e.g. from Year to Month)
■ a related item (e.g. from Sales SUM to Store)
■ a level of detail set up by the Discoverer manager (e.g. from Year to all items in the Product folder)
■ another worksheet or Internet page
For more information, see:
"About drilling in Discoverer worksheets"
Where do you want to drill from?Use this drop down list to select the worksheet item that you want to drill from. For example, if you want to drill down from year to month, you might select an item called Year.
Where do you want to drill to?Use this drop down list to select the type of drill you want to do. Use this drop down list as follows:
■ select Drill Up/Down and select an item from the list below to drill to a different level in a drill hierarchy (e.g. to drill from Year to Month)
■ select Drill to a Related Item and select a worksheet item from the list below to add related information to the worksheet (e.g. to drill from Sales SUM to Store)
■ select Drill to Detail and select a worksheet item from the list below to drill to a different level of detail (e.g. from Year to all items in the Product folder)
■ select Drill to Link and select a worksheet item from the list below to drill to a worksheet or Internet page
<List of drill targets>Use this list to select the target item, folder, or link you want to drill to. For example, if you select Drill Up/Down in the Where do you want to drill to? field, you might select Month to drill down to monthly sales data.
Show Advanced/Hide AdvancedUse this button to display or hide the advanced drill options.
Expand sheet to include new itemUse this radio button to add the drilled item to the worksheet. For example, if you want to drill from Year to Month, select this option to add the Month item to the worksheet.
Replace current itemUse this radio button to remove the currently selected item from the worksheet and display the drilled item instead. For example, if you drill from Year to Month, select

Drill dialog
Dialog reference 23-31
this option to remove the Year item from the worksheet and display the Month item instead.
Place drill results in a new sheetUse this check box when you want Discoverer to create a new worksheet to display the results of the drill.
■ Table
Use this radio button when you want Discoverer to create a new table worksheet to display the results of the drill.
■ Crosstab
Use this radio button when you want Discoverer to create a new crosstab worksheet to display the results of the drill.
Edit Calculation dialog
23-32 Oracle Business Intelligence Discoverer Plus User’s Guide
Edit Calculation dialog
Use this dialog to change the way that the currently selected calculation item behaves. For example, to changes its name, description, or formula.
For more information, see:
"What are calculations?"
"Simple calculation examples"
"Oracle analytic function examples"
What do you want to name this calculation?Use this field to enter a descriptive name for the calculation item. This name is displayed in calculation lists and on worksheets as the column header of the calculation results column. If you leave this box blank, Discoverer creates a default name for you.
ShowUse this drop down list to display calculations, functions, items and parameters that you can use to build a calculation. To include items in the calculation, paste them into the Calculation field.
Use the Show list options as follows:
■ Use the Functions option to display an extensive list of predefined Oracle functions.
■ Use the Selected option to display items in the worksheet.
■ Use the Available option to display all items in the business area.
■ Use the Calculations option to display existing worksheet calculations.
■ Use the Parameters option to display existing worksheet parameters. When you add parameters to the Calculation field, the parameter name is prefixed with ':' to indicate that it is a dynamic value set by the worksheet user. For more information about adding parameters to calculations, see "About using parameters to collect dynamic user input".
PasteUse this button to the add the item currently selected in the Show list to the Calculation. The item is copied into the Calculation field.
CalculationUse this field to enter the calculation details (for calculation examples, see "Discoverer calculation examples").
Note: When you add text to this field using the Paste button or a template, the text is appended to any existing text in the Calculation field, unless text in the Calculation field is selected.
To create a calculation, you one or more of the following methods:
■ Type the formula directly into the Calculation field.
Note: If you type an expression in the Calculation field, you must prefix the expression with an equals sign (i.e. =). For example, '=Sales SUM-Costs SUM'.
Edit Calculation dialog
Dialog reference 23-33
■ Paste items and functions from the Show field into your calculation.
■ Click the operator buttons underneath the Calculation field to use them in the calculation.
■ Use a template to help you define an analytic function. Click Insert Formula from Template (see Insert Formula from Template field below).
Insert Formula from TemplateUse this button to display a pop-up list of templates that you can use to build analytic functions. For example, choose Rank to display an easy-to-use Rank template that helps you create a ranked list position calculation. For more information about templates available, see "What analytic function templates are available in Discoverer?". When you use a template, the formula that you create is appended to any existing text in the Calculation field, unless text in the Calculation field is selected.
Operator buttons [+] [-] [x] [/] [%] [(] [)] [||]Use these buttons to add operators to the calculation. Operators are copied into the Calculation field.
Note: When you use arithmetic expressions in a calculation, the multiply and divide operators are executed first, regardless of their position in the calculation. If you have more than one operator of the same precedence, they are evaluated from left to right.
For example, the calculation Price – Discount * Quantity is evaluated as Discount*Quantity subtracted from Price. If you use parentheses around the subtraction expression (Price – Discount), the subtraction is executed before the multiplication.
OKUse this button to validate and save the calculation, as follows:
■ If the calculation has valid syntax, the calculation is saved and displayed in the Calculations dialog.
■ If the calculation has invalid syntax, an error message is displayed. You must correct any syntax errors before you can save the calculation.
Notes■ The table below shows the functions available in the box beneath the Show drop
down list.
Category Description
All Functions An alphabetical list of all functions.
Analytic Advanced statistical analysis, such as RANK, NTILE, CORR.
Conversion Converting from one data type to another, such as: RAWTOHEX, TO_CHAR, TO_DATE.
Database Optional category that is displayed when user defined functions are available (created using the Register PL/SQL Functions facility on the Tools menu in Oracle Discoverer Administrator).
Date Manipulating date items such as ADD_MONTHS, NEW_TIME, SYSDATE and NEXTDATE.
Edit Calculation dialog
23-34 Oracle Business Intelligence Discoverer Plus User’s Guide
■ For detailed information about all functions available in Discoverer, see Oracle SQL Reference and Oracle Data Warehousing Guide.
■ For examples of the most commonly used functions, see "Discoverer calculation examples".
■ To correct a divide by zero error, modify the calculation to check for a zero-value in the denominator and return a value of zero (for the entire calculation). For example, Instead of (SS+PS)/(SS-PS), use DECODE ((SS-PS), 0, 0, ((SS+PS)/(SS-PS))).
Group Aggregate and statistical functions including SUM, COUNT, MAX, MIN, VARIANCE.
Numeric Numeric items and floating point such as COS, LOG, MOD, POWER.
Others Miscellaneous functions such as LEAST, USER, DECODE, ROWNUM.
String Character items, text operations such as INITCAP, LPAD, NLS_UPPER.
Category Description
Edit Condition dialog
Dialog reference 23-35
Edit Condition dialog
Use this dialog to change the way that the currently selected condition item behaves. For example, you might want to change its name, description, or the way that it filters data in the worksheet.
For more information, see:
"What are conditions?"
"About using conditions"
What would you like to name your condition?Use this field to enter a descriptive name for the condition item. This name is displayed in the condition list on the Conditions dialog.
Generate name automatically?Use this check box if you want Discoverer to create a default name for you. The default name is based on the condition syntax.
What description would you like to give your condition?Use this field to enter a brief description for the new condition. This description is displayed in the description box on the Conditions dialog and helps workbook users choose which condition they want to use.
FormulaThis area is where you build the condition. The condition can contain one or more condition statements.
Item Use this drop down list to filter the worksheet by selecting an item to match against. For example, to filter information about people whose salary is more than $30,000, you might choose an item called 'Salary' here.
You can also choose from the following options:
■ If you want to add an existing condition, choose Select Condition... to display the "Select Condition dialog".
■ If you want to insert a calculation to use in the condition formula, choose Create Calculation... to display the "New Calculation dialog".
ConditionThis drop down list displays a list of logical operators that you can use to match against the Item selected. For example, to filter information about people who earn more than $30,000, you might choose the 'greater than' operator (>) here.
For more information on logical operators available, see Notes below.
ValuesUse this field to enter (or select from the drop down list) one or more values that you want to use to match against the selected Item. For example, if you want filter information about people who earn more than $30,000, enter 30,000 here.
Edit Condition dialog
23-36 Oracle Business Intelligence Discoverer Plus User’s Guide
You can also choose from the following options:
■ If you want to match the selected item against a new calculation, choose Create Calculation to display the "New Calculation dialog".
■ If you want to match the selected item against an existing worksheet item, choose Select Item to display the "Select Item dialog".
■ If you want to match the selected item against a new worksheet parameter, choose New Parameter to display the "New Parameter dialog".
■ If you want to match the selected item against an existing parameter, choose Select Parameter to display the "Select Parameter dialog".
■ To specify a date using a graphical calendar, click the down arrow to the right of the field and choose Select From Calendar to display the "Calendar dialog".
■ If the Item has an LOV that is too long to display, choose Select Multiple Values to search for and select values using the "Select Values dialog".
Note: You can enter up to 254 values in this field. If you want to enter more than 254 values in the condition, click Advanced and use the OR option to add a new condition statement line for the extra values.
Hint: If you are entering a percentage value, enter the decimal value of the percentage. For example, enter '.5' for 50% (for more information, see Notes below).
Case sensitiveUse this check box to make the condition case sensitive when matching against text data. For example, if turned on, the value 'New York' would not find details containing 'NEW YORK'. If turned off, the value 'New York' would find details containing 'NEW YORK' and 'new york'.
AdvancedUse this button to expand the dialog box enabling you to apply multiple condition statements to an item. The expanded dialog displays New Item, And, Or, Delete and Undo buttons. A Group column is also added to the Formula box (see Group below).
Expanded Advanced options
New ItemUse this button to add a new condition statement line to the condition. By default, new condition statement lines are grouped with the logical AND operator. In other words, the data must satisfy both condition statements to be filtered in the worksheet (see Group below).
AndUse this button to add a new condition statement line to the condition and group it with the previous condition statement line with a logical AND operator. Using 'AND' narrows a search to display only items that match all criteria. For example, with two condition statements, data must match condition statement one and condition statement two.
OrUse this button to add a new condition statement line to the condition and group it with the previous condition statement line with a logical OR operator. Using 'OR' widens a search to display items that match any of the criteria. For example, with two
Edit Condition dialog
Dialog reference 23-37
condition statements, data must match either condition statement one or condition statement two. (In SQL terms, this is an inclusive OR clause.)
DeleteUse this button to remove the currently selected condition statement line from the condition.
UndoUse this button to retrieve the deleted condition details if you delete a condition statement line from the condition and then change your mind.
Group
ANDUse this button to change the Group operator to a logical ‘AND’. You must have the current Group item selected. Using 'AND' narrows a search to display only items that match all criteria in the group.
ORUse this button to change the Group operator to a logical 'OR'. You must have the current Group item selected. Using 'OR' widens a search to display items that match any of the criteria in the group.
NOT ANDUse this button to change the Group operator to a logical 'NOT AND' operator.
NOT ORUse this button to change the Group operator to a logical 'NOT OR' operator.
Notes■ The following table describes logical operators available when matching data
against items.
Operator Meaning How it is used
= equals Year = 2001
Display only data for the year 2001.
<> Not equals Year <> 2001
Display data where the year is not 2001
> Greater than
Clicks > 10
Display data where the number of clicks on a website is more than 10
< Less than Salary < 50,000
Display data for people who earn less than 50,000
LIKE Similar to Employee_name LIKE CH%
Display data for employees whose name begins with CH.
Edit Condition dialog
23-38 Oracle Business Intelligence Discoverer Plus User’s Guide
■ If you are creating a condition that filters a Percent Rank or Percentage Contribution calculation, you need to enter the percentage value as a decimal value. For example, if you want to find values in the top 50%, you enter '.5' in the Values field, not '50'.
This is because the underlying worksheet values are decimals, not integers. Discoverer applies the whole number formatting to the decimal values.
IN Equal to any member of
WHERE job IN ('CLERK','ANALYST');
Operator Meaning How it is used
Edit Graph dialog: Font dialog tab
Dialog reference 23-39
Edit Graph dialog: Font dialog tab
Use this tab to change the text styles on a graph. For example, you might want to specify a different font for the graph title or axis title.
Note: The fields that you use to specify font details depend on the graph type selected.
For more information, see:
"About components of a Discoverer graph"
FontUse this drop down list to specify a text font.
SizeUse this drop down list to specify a font size.
StyleUse this drop down list to specify a font style (for example bold, italic, underlined, or sans-serif).
ColorUse this button to display a color pane that enables you to change the color of the item.
TextUse this color pane to specify a color for the item text.
AlignmentUse these buttons to set the horizontal text alignment (where applicable).
Show Actual font sizeUse this check box to display text in the example area in the font size and style selected.
OrientationUse the orientation buttons to rotate axis tick labels or axis titles to the best position. For example:
■ 0 degrees positions an X-axis title horizontally (to flip the title horizontally, choose 270 degrees)
■ 0 degrees positions a Y-axis title vertically (to flip the title vertically, choose 270 degrees)
Note: This option is not available for the X-axis title or the legend.
Edit Graph dialog: Legend tab
23-40 Oracle Business Intelligence Discoverer Plus User’s Guide
Edit Graph dialog: Legend tab
Use this dialog to control the appearance of the graph legend. The graph legend (sometimes called a key) explains how worksheet data is represented on a graph. For example, you might want to display a legend to explain which colors represent which worksheet items plotted on a graph.
This dialog is also displayed as:Edit Graph dialog: Legend page
For more information, see:
"About using graphs in Discoverer"
"About components of a Discoverer graph"
Note: The graph type that you have selected determines which fields are displayed. Not all fields might be described on this help page.
Show LegendUse this check box to display or hide the legend. This check box controls how the legend is displayed on screen and when the graph is printed or exported.
LocationUse this drop down list to change the position of the legend (e.g. above the graph or to the right of the graph). Select 'Automatic' if you want Discoverer to choose the best legend position for you.
Border colorUse this button to display or hide a color pane that enables you to change the color of the box surrounding the legend.
Background colorUse this button to display or hide a color pane that enables you to change the background color of the legend.
Legend FontUse this button to display the "Edit Graph dialog: Font dialog tab", which enables you to change the font style of the legend.
Edit Graph dialog: Pie Chart Options tab (column)
Dialog reference 23-41
Edit Graph dialog: Pie Chart Options tab (column)
Use this dialog to specify which data column you want to plot when you create a Pie Chart. For example, if the worksheet has the columns: Year, Sales, and Costs, you need to specify whether to plot Sales or Costs values.
This dialog is also displayed as:Edit Graph dialog: Pie Chart Options page (column)
For more information, see:
"About using graphs in Discoverer"
"About components of a Discoverer graph"
"Notes about creating pie graphs" to see an example worksheet configuration and chart.
Which column would you like to graph?Use this list to specify which worksheet column you want to represent on the pie chart.
For example, you might have a Crosstab worksheet with Region on the left axis and Profit SUM by Year on the top axis. If you select 'Columns' from the Graph series by: options on the "Edit Graph dialog: Titles, Totals, and Series tab", you might be able to select from Year options 2002, or 2003.
For more information about pie charts, see"Notes about creating pie graphs".
Edit Graph dialog: Pie Chart Options tab (row)
23-42 Oracle Business Intelligence Discoverer Plus User’s Guide
Edit Graph dialog: Pie Chart Options tab (row)
Use this dialog to specify which data column you want to plot when you create a Pie Chart. For example, if the worksheet has the rows: 1998, 1999, and 2000, you need to specify which of these you want to represent on the graph.
This dialog is also displayed as:Edit Graph dialog: Pie Chart Options page (row)
For more information, see:
"About using graphs in Discoverer"
"About components of a Discoverer graph"
"Notes about creating pie graphs" to see an example worksheet configuration and pie chart.
Which row would you like to graph?Use this list to specify which worksheet row you want to represent on the pie chart. For example, you might have a Crosstab worksheet with Region on the left axis and Profit SUM by Year on the top axis. If you select 'Rows' from the Graph series by: options on the "Edit Graph dialog: Titles, Totals, and Series tab", you might be able to select from Region options Central, East, or West.
For more information about pie charts, see"Notes about creating pie graphs".
Edit Graph dialog: Plot Area tab
Dialog reference 23-43
Edit Graph dialog: Plot Area tab
Use this dialog to specify how worksheet items are plotted on a graph. For example, you might want to set the background color of a graph, or specify the color of bars on a Bar graph.
Note: The fields that you use to specify a graph depend on the graph type selected.
This dialog is also displayed as:Edit Graph dialog: Plot Area page
For more information, see:
"About using graphs in Discoverer"
"About components of a Discoverer graph"
Note: The graph type that you have selected determines which fields are displayed. Not all fields might be described on this help page.
Background colorUse this button to display or hide a color pane that enables you to change the background color of the plot area.
Border colorUse this button to display or hide a color pane that enables you to change the color of the box surrounding the graph.
Show horizontal grid linesUse this check box to display or hide horizontal grid lines on the data plotting area of the graph. Horizontal grid lines enable you to compare graph values more accurately. When you select this check box, the adjacent drop down list and Color button become active, which enable you to change the line thickness and color of the line.
Note: You cannot change the line thickness of Polar graphs.
Show vertical grid linesUse this check box to display or hide vertical grid lines on the data plotting area of the graph. Vertical grid lines enable you to compare graph values more accurately. When you select this check box, the adjacent drop down list and Color button become active, which enable you to change the line thickness and color of the line.
Note: You cannot change the line thickness of Polar graphs.
Show data label on <graph item>Use this check box to display or hide data value labels on a graph. For example, you might want to display data values above the bars on a Bar graph. When you select this check box, the Options button becomes active, which enables you to change the label position and font style.
Note: This field is grayed out on 3D (i.e. three dimensional) graph types (e.g. Cube and Surface graph types).
Edit Graph dialog: Plot Area tab
23-44 Oracle Business Intelligence Discoverer Plus User’s Guide
Show data tips when mouse is over <graph item>Use this check box to display or hide pop-up labels when the cursor is pointing at areas of the graph. Pop-up labels make it easier to identify areas of the graph. When you select this check box, the Options button becomes active, which enables you to change the label settings. For example, you might want to display the series name (e.g. Sales SUM) and the value (e.g. 30,000) when you move the cursor over plotted values.
Show data markers on the lineUse this check box to display or hide marker shapes (e.g. circle, square, triangle) on the graph to identify which worksheet items relate to which line.
Note: This check box is only displayed for Line and Pareto graphs.
Select options for the series displayed on your graphUse this table to specify how worksheet items are displayed on the graph.
■ The Series column displays the names of worksheet items that are being plotted on the graph. Depending on the type of graph being created, you can select options for each series for some of the following:
■ a color pane in the Color column for changing the series color
■ a drop down list of line thicknesses in the Line column for changing the plot line weight (e.g. for the plot line on Line graphs)
■ a drop down list of marker shapes in the Marker column for changing the graphical symbol for series (e.g. for the plot area on Scatter graphs)
■ a drop down list of axes in the Y-Axis column for specifying which worksheet items are displayed on which series (e.g. on Dual-Y type graphs)
■ a fitline in the Fitline column to display for the series. Fitlines show trends or provide a simplified explanation of the data.
■ a type or marker to represent the data values for a combination graph in the Graph as column.
■ Use the individual series rows to specify how individual worksheet items are displayed on the graph. For example, you might have a row named Volume for specifying how the Volume worksheet item is displayed.
■ Use the All Series row to specify how all worksheet items are displayed on the graph.
Hint: Select Automatic in the Color column or Auto in the Marker column if you want Discoverer to format these attributes for you.
Notes■ The Marker column is not shown for Bubble graphs (i.e. markers in Bubble graphs
are always circular).
■ You cannot change the series options for some graph types (e.g. Surface graphs).
■ When you create a Polar graph, the following field changes apply:
■ the Show horizontal grid lines check box is displayed as Show circular grid lines
■ the Show vertical grid lines check box is displayed as Show radial grid lines
Edit Graph dialog: Style tab
Dialog reference 23-45
Edit Graph dialog: Style tab
Use this dialog to change the default style for the graph, which applies a predefined set of color tones and text styles to the graph. For example, graph styles available include Autumn, Financial, Executive, Black and White. Graph styles enable you to apply a consistent look and feel to graphs.
This dialog is also displayed as:Edit Graph dialog: Graph Style page
For more information, see:
"About using graphs in Discoverer"
"About components of a Discoverer graph"
StyleUse this drop down list to choose the graph style that you want to use (e.g. Autumn, Financial).
SampleThis area shows you how the graph will look when the selected graph style is applied.
Gradient EffectUse this check box to enhance the graph by varying the color shades. For example, you might want a blue bar on a bar graph to be shaded gradually from light blue to dark blue.
3-D EffectUse this check box to create a three-dimensional (3-D) version of the selected graph style.
Most graph sub-types have a three-dimensional effect that you can switch on and off as required (using the 3D-Effect check box on the Graph Styles dialog).
Note: 3D-Effect should not be confused with three-dimensional graphs, such as 3D-Cube and Surface, which are used to represent multi-dimensional data.
Edit Graph dialog: Titles, Totals, and Series tab
23-46 Oracle Business Intelligence Discoverer Plus User’s Guide
Edit Graph dialog: Titles, Totals, and Series tab
Use this dialog to configure a graph. For example, you might want to change a graph title or graph title font.
Note: The fields that you use to specify a graph depend on the graph type selected.
This dialog is also displayed as:Edit Graph dialog: Titles, Totals, and Series page
For more information, see:
"About components of a Discoverer graph"
Show titleUse this check box to display or hide the graph title defined in the field below. By default, the title is displayed above the graph.
InsertUse this button to add report information derived from dynamic values to the graph title (e.g. workbook name, current date, current time). These dynamic values are updated automatically when you display, print, or export a graph.
Title FontUse this button to display the "Edit Graph dialog: Font dialog tab", which enables you to change the font style of the graph title.
What would you like to display in your graph?Use these radio buttons to specify what data to include on the graph.
■ Data only
Use this radio button to display all worksheet data, when you want a full report.
■ Totals only
Use this radio button to display worksheet totals, when you want a summary only.
■ Both data and totals
Use this radio button to display the worksheet data and totals, where you want a full report with totals.
Show null values as zeroUse this check box to display null values (or empty data values) as zeros.
Graph series by (not Pie Chart style)Use these radio buttons to specify which items to put on the X-axis of a graph.
■ Columns
Use this radio button to put the first item on the worksheet on the X-axis (horizontal axis). The other items are series on the graph. In other words, their values are represented on the graph on the Y-axis (vertical axis).
■ Rows
Edit Graph dialog: Titles, Totals, and Series tab
Dialog reference 23-47
Use this radio button to represent the first item as a series on the graph. In other words, its value is represented on the graph on the Y-axis (vertical axis). The other values are placed on the X-axis (horizontal axis).
Graph series by (Pie Chart graph style)Use these radio buttons to specify which items to put on the X-axis of a Pie Chart (for more information about how to plot rows and columns in a Pie Chart, see "Notes about creating pie graphs").
■ Columns
Use this radio button to plot the values in the first column on the X-axis. In other words, the column’s values are represented on the pie chart as slices of the pie. When you select this radio button, use the Pie Chart Options button to display the "Edit Graph dialog: Pie Chart Options tab (column)", which enables you to change which item you use as the graph series.
■ Rows
Use this radio button to plot the values in the first row on the X-axis. In other words, the row’s values are represented on the pie chart as slices of the pie. When you select this radio button, use the Pie Chart Options button to display the "Edit Graph dialog: Pie Chart Options tab (row)", which enables you to change which item you use as the graph series.
Pie Chart OptionsUse this button to display the "Edit Graph dialog: Pie Chart Options tab (column)" or "Edit Graph dialog: Pie Chart Options tab (row)", which enable you to change which item you use as the graph series.
Edit Graph dialog: Type tab
23-48 Oracle Business Intelligence Discoverer Plus User’s Guide
Edit Graph dialog: Type tab
Use this dialog to choose what type of graph you want to create. For example, graph types available include pie charts, bar graphs, and line graphs.
This dialog is also displayed as:Edit Graph dialog: Graph Type page
For more information, see:
"About using graphs in Discoverer"
"About components of a Discoverer graph"
Note: The graph type that you have selected determines which fields are displayed. Not all fields might be described on this help page.
Graph typeUse this list to choose a graph type (or category). The Graph Subtype pane opposite displays graph styles of this type that you can choose from.
Graph SubtypeUse this area to choose a graph style from the sub-types available.
DescriptionThis area gives hints and tips on using the selected graph style.
Notes■ If you are editing an existing graph, you can also edit the graph using any of the
following methods:
■ Select the area of the graph that you want to edit, and use options on the graph menu bar to manipulate the graph area (for more information, see Section , "About Discoverer menus").
■ Select the area of the graph that you want to edit, right-click to display a graph menu of options for that area, and use the graph menu options to manipulate the graph area.
Edit Graph dialog: X-Axis tab
Dialog reference 23-49
Edit Graph dialog: X-Axis tab
Use this dialog to configure the X-axis (i.e. the horizontal axis) of a graph. For example, you might want to specify a title for the X-axis.
Note: The fields that you use to specify a graph depend on the graph type selected.
This dialog is also displayed as:Edit Graph dialog: X-Axis page
For more information, see:
"About using graphs in Discoverer"
"About components of a Discoverer graph"
Note: The graph type that you have selected determines which fields are displayed. Not all fields might be described on this help page.
Show X-Axis titleUse this check box to display or hide the X-axis title defined in the field below. By default, the title is displayed below the X-axis.
<Title field>Use this field to enter the title text for the axis.
InsertUse this button to add report information derived from dynamic values to the X-axis title (e.g. workbook name, current date, current time). These dynamic values are updated automatically when you display, print, or export a graph.
X-Axis Title FontUse this button to display the "Edit Graph dialog: Font dialog tab", which enables you to change the font style of the X-axis title.
Select options for line on the X-Axis■ Line thickness
Use this drop down list to change the weight of the X-axis line.
■ Line color
Use this button to display or hide a color pane that enables you to change the background color of the X-axis line.
Select options for the labels displayed on the X-AxisUse these radio buttons to specify how X-axis tick labels are displayed. Tick labels display graph scale information along the X and Y axes (e.g. 100, 200, 300).
For more information about X-axis tick labels, see "About components of a Discoverer graph".
■ Show labels for all tick marks on the axis
Use this radio button to display labels for all items on the X-axis. Select this option if you have a small number of tick mark labels to display.
Edit Graph dialog: X-Axis tab
23-50 Oracle Business Intelligence Discoverer Plus User’s Guide
■ Show labels for some tick marks on the axis
Use this radio button to display some X-axis tick mark labels but not others. Select this option if you have a large number of tick mark labels to display. When you select this radio button, the following fields become active:
■ Automatically skip labels to fit
■ Start with tick mark
■ Tick marks to skip between labels
Automatically skip labels to fitUse this radio button when you want to display only tick labels that fit on the graph without overlapping other labels.
Start with tick markUse this field to specify where to start the tick mark labels from. For example, type 3 to start from the third tick label from the left.
Tick marks to skip between labelsUse this field when you want to leave a gap between each tick mark label. For example, type 2 to leave a gap of two tick marks between each tick mark label.
(Scatter/Bubble and Circular graphs only) Set the scale you would like to use on this axisUse the following fields to change the scale of the X-axis.
■ Minimum
Use this field to change the lower axis range. Select the Set automatically check box if you want Discoverer to select the best range for you.
■ Maximum
Use this field to change the higher axis range. Select the Set automatically check box if you want Discoverer to select the best range for you.
■ Increment
Use this field to change the incremental axis range, or the granularity of the graph. Select the Set automatically check box if you want Discoverer to select the best range for you.
(Scatter/Bubble and Circular graphs only) Logarithmic scaleUse this check box to change the default linear scale of the X-axis to a logarithmic scale. When you select this check box, the adjacent Base drop down list becomes active, which enables you to change the default logarithmic base value.
You might use a logarithmic scale when you have numeric data that is widely spaced and you want to maintain the visibility of the smaller values. For example, if you had data ranging in value from 10 to 100,000 and you use the default linear scale, smaller values might not register on the graph. If you changed to a logarithmic scale of base 10, the smaller values would register on the graph.
Note: The e value in the Base drop down list is equal to 2.71 (sometimes referred to as a natural logarithm).
Edit Graph dialog: X-Axis tab
Dialog reference 23-51
(Scatter/Bubble and Circular graphs only) Reference LinesUse this button to display the Reference Lines dialog, which enables you to define up to three lines on a graph to emphasize particular data values on a graph. For example, you might add a reference line show the target sales value, to emphasize which regions achieved a target. For an example of a reference line on a graph, see "About components of a Discoverer graph".
Note: Reference lines on an X-Axis are typically used on circular graphs.
X-Axis Label FontUse this button to display the "Edit Graph dialog: Font dialog tab", which enables you to change the font style of the X-axis label.
Notes■ The following fields are grayed out for Polar graphs:
■ Show X-Axis title
■ Line thickness
■ The Set the scale you would like to use on this axis and Logarithmic scale fields are displayed when you are create a Polar graph, Scatter graph, or Bubble graph.
Edit Graph dialog: Y-Axis tab
23-52 Oracle Business Intelligence Discoverer Plus User’s Guide
Edit Graph dialog: Y-Axis tab
Use this dialog to configure the Y-axis (i.e. the vertical axis) of a graph. For example, you might want to specify a title for the Y-axis.
This dialog is also displayed as:Edit Graph dialog: Y-Axis pageEdit Graph dialog: Y1-Axis page (on dual-Y type graphs)Edit Graph dialog: Y2-Axis page (on dual-Y type graphs)
For more information, see:
"About using graphs in Discoverer"
"About components of a Discoverer graph"
Note: The graph type that you have selected determines which fields are displayed. Not all fields might be described on this help page.
Show Y1-Axis titleUse this check box to display or hide the Y-axis graph title defined in the box below. By default, the title is displayed to the left the Y-axis.
<Title field>Use this field to enter the title text for the axis.
InsertUse this button to add report information derived from dynamic values to the Y-axis title (e.g. workbook name, current date, current time). These dynamic values are updated automatically when you display, print, or export a graph.
Y1-axis Title FontUse this button to display the "Edit Graph dialog: Font dialog tab", which enables you to change the font style of the Y-axis label.
Select options for line on the Y1-Axis■ Line thickness
Use this drop down list to change the weight of the Y-axis line.
■ Line color
Use this color pane to change the color of the Y-axis line.
Set the scale you would like to use on this axisUse the following fields to change the scale of the X-axis.
■ Minimum
Use this field to change the default lower axis range. Select the Set automatically check box if you want Discoverer to select the best range for you.
■ Maximum
Use this field to change the default higher axis range. Select the Set automatically check box if you want Discoverer to select the best range for you.
Edit Graph dialog: Y-Axis tab
Dialog reference 23-53
■ Increment
Use this field to change the default incremental axis range, or the granularity of the graph. Select the Set automatically check box if you want Discoverer to select the best range for you.
■ Base line value
Use this field to specify a starting value for the Y-axis. For example, you might have a monthly sales target of 10,000 units and you want to emphasis how total sales for each month relate to the 10,000 target. In other words, on a vertical Bar graph you want to:
■ display monthly sales totals greater than 10,000 above the base line
■ display monthly sales totals less than 10,000 below the base line.
To achieve this graph layout you set the base line value to 10,000.
Note: The Base line value field is grayed out on the following types of graph:
■ Bubble
■ Scatter
■ Stock
■ Polar
■ stacked graphs (e.g. Bar graphs of sub-type Dual-Y Stacked)
■ percent graphs (e.g. Bar graph of sub-type Percent)
Note: If you are familiar with graphs in Microsoft Excel, changing the base line value is similar to setting the Category value in Microsoft Excel graphs.
Logarithmic scaleUse this check box to change the default linear scale of the X-axis to a logarithmic scale. When you select this check box, the adjacent Base drop down list becomes active, which enables you to change the default logarithmic base value.
You might use a logarithmic scale when you have numeric data that is widely spaced and you want to maintain the visibility of the smaller values. For example, if you had data ranging in value from 10 to 100,000 and you use the default linear scale, smaller values might not register on the graph. If you changed to a logarithmic scale of base 10, the smaller values would register on the graph.
Note: The e value in the Base drop down list is equal to 2.71 (sometimes referred to as a natural logarithm).
Reference LinesUse this button to display the Reference Lines dialog, which enables you to define up to three lines on a graph to emphasize particular data values on a graph. For example, you might add a reference line show the target sales value, to emphasize which regions achieved a target. For an example of a reference line on a graph, see "About components of a Discoverer graph".
Y1-Axis Label FontUse this button to display the "Edit Graph dialog: Font dialog tab", which enables you to change the font style of the Y-axis label.
Edit Graph dialog: Y-Axis tab
23-54 Oracle Business Intelligence Discoverer Plus User’s Guide
Notes■ Depending on which type of graph you are creating, the fields you can use might
change as follows:
■ Minimum, Maximum, Increment, and Logarithmic scale fields are grayed out on percent graph types (e.g. Bar graph of sub-type Percent)
■ Minimum, Maximum, and Logarithmic scale fields are grayed out on Pareto graphs
Edit Heading dialog
Dialog reference 23-55
Edit Heading dialog
Use this dialog to change the heading of the currently selected worksheet item. For example, you might want to change the item name '% incr' to a more user friendly 'Percentage Increase'.
For more information, see:
"About Discoverer worksheet types"
HeadingUse this field to enter a new name for the worksheet item. For example, you might want to change the heading '% incr' to 'Percentage Increase. The heading is displayed at the top of columns or to the left of rows to identify worksheet items.
Edit Parameter dialog
23-56 Oracle Business Intelligence Discoverer Plus User’s Guide
Edit Parameter dialog
Use this dialog to change the way that the currently selected parameter item behaves. For example, you might want to changes the parameter’s name, description, prompt, or default values.
For more information, see:
"What are parameters?"
"About using parameters"
What do you want to name this parameter?Use this field to enter a descriptive name for the parameter. This name is displayed in the parameter list on the "Edit Parameter Values dialog". If you leave this field blank, Discoverer creates a default name for you.
This parameter is based on the item namedThis read-only field displays the name of the item on which the parameter is based. If you want to create a parameter based on a different item, create a new parameter.
If this field displays <NONE> it can be used to provide input to a calculation. For example, <NONE> might be used in a parameter to enable worksheet users to enter a value to choose how much percentage increase they want to display on a worksheet.
What prompt do you want to show for this parameter?Use this field to enter a question or instruction that tells users what information they need to enter when choosing a parameter value. This prompt is displayed on the "Edit Parameter Values dialog". For example, 'What year do you want to look at?', or 'Please choose a region'. If you leave this field blank, Discoverer creates a default prompt for you.
What description do you want to show for this parameter?Use this field to enter a brief description of the parameter that tells users what the parameter is used for. This description is displayed on the "Edit Worksheet dialog: Parameters tab", and on the "Edit Parameter Values dialog".
Do you want to allow different parameter values for each worksheet?■ Use the Allow only one set of parameter values for all worksheets radio button
to make the same set of parameter values apply to all worksheets in the workbook.
■ Use the Allow different parameter values for each worksheet radio button to enable different parameter values to be specified for each worksheet.
Require users to enter a valueUse this check box to make users enter a parameter value before Discoverer will display the worksheet.
Enable users to select multiple values?Use this check box if you want users to be able to choose more than one value to match against the item.
Edit Parameter dialog
Dialog reference 23-57
Note: Clear this check box if <NONE> is displayed in the This parameter is based on the item named field. If a Discoverer end user enters more than one parameter value, only the first parameter value is used.
Enable users to select either indexes or valuesUse this check box to enable users to choose whether they want to display parameter values with indexes (e.g. (1) January, (2) February) or without (e.g. January, February) in the "Edit Parameter Values dialog".
Use this check box as follows:
■ Select this check box when you want worksheet users to be able to choose whether to display parameter values with or without indexes.
■ Clear this check box when you want parameter values to always be displayed without indexes.
Note: The Enable users to select either indexes or values check box is only available if indexes have been set up by the Discoverer manager.
For more information, see "About using indexes and values in parameters".
What default value do you want to give this parameter?Use this field to enter a default value for the parameter on the Edit Parameter Values dialog. If users do not enter a value in the Edit Parameter Values dialog, the value that you enter here is used.
Use the <Index and Value> drop down list (where available) to display default parameter values with indexes (e.g. (010) January, (011) February) or without indexes (e.g. January, February). For more information about using the <Index and Value> drop down list, see the "Edit Parameter Values dialog".
Note: You determine whether or not the <Index and Value> drop down list is displayed here, using the Enable users to select either indexes or values check box.
Hint: For date items, click on the calendar icon to the right of the field to specify a date using the graphical "Calendar dialog". If no calendar icon is displayed, click the down arrow to the right of the field and choose Select From Calendar to display the "Calendar dialog".
Note: If Discoverer Plus end users use the word TODAY as the default value of a parameter (e.g. to convert to today's date using a DECODE statement in a calculation), they must surround the word in single quotes (i.e. 'TODAY'). If TODAY is not surrounded by single quotes, Discoverer interprets the word as a literal value and displays the error message:
- ORA-01858: a non-numeric character was found where a numeric was expected
Do you want to filter the list of values for this parameter?Use these settings to refine the available parameter values that are displayed to the user.
■ Use the Show all available values radio button to display all available parameter values to the user.
■ Use the Filter the list of values based on the selected conditions radio button to activate a list of conditions you select to filter the parameter values displayed to the user.
Edit Parameter dialog
23-58 Oracle Business Intelligence Discoverer Plus User’s Guide
For more information, see "About filtering lists of parameter values based on selected conditions".
■ Use the check boxes in the <selected conditions> list to select one or more conditions to apply to the list of values for this parameter.
when you click a check box, Discoverer might display a warning symbol indicating that applying this condition might degrade query performance
Note: The check boxes in the <selected conditions> list are only available when you select the Filter the list of values based on the selected conditions radio button.
Edit Parameter Values dialog
Dialog reference 23-59
Edit Parameter Values dialog
Use this dialog to enter values for active worksheet parameters, which typically:
■ provide input to conditions to filter worksheets (e.g. when prompted to choose a month, you might enter 'January' to analyze January data only)
■ provide input to calculations (e.g. when prompted to choose a rolling average value, you might enter '3' to calculate a three month rolling average)
If you are printing a worksheet, you enter parameter values to limit or refine the data that you print.
This dialog is also displayed as:Export Wizard dialog: Parameters pagePrint Wizard dialog: Parameters pageSchedule Wizard dialog: Parameter Values pageCopy Scheduled Workbook dialog: Parameter Values tabEdit Scheduled Workbook dialog: Parameter Values tab
For more information, see:
"What are parameters?"
"About using parameters"
Select values for the following parameters:
<Parameter list>This area contains one or more fields into which you enter parameter values. Each field has a prompt (typically an instruction or question) telling you what value to enter. For example, if the prompt is 'Please choose a month', enter 'January' to analyze performance figures for January.
Mandatory parameters are indicated with an asterisk (*).
If a flashlight button is displayed next to a parameter field, click this button to display the "Select Value dialog", which enables you to search for and select the values that you want to use. For more information, see "Using lists of values (LOVs)".
Use the <Index and Value> drop down list (where available) to display default parameter values with indexes (e.g. (010) January, (011) February) or without indexes (e.g. January, February). For more information about using the <Index and Value> drop down list, see the "Edit Parameter Values dialog" and "About using indexes and values in parameters").
Note: You determine whether or not the <Index and Value> drop down list is displayed here, by using the Enable users to select either indexes or values check box in the "Edit Parameter dialog".
(optional) NextThis button enables you to display the next step in the Print Wizard, which is displayed when you print a workbook with more than worksheet with an active parameter. The Print Wizard enables you to specify parameter values for active parameters in a workbook. For example, if you print a workbook with three worksheets that have active parameters, the Print Wizard will have three steps, one step for each worksheet.
Edit Parameter Values dialog
23-60 Oracle Business Intelligence Discoverer Plus User’s Guide
Notes■ You can change parameter values in a worksheet at any time by choosing Tools |
Parameter Values.
■ For date items, click on the calendar icon to the right of the parameter value field to specify a date using the graphical "Calendar dialog". If no calendar icon is displayed, click the down arrow to the right of the field and choose Select From Calendar to display the "Calendar dialog".
■ You can enter the following reserved words into a parameter field:
■ SYSDATE or TODAY
Enter the reserved word SYSDATE or TODAY into a parameter field (must be of data type DATE) to display worksheet data that matches the system or today’s date.
■ USER
Enter the reserved word USER into a parameter field (must be of the same data type as the data type of the parameter) to display worksheet data that matches the current database user.
■ NULL
Enter the reserved word NULL into a parameter field (must be of data type DATE, STRING or NUMERIC) to display worksheet data where the item that this parameter is based upon has a NULL value.
Note that the reserved word must have the same data type as the parameter (e.g. SYSDATE or TODAY can only be used with a parameter that has the data type DATE).
The reserved word that you enter into a parameter field is case-insensitive (e.g. you could enter TODAY, today, ToDaY).
Note: You can enter reserved words using upper or lower case letters. However, you must not enter any additional text or text symbols. For example, you cannot use NULL% or 'NULL'. Discoverer would treat NULL% as a text string and not as a reserved word.
■ If you select a value for a workbook-level parameter, the value is applied to all worksheets in the workbook. For example, three worksheets (Sheet 1, Sheet 2, Sheet 3) contain the workbook level parameter Month. If you select January when prompted for the Month parameter for Sheet 1, January is selected for the Month parameter in Sheet 2 and Sheet 3. If you change the parameter value to February for Sheet 2 or Sheet 3, Discoverer applies this value to the other worksheets.
Edit Percentage dialog
Dialog reference 23-61
Edit Percentage dialog
Use this dialog to change the way that the currently selected percentage item behaves. For example, you might want to changes its name, description, or how it is calculated.
For more information, see:
"What are percentages?"
What do you want to name this percentage?Use this field to enter a descriptive name for the percentage item. This name is displayed in percentage lists and on worksheets as the column header of the percentage item. If you leave this box blank, Discoverer creates a default name for you.
What data point do you want to base your percentage on?Use this drop down list to select which item you want to base your percentage on. The list displays numeric items available in the worksheet.
Calculate as a percentage of:Use these radio buttons to choose how the percentage is calculated.
■ Grand total of all values
Use this radio button to calculate a percentage of all values.
■ Grand total for each column
Use this radio button to calculate a percentage for the item column (specific to crosstab worksheets).
Note: This field is only displayed when you add a total to a crosstab worksheet.
■ Grand total for each row
Use this radio button to calculate a percentage for the item row (specific to crosstab worksheets).
Note: This field is only displayed when you add a total to a crosstab worksheet.
■ Subtotal for each change in
Use this radio button to calculate a percentage for a sub-group. Select an item from the drop down list below to define the item that you want to sub-group. For example, to calculate a percentage total for each calendar year, you might choose 'Year' here.
Do you want to calculate percentages within each page?Use these radio buttons to choose whether to calculate the percentage for each page, or for all pages.
Note: You only use these radio buttons if the worksheet has page items.
■ Calculate percentages with each page
Use this radio button to calculate percentages for data on the current page. For example, if Region is displayed in the Page Items area, you might want to calculate how sales for each quarter contribute to total sales for the each region.
■ Calculate percentages across all pages
Edit Percentage dialog
23-62 Oracle Business Intelligence Discoverer Plus User’s Guide
Use this radio button to calculate percentages for all pages. For example, if Region is displayed in the Page Items area, you might want to calculate how sales for each quarter contribute to total sales for the all regions.
ExampleThis area shows you how your worksheet will look according to what options you specify.
Which totals do you want to be shown?Use these options to specify how you want totals and sub totals to be displayed.
Show grand total and grand total percentage?Use this check box to display a sum of all values and a sum of the percentages (specific to the Grand total for all values option).
LabelUse this field to define the grand total percentage label that will appear on the worksheet (if selected). To enter a different label, click the down arrow on the right of the field. To format the label, click the Format button and choose how you want the label to look on the worksheet.
Show subtotals and subtotal percentageUse this check box to display a subtotal for values in the item group, and a percentage for the subgroup (specific to the Subtotal at each change in option).
Note: This field is only displayed when you add a total to a crosstab worksheet.
LabelUse this field to define the subtotal percentage label that will appear on the worksheet (if selected). To enter a different label, click the down arrow on the right of the field. To format the label, click the Format button and choose how you want the label to look on the worksheet.
Note: This field is only displayed when you add a total to a crosstab worksheet.
Format DataUse this button to display the "Format Data dialog", where you change how the values look on the worksheet.
Note: This field is only displayed when you add a total to a crosstab worksheet.
Format HeadingUse this button to display the "Format heading dialog", where you change how the item headings look on the worksheet.
Note: This field is only displayed when you add a total to a crosstab worksheet.
Show the percentage of the grand total for each subtotalUse this check box to display a subtotal as a percentage of the grand total.
Note: This field is only displayed when you add a total to a crosstab worksheet.
Edit Percentage dialog
Dialog reference 23-63
LabelUse this field to define the grand total percentage label that will appear on the worksheet (if selected). To enter a different label, click the down arrow on the right of the field. To format the label, click the Format button and choose how you want the label to look on the worksheet.
Note: This field is only displayed when you add a total to a crosstab worksheet.
Format DataUse this button to display the "Format Data dialog", where you change how the values look on the worksheet.
Note: This field is only displayed when you add a total to a crosstab worksheet.
Format HeadingUse this button to display the "Format heading dialog", where you change how the item headings look on the worksheet.
Note: This field is only displayed when you add a total to a crosstab worksheet.
Edit Text Area dialog
23-64 Oracle Business Intelligence Discoverer Plus User’s Guide
Edit Text Area dialog
Use this dialog to edit the worksheet text that is displayed at the bottom of a worksheet. For example, you might want to display the date at the bottom of a worksheet. Formatting options that you specify apply to new text that you enter in the Text field or text currently selected in the Text field.
Note: If you are editing default Discoverer options (i.e. you chose Tools | Options and displayed the Formats tab) you use this dialog to specify the default worksheet text for new worksheets.
For more information, see:
"About worksheet titles and text"
"How to create or edit worksheet titles or text"
"How to display or hide worksheet titles or text"
FontUse this drop down list to specify a font for the text in the worksheet text area.
SizeUse this drop down list to specify a point size for the text in the worksheet text area.
ColorUse this color pane to specify a color for the text in the worksheet text area.
<Formatting buttons>Use these buttons to change font style and text alignment options for the text in the worksheet text area. For example, use the B button to make text bold or use the U button to underline text.
Note: If you apply a format to a text variable, the format is applied to all characters in that text variable when the value is displayed on the worksheet. In other words, you cannot apply different formats to individual characters in a text variable
Background colorUse this color pane to specify a background color for the text in the worksheet text area. The background color that you specify applies to the whole text area.
Hint: Make sure that the background color is different to the text color.
TextUse this field to enter the text that you want to appear at the bottom of the worksheet when you display the workbook on screen or print or export the worksheet. You can enter text and text variables up to a total maximum length of 1024 characters.
Note: The worksheet text displayed at runtime can be more than 1024 characters (e.g. if text variables are displayed).
InsertUse this button to display a drop down list of text variables (e.g. date, time) that you can insert into the worksheet text area.
Edit Text Area dialog
Dialog reference 23-65
Hint: Before you insert a text variable, place the cursor inside the Text field in the position at which you want to insert the text variable.
The value of a text variable is updated when a worksheet is displayed, printed, or exported. In other words, if you display the &Time variable on a worksheet, the time value is updated each time the worksheet is displayed, printed, or exported. For example, if you insert the &Time variable into a worksheet text area, the worksheet text area might display '12.00.00 PM' if you print the worksheet at midday and '08.30.00 AM' if you print the worksheet at eight-thirty in the morning.
Notes■ If you want to hide the worksheet text area on the current worksheet, clear the
Show text check box on the options dialog (for more information, see "How to display or hide worksheet titles or text").
■ If you include the &Date and &Time text variables in a worksheet text area, the values displayed in the worksheet are the date and time on the Discoverer server. The date and time on the Discoverer server might be different to the date and time on the machine running the Web browser where you started Discoverer Plus Relational.
■ To specify that Discoverer displays a worksheet text area when you create a new worksheet, choose Tools | Options and select the Show text area check box on the "Options dialog: Sheet tab".
Edit Title dialog
23-66 Oracle Business Intelligence Discoverer Plus User’s Guide
Edit Title dialog
Use this dialog to edit the worksheet title that is displayed at the top of a worksheet. For example, you might want to display the date at the top of a worksheet. Formatting options that you specify apply to new text that you enter in the Title field or text currently selected in the Title field
Note: If you are editing default Discoverer options (i.e. you chose Tools | Options and displayed the Formats tab) you use this dialog to specify the default worksheet title for new worksheets.
For more information, see:
"About worksheet titles and text"
"How to create or edit worksheet titles or text"
"How to display or hide worksheet titles or text"
FontUse this drop down list to specify a font for the text in the worksheet title area.
SizeUse this drop down list to specify a point size for the text in the worksheet title area.
ColorUse this color pane to specify a color for the text in the worksheet title area.
<Formatting buttons>Use these buttons to change font style and text alignment options for the text in the worksheet title area. For example, use the B button to make text bold or use the U button to underline text.
Note: If you apply a format to a text variable, the format is applied to all characters in that text variable when the value is displayed on the worksheet. In other words, you cannot apply different formats to individual characters in a text variable
Background colorUse this color pane to specify a background color for the text in the worksheet title area. The background color that you specify applies to the whole title area.
Hint: Make sure that the background color is different to the text color.
TitleUse this field to enter the text that you want to appear at the top of the worksheet when you display the workbook on screen or print or export the worksheet. You can enter text and text variables up to a total maximum length of 1024 characters.
Note: The worksheet title displayed at runtime can be more than 1024 characters (e.g. if text variables are displayed).
InsertUse this button to display a drop down list of text variables (e.g. date, time) that you can insert into the worksheet title area.
Edit Title dialog
Dialog reference 23-67
Hint: Before you insert a text variable, place the cursor inside the Title field in the position at which you want to insert the text variable.
The value of a text variable is updated when a worksheet is displayed, printed, or exported. In other words, if you display the &Time variable on a worksheet, the time value is updated each time the worksheet is displayed, printed, or exported. For example, if you insert the &Time variable into a worksheet title area, the worksheet title area might display '12.00.00 PM' if you print the worksheet at midday and '08.30.00 AM' if you print the worksheet at eight-thirty in the morning.
Notes■ If you want to hide the worksheet title area on the current worksheet, clear the
Show title check box on the options dialog (for more information, see "How to display or hide worksheet titles or text").
■ If you include the &Date and &Time text variables in a worksheet title area, the values displayed in the worksheet are the date and time on the Discoverer server. The date and time on the Discoverer server might be different to the date and time on the machine running the Web browser where you started Discoverer Plus Relational.
■ To specify that Discoverer displays a worksheet title area when you create a new worksheet, choose Tools | Options and select the Show title check box on the "Options dialog: Sheet tab".
Edit Total dialog
23-68 Oracle Business Intelligence Discoverer Plus User’s Guide
Edit Total dialog
Use this dialog to change the way that the currently selected total item behaves. For example, you might want to change its label, the type of total used, or how it is calculated.
For more information, see:
"What are totals?"
"About totals on worksheets"
"Examples of worksheet aggregation in Discoverer"
Which data point would you like to create a total on?Use this drop down list to specify which items you want to create a total for. You can specify a particular item or choose all items.
What kind of total do you want?Use this drop down list to specify what type of total you want.
Note: For more information about Sum and Cell Sum, see "About SUM and Cell SUM".
Where would you like your total to be shown?Use these radio buttons to specify where to display the total.
■ Grand total at bottom
Use this radio button to display a grand total of all values in the worksheet.
■ Grand total on right
Use this radio button to display a total for the item row.
Note: This field is only displayed when you add a total to a crosstab worksheet.
■ Subtotal at each change in
Use this radio button to calculate a total for a sub-group. Select an item from the drop down list below to define the item that you want to sub-group. For example, to calculate a total for each calendar month, you might choose 'Month' here.
Don’t display total for a single rowUse this check box to not display a total for a single row, where the row and total would have the same value.
Note: This field is called Don’t display total for single rows or columns when you add a total to a crosstab worksheet.
Do you want to calculate totals within each page?Use these radio buttons to choose the scope of the total. For example, if a worksheet contains page items (i.e. items are displayed in the Page Items area), you might want to display a total at the bottom of each page.
■ Calculate totals with each page
Edit Total dialog
Dialog reference 23-69
Use this radio button to apply the total to data displayed on the worksheet. For example, if Calendar Month is displayed in the Page Items area, you display a grand total for each month.
■ Calculate totals across all pages
Use this radio button to apply the total to all data in the worksheet. The total takes into account other page items not currently displayed on the worksheet. For example, if Calendar Month is displayed in the Page Items area, you display a grand total for all months.
ExampleThis area shows you how your worksheet will look according to what options you specify.
What label do you want to be shown?Use this field to specify what total label will be displayed on the worksheet. If the Generate label automatically check box is selected below, Discoverer creates a name for you. To enter a different label, clear the Generate label automatically check box and either type in a new label or choose a label from the drop down list on the right of the field. To change the default text style of the label, click the Format button and choose a text font, style, color and alignment.
Generate label automaticallyUse this check box if you want Discoverer to create a total name for you. To change the default text style, click the Format button and choose a text font, style, color and alignment.
Format DataUse this button to display the "Format Data dialog", where you change how the values look on the worksheet.
Format HeadingUse this button to display the "Format heading dialog", where you change how the item headings look on the worksheet.
Edit Worksheet dialog
23-70 Oracle Business Intelligence Discoverer Plus User’s Guide
Edit Worksheet dialog
Use this dialog to change how the currently displayed worksheet looks and behaves. You can:
■ change which items are displayed, their position on the worksheet, and how they look
■ create, edit, and remove worksheet items such as conditions, calculations, exceptions, percentages, totals, and parameters.
Note: For more information about maximizing Discoverer performance, see "About designing workbooks for maximum performance".
This dialog is also displayed as:Duplicate as Table dialogDuplicate as Crosstab dialogWorksheet Wizard dialogWorkbook Wizard dialog
For more information about tabs on this dialog, see:
"Edit Worksheet dialog: Worksheet Layout tab"
"Edit Worksheet dialog: Select Items tab"
"Edit Worksheet dialog: Crosstab Layout tab"
"Edit Worksheet dialog: Table Layout tab"
"Edit Worksheet dialog: Sort tab"
"Edit Worksheet dialog: Parameters tab"
PropertiesUse this button to display the Worksheet Properties dialog. Use the Worksheet Properties dialog to specify:
■ how Discoverer names worksheets (see "Worksheet Properties dialog: General tab")
■ how Discoverer formats worksheets (see "Worksheet Properties dialog: Sheet/Crosstab Format tab")
■ how Discoverer handles worksheet aggregation (see "Worksheet Properties dialog: Aggregation tab")
Show SQLUse this button to display the SQL Inspector dialog, which shows the underlying SQL code for the current worksheet that Discoverer uses to extract data from the database. For more information about SQL, see "Using SQL".
Edit Worksheet dialog: Crosstab Layout tab
Dialog reference 23-71
Edit Worksheet dialog: Crosstab Layout tab
Use this tab to change the layout of the current worksheet. This is also known as pivoting. For example, you might want to change which items are displayed, and their position on the worksheet.
This dialog is also displayed as:Duplicate as Crosstab dialog: Crosstab Layout tabWorksheet Wizard dialog: Crosstab layout page
For more information, see:
"About pivoting worksheet items"
"About designing workbooks for maximum performance".
Show page itemsUse this check box to display page items on the worksheet.
Page Items areaThis area shows which items are displayed in the Page Items area on the worksheet.
<Layout area>This area shows how the items are arranged.
■ To change an item’s position, click the item and drag and drop it to a new location. To help you position items, as you move an item round the worksheet a black line is displayed showing its new location.
■ To remove an item, click the item and press Delete.
Notes■ If you remove an item from a worksheet (e.g. by selecting an item and pressing the
Delete key), you also remove items that are dependent on the item (e.g. calculations, conditions). For example, if you remove an items called Sales SUM that is used in a calculation, the calculation is also removed.
Edit Worksheet dialog: Parameters tab
23-72 Oracle Business Intelligence Discoverer Plus User’s Guide
Edit Worksheet dialog: Parameters tab
Use this tab to manage existing parameters and create new parameters. For example, you might want to delete parameters from a worksheet, or change the order that parameters are displayed when worksheet end users are prompted for parameter values.
This dialog is also displayed as:Worksheet Wizard dialog: Parameters page
For more information, see:
"What are parameters?"
"About using parameters"
"About designing workbooks for maximum performance".
Available parametersThis list shows which parameters are available to the current worksheet and enables you to select parameters to edit, delete, and re-order.
To turn off a worksheet parameter, you can either delete the parameter or de-activate the parameter. De-activate parameters as follows:
■ If the parameter is included in a condition, display the Conditions tab and clear the check box next to the condition containing the parameter, then click OK to close the dialog.
■ If the parameter is included in a calculation, display the Calculation tab and clear the check box next to the calculation containing the parameter, then click OK to close the dialog.
The order of parameters in the Available parameters list determines the order in which worksheet end users are prompted for parameter values.
Note: The Order column displays NA when a parameter is not active (i.e. the parameter’s underlying condition or calculation is not active).
DescriptionThis field displays a user-friendly description of the currently selected parameter that is displayed when worksheet end users enter parameter values.
Hint: To change the description, click Edit and update the What description do you want to show other users? field.
NewUse this button to display the New parameter dialog (see "New Parameter dialog"). Use the "New Parameter dialog" to create new worksheet parameters that prompt worksheet end users for dynamic input.
EditUse this button to display the Edit parameter dialog (see "Edit Parameter dialog"). Use the Edit parameter dialog to edit the currently selected parameter.
Edit Worksheet dialog: Parameters tab
Dialog reference 23-73
DeleteUse this button to permanently remove the selected parameter. Worksheet users are no longer prompted to specify a parameter value for this parameter.
Note: When you remove parameters, you also remove items that are dependent on the parameter (e.g. calculations, conditions). For example, if the parameter that you delete is used in a worksheet calculation, the calculation is also removed. To remove a parameter from a worksheet without deleting the parameter, deactivate it by removing the active condition or calculation that the parameter uses. For more information, see "How to deactivate parameters".
Move UpUse this button to change the order of the currently selected parameter in the Available parameters list. The order of parameters in the Available parameters list determines the order in which worksheet end users are prompted for parameter values.
Move DownUse this button to change the order of the currently selected parameter in the Available parameters list. The order of parameters in the Available parameters list determines the order in which worksheet end users are prompted for parameter values.
Notes■ You are not allowed to delete parameters created for you by the Discoverer
manager.
Edit Worksheet dialog: Select Items tab
23-74 Oracle Business Intelligence Discoverer Plus User’s Guide
Edit Worksheet dialog: Select Items tab
Use this tab to specify which items to display on the current worksheet. For example, you might want to add items so that you can analyze your data in a new way.
This dialog is also displayed as:Worksheet Wizard dialog: Select Items page
For more information on tabs on the Select Items tab, see:
"Edit Worksheet dialog: Select Items tab: Items tab"
"Edit Worksheet dialog: Select Items tab: Conditions tab"
"Edit Worksheet dialog: Select Items tab: Calculations tab"
Items tabThis tab displays available items that you can add to the current worksheet (for more information, see "Edit Worksheet dialog: Select Items tab: Items tab").
Conditions tabThis tab displays available conditions that you can add to the current worksheet (for more information, see "Edit Worksheet dialog: Select Items tab: Conditions tab").
Calculations tabThis tab displays available calculations, percentages, and totals that you can add to the current worksheet (for more information, see "Edit Worksheet dialog: Select Items tab: Calculations tab").
SelectedUse this list to see the items currently displayed on the worksheet.
To remove an item from the worksheet, select the item in the Selected list, then click the left arrow button (<) to move it back to the Available list.
To select more than one item at a time, hold down the control key (Ctrl) when you select items.
NewUse this button to display a list of item types (calculations, totals, conditions) that you create and add to the worksheet.
EditUse this button to edit the item currently selected in the Available items list.
Note: You can only edit items that you have created. You cannot edit items created by the Discoverer manager. Click New to create a new worksheet item.
ShowUse this button to display the "Show Condition dialog", where you can look at the currently selected condition in detail.
Note: This button is active when you are not allowed to edit the currently selected condition (for more information, see the description of the Edit button).
Edit Worksheet dialog: Select Items tab
Dialog reference 23-75
DeleteUse this button to permanently remove the item currently selected in the Available items list.
Note: You can only delete items that you have created (for more information, see Show option). You cannot delete items created by the Discoverer manager.
Notes■ If you remove an item from a worksheet, you also remove items that are
dependent on the item (e.g. calculations, conditions). For example, if you remove an item called Sales SUM that is used in a calculation, the calculation is also removed.
Edit Worksheet dialog: Select Items tab: Items tab
23-76 Oracle Business Intelligence Discoverer Plus User’s Guide
Edit Worksheet dialog: Select Items tab: Items tab
Use this tab to see the items available for use in the worksheet, to edit items, and to add items to the current worksheet. For more information about options on the Select Items tab, see "Edit Worksheet dialog: Select Items tab".
ListUse this drop down list to select a different business area (for more information about business areas, see "What are business areas?"). This drop down list is only active when you have access to more than one business area.
Hint: If you cannot see the items that you want to analyze, make sure that you selected the correct connection when you started Discoverer Plus Relational. If necessary, exit Discoverer Plus Relational and re-start Discoverer Plus Relational using a different connection that has access to the business area you want to analyze.
<Flashlight button>Click the flashlight button next to the List field to display the "Find dialog (in Item Navigator)", which enables you to search any business area for items that you want to add to the worksheet.
<Items list>Use this list to see the items available for use in the worksheet, and to add and remove items to and from the worksheet. You can also use options on the Available Items toolbar to create new items (e.g. new calculations or conditions) and edit existing items. For more information about options on the Available Items toolbar, see "Available Items pane".
Hint: To locate an item quickly when the focus is on the <Items list>, type the first letter of the item or folder that you want to locate. The next item or folder beginning with the typed letter is highlighted. For example, type 'r' to locate the Region item.
Click the plus (+) and minus (-) buttons next to folders and items to expand and collapse them.
To add an item to the worksheet, do one of the following:
■ drag and drop an item from this field into the Selected field
■ select an item and click the right arrow button (>)
To select more than one item at a time, hold down the control key (Ctrl) when you select items. Items currently displayed on the worksheet are marked with a tick symbol (or check mark).
For descriptions of icons used in the <Items list>, see "About icons used in the Discoverer item navigator".
Notes■ Discoverer can show the name and description of database joins that exist between
the folders displayed in the <Items list> and for items displayed in the Selected list. For more information, see the description of the Show Joins check box in the "Options dialog: Advanced tab".
Edit Worksheet dialog: Select Items tab
Dialog reference 23-77
Edit Worksheet dialog: Select Items tab: Conditions tab
Use this tab to see the conditions available for use in the worksheet, to edit conditions, and to apply conditions to the current worksheet. For more information about options on the Select Items tab, see "Edit Worksheet dialog: Select Items tab".
ListUse this drop down list to select the type of conditions to display in the <Items list> below, as follows:
■ choose 'All Items' to see all available conditions
■ choose 'Selected Items' to see conditions related to items currently included in the worksheet
■ choose a particular worksheet item (e.g. Profit SUM) to see conditions active on that item
<Items list>Use this list to see the conditions available for use in the worksheet, to apply conditions to the worksheet, and to remove conditions from the worksheet.
Click the plus (+) and minus (-) buttons next to a condition category (e.g. My Conditions) to expand and collapse the category.
To apply a condition to the worksheet, do one of the following:
■ drag and drop a condition from this field into the Selected field
■ select a condition and click the right arrow button (i.e. >)
To select more than one condition at a time, hold down the control key (Ctrl) when you select items. Conditions currently applied to the worksheet are marked with a tick symbol (or check mark).
For descriptions of icons used in the <Items list>, see "About icons used in the Discoverer item navigator".
Edit Worksheet dialog: Select Items tab: Calculations tab
23-78 Oracle Business Intelligence Discoverer Plus User’s Guide
Edit Worksheet dialog: Select Items tab: Calculations tab
Use this tab to see the calculations, percentages, and totals available for use in the worksheet, and to create and edit calculations, percentages, and totals. For more information about options on the Select Items tab, see "Edit Worksheet dialog: Select Items tab".
ListUse this drop down list to select the type of calculations to display in the <Items list> below, as follows:
■ choose 'All Items' to see all available calculations, percentages, and totals
■ choose 'Selected Items' to see calculations, percentages, and totals related to items currently included in the worksheet
■ choose a particular worksheet item (e.g. Profit SUM) to see calculations, percentages, and totals active on that item
<Items list>Use this list to see the calculations, percentages, and totals available for use in the worksheet, and to add and to remove calculations, percentages, and totals to and from the worksheet.
Click the plus (+) and minus (-) buttons next to a calculation category (e.g. My Calculations, My Percentages, My Totals) to expand and collapse the category.
To add a calculation/total/percentage to the worksheet, do one of the following:
■ drag and drop a calculation/total/percentage from this field into the Selected field
■ select a calculation, percentage, or total in this field and click the right arrow button (i.e. >)
To select more than one item at a time, hold down the control key (Ctrl) when you select items. Items currently displayed on the worksheet are marked with a tick symbol (or check mark).
For descriptions of icons used in the <Items list>, see "About icons used in the Discoverer item navigator".
Edit Worksheet dialog: Sort tab
Dialog reference 23-79
Edit Worksheet dialog: Sort tab
Use this tab to change the sort order of items on the current table worksheet. For example, you might want to order numerical sales data from highest to lowest to look at sales performance.
Note: You won’t find a Sort tab on the Edit Worksheet dialog for crosstab worksheets. To sort a crosstab worksheet, choose Tools | Sort to display the "Sort Crosstab dialog".
This dialog is also displayed as:Worksheet Wizard dialog: Sort page
For more information, see:
"About sorting on table worksheets"
"How to sort data on a table worksheet"
"Examples of sorting"
<Sort list>Use this list to manage how the worksheet data is ordered. Sorts are arranged in order of precedence.
Note: Group sorts automatically take precedence over non-group sorts.
ColumnThis field displays the name of the item on which the data is ordered.
DirectionUse this drop down list to change how the data is ordered.
■ Low to High sorts A - Z alphabetically and 1 - 10 etc. numerically (language specific).
■ Hi to Low sorts Z - A alphabetically and 10 - 1 etc. numerically (language specific).
Sort TypeUse this option to group data and not display duplicate values. For example, if you sort on year, and there are many rows for 2001, the value 2001 will only be displayed for the first row with that value. Note the following:
■ Items sorted on group take precedence over items not sorted on group.
■ Changing an item to group sort automatically moves it to a higher position in the sort list over items not sorted on group.
For more information about group sorting, see "What is group sorting?".
HiddenUse this option to hide or display the sorted item on the worksheet, as follows:
■ Select the Hidden check box to hide the sorted item.
■ Clear the Hidden check box to display the sorted item on the worksheet.
Edit Worksheet dialog: Sort tab
23-80 Oracle Business Intelligence Discoverer Plus User’s Guide
AddUse this button to add a new sort to the worksheet. The sort is added to the sort list. Click the button to display a list of items available, then click an item to create a sort on that item.
DeleteUse this button to remove the sort currently selected in the sort list from the worksheet.
Move upUse this button to change the order of precedence of the selected sort item. Moving a sort up the list increases its precedence.
Move downUse this button to change the order of precedence of the selected sort item. Moving a sort down the list decreases its precedence.
Notes■ You can also drag and drop items into a difference position in the sort list to
change the order of precedence.
Edit Worksheet dialog: Table Layout tab
Dialog reference 23-81
Edit Worksheet dialog: Table Layout tab
Use this tab to change the layout of the current worksheet. For example, to change which items are displayed, and their position on the worksheet.
This dialog is also displayed as:Duplicate as Table dialog: Table Layout tabWorksheet Wizard: Table Layout page
For more information, see:
"About designing workbooks for maximum performance".
Show page itemsUse this check box to display page items on the worksheet.
Page Items areaThis area shows which items are displayed in the Page Items area on the worksheet.
Hide duplicate rowsUse this check box to not display duplicate values. For example, if you have a group of rows for the same month January, January is displayed for the first item in the group only.
<Layout area>This area shows how the items are arranged.
■ To change an item’s position, click the item and drag and drop it to a new location. To help you position items, as you move an item round the worksheet a black line is displayed showing its new location.
■ To remove an item, click the item and press Delete.
Notes■ If you remove an item from a worksheet (e.g. by selecting an item and pressing the
Delete key), you also remove items that are dependent on the item (e.g. calculations, conditions). For example, if you remove an items called Sales SUM that is used in a calculation, the calculation is also removed.
Edit Worksheet dialog: Worksheet Layout tab
23-82 Oracle Business Intelligence Discoverer Plus User’s Guide
Edit Worksheet dialog: Worksheet Layout tab
Use this dialog to select the worksheet elements (e.g. title area, graph) to display on the worksheet. For example, you might want to display a title area at the top of the worksheet and a text area at the bottom of the worksheet.
This dialog is also displayed as:Worksheet Wizard dialog: Worksheet Layout page
For more information, see:
"What are workbooks?"
"What are worksheets?"
■ Title
Use this check box to display a title area at the top of the worksheet (for more information, see "About worksheet titles and text").
■ Page Items
Use this check box to display data grouped by the items in the Page Axis area (for more information, see "What are axis items?").
■ Crosstab/Table
Use this check box to specify whether you display the worksheet data area.
■ Graph
Use this check box to specify whether you display a graph alongside the worksheet data area.
■ Placement
Use this drop down list to specify where to place the graph in relation to the worksheet data.
■ Text Area
Use this check box to display a text area at the bottom of the worksheet (for more information, see "About worksheet titles and text").
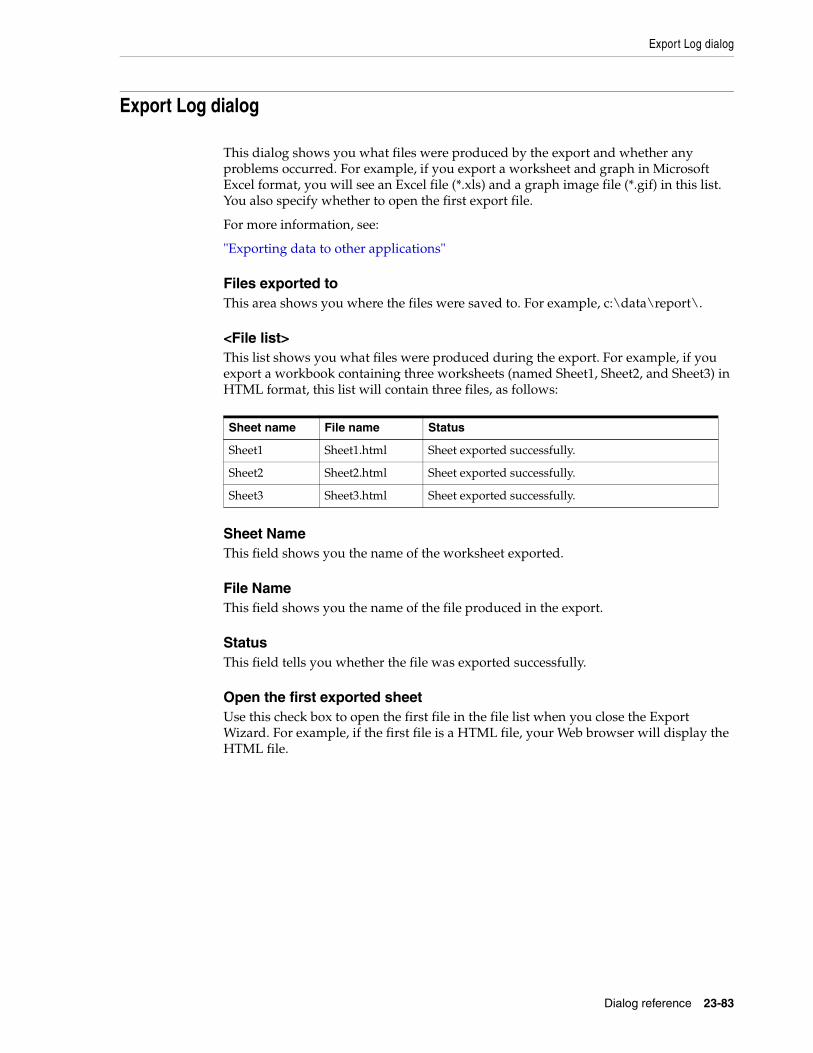
Export Log dialog
Dialog reference 23-83
Export Log dialog
This dialog shows you what files were produced by the export and whether any problems occurred. For example, if you export a worksheet and graph in Microsoft Excel format, you will see an Excel file (*.xls) and a graph image file (*.gif) in this list. You also specify whether to open the first export file.
For more information, see:
"Exporting data to other applications"
Files exported toThis area shows you where the files were saved to. For example, c:\data\report\.
<File list>This list shows you what files were produced during the export. For example, if you export a workbook containing three worksheets (named Sheet1, Sheet2, and Sheet3) in HTML format, this list will contain three files, as follows:
Sheet NameThis field shows you the name of the worksheet exported.
File NameThis field shows you the name of the file produced in the export.
StatusThis field tells you whether the file was exported successfully.
Open the first exported sheetUse this check box to open the first file in the file list when you close the Export Wizard. For example, if the first file is a HTML file, your Web browser will display the HTML file.
Sheet name File name Status
Sheet1 Sheet1.html Sheet exported successfully.
Sheet2 Sheet2.html Sheet exported successfully.
Sheet3 Sheet3.html Sheet exported successfully.

Export Wizard dialog: Format and Name page
23-84 Oracle Business Intelligence Discoverer Plus User’s Guide
Export Wizard dialog: Format and Name page
Use this dialog to specify what format you want to export to, and where to save files.
For more information, see:
"Exporting data to other applications"
Which export format do you want to use?Use these drop down list to specify an export format for worksheets and graphs.
■ Table/Crosstab
Use this drop down list to specify an export format for worksheets. Format types supported include Oracle Reports (*.xml), Microsoft Excel, HTML, and Text.
Note: Web Query for Microsoft Excel (*.iqy) format is not available in a Single Sign-On environment. Contact the Discoverer manager or Oracle administrator for more information.
■ Graph
Use this drop down list to specify an export format for graphs. Format types supported include the following.
– Portable Network Graphics (*.png) - save graphs in PNG format (default). PNG format is an image file format that is common on the Web and supported by many business applications.
– GIF Image (*.gif) - save graphs in GIF format.
Note: Graph files GIF format are limited to 256 colors, and thereby might be of lower quality than graph files in PNG format.
– HTML using PNG (*.htm) - save graphs as PNG embedded in HTML files.
Where do you want to save the file?Use this field to specify where to save the exported data (for example, c:\data\reports). Type in a file location, or use the Browse button to navigate to a file location.
BrowseUse this button to display the Save dialog, where you navigate to a file location and choose a file name and export format.
What do you want to name the filesUse this field to change the default name of exported files. For example, if you change this value to Sales Analysis Report and export to Microsoft Excel format, Discoverer names the export file Sales Analysis Report.xls.
The following fields are displayed if you select the Web Query for Microsoft Excel (*.iqy) format in the What export format do you want to use? fieldFor more information, see "About exporting worksheets to Microsoft Excel Web Query format".
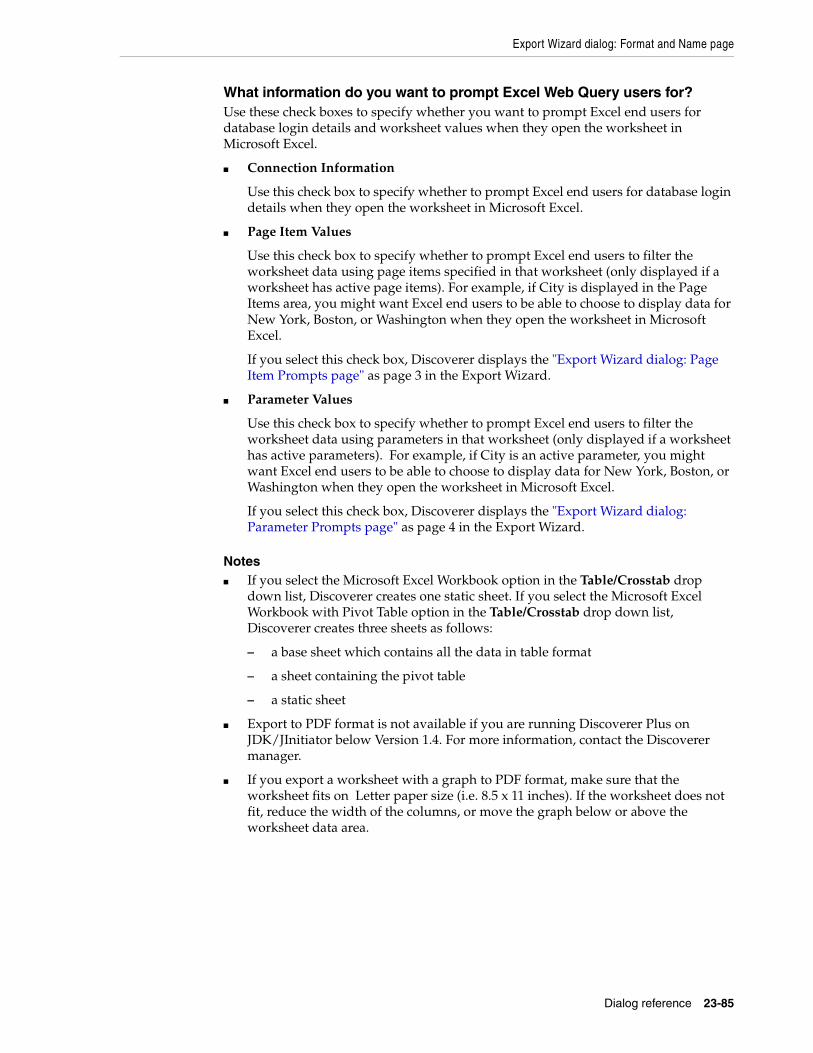
Export Wizard dialog: Format and Name page
Dialog reference 23-85
What information do you want to prompt Excel Web Query users for?Use these check boxes to specify whether you want to prompt Excel end users for database login details and worksheet values when they open the worksheet in Microsoft Excel.
■ Connection Information
Use this check box to specify whether to prompt Excel end users for database login details when they open the worksheet in Microsoft Excel.
■ Page Item Values
Use this check box to specify whether to prompt Excel end users to filter the worksheet data using page items specified in that worksheet (only displayed if a worksheet has active page items). For example, if City is displayed in the Page Items area, you might want Excel end users to be able to choose to display data for New York, Boston, or Washington when they open the worksheet in Microsoft Excel.
If you select this check box, Discoverer displays the "Export Wizard dialog: Page Item Prompts page" as page 3 in the Export Wizard.
■ Parameter Values
Use this check box to specify whether to prompt Excel end users to filter the worksheet data using parameters in that worksheet (only displayed if a worksheet has active parameters). For example, if City is an active parameter, you might want Excel end users to be able to choose to display data for New York, Boston, or Washington when they open the worksheet in Microsoft Excel.
If you select this check box, Discoverer displays the "Export Wizard dialog: Parameter Prompts page" as page 4 in the Export Wizard.
Notes■ If you select the Microsoft Excel Workbook option in the Table/Crosstab drop
down list, Discoverer creates one static sheet. If you select the Microsoft Excel Workbook with Pivot Table option in the Table/Crosstab drop down list, Discoverer creates three sheets as follows:
– a base sheet which contains all the data in table format
– a sheet containing the pivot table
– a static sheet
■ Export to PDF format is not available if you are running Discoverer Plus on JDK/JInitiator below Version 1.4. For more information, contact the Discoverer manager.
■ If you export a worksheet with a graph to PDF format, make sure that the worksheet fits on Letter paper size (i.e. 8.5 x 11 inches). If the worksheet does not fit, reduce the width of the columns, or move the graph below or above the worksheet data area.
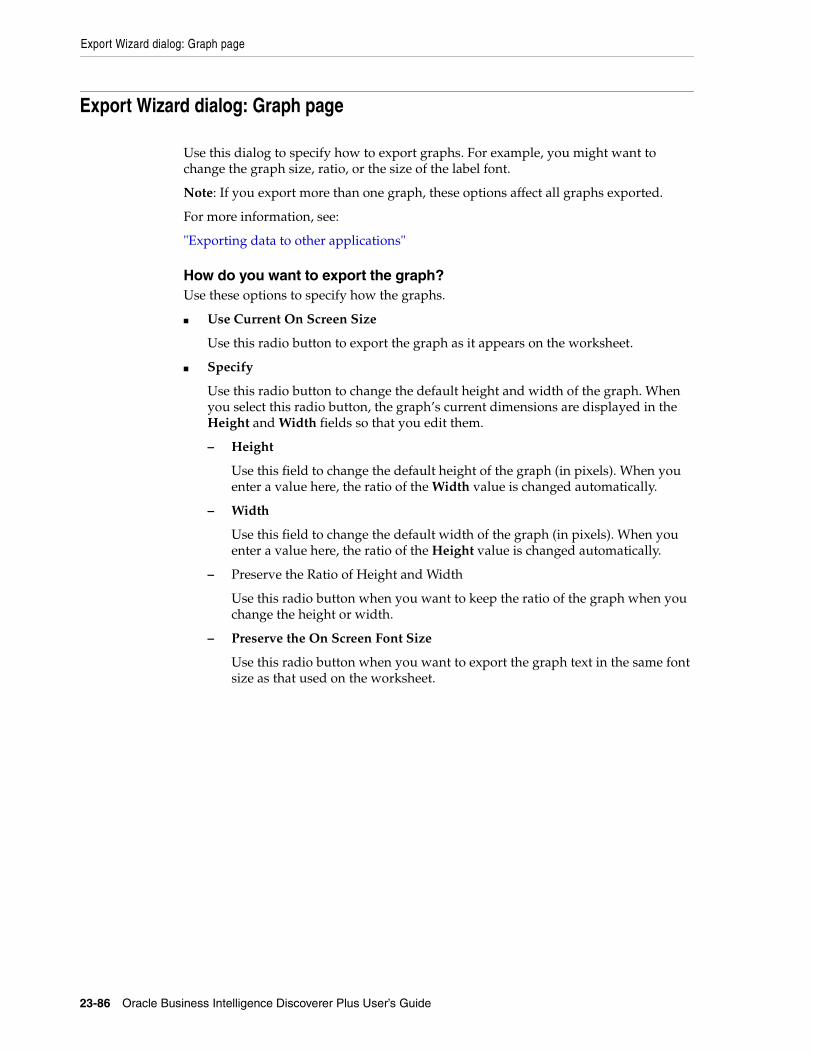
Export Wizard dialog: Graph page
23-86 Oracle Business Intelligence Discoverer Plus User’s Guide
Export Wizard dialog: Graph page
Use this dialog to specify how to export graphs. For example, you might want to change the graph size, ratio, or the size of the label font.
Note: If you export more than one graph, these options affect all graphs exported.
For more information, see:
"Exporting data to other applications"
How do you want to export the graph?Use these options to specify how the graphs.
■ Use Current On Screen Size
Use this radio button to export the graph as it appears on the worksheet.
■ Specify
Use this radio button to change the default height and width of the graph. When you select this radio button, the graph’s current dimensions are displayed in the Height and Width fields so that you edit them.
– Height
Use this field to change the default height of the graph (in pixels). When you enter a value here, the ratio of the Width value is changed automatically.
– Width
Use this field to change the default width of the graph (in pixels). When you enter a value here, the ratio of the Height value is changed automatically.
– Preserve the Ratio of Height and Width
Use this radio button when you want to keep the ratio of the graph when you change the height or width.
– Preserve the On Screen Font Size
Use this radio button when you want to export the graph text in the same font size as that used on the worksheet.
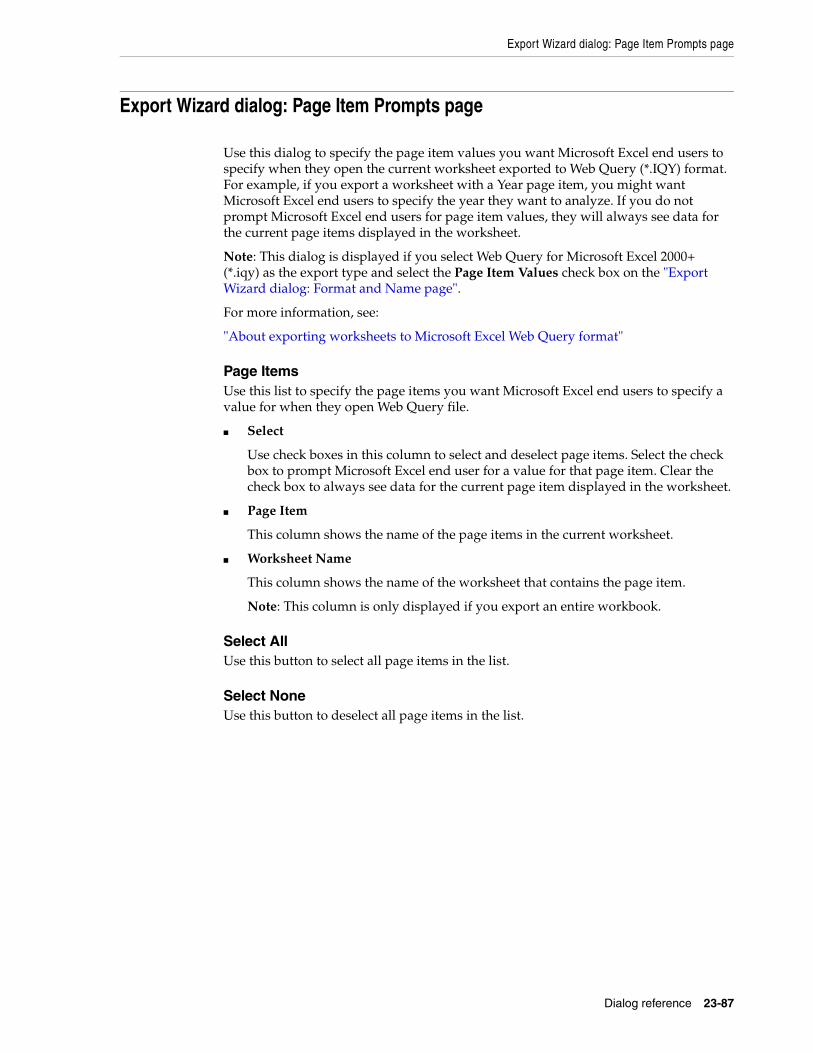
Export Wizard dialog: Page Item Prompts page
Dialog reference 23-87
Export Wizard dialog: Page Item Prompts page
Use this dialog to specify the page item values you want Microsoft Excel end users to specify when they open the current worksheet exported to Web Query (*.IQY) format. For example, if you export a worksheet with a Year page item, you might want Microsoft Excel end users to specify the year they want to analyze. If you do not prompt Microsoft Excel end users for page item values, they will always see data for the current page items displayed in the worksheet.
Note: This dialog is displayed if you select Web Query for Microsoft Excel 2000+ (*.iqy) as the export type and select the Page Item Values check box on the "Export Wizard dialog: Format and Name page".
For more information, see:
"About exporting worksheets to Microsoft Excel Web Query format"
Page ItemsUse this list to specify the page items you want Microsoft Excel end users to specify a value for when they open Web Query file.
■ Select
Use check boxes in this column to select and deselect page items. Select the check box to prompt Microsoft Excel end user for a value for that page item. Clear the check box to always see data for the current page item displayed in the worksheet.
■ Page Item
This column shows the name of the page items in the current worksheet.
■ Worksheet Name
This column shows the name of the worksheet that contains the page item.
Note: This column is only displayed if you export an entire workbook.
Select AllUse this button to select all page items in the list.
Select NoneUse this button to deselect all page items in the list.
Export Wizard dialog: Parameter Prompts page
23-88 Oracle Business Intelligence Discoverer Plus User’s Guide
Export Wizard dialog: Parameter Prompts page
Use this dialog to specify the parameter values you want Microsoft Excel end users to specify when they open current worksheet exported to Web Query (*.IQY) format. For example, if you export a worksheet with a Year parameter, you might want Microsoft Excel end users to specify the year they want to analyze. If you do not prompt Microsoft Excel end users for parameter values, they will always see data for the current parameter values displayed in the worksheet.
Note: This dialog is displayed if you select Web Query for Microsoft Excel 2000+ (*.iqy) as the export type and select the Parameter Values check box on the "Export Wizard dialog: Format and Name page".
For more information, see:
"About exporting worksheets to Microsoft Excel Web Query format"
ParametersUse this list to specify the parameters you want Microsoft Excel end users to specify a value for when they open Web Query file.
■ Select
Use check boxes in this column to select and deselect parameters. Select the check box to prompt Microsoft Excel end user for a value for that parameter. Clear the check box to always see data for the current parameter displayed in the worksheet.
■ Parameter
This column shows the name of the parameters in the current worksheet.
■ Current Value(s)
This column shows the current value of the parameter. If the Microsoft Excel end user does not specify a different parameter value when prompted, this parameter value is applied to the worksheet values.
■ Worksheet Name
This column shows the name of the worksheet that contains the parameter.
Note: This column is only displayed if you export an entire workbook.
Select AllUse this button to select all parameters in the list.
Select NoneUse this button to deselect all parameters in the list.
Export Wizard dialog: Select page
Dialog reference 23-89
Export Wizard dialog: Select page
Use this dialog to specify what data you want to export. For example, you might want to export the current worksheet or all worksheets, or export graph data with worksheets.
For more information, see:
"Exporting data to other applications"
What do you want to export?Use these radio buttons to specify what data you want to export.
■ Entire workbook
Use this radio button to export all worksheets in the workbook, including all graphs.
Note: If you have extraneous worksheets in a workbook, this option might affect Discoverer performance. For more information about maximizing Discoverer performance, see "About designing workbooks for maximum performance".
■ Current worksheet
Use this radio button to export the worksheet that you currently have open.
■ Table/Crosstab
Use this check box to export the currently displayed worksheet.
■ Graph
Use this check box to export the currently displayed graph.
Export Wizard dialog: Supervise page
23-90 Oracle Business Intelligence Discoverer Plus User’s Guide
Export Wizard dialog: Supervise page
Use this dialog to choose whether to monitor the export whilst it is in progress. For example, if the worksheet uses large queries, you might want to respond to warnings about how long queries will take.
For more information, see:
"Exporting data to other applications"
Do you want to supervise the export process?■ Supervised
Use this radio button when you think that the export might take a long time or might produce more than the maximum amount of data. You can then respond to warnings during the process.
■ Unsupervised
Use this radio button when you want to export the data regardless of possible warnings about how long the export will take or how much data will be produced.
Note: For more information about how to manage queries that run during exports, see "Options dialog: Query Governor tab".
Find dialog (in Item Navigator)
Dialog reference 23-91
Find dialog (in Item Navigator)
Use this dialog to find items or folders that you want to add to a worksheet. This is useful when you have a large business area, or want to add items from different business areas without having to navigate to those business areas.
For example, you might want to search for folders that begin with the letter 'C', or search for items that contain the text 'Transaction'.
For more information, see:
"What are worksheets?"
"How to edit worksheets using the Edit Worksheet wizard"
Search inUse this drop down list to specify which business area you want to search. If you want to search all business areas in the current End User Layer, choose the 'All Business Areas' option.
Search byUse this drop down list to specify how you want to match items. For example, choose 'Starts With' and enter 'T' as a Search for value to find only items beginning with the letter 'T'.
Search forUse this field to enter the text that you want to match against. For example, enter 'T' here and choose Starts With in the Search by drop down list to find only items beginning the letter 'T'.
GoUse this button to start the search according to the search criteria that you have specified, and display matching items and folders in the Results list below.
Case-sensitiveUse this check box to specify whether you want to match upper and lower case letters exactly when searching (e.g. when selected, the search term 'New York' would find 'New York', but would not find 'NEW YORK', 'new york', or 'new York').
ResultsThis list displays items that match the search criteria that you have specified. Use this list to choose items that you want to add to the worksheet.
To select items from the Results list, do one of the following:
■ double-click on an item in the Results list to select the item in the "Edit Worksheet dialog: Select Items tab"
■ select an item in the Results list and click OK to return to the "Edit Worksheet dialog: Select Items tab"
When you select an item in the Results list, the item is highlighted in the Available list in the Item Navigator. To select the item, move the item from the Available list to the Selected list.

Find dialog (in Item Navigator)
23-92 Oracle Business Intelligence Discoverer Plus User’s Guide
Note: You can only select items from grayed in folders in the Available list. For more information, see the Discoverer manager.
Find dialog (in Worksheet)
Dialog reference 23-93
Find dialog (in Worksheet)
Use this dialog to find data in the currently displayed worksheet. This is useful in large worksheets. For example, to find cell values that contain New York.
For more information, see:
"What are worksheets?"
"How to find data in a worksheet"
Search inUse this drop down list to specify which worksheet area you want to search (e.g. worksheet headings or worksheet data), as follows:
■ Select the Data only option to search the worksheet cell values (i.e. data points), but not heading values in the left and top axes.
■ Select the Both data and heading option to search both the worksheet cell values (i.e. data points) and the heading values in the left and top axes.
Note: This drop down list is only enabled on crosstab worksheets. On table worksheets, you can only search worksheet data.
Search byUse this drop down list to specify how you want to match search text. For example, choose Contains here and type New York in the Search for field to find worksheet values containing New York.
Note: If you choose the Is Null option, you search for null values regardless of how null values are displayed. To specify how null values are displayed, choose Tools | Options, display the "Options dialog: Sheet tab", and select an option in the Show null values as field.
Search forUse this field to enter the search text that you want to find. For example, type New York here and choose Contains in the Search by drop down list to find worksheet values containing New York.
Note: This field is not enabled if you choose the Is Null option from the Search by drop down list.
Case-sensitiveUse this check box to specify whether you want to match upper and lower case letters exactly when searching (e.g. when selected, the search term 'New York' would find 'New York', but would not find 'NEW YORK', 'new york', or 'new York').
Find PreviousUse this button to search backwards for the specified text. When the search reaches the beginning of the worksheet, Discoverer goes back to the end of the worksheet and resumes the search.
Find dialog (in Worksheet)
23-94 Oracle Business Intelligence Discoverer Plus User’s Guide
Find NextUse this button to search forwards for the specified text. When the search reaches the end of the worksheet, Discoverer goes back to the start of the worksheet and resumes the search.
Notes■ You can only search worksheet data that is currently displayed. A worksheet
search does not include:
■ other page items (if specified).
■ data not yet displayed (e.g. because Discoverer only data specified number of rows at a time). To change the number of rows retrieved at a time, choose Tools | Options, display the "Options dialog: Query Governor tab", and specify a value in the Retrieve data incrementally in groups of field.
Following Value dialog
Dialog reference 23-95
Following Value dialog
Use this dialog to create a following value calculation. A following value calculation returns the value that is a specified number of rows or a specified time period after each value. For example, you might want to know what the following month’s sales are for each value.
You typically use following value to create calculations for use in other calculations. For example, you might use the following month’s sales values to calculate the change in sales from the following month as a percentage of annual sales.
This type of analysis is sometimes referred to as LAG/LEAD analysis.
Note: To return a preceding value rather than a following value, use the Preceding Value dialog (see "Preceding Value dialog").
For more information, see:
"What are analytic functions?"
"Examples of using row-based and time-based intervals"
"How to create a new calculation using an analytic function template"
"LAG/LEAD function examples"
Following value ofUse this drop down list to choose the item for which you want to return the following value. For example, you might choose Sales SUM to calculate the following sales value.
Return valueUse this drop down list to specify the number of rows or the number of time periods in which you want to compare the values. For example, you might choose '3' to compare sales values with sales values three months in advance.
Use the adjacent drop down list to choose a row-based interval or a time-based interval. For example, you might choose Months Following Current Value to compare sales values with later sales values.
Hint: If you have time-based data, use time-based groups (e.g. Days/Weeks/Months After Current Value). If you do not have time-based data, use row-based groups (e.g. Rows After Current Value). For more information about types of group, see "About windowing".
For examples of specifying row-based and time-based intervals, see "Examples of using row-based and time-based intervals".
Order rows byUse this drop down list to specify how to order the worksheet values. For example, you might choose Calendar Month to compare sales with sales one month in advance. Then use the adjacent drop down list to specify whether to order values in ascending order (i.e. Lowest to Highest) or descending order (i.e. Highest to Lowest).
Hint: If you have specified a time-based group in the Return value fields, specify a time-based value in the Order rows by fields (e.g. Calendar Month).
Following Value dialog
23-96 Oracle Business Intelligence Discoverer Plus User’s Guide
Then order rows byUse this drop down list to specify a secondary order for the values. For example, you might choose City to sort values on city within month. Then use the adjacent drop down list to specify whether to order values in ascending order (i.e. Lowest to Highest) or descending order (i.e. Highest to Lowest).
Note: This drop down list only enabled if you specified a row-based group in the Following value drop down list. This drop down list is only disabled if you specified a time-based group in the Following value drop down list.
Restart calculation at each change inUse this list to specify which groups to use if you want to arrange results into groups (sometimes referred to as partitions).
For example, to calculate the following value in Sales SUM values between months within year, you might choose Calendar Year.
If you do not specify a group, Discoverer treats all worksheet values as a single group.
CalculationThis read-only field displays the underlying formula that you are building as you specify values for the fields above. This formula is updated each time you change one of the values in the fields above. When you click OK, the formula is transferred to the Calculation field in the "New Calculation dialog" or the "Edit Calculation dialog".
Notes■ A following value calculation will return a null value if the following row is
beyond the last row in the group.
Format dialog
Dialog reference 23-97
Format dialog
Use this tab to select a worksheet item to format. For example, you might want to changes their font, font size, color, alignment, and how they text wrap.
This dialog is also displayed as:Worksheet Wizard: Format dialog
For more information, see:
"How to change the format of worksheet items"
Click an item in the list to edit its heading, or to change the format for its dataUse this list to choose which items you want to change. This list contains all items currently displayed on the worksheet.
ExampleThis area shows how the selected item will look on the worksheet.
Format DataUse this button to display the "Format Data dialog: Format tab", where you change how the values look on the worksheet.
Format HeadingUse this button to display the "Format heading dialog", where you change how the item headings look on the worksheet.
Edit HeadingUse this button to display the "Edit Heading dialog", where you change the item headings that appear on worksheets. For example, you might want to change the heading 'Month' to 'Sales Month'.
Format Data dialog
23-98 Oracle Business Intelligence Discoverer Plus User’s Guide
Format Data dialog
Use this dialog to change the format of the currently selected worksheet item. For each item, you can change the:
■ font and font size
■ font style
■ text and background color
■ text alignment
■ text wrapping
■ date style (for date items)
■ number style (for number items)
■ text style (for text items) using styles defined by the Discoverer manager
For more information, see:
"About Discoverer worksheet types"
"Format Data dialog: Date tab"
"Format Data dialog: Format tab"
"Format Data dialog: Number tab"
"Format Data dialog: Text tab"
"Format Data dialog: Breaks tab"
Format Data dialog: Breaks tab
Dialog reference 23-99
Format Data dialog: Breaks tab
Use this tab to change the group sorting style of the currently selected worksheet item (for more information about group sorting, see "What is group sorting?"). For example, if you create a group sort on a worksheet item called Region, you might want to insert a blank row after each region to make the worksheet more readable.
Note: These options are grayed out when the selected item is not group sorted. If you want to specify breaks for the selected item, first create a group sort on the item (for more information, see "How to sort data on a table worksheet"). You cannot apply a group sort to an item on a crosstab worksheet.
For more information, see:
"About Discoverer worksheet types"
"What is group sorting?"
Insert
LineUse this check box to enable the adjacent fields, which enable you to separate data rows on a worksheet with a horizontal line. The fields enable you to specify a line thickness and line color. For example, if worksheet data is grouped by region, you might want to display a thick blue line between each region.
Blank RowUse this check box to enable the adjacent field, which enables you to separate data rows on a worksheet with one or more blank lines. The adjacent field enables you to specify the number of blanks lines. For example, if worksheet data is grouped by region, you might want to display two blank lines between each region.
Page BreakUse this check box to separate data rows on a worksheet by displaying each group on a new page. For example, if worksheet data is grouped by region, you might want to display each region on a separate page in the worksheet.
Format Data dialog: Date tab
23-100 Oracle Business Intelligence Discoverer Plus User’s Guide
Format Data dialog: Date tab
Use this tab to change the format of the currently selected date worksheet item. For example, to change the font style, text color, text alignment, or the layout of date characters.
For more information, see:
"About Discoverer worksheet types"
CategoriesUse this list to select a predefined format for the currently selected date item.
TypeUse this list to select a date type.
ExampleThis field shows how the type selected in the Type list will look on the worksheet.
TypeUse this list (which is displayed when the Custom category is selected) to either choose from an existing custom type, or to create your own custom type. For example, you might want to create a new type to display time as SS:MM:HH rather than HH:MM:SS.
Hint: To create a new custom type:
1. select a type from the Type list
2. enter changes in the Edit Type field
3. click Add to save changes
Use the Example field to see how changes affect how the item is displayed.
Format Data dialog: Format tab
Dialog reference 23-101
Format Data dialog: Format tab
Use this tab to change the format of the currently selected worksheet item. For example, to change default the font, text size, text color, and alignment. Each option changes the default item format for the item currently selected on the Edit Worksheet - Format tab (see "Format dialog").
This dialog is also displayed as:Format dialog (for a Conditional Format)
For more information, see:
"About Discoverer worksheet types"
FontUse this drop down list to specify a text font for the item.
SizeUse this drop down list to specify a font size for the item.
StyleUse this drop down list to specify a font style for the item (e.g. bold, italic, underlined).
Color
TextUse this color pane to specify a color for the item text.
BackgroundUse this color pane to specify a background color for the item text.
AlignmentUse these buttons to set the vertical and horizontal text alignment.
Wrap words in cellUse this check box to wrap the item text to fit into the space available. When not selected, the text is cut-off if it exceeds the space available.
ExampleThis area shows how the type selected will look on the worksheet.
Show Actual font sizeUse this check box to display text in the example area in the font size and style selected.
Format Data dialog: Number tab
23-102 Oracle Business Intelligence Discoverer Plus User’s Guide
Format Data dialog: Number tab
Use this tab to change the format of the currently selected numeric worksheet item. For example, to change default the currency symbol, number of decimal places, percent sign, and how negative numbers are displayed.
For more information, see:
"About Discoverer worksheet types"
Note: The fields displayed depend on the category of number displayed in the Categories list.
CategoriesUse this list to select a predefined format for the currently selected numeric item.
Decimal PlacesUse this list to specify the number of decimal places that you want to display for the item.
Display symbolUse this check box to display this currency symbol in front of values for the current item.
Use 1000 SeparatorUse this check box to separate large numbers with a separator (e.g. English speaking countries use a comma (,) at every 1000. For example, 1,900,120.
Negative NumbersUse this list to select how to display negative numbers on the worksheet. For example, in red, or in brackets, or prefixed with a minus symbol (-).
TypeUse this list (which is displayed when the Custom category is selected) to either choose from an existing custom type, or to create your own custom type. For example, you might want to create a new type to display money as 99999990 rather than 999G990.
Hint: To create a new custom type:
1. Select a type from the Type list.
2. Enter changes in the Edit Type field.
3. Click Add to save changes.
Use the Example field to see how changes affect how the item is displayed.
Notes■ For private connections, the Locale setting on the Create/Edit Connection:
Connection details page determines the default currency symbol displayed. To change the currency symbol, change the Locale setting on the Create/Edit Connection: Connection details page (select the Update link next to the connection you want to edit). For public connections, contact the Discoverer manager to

Format Data dialog: Number tab
Dialog reference 23-103
change the default language and currency symbol. For more information about specifying a currently symbol for worksheet items, see "How to set the currency symbol for numeric items".
Format Data dialog: Text tab
23-104 Oracle Business Intelligence Discoverer Plus User’s Guide
Format Data dialog: Text tab
Use this tab to change the format of the currently selected text worksheet item. For example, to change the text to upper case, lower case, or to capitals.
For more information, see:
"About Discoverer worksheet types"
CategoriesUse this list to look at types available in each category (see Type list).
TypeUse this list to specify a pre-defined text type from the options available. For example, choose UPPERCASE to change text to upper case.
ExampleThis field shows how the type selected will look on the worksheet.
Format heading dialog
Dialog reference 23-105
Format heading dialog
Use this tab to change the heading format of the currently selected item. For example, to change the text to upper case, lower case, or to capitals.
For more information, see:
"About Discoverer worksheet types"
FontUse this drop down list to specify a text font for the item.
SizeUse this drop down list to specify a font size for the item.
StyleUse this drop down list to specify a font style for the item (for example bold, italic, underlined, or sans-serif).
Color
TextUse this color pane to specify a color for the item text.
BackgroundUse this color pane to specify a background color for the item text.
AlignmentUse these buttons to set the vertical and horizontal text alignment.
Wrap words in cellUse this check box to wrap the item text to fit into the space available. When not selected, the text is cut-off if it exceeds the space available.
ExampleThis area shows how the type selected will look on the worksheet.
Show Actual font sizeUse this check box to display text in the example area in the font size and style selected.
Group Total dialog
23-106 Oracle Business Intelligence Discoverer Plus User’s Guide
Group Total dialog
Use this dialog to create a group total calculation (sometimes referred to as a reporting aggregate). A group total calculation aggregates values within a group. For example, you might want to calculate a total sales value for each quarter.
This type of analysis is sometimes referred to as windowing analysis.
For more information, see:
"What are analytic functions?"
"How to create a new calculation using an analytic function template"
"Windowing function examples"
Total onUse this drop down list to choose the item for which you want to calculate the group total. For example, you might choose Sales SUM to calculate a total sales value for each year.
Total typeUse this drop down list to specify the type of total you want. For example, choose 'f(x) Sum' to add values in the group, or 'f(x) Avg' to produce an average of the values in the group.
Restart total at each change inUse this list to specify which groups to use if you want to arrange results into groups (sometimes referred to as partitions).
For example, to calculate the total of Sales SUM values within year, you might choose Calendar Year. In other words, if you have sales values spanning two years, you will have a group total value for each year.
If you do not specify a group, Discoverer treats all worksheet values as a single group.
CalculationThis read-only field displays the underlying formula that you are building as you specify values for the fields above. This formula is updated each time you change one of the values in the fields above. When you click OK, the formula is transferred to the Calculation field in the "New Calculation dialog" or the "Edit Calculation dialog".
Notes ■ A group total analytic function is similar to a Discoverer worksheet total.
However, the group total analytic function calculates a total value for each row in the group. Therefore, you can use group total analytic functions to build more complex calculations. For example, you might use a group total analytic function to calculate the Sales SUM as a percentage of the group total for the region.
Header/Footer Font dialog
Dialog reference 23-107
Header/Footer Font dialog
Use this dialog to select font details for the text in the header or footer that you create for a printed worksheet using the "Page Setup dialog: Header/Footer tab". For example, you might want to increase the font size for header text from 12 to 18.
For more information, see:
"About printing in Discoverer Plus Relational"
"What are Page Setup options"
"How to print Discoverer worksheets"
FontUse this drop down list to specify a text font for the text in the header or footer.
SizeUse this drop down list to specify a font size for the text in the header or footer.
StyleUse these buttons to specify a font style (e.g. bold, italic) for the text in the header or footer.
Actual font sizeUse this check box to specify how you want to display text in the Example area. Select this check box to display text in the point size specified in the Size field. For example, you might want to see whether a small font size is readable.
Heading Format dialog (Default Options)
23-108 Oracle Business Intelligence Discoverer Plus User’s Guide
Heading Format dialog (Default Options)
Use this tab to change the default heading style for new worksheet items.
Note: Changing the default heading style does not change the heading style for existing worksheet items. Choose Format | Item Formats to change the format of existing worksheet items.
For more information, see:
"About Discoverer worksheet types"
FontUse this drop down list to specify a text font.
SizeUse this drop down list to specify a font size.
StyleUse this drop down list to specify a font style (for example bold, italic, underlined, or sans-serif).
ColorUse this icon to display a color chart, where you can change the default color.
TextUse this color pane to specify a color for the item text.
AlignmentUse these buttons to set the horizontal text alignment (where applicable).
Actual font sizeUse this check box to display text in the example area in the font size and style selected.

Join folders dialog
Dialog reference 23-109
Join folders dialog
Use this dialog to specify how folders should be joined. Discoverer displays this dialog when it detects more than one possible join between two folders, when you create a worksheet.
For example, a product key item in a Products folder might be joined with a product key item in a Sales folder. The Products folder and Sales folder might also be joined by another item (e.g. Location) that exists in both of the folders. In this example Discoverer will display both joins enabling you to select the appropriate join for the query.
For more information, see:
"About multiple join paths"
There are several ways to join the folders you have selected. Please select the join or joins you want to use:Use this list to select how you want to join folders.
It is recommended that you select all the joins displayed to make sure that Discoverer displays accurate results data.
Contact the Discoverer manager if you are not sure about selecting joins.
Note: Discoverer displays this dialog only if you have cleared the Disable Multiple Join Paths check box (for more information, see the "Options dialog: Advanced tab").
Manage Links dialog
23-110 Oracle Business Intelligence Discoverer Plus User’s Guide
Manage Links dialog
Use this dialog to create, edit, and delete drill links in Discoverer.
For more information, see:
"About user defined drill links"
"About drilling in Discoverer worksheets"
ItemUse this drop down list to select the worksheet item for which you want to create or edit a drill link. You can create more than one drill link on the same worksheet item. Discoverer displays a list of drill link names when the drill link is selected in a worksheet.
ListsUse this list to select an existing drill link to edit or delete, or to rearrange the order in which multiple drill links are displayed in the worksheet. Use the up arrow and down arrow buttons next to the list to rearrange the order in which Discoverer presents multiple drill links when a drill link icon is selected in a worksheet.
New LinkUse this button to display the "New Link dialog", which enables you to add a drill link to a worksheet item. You can add more than one drill link to the same worksheet item.
Edit LinkUse this button to display the "Edit Link dialog", which enables you to edit the currently selected drill link.
Hint: When you display the "Edit Link dialog", Discoverer does not allow you to change the drill link type (i.e. you cannot change a worksheet drill link to an Internet page address, or change an Internet page address to worksheet link). If you want to create a drill link of a different type, click New Link to display the "New Link dialog" and create a new drill link.
Delete LinkUse this button to remove the currently selected drill link from the worksheet.
Notes■ You create drill links in Discoverer Plus Relational.
■ You can use drill links to navigate worksheets in both Discoverer Plus Relational and Discoverer Viewer.
Manage Workbooks dialog
Dialog reference 23-111
Manage Workbooks dialog
Use this dialog to manage Discoverer workbooks. For example, you might want to open workbooks, delete old workbooks, or share workbooks with other users.
For more information, see:
"What are workbooks?"
ViewUse this list to specify the type of workbooks you want to display in the Workbooks list. For example, you might choose My Workbooks to display only workbooks owned by the database user that you are logged in as.
<View style button>Use this drop down list to select a style for the Workbooks list. For example, you might choose the User Tree option to display workbooks grouped by database user. Or you might choose Workbook Tree to display workbooks in alphabetical order.
Name containsUse this field to restrict the Workbooks list to those workbooks with names that contain the character(s) that you specify. For example, enter 'January' to display in the Workbooks list only those workbooks with names that contain January.
ClearUse this button to clear any text in the Name contains field and display the names of all workbooks in the Workbooks list.
Workbooks
Use this list to select workbooks that you want to manage. Workbooks are represented by a book icon. Scheduled workbooks are represented by a clock icon.
Hint: Click on a column name to sort the Workbooks list on that column. Click on the arrow in a column name to reverse the sort order. You can also drag and drop columns to a different position in the Workbooks list.
Hint: Right-click on a workbook to display a right-click menu that enables you to delete the workbook or display the workbook’s properties.
OpenUse this button to open the currently selected workbook. You can only open one workbook at a time.
DeleteUse this button to delete the currently selected workbook. You can delete more than one workbook at the same time. You can only delete workbooks that you own. The Delete button is only grayed out if you do not own the currently selected workbook (for more information, see "About sharing workbooks and security").
Manage Workbooks dialog
23-112 Oracle Business Intelligence Discoverer Plus User’s Guide
ShareUse this button to display the "Share Workbooks dialog: User -> Workbook tab", which enables you to share the currently selected workbook. You can only share workbooks that you own. The Share button is only grayed out if you do not own the currently selected workbook (for more information, see "About sharing workbooks and security").
PropertiesUse this button to display the "Workbook Properties dialog", which displays properties (e.g. owner, creation date) of the currently selected workbook.
DescriptionThis field displays additional information about the workbook, which was entered using the "Workbook Properties dialog". Use this information to help you decide which workbook you want to analyze. This area is blank if no description is available.
Hint: To add or edit the description, update the workbook properties (for more information, see "How to view and update a workbook’s properties").
Move Worksheets dialog
Dialog reference 23-113
Move Worksheets dialog
Use this dialog to rearrange the worksheets in the workbook. For example, you might want to move an important worksheet to the front of a workbook so that it is displayed when a workbook is opened by another Discoverer user.
For more information, see:
"What are worksheets?"
WorksheetsUse this list to select which worksheet you want to move.
Up arrowUse this button to move the selected worksheet one position up the worksheet list.
Down arrowUse this button to move the selected worksheet one position down the worksheet list.
Moving Total dialog
23-114 Oracle Business Intelligence Discoverer Plus User’s Guide
Moving Total dialog
Use this dialog to create a moving total calculation. A moving total calculation calculates a total for the specified number of rows or a specified time period before each value. For example, you might want to a three month moving average of sales figures.
This type of analysis is sometimes referred to as windowing analysis.
For more information, see:
"What are analytic functions?"
"Examples of using row-based and time-based intervals"
"How to create a new calculation using an analytic function template"
"Windowing function examples"
Total onUse this drop down list to choose the item for which you want to calculate the moving total. For example, you might choose Sales SUM to calculate a moving total of sales values.
Total typeUse this drop down list to specify what type of total you want. For example, choose 'f(x) Sum' to add values in the group, or 'f(x) Avg' to produce an average of the values in the group.
Start onUse this drop down list to specify the number of rows or the number of time periods in which you want to compare the values.
You specify a number of rows or a time period before the current value. For example, you might choose 2 to calculate the total from two values before each value, including the current value. In other words, you choose 2 if you want a three month moving average.
Use the adjacent drop down list to choose a row-based interval or a time-based interval. For example, you might choose Months Before Current Value if you want a three month moving average.
Hint: If you have time-based data, use time-based groups (e.g. Days/Weeks/Months Before Current Value). If you do not have time-based data, use row-based groups (e.g. Rows Before Current Value). For more information about types of group, see "About windowing".
For examples of specifying row-based and time-based intervals, see "Examples of using row-based and time-based intervals".
Order rows byUse this drop down list to specify how to order the values. For example, you might choose Calendar Month if you want a three month moving average.
Use the adjacent drop down list to specify whether to order values in ascending order (i.e. Lowest to Highest) or descending order (i.e. Highest to Lowest).
Moving Total dialog
Dialog reference 23-115
Hint: If you have specified a time-based group in the Start on drop down list, specify a time-based Order rows by value (e.g. Calendar Month).
Then order rows byUse this drop down list to specify a secondary order for the values. For example, you might choose City to sort values on city within month.
Use the adjacent drop down list to specify whether to order values in ascending order (i.e. Lowest to Highest) or descending order (i.e. Highest to Lowest).
Note: This drop down list is only enabled if you specified a row-based group in the Start on drop down list. This drop down list is only disabled if you specified a time-based group in the Start on drop down list.
Restart moving total at each change inUse this list to specify which groups to use if you want to arrange results into groups (sometimes referred to as partitions).
For example, to calculate a three month moving average for Sales SUM values within a give year and region, you might choose Calendar Year and Region.
If you do not specify a group, Discoverer treats all worksheet values as a single group.
CalculationThis read-only field displays the underlying formula that you are building as you specify values for the fields above. This formula is updated each time you change one of the values in the fields above. When you click OK, the formula is transferred to the Calculation field in the "New Calculation dialog" or the "Edit Calculation dialog".
New Calculation dialog
23-116 Oracle Business Intelligence Discoverer Plus User’s Guide
New Calculation dialog
Use this dialog to create a new calculation. For example, you might want to analyze the worksheet data in a new way and add a column to the worksheet to do this.
For more information, see:
"What are calculations?"
"Discoverer calculation examples"
"What are analytic functions?"
"How to create a new calculation using an analytic function template"
What do you want to name this calculation?Use this field to enter a descriptive name for the calculation item. This name is displayed in calculation lists and on worksheets as the column header of the calculation results column. If you leave this box blank, Discoverer creates a default name for you.
ShowUse this drop down list to display calculations, functions, items and parameters that you can use to build a calculation. To include items in the calculation, paste them into the Calculation field.
Use the Show list options as follows:
■ Use the Functions option to display an extensive list of predefined Oracle functions.
■ Use the Selected option to display items in the worksheet.
■ Use the Available option to display all items in the business area.
■ Use the Calculations option to display existing worksheet calculations.
■ Use the Parameters option to display existing worksheet parameters. When you add parameters to the Calculation field, the parameter name is prefixed with ':' to indicate that it is a dynamic value set by the worksheet user. For more information about adding parameters to calculations, see "About using parameters to collect dynamic user input".
PasteUse this button to the add the item currently selected in the Show list to the Calculation. The item is copied into the Calculation field.
CalculationUse this field to enter the calculation details (for calculation examples, see "Discoverer calculation examples").
Note: When you add text to this field using the Paste button or a template, the text is appended to any existing text in the Calculation field, unless text in the Calculation field is selected.
To create a calculation, you one or more of the following methods:
■ Type the formula directly into the Calculation field.
New Calculation dialog
Dialog reference 23-117
Note: If you type an expression in the Calculation field, you must prefix the expression with an equals sign (i.e. =). For example, '=Sales SUM-Costs SUM'.
■ Paste items and functions from the Show field into your calculation.
■ Click the operator buttons underneath the Calculation field to use them in the calculation.
■ Use a template to help you define an analytic function. Click Insert Formula from Template (see Insert Formula from Template field below).
Insert Formula from TemplateUse this button to display a pop-up list of templates that you can use to build analytic functions. For example, choose Rank to display an easy-to-use Rank template that helps you create a ranked list position calculation. For more information about templates available, see "What analytic function templates are available in Discoverer?". When you use a template, the formula that you create is appended to any existing text in the Calculation field, unless text in the Calculation field is selected.
Operator buttons [+] [-] [x] [/] [%] [(] [)] [||]Use these buttons to add operators to the calculation. Operators are copied into the Calculation field.
Note: When you use arithmetic expressions in a calculation, the multiply and divide operators are executed first, regardless of their position in the calculation. If you have more than one operator of the same precedence, they are evaluated from left to right.
For example, the calculation Price – Discount * Quantity is evaluated as Discount*Quantity subtracted from Price. If you use parentheses around the subtraction expression (Price – Discount), the subtraction is executed before the multiplication.
OKUse this button to validate and save the calculation, as follows:
■ If the calculation has valid syntax, the calculation is saved and displayed in the Calculations dialog.
■ If the calculation has invalid syntax, an error message is displayed. You must correct any syntax errors before you can save the calculation.
Notes■ The table below shows the functions available in the box beneath the Show drop
down list.
Category Description
All Functions An alphabetical list of all functions.
Analytic Advanced statistical analysis, such as RANK, NTILE, CORR.
Conversion Converting from one data type to another, such as: RAWTOHEX, TO_CHAR, TO_DATE.
Database Optional category that is displayed when user defined functions are available (created using the Register PL/SQL Functions facility on the Tools menu in Oracle Discoverer Administrator).
New Calculation dialog
23-118 Oracle Business Intelligence Discoverer Plus User’s Guide
■ For detailed information about all functions available in Discoverer, see Oracle SQL Reference and Oracle Data Warehousing Guide.
■ For examples of the most commonly used functions, see "Discoverer calculation examples".
■ To correct a divide by zero error, modify the calculation to check for a zero-value in the denominator and return a value of zero (for the entire calculation). For example, Instead of (SS+PS)/(SS-PS), use DECODE ((SS-PS), 0, 0, ((SS+PS)/(SS-PS))).
Date Manipulating date items such as ADD_MONTHS, NEW_TIME, SYSDATE and NEXTDATE.
Group Aggregate and statistical functions including SUM, COUNT, MAX, MIN, VARIANCE.
Numeric Numeric items and floating point such as COS, LOG, MOD, POWER.
Others Miscellaneous functions such as LEAST, USER, DECODE, ROWNUM.
String Character items, text operations such as INITCAP, LPAD, NLS_UPPER.
Category Description
New Condition dialog
Dialog reference 23-119
New Condition dialog
Use this dialog to create a new condition item. For example, you might want to filter the data in the worksheet data in a new way.
For more information, see:
"What are conditions?"
What would you like to name your condition?Use this field to enter a descriptive name for the condition item. This name is displayed in the condition list on the Conditions dialog.
Generate name automatically?Use this check box if you want Discoverer to create a default name for you. The default name is based on the condition syntax.
What description would you like to give your condition?Use this field to enter a brief description for the new condition. This description is displayed in the description box on the Conditions dialog and helps workbook users choose which condition they want to use.
FormulaThis area is where you build the condition. The condition can contain one or more condition statements.
Item Use this drop down list to filter the worksheet by selecting an item to match against. For example, to filter information about people whose salary is more than $30,000, you might choose an item called 'Salary' here.
You can also choose from the following options:
■ If you want to add an existing condition, choose Select Condition... to display the "Select Condition dialog".
■ If you want to insert a calculation to use in the condition formula, choose Create Calculation... to display the "New Calculation dialog".
ConditionThis drop down list displays a list of logical operators that you can use to match against the Item selected. For example, to filter information about people who earn more than $30,000, you might choose the 'greater than' operator (>) here.
For more information on logical operators available, see Notes below.
ValuesUse this field to enter (or select from the drop down list) one or more values that you want to use to match against the selected Item. For example, if you want filter information about people who earn more than $30,000, enter 30,000 here.
You can also choose from the following options from the drop down menu:
New Condition dialog
23-120 Oracle Business Intelligence Discoverer Plus User’s Guide
■ If you want to match the selected item against a new calculation, choose Create Calculation to display the "New Calculation dialog".
■ If you want to match the selected item against an existing worksheet item, choose Select Item to display the "Select Item dialog".
■ If you want to match the selected item against a new worksheet parameter, choose New Parameter to display the "New Parameter dialog".
■ If you want to match the selected item against an existing parameter, choose Select Parameter to display the "Select Parameter dialog".
■ To specify a date using a graphical calendar, click the down arrow to the right of the field and choose Select From Calendar to display the "Calendar dialog".
■ If the Item has an LOV that is too long to display, choose Select Multiple Values to search for and select values using the "Select Values dialog".
Note: You can enter up to 254 values in this field. If you want to enter more than 254 values in the condition, click Advanced and use the OR option to add a new condition statement line for the extra values.
Hint: If you are entering a percentage value, enter the decimal value of the percentage. For example, enter '.5' for 50% (for more information, see Notes below).
Case sensitiveUse this check box to make the condition case sensitive when matching against text data. For example, if turned on, the value 'New York' would not find details containing 'NEW YORK'. If turned off, the value 'New York' would find details containing 'NEW YORK' and 'new york'.
AdvancedUse this button to expand the dialog box enabling you to apply multiple condition statements to an item. The expanded dialog displays New Item, And, Or, Delete and Undo buttons. A Group column is also added to the Formula box (see Group below).
Expanded Advanced options
New ItemUse this button to add a new condition statement line to the condition. By default, new condition statement lines are grouped with the logical AND operator. In other words, the data must satisfy both condition statements to be filtered in the worksheet (see Group below).
AndUse this button to add a new condition statement line to the condition and group it with the previous condition statement line with a logical AND operator. Using 'AND' narrows a search to display only items that match all criteria. For example, with two condition statements, data must match condition statement one and condition statement two.
OrUse this button to add a new condition statement line to the condition and group it with the previous condition statement line with a logical OR operator. Using 'OR' widens a search to display items that match any of the criteria. For example, with two
New Condition dialog
Dialog reference 23-121
condition statements, data must match either condition statement one or condition statement two. (In SQL terms, this is an inclusive OR clause.)
DeleteUse this button to remove the currently selected condition statement line from the condition.
UndoUse this button to retrieve the deleted condition details if you delete a condition statement line from the condition and then change your mind.
Group
ANDUse this button to change the Group operator to a logical ‘AND’. You must have the current Group item selected. Using 'AND' narrows a search to display only items that match all criteria in the group.
ORUse this button to change the Group operator to a logical ‘OR’. You must have the current Group item selected. Using 'OR' widens a search to display items that match any of the criteria in the group.
NOT ANDUse this button to change the Group operator to a logical ‘NOT AND’ operator.
NOT ORUse this button to change the Group operator to a logical ‘NOT OR’ operator.
Notes■ The following table describes logical operators available when matching data
against items.
Operator Meaning How it is used
= equals Year = 2001
Display only data for the year 2001.
<> Not equals Year <> 2001
Display data where the year is not 2001
> Greater than
Clicks > 10
Display data where the number of clicks on a website is more than 10
< Less than Salary < 50,000
Display data for people who earn less than 50,000
LIKE Similar to Employee_name LIKE CH%
Display data for employees whose name begins with CH.

New Condition dialog
23-122 Oracle Business Intelligence Discoverer Plus User’s Guide
■ If you are creating a condition that filters a Percent Rank or Percentage Contribution calculation, you need to enter the percentage value as a decimal value. For example, if you want to find values in the top 50%, you enter '.5' in the Values field, not '50'.
This is because the underlying worksheet values are decimals, not integers. Discoverer applies the whole number formatting to the decimal values.
IN Equal to any member of
WHERE job IN ('CLERK','ANALYST');
Operator Meaning How it is used
New Conditional Format dialog
Dialog reference 23-123
New Conditional Format dialog
Use this dialog to create a new conditional format to highlight exceptional data for a worksheet item. For example, you might want to highlight sales figures greater than 100,000 by displaying them with a blue background.
This dialog is also displayed as:Edit Conditional format dialog
For more information, see:
■ "About managing conditional formatting"
■ "What is a conditional format?"
■ "Examples of conditional formatting"
Note: You can only have one active conditional format or stoplight format for each numeric worksheet item. For example, if you want to activate a conditional format on a worksheet item that already has a active stoplight format, you must first deactivate (or delete) the existing stoplight format.
What would you like to name your Conditional Format?Use this field to specify a short name for the conditional format. The name you specify is used to identify the conditional format on other dialogs. If you want Discoverer to create a name for you, select the Generate Name Automatically check box.
What description would you like to give your Conditional Format?Use this field to enter a brief description for the new conditional format. This description is displayed in the Description field on the Conditional Formats dialog and helps workbook users choose which conditional format they want to use.
Item Use this drop down list to select the worksheet item you want to apply the conditional format to. For example, to highlight costs greater than 100,000 you might choose an item called Cost SUM here.
ConditionUse this drop down list to select the conditional operator (e.g. = for equals, > for greater than, < for less than) you want to use to match against the worksheet item selected. For example, to highlight costs greater than 100,000 you might choose greater than (i.e. >) here.
ValueUse this field to enter the value that you want to match against or select a value from the drop down list. For example, to highlight costs greater than 100,000 you might enter 100,000 here.
Hint: For date items, choose Select from Calendar from the drop down list to specify a date using the graphical "Calendar dialog".
New Conditional Format dialog
23-124 Oracle Business Intelligence Discoverer Plus User’s Guide
FormatUse this button to display the "Format Data dialog: Format tab" dialog, where you specify the color and text style for the worksheet item specified in the Item field when it meets the condition you specify in this dialog.
For example, to highlight sales figures greater than 100,000 with a blue background, use the "Format Data dialog: Format tab" dialog to choose a blue background color.
Hint: Use the Example box to see how a conditional format will look on the worksheet.
New Link dialog
Dialog reference 23-125
New Link dialog
Use this dialog to create a new drill link or edit an existing drill link. For example, you might want to create a drill link on a worksheet item called Region to display a worksheet containing more detailed Region information.
This dialog is also displayed as:Edit Link dialog
For more information, see:
"About user defined drill links"
Link From:This read-only field shows the name of the item currently selected on the worksheet. If you want to create a drill link from a different worksheet item, click Cancel and select a different worksheet item first.
What would you like to name this link?Use this field to enter a descriptive name for the drill link. This name is displayed in the list of drill links on the "Manage Links dialog".
Note: You must enter a unique name before you can save the drill link details.
Hint: If you enter an instruction on how to use the drill link into this field, the instruction will appear in the worksheet as:
■ a tooltip (when an item contains a single link)
■ a link name (when a user selects a drill link icon (when an item contains multiple links)
For example, you might enter 'Click here to connect to the Products Web site', or 'Click here to display the Products worksheet'.
Where do you want to link to?Use this list to select a link type, as follows:
■ to connect to an Internet page, select URL and enter the Internet page address (e.g. www.company.com/storelist) in the Destination field below
■ to connect to a Discoverer worksheet, select Worksheet and select a worksheet in the Destination Worksheet field below
Note: If you are editing a drill link, this field is grayed out. To create a drill link of another type, click New Link on the "Manage Links dialog" and create a new drill link.
Destination: URLUse this field to specify the Internet page address you want to drill to (if you selected URL in the Where do you want to link to? field). For example, http://www.company.com/storelist.
Note: The URL that you enter must be syntactically correct and must be prefixed with HTTP, HTTPS, FTP, or a protocol authorized by the Discoverer manager.
New Link dialog
23-126 Oracle Business Intelligence Discoverer Plus User’s Guide
InsertUse this field to insert (at the cursor position the Internet page address in the Destination field) a value that you specify. This field enables you to create a dynamic Internet page address incorporating worksheet item values.
For example, you might want to display an Internet page for a particular store by incorporating the currently selected worksheet value into an Internet page address. In other words, if you select the drill link for the New York store, you link to the Internet page for the New York store (e.g. http://www.company.com/storelist/New_York/Details.htm. To create this dynamic Internet page address, you might do the following:
■ Enter http://www.company.com/storelist/ in the Destination field.
■ Click Insert and choose Store name from the drop down list.
■ Append the text in the Destination field with /Details.htm.
The URL is now http://www.company.com/storelist/Details.htm
■ Click OK to save the drill link, then click OK again to close the Links dialog.
If a Discoverer end user clicks the drill link for the New York worksheet item, Discoverer displays the http://www.company.com/storelist/New_York/Details.htm Internet page in a browser window. If a Discoverer end user clicks the drill link for the Boston worksheet item, Discoverer displays the http://www.company.com/storelist/Boston/Details.htm Internet page in a browser window.
Note: This button is only displayed when you select URL in the Where do you want to link to? field.
Destination: Destination WorkbookThis field displays the name of the currently selected workbook. If you want to link to a worksheet in a different workbook, click Browse to display the "Choose Worksheet dialog".
BrowseUse this button to display the "Choose Worksheet dialog", which enables you to locate and select a worksheet to display when the link is selected.
Note: This button is only active when you select Worksheet in the Where do you want to link to? field.
Destination: Destination WorksheetUse this drop down to select the worksheet in the currently opened workbook that you want to drill to. If you want to link to a worksheet in a different workbook, click Browse to display the "Choose Worksheet dialog".
ParametersUse this button to display the "Parameters dialog", which enables you to select a parameter or parameter value to refine the worksheet displayed when the drill link is selected, as follows:
■ to create a static drill link, enter a value surrounded by double quotes (e.g. type "3" to specify three as the default parameter value for a calculation)
■ to create a dynamic drill link, click on the down arrow next to the field and select the name of a worksheet item

New Link dialog
Dialog reference 23-127
Note: This button is only active when select Worksheet in the Where do you want to link to? field and the selected worksheet contains one or more parameters.
New Parameter dialog
23-128 Oracle Business Intelligence Discoverer Plus User’s Guide
New Parameter dialog
Use this dialog to create a new parameter. For example, you might want to enable Discoverer users to choose how they filter worksheet data when a worksheet is opened.
For more information, see:
"What are parameters?"
"About using parameters"
What do you want to name this parameter?Use this field to enter a descriptive name for the parameter. This name is displayed in the parameter list on the "Edit Parameter Values dialog". If you leave this field blank, Discoverer creates a default name for you.
Which item do you want to base this parameter on?Use this drop down list to specify which item you want to base the parameter on, as follows:
■ If you want to use the parameter to filter worksheets, select the item that you want to filter on from the list of items currently included in the worksheet. For example, to filter a worksheet on calendar month, you might choose Month here.
Hint: If you want to base your parameter on an item that is not currently included in the worksheet, use the More items option to display the "Select Item dialog". The "Select Item dialog" enables you to choose items from available folders to use in the worksheet.
■ If you want to use the parameter to provide input to a calculation, select the <NONE> option. For example, choose <NONE> to enable worksheet users to choose how much percentage increase they want to display on a worksheet.
Create condition with operatorUse this check box to automatically create a condition for this parameter that filters the worksheet using the item selected. This check box is selected by default when you create a new parameter, and is automatically cleared if you select <NONE> from the Which item do you want to base this parameter on? drop down list.
Use the drop down list to select the appropriate operator (e.g. =) to use with the condition.
ConditionThis read-only field displays the name of the condition used in this parameter.
What prompt do you want to show for this parameter?Use this field to enter a question or instruction that tells users what information they need to enter when choosing a parameter value. This prompt is displayed on the "Edit Parameter Values dialog". For example, 'What year do you want to look at?', or 'Please choose a region'. If you leave this field blank, Discoverer creates a default prompt for you.
New Parameter dialog
Dialog reference 23-129
What description do you want to show for this parameter?Use this field to enter a brief description of the parameter that tells users what the parameter is used for. This description is displayed on the "Edit Worksheet dialog: Parameters tab", and on the "Edit Parameter Values dialog".
Do you want to allow different parameter values for each worksheet?■ Use the Allow only one set of parameter values for all worksheets radio button
to apply the same set of parameter values to all worksheets in the workbook.
■ Use the Allow different parameter values for each worksheet radio button to enable different parameter values to be specified for each worksheet.
Require users to enter a valueUse this check box to make users enter a parameter value before Discoverer will display the worksheet. Note that by default this check box is selected.
Enable users to select multiple values?Use this check box if you want users to be able to choose more than one value to match against the item.
Note: Clear this check box if you selected <NONE> from the Which item do you want to base the parameter on? drop down list. If a Discoverer end user enters more than one parameter value, only the first parameter value is used.
Enable users to select either indexes or valuesUse this check box to enable users to choose whether they want to display parameter values with indexes (e.g. (010) January, (011) February) or without (e.g. January, February) in the "Edit Parameter Values dialog".
Use this check box as follows:
■ Select this check box when you want worksheet users to be able to choose whether to display parameter values with or without indexes.
■ Clear this check box when you want parameter values to always be displayed without indexes.
Note: The Enable users to select either indexes or values check box is only available if indexes have been set up by the Discoverer manager.
What default value do you want to give this parameter?Use this field to enter a default value for the parameter on the Edit Parameter Values dialog. If users do not enter a value in the Edit Parameter Values dialog, the value that you enter here is used.
Use the <Index and Value> drop down list (where available) to display default parameter values with indexes (e.g. (010) January, (011) February) or without indexes (e.g. January, February). For more information about using the <Index and Value> drop down list, see the "Edit Parameter Values dialog".
Note: You determine whether or not the <Index and Value> drop down list is displayed here, using the Enable users to select either indexes or values check box.
Hint: For date items, click on the calendar icon to the right of the field to specify a date using the graphical "Calendar dialog". If no calendar icon is displayed, click the down arrow to the right of the field and choose Select From Calendar to display the "Calendar dialog".
New Parameter dialog
23-130 Oracle Business Intelligence Discoverer Plus User’s Guide
Note: If Discoverer Plus end users use the word TODAY as the default value of a parameter (e.g. to convert to today's date using a DECODE statement in a calculation), they must surround the word in single quotes (i.e. 'TODAY'). If TODAY is not surrounded by single quotes, Discoverer interprets the word as a literal value and displays the error message:
- ORA-01858: a non-numeric character was found where a numeric was expected
Do you want to filter the list of values for this parameter?Use these settings to improve performance by reducing the number of parameter values that are displayed to the user.
■ Use the Show all available values radio button to display all available parameter values to the user.
■ Use the Filter the list of values based on the selected conditions radio button to activate a list of conditions that you select to filter the parameter values displayed to the user.
■ Use the check boxes in the <selected conditions> list to select one or more conditions to apply to the list of values for this parameter.
Note: The check boxes in the <selected conditions> list are only available when you select the Filter the list of values based on the selected conditions radio button.
New Percentage dialog
Dialog reference 23-131
New Percentage dialog
Use this dialog to create a new percentage item. For example, you might want to analyze the worksheet in a new way by calculating your monthly sales as a percentage of annual sales.
For more information, see:
"What are percentages?"
What do you want to name this percentage?Use this field to enter a descriptive name for the percentage item. This name is displayed in percentage lists and on worksheets as the column header of the percentage item. If you leave this box blank, Discoverer creates a default name for you.
What data point do you want to base your percentage on?Use this drop down list to select which item you want to base your percentage on. The list displays numeric items available in the worksheet.
Calculate as a percentage of:Use these radio buttons to choose how the percentage is calculated.
■ Grand total of all values
Use this radio button to calculate a percentage of all values.
■ Grand total for each column
Use this radio button to calculate a percentage for the item column (specific to crosstab worksheets).
Note: This field is only displayed when you add a total to a crosstab worksheet.
■ Grand total for each row
Use this radio button to calculate a percentage for the item row (specific to crosstab worksheets).
Note: This field is only displayed when you add a total to a crosstab worksheet.
■ Subtotal for each change in
Use this radio button to calculate a percentage for a sub-group. Select an item from the drop down list below to define the item that you want to sub-group. For example, to calculate a percentage total for each calendar year, you might choose 'Year' here.
Do you want to calculate percentages within each page?Use these radio buttons to choose whether to calculate the percentage for each page, or for all pages.
Note: You only use these radio buttons if the worksheet has page items.
■ Calculate percentages with each page
Use this radio button to calculate percentages for data on the current page. For example, if Region is displayed in the Page Items area, you might want to calculate how sales for each quarter contribute to total sales for the each region.
■ Calculate percentages across all pages

New Percentage dialog
23-132 Oracle Business Intelligence Discoverer Plus User’s Guide
Use this radio button to calculate percentages for all pages. For example, if Region is displayed in the Page Items area, you might want to calculate how sales for each quarter contribute to total sales for the all regions.
ExampleThis area shows you how your worksheet will look according to what options you specify.
Which totals do you want to be shown?Use these options to specify how you want totals and sub totals to be displayed.
Show grand total and grand total percentage?Use this check box to display a sum of all values and a sum of the percentages (specific to the Grand total for all values option).
LabelUse this field to define the grand total percentage label that will appear on the worksheet (if selected). To enter a different label, click the down arrow on the right of the field. To format the label, click the Format button and choose how you want the label to look on the worksheet.
Show subtotals and subtotal percentageUse this check box to display a subtotal for values in the item group, and a percentage for the subgroup (specific to the Subtotal at each change in option).
Note: This field is only displayed when you add a total to a crosstab worksheet.
LabelUse this field to define the subtotal percentage label that will appear on the worksheet (if selected). To enter a different label, click the down arrow on the right of the field. To format the label, click the Format button and choose how you want the label to look on the worksheet.
Note: This field is only displayed when you add a total to a crosstab worksheet.
Format DataUse this button to display the "Format Data dialog", where you change how the values look on the worksheet.
Note: This field is only displayed when you add a total to a crosstab worksheet.
Format HeadingUse this button to display the "Format heading dialog", where you change how the item headings look on the worksheet.
Note: This field is only displayed when you add a total to a crosstab worksheet.
Show the percentage of the grand total for each subtotalUse this check box to display a subtotal as a percentage of the grand total.
Note: This field is only displayed when you add a total to a crosstab worksheet.
New Percentage dialog
Dialog reference 23-133
LabelUse this field to define the grand total percentage label that will appear on the worksheet (if selected). To enter a different label, click the down arrow on the right of the field. To format the label, click the Format button and choose how you want the label to look on the worksheet.
Note: This field is only displayed when you add a total to a crosstab worksheet.
Format DataUse this button to display the "Format Data dialog", where you change how the values look on the worksheet.
Note: This field is only displayed when you add a total to a crosstab worksheet.
Format HeadingUse this button to display the "Format heading dialog", where you change how the item headings look on the worksheet.
Note: This field is only displayed when you add a total to a crosstab worksheet.
New Scheduled Workbook Results dialog
23-134 Oracle Business Intelligence Discoverer Plus User’s Guide
New Scheduled Workbook Results dialog
Use this dialog to see the scheduled workbook results sets that are ready to use. This dialog appears when workbooks that you have scheduled have been processed since you last connected to Discoverer. For example, if you start Discoverer in the morning, scheduled workbooks that you have access to that have been processed overnight will be ready to use.
Note: Click the Don’t show this window again check box when you do not want to display this dialog in future.
For more information, see:
"What are scheduled workbooks?"
"When to use scheduled workbooks"
"About how scheduled workbooks are processed"
New scheduled workbook results have been generatedUse this list to see which scheduled workbook results sets are ready to use and to select scheduled workbook results sets to open.
Don’t show this window againUse this check box when you do not want Discoverer to inform you about new scheduled workbooks that are ready to use.
Scheduling ManagerUse this button to display the "Scheduling Manager dialog", where you manage scheduled workbooks. For example, you can open, edit, delete, and schedule workbooks that you have created.
OpenUse this button to open the currently selected scheduled workbook.
New Stoplight Format dialog
Dialog reference 23-135
New Stoplight Format dialog
Use this dialog to create a new stoplight format for a worksheet item. For example, you might want to categorize sales figures as unacceptable, acceptable, and desirable.
This dialog is also displayed as:Edit Stoplight format dialog
For more information, see:
"About managing conditional formatting"
"What is a stoplight format?"
"Examples of conditional formatting"
Note: You can only have one active conditional format or stoplight format for each numeric worksheet item. For example, if you want to activate a stoplight format on a worksheet item that already has a active stoplight format, you must first deactivate (or delete) the existing stoplight format for that worksheet item.
What would you like to name your stoplight format?Use this field to specify a short name for the stoplight format. The name you specify is used to identify the conditional format on other dialogs. If you want Discoverer to create a name for you, select the Generate Name Automatically check box.
Which data point would you like to format?Use this drop down list to specify which worksheet item you want to apply the stoplight format to.
What are the thresholds for unacceptable and desirable data ranges?Use these fields to specify the ranges for the unacceptable and desirable categories.
■ Unacceptable
Use this field to enter the threshold for the unacceptable category. For example, enter 5000 to make the unacceptable threshold 5000 or less.
■ Acceptable
This read-only field is populated automatically based on the values that you enter in the Unacceptable and Desirable fields.
■ Desirable
Use this field to enter the threshold for the desirable category. For example, enter 30000 to make the desirable threshold 30000 or more.
Edit ColorsUse this button to display the "Stoplight colors dialog", which enables you to change the color of unacceptable, acceptable, and desirable values.
Hide data values for stoplight formatsUse this check box to specify whether to display worksheet values for the worksheet item that is being formatted. For example, you might select this check box if you want

New Stoplight Format dialog
23-136 Oracle Business Intelligence Discoverer Plus User’s Guide
to create a more visual worksheet that displays formatting colors but not the values themselves.
New Total dialog
Dialog reference 23-137
New Total dialog
Use this dialog to create a new total on the worksheet. For example, you might want to analyze the worksheet in a new way by summing a column of sales figures.
For more information, see:
"What are totals?"
"About totals on worksheets"
"Examples of worksheet aggregation in Discoverer"
Which data point would you like to create a total on?Use this drop down list to specify which items you want to create a total for. You can specify a particular item or choose all items.
What kind of total do you want?Use this drop down list to specify what type of total you want.
Note: For more information about Sum and Cell Sum, see "About SUM and Cell SUM".
Where would you like your total to be shown?Use these radio buttons to specify where to display the total.
■ Grand total at bottom
Use this radio button to display a grand total of all values in the worksheet.
■ Grand total on right
Use this radio button to display a total for the item row.
Note: This field is only displayed when you add a total to a crosstab worksheet.
■ Subtotal at each change in
Use this radio button to calculate a total for a sub-group. Select an item from the drop down list below to define the item that you want to sub-group. For example, to calculate a total for each calendar month, you might choose 'Month' here.
Don’t display total for a single rowUse this check box to not display a total for a single row, where the row and total would have the same value.
Note: This field is called Don’t display total for single rows or columns when you add a total to a crosstab worksheet.
Do you want to calculate totals within each page?Use these radio buttons to choose the scope of the total. For example, if a worksheet contains page items (i.e. items are displayed in the Page Items area), you might want to display a total at the bottom of each page.
■ Calculate totals with each page
New Total dialog
23-138 Oracle Business Intelligence Discoverer Plus User’s Guide
Use this radio button to apply the total to data displayed on the worksheet. For example, if Calendar Month is displayed in the Page Items area, you display a grand total for each month.
■ Calculate totals across all pages
Use this radio button to apply the total to all data in the worksheet. The total takes into account other page items not currently displayed on the worksheet. For example, if Calendar Month is displayed in the Page Items area, you display a grand total for all months.
ExampleThis area shows you how your worksheet will look according to what options you specify.
What label do you want to be shown?Use this field to specify what total label will be displayed on the worksheet. If the Generate label automatically check box is selected below, Discoverer creates a name for you. To enter a different label, clear the Generate label automatically check box and either type in a new label or choose a label from the drop down list on the right of the field. To change the default text style of the label, click the Format button and choose a text font, style, color and alignment.
Generate label automaticallyUse this check box if you want Discoverer to create a total name for you. To change the default text style, click the Format button and choose a text font, style, color and alignment.
Format DataUse this button to display the "Format Data dialog", where you change how the values look on the worksheet.
Format HeadingUse this button to display the "Format heading dialog", where you change how the item headings look on the worksheet.
Open Workbook from Database dialog
Dialog reference 23-139
Open Workbook from Database dialog
Use this dialog to choose a workbook to open. For example, you might have saved a Discoverer workbook previously and want to edit it again. Or, you might want to edit a workbook created by another Discoverer user.
Note: You can only open one workbook at a time. If a workbook is currently open, opening a different workbook will close the currently opened workbook.
For more information, see:
"What are workbooks?"
ViewUse this list to specify the type of workbooks you want to display in the Workbooks list. For example, you might choose My Workbooks to display only workbooks owned by the database user that you are logged in as.
<View style button>Use this drop down list to select a style for the Workbooks list. For example, you might choose the User Tree option to display workbooks grouped by database user. Or you might choose Workbook Tree to display workbooks in alphabetical order.
Name containsUse this field to restrict the Workbooks list to those workbooks with names that contain the character(s) that you specify. For example, enter 'January' to display in the Workbooks list only those workbooks with names that contain January.
ClearUse this button to clear any text in the Name contains field and display the names of all workbooks in the Workbooks list.
WorkbooksUse this list to select the workbook that you want to open. Workbooks are represented by a book icon. Scheduled workbooks are represented by a clock icon. To open a workbook, double-click on the workbook name, or select the workbook and click Open. Type a letter to jump to workbooks beginning with that letter.
Hint: Click on a column name to sort the Workbooks list on that column. Click on the arrow in a column name to reverse the sort order. You can also drag and drop columns to a different position in the Workbooks list.
If the workbook that you want to open is not in the Workbooks list, make sure you chose the correct connection when you started Discoverer Plus Relational. If a workbook has been created by another Discoverer user, make sure that the Discoverer user has shared the workbook with you (for more information, see "About sharing workbooks").
If you cannot find a scheduled workbook that you want to open, check the status of scheduled workbooks by choosing File | Scheduling to display the "Scheduling Manager dialog".
Note: The date and time in the Modified field is the date and time on the Web server, which might be different from the date and time on the browser machine.
Open Workbook from Database dialog
23-140 Oracle Business Intelligence Discoverer Plus User’s Guide
DescriptionThis field displays additional information about the workbook, which was entered using the "Workbook Properties dialog". Use this information to help you decide which workbook you want to analyze. This area is blank if no description is available.
Hint: To add or edit the description, update the workbook properties (for more information, see "How to view and update a workbook’s properties").
OpenUse this button to open the workbook selected in the Workbooks list.
NotesWhen connected as an Oracle Applications user, the following security rules apply:
■ If you connect as a particular user and responsibility and schedule a workbook, the scheduled workbook is specific to that user and responsibility.
■ If you connect as a particular user but a different responsibility from the one used to schedule a workbook, the scheduled workbook might contain different results from the original scheduled workbook that was created.
For more information about using Discoverer as an Oracle Applications user, see "How to start Discoverer in Oracle Applications mode using an existing connection".
Options dialog: Advanced tab
Dialog reference 23-141
Options dialog: Advanced tab
Use this tab to specify the way that Discoverer keeps worksheet data up-to-date, and how it processes complex data. For example, if you use static data that is not changed frequently, you might not want a worksheet refreshed when you change the format of a sheet.
For more information, see:
"About multiple join paths"
"About fan traps"
"About automatic querying"
Automatic querying
Disable automatic querying from database (only used cached results)Use this check box to specify whether Discoverer refreshes worksheets with up-to-date data when you change a worksheet format. Do not select this check box without first contacting the Discoverer manager. For more information about the Discoverer Server cache, contact the Discoverer manager.
If you clear this check box, Discoverer always displays up-to-date data, however performance might be affected. If you select this check box, you might need to choose Tools | Refresh Sheet after changing a worksheet layout.
Joins
Disable fan trap detectionClear this check box if you want Discoverer to detect potential fan trap configurations, generate the correct SQL and display correct worksheet data. Where Discoverer cannot resolve a fan trap, Discoverer prevents the worksheet from running and displays a warning message dialog.
Note: It is recommended that you clear this check box. Do not select this check box without first contacting the Discoverer manager.
Select this check box if you do not want Discoverer to detect or resolve potential fan trap configurations (see Note above).
Disable multiple join path detectionUse this check box to disable multiple join detection.
Note: Do not select this check box without first contacting the Discoverer manager as Discoverer might display unexpected data depending on the join(s) that Discoverer automatically selects.
Select this check box for Discoverer to automatically select all joins between folders (where more than one join exists between two folders) when you create a worksheet.
Clear this check box for Discoverer to display the "Join folders dialog" (where more than one join exists between two folders) when you create a worksheet.
Options dialog: Advanced tab
23-142 Oracle Business Intelligence Discoverer Plus User’s Guide
Show JoinsSelect this check box to show the name and description of the database joins used in the following lists in the "Edit Worksheet dialog: Select Items tab":
■ the Available list
The joins shown in the Available list enable you to select items from the folders displayed, and use them in a worksheet.
■ the Selected list
The joins shown in the Selected list are the joins that are required to display the selected items in a worksheet.
Options dialog: EUL tab
Dialog reference 23-143
Options dialog: EUL tab
Use this tab to select a default End User Layer (EUL) to connect to when you start Discoverer. For example, the Discoverer manager have given you access to more than one EUL, to enable you to access a wide range of workbooks. If so, you can choose a default EUL here.
Contact the Discoverer manager for more information about which EULs you can access.
For more information, see:
"About default Discoverer settings"
Select a default EULUse this drop down list to choose an EUL that you want to connect to by default.
■ If you only have access to one EUL, this is a read-only field that shows you which EUL you are connected to.
■ If you have access to more than one EUL, you can choose which one you want to use by default.
Options dialog: Formats tab
23-144 Oracle Business Intelligence Discoverer Plus User’s Guide
Options dialog: Formats tab
Use this tab to change the default worksheet style that Discoverer uses for new worksheets. For example, you might want new worksheets or worksheet items to have blue headings and green text.
For more information, see:
"About Discoverer worksheet types"
NameUse this list to choose the worksheet element you want to change as follows:
■ To change how worksheet items are displayed, select Data Format and click Change to display the "Data Format dialog (Default Options)".
■ To change how worksheet item headings are displayed, select Heading Format and click Change to display the "Heading Format dialog (Default Options)".
■ To display how worksheet totals are displayed, select Total Format and click Change to display the "Total Format dialog (Default Options)".
■ To change how worksheet conditional text is displayed, select Conditional Format and click Change to display the "Conditional Formats dialog".
■ To change how worksheet stoplight colors are displayed, select Stoplight Color Format and click Change to display the "Stoplight colors dialog".
■ To change how worksheet titles are displayed, select Title and click Change to display the "Edit Title dialog".
■ To change how worksheet text areas are displayed, select Text Area and click Change to display the "Edit Text Area dialog".
Hint: You can also display the appropriate dialog by double-clicking the option you want to change.
Format SampleThis area shows you how the item will look on the worksheet, according to changes that you make.
ChangeUse this button to display the appropriate dialog where you edit the format options for the currently selected worksheet element (e.g. heading, title).
ResetUse this button to cancel any changes you have made and revert to the original default setting for the highlighted format option. The Reset button does not reset all format options.
Notes■ Changing the default style does not affect existing worksheets.
■ Changing the default style does affect new items you add to existing worksheets.
Options dialog: General tab
Dialog reference 23-145
Options dialog: General tab
Use this tab to configure how Discoverer displays worksheets. For example, you might want Discoverer to ask worksheet users to confirm whether they want a query to be run.
For more information, see:
"What are worksheets?"
"What are scheduled workbooks?"
Workbooks
After opening a workbookUse these radio buttons to specify how you want Discoverer to display worksheets.
■ Run query automatically
Use this radio button when you want Discoverer to always display up-to-date data in the worksheet.
Note: This option is not available if you are connected as a user that is only able to run scheduled workbooks. For more information, contact the Discoverer manager.
■ Don’t run query (leave sheet empty)
Use this radio button when you want the Discoverer user to decide when to refresh a worksheet. When a worksheet is first opened, it will be empty. Use this option when you want to work on the worksheet without looking at the data. For example, some worksheets users might want to set filtering conditions before opening a large worksheet, or change the layout of a worksheet before analyzing the data.
■ Ask for confirmation
Use this radio button when you want workbook users to confirm before worksheets are refreshed with up-to-date data. For example, some worksheets users might want to set filtering conditions before opening a large worksheet.
Workbooks in recently used list <n> entriesUse this field to specify the maximum number of workbook names to display in the Recently Used field in the "Workbook Wizard: Create/Open Workbook dialog".
Scheduled Workbooks
Don’t show the new results window after initial connectionUse this check box when you do not want to be informed about new scheduled workbook results that are available. The "New Scheduled Workbook Results dialog" will not be displayed when you start Discoverer.
Don’t show expired results on exit, delete results automaticallyUse this check box when you do not want to be informed about expired scheduled workbook results and asked whether you want to delete them. The "Delete Scheduled Workbook Results dialog" will not be displayed when you close Discoverer.
Options dialog: General tab
23-146 Oracle Business Intelligence Discoverer Plus User’s Guide
Wizards
Show wizard graphicsUse this check box to display or hide graphics on wizard dialogs. Graphics are used as visual aids to choosing options. For example, when choosing between a table and crosstab format, the graphic shows how the data is arranged on the worksheet.
When workbook users are experienced Discoverer users, you might want to improve Discoverer performance by not displaying wizard graphics.
Measurement unit
Measurement unit for workbooksUse this drop down list to choose the measurement unit to use for workbook column width. For example, you can specify the column width in terms of pixels, inches or centimeters.
Options dialog: Query Governor tab
Dialog reference 23-147
Options dialog: Query Governor tab
Use this tab to specify how Discoverer uses summaries and performs queries.
Note: Do not change these options unless advised to do so by the Discoverer manager.
For more information, see:
"What are summaries?"
"What are worksheets?"
Summary Data
When do you want to use Summary data?Use these radio buttons to specify when you want Discoverer to use summaries. The table below describes options available.
Query GovernorUse these radio buttons to specify how Discoverer handles queries.
■ Warn me if predicted time exceeds
Use this check box to display a warning when the predicted query times exceed the time that you define in the box on the right. The estimated query time is displayed so that you can choose whether to continue. If the wait time is too long, you can schedule the workbook to run at a later time. For example, you might want to schedule the workbook to run overnight so that it is ready to open in the morning.
■ Prevent queries from running longer than
Use this check box if you do not want to run queries when the predicted query time exceeds the time that you define in the box on the right.
■ Limit retrieved query data to
Use this check box to not retrieve more than the number of rows that you define in the box on the right.
■ Retrieve data incrementally in groups of
Use this field to define how many rows to retrieve from the database at once.
■ Cancel list of values retrieval after
Use this field to define the maximum time you want to wait while Discoverer retrieves list of values items.
Option Use to
Always, when available Specify that you want Discoverer to use summaries automatically where possible.
Only when summary data is not out of date (stale)
Specify that you want Discoverer to use summaries when up-to-date data is available.
Never Specify that you do not want Discoverer to use summaries.
Options dialog: Query Governor tab
23-148 Oracle Business Intelligence Discoverer Plus User’s Guide
Notes■ If the Retrieve data incrementally in groups of value is greater than or equal to
the Limit retrieved query data to value, only one retrieval increment is fetched from the database.
Options dialog: Sheet tab
Dialog reference 23-149
Options dialog: Sheet tab
Use this tab to specify how all new worksheets are displayed. For example, use this dialog to:
■ display or hide column headings, gridlines and row numbers
■ define column width, crosstab style and gridline color
■ display or hide the worksheet title, text area
■ define how to display null values
■ show drill links as icons
For more information, see:
"What are worksheets?"
Table headers
Show column headingsUse this check box to display or hide column headings on worksheets. You might want to hide column headings if they are not required on a worksheet. Discoverer displays column headings by default.
Show row numbersUse this check box to display or hide row numbers on worksheets. You might want to show row numbers to enable users to use the row numbers to locate a specific worksheet row.
Column widthUse this drop down list to specify the column width. The available options are:
■ Use default width
Select this option if you want the column to be the same width as the column heading.
■ Use auto width
Select this option if you want the column to be the width of the column heading or the widest data cell (whichever is the wider).
Crosstab headers
Show item labelsUse this check box to display or hide the crosstab item labels (e.g. Region). If item labels have been defined, they are displayed on the crosstab vertical or side axis.
Show heading gridlinesUse this check box to display or hide crosstab vertical axis heading gridlines.
3D heading gridlinesUse this check box to display the crosstab heading gridlines in 3D style. This check box is only enabled when the Show heading gridlines check box is selected.
Options dialog: Sheet tab
23-150 Oracle Business Intelligence Discoverer Plus User’s Guide
Crosstab styleUse this drop down list to control the appearance of the side axis on a crosstab as follows:
■ Inline
Choose this option to display the first child row, on the same row as its parent. For example, on a worksheet that shows Years and Months, January (the first child row) appears on the same row as the year 2001 (the parent row).
■ Outline
Choose this option to display the first child row on the row below its parent. For example, on a worksheet that shows Years and Months, January (the first child row) appears on the row below the year 2001 (the parent row).
Table and crosstab data area
Show vertical gridlinesUse this check box to display or hide the vertical gridlines in the data body.
Show horizontal gridlinesUse this check box to display or hide the horizontal gridlines (i.e. in the data body).
Gridline colorUse this button to change the color of the gridlines that are displayed (i.e. in the data body).
Sheet content
Show titleUse this check box to display or hide the worksheet title. When you select this check box Discoverer displays a title area at the top of each new worksheet.
Hint: You can also specify whether Discoverer displays or hides the title of the current worksheet (for more information, see "How to display or hide worksheet titles or text").
Show text areaUse this check box to display or hide the text area. If a text area has been defined, it appears at the bottom of the worksheet.
Show null values asUse this drop down list to specify how Discoverer displays null (or empty) values. For example, if you typed the words No information available in this field, Discoverer will display this text when there is no data for a cell. Discoverer displays a blank cell by default.
Show drill links asUse this check box list to specify that Discoverer displays drill links as icons. Alternatively, you could clear this check box to specify that Discoverer displays drill links as hypertext links.

Options dialog: Sheet tab
Dialog reference 23-151
ExampleThis area of the dialog indicates how the worksheet will look, with the options you have set.
Page Setup dialog
23-152 Oracle Business Intelligence Discoverer Plus User’s Guide
Page Setup dialog
Use this dialog to select Page Setup options for the current worksheet. For example, you might want to change the orientation or margin size, or create a page header and footer.
Note: Page Setup options affect how a worksheet prints out but not how a worksheet is displayed on-screen in Discoverer Plus Relational.
For more information, see:
"What are Page Setup options"
For more information about Page Setup options, see:
■ "Page Setup dialog: Worksheet tab"
■ "Page Setup dialog: Table/Crosstab tab"
■ "Page Setup dialog: Graph tab"
■ "Page Setup dialog: Margins tab"
■ "Page Setup dialog: Header/Footer tab"
Print PreviewUse this button to display the "Print Preview dialog", which enables you to check that the layout is correct before you print the worksheet.
OKUse this button to close the Page Setup dialog and return to the previous dialog. Discoverer applies the Page Setup options for the current session. To save the Page Setup options permanently for the selected worksheet, you must save the workbook (for more information, see "How to save workbooks").
Page Setup dialog: Graph tab
Dialog reference 23-153
Page Setup dialog: Graph tab
Use this dialog to specify how to print worksheet graphs. For example, you might want Discoverer to adjust the scaling to fit a large graph onto one printed page.
Note: This tab is displayed when a worksheet has a graph currently displayed or the Graph check box on the "Print dialog" is selected.
For more information, see:
"What are Page Setup options"
"About Page Setup options for graphs"
"How to print Discoverer worksheets"
GraphUse these radio buttons to specify a graph size. For example, if a graph is too large to fit on a printed page, you might reduce the size of the graph to fit the page. For an illustrated example of graph scaling, see "About Page Setup options for graphs").
■ Actual size
Use this radio button to print the graph in the same proportion to the worksheet data as displayed on screen. If a large graph will not fit on a printed page, Discoverer crops the graph.
■ Fit to page
Use this radio button to change the size of the graph so that it fits exactly on a single printed page without being cropped. For example, you might want a small graph to fill the a full page of A4 paper.
■ Preserve the Ratio of Height and Width
Use this check box to maintain the proportions of the graph when it is resized. For example, if a graph is 20 cm by 20 cm in full size and the available print area is 10 cm by 30 cm (on A4 portrait), selecting this check box would reduce the graph size to 10 cm by 10 cm. If you clear this check box, Discoverer would resize the graph to 10cm by 30cm (if the available print area is 10 cm by 30 cm on A4 portrait).
■ Preserve the Actual Font Size
Use this check box to maintain the font size when the graph is resized. If a large graph is reduced in size to fit on a a page of A4 paper, you might want to maintain a font size of 14 to make the graph labels readable. If you clear this check box and reduce the size of a graph, the graph labels might be too small to read.
Print PreviewUse this button to display the "Print Preview dialog", which enables you to check that the layout is correct before you print the worksheet.
OKUse this button to close the Page Setup dialog and return to the previous dialog. Discoverer applies the Page Setup options for the current session. To save the Page Setup options permanently for the selected worksheet, you must save the workbook (for more information, see "How to save workbooks").

Page Setup dialog: Header/Footer tab
23-154 Oracle Business Intelligence Discoverer Plus User’s Guide
Page Setup dialog: Header/Footer tab
Use this dialog to add a header or footer to a printed worksheet. For example, you might want to add a report author details or the date and time to the top of a worksheet. For a detailed example of a worksheet with a header and footer, see "About elements of a printed worksheet in Discoverer Plus Relational".
Note: A header or footer that you create is displayed on the printed worksheet but is not displayed on-screen.
Hint: Make sure that the header margin size and footer margin size specified on the "Page Setup dialog: Margins tab" are big enough to print the header and footer that you specify.
For more information, see:
"What are Page Setup options"
"About elements of a printed worksheet in Discoverer Plus Relational"
"How to print Discoverer worksheets"
HeaderUse these fields to create a header at the top of the worksheet. For example, you might want to print the date and time at the top of the worksheet. The header is printed on every page above the worksheet title (if printed) and worksheet body.
Border BelowUse this drop down list to print a solid line below the header to separate the header from the rest of the worksheet (e.g. worksheet title, worksheet data, graph).
InsertUse this button to display a drop down list of text variables (e.g. date, time) that you can insert into the Left, Center, and Right fields for the header (for more information about variables, see "Notes" below).
Hint: Before you insert a text variable, click inside the Left, Center, or Right fields for the header, then click Insert.
FontUse this button to display the "Header/Footer Font dialog", which enables you to select a font style for the header.
Left/Center/RightUse these fields to enter text that you want to appear in the header. You can enter text and variables. For example, to display the text Weekly Report at the left of the header, click inside the Left field and type Weekly Report.
FooterUse these fields to create a footer at the bottom of the worksheet. For example, you might want to print the name of the worksheet creator at the bottom of the worksheet. The footer is printed on every page below the worksheet text area (if printed) and worksheet body.
Page Setup dialog: Header/Footer tab
Dialog reference 23-155
Border AboveUse this drop down list to print a solid line above the footer to separate the footer from the rest of the worksheet (e.g. worksheet text area, worksheet data, graph)
InsertUse this button to display a drop down list of text variables (e.g. date, time) that you can insert into the Left, Center, or Right fields for the footer (for more information about variables, see "Notes" below).
Hint: Before you insert a variable, click inside the Left, Center, and Right fields for the footer, then click Insert.
FontUse this button to display the "Header/Footer Font dialog", which enables you to select a font style for the footer.
Left/Center/RightUse these fields to enter text that you want to appear in the footer. You can enter text and text variables. For example, to display Weekly Report at the left of the footer, place the cursor in the Left field and type Weekly Report.
Print PreviewUse this button to display the "Print Preview dialog", which enables you to check that the layout is correct before you print the worksheet.
OKUse this button to close the Page Setup dialog and return to the previous dialog. Discoverer applies the Page Setup options for the current session. To save the Page Setup options permanently for the selected worksheet, you must save the workbook (for more information, see "How to save workbooks").
Notes■ A variables is prefixed with an ampersand character (&) in the Left, Center, or
Right fields. The value of a variable is updated when the worksheet is printed. In other words, if you display the &Time variable on a worksheet, the time value is updated each time the worksheet is printed. For example, if you insert the &Time variable into a header, Discoverer will print '08.30.00 AM' if you print the worksheet at eight-thirty in the morning and '12.00.00- PM' if you print the worksheet at midday.
Page Setup dialog: Margins tab
23-156 Oracle Business Intelligence Discoverer Plus User’s Guide
Page Setup dialog: Margins tab
Use this dialog to select margin values (for more information, see "About elements of a printed worksheet in Discoverer Plus Relational"). For example, if you are using a Fit to page option, you might want to make a worksheet or graph bigger by increasing the amount of available print space.
The margins you specify determine the space available when selecting the scaling options on the "Page Setup dialog: Table/Crosstab tab" and the "Page Setup dialog: Graph tab".
For more information, see:
"About elements of a printed worksheet in Discoverer Plus Relational"
"About printing in Discoverer Plus Relational"
"How to print Discoverer worksheets"
UnitsUse this drop down list to change the units used by the fields below. For example, you might want to display the values below as either 1 inch, 2.54 centimetres, or 72 pixels.
TopUse this field to specify the size of the top margin. The greater the value, the more space between the top of the printed page and the first line of the worksheet (e.g. the worksheet title or first row of data on each page).
Note: If the top margin is less than the header margin, the header will not print.
LeftUse this field to specify the size of the left margin. The greater the value, the more space between the left side of the printed page and the worksheet data or graph.
BottomUse this field to specify the size of the bottom margin. The greater the value, the more space between the bottom of the printed page and the last line of the worksheet (e.g. the worksheet text area or last row of data on each page).
Note: If the bottom margin is less than the footer margin, the footer will not print.
RightUse this field to specify the size of the right margin. The greater the value, the more space between the right side of the printed page and the worksheet data or graph.
HeaderUse this field to specify the amount of the space between the top of the printed page and the header text specified on the "Page Setup dialog: Header/Footer tab".
Note: If a header margin is greater than a top margin, a header will not print.
FooterUse this field to specify the amount of the space between the bottom of the printed page and the footer text specified on the "Page Setup dialog: Header/Footer tab".
Page Setup dialog: Margins tab
Dialog reference 23-157
Note: If a footer margin is greater than a bottom margin, a footer will not print.
Print PreviewUse this button to display the "Print Preview dialog", which enables you to check that the layout is correct before you print the worksheet.
OKUse this button to close the Page Setup dialog and return to the previous dialog. Discoverer applies the Page Setup options for the current session. To save the Page Setup options permanently for the selected worksheet, you must save the workbook (for more information, see "How to save workbooks").
Page Setup dialog: Table/Crosstab tab
23-158 Oracle Business Intelligence Discoverer Plus User’s Guide
Page Setup dialog: Table/Crosstab tab
Use this dialog to select page ordering, scaling, and whether to repeat worksheet headers on each printed page. For example, you might want Discoverer to adjust the scaling to fit an entire worksheet onto one printed page.
For more information, see:
"About printing in Discoverer Plus Relational"
"What are Page Setup options"
"How to print Discoverer worksheets"
Table/Crosstab Page OrderUse these options to specify how you want to print reports that do not fit onto one printed page.
■ Across, then Down
Use this radio button to print the all columns before printing the rows that do not fit on the first printed page. For example, you have a report with five columns and 100 rows. You can fit four columns and 50 rows on each printed page. Using this option will print:
■ rows 1 to 50 for the first four columns on page one and rows 1 to 50 for column five on page two
■ rows 51 to 100 for the first four columns on page three and rows 51 to 100 for column five on page four
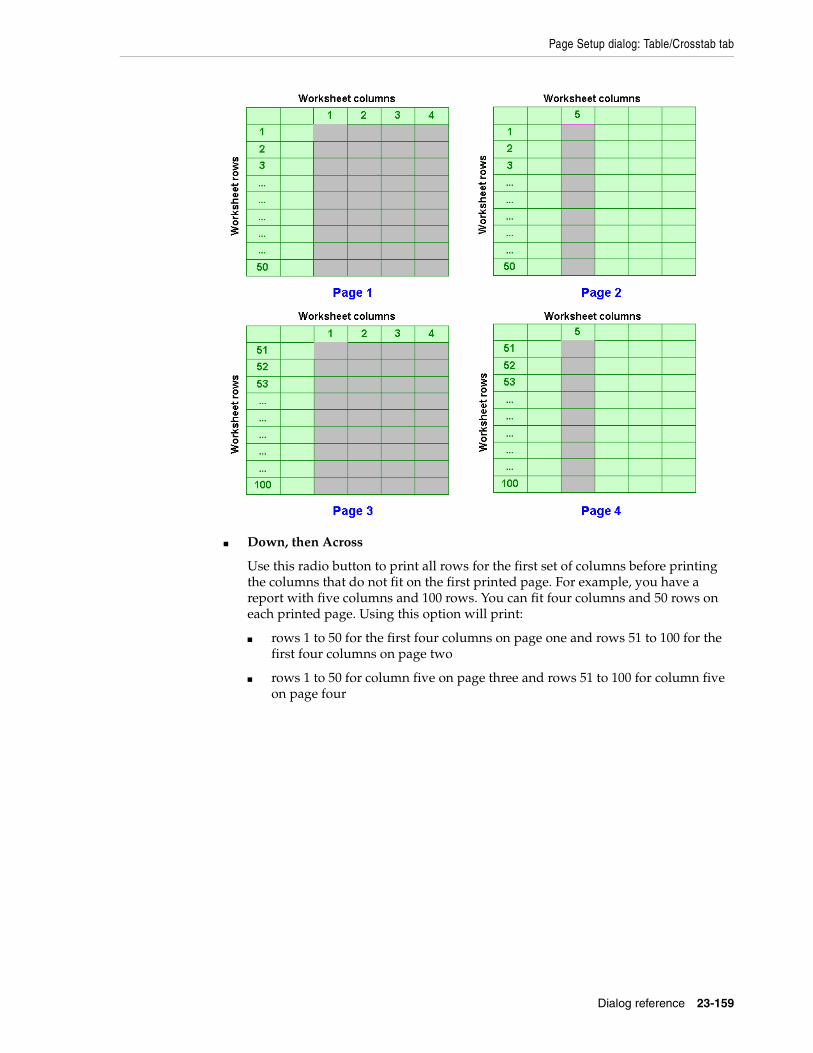
Page Setup dialog: Table/Crosstab tab
Dialog reference 23-159
■ Down, then Across
Use this radio button to print all rows for the first set of columns before printing the columns that do not fit on the first printed page. For example, you have a report with five columns and 100 rows. You can fit four columns and 50 rows on each printed page. Using this option will print:
■ rows 1 to 50 for the first four columns on page one and rows 51 to 100 for the first four columns on page two
■ rows 1 to 50 for column five on page three and rows 51 to 100 for column five on page four
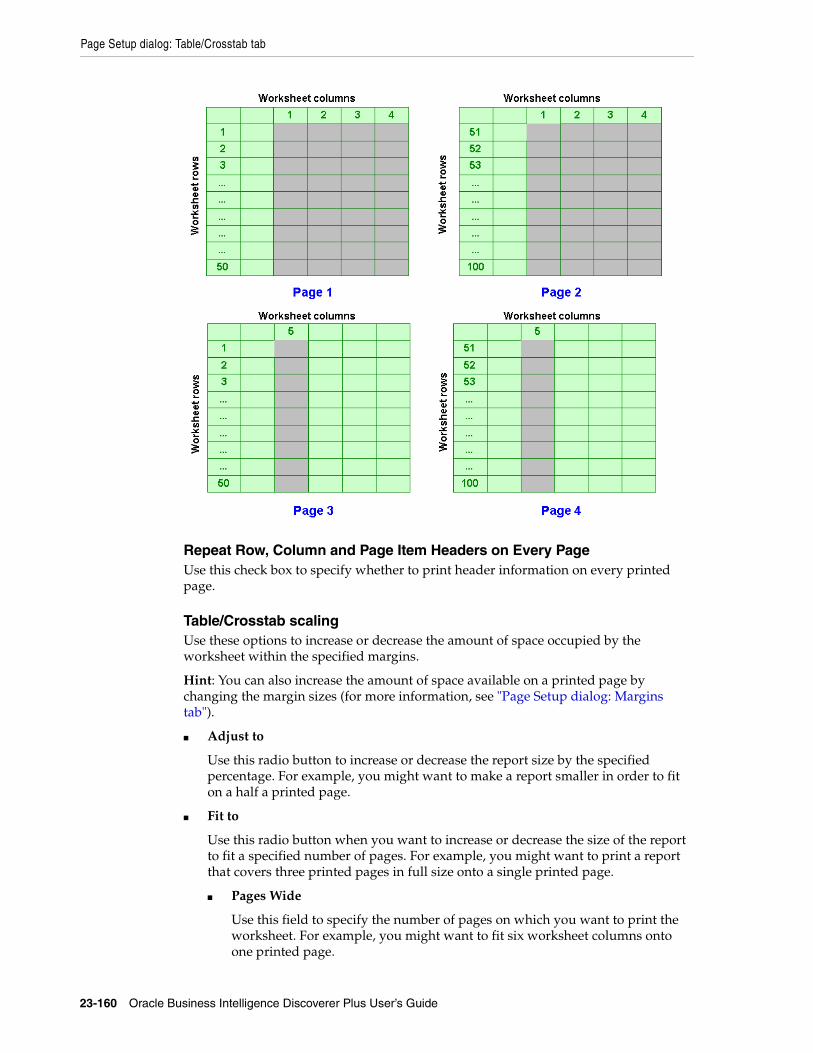
Page Setup dialog: Table/Crosstab tab
23-160 Oracle Business Intelligence Discoverer Plus User’s Guide
Repeat Row, Column and Page Item Headers on Every PageUse this check box to specify whether to print header information on every printed page.
Table/Crosstab scalingUse these options to increase or decrease the amount of space occupied by the worksheet within the specified margins.
Hint: You can also increase the amount of space available on a printed page by changing the margin sizes (for more information, see "Page Setup dialog: Margins tab").
■ Adjust to
Use this radio button to increase or decrease the report size by the specified percentage. For example, you might want to make a report smaller in order to fit on a half a printed page.
■ Fit to
Use this radio button when you want to increase or decrease the size of the report to fit a specified number of pages. For example, you might want to print a report that covers three printed pages in full size onto a single printed page.
■ Pages Wide
Use this field to specify the number of pages on which you want to print the worksheet. For example, you might want to fit six worksheet columns onto one printed page.
Page Setup dialog: Table/Crosstab tab
Dialog reference 23-161
■ Pages Tall
Use this field to specify the number of pages on which you want to print the worksheet. For example, you might want to fit 100 worksheet rows onto one printed page.
Print PreviewUse this button to display the "Print Preview dialog", which enables you to check that the layout is correct before you print the worksheet.
OKUse this button to close the Page Setup dialog and return to the previous dialog. Discoverer applies the Page Setup options for the current session. To save the Page Setup options permanently for the selected worksheet, you must save the workbook (for more information, see "How to save workbooks").
Page Setup dialog: Worksheet tab
23-162 Oracle Business Intelligence Discoverer Plus User’s Guide
Page Setup dialog: Worksheet tab
Use this dialog to select a paper orientation and to specify the areas of the worksheet you want to print. For example, you might want to use landscape format to print a wide report.
For more information, see:
"About printing in Discoverer Plus Relational"
"What are Page Setup options"
"How to print Discoverer worksheets"
Paper SizeThis read-only field displays the default paper size for the default printer.
OrientationUse these radio buttons to specify how the worksheet is positioned on the printed page.
■ Portrait
Use this radio button to position the worksheet vertically.
■ Landscape
Use this radio button to position the worksheet horizontally.
TitleUse these radio buttons to specify whether to repeat the worksheet title area on each printed page.
■ Print on First Page Only
Use this radio button to print the worksheet title on the first page and not on subsequent pages. For example, select this option to print the worksheet title on Page 1 of a three page report.
■ Print on Every Page
Use this radio button to print the worksheet title on each printed page. For example, select this option to print the worksheet title on Pages 1, 2, and 3 of a three page report.
TextUse these radio buttons to specify whether to repeat the worksheet text area on each printed page.
■ Print on First Page Only
Use this radio button to print the worksheet text area on the first page and not on subsequent pages. For example, select this option to print the worksheet text area on Page 1 of a three page report.
■ Print on Every Page
Use this radio button to print the worksheet text area on each printed page. For example, select this option to print the worksheet text area on Pages 1, 2, and 3 of a three page report.
Page Setup dialog: Worksheet tab
Dialog reference 23-163
Page ItemsUse these radio buttons to specify the page item values you want to print. The page item values you specify are printed when you print the current worksheet, or print the whole workbook. If you print the currently selected worksheet only, you can change the page item values selected using the Page Items options on the "Print dialog".
■ Print Current Page Item Selections
Use this radio button to print the data currently displayed on the worksheet. For example, if you have Region in the page items area with East selected, select this radio button to print data for the East region.
■ Print All Page Item Combinations
Use this radio button to print all data for all page item values. For example, if you have Region in the page items area with East selected, select this radio button to print data for all regions (e.g. East, West, and Central).
Print PreviewUse this button to display the "Print Preview dialog", which enables you to check that the layout is correct before you print the worksheet.
OKUse this button to close the Page Setup dialog and return to the previous dialog. Discoverer applies the Page Setup options for the current session. To save the Page Setup options permanently for the selected worksheet, you must save the workbook (for more information, see "How to save workbooks").
Parameters dialog
23-164 Oracle Business Intelligence Discoverer Plus User’s Guide
Parameters dialog
Use this dialog to select a worksheet item on which to create a parameter for the selected worksheet to prompt end users for a parameter value. For example, if you create a link to a worksheet with an active City parameter, you might want to activate a Region parameter instead. In this scenario, when an end user selects the link, they are prompted for a Region, not a City.
You can also change the default parameter value that is used to refine the worksheet displayed when a link is used to connect two worksheets. For example, if you want a link to display a worksheet called Sales that contains a parameter on the Month item, you might want to change the default month from January to February.
Note: If you enter all possible values in the Parameters field, the end user is not prompted to specify a parameter value when they use the link. For example, if you create a link that displays a worksheet with a month parameter, if you specify all twelve months in the Parameters field, Discoverer will not prompt the end user for a month, but will display data for all months.
You can also create a dynamic link, which displays different data for each worksheet cell depending on the value of the cell. For example, you might want to click a link on a worksheet item called Year to display a sales information for that particular year. The value of the worksheet cell is passed to the target worksheet using a worksheet parameter. For more information, see "How to create drill links to Discoverer worksheets".
For more information, see:
"About user defined drill links"
"About drilling in Discoverer worksheets"
"What are parameters?"
ParametersUse this field to change the default parameter value that you pass to the target worksheet by doing one of the following:
■ enter a parameter value surrounded by double quotes (e.g. "January")
If you enter a value in this field or leave this field blank, you create a static link that always displays the same data in the target worksheet. For example, if you enter 'January' as a value for a Month parameter, the worksheet displays data for January.
■ click to down arrow next to the field and select a worksheet item from the drop down list (see <Down arrow button> field description)
If you insert the name of a worksheet item into this field, you create a dynamic link that displays different data for each worksheet cell depending on the value of the cell. For example, you might want to click a link on a worksheet item called Year to display a sales information for that particular year.
<Down arrow button>This button displays a list of select a worksheet items whose value you can to pass to the target worksheet.
For example, if you create a link on a worksheet item called Year to a target worksheet has an active parameter on year, select Year from the drop down list. Discoverer passes

Parameters dialog
Dialog reference 23-165
the value of each cell (e.g. 2005, 2006) to the target worksheet as a parameter value and filters the worksheet data using the parameter value. In other words, if you select the link on the 2005 worksheet value, Discoverer displays a worksheet filtered on 2005 data. If you select the link on the 2006 worksheet value, Discoverer display a worksheet filtered on 2006 data.
DescriptionThis read-only field displays a description of the current parameter that can contain additional information such as hints on using the parameter.
Percent Contribution dialog
23-166 Oracle Business Intelligence Discoverer Plus User’s Guide
Percent Contribution dialog
Use this dialog to create a percent contribution calculation. A percent contribution calculation calculates how much each value contributes to the sum of a set of values, and expresses the ratio as a percentage. For example, you might want to know how each store in a group of stores contributes to annual profits.
This type of analysis is sometimes referred to as reporting analysis.
For more information, see:
"What are analytic functions?"
"How to create a new calculation using an analytic function template"
"Reporting function examples"
Percent contribution onUse this drop down list to choose the item for which you want to calculate the percent contribution. For example, you might choose Sales SUM to calculate a percent contribution of sales values.
Restart percent contribution at each change inUse this list to specify which groups to use if you want to arrange results into groups (sometimes referred to as partitions).
For example, if you have Sales SUM values for each store and you want to calculate the percentage contribution for each store in relation to annual profits, you might choose Calendar Year.
If you do not specify a group, Discoverer treats all worksheet values as a single group.
CalculationThis read-only field displays the underlying formula that you are building as you specify values for the fields above. This formula is updated each time you change one of the values in the fields above. When you click OK, the formula is transferred to the Calculation field in the "New Calculation dialog" or the "Edit Calculation dialog".
Notes■ Discoverer uses an underlying RATIO_TO_REPORT() function for this calculation.
■ For more information about calculating how running totals contribute to their group’s total, see "Percent Running Contribution dialog".
Percent Difference dialog
Dialog reference 23-167
Percent Difference dialog
Use this dialog to create a percent difference calculation. A percent difference calculation typically calculates the difference between an initial value and a subsequent value, and expresses the result as a percentage. For example, you might want to calculate the difference between sales in one month and sales in another month expressed as a percentage.
This type of analysis is sometimes referred to as LAG/LEAD analysis.
Note: To calculate just difference between an initial value and a subsequent value, use the Difference calculation (for more information, see "Difference dialog").
For more information, see:
"What are analytic functions?"
"Examples of using row-based and time-based intervals"
"How to create a new calculation using an analytic function template"
"LAG/LEAD function examples"
Compare values ofUse this drop down list to choose the item for which you want to calculate the percentage difference. For example, you might choose Sales SUM to calculate the change in sales values over time.
Preceding valueUse this drop down list to specify the number of rows or the number of time periods in which you want to compare the values. For example, you might choose 3 to calculate the difference in sales compared to three months previously.
Use the adjacent drop down list to choose a row-based interval or a time-based interval. For example, you might choose Months Before Current Value to compare sales values with earlier sales values.
Hint: If you have time-based data, use time-based groups (e.g. Days/Weeks/Months Before Current Value). If you do not have time-based data, use row-based groups (e.g. Rows Before Current Value). For more information about types of group, see "About windowing".
For examples of specifying row-based and time-based intervals, see "Examples of using row-based and time-based intervals".
Order rows byUse this drop down list to specify how to order the worksheet values. For example, you might choose Calendar Month to compare sales in one month with sales in other months.
Use the adjacent drop down list to specify whether to order values in ascending order (i.e. Lowest to Highest) or descending order (i.e. Highest to Lowest).
Then order rows byUse this drop down list to specify a secondary order for the values. For example, you might choose City to sort values on city within month.
Percent Difference dialog
23-168 Oracle Business Intelligence Discoverer Plus User’s Guide
Use the adjacent drop down list to specify whether to order values in ascending order (i.e. Lowest to Highest) or descending order (i.e. Highest to Lowest).
Restart calculation at each change inUse this list to specify which groups to use if you want to arrange results into groups (sometimes referred to as partitions).
For example, to calculate the difference in Sales SUM values within year, you might choose Calendar Year.
If you do not specify a group, Discoverer treats all worksheet values as a single group.
CalculationThis read-only field displays the underlying formula that you are building as you specify values for the fields above. This formula is updated each time you change one of the values in the fields above. When you click OK, the formula is transferred to the Calculation field in the "New Calculation dialog" or the "Edit Calculation dialog".
Notes■ A percent difference calculation will return a null value if there is no preceding
value with which to compare.
Percent Rank dialog
Dialog reference 23-169
Percent Rank dialog
Use this dialog to create a percent rank calculation. A percent rank calculation calculates the relative position of a value in a group of values, and expresses the result as a percentage. For example, you might want to find out which products are in the top 25% and top 50% of best selling products. In other words, if you calculate the percent rank for sales totals for 15 stores (highest value ranked 1):
■ the store ranked 4th has the percent rank value of 25%
■ the store ranked 8th has the percent rank value of 50%.
You can therefore find the top 25% and 50% of the best performing stores.
Note: Percent Rank analysis is similar to cumulative distribution.
For more information, see:
"What are analytic functions?"
"How to create a new calculation using an analytic function template"
"Ranking function examples"
Rank based onUse this drop down list to choose the item for which you want to calculate the percentage rank. For example, to calculate the percent rank of stores, you might choose Sales SUM.
Use the adjacent drop down list to specify the ranking order. For example, you might choose Highest Value Ranked 1 if you want stores with the highest sales to have the highest ranked list positions. In other words:
■ if you choose Highest Value Ranked 1, the highest ranked item has the percent rank value of 0%
■ if you choose Highest Value Ranked 1, the lowest ranked item has the percent rank value of 100%
Then rank based onUse this drop down list to choose an item that is used to determine the rank of values if they have tied ranks (i.e. the same rank in the Rank based on field).
For example, to find stores with the highest sales and lowest costs you might choose the following:
■ Sales SUM and Highest Value Ranked 1 in the Rank based on field
■ Costs SUM and Lowest Value Ranked 1 in the Then rank based on field
In other words, if you have two stores with the same Sales SUM value, you might determine the rank by looking at the Costs SUM value to see which store has the lowest costs.
Restart ranking at each change inUse this list to specify which groups to use if you want to arrange results into groups (sometimes referred to as partitions).
Percent Rank dialog
23-170 Oracle Business Intelligence Discoverer Plus User’s Guide
For example, to calculate a percent rank of Sales SUM values within year, you might choose Calendar Year. In other words, if Sales SUM values span two years you will have a best performing store for each year.
If you do not specify a group, Discoverer treats all worksheet values as a single group.
CalculationThis read-only field displays the underlying formula that you are building as you specify values for the fields above. This formula is updated each time you change one of the values in the fields above. When you click OK, the formula is transferred to the Calculation field in the "New Calculation dialog" or the "Edit Calculation dialog".
Notes■ To calculate just the ranked list position of items, see "Rank dialog".
■ You can find the median value in a set of values by looking at the value with 50% (or nearest 50%) as the percent rank value.
■ Discoverer uses an underlying PERCENT_RANK() function for this calculation.
■ Percent rank is calculated as the rank of each row minus 1, divided by 1 less than the number of rows being evaluated (the entire query result set or a partition). The range of values returned is 0 to 1, inclusive. The first row in any set has a PERCENT_RANK value of 0.
For example, a value ranked 3 in a group of 5 values has the percent rank of 0.5 (i.e. 3 minus 1 divided by 5 minus 1, or 2 divided by 4, which gives 0.5 or 50%).
Percent Running Contribution dialog
Dialog reference 23-171
Percent Running Contribution dialog
Use this dialog to create a percent running contribution calculation. A percent running contribution calculation can be used for Pareto analysis (sometimes referred to as 80-20 analysis). Pareto analysis calculates how the running total contributes to a group, and expresses the result as a percentage. For example, you might want to know how the top five stores contribute as a percentage of annual sales.
This type of analysis is sometimes referred to as reporting analysis.
For more information, see:
"What are analytic functions?"
"How to create a new calculation using an analytic function template"
"Reporting function examples"
Percent running contribution onUse this drop down list to choose the item for which you want to calculate the running total. For example, you might choose Sales SUM to calculate a percent running total of sales values.
Order rows byUse this drop down list to specify how to order the values. You typically order by the item specified in the Percent running contribution on drop down list, or a time period item.
Use the adjacent drop down list to specify whether to order values in ascending order (i.e. Lowest to Highest) or descending order (i.e. Highest to Lowest).
Then order rows byUse this drop down list to specify a secondary order for the values. For example, you might choose City to sort values on city within month.
Use the adjacent drop down list to specify whether to order values in ascending order (i.e. Lowest to Highest) or descending order (i.e. Highest to Lowest).
Restart percent running contribution at each change inUse this list to specify which groups to use if you want to arrange results into groups (sometimes referred to as partitions).
For example, to calculate the percent running contribution of each store in relation to all stores for each year, you might choose Calendar Year.
If you do not specify a group, Discoverer treats all worksheet values as a single group.
CalculationThis read-only field displays the underlying formula that you are building as you specify values for the fields above. This formula is updated each time you change one of the values in the fields above. When you click OK, the formula is transferred to the Calculation field in the "New Calculation dialog" or the "Edit Calculation dialog".

Preceding Value dialog
23-172 Oracle Business Intelligence Discoverer Plus User’s Guide
Preceding Value dialog
Use this dialog to create a preceding value calculation. A preceding value calculation returns the value that is a specified number of rows or a specified time period before each value. For example, you might want to know what the previous month’s sales are for each value.
You typically create preceding calculations for use in other calculations. For example, you might use the preceding month’s sales values to calculate the change in sales from the previous month.
This type of analysis is sometimes referred to as LAG/LEAD analysis.
Note: To return a following value rather than a preceding value, use the Following Value dialog (see "Following Value dialog").
For more information, see:
"What are analytic functions?"
"Examples of using row-based and time-based intervals"
"How to create a new calculation using an analytic function template"
"LAG/LEAD function examples"
Preceding value ofUse this drop down list to choose the item for which you want to return the preceding value. For example, you might choose Sales SUM to calculate a previous sales value.
Return valueUse this drop down list to specify the number of rows or the number of time periods in which you want to compare the values. For example, you might choose '3' to compare sales values with earlier sales values.
Use the adjacent drop down list to choose a row-based interval or a time-based interval. For example, you might choose Months Preceding Current Value to compare sales values with earlier sales values.
Hint: If you have time-based data, use time-based groups (e.g. Days/Weeks/Months Before Current Value). If you do not have time-based data, use row-based groups (e.g. Rows Before Current Value). For more information about types of group, see "About windowing".
For examples of specifying row-based and time-based intervals, see "Examples of using row-based and time-based intervals".
Order rows byUse this drop down list to specify how to order the worksheet values. For example, you might choose Calendar Month to compare sales with the previous month’s sales.
Use the adjacent drop down list to specify whether to order values in ascending order (i.e. Lowest to Highest) or descending order (i.e. Highest to Lowest).
Hint: If you have specified a time-based group in the Return value fields, specify a time-based value in the Order rows by fields (e.g. Calendar Month).
Preceding Value dialog
Dialog reference 23-173
Then order rows byUse this drop down list to specify a secondary order for the values. For example, you might choose 'City' to sort values on city within month.
Use the adjacent drop down list to specify whether to order values in ascending order (i.e. Lowest to Highest) or descending order (i.e. Highest to Lowest).
Restart calculation at each change inUse this list to specify which groups to use if you want to arrange results into groups (sometimes referred to as partitions).
For example, to calculate the preceding value of sales values of months within each year, you might choose Calendar Year.
If you do not specify a group, Discoverer treats all worksheet values as a single group.
CalculationThis read-only field displays the underlying formula that you are building as you specify values for the fields above. This formula is updated each time you change one of the values in the fields above. When you click OK, the formula is transferred to the Calculation field in the "New Calculation dialog" or the "Edit Calculation dialog".
Notes■ A preceding value calculation will return a null value if there is no preceding
value.
Print dialog
23-174 Oracle Business Intelligence Discoverer Plus User’s Guide
Print dialog
Use this dialog to specify the parts of the worksheet you want to print. For example, you might want to print an entire workbook, or just the currently displayed graph.
For more information, see:
"About printing in Discoverer Plus Relational"
"What are Page Setup options"
"How to print Discoverer worksheets"
PrintUse these options to select the Discoverer worksheets to print.
■ Entire Workbook
Use this radio button to print the worksheet and graph for all worksheets in the workbook, including page item values selected in the individual worksheets’ Page Setup options.
Note:
■ The Page Setup and Preview buttons are not available when you select this radio button.
■ If any of the worksheets have active parameters, Discoverer displays the "Edit Parameter Values dialog" to prompt for parameter values.
■ You can specify Page Setup options for each worksheet before you print the workbook (for more information, see "How to change Page Setup options for a worksheet"). For example, you might want to print all page item combinations for a worksheet by first selecting the Print All Page Item Combinations on the "Page Setup dialog: Worksheet tab".
■ Current Worksheet
Use this radio button to print the currently displayed worksheet only. When you select this radio button, the Table and Graph check boxes are active, which enable you to print just the data, just the graph, or both data and graph.
■ Table/Crosstab
Use this check box to print the current worksheet data as displayed. If the worksheet has page items, use the Page Items options to specify the page item values to print. Discoverer also prints the worksheet title area and text area, if specified.
■ Graph
Use this check box to print the graph for the current worksheet (even if the graph is not currently displayed on-screen). Discoverer also prints the worksheet title area and text area, if specified.
If you select this check box when the worksheet does not currently have a graph, Discoverer creates a default graph for you to print out.
■ Page Items
Print dialog
Dialog reference 23-175
Use these options to specify the page item values you want to print. For example, if the Region in the page items area currently has East selected, you can print data for either the East region only, or all regions.
Print Current Selections
Use this radio button to print the data currently displayed on the worksheet. For example, if the Region in the page items area currently has East selected, select this radio button to print data for the East region.
Print All Combinations
Use this radio button to print data for all page items. For example, if the Region in the page items area currently has East selected, select this radio button to print data for all regions (e.g. East, West, and Central).
Automatically Resolve Issues that Occur During Printing
Use this check box to specify whether you want to view Discoverer alerts during printing. For example, if you clear this check box Discoverer might display an alert for a long running query.
When you select this check box, the Skip sheets with long running queries check box becomes active.
Skip sheets with long running queries
Use this check box to not print large or complex worksheets that exceed the long running query limit. For more information about how to manage queries that run during printing, see "Options dialog: Query Governor tab".
Page SetupUse this button to display the "Page Setup dialog", which enables you to change the print settings for the current worksheet (e.g. select the orientation or margin size, create a page header and footer).
Print PreviewUse this button to display the "Print Preview dialog", which enables you to check that the layout is correct before you print the worksheet.
OKUse this button to display the operating system print dialog, which enables you to print the report.
Print Preview dialog
23-176 Oracle Business Intelligence Discoverer Plus User’s Guide
Print Preview dialog
Use this dialog to check that the worksheet print layout is correct before you print the report. For example, you might want to make sure that you can fit a printed report onto a single side of A4 size paper.
For more information, see:
"About printing in Discoverer Plus Relational"
"What are Page Setup options"
"How to print Discoverer worksheets"
ZoomUse this drop down list to increase and decrease the magnification of the report in the preview pane below.
<Preview pane>This area shows how the worksheet will look when it is printed. Use the page navigation buttons (<<,<,>,>>) to display different pages in the report in the <Preview pane>.
Page SetupUse this button to display the "Page Setup dialog", which enables you to change the print settings for the current worksheet (e.g. select the paper orientation or margin size, create a page header and footer).
PrintUse this button to print the worksheet. Discoverer displays the operating system print dialog, which enables you to set additional print options and print the report.
CloseUse this button to close the Print Preview dialog and display the previous dialog.
Rank dialog
Dialog reference 23-177
Rank dialog
Use this dialog to create a rank calculation. A rank calculation calculates the ranked list position of values. For example, you might want to know what are the top ten highest performing stores based on sales.
Hint: If you want to perform top-n analysis, apply a condition to the worksheet to limit the data by rank. For example, you might use a condition where Rank is less than or equal to ten to find the top ten values.
For more information, see:
"What are analytic functions?"
"How to create a new calculation using an analytic function template"
"Ranking function examples"
Rank based onUse this drop down list to choose the item for which you want to calculate the rank. For example, to calculate the relative position of stores based on sales, you might choose Sales SUM.
Use the adjacent drop down list to specify the ranking order. For example, you might choose Highest Value Ranked 1 if you want stores with the higher sales to have the higher rank.
Then rank based onUse this drop down list to choose an item that is used to determine the rank of values if they have tied ranks (i.e. the same rank in the Rank based on field).
For example, to find stores with the highest sales and lowest costs you might choose the following:
■ Sales SUM and Highest Value Ranked 1 in the Rank based on field
■ Costs SUM and Lowest Value Ranked 1 in the Then rank based on field
In other words, if you have two stores with the same Sales SUM value, you might determine the rank by looking at the Costs SUM value to see which store has the lowest costs.
Restart ranking at each change inUse this list to specify which groups to use if you want to arrange results into groups (sometimes referred to as partitions).
For example, to calculate a rank of Sales SUM values within year, you might choose Calendar Year. In other words, if Sales SUM values span two years you will have a best performing store for each year.
If you do not specify a group, Discoverer treats all worksheet values as a single group.
Rank TiesUse these radio buttons to specify how you want to calculate the rank of a value following two or more identical values (known as ties).
Rank dialog
23-178 Oracle Business Intelligence Discoverer Plus User’s Guide
■ Normal - use non-consecutive ranking numbers when values are equal. For example, if the top five values are equal, assign the rank 1 to each value, and assign the rank 6 to the next ranked value.
■ Dense - use consecutive ranking numbers when values are equal. For example, if the top five values are equal, assign the rank 1 to each value, and assign the rank 2 to the next ranked value.
CalculationThis read-only field displays the underlying formula that you are building as you specify values for the fields above. This formula is updated each time you change one of the values in the fields above. When you click OK, the formula is transferred to the Calculation field in the "New Calculation dialog" or the "Edit Calculation dialog".
Reference Lines dialog
Dialog reference 23-179
Reference Lines dialog
Use this dialog to specify reference lines for a graph. A reference line is a fixed line against which graphed values can be compared. For example, you might add a reference line to represent a sales target, to emphasize which regions achieved the sales target.
For more information, see:
"About components of a Discoverer graph"
ShowUse this field to specify whether reference lines appear in the graph.
ColorUse this field to specify the color of the reference lines.
ThicknessUse this field to specify the thickness (or weight) of the reference line.
LabelUse this field to specify a label for the reference line. Click in the box and type a label. The label is displayed in the graph legend.
Cross atUse this field to specify the value along the axis at which the reference line is displayed. For example, to represent a sales target of $100,000, you might enter 100,000. Or, on a percentage axis, enter 40 to add a reference line at 40%.
Running Total dialog
23-180 Oracle Business Intelligence Discoverer Plus User’s Guide
Running Total dialog
Use this dialog to create a running total calculation. A running total calculation calculates the total starting with the first value in the group, adding each previous total value to the next value in the group. For example, you might want to calculate a cumulative total of sales figures.
This type of analysis is sometimes referred to as windowing.
For more information, see:
"What are analytic functions?"
"How to create a new calculation using an analytic function template"
Running total onUse this drop down list to choose the item for which you want to calculate the running total. For example, you might choose Sales SUM to calculate a running total of sales values.
Order rows byUse this drop down list to specify how to order the values. For example, you might choose Calendar Month if you want running total across months.
Use the adjacent drop down list to specify whether to order values in ascending order (i.e. Lowest to Highest) or descending order (i.e. Highest to Lowest).
Then order rows byUse this drop down list to specify a secondary order for the values. For example, you might choose Calendar Month from the Order rows by list and City from the Then order rows by list to sort values on city within month.
Use the adjacent drop down list to specify whether to order values in ascending order (i.e. Lowest to Highest) or descending order (i.e. Highest to Lowest).
Restart running total at each change inUse this list to specify which groups to use if you want to arrange results into groups (sometimes referred to as partitions).
For example, to calculate a running total for Sales SUM values within year, you might choose Calendar Year here. In other words, if you have Sales SUM values spanning two years, you will have a running total for each year.
If you do not specify a group, Discoverer treats all worksheet values as a single group.
CalculationThis read-only field displays the underlying formula that you are building as you specify values for the fields above. This formula is updated each time you change one of the values in the fields above. When you click OK, the formula is transferred to the Calculation field in the "New Calculation dialog" or the "Edit Calculation dialog".
Save Workbook to Database dialog
Dialog reference 23-181
Save Workbook to Database dialog
Use this dialog to save the current workbook in the database. For example, you might want to save a new workbook that you have just created, or save a copy of an existing workbook with a new name.
Hint: If you want to publish the workbook to other Discoverer Plus Relational or Discoverer Viewer users, you must save the workbook and share it (for more information, see "About sharing workbooks"). Before you publish a Discoverer workbook, make sure that the workbook is designed for maximum performance (for more information, see "About designing workbooks for maximum performance").
For more information, see:
"What are workbooks?"
ViewUse this list to specify the type of workbooks you want to display in the Workbooks list. For example, you might choose My Workbooks to display only workbooks owned by the database user that you are logged in as.
<View style button>Use this drop down list to select a style for the Workbooks list. For example, you might choose the User Tree option to display workbooks grouped by database user. Or you might choose Workbook Tree to display workbooks in alphabetical order.
Name containsUse this field to restrict the Workbooks list to those workbooks with names that contain the character(s) that you specify. For example, enter 'January' to display in the Workbooks list only those workbooks with names that contain January.
ClearUse this button to clear any text in the Name contains field and display the names of all workbooks in the Workbooks list.
WorkbooksUse this list to view the names of existing workbooks in the database.
Hint: Click on a column name to sort the Workbooks list on that column. Click on the arrow in a column name to reverse the sort order. You can also drag and drop columns to a different position in the Workbooks list.
New nameUse this field to enter a name for the workbook and click Save to save the workbook. The name you enter must be unique.
You can enter a name in the New name field that:
■ has an maximum length of approximately 100 characters (depending on the language in which you are running Discoverer).
■ includes upper or lower case characters, and spaces. For example 'Jchan Sales Workbook March performance reports'.
■ does not include a colon (:) character
Save Workbook to Database dialog
23-182 Oracle Business Intelligence Discoverer Plus User’s Guide
SaveUse this button to save the workbook in Discoverer and close the dialog.
Notes■ If two users open the same workbook and try to save the workbook at the same
time, Discoverer saves the changes made by the user that saves the workbook first. The second user is informed that the workbook has been modified and given the option to overwrite the modifications or save the workbook under a different name.
■ To store additional information about a workbook (e.g. the intended audience) you must update the workbook’s properties and then save the workbook. For more information, see "How to view and update a workbook’s properties".
Schedule Wizard dialog
Dialog reference 23-183
Schedule Wizard dialog
Use this dialog to create new scheduled workbooks. For example, you might want to schedule a weekly report, or create a snap shot of Discoverer data to share with another Discoverer user.
This dialog is also displayed as:Edit Scheduled Workbook dialog (when you are editing a scheduled workbook)Copy Scheduled Workbook dialog (when you are copying a scheduled workbook)
For more information, see:
"Schedule Wizard dialog: General tab"
"Schedule Wizard dialog: Schedule tab"

Schedule Wizard dialog: General tab
23-184 Oracle Business Intelligence Discoverer Plus User’s Guide
Schedule Wizard dialog: General tab
Use this dialog to specify a name and description for a scheduled workbook, and specify which worksheets are included for processing. For example, you might want to schedule only one worksheet in a workbook.
This dialog is also displayed as:Copy Scheduled Workbook dialog: General tabEdit Scheduled Workbook dialog: General tab
For more information, see:
"What are scheduled workbooks?"
"When to use scheduled workbooks"
"About how scheduled workbooks are processed"
What do you want to name this scheduled workbook?Use this field to enter a short descriptive name for the scheduled workbook. This name will be used by users to identify the workbook in Discoverer.
What description do you want for this scheduled workbook?Use this field to enter additional information about the workbook. This information is used by workbook users when they choose which workbooks to open.
(optional) Which worksheet(s) do you want to include in this scheduled workbook?Use this list to specify which worksheets you want to include in the scheduled workbook. To include a worksheet, select the check box next to the worksheet.
(optional) Select AllUse this button to select every worksheet in the worksheet list.
(optional) Select NoneUse this button to deselect every worksheet in the worksheet list.
Schedule Wizard dialog: Schedule tab
Dialog reference 23-185
Schedule Wizard dialog: Schedule tab
Use this dialog to specify when you want the scheduled workbook to be processed. For example, you might want to process a workbook at 1.00 a.m. when the network has spare capacity.
This dialog is also displayed as:Copy Scheduled Workbook dialog: Schedule tabEdit Scheduled Workbook dialog: Schedule tab
For more information, see:
"What are scheduled workbooks?"
"When to use scheduled workbooks"
"About how scheduled workbooks are processed"
When do you want to schedule this workbook?Use these fields to specify when you want Discoverer to process the scheduled workbook.
■ Immediately
Use this radio button to process the scheduled workbook as soon as you click Finish.
■ Time
Use this radio button to process the scheduled workbook at a time in the future that you specify in the adjacent field.
You can change the date and time by selecting individual parts of the field (e.g. day of the week) and using the up and down arrows to increment and decrement the values. For example:
■ click on Sunday in the day area and click the up arrow to change the value to Monday or click the down arrow to change the value to Saturday
■ click on 12 in the hour area and click the up arrow to change the value to 1 or click the down arrow to change the value to 11
■ click on AM in the time area and click the up arrow or down arrow to change the value to PM
Hint: Click on the calendar icon to the right of the field to specify a date using the graphical "Calendar dialog".
Note: The time and date that you set here is the time on the database machine, which might be different from the date and time on the Discoverer client machine. For more information about the time on the database machine, contact the Discoverer manager.
How often do you want to schedule this workbook?Use these fields to specify how often Discoverer processes the scheduled workbook.
■ Never
Schedule Wizard dialog: Schedule tab
23-186 Oracle Business Intelligence Discoverer Plus User’s Guide
Use this radio button when you want Discoverer to process a scheduled workbook on demand rather than at regular intervals. For example, for an occasional report requested by your manager.
■ Repeat every
Use these fields when you want Discoverer to process a scheduled workbook regularly. Use the first field to specify a number, and the second field to specify an interval. For example, choose '1' and 'Week' to process a scheduled workbook once every week at the time and date specified by When do you want to schedule this workbook?.
Do you want to keep all versions of results?Use these fields to specify whether to store scheduled workbook results sets or over-write the previous scheduled workbook results set each time Discoverer produces a new set. If a report is processed frequently, using this option might require a large amount of database space - contact the Discoverer manager for more details.
■ Yes, keep all results
Use this radio button when you want Discoverer to store the scheduled workbook results sets each time a scheduled workbook is processed. Use this option when you want to store historical data.
■ No, just keep the latest set of results
Use this radio button when you want Discoverer to store only the latest scheduled workbook results set. Use this option when you do not want to store historical data.
How long do you want to keep the results?
Delete results after _ daysUse this field to specify how long you store the latest scheduled workbook results set. For example, if you process a weekly report, you might delete the results after seven days to minimize the amount of database space used.
Scheduling Manager dialog
Dialog reference 23-187
Scheduling Manager dialog
Use this dialog to manage scheduled workbooks. For example, to create a new scheduled workbook, or change the time or frequency of an existing scheduled workbook.
For more information, see:
"What are scheduled workbooks?"
"When to use scheduled workbooks"
"About how scheduled workbooks are processed"
Scheduled Workbooks:Use this list to look at the workbooks that are currently scheduled and whether scheduled workbook results sets are ready to open, as follows:
■ use the plus symbol (+) next to each scheduled workbook to expand the list to display scheduled workbook results sets for that workbook
■ use the minus symbol (-) next to scheduled workbooks to collapse the list of scheduled workbook results sets
Hint: If a scheduled workbook results sets has 'Report Ready’ in the Status field, the report has been processed and is ready to open. To open a report, select the report and click Open.
OpenUse this button to open the currently selected scheduled workbook results set in Discoverer. You can then analyze the worksheet data, print reports, and share the data with other Discoverer users.
Note: The Open button is grayed out if you have selected a scheduled workbook in the Scheduled Workbooks list. Make sure that you first select a scheduled workbook results set.
EditUse this button to display the "Schedule Wizard dialog: Schedule tab", where you change currently selected scheduled workbook.
CopyUse this button to make a copy of the selected scheduled workbook that you can edit to create a new scheduled workbook. This provides a quick way to create a scheduled workbook when a similar scheduled workbook already exists.
DeleteUse this button to remove the currently selected scheduled workbook or scheduled workbook results sets permanently. Do one of the following:
■ select a scheduled workbook in the Scheduled Workbooks list, then click Delete to remove the scheduled workbook and its scheduled workbook results sets.
■ select a scheduled workbook results set then click Delete to remove the scheduled workbook results set but continue processing the scheduled workbook.
Scheduling Manager dialog
23-188 Oracle Business Intelligence Discoverer Plus User’s Guide
Note: You can also use the Unscheduled button to stop a scheduled workbook from being processed but keep its results sets.
View ErrorUse this button to find out why a scheduled workbook failed. The Error Details dialog displays the error message generated when the scheduled workbook failed.
UnscheduleUse this button to stop the currently selected scheduled workbook but keep its scheduled workbook results sets.
Note: The Unscheduled button is grayed out if:
■ the scheduled workbook is a single run workbook that has been processed (i.e. the value in the Status column is Report Ready).
■ the scheduled workbook has already been unscheduled (i.e. the value in the Status column is Unscheduled).
■ a scheduled workbook is not selected in the Scheduled Workbooks list (e.g. you have selected a scheduled workbook results set).
Hint: To restart a scheduled workbook that has been unscheduled, use the Copy option to copy the scheduled workbook and recreate it.
ScheduleUse this button to display the "Schedule Wizard dialog: General tab", where you create scheduled workbooks.
RefreshUse this button to refresh the Scheduled Workbooks list with up-to-date status information.
Note: If you only have Discoverer privileges to open scheduled workbook results, this button is grayed out. For more information about the Discoverer privileges that you have, contact the Discoverer manager.
Select Condition dialog
Dialog reference 23-189
Select Condition dialog
Use this dialog to add an existing condition to a new condition. For example, you might want to use an existing condition to build a new complex condition.
For more information, see:
"What are conditions?"
Select a conditionUse this list to select which existing condition you want to add to the new condition. A new condition statement line is added to the condition Formula area on the "New Condition dialog" or "Edit Condition dialog" dialog.
Select Item dialog
23-190 Oracle Business Intelligence Discoverer Plus User’s Guide
Select Item dialog
Use this dialog to select which item you want to match against when defining a condition or a parameter, as follows.
■ If you are creating a condition, you might have two items and want to display data where values in the first item match values in the second item. In other words, display data where values exist on both item one and item two. For example, if you had a condition statement:
Data.Month = Analysis.Month
you display data where January exists in both items Data.Month and Analysis.Month.
■ If you are creating a parameter, this dialog displays all items available in the worksheet, not just items that are currently displayed. For example, although you do not display year information on a worksheet, you might want users to be able to specify which year’s data they want to analyze.
Select an itemUse this list to select which item you want to match against. For example, if you are creating a parameter to enable worksheet users to choose which year’s data they want to analyze, you might choose Video Analysis Information.Calendar Year.
Select item to drill dialog
Dialog reference 23-191
Select item to drill dialog
Use this dialog to select which item you want to use to drill into or out of a worksheet.
Note: This dialog is displayed when there are too many items to display in a drop down list.
For more information, see:
"About drilling in Discoverer worksheets"
Select one of the following items to drillUse this list to select the item on which you want to drill. For example, you might choose Calendar Month to display worksheet data for individual months.
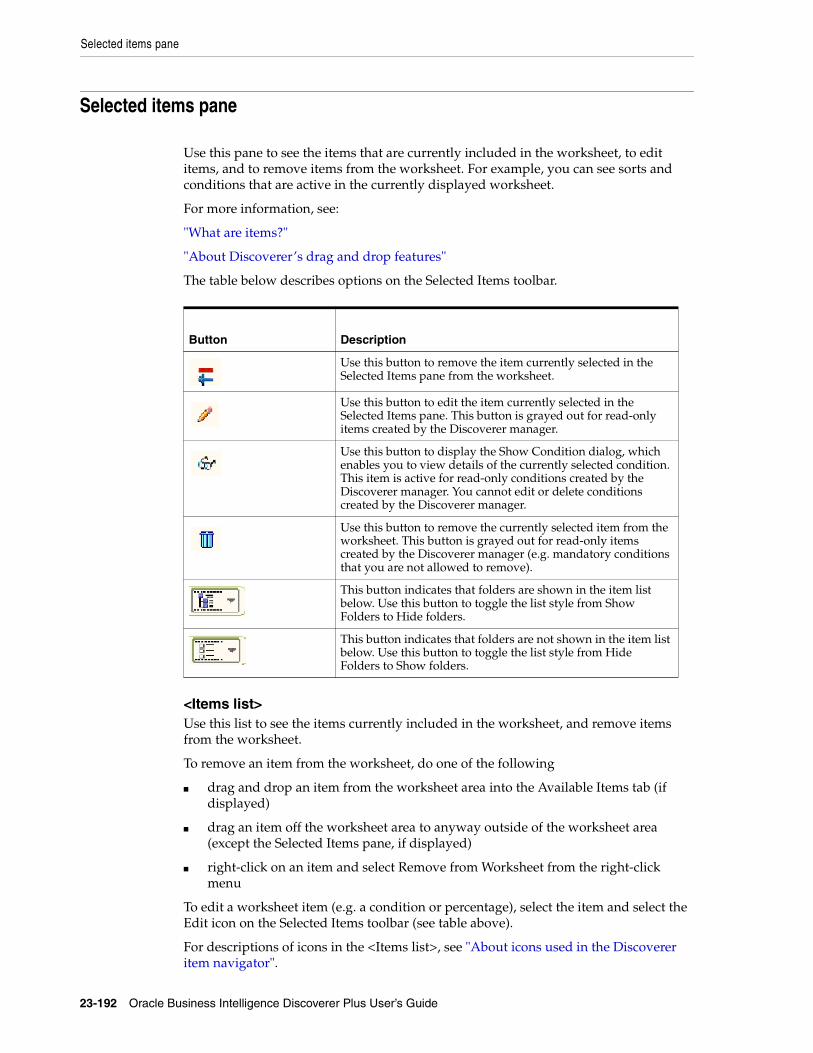
Selected items pane
23-192 Oracle Business Intelligence Discoverer Plus User’s Guide
Selected items pane
Use this pane to see the items that are currently included in the worksheet, to edit items, and to remove items from the worksheet. For example, you can see sorts and conditions that are active in the currently displayed worksheet.
For more information, see:
"What are items?"
"About Discoverer’s drag and drop features"
The table below describes options on the Selected Items toolbar.
<Items list>Use this list to see the items currently included in the worksheet, and remove items from the worksheet.
To remove an item from the worksheet, do one of the following
■ drag and drop an item from the worksheet area into the Available Items tab (if displayed)
■ drag an item off the worksheet area to anyway outside of the worksheet area (except the Selected Items pane, if displayed)
■ right-click on an item and select Remove from Worksheet from the right-click menu
To edit a worksheet item (e.g. a condition or percentage), select the item and select the Edit icon on the Selected Items toolbar (see table above).
For descriptions of icons in the <Items list>, see "About icons used in the Discoverer item navigator".
Button Description
Use this button to remove the item currently selected in the Selected Items pane from the worksheet.
Use this button to edit the item currently selected in the Selected Items pane. This button is grayed out for read-only items created by the Discoverer manager.
Use this button to display the Show Condition dialog, which enables you to view details of the currently selected condition. This item is active for read-only conditions created by the Discoverer manager. You cannot edit or delete conditions created by the Discoverer manager.
Use this button to remove the currently selected item from the worksheet. This button is grayed out for read-only items created by the Discoverer manager (e.g. mandatory conditions that you are not allowed to remove).
This button indicates that folders are shown in the item list below. Use this button to toggle the list style from Show Folders to Hide folders.
This button indicates that folders are not shown in the item list below. Use this button to toggle the list style from Hide Folders to Show folders.
Select Parameter dialog
Dialog reference 23-193
Select Parameter dialog
Use this dialog when you select an item in the Item field that has a parameter created against it, and you want to match the selected item against a dynamic value entered as a parameter.
For example, you have a parameter called 'Increase amount' that is set to 1000. The 'Increase amount' parameter value entered is used to calculate a stock increase amount. You might also want to restrict the worksheet to items where the quantity is greater than the value of the 'Increase amount' parameter (i.e. 1000 in this example).
For more information, see:
"What are parameters?"
Select a parameterUse this list to select which parameter value you want to match against the selected item.
Select User dialog
23-194 Oracle Business Intelligence Discoverer Plus User’s Guide
Select User dialog
Use this dialog to search for and select the database user (or role) with whom you want to share workbooks. For example, to narrow your search you might want to list only database usernames that begin with the letter C.
For more information, see:
"About sharing workbooks"
"About sharing workbooks and security"
Search inUse this drop down list to specify whether to search for database users (and/or roles), or both.
Search byUse this drop down list to specify how you want to match against the value that you type in the Search for field. For example, to find all database usernames starting with the letter T, choose Starts With and type T in the Search for field.
Search forUse this field to enter the text that you want to search for. For example, to find all database usernames starting with the letter T, type T and choose Starts With from the Search by drop down list.
GoUse this button to start the search according to the search criteria that you have specified and display matching values in the Results list in groups of 100.
If you click Go when the Search for field is empty, all database users specified by the Search In value are displayed.
ResultsThis list displays the results of the search. Use this list to select a database user (or role). Select a name in the list and click OK.
PreviousUse this button to display the previous 100 database users (or roles).
NextUse this button to display the next 100 database users (or roles).
Select Value dialog
Dialog reference 23-195
Select Value dialog
Use this dialog to search LOV values and select the value that you want. For example, when you choose a parameter value or condition item that has a long list of values, you might want to search for values that begin with the letter 'C', and then select 'CPM'.
For more information, see:
"Using lists of values (LOVs)"
Search byUse this drop down list to specify how you want to match values. For example, choose Starts With and enter 'T' as a Search for value to list only items beginning with the letter 'T'.
Search forUse this field to enter the text that you want to match against. For example, enter 'T' here and choose Starts With in the Search by drop down list to list only items beginning the letter 'T'.
GoUse this button to start the search according to the search criteria that you have specified and display matching values in the Displayed values list below. If you click Go when the Search for field is empty, the first group of values in the LOV is displayed.
Case-sensitiveUse this check box to specify whether you want to match upper and lower case letters exactly when searching (e.g. when selected, the search term 'New York' would find 'New York', but would not find 'NEW YORK', 'new york', or 'new York').
Displayed valuesThis list displays values that match the search criteria that you have specified, or values displayed by default when the dialog is first displayed.
<Left arrow>Use this button to display the previous set of values.
<Right arrow>Use this button to display the next set of values.
Notes■ The number of values retrieved at a time is specified by the Discoverer manager.
■ To search for null values, enter NULL or "" in the Search for field.
Select Values dialog
23-196 Oracle Business Intelligence Discoverer Plus User’s Guide
Select Values dialog
Use this dialog to search LOV values and select the values that you want. For example, when you choose a parameter value or condition item that has a long list of values, you might want to search for values that begin with the letter 'C', and then select 'CPM' and 'CPN' and 'CPO'.
For more information, see:
"Using lists of values (LOVs)"
Search byUse this drop down list to specify how you want to match values. For example, choose Starts With and enter 'T' as a Search for value to list only items beginning with the letter 'T'.
Search forUse this field to enter the text that you want to match against. For example, enter 'T' here and choose Starts With in the Search by drop down list to list only items beginning the letter 'T'.
GoUse this button to start the search according to the search criteria that you have specified and display matching values in the Displayed values list below. If you click Go when the Search for field is empty, the first group of values in the LOV is displayed.
Case-sensitiveUse this check box to specify whether you want to match upper and lower case letters exactly when searching (e.g. when selected, the search term 'New York' would find 'New York', but would not find 'NEW YORK', 'new york', or 'new York').
Displayed valuesThis list displays values that match the search criteria that you have specified, or values displayed by default when the dialog is first displayed. Use this list to choose values that you want to select. To choose values, move values from the Displayed values list to the Selected values list.
Note: You can select more than one value by pressing the Ctrl key and clicking another value.
Selected valuesUse this list to see which values are currently selected. To deselect values, move values from the Selected values list to the Displayed values list.
<Left arrow>Use this button to display the previous set of values.
<Right arrow>Use this button to display the next set of values.

Select Values dialog
Dialog reference 23-197
Notes■ To search for null values, enter NULL or "" in the Search for field.
Select Workbook from Database dialog
23-198 Oracle Business Intelligence Discoverer Plus User’s Guide
Select Workbook from Database dialog
Use this dialog to choose a workbook to schedule. For example, you might have created a workbook called Sales Report that you want to process weekly.
For more information, see:
"What are scheduled workbooks?"
"When to use scheduled workbooks"
ViewUse this drop down list to select the type of workbooks you want to display in the Workbooks list. For example, you might choose My Workbooks to display only workbooks that you have created.
<View style button>Use this drop down list to select a style for the Workbooks list. For example, you might choose the User Tree option to display workbooks grouped by database user. Or you might choose Workbook Tree to display workbooks in alphabetical order.
Name containsUse this field to restrict the Workbooks list to those workbooks with names that contain the character(s) that you specify. For example, enter 'January' to display in the Workbooks list only those workbooks with names that contain January.
ClearUse this button to clear any text in the Name contains field and display the names of all workbooks in the Workbooks list.
WorkbooksUse this list to select a workbook to schedule. To schedule a workbook, select the workbook and click Select or double-click on the workbook name.
Hint: Click on a column name to sort the Workbooks list on that column. Click on the arrow in a column name to reverse the sort order. You can also drag and drop columns to a different position in the Workbooks list.
DescriptionThis field displays additional information about the workbook, which was entered using the "Workbook Properties dialog". Use this information to help you decide which workbook you want to schedule. This area is blank if no description is available.
Hint: To add or edit the description, update the workbook properties (for more information, see "How to view and update a workbook’s properties").
SelectUse this button to schedule the workbook highlighted in the Workbooks list.
Share Workbooks dialog: User -> Workbook tab
Dialog reference 23-199
Share Workbooks dialog: User -> Workbook tab
Use this dialog to share multiple workbooks with a single database user (or role) in one operation. For example, you might have created a number of workbooks for analyzing sales and want to give a single Discoverer user access to all of the workbooks.
You can also use this dialog to see the workbooks that Discoverer users have access to.
Note: To give many Discoverer users access to a single workbook in one operation, use the "How to share the currently open workbook with other Discoverer users".
For more information, see:
"What are workbooks?"
"About sharing workbooks and security"
UserUse this drop down list to specify the database user or database role that you want to access the workbooks.
Note: Database users are represented by a person icon. Database roles are represented by a mask icon. For more information about selecting database users (and/or roles), see "About sharing workbooks".
Select User...Use this button to display the "Select User dialog", which enables you to search for and select a user or role.
WorkbooksThis area enables you to select workbooks to share.
■ Available
Use this list to specify the workbooks you want to give the selected user or role access to. To give the user access to a particular workbook, move the workbook from the Available list to the Shared list.
Note: You can select more than one workbook by pressing the Ctrl key and clicking another workbook.
■ Shared
Use this list to see the workbooks the selected user or role has access to. To revoke access to a particular workbook, move the workbook from the Shared list back to the Available list.
Note: Scheduled workbooks have a clock icon in front of the workbook name. If you share a scheduled workbook, you share all scheduled workbook results sets produced by that scheduled workbook. For more information, see "What are scheduled workbooks?".
DescriptionThis field displays additional information about the currently selected workbook, which was entered using the "Workbook Properties dialog". Use this information to help you decide which workbook you want to share. This area is blank if no description is available.
Share Workbooks dialog: User -> Workbook tab
23-200 Oracle Business Intelligence Discoverer Plus User’s Guide
Hint: To add or edit the description, update the workbook properties (for more information, see "How to view and update a workbook’s properties").
Notes■ In the User list, database users are represented by a person icon. Database roles are
represented by a mask icon. For more information about selecting database users (and/or roles), see "About sharing workbooks".
■ To give many Discoverer users access to a single workbook in one operation, use the "Share Workbooks dialog: Workbook -> User tab".
Share Workbooks dialog: Workbook -> User tab
Dialog reference 23-201
Share Workbooks dialog: Workbook -> User tab
Use this dialog to share a single workbook with multiple database users (and/or roles) in one operation. For example, you might have created a workbook for analyzing sales and want to publish the workbook to a group of Discoverer Viewer users.
You can also use this dialog to see the workbooks that Discoverer users have access to.
Note: To give a single Discoverer user access to many workbooks in one operation, use the "How to share multiple workbooks with a single Discoverer user".
This dialog is also displayed as:Share Workbook dialog
For more information, see:
"What are workbooks?"
"About sharing workbooks and security"
WorkbookThis field displays the name of the currently selected workbook (that you selected in the Manage Workbooks dialog). If you want to share a different workbook, click Cancel and select a different workbook in the Manage Workbooks dialog.
Note: Scheduled workbooks have a clock icon in front of the workbook name. If you share a scheduled workbook, you share all scheduled workbook results sets produced by that scheduled workbook. For more information, see "What are scheduled workbooks?".
UsersThis area enables you to select users with which to share the workbook.
■ Search
Use these fields to search for the database users (and/or roles) to whom you want to share workbooks, as follows:
■ Use the left hand drop down list to specify whether to search for database users or roles (or both).
■ Use the middle drop down list to specify the criteria you want to use to match database users (and/or roles). For example, you might want to search for database usernames beginning with a particular letter.
■ Use the right hand field to specify text in the name of a database user (or role) that you want to search for. If you leave this field empty and click Go, all database users (and/or roles) are displayed (depending on which value is selected in the left hand drop down list).
Note: Database users are represented by a person icon. Database roles are represented by a mask icon. For more information about selecting database users (and/or roles), see "About sharing workbooks".
■ Go
Use this button to display in the Available list the database users (and/or roles) that match your search criteria in groups of 100.
■ Available
Share Workbooks dialog: Workbook -> User tab
23-202 Oracle Business Intelligence Discoverer Plus User’s Guide
Use this list to specify the database users (and/or roles) you want to give access to the selected workbook. To give access, move names from the Available list to the Shared list.
Note: You can select more than one Discoverer user by pressing the Ctrl key and clicking another Discoverer user.
■ Shared
Use this list to see the users that have access to the selected workbook. To revoke access, move Discoverer user names from the Shared list back to the Available list.
■ Previous
Use this button to display the previous 100 database users (or roles).
■ Next
Use this button to display the next 100 database users (or roles).
DescriptionThis field displays additional information about the currently selected workbook, which was entered using the "Workbook Properties dialog". Use this information to help you decide which workbook you want to share. This area is blank if no description is available.
Hint: To add or edit the description, update the workbook properties (for more information, see "How to view and update a workbook’s properties").
Notes■ To give a single user or role access to many workbooks in one operation, use the
"Share Workbooks dialog: User -> Workbook tab".
Show Condition dialog
Dialog reference 23-203
Show Condition dialog
This dialog enables you to see in detail a condition defined by the Discoverer manager. When using conditions created by the Discoverer manager, you can look at them, but you cannot change them or remove them from the worksheet.
You can turn them on and off just like other conditions created by you or other Discoverer users.
For more information, see:
"What are conditions?"
What would you like to name your condition?This field displays the name of the condition.
What description would you like to give your condition?This field displays additional information about the condition entered when the item was created. It is blank if no additional information is available.
FormulaThis box shows the components of the condition:
■ Item
This read-only field shows the item on data is matched against. For example, to filter information about people who earn more than $30,000, this field might contain 'Salary'.
■ Condition
This read-only field shows the operators being used to match against the Item. For example, to filter information about people who earn more than $30,000, this field might contain '>' (the greater than operator).
■ Values
This read-only field shows the value used to use to match against the selected Item. For example, to filter information about people who earn more than $30,000, this field might contain 30,000.
■ Case sensitive
This read-only field shows whether the condition is case sensitive when matching against text data. For example, if turned on, the value 'New York' would not find details containing 'NEW YORK'. If turned off, the value 'New York' would find details containing 'NEW YORK' and 'new york'.
Note: If the condition is an advanced condition containing more than one line, the formula box will show the other lines and the logical operators joining the lines.
Sort Crosstab dialog
23-204 Oracle Business Intelligence Discoverer Plus User’s Guide
Sort Crosstab dialog
Use this tab to change the default sort order of items on the current crosstab worksheet. For example, you might want to order numerical sales data from highest to lowest to analyze at sales performance.
For more information, see:
"About sorting on crosstab worksheets"
"How to sort data on a crosstab worksheet"
"Examples of sorting"
Item to sortUse this list to select the item on which you want to sort. For example:
■ if you have Region on the left axis, you might select Region to sort profit data vertically
■ if you have Year on the top axis, you might select Year to sort profit data horizontally
Note: Group sorts automatically take precedence over non-group sorts.
Sort Details for <worksheet item>Use this table to specify sort details for the worksheet item selected in the Item to sort list.
Data PointUse this field to specify the data point on which you want to sort. For example, you might choose Profit SUM to order data by the amount of profit.
Row or ColumnUse this field to specify which row or column you want to sort, as follows:
■ if you specify an item on the left axis in the Data Point field, you specify which column you want to use to sort the worksheet
For example, you might have Region on the left axis and Year on the top axis. If you choose Region in the Data Point field, you choose which Year column you want to sort (e.g. 1998, 1999, 2000).
■ if you specify an item on the top axis in the Data Point field, you specify which row you want to use to sort the worksheet
For example, you might have Region on the left axis and Year on the top axis. If you choose Year in the Data Point field, you choose which Region row you want to sort (e.g. Central, East, West).
Note: This field is blank if the sort item is not a data point.
DirectionUse this drop down list to change how the data is ordered.
■ Low to High sorts A - Z alphabetically and 1 - 10 etc. numerically (language specific).
Sort Crosstab dialog
Dialog reference 23-205
■ Hi to Low sorts Z - A alphabetically and 10 - 1 etc. numerically (language specific).
Default sort on row/column headingsUse this drop down list to choose a default sort order.
AddUse this button to add a new sort to the Sort details for table. Use the Data Point, Row/Column, and Direction fields to specify sort details.
DeleteUse this button to remove the sort currently selected in the sort list from the Sort details for table.
Move upUse this button to change the order of precedence of the selected sort item. Moving a sort up the list increases its precedence.
Move downUse this button to change the order of precedence of the selected sort item. Moving a sort down the list decreases its precedence.
Notes■ You can also drag and drop items into a difference position in the sort list to
change the order of precedence.
Stoplight colors dialog
23-206 Oracle Business Intelligence Discoverer Plus User’s Guide
Stoplight colors dialog
Use this dialog to change the default colors that categorize worksheet values as unacceptable, acceptable, and desirable in the current worksheet. For example, you might want to change the color for the acceptable category from the default color (i.e. yellow) to blue. Discoverer applies colors that you specify to all existing and new stoplight formats in the current worksheet.
Note: If you are editing default Discoverer options (i.e. you chose Tools | Options and displayed the Formats tab) you use this dialog to specify the default stoplight colors for new stoplight formats that you create in any workbook.
For more information, see:
"What is conditional formatting?"
"Notes on using conditional formats and stoplight formats"
What colors should be used to identify Stoplight Data?Use these fields to specify the color of values in the unacceptable, acceptable, and desirable categories. Click a color button next to a category to display a color palette for that category and select a color.
Text area
Dialog reference 23-207
Text area
Use this area to edit the worksheet text area that can be displayed at the bottom of a worksheet.
For more information, see:
"What are worksheets?"
"How to create or edit worksheet titles or text"
"How to display or hide worksheet titles or text"
Hint: Double click on the worksheet text area to display the "Edit Text Area dialog", which enables you to create or edit the worksheet text. Alternatively, right-click and choose Text from the right-click menu.
Title area
23-208 Oracle Business Intelligence Discoverer Plus User’s Guide
Title area
Use this area to edit the worksheet title area that can be displayed at the top of a worksheet.
For more information, see:
"What are worksheets?"
"How to create or edit worksheet titles or text"
"How to display or hide worksheet titles or text"
Hint: Double click on the worksheet title area to display the "Edit Title dialog", which enables you to create or edit the worksheet title. Alternatively, right-click and choose Title from the right-click menu.
Total Format dialog (Default Options)
Dialog reference 23-209
Total Format dialog (Default Options)
Use this tab to change the default total style for new worksheet items.
Note: Changing the default total style does not change the total style for existing worksheet items. Choose Format | Item Formats to change the format of existing worksheet items.
For more information, see:
"About Discoverer worksheet types"
FontUse this drop down list to specify a text font.
SizeUse this drop down list to specify a font size.
StyleUse this drop down list to specify a font style (for example bold, italic, underlined, or sans-serif).
Color
TextUse this color pane to specify a color for the item text.
Actual font sizeUse this check box to display text in the example area in the font size and style selected.
Workbook Properties dialog
23-210 Oracle Business Intelligence Discoverer Plus User’s Guide
Workbook Properties dialog
Use this dialog to find out information about the current workbook. For example, to see when it was created or last revised, or who owns the workbook. You might also want to store additional information that will help other Discoverer users choose which workbook they want to use.
For more information, see:
"What are workbooks?"
"How to view and update a workbook’s properties"
NameThis read-only field displays the name of the current workbook prefixed with the name of the End User Layer.
OwnerThis read-only field displays the database login name of the workbook owner.
Date CreatedThis read-only field displays the date that the workbook was created.
Note: For scheduled workbooks, the time is the time on the Web server, which might be different from the time on the client browser machine.
Date ModifiedThis read-only field displays the date that the workbook was last updated.
Date ScheduledIf the current workbook is a scheduled workbook, this read-only field displays the date that the workbook was scheduled.
Note: For scheduled workbooks, the date is the time on the Web server, which might be different from the date on the client browser machine.
Date RunIf a scheduled workbook results set is currently selected, this read-only field displays the date that the workbook was processed.
IdentifierUse this field to change the unique name assigned to the workbook (known as an identifier).
Do not change identifiers except under the following circumstances:
■ The identifier must be changed to comply with strict naming conventions.
■ A workbook has been deleted and needs to be recreated with the same identifier as its original.
Note: Do not change the Identifier value unless specifically asked to do so by the Discoverer manager.
Workbook Properties dialog
Dialog reference 23-211
DescriptionUse this field to enter additional information about the workbook. This information is displayed on the Open Workbook dialog to help Discoverer users choose which workbook they want to open.
Notes■ The Identifier and Description fields are write-enabled if you display this dialog
by choosing File | Workbook Properties. The Identifier and Description fields are read-only if you display this dialog from the following dialogs:
■ "Manage Workbooks dialog"
■ "Open Workbook from Database dialog"
■ "Save Workbook to Database dialog"
Workbook Wizard: Create/Open Workbook dialog
23-212 Oracle Business Intelligence Discoverer Plus User’s Guide
Workbook Wizard: Create/Open Workbook dialog
Use this dialog to specify the type of workbook you want to open. When opening a workbook, you need to know whether it is a workbook stored in the Discoverer database, or whether it is a scheduled workbook stored in the Discoverer database.
If you are not sure about the type of workbook to open, contact the Discoverer manager.
For more information, see:
"What are workbooks?"
"What are worksheets?"
What do you want to do?■ Open an existing workbook
Use this radio button to open an existing workbook or scheduled workbook from the database. Use this option if you have saved a workbook previously in Discoverer, or if you have access to a workbook that another Discoverer user has saved.
■ Recently Used
Use this list to select a workbook to open from a list of previously opened workbooks (maximum of four).
■ Browse
Use this button to display the "Open Workbook from Database dialog", which enables you to select a workbook to open.
■ Create a new workbook
Use this fields to create a new workbook in which you can store worksheets containing Discoverer data. Use these fields to choose what type of worksheet to create in the new workbook. You cannot create an empty workbook (a workbook that contains no worksheets). Use the following fields to choose a worksheet style for the first worksheet in the workbook, and specify the worksheet objects you want to display.
■ Title
Use this check box to display a title area at the top of the worksheet (for more information, see "About worksheet titles and text").
■ Page Items
Use this check box to display data grouped by the items in the Page Axis area (for more information, see "What are axis items?").
■ Crosstab/Table
Use these radio buttons to select a worksheet style (for more information, see "About Discoverer worksheet types").
■ Graph
Use this check box to create a graph alongside the worksheet data.
■ Placement

Workbook Wizard: Create/Open Workbook dialog
Dialog reference 23-213
Use this drop down list to specify where to place the graph initially in relation to the worksheet data. You can always move the graph at any time when editing the worksheet.
■ Text Area
Use this check box to display a text area at the bottom of the worksheet (for more information, see "About worksheet titles and text").
Note: You can always change the worksheet style and objects to display at any time when working with the worksheet.
Worksheet Properties dialog: Aggregation tab
23-214 Oracle Business Intelligence Discoverer Plus User’s Guide
Worksheet Properties dialog: Aggregation tab
Use this tab to control how Discoverer populates cells for aggregated values (sometimes referred to as roll-up values) for the current worksheet.
For more information, see:
"What are aggregated values in Discoverer"
"What are linear and non-linear totals"
"Examples of worksheet aggregation in Discoverer"
If Discoverer cannot compute an aggregated cell value, how should the cell be populated?Use these options to specify how you want Discoverer to populate cells for aggregated values. If you clear the Use the aggregation behavior selected by the Discoverer manager check box, the radio button options beneath become active.
Use the aggregation behavior selected by the Discoverer managerUse this check box to control whether you specify how Discoverer calculates aggregated values, or whether you accept the default Discoverer behavior specified for you by the Discoverer manager, as follows:
■ Select this check box if you want the Discoverer manager to specify how Discoverer calculates aggregated values. The radio button options show which aggregation behavior the Discoverer manager has specified for you.
Note: This is the recommended option. To avoid getting non-meaningful results, do not clear this check box unless you are advised to do so by the Discoverer manager.
■ Clear this check box if you want to specify how Discoverer calculates aggregated values by selecting one of the radio button options. If you clear this check box, make sure that you get the worksheet results that you expect if you select a different aggregation option to the default aggregation option.
Aggregation optionsIf you clear the Use the aggregation behavior selected by the Discoverer manager check box, use these options to manually control how Discoverer populates cells for aggregated values.
■ Show the aggregated value computed by the database. The database uses the same aggregation method as Discoverer
Use this radio button if you want Discoverer to compute an aggregated value by adding up data points and applying the calculation to the result. For an example, see "Example 1: Example of a Rank calculation using an Oracle9i database".
■ Show values that cannot be aggregated as: <Non-aggregable label>
Use this radio button if you want Discoverer to display the non-aggregable label (e.g. N.A.) for certain specific non-linear calculations that cannot be aggregated.
The non-aggregable label is the display text that you specify on the "Worksheet Properties dialog: Sheet/Crosstab Format tab" (i.e. choose Edit | Worksheet Properties).
■ Show the sum of the values displayed in the contributing cells
Worksheet Properties dialog: Aggregation tab
Dialog reference 23-215
Use this radio button when you want Discoverer to compute an aggregated value by simply adding up a series of data points.
Notes
■ For an example of a Discoverer worksheet that includes repeated values, see "Example 2: Example showing how Discoverer does not aggregate repeated values using an Oracle9i database".
Notes on aggregation when sharing worksheets between Discoverer Desktop and Discoverer Plus Relational/Viewer usersThis section explains how Discoverer computes aggregated values if you share Discoverer worksheets with other Discoverer Desktop or Discoverer Plus Relational/Viewer users.
Note: If a potential fan trap situation exists, make sure that Discoverer users specify the same fan trap settings (for more information, see "Options dialog: Advanced tab").
About sharing a Discoverer worksheet between Discoverer Plus Relational usersTo make sure that a Discoverer worksheet contains the same aggregated values regardless of which Discoverer Plus Relational user opens it, do one or both of the following:
■ explicitly set the aggregation option on the Aggregation tab (i.e. clear the Use the aggregation behavior selected by the Discoverer manager check box and select one of the radio button options)
■ make sure that the Discoverer manager has specified the same default Aggregation option (i.e. the EnhancedAggregationStrategy preference) on all Discoverer middle-tier machines being used
About sharing a Discoverer worksheet between Discoverer Plus Relational and Discoverer Desktop usersIf you want to share a Discoverer worksheet between Discoverer Plus Relational and Discoverer Desktop, note the following:
■ if a worksheet created in Discoverer Plus Relational is opened in Discoverer Desktop, Discoverer Desktop displays the same aggregated values
■ if a worksheet created in Discoverer Plus Relational (and the Show the aggregated value computed by the database. The database uses the same aggregation method as Discoverer option is selected) is opened in Discoverer Desktop, Discoverer Desktop displays the non-aggregable label by default
■ if a worksheet created in Discoverer Desktop is opened in Discoverer Plus Relational, Discoverer Plus Relational uses the same aggregation behavior as specified in Discoverer Desktop
Worksheet Properties dialog: General tab
23-216 Oracle Business Intelligence Discoverer Plus User’s Guide
Worksheet Properties dialog: General tab
Use this tab to view and change the properties of the current worksheet. For example, you might want to change the worksheet name to give the worksheet a more user-friendly name.
For more information, see:
"What are worksheets?"
NameUse this field when you want to change the name of the current worksheet. The name entered here is displayed at the bottom of the worksheet. When you create without explicitly giving the worksheet a name, Discoverer creates a default name for you (e.g. Sheet1, Sheet2). Changing the default name to something more meaningful can make the worksheet more usable for other Discoverer users.
IdentifierThis read-only field displays the unique characters assigned to the worksheet (known as an identifier). You might need to know this value to confirm the identity of a worksheet.
DescriptionUse this field to enter additional information about the worksheet. This information is displayed in worksheet lists to help Discoverer users choose which worksheet they want to look at.
Worksheet Properties dialog: Sheet/Crosstab Format tab
Dialog reference 23-217
Worksheet Properties dialog: Sheet/Crosstab Format tab
Use this tab to specify how the current worksheet is displayed. Use this dialog to:
■ display or hide headings, gridlines and row numbers
■ define crosstab style and gridline color
■ define how to display null values
■ show drill links as icons
For more information, see:
"What are worksheets?"
Table headers (options displayed for tabular worksheets)
Show column headingsUse this check box to display or hide column headings on the current worksheet. You might want to hide column headings, for example if they are not required on a worksheet. Discoverer displays column headings by default.
Show row numbersUse this check box to display or hide row numbers on the current worksheet. You might want to show row numbers, for example to enable users to use the row numbers to locate a specific worksheet row. Discoverer displays row numbers by default.
Crosstab headers (options displayed for crosstab worksheets)
Show item labelsUse this check box to display or hide the crosstab item labels on the current worksheet (e.g. Region). If item labels have been defined, they are displayed on the crosstab vertical or side axis.
Show heading gridlinesUse this check box to display or hide crosstab heading gridlines on the current worksheet.
3D heading gridlinesUse this check box to display the crosstab heading gridlines in 3D style. This check box is only enabled when the Show heading gridlines check box is selected.
Crosstab styleUse this drop down list to select a value to configure the side (left) axis on a crosstab as follows:
■ Inline
Choose this option to display the first child row, on the same row as its parent. For example, on a worksheet that shows Years and Months, January (the first child row) appears on the same row as the year 2001 (the parent row).
■ Outline
Worksheet Properties dialog: Sheet/Crosstab Format tab
23-218 Oracle Business Intelligence Discoverer Plus User’s Guide
Choose this option to display the first child row on the row below its parent. For example, on a worksheet that shows Years and Months, January (the first child row) appears on the row below the year 2001 (the parent row).
Cell or data body gridlines
Show vertical gridlinesUse this check box to display or hide the vertical gridlines (in the data cells).
Show horizontal gridlinesUse this check box to display or hide the horizontal gridlines (in the data cells).
Gridline colorUse this button to change the color of the gridlines that are displayed in the data cells.
Content
Show null values asUse this drop down list to specify how Discoverer displays null (or empty) values. For example, if you typed the words No information available in this field, Discoverer will display this text when there is no data for a cell. Discoverer displays a blank cell by default.
Show drill links asUse this check box list to specify that Discoverer displays drill links as icons. Alternatively, you could clear this check box to specify that Discoverer displays drill links as hypertext links.
ExampleThis area shows you how the worksheet will look, with the options you have set.
Discoverer calculation examples A-1
ADiscoverer calculation examples
This appendix contains the following sections:
■ "How to find more information about Oracle analytic functions"
■ "About the examples in this chapter"
■ "How do I create calculations?"
■ "About using parameters to provide dynamic input to calculations"
■ "Simple calculation examples"
■ "Oracle analytic function examples"
■ "Examples of using row-based and time-based intervals"
How to find more information about Oracle analytic functionsFor more information about Oracle functions in general, refer to the following Oracle publications:
■ Oracle SQL Reference
■ Oracle Data Warehousing Guide
About the examples in this chapterThe examples in the following sections use the Video Stores Tutorial supplied with Discoverer. If you do not have the Video Stores Tutorial installed, contact the Discoverer manager.
Note: If that database version that you are using does not support IF or CASE statements, you can use DECODE instead. Alternatively, you can create a PL/SQL function in the database.
How do I create calculations?For more information about how to create calculations, see "How to create calculations".
About using parameters to provide dynamic input to calculationsYou often use parameters to provide dynamic input to calculations. This enables other values to be entered arbitrarily for more effective analysis. In other words, to provide a
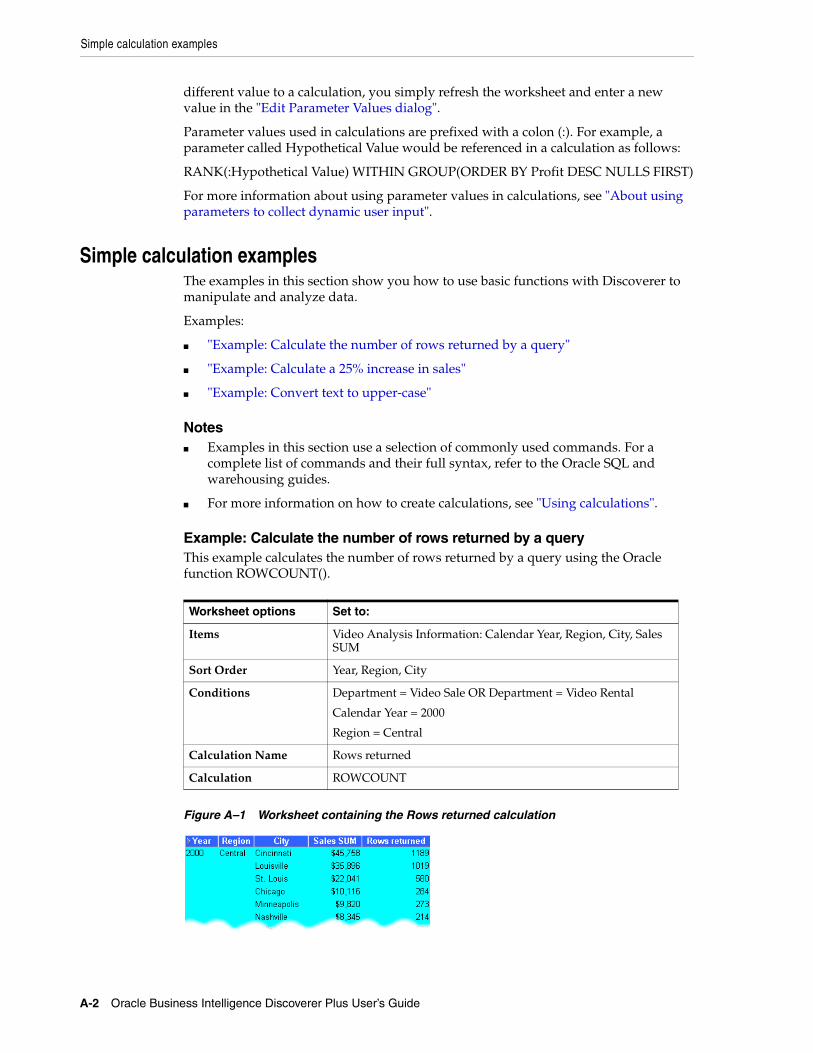
Simple calculation examples
A-2 Oracle Business Intelligence Discoverer Plus User’s Guide
different value to a calculation, you simply refresh the worksheet and enter a new value in the "Edit Parameter Values dialog".
Parameter values used in calculations are prefixed with a colon (:). For example, a parameter called Hypothetical Value would be referenced in a calculation as follows:
RANK(:Hypothetical Value) WITHIN GROUP(ORDER BY Profit DESC NULLS FIRST)
For more information about using parameter values in calculations, see "About using parameters to collect dynamic user input".
Simple calculation examplesThe examples in this section show you how to use basic functions with Discoverer to manipulate and analyze data.
Examples:
■ "Example: Calculate the number of rows returned by a query"
■ "Example: Calculate a 25% increase in sales"
■ "Example: Convert text to upper-case"
Notes■ Examples in this section use a selection of commonly used commands. For a
complete list of commands and their full syntax, refer to the Oracle SQL and warehousing guides.
■ For more information on how to create calculations, see "Using calculations".
Example: Calculate the number of rows returned by a queryThis example calculates the number of rows returned by a query using the Oracle function ROWCOUNT().
Figure A–1 Worksheet containing the Rows returned calculation
Worksheet options Set to:
Items Video Analysis Information: Calendar Year, Region, City, Sales SUM
Sort Order Year, Region, City
Conditions Department = Video Sale OR Department = Video Rental
Calendar Year = 2000
Region = Central
Calculation Name Rows returned
Calculation ROWCOUNT
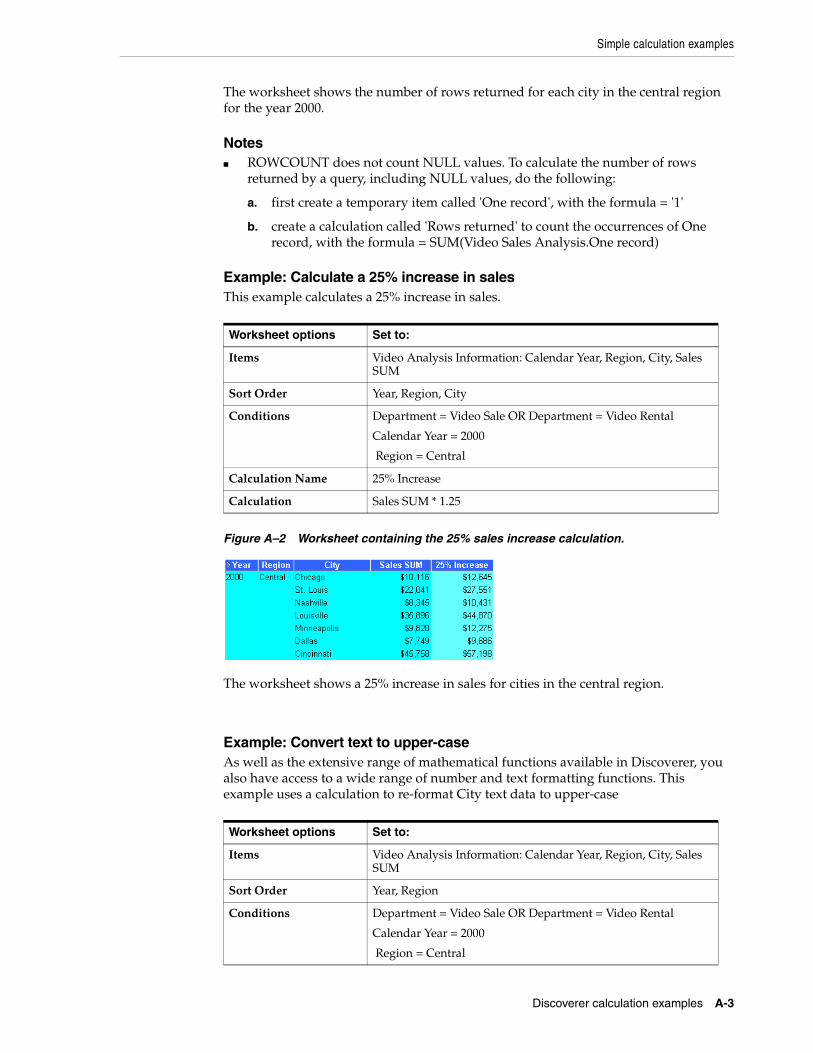
Simple calculation examples
Discoverer calculation examples A-3
The worksheet shows the number of rows returned for each city in the central region for the year 2000.
Notes■ ROWCOUNT does not count NULL values. To calculate the number of rows
returned by a query, including NULL values, do the following:
a. first create a temporary item called 'One record', with the formula = '1'
b. create a calculation called 'Rows returned' to count the occurrences of One record, with the formula = SUM(Video Sales Analysis.One record)
Example: Calculate a 25% increase in salesThis example calculates a 25% increase in sales.
Figure A–2 Worksheet containing the 25% sales increase calculation.
The worksheet shows a 25% increase in sales for cities in the central region.
Example: Convert text to upper-caseAs well as the extensive range of mathematical functions available in Discoverer, you also have access to a wide range of number and text formatting functions. This example uses a calculation to re-format City text data to upper-case
Worksheet options Set to:
Items Video Analysis Information: Calendar Year, Region, City, Sales SUM
Sort Order Year, Region, City
Conditions Department = Video Sale OR Department = Video Rental
Calendar Year = 2000
Region = Central
Calculation Name 25% Increase
Calculation Sales SUM * 1.25
Worksheet options Set to:
Items Video Analysis Information: Calendar Year, Region, City, Sales SUM
Sort Order Year, Region
Conditions Department = Video Sale OR Department = Video Rental
Calendar Year = 2000
Region = Central
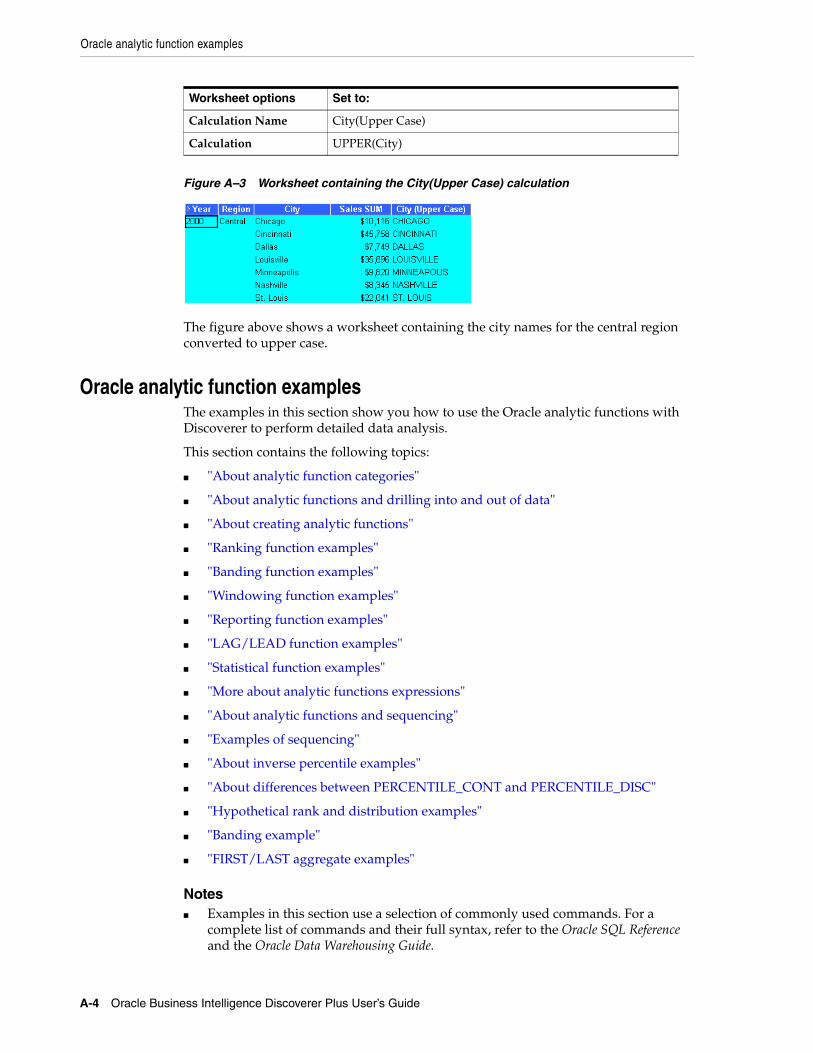
Oracle analytic function examples
A-4 Oracle Business Intelligence Discoverer Plus User’s Guide
Figure A–3 Worksheet containing the City(Upper Case) calculation
The figure above shows a worksheet containing the city names for the central region converted to upper case.
Oracle analytic function examplesThe examples in this section show you how to use the Oracle analytic functions with Discoverer to perform detailed data analysis.
This section contains the following topics:
■ "About analytic function categories"
■ "About analytic functions and drilling into and out of data"
■ "About creating analytic functions"
■ "Ranking function examples"
■ "Banding function examples"
■ "Windowing function examples"
■ "Reporting function examples"
■ "LAG/LEAD function examples"
■ "Statistical function examples"
■ "More about analytic functions expressions"
■ "About analytic functions and sequencing"
■ "Examples of sequencing"
■ "About inverse percentile examples"
■ "About differences between PERCENTILE_CONT and PERCENTILE_DISC"
■ "Hypothetical rank and distribution examples"
■ "Banding example"
■ "FIRST/LAST aggregate examples"
Notes■ Examples in this section use a selection of commonly used commands. For a
complete list of commands and their full syntax, refer to the Oracle SQL Reference and the Oracle Data Warehousing Guide.
Calculation Name City(Upper Case)
Calculation UPPER(City)
Worksheet options Set to:
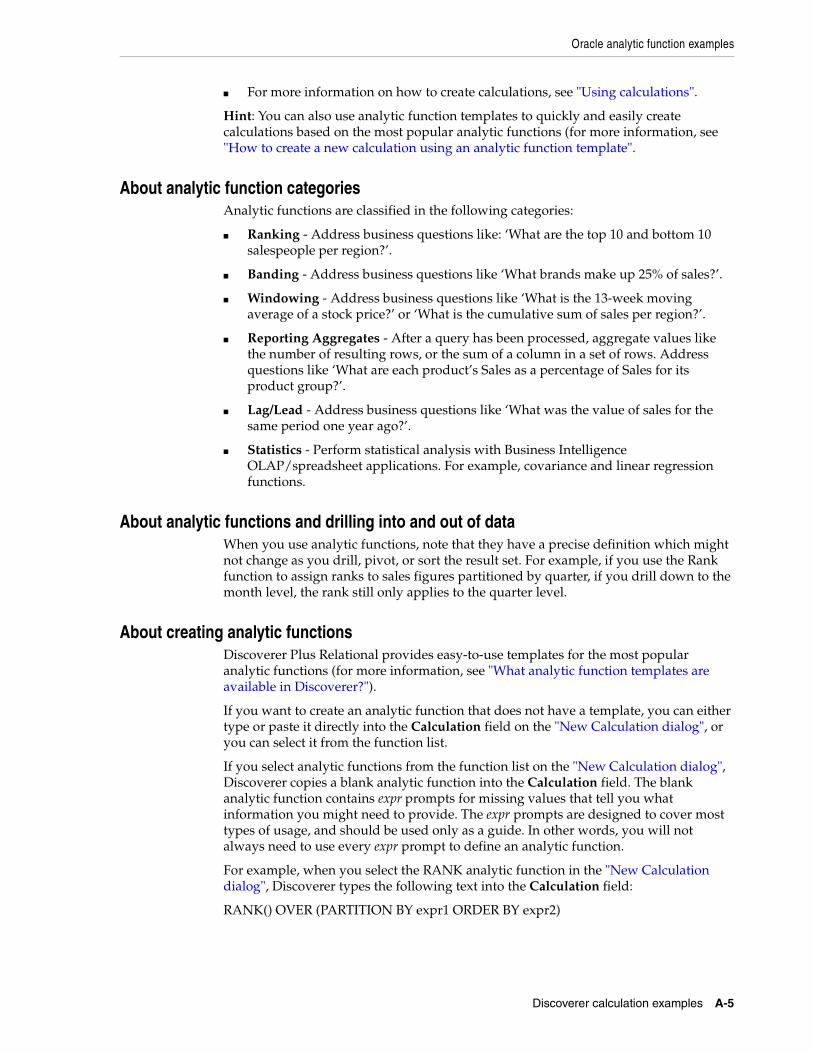
Oracle analytic function examples
Discoverer calculation examples A-5
■ For more information on how to create calculations, see "Using calculations".
Hint: You can also use analytic function templates to quickly and easily create calculations based on the most popular analytic functions (for more information, see "How to create a new calculation using an analytic function template".
About analytic function categoriesAnalytic functions are classified in the following categories:
■ Ranking - Address business questions like: ‘What are the top 10 and bottom 10 salespeople per region?’.
■ Banding - Address business questions like ‘What brands make up 25% of sales?’.
■ Windowing - Address business questions like ‘What is the 13-week moving average of a stock price?’ or ‘What is the cumulative sum of sales per region?’.
■ Reporting Aggregates - After a query has been processed, aggregate values like the number of resulting rows, or the sum of a column in a set of rows. Address questions like ‘What are each product’s Sales as a percentage of Sales for its product group?’.
■ Lag/Lead - Address business questions like ‘What was the value of sales for the same period one year ago?’.
■ Statistics - Perform statistical analysis with Business Intelligence OLAP/spreadsheet applications. For example, covariance and linear regression functions.
About analytic functions and drilling into and out of dataWhen you use analytic functions, note that they have a precise definition which might not change as you drill, pivot, or sort the result set. For example, if you use the Rank function to assign ranks to sales figures partitioned by quarter, if you drill down to the month level, the rank still only applies to the quarter level.
About creating analytic functionsDiscoverer Plus Relational provides easy-to-use templates for the most popular analytic functions (for more information, see "What analytic function templates are available in Discoverer?").
If you want to create an analytic function that does not have a template, you can either type or paste it directly into the Calculation field on the "New Calculation dialog", or you can select it from the function list.
If you select analytic functions from the function list on the "New Calculation dialog", Discoverer copies a blank analytic function into the Calculation field. The blank analytic function contains expr prompts for missing values that tell you what information you might need to provide. The expr prompts are designed to cover most types of usage, and should be used only as a guide. In other words, you will not always need to use every expr prompt to define an analytic function.
For example, when you select the RANK analytic function in the "New Calculation dialog", Discoverer types the following text into the Calculation field:
RANK() OVER (PARTITION BY expr1 ORDER BY expr2)
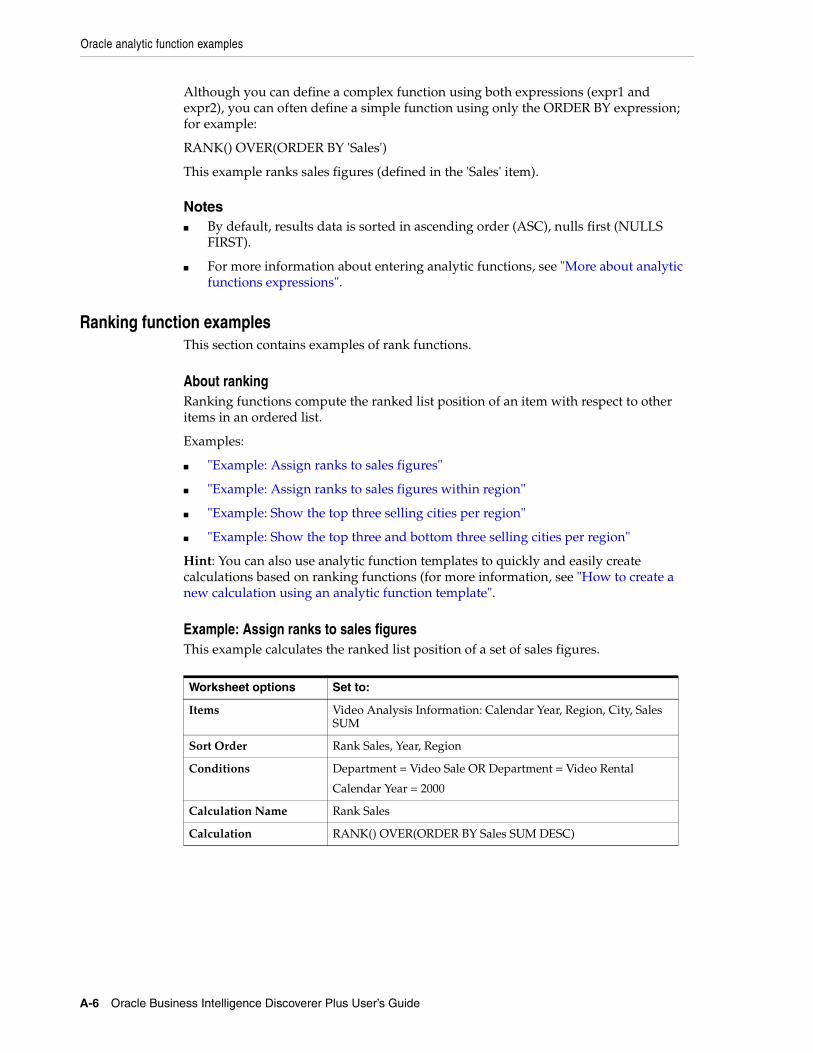
Oracle analytic function examples
A-6 Oracle Business Intelligence Discoverer Plus User’s Guide
Although you can define a complex function using both expressions (expr1 and expr2), you can often define a simple function using only the ORDER BY expression; for example:
RANK() OVER(ORDER BY 'Sales')
This example ranks sales figures (defined in the 'Sales' item).
Notes■ By default, results data is sorted in ascending order (ASC), nulls first (NULLS
FIRST).
■ For more information about entering analytic functions, see "More about analytic functions expressions".
Ranking function examplesThis section contains examples of rank functions.
About rankingRanking functions compute the ranked list position of an item with respect to other items in an ordered list.
Examples:
■ "Example: Assign ranks to sales figures"
■ "Example: Assign ranks to sales figures within region"
■ "Example: Show the top three selling cities per region"
■ "Example: Show the top three and bottom three selling cities per region"
Hint: You can also use analytic function templates to quickly and easily create calculations based on ranking functions (for more information, see "How to create a new calculation using an analytic function template".
Example: Assign ranks to sales figuresThis example calculates the ranked list position of a set of sales figures.
Worksheet options Set to:
Items Video Analysis Information: Calendar Year, Region, City, Sales SUM
Sort Order Rank Sales, Year, Region
Conditions Department = Video Sale OR Department = Video Rental
Calendar Year = 2000
Calculation Name Rank Sales
Calculation RANK() OVER(ORDER BY Sales SUM DESC)
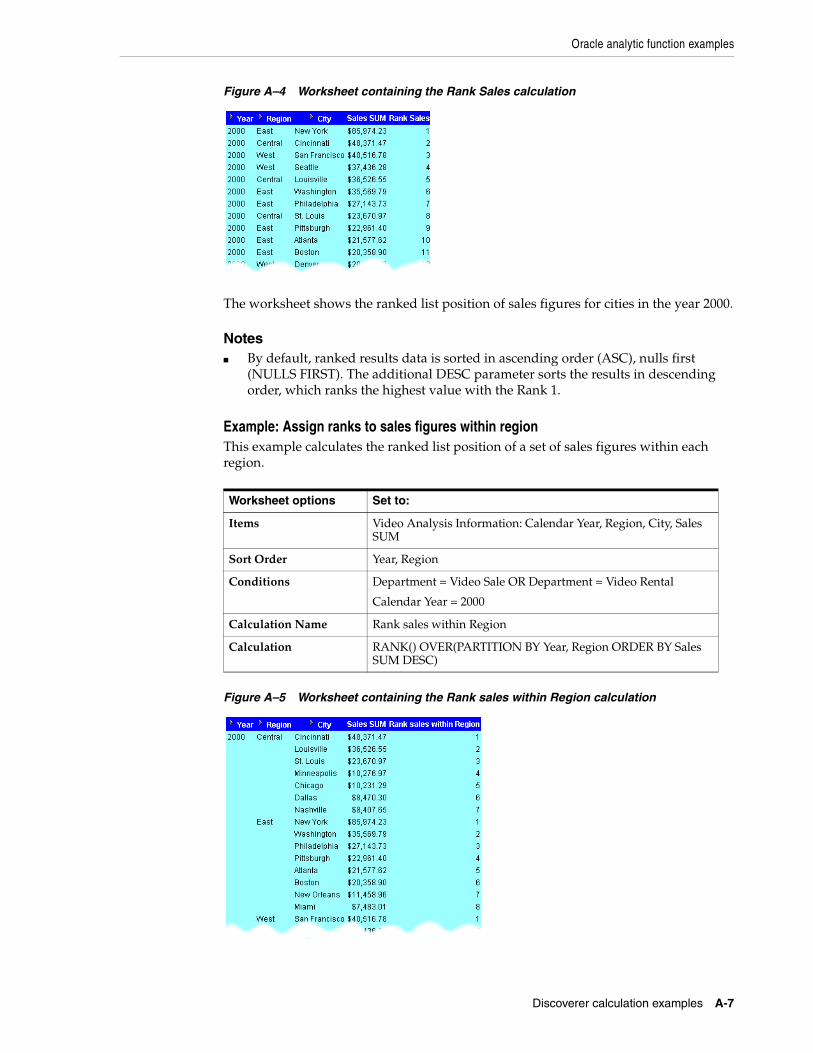
Oracle analytic function examples
Discoverer calculation examples A-7
Figure A–4 Worksheet containing the Rank Sales calculation
The worksheet shows the ranked list position of sales figures for cities in the year 2000.
Notes■ By default, ranked results data is sorted in ascending order (ASC), nulls first
(NULLS FIRST). The additional DESC parameter sorts the results in descending order, which ranks the highest value with the Rank 1.
Example: Assign ranks to sales figures within regionThis example calculates the ranked list position of a set of sales figures within each region.
Figure A–5 Worksheet containing the Rank sales within Region calculation
Worksheet options Set to:
Items Video Analysis Information: Calendar Year, Region, City, Sales SUM
Sort Order Year, Region
Conditions Department = Video Sale OR Department = Video Rental
Calendar Year = 2000
Calculation Name Rank sales within Region
Calculation RANK() OVER(PARTITION BY Year, Region ORDER BY Sales SUM DESC)
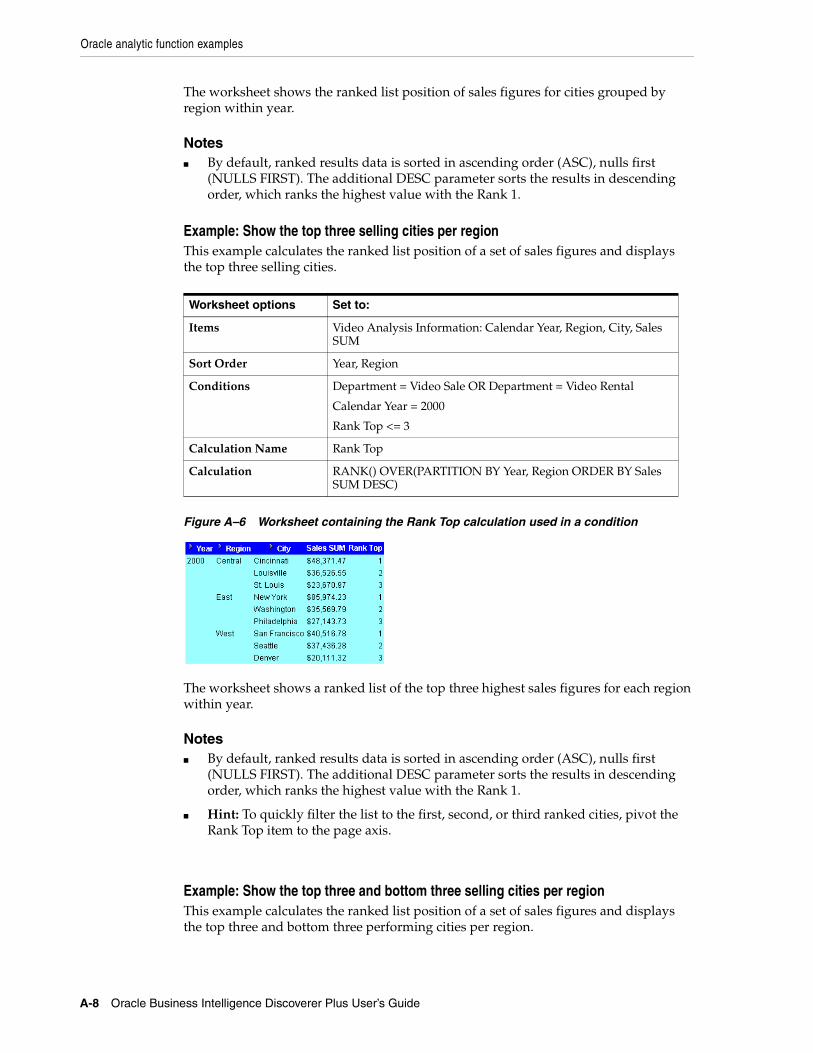
Oracle analytic function examples
A-8 Oracle Business Intelligence Discoverer Plus User’s Guide
The worksheet shows the ranked list position of sales figures for cities grouped by region within year.
Notes■ By default, ranked results data is sorted in ascending order (ASC), nulls first
(NULLS FIRST). The additional DESC parameter sorts the results in descending order, which ranks the highest value with the Rank 1.
Example: Show the top three selling cities per regionThis example calculates the ranked list position of a set of sales figures and displays the top three selling cities.
Figure A–6 Worksheet containing the Rank Top calculation used in a condition
The worksheet shows a ranked list of the top three highest sales figures for each region within year.
Notes■ By default, ranked results data is sorted in ascending order (ASC), nulls first
(NULLS FIRST). The additional DESC parameter sorts the results in descending order, which ranks the highest value with the Rank 1.
■ Hint: To quickly filter the list to the first, second, or third ranked cities, pivot the Rank Top item to the page axis.
Example: Show the top three and bottom three selling cities per regionThis example calculates the ranked list position of a set of sales figures and displays the top three and bottom three performing cities per region.
Worksheet options Set to:
Items Video Analysis Information: Calendar Year, Region, City, Sales SUM
Sort Order Year, Region
Conditions Department = Video Sale OR Department = Video Rental
Calendar Year = 2000
Rank Top <= 3
Calculation Name Rank Top
Calculation RANK() OVER(PARTITION BY Year, Region ORDER BY Sales SUM DESC)
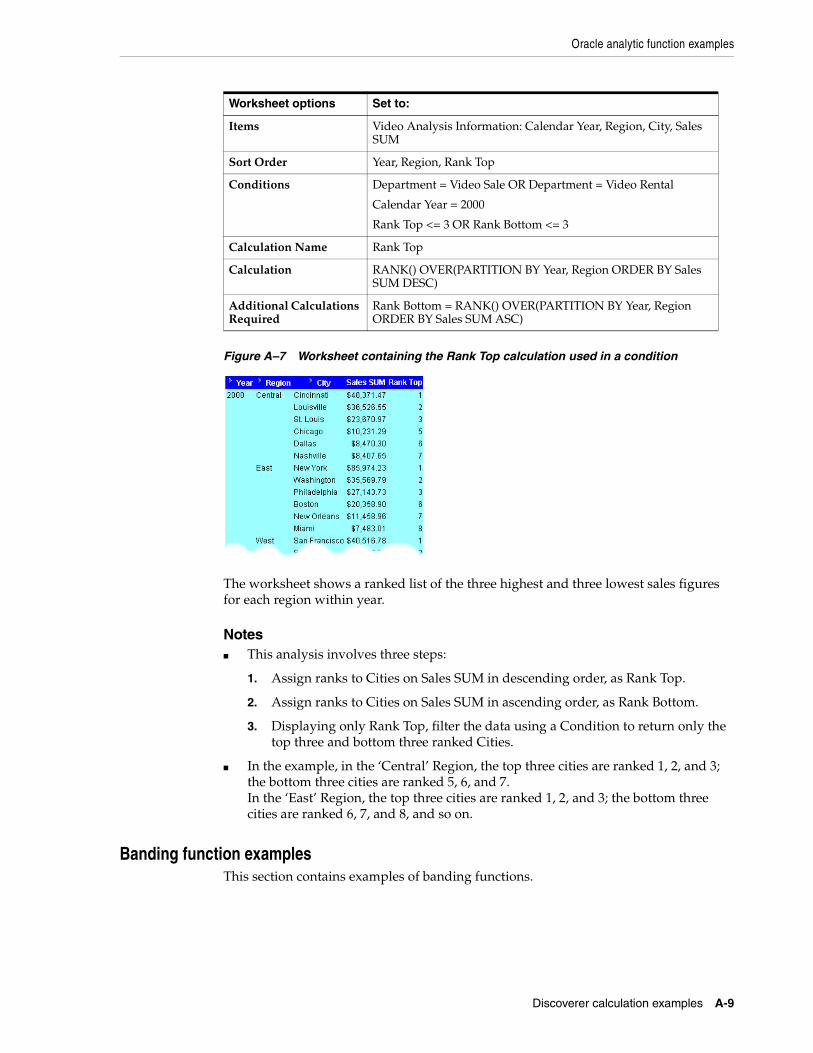
Oracle analytic function examples
Discoverer calculation examples A-9
Figure A–7 Worksheet containing the Rank Top calculation used in a condition
The worksheet shows a ranked list of the three highest and three lowest sales figures for each region within year.
Notes■ This analysis involves three steps:
1. Assign ranks to Cities on Sales SUM in descending order, as Rank Top.
2. Assign ranks to Cities on Sales SUM in ascending order, as Rank Bottom.
3. Displaying only Rank Top, filter the data using a Condition to return only the top three and bottom three ranked Cities.
■ In the example, in the ‘Central’ Region, the top three cities are ranked 1, 2, and 3; the bottom three cities are ranked 5, 6, and 7.In the ‘East’ Region, the top three cities are ranked 1, 2, and 3; the bottom three cities are ranked 6, 7, and 8, and so on.
Banding function examplesThis section contains examples of banding functions.
Worksheet options Set to:
Items Video Analysis Information: Calendar Year, Region, City, Sales SUM
Sort Order Year, Region, Rank Top
Conditions Department = Video Sale OR Department = Video Rental
Calendar Year = 2000
Rank Top <= 3 OR Rank Bottom <= 3
Calculation Name Rank Top
Calculation RANK() OVER(PARTITION BY Year, Region ORDER BY Sales SUM DESC)
Additional Calculations Required
Rank Bottom = RANK() OVER(PARTITION BY Year, Region ORDER BY Sales SUM ASC)
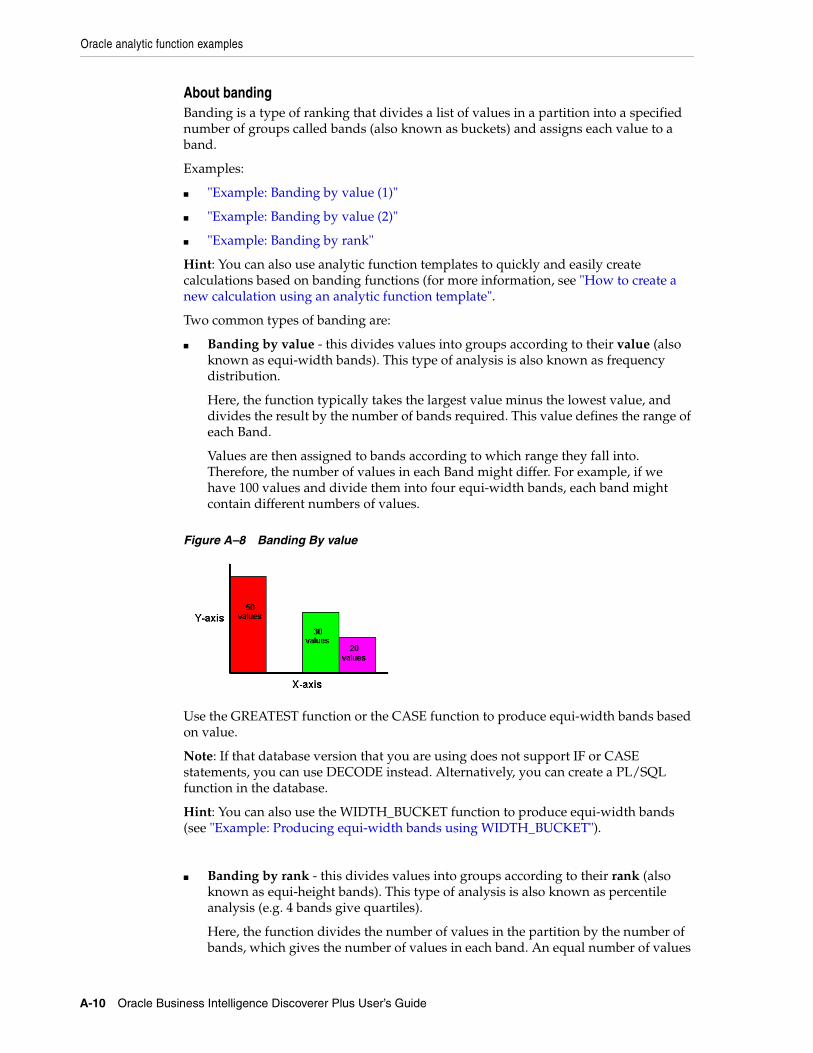
Oracle analytic function examples
A-10 Oracle Business Intelligence Discoverer Plus User’s Guide
About bandingBanding is a type of ranking that divides a list of values in a partition into a specified number of groups called bands (also known as buckets) and assigns each value to a band.
Examples:
■ "Example: Banding by value (1)"
■ "Example: Banding by value (2)"
■ "Example: Banding by rank"
Hint: You can also use analytic function templates to quickly and easily create calculations based on banding functions (for more information, see "How to create a new calculation using an analytic function template".
Two common types of banding are:
■ Banding by value - this divides values into groups according to their value (also known as equi-width bands). This type of analysis is also known as frequency distribution.
Here, the function typically takes the largest value minus the lowest value, and divides the result by the number of bands required. This value defines the range of each Band.
Values are then assigned to bands according to which range they fall into. Therefore, the number of values in each Band might differ. For example, if we have 100 values and divide them into four equi-width bands, each band might contain different numbers of values.
Figure A–8 Banding By value
Use the GREATEST function or the CASE function to produce equi-width bands based on value.
Note: If that database version that you are using does not support IF or CASE statements, you can use DECODE instead. Alternatively, you can create a PL/SQL function in the database.
Hint: You can also use the WIDTH_BUCKET function to produce equi-width bands (see "Example: Producing equi-width bands using WIDTH_BUCKET").
■ Banding by rank - this divides values into groups according to their rank (also known as equi-height bands). This type of analysis is also known as percentile analysis (e.g. 4 bands give quartiles).
Here, the function divides the number of values in the partition by the number of bands, which gives the number of values in each band. An equal number of values
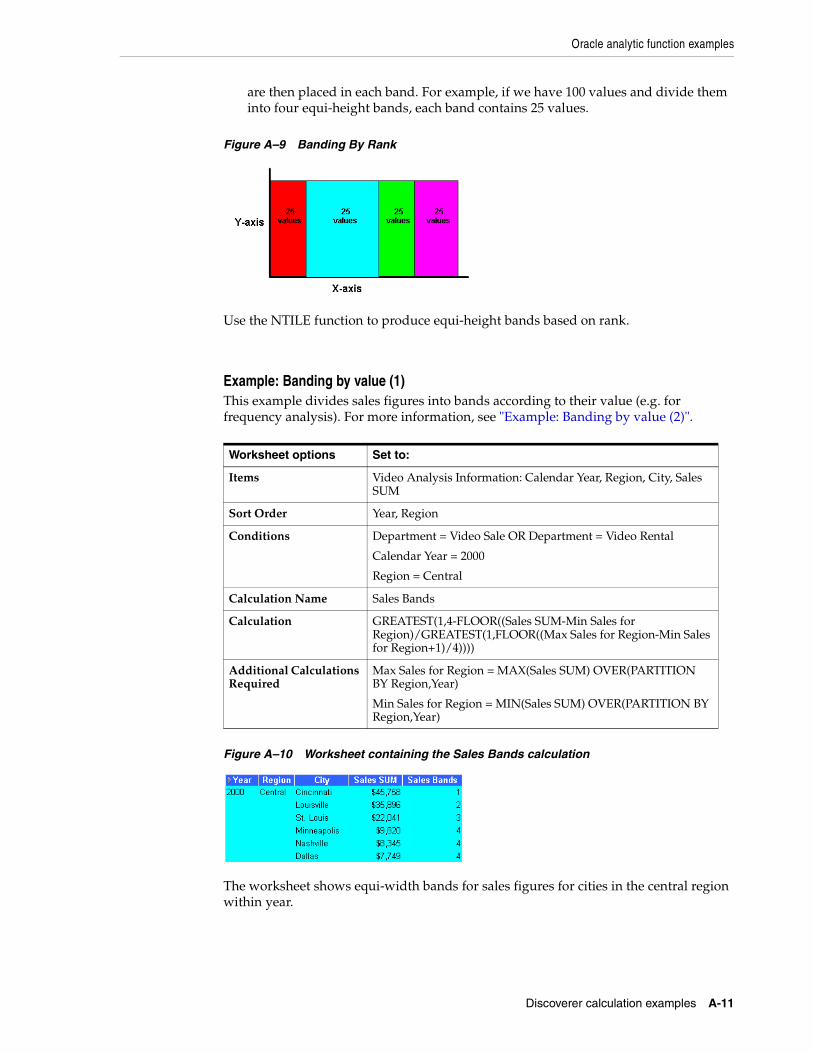
Oracle analytic function examples
Discoverer calculation examples A-11
are then placed in each band. For example, if we have 100 values and divide them into four equi-height bands, each band contains 25 values.
Figure A–9 Banding By Rank
Use the NTILE function to produce equi-height bands based on rank.
Example: Banding by value (1)This example divides sales figures into bands according to their value (e.g. for frequency analysis). For more information, see "Example: Banding by value (2)".
Figure A–10 Worksheet containing the Sales Bands calculation
The worksheet shows equi-width bands for sales figures for cities in the central region within year.
Worksheet options Set to:
Items Video Analysis Information: Calendar Year, Region, City, Sales SUM
Sort Order Year, Region
Conditions Department = Video Sale OR Department = Video Rental
Calendar Year = 2000
Region = Central
Calculation Name Sales Bands
Calculation GREATEST(1,4-FLOOR((Sales SUM-Min Sales for Region)/GREATEST(1,FLOOR((Max Sales for Region-Min Sales for Region+1)/4))))
Additional Calculations Required
Max Sales for Region = MAX(Sales SUM) OVER(PARTITION BY Region,Year)
Min Sales for Region = MIN(Sales SUM) OVER(PARTITION BY Region,Year)
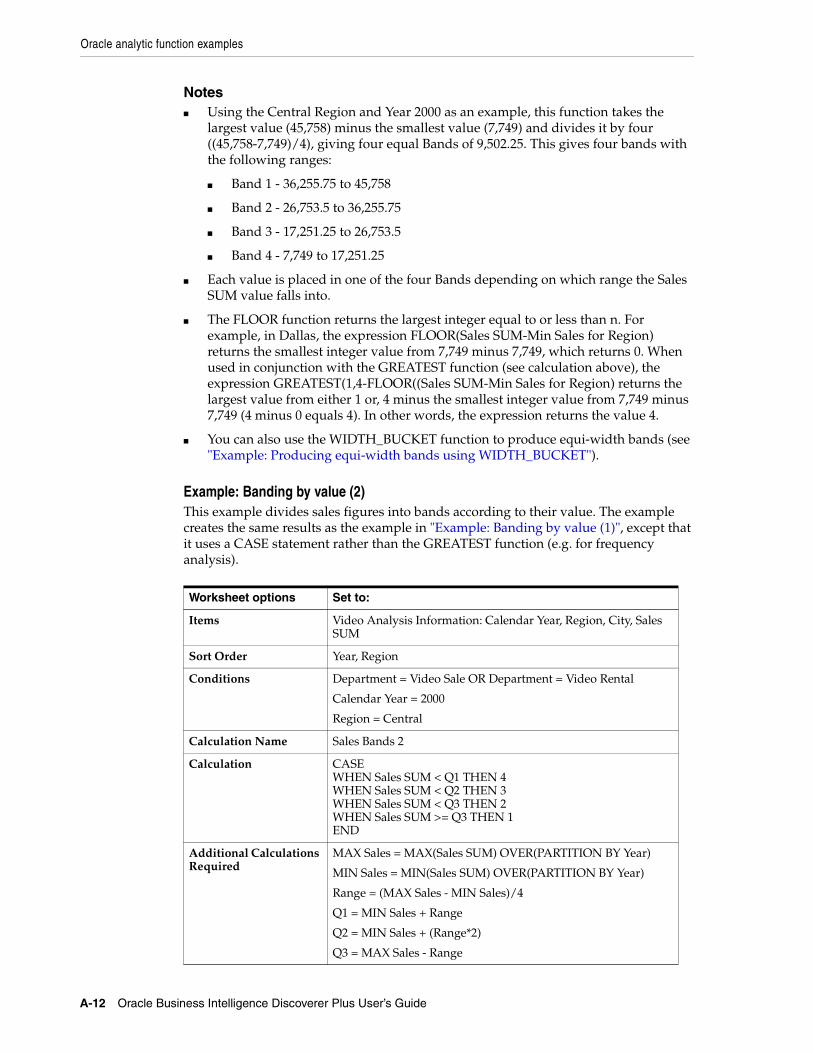
Oracle analytic function examples
A-12 Oracle Business Intelligence Discoverer Plus User’s Guide
Notes■ Using the Central Region and Year 2000 as an example, this function takes the
largest value (45,758) minus the smallest value (7,749) and divides it by four ((45,758-7,749)/4), giving four equal Bands of 9,502.25. This gives four bands with the following ranges:
■ Band 1 - 36,255.75 to 45,758
■ Band 2 - 26,753.5 to 36,255.75
■ Band 3 - 17,251.25 to 26,753.5
■ Band 4 - 7,749 to 17,251.25
■ Each value is placed in one of the four Bands depending on which range the Sales SUM value falls into.
■ The FLOOR function returns the largest integer equal to or less than n. For example, in Dallas, the expression FLOOR(Sales SUM-Min Sales for Region) returns the smallest integer value from 7,749 minus 7,749, which returns 0. When used in conjunction with the GREATEST function (see calculation above), the expression GREATEST(1,4-FLOOR((Sales SUM-Min Sales for Region) returns the largest value from either 1 or, 4 minus the smallest integer value from 7,749 minus 7,749 (4 minus 0 equals 4). In other words, the expression returns the value 4.
■ You can also use the WIDTH_BUCKET function to produce equi-width bands (see "Example: Producing equi-width bands using WIDTH_BUCKET").
Example: Banding by value (2)This example divides sales figures into bands according to their value. The example creates the same results as the example in "Example: Banding by value (1)", except that it uses a CASE statement rather than the GREATEST function (e.g. for frequency analysis).
Worksheet options Set to:
Items Video Analysis Information: Calendar Year, Region, City, Sales SUM
Sort Order Year, Region
Conditions Department = Video Sale OR Department = Video Rental
Calendar Year = 2000
Region = Central
Calculation Name Sales Bands 2
Calculation CASE WHEN Sales SUM < Q1 THEN 4 WHEN Sales SUM < Q2 THEN 3 WHEN Sales SUM < Q3 THEN 2 WHEN Sales SUM >= Q3 THEN 1 END
Additional Calculations Required
MAX Sales = MAX(Sales SUM) OVER(PARTITION BY Year)
MIN Sales = MIN(Sales SUM) OVER(PARTITION BY Year)
Range = (MAX Sales - MIN Sales)/4
Q1 = MIN Sales + Range
Q2 = MIN Sales + (Range*2)
Q3 = MAX Sales - Range
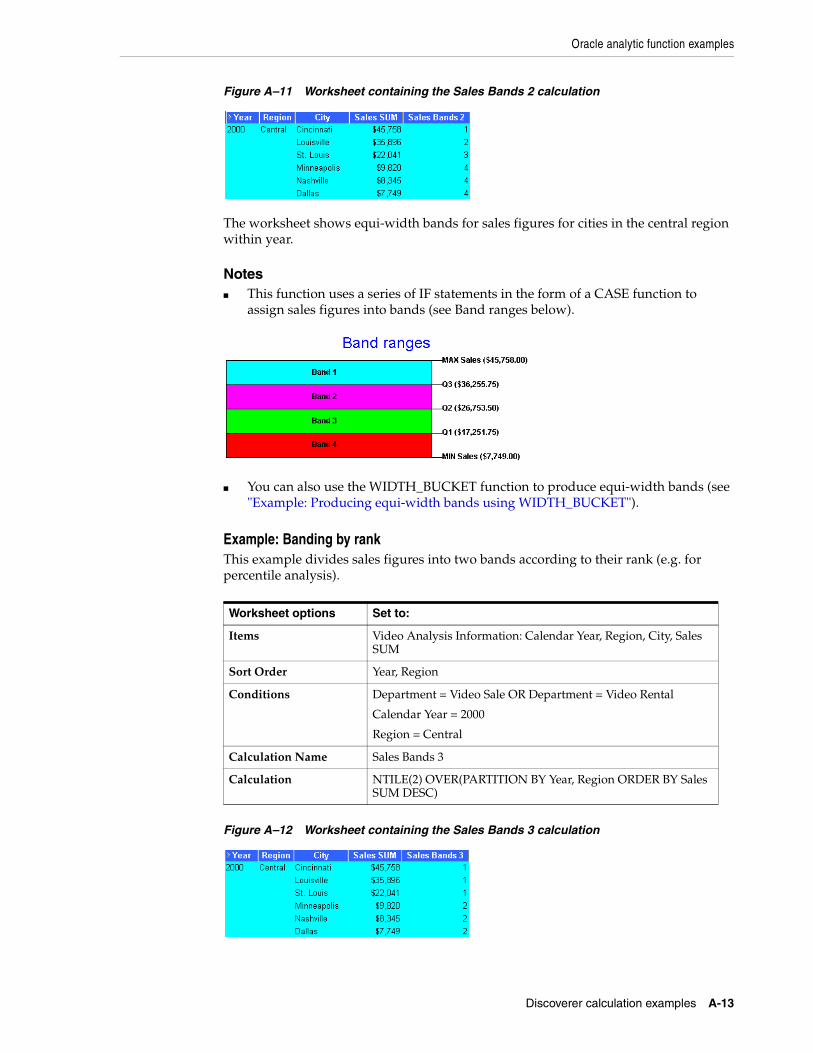
Oracle analytic function examples
Discoverer calculation examples A-13
Figure A–11 Worksheet containing the Sales Bands 2 calculation
The worksheet shows equi-width bands for sales figures for cities in the central region within year.
Notes■ This function uses a series of IF statements in the form of a CASE function to
assign sales figures into bands (see Band ranges below).
■ You can also use the WIDTH_BUCKET function to produce equi-width bands (see "Example: Producing equi-width bands using WIDTH_BUCKET").
Example: Banding by rankThis example divides sales figures into two bands according to their rank (e.g. for percentile analysis).
Figure A–12 Worksheet containing the Sales Bands 3 calculation
Worksheet options Set to:
Items Video Analysis Information: Calendar Year, Region, City, Sales SUM
Sort Order Year, Region
Conditions Department = Video Sale OR Department = Video Rental
Calendar Year = 2000
Region = Central
Calculation Name Sales Bands 3
Calculation NTILE(2) OVER(PARTITION BY Year, Region ORDER BY Sales SUM DESC)
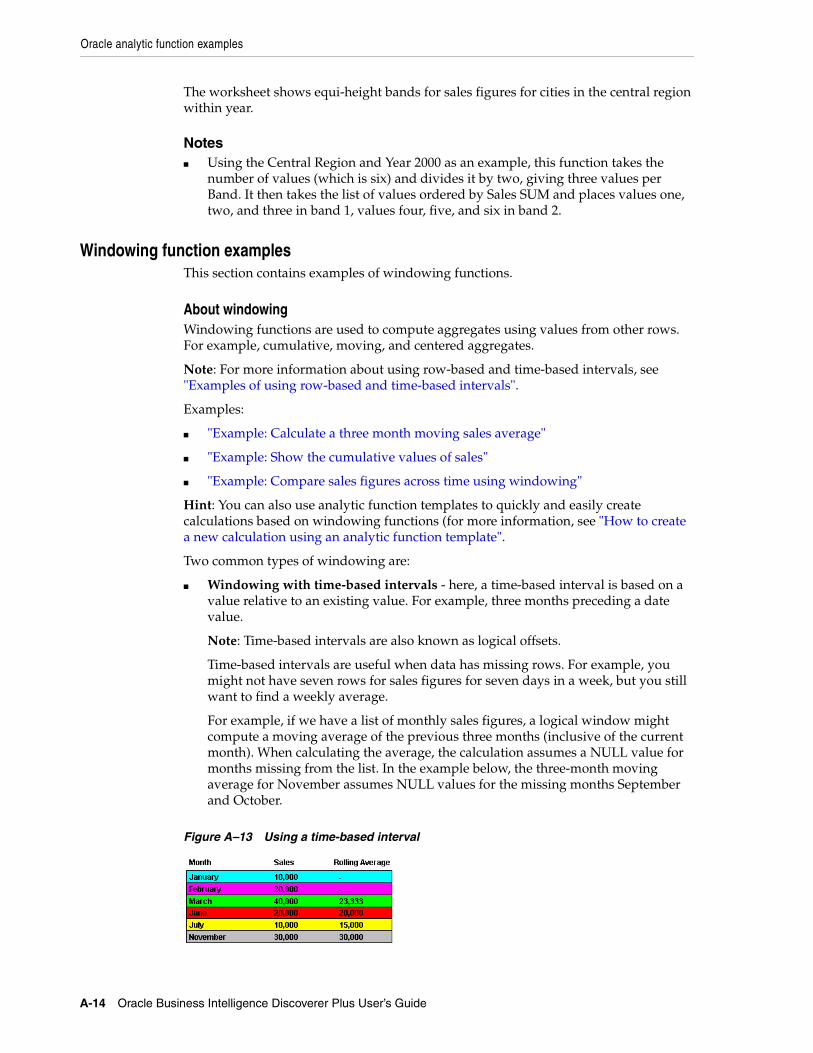
Oracle analytic function examples
A-14 Oracle Business Intelligence Discoverer Plus User’s Guide
The worksheet shows equi-height bands for sales figures for cities in the central region within year.
Notes■ Using the Central Region and Year 2000 as an example, this function takes the
number of values (which is six) and divides it by two, giving three values per Band. It then takes the list of values ordered by Sales SUM and places values one, two, and three in band 1, values four, five, and six in band 2.
Windowing function examplesThis section contains examples of windowing functions.
About windowingWindowing functions are used to compute aggregates using values from other rows. For example, cumulative, moving, and centered aggregates.
Note: For more information about using row-based and time-based intervals, see "Examples of using row-based and time-based intervals".
Examples:
■ "Example: Calculate a three month moving sales average"
■ "Example: Show the cumulative values of sales"
■ "Example: Compare sales figures across time using windowing"
Hint: You can also use analytic function templates to quickly and easily create calculations based on windowing functions (for more information, see "How to create a new calculation using an analytic function template".
Two common types of windowing are:
■ Windowing with time-based intervals - here, a time-based interval is based on a value relative to an existing value. For example, three months preceding a date value.
Note: Time-based intervals are also known as logical offsets.
Time-based intervals are useful when data has missing rows. For example, you might not have seven rows for sales figures for seven days in a week, but you still want to find a weekly average.
For example, if we have a list of monthly sales figures, a logical window might compute a moving average of the previous three months (inclusive of the current month). When calculating the average, the calculation assumes a NULL value for months missing from the list. In the example below, the three-month moving average for November assumes NULL values for the missing months September and October.
Figure A–13 Using a time-based interval
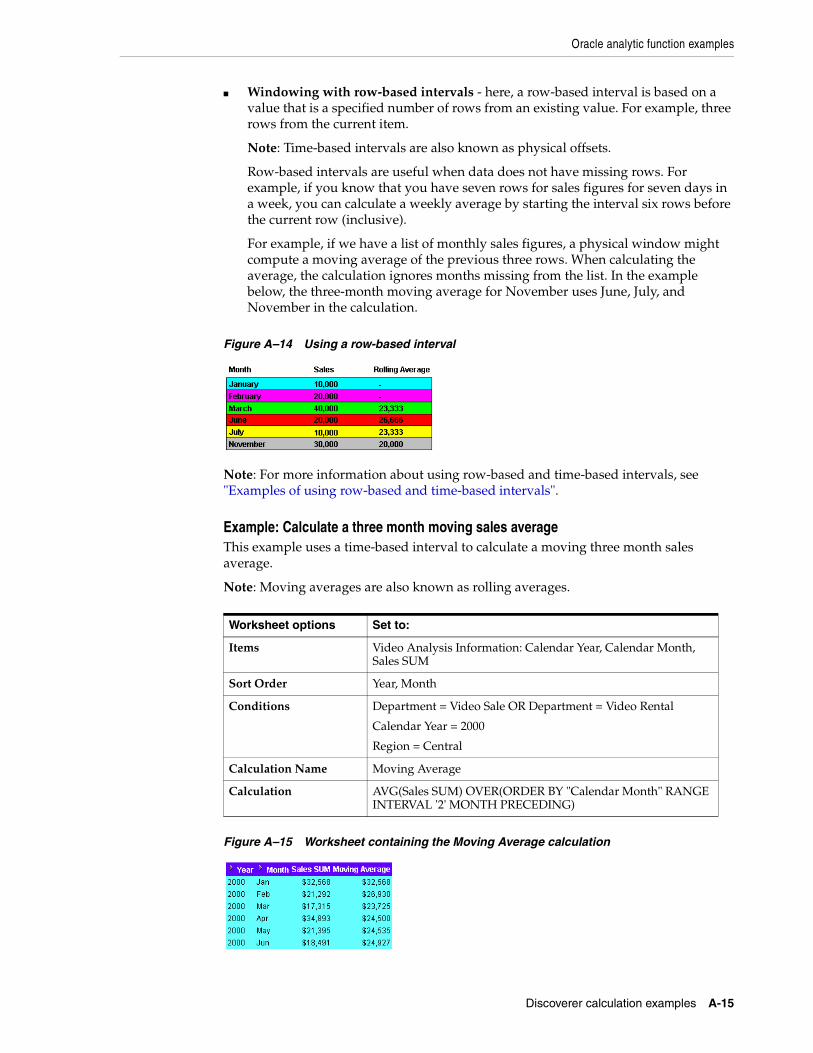
Oracle analytic function examples
Discoverer calculation examples A-15
■ Windowing with row-based intervals - here, a row-based interval is based on a value that is a specified number of rows from an existing value. For example, three rows from the current item.
Note: Time-based intervals are also known as physical offsets.
Row-based intervals are useful when data does not have missing rows. For example, if you know that you have seven rows for sales figures for seven days in a week, you can calculate a weekly average by starting the interval six rows before the current row (inclusive).
For example, if we have a list of monthly sales figures, a physical window might compute a moving average of the previous three rows. When calculating the average, the calculation ignores months missing from the list. In the example below, the three-month moving average for November uses June, July, and November in the calculation.
Figure A–14 Using a row-based interval
Note: For more information about using row-based and time-based intervals, see "Examples of using row-based and time-based intervals".
Example: Calculate a three month moving sales averageThis example uses a time-based interval to calculate a moving three month sales average.
Note: Moving averages are also known as rolling averages.
Figure A–15 Worksheet containing the Moving Average calculation
Worksheet options Set to:
Items Video Analysis Information: Calendar Year, Calendar Month, Sales SUM
Sort Order Year, Month
Conditions Department = Video Sale OR Department = Video Rental
Calendar Year = 2000
Region = Central
Calculation Name Moving Average
Calculation AVG(Sales SUM) OVER(ORDER BY "Calendar Month" RANGE INTERVAL '2' MONTH PRECEDING)
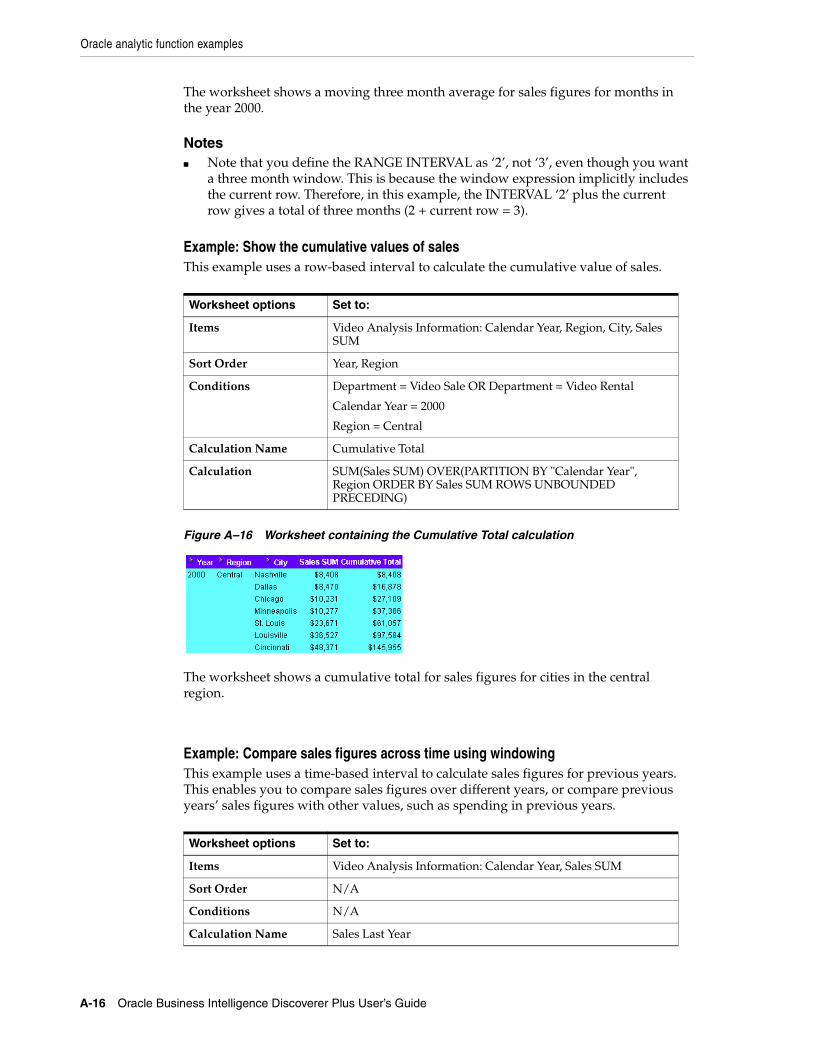
Oracle analytic function examples
A-16 Oracle Business Intelligence Discoverer Plus User’s Guide
The worksheet shows a moving three month average for sales figures for months in the year 2000.
Notes■ Note that you define the RANGE INTERVAL as ‘2’, not ‘3’, even though you want
a three month window. This is because the window expression implicitly includes the current row. Therefore, in this example, the INTERVAL ‘2’ plus the current row gives a total of three months (2 + current row = 3).
Example: Show the cumulative values of salesThis example uses a row-based interval to calculate the cumulative value of sales.
Figure A–16 Worksheet containing the Cumulative Total calculation
The worksheet shows a cumulative total for sales figures for cities in the central region.
Example: Compare sales figures across time using windowingThis example uses a time-based interval to calculate sales figures for previous years. This enables you to compare sales figures over different years, or compare previous years’ sales figures with other values, such as spending in previous years.
Worksheet options Set to:
Items Video Analysis Information: Calendar Year, Region, City, Sales SUM
Sort Order Year, Region
Conditions Department = Video Sale OR Department = Video Rental
Calendar Year = 2000
Region = Central
Calculation Name Cumulative Total
Calculation SUM(Sales SUM) OVER(PARTITION BY "Calendar Year", Region ORDER BY Sales SUM ROWS UNBOUNDED PRECEDING)
Worksheet options Set to:
Items Video Analysis Information: Calendar Year, Sales SUM
Sort Order N/A
Conditions N/A
Calculation Name Sales Last Year
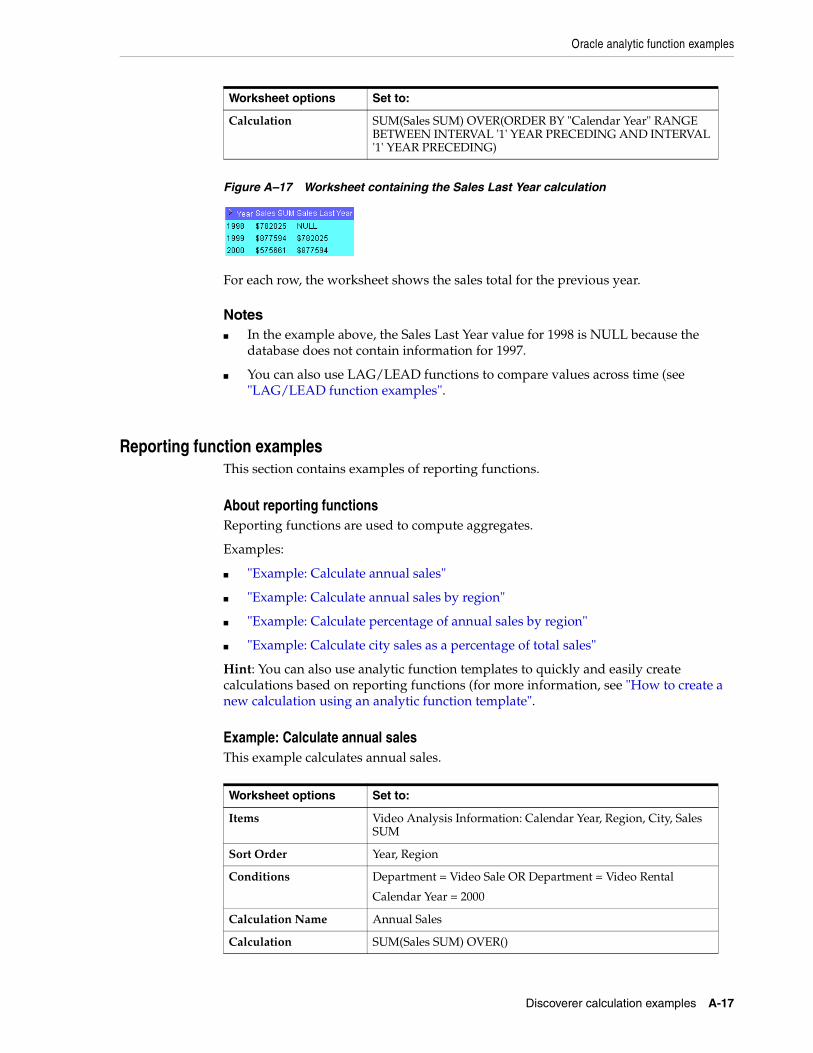
Oracle analytic function examples
Discoverer calculation examples A-17
Figure A–17 Worksheet containing the Sales Last Year calculation
For each row, the worksheet shows the sales total for the previous year.
Notes■ In the example above, the Sales Last Year value for 1998 is NULL because the
database does not contain information for 1997.
■ You can also use LAG/LEAD functions to compare values across time (see "LAG/LEAD function examples".
Reporting function examplesThis section contains examples of reporting functions.
About reporting functionsReporting functions are used to compute aggregates.
Examples:
■ "Example: Calculate annual sales"
■ "Example: Calculate annual sales by region"
■ "Example: Calculate percentage of annual sales by region"
■ "Example: Calculate city sales as a percentage of total sales"
Hint: You can also use analytic function templates to quickly and easily create calculations based on reporting functions (for more information, see "How to create a new calculation using an analytic function template".
Example: Calculate annual salesThis example calculates annual sales.
Calculation SUM(Sales SUM) OVER(ORDER BY "Calendar Year" RANGE BETWEEN INTERVAL '1' YEAR PRECEDING AND INTERVAL '1' YEAR PRECEDING)
Worksheet options Set to:
Items Video Analysis Information: Calendar Year, Region, City, Sales SUM
Sort Order Year, Region
Conditions Department = Video Sale OR Department = Video Rental
Calendar Year = 2000
Calculation Name Annual Sales
Calculation SUM(Sales SUM) OVER()
Worksheet options Set to:
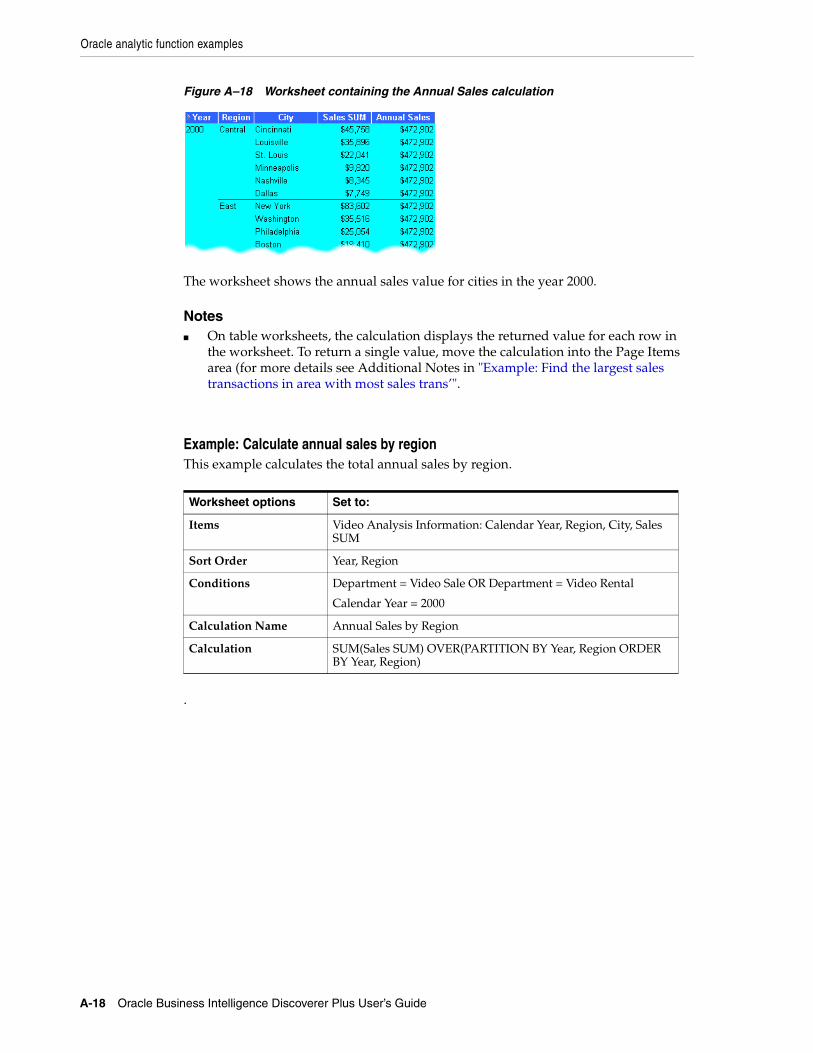
Oracle analytic function examples
A-18 Oracle Business Intelligence Discoverer Plus User’s Guide
Figure A–18 Worksheet containing the Annual Sales calculation
The worksheet shows the annual sales value for cities in the year 2000.
Notes■ On table worksheets, the calculation displays the returned value for each row in
the worksheet. To return a single value, move the calculation into the Page Items area (for more details see Additional Notes in "Example: Find the largest sales transactions in area with most sales trans’".
Example: Calculate annual sales by regionThis example calculates the total annual sales by region.
.
Worksheet options Set to:
Items Video Analysis Information: Calendar Year, Region, City, Sales SUM
Sort Order Year, Region
Conditions Department = Video Sale OR Department = Video Rental
Calendar Year = 2000
Calculation Name Annual Sales by Region
Calculation SUM(Sales SUM) OVER(PARTITION BY Year, Region ORDER BY Year, Region)
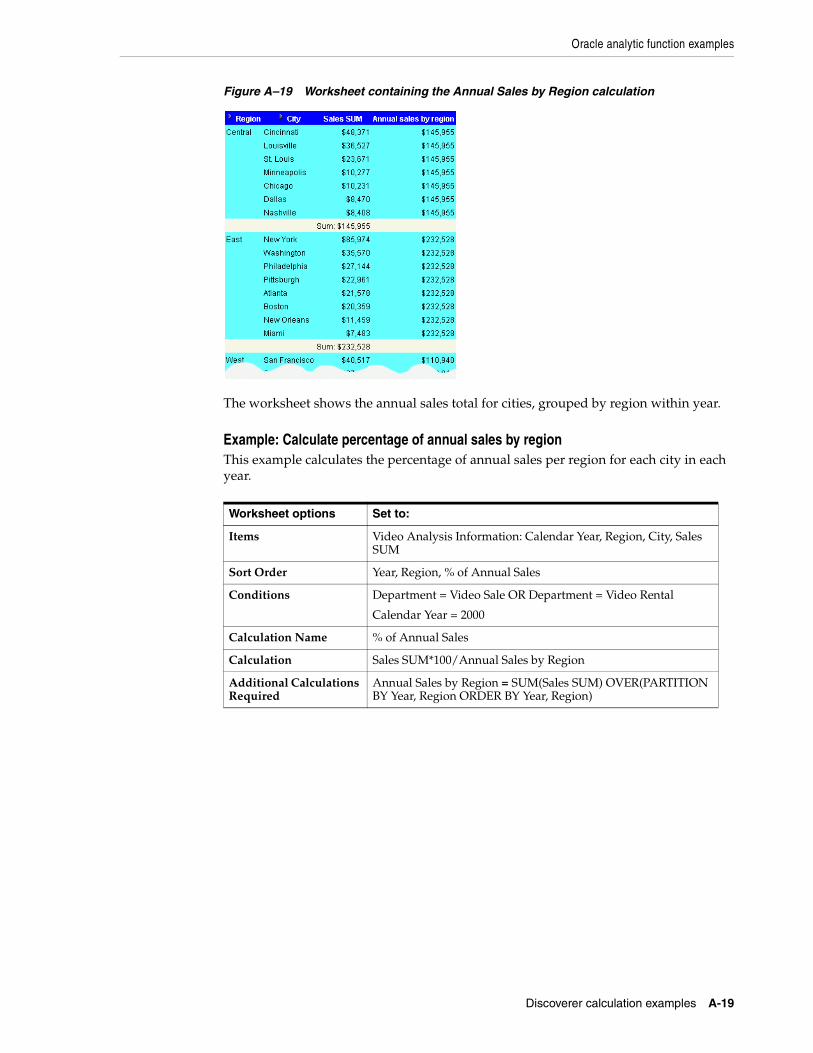
Oracle analytic function examples
Discoverer calculation examples A-19
Figure A–19 Worksheet containing the Annual Sales by Region calculation
The worksheet shows the annual sales total for cities, grouped by region within year.
Example: Calculate percentage of annual sales by regionThis example calculates the percentage of annual sales per region for each city in each year.
Worksheet options Set to:
Items Video Analysis Information: Calendar Year, Region, City, Sales SUM
Sort Order Year, Region, % of Annual Sales
Conditions Department = Video Sale OR Department = Video Rental
Calendar Year = 2000
Calculation Name % of Annual Sales
Calculation Sales SUM*100/Annual Sales by Region
Additional Calculations Required
Annual Sales by Region = SUM(Sales SUM) OVER(PARTITION BY Year, Region ORDER BY Year, Region)
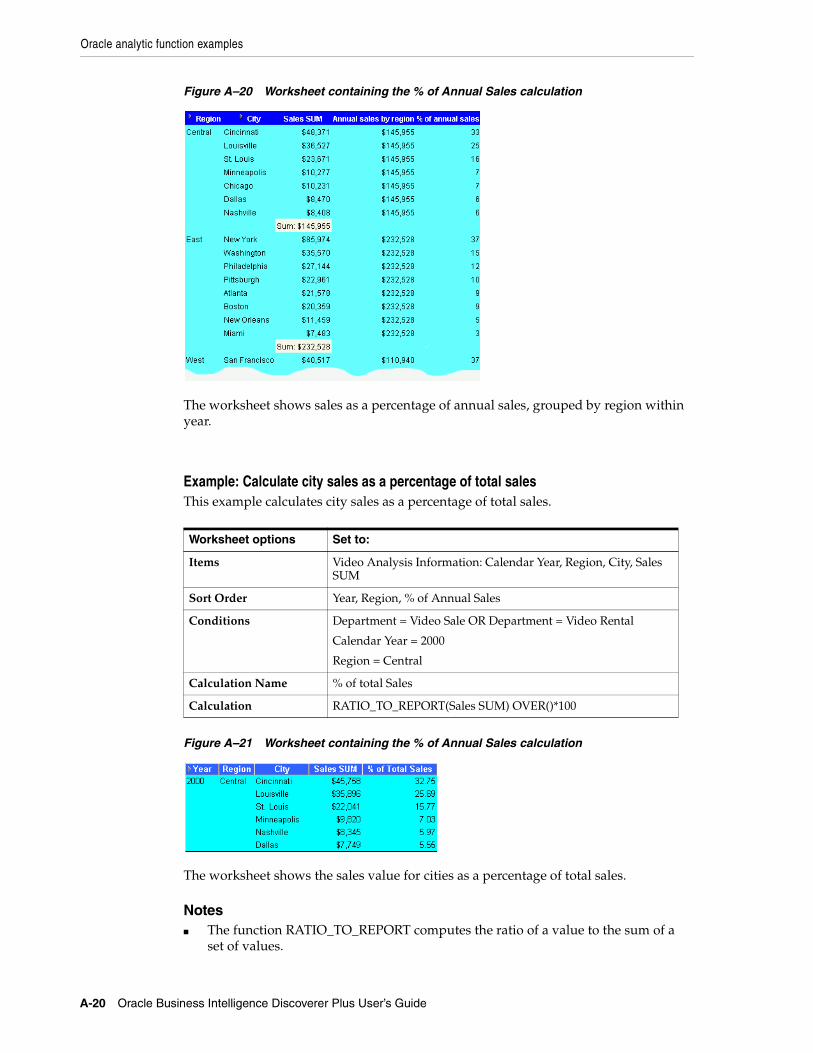
Oracle analytic function examples
A-20 Oracle Business Intelligence Discoverer Plus User’s Guide
Figure A–20 Worksheet containing the % of Annual Sales calculation
The worksheet shows sales as a percentage of annual sales, grouped by region within year.
Example: Calculate city sales as a percentage of total salesThis example calculates city sales as a percentage of total sales.
Figure A–21 Worksheet containing the % of Annual Sales calculation
The worksheet shows the sales value for cities as a percentage of total sales.
Notes■ The function RATIO_TO_REPORT computes the ratio of a value to the sum of a
set of values.
Worksheet options Set to:
Items Video Analysis Information: Calendar Year, Region, City, Sales SUM
Sort Order Year, Region, % of Annual Sales
Conditions Department = Video Sale OR Department = Video Rental
Calendar Year = 2000
Region = Central
Calculation Name % of total Sales
Calculation RATIO_TO_REPORT(Sales SUM) OVER()*100
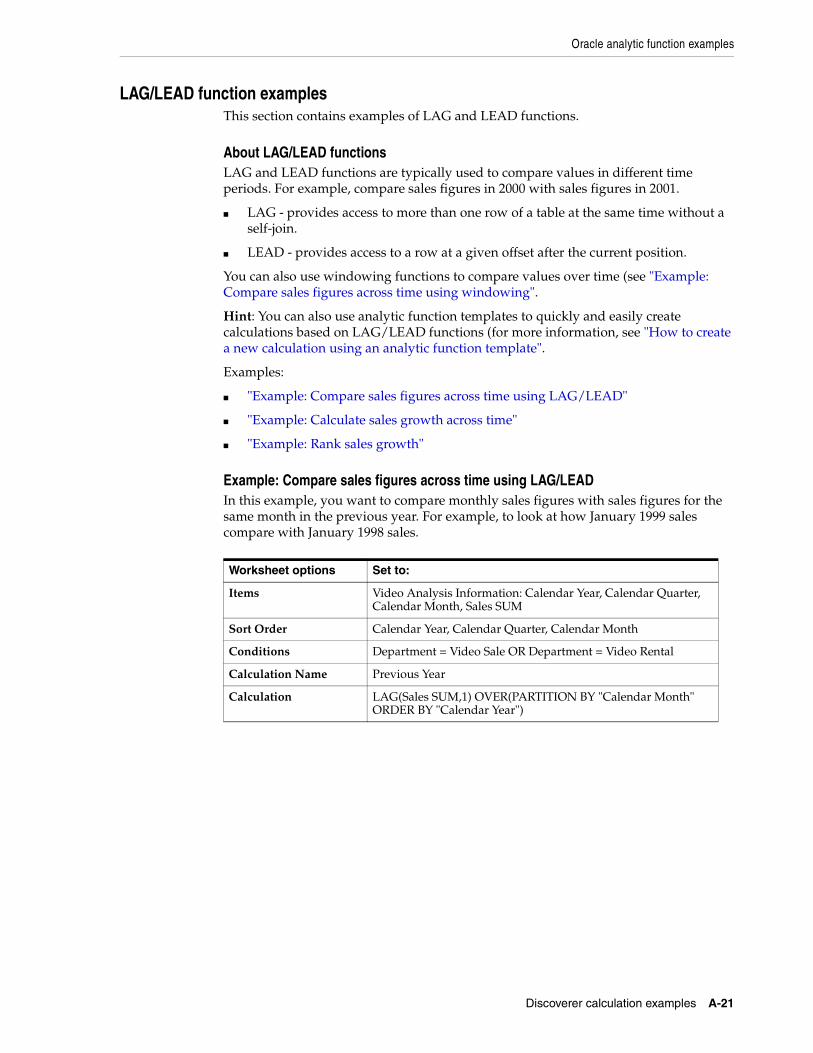
Oracle analytic function examples
Discoverer calculation examples A-21
LAG/LEAD function examplesThis section contains examples of LAG and LEAD functions.
About LAG/LEAD functionsLAG and LEAD functions are typically used to compare values in different time periods. For example, compare sales figures in 2000 with sales figures in 2001.
■ LAG - provides access to more than one row of a table at the same time without a self-join.
■ LEAD - provides access to a row at a given offset after the current position.
You can also use windowing functions to compare values over time (see "Example: Compare sales figures across time using windowing".
Hint: You can also use analytic function templates to quickly and easily create calculations based on LAG/LEAD functions (for more information, see "How to create a new calculation using an analytic function template".
Examples:
■ "Example: Compare sales figures across time using LAG/LEAD"
■ "Example: Calculate sales growth across time"
■ "Example: Rank sales growth"
Example: Compare sales figures across time using LAG/LEADIn this example, you want to compare monthly sales figures with sales figures for the same month in the previous year. For example, to look at how January 1999 sales compare with January 1998 sales.
Worksheet options Set to:
Items Video Analysis Information: Calendar Year, Calendar Quarter, Calendar Month, Sales SUM
Sort Order Calendar Year, Calendar Quarter, Calendar Month
Conditions Department = Video Sale OR Department = Video Rental
Calculation Name Previous Year
Calculation LAG(Sales SUM,1) OVER(PARTITION BY "Calendar Month" ORDER BY "Calendar Year")
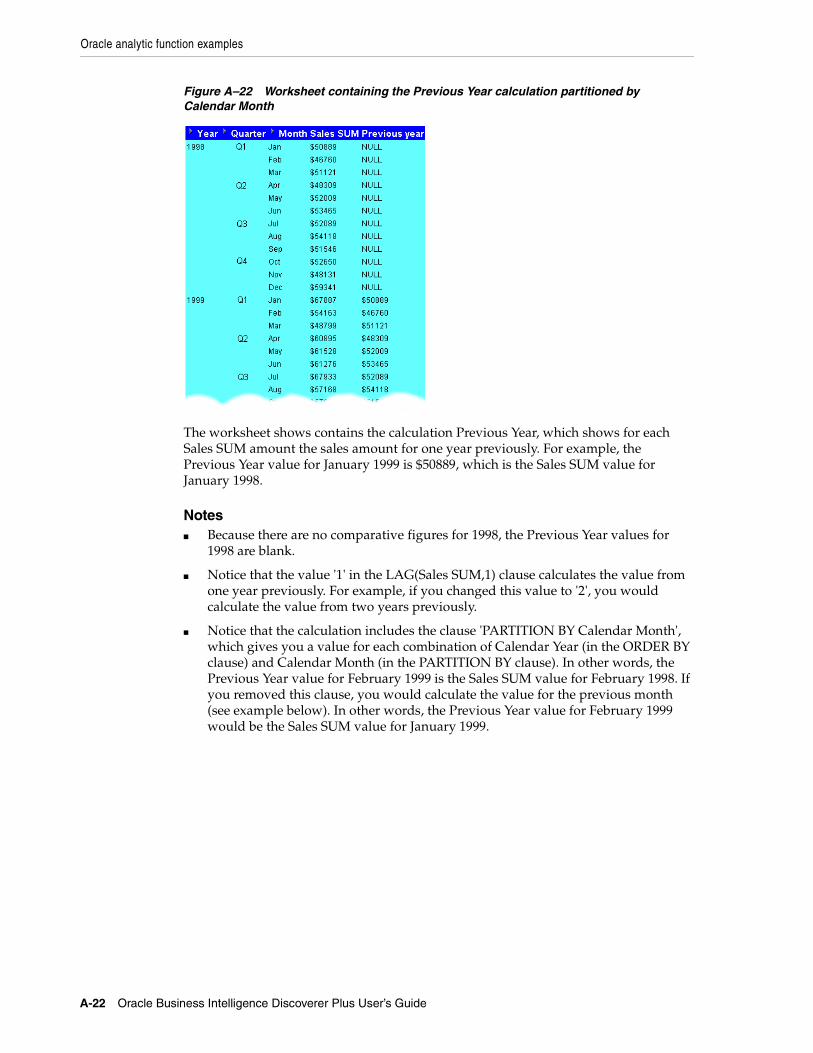
Oracle analytic function examples
A-22 Oracle Business Intelligence Discoverer Plus User’s Guide
Figure A–22 Worksheet containing the Previous Year calculation partitioned by Calendar Month
The worksheet shows contains the calculation Previous Year, which shows for each Sales SUM amount the sales amount for one year previously. For example, the Previous Year value for January 1999 is $50889, which is the Sales SUM value for January 1998.
Notes■ Because there are no comparative figures for 1998, the Previous Year values for
1998 are blank.
■ Notice that the value '1' in the LAG(Sales SUM,1) clause calculates the value from one year previously. For example, if you changed this value to '2', you would calculate the value from two years previously.
■ Notice that the calculation includes the clause 'PARTITION BY Calendar Month', which gives you a value for each combination of Calendar Year (in the ORDER BY clause) and Calendar Month (in the PARTITION BY clause). In other words, the Previous Year value for February 1999 is the Sales SUM value for February 1998. If you removed this clause, you would calculate the value for the previous month (see example below). In other words, the Previous Year value for February 1999 would be the Sales SUM value for January 1999.
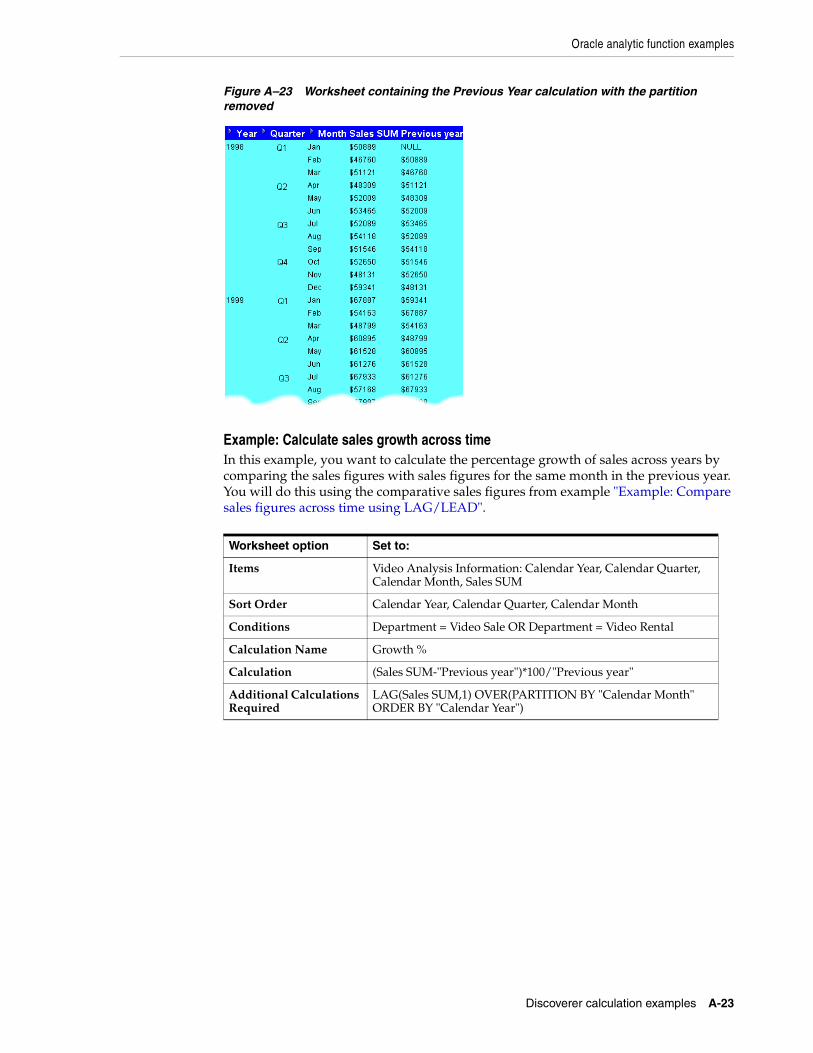
Oracle analytic function examples
Discoverer calculation examples A-23
Figure A–23 Worksheet containing the Previous Year calculation with the partition removed
Example: Calculate sales growth across timeIn this example, you want to calculate the percentage growth of sales across years by comparing the sales figures with sales figures for the same month in the previous year. You will do this using the comparative sales figures from example "Example: Compare sales figures across time using LAG/LEAD".
Worksheet option Set to:
Items Video Analysis Information: Calendar Year, Calendar Quarter, Calendar Month, Sales SUM
Sort Order Calendar Year, Calendar Quarter, Calendar Month
Conditions Department = Video Sale OR Department = Video Rental
Calculation Name Growth %
Calculation (Sales SUM-"Previous year")*100/"Previous year"
Additional Calculations Required
LAG(Sales SUM,1) OVER(PARTITION BY "Calendar Month" ORDER BY "Calendar Year")
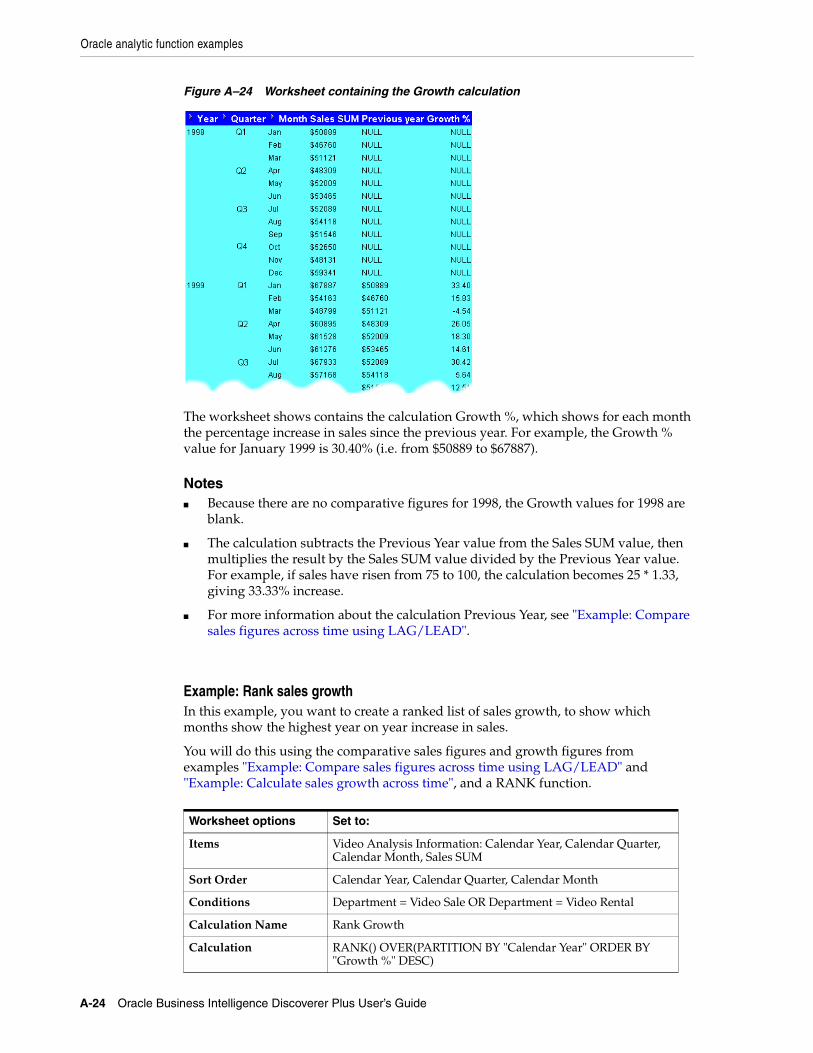
Oracle analytic function examples
A-24 Oracle Business Intelligence Discoverer Plus User’s Guide
Figure A–24 Worksheet containing the Growth calculation
The worksheet shows contains the calculation Growth %, which shows for each month the percentage increase in sales since the previous year. For example, the Growth % value for January 1999 is 30.40% (i.e. from $50889 to $67887).
Notes■ Because there are no comparative figures for 1998, the Growth values for 1998 are
blank.
■ The calculation subtracts the Previous Year value from the Sales SUM value, then multiplies the result by the Sales SUM value divided by the Previous Year value. For example, if sales have risen from 75 to 100, the calculation becomes 25 * 1.33, giving 33.33% increase.
■ For more information about the calculation Previous Year, see "Example: Compare sales figures across time using LAG/LEAD".
Example: Rank sales growthIn this example, you want to create a ranked list of sales growth, to show which months show the highest year on year increase in sales.
You will do this using the comparative sales figures and growth figures from examples "Example: Compare sales figures across time using LAG/LEAD" and "Example: Calculate sales growth across time", and a RANK function.
Worksheet options Set to:
Items Video Analysis Information: Calendar Year, Calendar Quarter, Calendar Month, Sales SUM
Sort Order Calendar Year, Calendar Quarter, Calendar Month
Conditions Department = Video Sale OR Department = Video Rental
Calculation Name Rank Growth
Calculation RANK() OVER(PARTITION BY "Calendar Year" ORDER BY "Growth %" DESC)
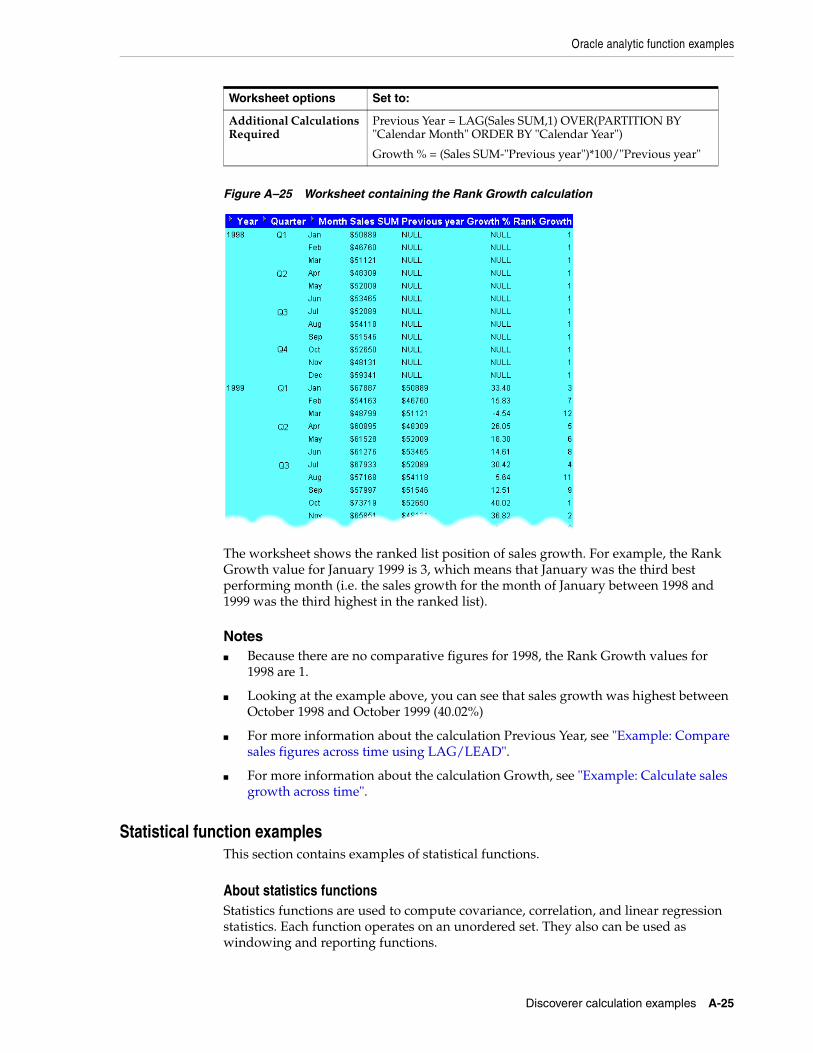
Oracle analytic function examples
Discoverer calculation examples A-25
Figure A–25 Worksheet containing the Rank Growth calculation
The worksheet shows the ranked list position of sales growth. For example, the Rank Growth value for January 1999 is 3, which means that January was the third best performing month (i.e. the sales growth for the month of January between 1998 and 1999 was the third highest in the ranked list).
Notes■ Because there are no comparative figures for 1998, the Rank Growth values for
1998 are 1.
■ Looking at the example above, you can see that sales growth was highest between October 1998 and October 1999 (40.02%)
■ For more information about the calculation Previous Year, see "Example: Compare sales figures across time using LAG/LEAD".
■ For more information about the calculation Growth, see "Example: Calculate sales growth across time".
Statistical function examplesThis section contains examples of statistical functions.
About statistics functionsStatistics functions are used to compute covariance, correlation, and linear regression statistics. Each function operates on an unordered set. They also can be used as windowing and reporting functions.
Additional Calculations Required
Previous Year = LAG(Sales SUM,1) OVER(PARTITION BY "Calendar Month" ORDER BY "Calendar Year")
Growth % = (Sales SUM-"Previous year")*100/"Previous year"
Worksheet options Set to:
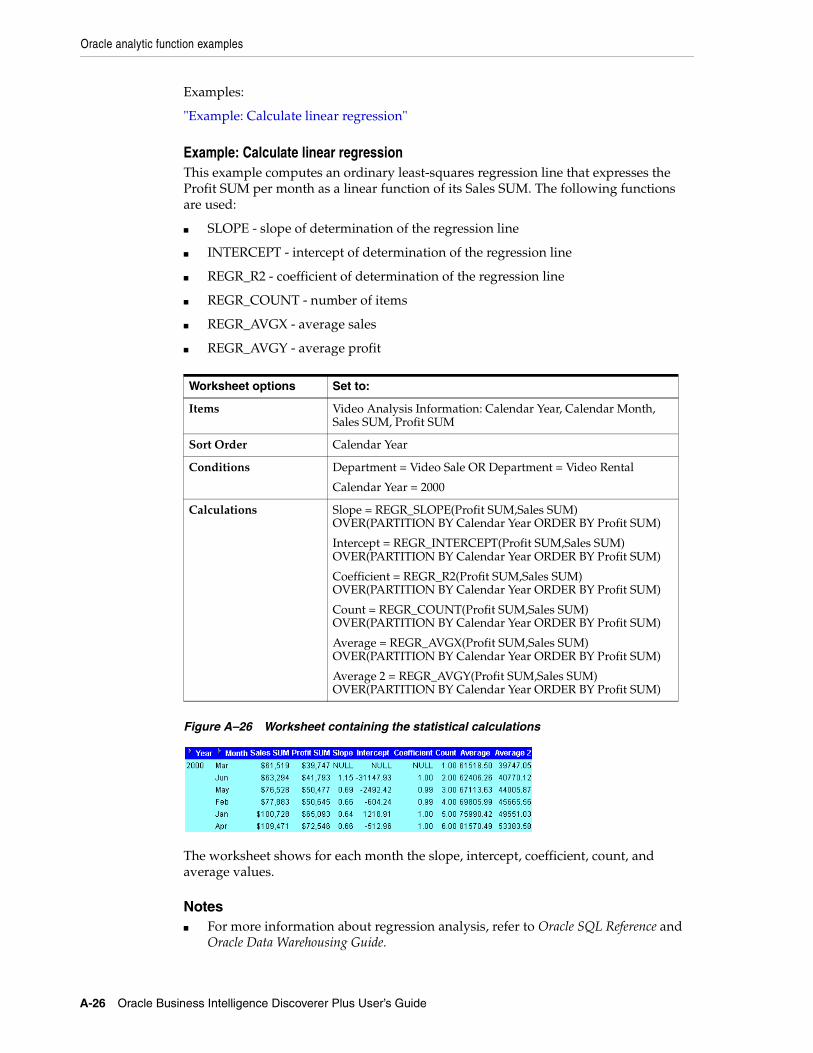
Oracle analytic function examples
A-26 Oracle Business Intelligence Discoverer Plus User’s Guide
Examples:
"Example: Calculate linear regression"
Example: Calculate linear regression This example computes an ordinary least-squares regression line that expresses the Profit SUM per month as a linear function of its Sales SUM. The following functions are used:
■ SLOPE - slope of determination of the regression line
■ INTERCEPT - intercept of determination of the regression line
■ REGR_R2 - coefficient of determination of the regression line
■ REGR_COUNT - number of items
■ REGR_AVGX - average sales
■ REGR_AVGY - average profit
Figure A–26 Worksheet containing the statistical calculations
The worksheet shows for each month the slope, intercept, coefficient, count, and average values.
Notes■ For more information about regression analysis, refer to Oracle SQL Reference and
Oracle Data Warehousing Guide.
Worksheet options Set to:
Items Video Analysis Information: Calendar Year, Calendar Month, Sales SUM, Profit SUM
Sort Order Calendar Year
Conditions Department = Video Sale OR Department = Video Rental
Calendar Year = 2000
Calculations Slope = REGR_SLOPE(Profit SUM,Sales SUM) OVER(PARTITION BY Calendar Year ORDER BY Profit SUM)
Intercept = REGR_INTERCEPT(Profit SUM,Sales SUM) OVER(PARTITION BY Calendar Year ORDER BY Profit SUM)
Coefficient = REGR_R2(Profit SUM,Sales SUM) OVER(PARTITION BY Calendar Year ORDER BY Profit SUM)
Count = REGR_COUNT(Profit SUM,Sales SUM) OVER(PARTITION BY Calendar Year ORDER BY Profit SUM)
Average = REGR_AVGX(Profit SUM,Sales SUM) OVER(PARTITION BY Calendar Year ORDER BY Profit SUM)
Average 2 = REGR_AVGY(Profit SUM,Sales SUM) OVER(PARTITION BY Calendar Year ORDER BY Profit SUM)
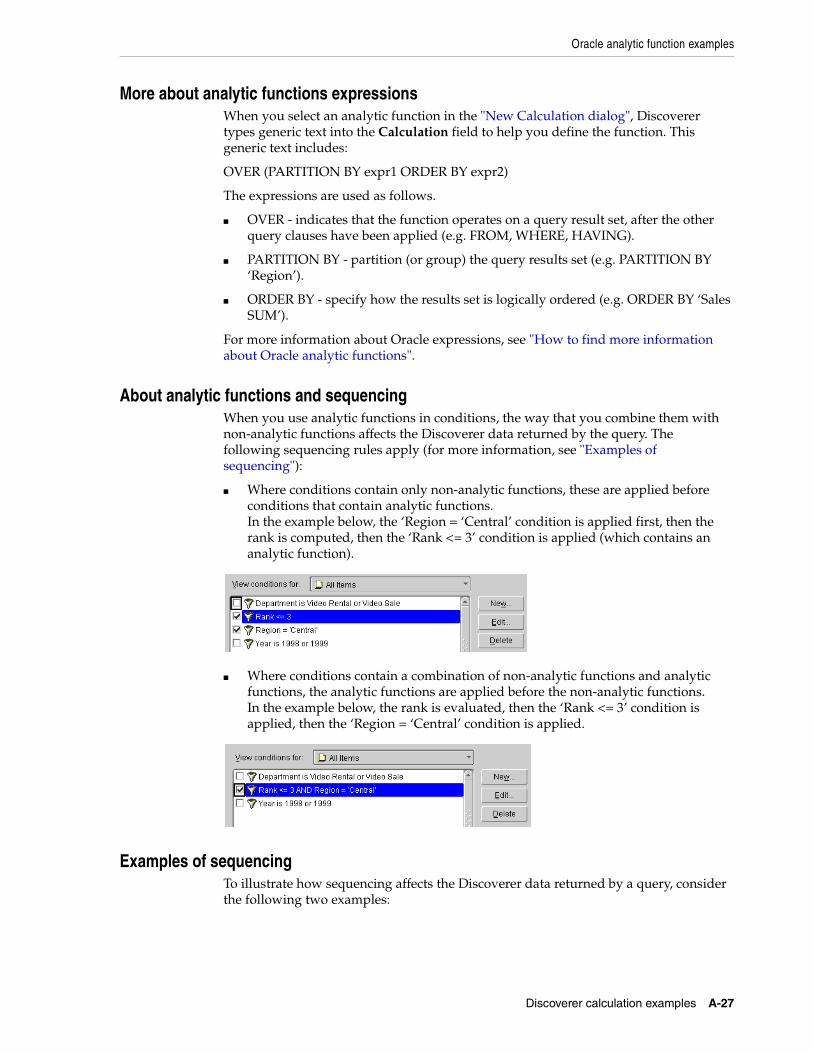
Oracle analytic function examples
Discoverer calculation examples A-27
More about analytic functions expressionsWhen you select an analytic function in the "New Calculation dialog", Discoverer types generic text into the Calculation field to help you define the function. This generic text includes:
OVER (PARTITION BY expr1 ORDER BY expr2)
The expressions are used as follows.
■ OVER - indicates that the function operates on a query result set, after the other query clauses have been applied (e.g. FROM, WHERE, HAVING).
■ PARTITION BY - partition (or group) the query results set (e.g. PARTITION BY ‘Region’).
■ ORDER BY - specify how the results set is logically ordered (e.g. ORDER BY ‘Sales SUM’).
For more information about Oracle expressions, see "How to find more information about Oracle analytic functions".
About analytic functions and sequencingWhen you use analytic functions in conditions, the way that you combine them with non-analytic functions affects the Discoverer data returned by the query. The following sequencing rules apply (for more information, see "Examples of sequencing"):
■ Where conditions contain only non-analytic functions, these are applied before conditions that contain analytic functions.In the example below, the ‘Region = ‘Central’ condition is applied first, then the rank is computed, then the ‘Rank <= 3’ condition is applied (which contains an analytic function).
■ Where conditions contain a combination of non-analytic functions and analytic functions, the analytic functions are applied before the non-analytic functions.In the example below, the rank is evaluated, then the ‘Rank <= 3’ condition is applied, then the ‘Region = ‘Central’ condition is applied.
Examples of sequencingTo illustrate how sequencing affects the Discoverer data returned by a query, consider the following two examples:
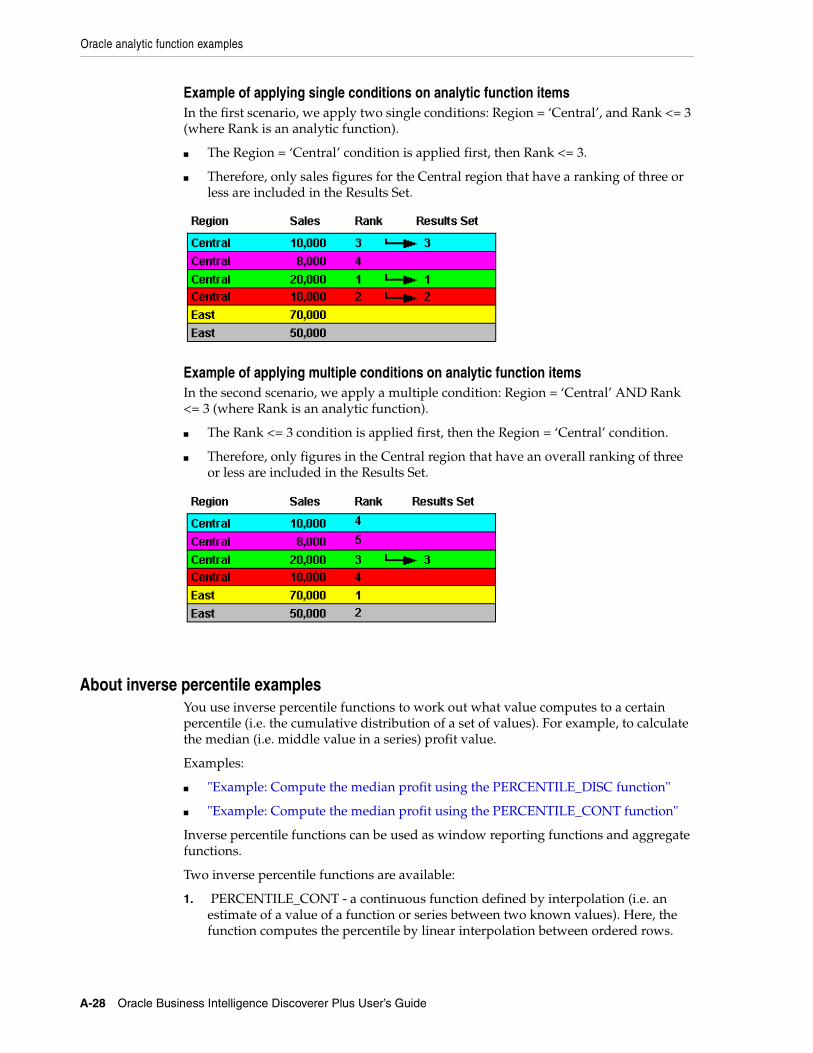
Oracle analytic function examples
A-28 Oracle Business Intelligence Discoverer Plus User’s Guide
Example of applying single conditions on analytic function items In the first scenario, we apply two single conditions: Region = ‘Central’, and Rank <= 3 (where Rank is an analytic function).
■ The Region = ‘Central’ condition is applied first, then Rank <= 3.
■ Therefore, only sales figures for the Central region that have a ranking of three or less are included in the Results Set.
Example of applying multiple conditions on analytic function itemsIn the second scenario, we apply a multiple condition: Region = ‘Central’ AND Rank <= 3 (where Rank is an analytic function).
■ The Rank <= 3 condition is applied first, then the Region = ‘Central’ condition.
■ Therefore, only figures in the Central region that have an overall ranking of three or less are included in the Results Set.
About inverse percentile examplesYou use inverse percentile functions to work out what value computes to a certain percentile (i.e. the cumulative distribution of a set of values). For example, to calculate the median (i.e. middle value in a series) profit value.
Examples:
■ "Example: Compute the median profit using the PERCENTILE_DISC function"
■ "Example: Compute the median profit using the PERCENTILE_CONT function"
Inverse percentile functions can be used as window reporting functions and aggregate functions.
Two inverse percentile functions are available:
1. PERCENTILE_CONT - a continuous function defined by interpolation (i.e. an estimate of a value of a function or series between two known values). Here, the function computes the percentile by linear interpolation between ordered rows.

Oracle analytic function examples
Discoverer calculation examples A-29
2. PERCENTILE_DISC is a step function that assumes discrete values. Here, the function scans the cumulative distribution value (using CUME_DIST) in each group to find the first value greater than or equal to the specified percentile value.
Note: Inverse percentile functions do the opposite of the CUME_DIST function, which works out the cumulative distribution of a set of values.
About differences between PERCENTILE_CONT and PERCENTILE_DISCPERCENTILE_CONT and PERCENTILE_DISC might return different results, depending on the number of rows in the calculation. For example, if the percentile value is 0.5, PERCENTILE_CONT returns the average of the two middle values for groups with even number of elements. In contrast, PERCENTILE_DISC returns the value of the first one among the two middle values. For aggregate groups with an odd number of elements, both functions return the value of the middle element.
Example: Compute the median profit using the PERCENTILE_DISC functionThis example computes the median profit value for cities using the PERCENTILE_DISC function as a reporting aggregate function.
Figure A–27 Worksheet containing the Median(PERCENTILE_DISC) calculation
The worksheet shows the median profit value for cities. The median profit value (i.e. 0.50 in the Cumulative Distribution column) is $61,942,21 (i.e. the value for Pittsburgh, which has the value 0.50 in the Cumulative Distribution column).
Worksheet options Set to:
Items Video Analysis Information: City, Profit SUM
Sort Order Not applicable
Conditions Not applicable
Calculation Name Median (PERCENTILE_DISC)
Calculation PERCENTILE_DISC(0.5) WITHIN GROUP(ORDER BY Profit SUM) OVER()
Additional Calculations Required
Cumulative Distribution = CUME_DIST() OVER(ORDER BY Profit SUM)
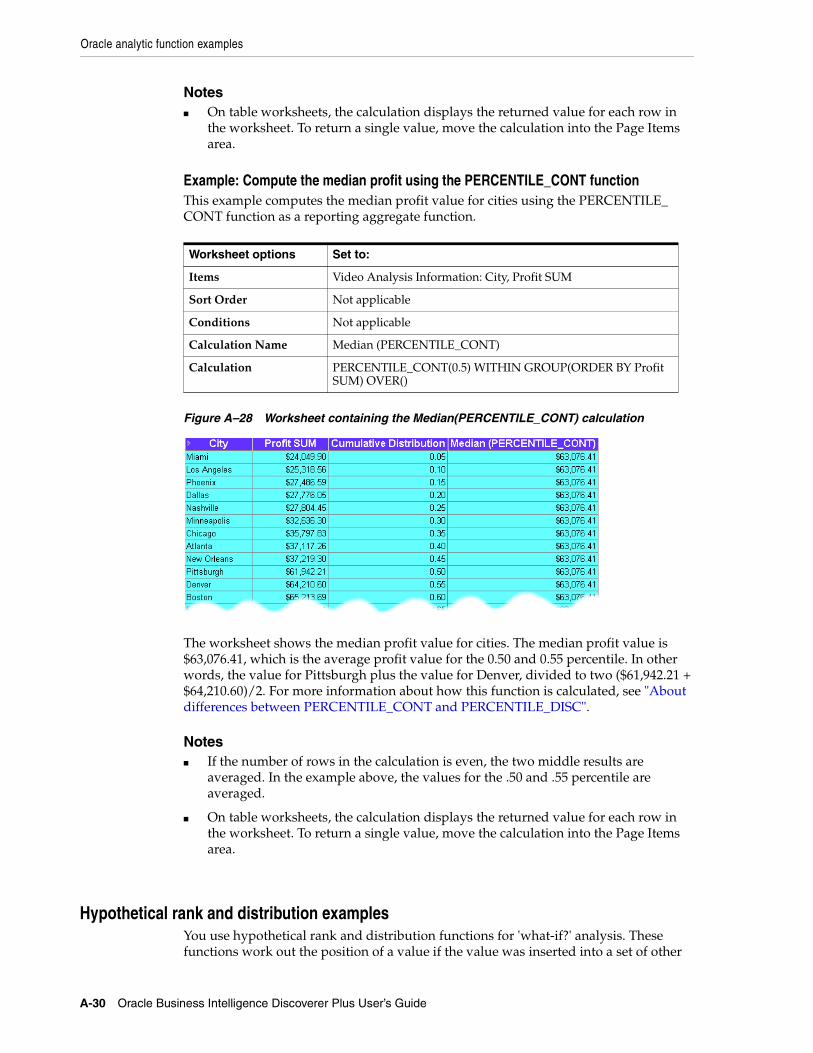
Oracle analytic function examples
A-30 Oracle Business Intelligence Discoverer Plus User’s Guide
Notes■ On table worksheets, the calculation displays the returned value for each row in
the worksheet. To return a single value, move the calculation into the Page Items area.
Example: Compute the median profit using the PERCENTILE_CONT functionThis example computes the median profit value for cities using the PERCENTILE_CONT function as a reporting aggregate function.
Figure A–28 Worksheet containing the Median(PERCENTILE_CONT) calculation
The worksheet shows the median profit value for cities. The median profit value is $63,076.41, which is the average profit value for the 0.50 and 0.55 percentile. In other words, the value for Pittsburgh plus the value for Denver, divided to two ($61,942.21 + $64,210.60)/2. For more information about how this function is calculated, see "About differences between PERCENTILE_CONT and PERCENTILE_DISC".
Notes■ If the number of rows in the calculation is even, the two middle results are
averaged. In the example above, the values for the .50 and .55 percentile are averaged.
■ On table worksheets, the calculation displays the returned value for each row in the worksheet. To return a single value, move the calculation into the Page Items area.
Hypothetical rank and distribution examplesYou use hypothetical rank and distribution functions for 'what-if?' analysis. These functions work out the position of a value if the value was inserted into a set of other
Worksheet options Set to:
Items Video Analysis Information: City, Profit SUM
Sort Order Not applicable
Conditions Not applicable
Calculation Name Median (PERCENTILE_CONT)
Calculation PERCENTILE_CONT(0.5) WITHIN GROUP(ORDER BY Profit SUM) OVER()
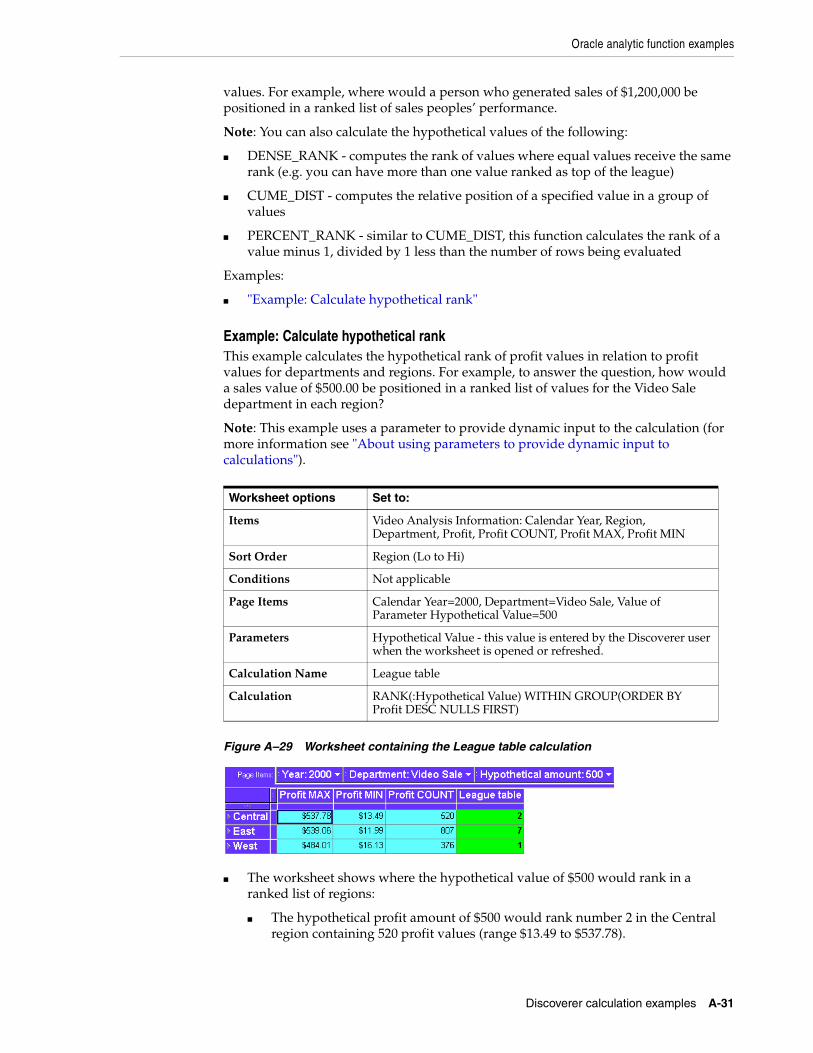
Oracle analytic function examples
Discoverer calculation examples A-31
values. For example, where would a person who generated sales of $1,200,000 be positioned in a ranked list of sales peoples’ performance.
Note: You can also calculate the hypothetical values of the following:
■ DENSE_RANK - computes the rank of values where equal values receive the same rank (e.g. you can have more than one value ranked as top of the league)
■ CUME_DIST - computes the relative position of a specified value in a group of values
■ PERCENT_RANK - similar to CUME_DIST, this function calculates the rank of a value minus 1, divided by 1 less than the number of rows being evaluated
Examples:
■ "Example: Calculate hypothetical rank"
Example: Calculate hypothetical rankThis example calculates the hypothetical rank of profit values in relation to profit values for departments and regions. For example, to answer the question, how would a sales value of $500.00 be positioned in a ranked list of values for the Video Sale department in each region?
Note: This example uses a parameter to provide dynamic input to the calculation (for more information see "About using parameters to provide dynamic input to calculations").
Figure A–29 Worksheet containing the League table calculation
■ The worksheet shows where the hypothetical value of $500 would rank in a ranked list of regions:
■ The hypothetical profit amount of $500 would rank number 2 in the Central region containing 520 profit values (range $13.49 to $537.78).
Worksheet options Set to:
Items Video Analysis Information: Calendar Year, Region, Department, Profit, Profit COUNT, Profit MAX, Profit MIN
Sort Order Region (Lo to Hi)
Conditions Not applicable
Page Items Calendar Year=2000, Department=Video Sale, Value of Parameter Hypothetical Value=500
Parameters Hypothetical Value - this value is entered by the Discoverer user when the worksheet is opened or refreshed.
Calculation Name League table
Calculation RANK(:Hypothetical Value) WITHIN GROUP(ORDER BY Profit DESC NULLS FIRST)
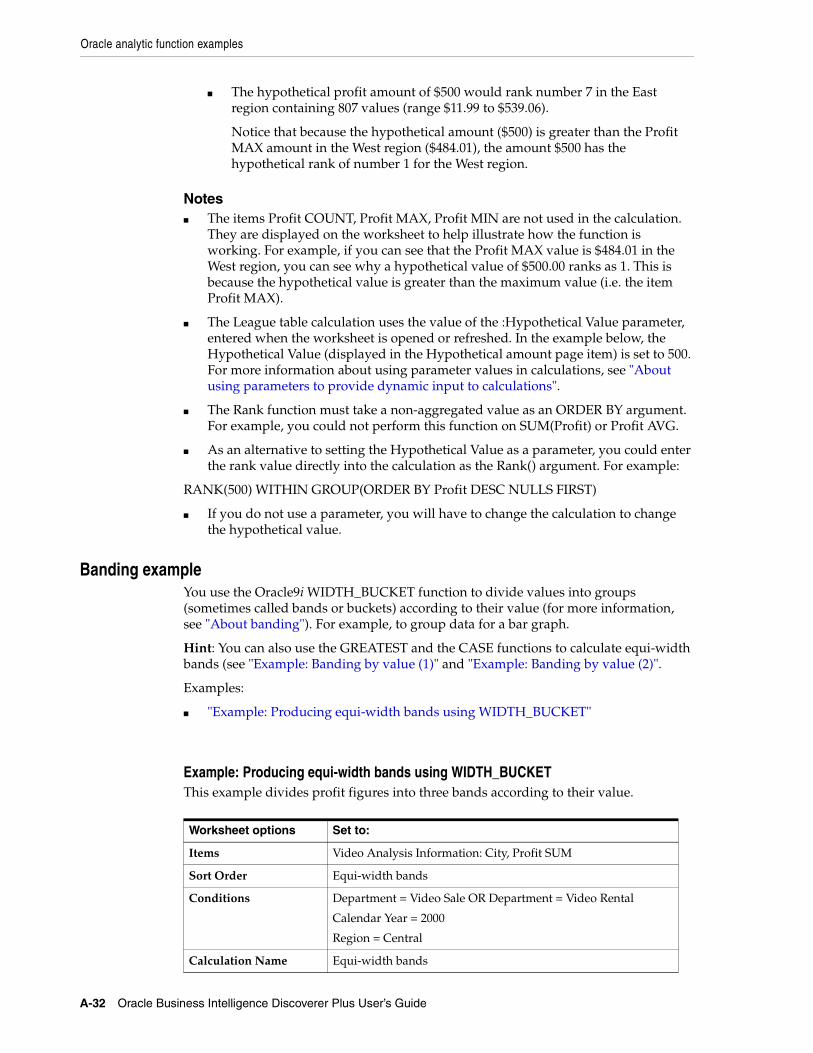
Oracle analytic function examples
A-32 Oracle Business Intelligence Discoverer Plus User’s Guide
■ The hypothetical profit amount of $500 would rank number 7 in the East region containing 807 values (range $11.99 to $539.06).
Notice that because the hypothetical amount ($500) is greater than the Profit MAX amount in the West region ($484.01), the amount $500 has the hypothetical rank of number 1 for the West region.
Notes■ The items Profit COUNT, Profit MAX, Profit MIN are not used in the calculation.
They are displayed on the worksheet to help illustrate how the function is working. For example, if you can see that the Profit MAX value is $484.01 in the West region, you can see why a hypothetical value of $500.00 ranks as 1. This is because the hypothetical value is greater than the maximum value (i.e. the item Profit MAX).
■ The League table calculation uses the value of the :Hypothetical Value parameter, entered when the worksheet is opened or refreshed. In the example below, the Hypothetical Value (displayed in the Hypothetical amount page item) is set to 500. For more information about using parameter values in calculations, see "About using parameters to provide dynamic input to calculations".
■ The Rank function must take a non-aggregated value as an ORDER BY argument. For example, you could not perform this function on SUM(Profit) or Profit AVG.
■ As an alternative to setting the Hypothetical Value as a parameter, you could enter the rank value directly into the calculation as the Rank() argument. For example:
RANK(500) WITHIN GROUP(ORDER BY Profit DESC NULLS FIRST)
■ If you do not use a parameter, you will have to change the calculation to change the hypothetical value.
Banding exampleYou use the Oracle9i WIDTH_BUCKET function to divide values into groups (sometimes called bands or buckets) according to their value (for more information, see "About banding"). For example, to group data for a bar graph.
Hint: You can also use the GREATEST and the CASE functions to calculate equi-width bands (see "Example: Banding by value (1)" and "Example: Banding by value (2)".
Examples:
■ "Example: Producing equi-width bands using WIDTH_BUCKET"
Example: Producing equi-width bands using WIDTH_BUCKETThis example divides profit figures into three bands according to their value.
Worksheet options Set to:
Items Video Analysis Information: City, Profit SUM
Sort Order Equi-width bands
Conditions Department = Video Sale OR Department = Video Rental
Calendar Year = 2000
Region = Central
Calculation Name Equi-width bands
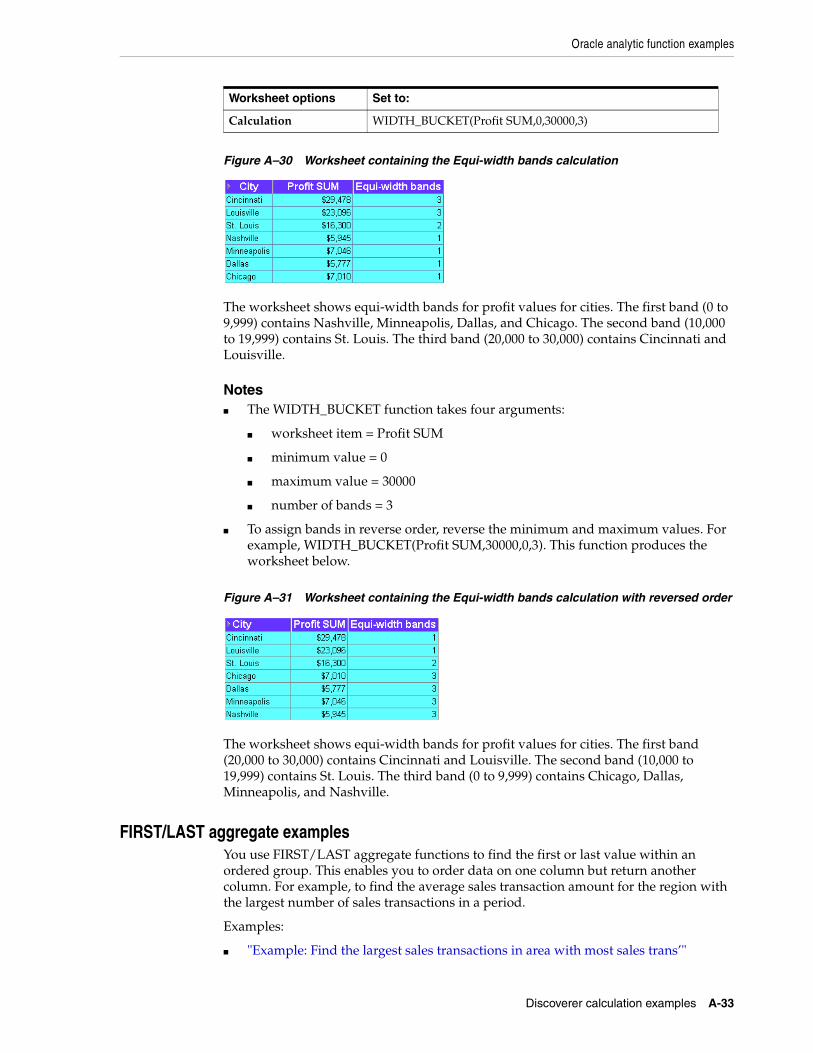
Oracle analytic function examples
Discoverer calculation examples A-33
Figure A–30 Worksheet containing the Equi-width bands calculation
The worksheet shows equi-width bands for profit values for cities. The first band (0 to 9,999) contains Nashville, Minneapolis, Dallas, and Chicago. The second band (10,000 to 19,999) contains St. Louis. The third band (20,000 to 30,000) contains Cincinnati and Louisville.
Notes■ The WIDTH_BUCKET function takes four arguments:
■ worksheet item = Profit SUM
■ minimum value = 0
■ maximum value = 30000
■ number of bands = 3
■ To assign bands in reverse order, reverse the minimum and maximum values. For example, WIDTH_BUCKET(Profit SUM,30000,0,3). This function produces the worksheet below.
Figure A–31 Worksheet containing the Equi-width bands calculation with reversed order
The worksheet shows equi-width bands for profit values for cities. The first band (20,000 to 30,000) contains Cincinnati and Louisville. The second band (10,000 to 19,999) contains St. Louis. The third band (0 to 9,999) contains Chicago, Dallas, Minneapolis, and Nashville.
FIRST/LAST aggregate examplesYou use FIRST/LAST aggregate functions to find the first or last value within an ordered group. This enables you to order data on one column but return another column. For example, to find the average sales transaction amount for the region with the largest number of sales transactions in a period.
Examples:
■ "Example: Find the largest sales transactions in area with most sales trans’"
Calculation WIDTH_BUCKET(Profit SUM,0,30000,3)
Worksheet options Set to:
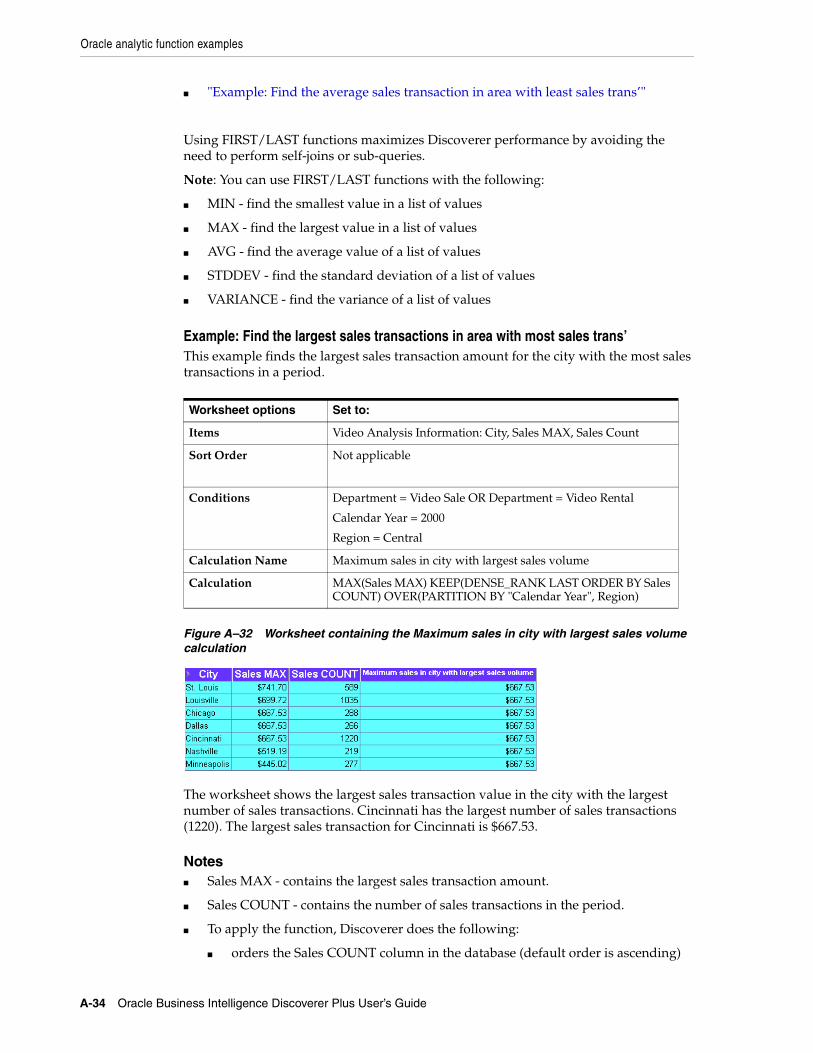
Oracle analytic function examples
A-34 Oracle Business Intelligence Discoverer Plus User’s Guide
■ "Example: Find the average sales transaction in area with least sales trans’"
Using FIRST/LAST functions maximizes Discoverer performance by avoiding the need to perform self-joins or sub-queries.
Note: You can use FIRST/LAST functions with the following:
■ MIN - find the smallest value in a list of values
■ MAX - find the largest value in a list of values
■ AVG - find the average value of a list of values
■ STDDEV - find the standard deviation of a list of values
■ VARIANCE - find the variance of a list of values
Example: Find the largest sales transactions in area with most sales trans’This example finds the largest sales transaction amount for the city with the most sales transactions in a period.
Figure A–32 Worksheet containing the Maximum sales in city with largest sales volume calculation
The worksheet shows the largest sales transaction value in the city with the largest number of sales transactions. Cincinnati has the largest number of sales transactions (1220). The largest sales transaction for Cincinnati is $667.53.
Notes■ Sales MAX - contains the largest sales transaction amount.
■ Sales COUNT - contains the number of sales transactions in the period.
■ To apply the function, Discoverer does the following:
■ orders the Sales COUNT column in the database (default order is ascending)
Worksheet options Set to:
Items Video Analysis Information: City, Sales MAX, Sales Count
Sort Order Not applicable
Conditions Department = Video Sale OR Department = Video Rental
Calendar Year = 2000
Region = Central
Calculation Name Maximum sales in city with largest sales volume
Calculation MAX(Sales MAX) KEEP(DENSE_RANK LAST ORDER BY Sales COUNT) OVER(PARTITION BY "Calendar Year", Region)
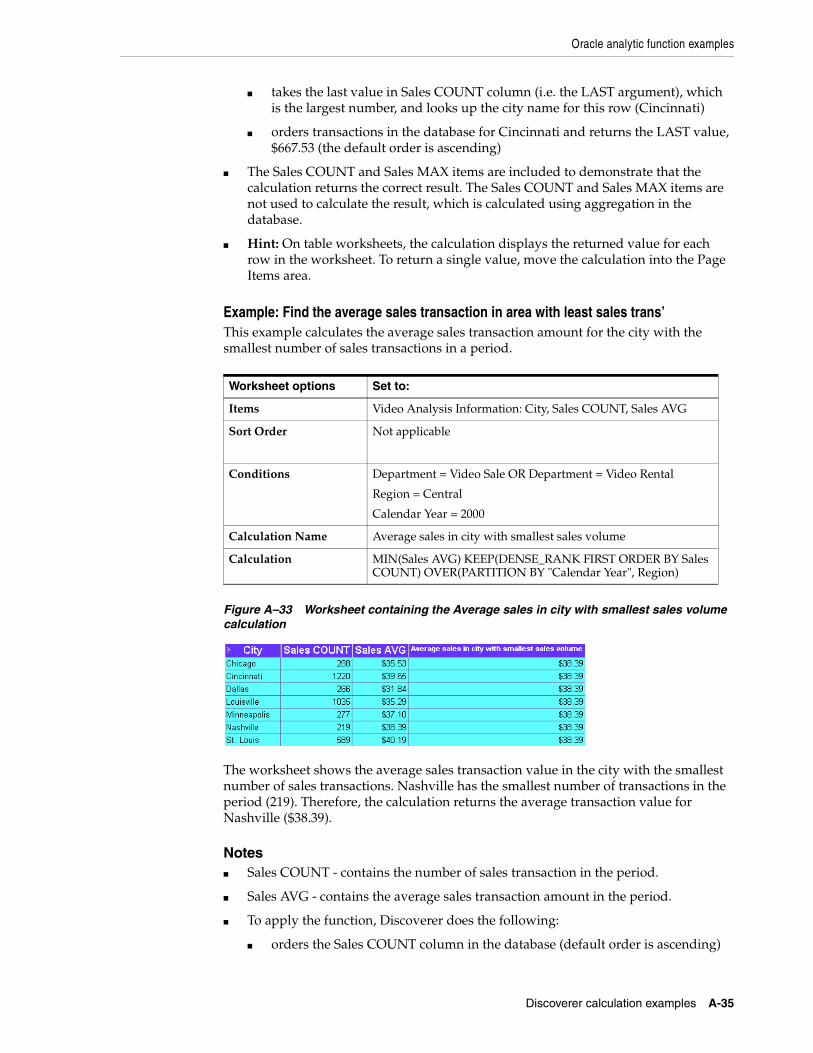
Oracle analytic function examples
Discoverer calculation examples A-35
■ takes the last value in Sales COUNT column (i.e. the LAST argument), which is the largest number, and looks up the city name for this row (Cincinnati)
■ orders transactions in the database for Cincinnati and returns the LAST value, $667.53 (the default order is ascending)
■ The Sales COUNT and Sales MAX items are included to demonstrate that the calculation returns the correct result. The Sales COUNT and Sales MAX items are not used to calculate the result, which is calculated using aggregation in the database.
■ Hint: On table worksheets, the calculation displays the returned value for each row in the worksheet. To return a single value, move the calculation into the Page Items area.
Example: Find the average sales transaction in area with least sales trans’This example calculates the average sales transaction amount for the city with the smallest number of sales transactions in a period.
Figure A–33 Worksheet containing the Average sales in city with smallest sales volume calculation
The worksheet shows the average sales transaction value in the city with the smallest number of sales transactions. Nashville has the smallest number of transactions in the period (219). Therefore, the calculation returns the average transaction value for Nashville ($38.39).
Notes■ Sales COUNT - contains the number of sales transaction in the period.
■ Sales AVG - contains the average sales transaction amount in the period.
■ To apply the function, Discoverer does the following:
■ orders the Sales COUNT column in the database (default order is ascending)
Worksheet options Set to:
Items Video Analysis Information: City, Sales COUNT, Sales AVG
Sort Order Not applicable
Conditions Department = Video Sale OR Department = Video Rental
Region = Central
Calendar Year = 2000
Calculation Name Average sales in city with smallest sales volume
Calculation MIN(Sales AVG) KEEP(DENSE_RANK FIRST ORDER BY Sales COUNT) OVER(PARTITION BY "Calendar Year", Region)
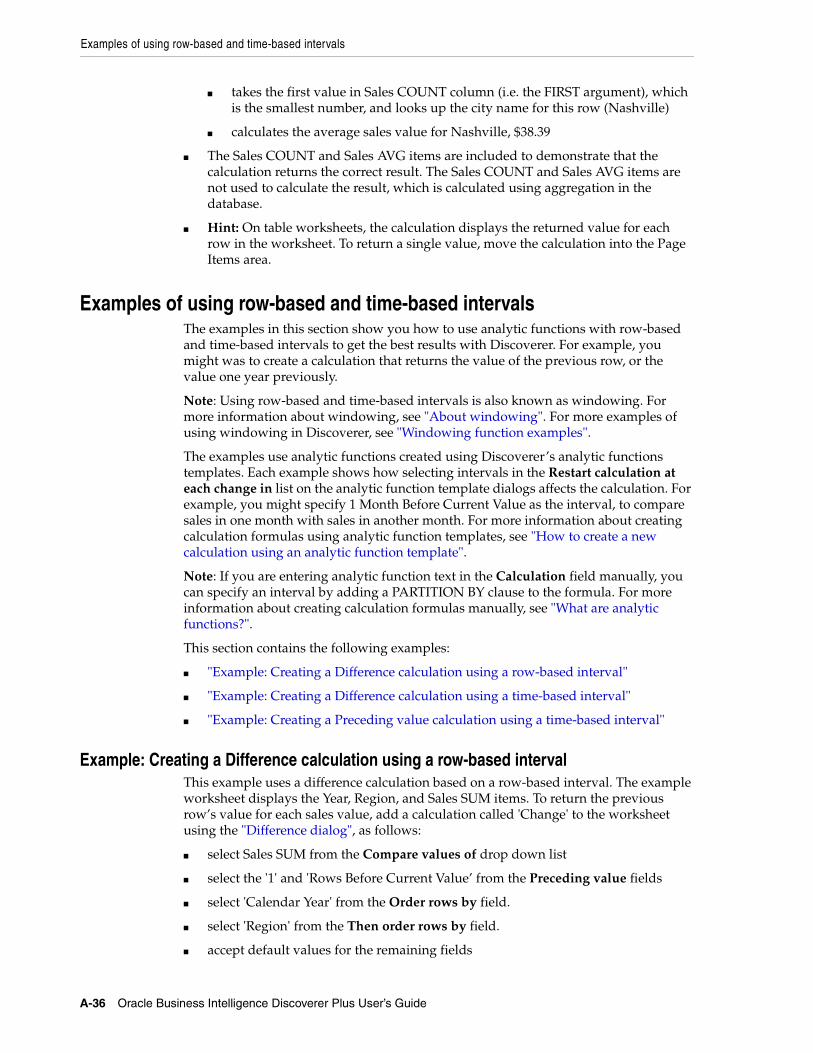
Examples of using row-based and time-based intervals
A-36 Oracle Business Intelligence Discoverer Plus User’s Guide
■ takes the first value in Sales COUNT column (i.e. the FIRST argument), which is the smallest number, and looks up the city name for this row (Nashville)
■ calculates the average sales value for Nashville, $38.39
■ The Sales COUNT and Sales AVG items are included to demonstrate that the calculation returns the correct result. The Sales COUNT and Sales AVG items are not used to calculate the result, which is calculated using aggregation in the database.
■ Hint: On table worksheets, the calculation displays the returned value for each row in the worksheet. To return a single value, move the calculation into the Page Items area.
Examples of using row-based and time-based intervalsThe examples in this section show you how to use analytic functions with row-based and time-based intervals to get the best results with Discoverer. For example, you might was to create a calculation that returns the value of the previous row, or the value one year previously.
Note: Using row-based and time-based intervals is also known as windowing. For more information about windowing, see "About windowing". For more examples of using windowing in Discoverer, see "Windowing function examples".
The examples use analytic functions created using Discoverer’s analytic functions templates. Each example shows how selecting intervals in the Restart calculation at each change in list on the analytic function template dialogs affects the calculation. For example, you might specify 1 Month Before Current Value as the interval, to compare sales in one month with sales in another month. For more information about creating calculation formulas using analytic function templates, see "How to create a new calculation using an analytic function template".
Note: If you are entering analytic function text in the Calculation field manually, you can specify an interval by adding a PARTITION BY clause to the formula. For more information about creating calculation formulas manually, see "What are analytic functions?".
This section contains the following examples:
■ "Example: Creating a Difference calculation using a row-based interval"
■ "Example: Creating a Difference calculation using a time-based interval"
■ "Example: Creating a Preceding value calculation using a time-based interval"
Example: Creating a Difference calculation using a row-based intervalThis example uses a difference calculation based on a row-based interval. The example worksheet displays the Year, Region, and Sales SUM items. To return the previous row’s value for each sales value, add a calculation called 'Change' to the worksheet using the "Difference dialog", as follows:
■ select Sales SUM from the Compare values of drop down list
■ select the '1' and 'Rows Before Current Value’ from the Preceding value fields
■ select 'Calendar Year' from the Order rows by field.
■ select 'Region' from the Then order rows by field.
■ accept default values for the remaining fields
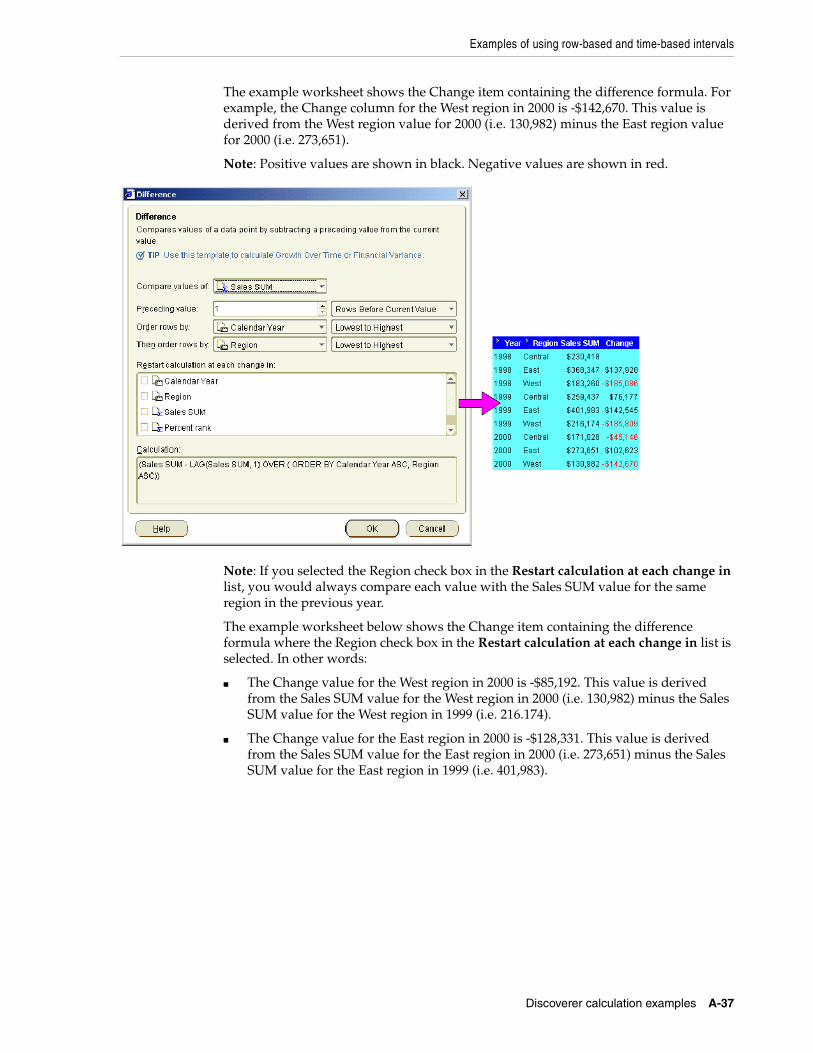
Examples of using row-based and time-based intervals
Discoverer calculation examples A-37
The example worksheet shows the Change item containing the difference formula. For example, the Change column for the West region in 2000 is -$142,670. This value is derived from the West region value for 2000 (i.e. 130,982) minus the East region value for 2000 (i.e. 273,651).
Note: Positive values are shown in black. Negative values are shown in red.
Note: If you selected the Region check box in the Restart calculation at each change in list, you would always compare each value with the Sales SUM value for the same region in the previous year.
The example worksheet below shows the Change item containing the difference formula where the Region check box in the Restart calculation at each change in list is selected. In other words:
■ The Change value for the West region in 2000 is -$85,192. This value is derived from the Sales SUM value for the West region in 2000 (i.e. 130,982) minus the Sales SUM value for the West region in 1999 (i.e. 216.174).
■ The Change value for the East region in 2000 is -$128,331. This value is derived from the Sales SUM value for the East region in 2000 (i.e. 273,651) minus the Sales SUM value for the East region in 1999 (i.e. 401,983).
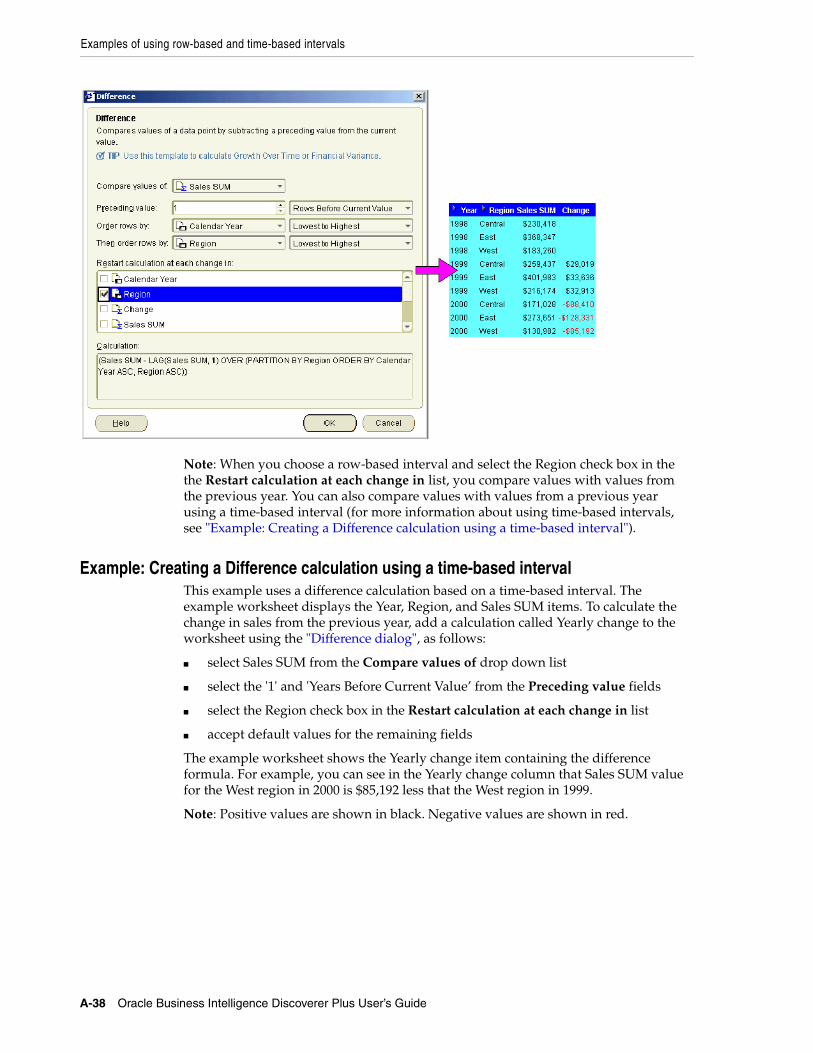
Examples of using row-based and time-based intervals
A-38 Oracle Business Intelligence Discoverer Plus User’s Guide
Note: When you choose a row-based interval and select the Region check box in the the Restart calculation at each change in list, you compare values with values from the previous year. You can also compare values with values from a previous year using a time-based interval (for more information about using time-based intervals, see "Example: Creating a Difference calculation using a time-based interval").
Example: Creating a Difference calculation using a time-based intervalThis example uses a difference calculation based on a time-based interval. The example worksheet displays the Year, Region, and Sales SUM items. To calculate the change in sales from the previous year, add a calculation called Yearly change to the worksheet using the "Difference dialog", as follows:
■ select Sales SUM from the Compare values of drop down list
■ select the '1' and 'Years Before Current Value’ from the Preceding value fields
■ select the Region check box in the Restart calculation at each change in list
■ accept default values for the remaining fields
The example worksheet shows the Yearly change item containing the difference formula. For example, you can see in the Yearly change column that Sales SUM value for the West region in 2000 is $85,192 less that the West region in 1999.
Note: Positive values are shown in black. Negative values are shown in red.
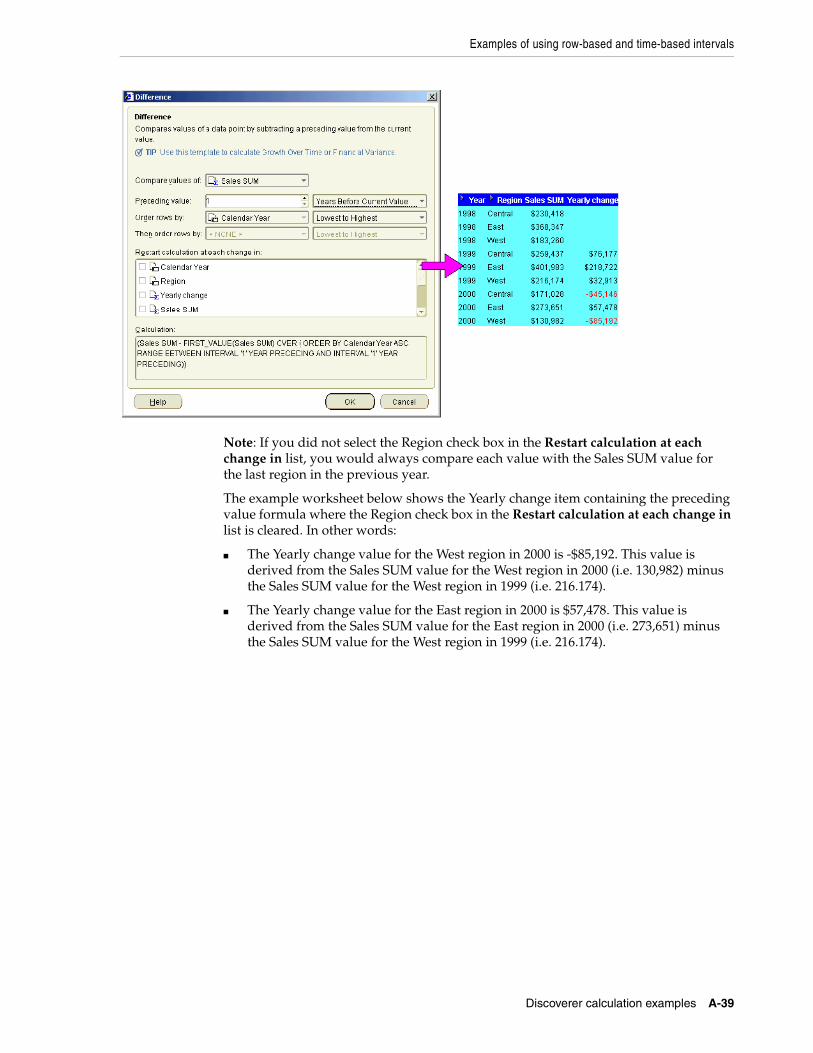
Examples of using row-based and time-based intervals
Discoverer calculation examples A-39
Note: If you did not select the Region check box in the Restart calculation at each change in list, you would always compare each value with the Sales SUM value for the last region in the previous year.
The example worksheet below shows the Yearly change item containing the preceding value formula where the Region check box in the Restart calculation at each change in list is cleared. In other words:
■ The Yearly change value for the West region in 2000 is -$85,192. This value is derived from the Sales SUM value for the West region in 2000 (i.e. 130,982) minus the Sales SUM value for the West region in 1999 (i.e. 216.174).
■ The Yearly change value for the East region in 2000 is $57,478. This value is derived from the Sales SUM value for the East region in 2000 (i.e. 273,651) minus the Sales SUM value for the West region in 1999 (i.e. 216.174).
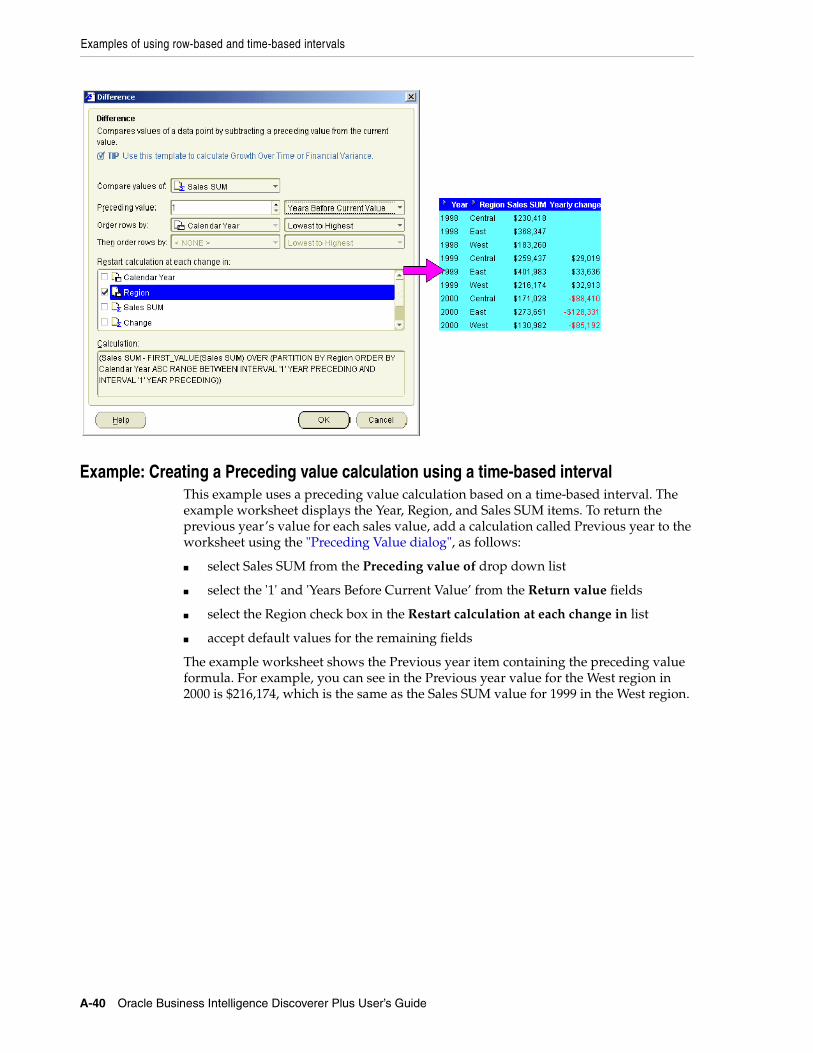
Examples of using row-based and time-based intervals
A-40 Oracle Business Intelligence Discoverer Plus User’s Guide
Example: Creating a Preceding value calculation using a time-based intervalThis example uses a preceding value calculation based on a time-based interval. The example worksheet displays the Year, Region, and Sales SUM items. To return the previous year’s value for each sales value, add a calculation called Previous year to the worksheet using the "Preceding Value dialog", as follows:
■ select Sales SUM from the Preceding value of drop down list
■ select the '1' and 'Years Before Current Value’ from the Return value fields
■ select the Region check box in the Restart calculation at each change in list
■ accept default values for the remaining fields
The example worksheet shows the Previous year item containing the preceding value formula. For example, you can see in the Previous year value for the West region in 2000 is $216,174, which is the same as the Sales SUM value for 1999 in the West region.
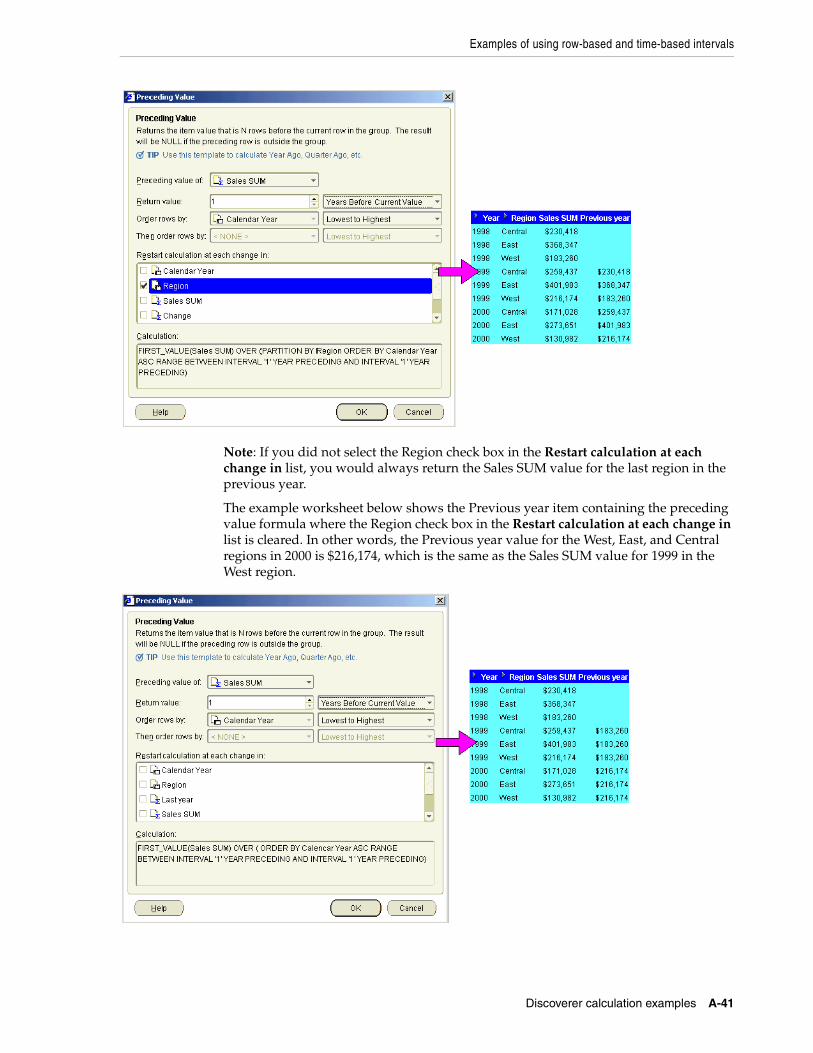
Examples of using row-based and time-based intervals
Discoverer calculation examples A-41
Note: If you did not select the Region check box in the Restart calculation at each change in list, you would always return the Sales SUM value for the last region in the previous year.
The example worksheet below shows the Previous year item containing the preceding value formula where the Region check box in the Restart calculation at each change in list is cleared. In other words, the Previous year value for the West, East, and Central regions in 2000 is $216,174, which is the same as the Sales SUM value for 1999 in the West region.

Examples of using row-based and time-based intervals
A-42 Oracle Business Intelligence Discoverer Plus User’s Guide
Discoverer support for Oracle Applications B-1
BDiscoverer support for Oracle Applications
This appendix contains the following sections:
■ "What are Oracle Applications?"
■ "What features does Discoverer support for Oracle Applications users?"
■ "What are the prerequisites to run Discoverer with Oracle Applications?"
■ "About using indexes and values in parameters"
■ "How to start Discoverer in Oracle Applications mode using an existing connection"
What are Oracle Applications?Oracle Applications are Oracle's integrated enterprise resource planning (ERP) and customer relationship management (CRM) solution. Oracle Applications enable companies to run their entire worldwide operations from a central site. For further information see http://www.oracle.com/.
Note: For more information about Oracle Applications mode End User Layers, see Oracle Business Intelligence Discoverer Administration Guide.
What features does Discoverer support for Oracle Applications users?Discoverer supports the following features for Oracle Applications users:
■ access to Oracle Applications databases using Oracle Applications user names, passwords and responsibilities
■ access to Oracle Applications mode EULs
■ support for Oracle Applications implementations of multiple organizations and multiple reporting currencies
Notes■ Using Discoverer with Oracle Applications multiple organizations support enables
you to work with data from more than one organization. Discoverer end users can query and analyze data from a set of organizations to which they have been granted access. The folders in the EUL you are connecting to must be based on Oracle Business Views (available in Oracle Applications 11i).
■ Using Discoverer with Oracle Applications multiple reporting currencies enables you to work with data in the appropriate currency based on your assigned Applications user ID and responsibility.
What are the prerequisites to run Discoverer with Oracle Applications?
B-2 Oracle Business Intelligence Discoverer Plus User’s Guide
■ Contact the Discoverer manager for more information about using Discoverer with an Oracle Applications database.
What are the prerequisites to run Discoverer with Oracle Applications?To start Discoverer as an Oracle Applications user, the following conditions must be met:
■ one of the following Oracle Applications versions must be installed:
■ Release 10.7 (SmartClient and Character mode)
■ Release 11
■ Release 11i
■ you have created an Applications mode EUL (contact the Discoverer manager for more information about Applications mode EULs)
About using indexes and values in parametersDiscoverer enables you to use the <Index and Value> drop down list to display and select parameter values with numbers from associated indexed items (e.g. (1) January, (2) February) or without numbers (e.g. January, February). Indexed items are set up by the Discoverer manager to improve query performance for specific EUL items, when used as parameters.
The <Index and Value> drop down list enables you to choose whether to enter parameter values as index numbers or values. For example, if you want to enter the value January for a parameter called Month, you could do either of the following:
■ select Index from the <Index and Value> drop down list and enter the index number that represents January (e.g. 1)
■ select Value from the <Index and Value> drop down list and enter the text value that represents January (e.g. January)
Either of the above values will produce the same result in the worksheet.
How to start Discoverer in Oracle Applications mode using an existing connection
Before you can start Discoverer as an Oracle Applications user, certain conditions must be met (for more information, see "What are the prerequisites to run Discoverer with Oracle Applications?").
To start Discoverer in Oracle Applications mode using an existing connection:
1. Display the Discoverer Viewer connections page (for more information, see "How to display the Discoverer Plus connections page").
2. Select the name of a connection name in the Connection column to start Discoverer.
Hint: To confirm that you are using the correct login, click Show in the Details column to display more information about a login. To hide additional information, click Hide.
Discoverer starts and displays the "Workbook Wizard: Create/Open Workbook dialog".
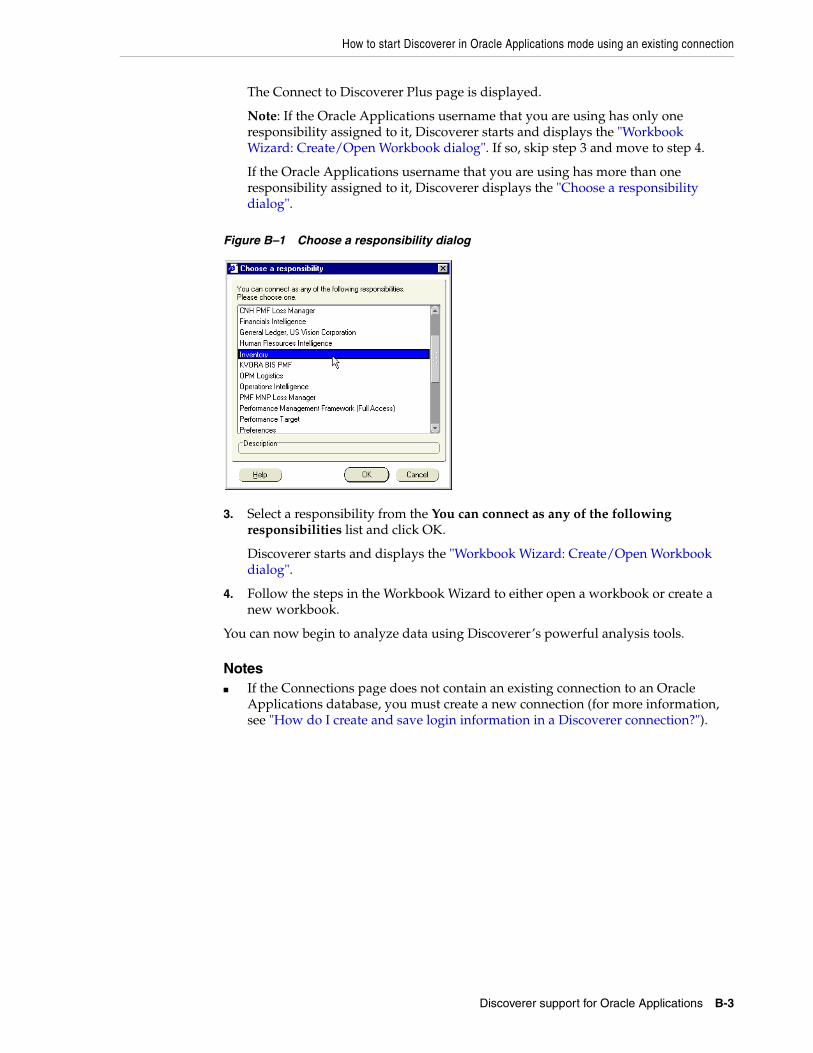
How to start Discoverer in Oracle Applications mode using an existing connection
Discoverer support for Oracle Applications B-3
The Connect to Discoverer Plus page is displayed.
Note: If the Oracle Applications username that you are using has only one responsibility assigned to it, Discoverer starts and displays the "Workbook Wizard: Create/Open Workbook dialog". If so, skip step 3 and move to step 4.
If the Oracle Applications username that you are using has more than one responsibility assigned to it, Discoverer displays the "Choose a responsibility dialog".
Figure B–1 Choose a responsibility dialog
3. Select a responsibility from the You can connect as any of the following responsibilities list and click OK.
Discoverer starts and displays the "Workbook Wizard: Create/Open Workbook dialog".
4. Follow the steps in the Workbook Wizard to either open a workbook or create a new workbook.
You can now begin to analyze data using Discoverer’s powerful analysis tools.
Notes■ If the Connections page does not contain an existing connection to an Oracle
Applications database, you must create a new connection (for more information, see "How do I create and save login information in a Discoverer connection?").

How to start Discoverer in Oracle Applications mode using an existing connection
B-4 Oracle Business Intelligence Discoverer Plus User’s Guide
Glossary-1
Glossary
Analytic functions
Analytic functions compute an aggregate value based on a group of rows. The group of rows is called a window and is defined by the analytic clause. Analytic functions differ from aggregate functions in that they return one value for each row. For example, if you create a ranking function, you create a rank value for each row.
For more information about Oracle9i functions, refer to Oracle9i SQL Reference or Oracle9i Data Warehousing Guide.
Business area
A business area is a collection of related information in the database. The Discoverer manager works with the different departments in your organization to identify the information that each department requires from the database.
Calculation
Calculations are worksheet items based on formulas or expressions (e.g. mathematical formulas, text handling functions, analytic functions).
Condition
Conditions are worksheet items that enable you to select what data to display on worksheets. Conditions filter out data that you are not interested in, enabling you to concentrate on data that you want to analyze. For example, you might use a condition to display only data for the month January.
Item
Items are different types of information stored in a folder. For example, if a Products folder contains reference numbers, descriptions, and the price of each product, the items in the Products folder are reference number, description, and price.
List of values
A List of values (LOV) is a list of valid values for an item. For example, a LOV for a year item might contain the values 1998, 1999, and 2000.
Page Item
A page item is a filtering item located above a worksheet in the Page Items area. Page items enable you to look at one area of information at a time. For example, if an item called Month is placed in the Page Items area, you might select January from the page item drop down list to produce a January report, then select February to produce a February report and so on.
Glossary-2
Parameter
Parameters are workbook items that enable Discoverer end users to specify dynamic input values that are used to analyze worksheets. Input values are typically used to:
■ provide input to conditions that are used to filter worksheets - for example, when a workbook or worksheet is opened or refreshed, the parameter is used to first ask the worksheet user 'What month do you want to analyze?'. A worksheet user can choose to look at data for the month of January only.
■ provide input to calculations - for example, a worksheet user can enter the value '3' when prompted, which is then used to divide data into three bands using a predefined calculation containing a banding function
Query
A query is a question that Discoverer asks the database in order to get the data that you want to analyze.
Every time you open a worksheet or create a new worksheet, Discoverer sends a query to your company's database. For example, how did Product A sell last month?
Note: Queries are written in Structured Query Language (SQL), a language that databases understand. You do not need to understand SQL to communicate with the database - Discoverer writes the SQL query for you!
Workbook
Workbooks are Discoverer files that contain worksheets displaying data retrieved from the database.
If you are familiar with spreadsheet applications (e.g. Microsoft Excel), think of a workbook as a spreadsheet file.
Worksheet
Worksheets contain the data that you want to analyze, together with a number of Discoverer components to help you analyze the data. For example, a worksheet can contain parameters, totals, percentages, exceptions, and calculations.
If you are familiar with spreadsheet applications (e.g. Microsoft Excel), think of a workbook as a spreadsheet file and worksheets as different sheets in that spreadsheet file.
Index-1
Index
Symbols% values as decimal, 23-38, 23-122
Numerics80-20 analysis, 23-171
Aabout Discoverer Plus Relational, 2-1advanced options, 22-22
automatic querying, 22-22fan traps, 22-22
aggregation for multidimensional data, 3-6analytic function examples, A-4analytic function templates
Band by Rank, 23-11Band by Value, 23-12Difference, 23-28Following Value, 23-95Group Total, 23-106Moving Total, 23-114Percent Contribution, 23-166Percent Difference, 23-167Percent Rank, 23-169Percent Running Contribution, 23-171Preceding Value, 23-172quartiles, 23-11Rank, 23-177, 23-179Running Total, 23-180
analytic functions, 17-3about, 17-3and sequencing, A-27applying conditions, A-27banding, A-9, A-31, A-32banding using CASE statement, A-12banding using GREATEST(), A-11banding with WIDTH_BUCKET, A-32categories, A-5creating using templates, 17-3, 17-8examples of sequencing, A-27FIRST/LAST, A-33how to create, 17-3hypothetical rank, A-30, A-31inverse percentile, A-28
LAG(), A-21, A-23LAG/LEAD, A-21linear regression, A-26MAX(), A-34MIN(), A-35PERCENTILE_CONT(), A-30PERCENTILE_DISC(), A-29RANK(), A-6, A-7, A-8, A-24ranking, A-6reporting, A-17reporting using RATIO_TO_REPORT(), A-20reporting using SUM(), A-17, A-18, A-19sequencing examples, A-27statistical functions, A-25templates available, 17-3using templates with parameters, 17-8windowing, A-14windowing using AVG(), A-15windowing using SUM(), A-16
attributes, 3-6automatic querying, 22-22axis items
about, 5-8
Bbanding, 23-12business areas
about, 2-4
Ccalculations
about, 17-1concatenated items, 17-2creating, 17-5deleting, 17-13displaying and hiding, 17-4editing, 17-11examples, 17-14mathematical, A-3providing dynamic input to, A-1removing carriage returns, 17-2ROWCOUNT, A-2UPPER, A-3using, 17-2
Index-2
carriage returns in calculations, 17-2CASE statements, A-1, A-10Catalog, Discoverer, 3-7column width, 7-1, 23-20concatenated items, 17-2Conditional formatting, 2-9conditions
about, 13-1and aggregates, 13-12and roll-up values, 13-12applying more than one, 13-3applying to roll-ups, 13-12creating multiple, 13-7creating nested, 13-9creating single, 13-5deleting, 13-11editing, 13-10examples, 13-13IF statements, A-10multiple conditions, 13-2nested conditions, 13-2on Percent Rank or Percentage Contribution
calculations, 23-38, 23-122order of application with analytic functions, A-27turning on, 13-3using, 13-3
connectionsabout (see Discoverer connections), 4-1
crosstab worksheets, 6-4cubes in multidimensional data sources, 3-3cumulative distribution, 23-169currency symbol
how to set, 7-9
Ddata points
about, 5-9database
sample, 2-8database accounts
about, 4-6DECODE, A-1, A-10default worksheet format, 22-21deleting
workbooks, 6-10worksheets, 6-15
designing workbooks, 6-4dimensions
attributes, 3-6defined, 3-5filters, 3-7hierarchies, 3-5
Discovererchanging passwords, 4-9getting data, 1-3how to change passwords, 4-10how to exit, 4-5how to start, 4-2how to start using a connection, 4-3
workflow, 1-3Discoverer Catalog, 3-7Discoverer connection
user defined, 4-9Discoverer connections
about, 4-1about public, 4-9changing EULs, 4-10creating, 4-6deleting, 4-9editing, 4-8private, 4-9
Discoverer Gauge portletadding, 21-15
Discoverer List of Worksheets portletadding, 21-13
Discoverer managerabout the, 1-6
Discoverer Plus Relationalabout, 2-1menus, 5-4new features in release 10.1.2, 2-9sample database, 2-8toolbars, 5-5
Discoverer Portlet ProviderGauges portlet, 21-5List of Worksheets portlet, 21-4types, 21-3using, 21-13, 21-14, 21-15Worksheet portlet, 21-4
Discoverer Viewercustomizing worksheets, 21-18
Discoverer work areaabout, 5-1
Discoverer Worksheet portletadding, 21-14
div/0 error, 23-34, 23-118divide by zero error, 23-34, 23-118Drill dialog, 23-30drill hierarchies
about, 10-2default, 10-2multiple, 10-2
drill linksabout, 10-12, 10-13creating, 10-16, 10-18defined by Discoverer manager, 10-14types, 10-12using, 10-15, 10-20
drill out, 10-14drilling
about, 10-1drill hierarchies, 10-2how to drill in graphs, 10-5how to drill to detail, 10-11how to drill up and down, 10-3out, 10-14to detail, 10-10to related items, 10-7, 10-8with drill links, 10-13
Index-3
EEnhanced interactivity, 2-9examples of analytic functions, A-4Excel
exporting to, 19-3row limits, 19-3support for export to, 19-3
execution plans, 22-26exiting Discoverer
how to exit, 4-5export to PDF
paper size, 23-85exporting
about, 19-1accessing exported files, 19-6and page items, 19-6how to export data, 19-6to Microsoft Excel, 19-3to Oracle Reports, 19-2worksheets and graphs, 19-5
Ffan traps, 22-22filtering parameter LOVs by associating conditions
with a parameter, 11-3filters for aggregation, 3-6Find dialog
using to find worksheet data, 6-16finding worksheet data, 6-16folders
about, 2-5frequency distribution, A-10frequency distribution analysis, 23-12functions
analytic function examples, A-4
GGauges portlet, 21-3graphs
about, 8-1adding reference lines, 23-51, 23-53components, 8-4creating, 8-10creating bubble graphs, 8-6creating dual-Y charts, 8-8creating hi-low-close stock charts, 8-7creating pie graphs, 8-9drilling in, 10-5editing, 8-15positioning, 8-16reference lines, 8-4, 23-179sub-types, 8-5types available, 8-5using, 8-2
Hheadings
changing, 7-12help system
about, 2-10, 3-8hierarchies, 3-5hierarchy
drill hierarchies, 10-2
Iidentifiers
editing worksheet properties, 6-23in workbook properties, 6-21
IF statements, A-1IF statements in conditions, A-10item headings
changing the format, 7-12items
about, 2-7
LLetter paper size, 23-85List of worksheets portlet, 21-3LOVs
about, 22-14examples, 22-14selecting multiple values, 22-18selecting single values, 22-16using long LOVs, 22-16
MManage Links dialog, 23-110maximizing Discoverer performance, 6-4measures, 3-4median, A-29
calculating the, A-29medians
calculating, A-28migration
Discoverer 4i totals, 14-4, 14-5multidimensional data sources, 3-2
aggregation, 3-6attributes, 3-6cubes, 3-3dimensions, 3-5filters, 3-7hierarchies, 3-5measures, 3-4
multiple join paths, 22-24
NNative support of the database OLAP option, 2-9new features, 2-9New Link dialog, 23-125non-Oracle databases, 6-7
OOLAP
Index-4
why use, 3-2online analytic processing
defined, 3-2ORA-01858 error message, 23-57Oracle Applications
about, B-1Discoverer support for, B-1how to start Discoverer using, B-2prerequisites, B-2
Oracle Reportsopening XML files, 19-2
OracleAS Portalabout, 21-1adding a Gauge Portlet, 21-15adding a List of Worksheets Portlet, 21-13adding a Worksheet Portlet, 21-14Discoverer Gauges portlet, 21-5Discoverer List of Worksheets portlet, 21-4Discoverer portlet types available, 21-3Discoverer Worksheet portlet, 21-4portlet types available, 21-3what you need, 21-6
PPage Setup options, 18-3
for graphs, 18-5parameters
about filtering parameter LOVs by specifying associated conditions, 11-3
creating, 11-8deleting, 11-10entering reserved words, 23-59examples, 11-11mapping to Discoverer Portlet parameters, 21-19
Parameters dialog, 23-164Pareto analysis, 23-171password
changing, 4-9PDF export
paper size, 23-85Percent Rank
and conditions, 23-38, 23-122Percentage Contribution
and conditions, 23-38, 23-122percentage values as decimal, 23-38, 23-122percentages
about, 15-1creating, 15-3deleting, 15-6displaying and hiding, 15-2editing, 15-5examples, 15-7
percentile analysis, A-10performance
maximizing Discoverer, 6-4worksheet design, 6-4
pivotingabout, 9-1on crosstab worksheets, 9-3
unexpected results, 9-6portlet parameters, 21-19portlets
about Gauges portlet, 21-5about List of Worksheets portlet, 21-4about Worksheet portlet, 21-4customizing, 21-17customizing in Discoverer Viewer, 21-18editing, 21-16Gauges, 21-15List of Worksheets, 21-13Worksheet, 21-14
printinghow to print, 18-10, 18-12output options, 18-9Page Setup options, 18-3PDF format, 18-14print dialog, 18-9scaling, 18-9worksheet and graph on same page, 8-4, 18-1worksheet elements, 18-2
private connections, 4-9
Qquartiles, A-10
creating, 23-11queries
OLAP, 3-2
Rreference lines, 23-179relational data sources, 2-2reserved word
enter in parameter field, 23-59TODAY, 23-57
Ssample database, 2-8scheduled workbooks
about, 22-1, 22-3accessing results, 22-4copying, 22-9creating, 22-5editing, 22-8how to delete results, 22-12how to schedule workbooks, 22-5how to unschedule, 22-11processing, 22-5sharing, 20-3when to use, 22-3
sharing workbooksabout, 20-1, 20-3with a single user, 20-5with multiple users, 20-3
Single Sign-onabout, 4-11passwords and Discoverer passwords, 4-11
Single Sign-On support for Virtual Private
Index-5
Databases, 2-10sorting
about, 16-1about group sorting, 16-3changing sort item, 16-6examples, 16-7on crosstab worksheets, 16-2, 16-5on table worksheets, 16-2, 16-4removing, 16-7
SQLabout, 22-25and execution plans, 22-26and summaries, 22-25and summary folders, 22-25how to view, 22-26how to view an execution plan, 22-27using, 22-25
starting Discovererdirectly, 4-4how to start, 4-2, 4-3
symbolsetting the currency symbol, 7-9
Ttable worksheets, 6-4templates
for analytic functions, 17-3using, 17-8
titleabout editing worksheet title, 6-12worksheet, 23-64, 23-66
TODAY reserved word, 23-57totals
about SUM and Cell SUM, 14-2Cell SUM, 14-2creating, 14-6deleting, 14-10displaying and hiding, 14-5editing, 14-9examples, 14-11migrating totals to OracleBI, 14-4migrating totals to OracleBI Discoverer, 14-5migration from Discoverer 4i, 14-4, 14-5on crosstab worksheets, 14-2SUM, 14-2when to use Cell SUM, 14-3when to use SUM, 14-3
Uuser defined connection, 4-9
Wwork area, 5-1
drag and drop features, 5-3menus, 5-4tool tips, 5-7toolbars, 5-5
workbook properties, 6-21
workbooksabout, 6-2adding new worksheets, 6-21creating, 6-17deleting from database, 6-10designing for maximum performance, 6-4editing, 6-8non-Oracle databases, 6-7opening, 6-5renaming, 6-14reordering, 6-14saving, 6-8, 6-10viewing properties, 6-21
worksheet datafinding, 6-16
Worksheet portlet, 21-3worksheet properties
about, 6-22editing, 6-23view identifier, 6-23
worksheet settingsabout, 22-19changing, 22-19how to change, 22-20reverting to default, 22-21
worksheet textcreating, 6-12
worksheet titleabout editing, 6-12text limit, 23-64, 23-66text variables, 23-64, 23-66
worksheet wizardabout, 5-9
worksheetsabout, 6-3about table, 6-4adding items, 7-3, 7-4changing the format, 7-7, 7-11crosstab, 6-4default format, 22-21deleting, 6-15designing for maximum performance, 6-4duplicating, 7-6editing, 7-1, 7-2performance, 6-4refreshing, 6-15removing items, 7-5renaming, 6-14reordering, 6-14types of, 6-4

Index-6


