29
Oracle Database 10g GeoRaster: Scalability and Performance Analysis An Oracle Technical White Paper August 2005

Oracle Database 10g GeoRaster: Scalability and Performance Analysis
An Oracle Technical White PaperAugust 2005
Oracle Database 10g GeoRaster: Scalability and Performance Analysis
1 Introduction.................................................................................................... 42 The technology and products used in the test .......................................... 4
2.1 Oracle Spatial GeoRaster....................................................................... 42.2 Oracle Database 10g and RAC ............................................................ 52.3 Oracle Application Server 10g and OC4J........................................... 52.4 MapViewer............................................................................................... 52.5 Web Cache Load Balancer.................................................................... 52.6 Asianux .................................................................................................... 52.7 NetApp Storage R200............................................................................ 62.8 Others....................................................................................................... 6
3 The test dataset............................................................................................... 64 Loading raster data......................................................................................... 7
4.1 Test environment.................................................................................... 74.2 Test results .............................................................................................. 7
4.2.1 Loading images................................................................................ 74.2.2 Analysis............................................................................................. 8
5 Creating a huge GeoRaster object............................................................... 95.1 Test environment and workflow.......................................................... 9
5.1.1 Database configuration.................................................................. 95.1.2 Testing flow .................................................................................. 10
5.2 Test results ............................................................................................ 115.2.1 Creating a huge image.................................................................. 115.2.1 Analysis........................................................................................... 11
6 Testing the GeoRaster tuning procedure.................................................. 126.1 Test environment.................................................................................. 126.2 Test approach........................................................................................ 126.3 Test results............................................................................................. 13
6.3.1 Changing GeoRaster block sizes................................................ 136.3.2 Analysis........................................................................................... 13
7 Testing the GeoRaster cell data query procedure.................................... 147.1 Test environment.................................................................................. 147.2 Test design............................................................................................. 147.3 Test results and analysis....................................................................... 15
7.3.1 Total concurrent requests and the average response time...... 157.3.2 Tuning the physical storage and database cache size............... 167.3.3 Testing single requests on one RAC node................................ 17
8 Concurrency test in a grid enviorment with one RAC node..................188.1 Test environment.................................................................................. 188.2 Test data and test design...................................................................... 188.3 Test results and analysis....................................................................... 21
8.3.1 Query concurrency on different GeoRaster objects................ 21
Oracle Database 10g GeoRaster: Scalability and Performance Analysis Page 2
8.3.2 Tuning OC4J instances to improve concurrency..................... 228.3.3 Configuring OC4J instances to improve concurrency.............228.3.4 Query concurrency on different window sizes......................... 24
9 Concurrency test in a grid environment with two RAC nodes............. 249.1 Test environment.................................................................................. 249.2 Test data and design............................................................................. 249.3 Test results and analysis ...................................................................... 25
9.3.1 Adding RAC nodes to improve the query scalability ............. 259.3.2 Adding RAC nodes to improve the query performance......... 269.3.3 Tuning the grid to improve the scalability and performance 27
10 Summary...................................................................................................... 28
Oracle Database 10g GeoRaster: Scalability and Performance Analysis Page 3
Oracle Database 10g GeoRaster: Scalability and Performance Analysis
1 INTRODUCTIONGeoRaster is a new feature of Oracle Spatial in Oracle Database 10g. It allows users to store, index, query, analyze, and deliver GeoRaster data, that is, image and gridded data and its associated metadata. GeoRaster provides Oracle Spatial data types and an object-relational schema. It is designed to deliver enterprise-class data management capability to large image and gridded data processing solutions.
One of the major characteristics of raster data is the huge size and large volume. One of the major challenges facing large-scale raster data management systems is the performance and scalability, including concurrent multi-user support. The GeoRaster feature of Oracle database 10g is designed to allow users to build huge raster databases in the scale of petabytes and provide strong scalability and good performance. We conducted a series of tests using the Oracle 10g grid computing technology. This paper is a summarization of this test and provides information about:
Using GeoRaster under a simple grid environment, which contains two RAC database nodes, five 10gAS (OC4J) instances and the Network Appliance NearStore R200.
Test results of loading GeoRaster data, creating a single GeoRaster object in size of over one terrabytes, querying GeoRaster data using the getRasterSubset procedure and changing the internal GeoRaster storage formats using the changeFormatCopy procedure, concurrent multi-user query and tuning.
Some scalability and performance characteristics of Oracle Spatial GeoRaster 10g Release 1.
2 THE TECHNOLOGY AND PRODUCTS USED IN THE TEST
2.1 Oracle Spatial GeoRasterThe test is targeted at the Spatial GeoRaster feature in Oracle Database 10g Release 1. This is also the first version of GeoRaster.
Oracle Database 10g GeoRaster: Scalability and Performance Analysis Page 4
2.2 Oracle Database 10g and RAC The test is based on Oracle Database 10g Release 1.
Oracle Real Application Clusters (RAC) is an Oracle database option that permits two or more database instances to support and manage the workload of a single Oracle database. Oracle RAC 10g serves as a key foundation technology for enterprise grids where each database instance represents a node and workloads are being shared across all the nodes within the grid.
In the test, we used two RAC nodes as the database grid. The two RAC nodes were installed on Asianux (see 2.6 for more information about Asianux).
2.3 Oracle Application Server 10g and OC4JIn the middle tier we used Oracle Application Server 10g Release 1 for concurrency test on single RAC node and used Oracle Application Server 10g Release 2 for concurrency test on two RAC nodes.
OC4J is Oracle Application Server Containers for J2EE. It is a fast, lightweight, highly scalable, and easy-to-use J2EE environment. It is highly optimized, providing extremely fast response times and very high throughput rates. Oracle 10g application server serves as a key foundation technology for enterprise grids.
In the test, we used 2 to 5 OC4J instances distributed on two servers as the Oracle 10g AS grid.
2.4 MapViewerOracle AS MapViewer provides powerful geospatial data visualization and reporting services, which basically is a Java servlet that runs inside OC4J. Once up and running, it acts as a map server that awaits user’s map request through HTTP, and sends back a map response after processing and generating a map. MapViewer supports display of GeoRaster objects.
Our test was based on MapViewer 10.1.2 preview version.
2.5 Web Cache Load BalancerThe Oracle 10g AS Web Cache is an integrated component of Oracle's application server infrastructure. It was used to distribute requests over original OC4J servers without caching any responses. It balances the load among original OC4J servers.
2.6 Asianux Asianux is a Linux server operating system, which is widely used in Asia. It provides enterprise customers with high reliability, scalability, manageability and better hardware & software compatibility.
In the test, the 10g database RAC nodes were installed on Asianux 1.0 Service Pack 1. The primary OC4J server was installed on Asianux 1.0.
Oracle Database 10g GeoRaster: Scalability and Performance Analysis Page 5
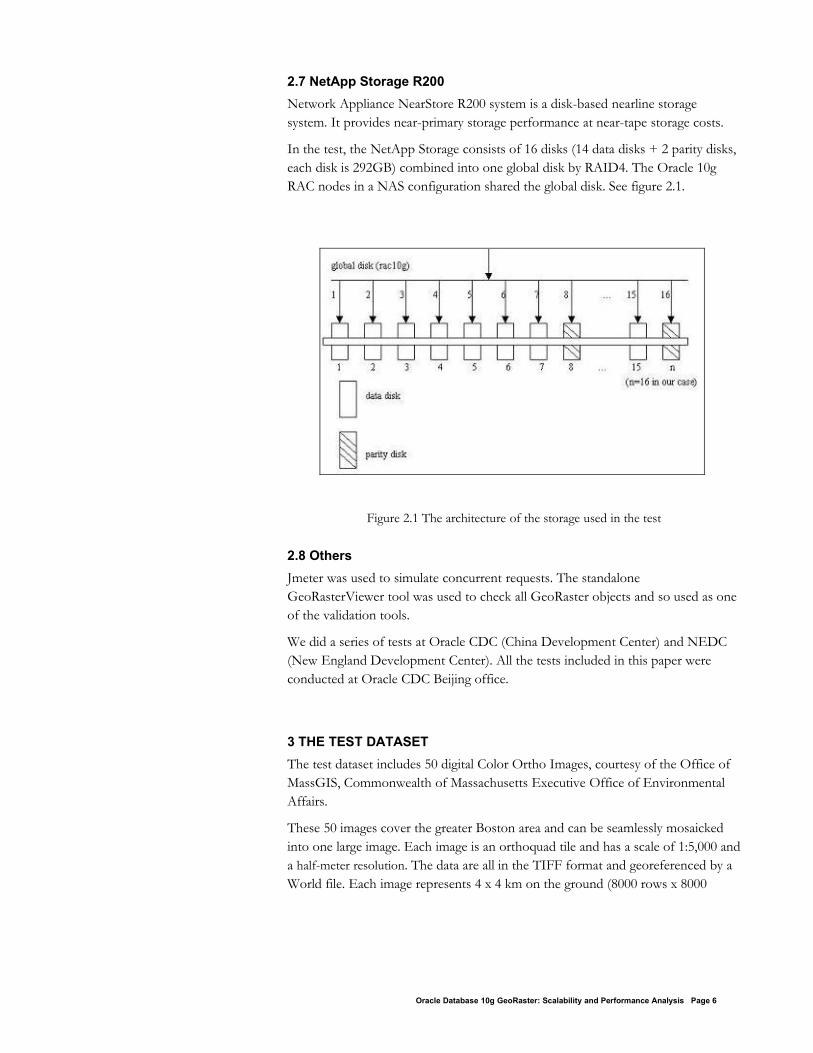
2.7 NetApp Storage R200Network Appliance NearStore R200 system is a disk-based nearline storage system. It provides near-primary storage performance at near-tape storage costs.
In the test, the NetApp Storage consists of 16 disks (14 data disks + 2 parity disks, each disk is 292GB) combined into one global disk by RAID4. The Oracle 10g RAC nodes in a NAS configuration shared the global disk. See figure 2.1.
Figure 2.1 The architecture of the storage used in the test
2.8 OthersJmeter was used to simulate concurrent requests. The standalone GeoRasterViewer tool was used to check all GeoRaster objects and so used as one of the validation tools.
We did a series of tests at Oracle CDC (China Development Center) and NEDC (New England Development Center). All the tests included in this paper were conducted at Oracle CDC Beijing office.
3 THE TEST DATASETThe test dataset includes 50 digital Color Ortho Images, courtesy of the Office of MassGIS, Commonwealth of Massachusetts Executive Office of Environmental Affairs.
These 50 images cover the greater Boston area and can be seamlessly mosaicked into one large image. Each image is an orthoquad tile and has a scale of 1:5,000 and a half-meter resolution. The data are all in the TIFF format and georeferenced by a World file. Each image represents 4 x 4 km on the ground (8000 rows x 8000
Oracle Database 10g GeoRaster: Scalability and Performance Analysis Page 6
columns, equaling 64,000,000 pixels). Since each image is a true color image, they all have three bands and the cell depth is 8-bit unsigned integer. Each one is approximately 192,000,000 bytes (183 Megabytes) in size. Inside the TIFF image files, the images are all blocked into strips and each strip has only one row of pixels. All images are georeferenced to Massachusetts State Plane (Lambert Conformal Conic Projection) NAD83 denominated in meters.
4 LOADING RASTER DATAThe GeoRasterLoader is a standalone tool provided by Oracle to load raster data files into Oracle database and store them as GeoRaster objects. It can be run from the command line with a thin JDBC connection. As the GeoRasterLoader is a java loader, tuning JVM can improve loading performance. The intention of this test is to load the 50 images into a GeoRaster database for the tests hereafter and to show how JVM tuning can affect the loading speed.
In the test, we load each of the 50 images into one GeoRaster object. In order to facilitate efficient storage and fast retrieval of large images, the images can be tiled into smaller blocks. You can use different block sizes to store images and change their storage format from one block size to another, which is called “reblocking”.
4.1 Test environmentThe test was done on a Linux server, which has 4x 1G RAM, 4x 2.4GHz CPU, and 1x 72G internal hard disk. The OS is Asianux 1.0 Service Pack 1.
Storage: NetApp R200
Database: Oracle Database 10g Release 1.
4.2 Test results
4.2.1 Loading images
We used the standalone GeoRasterLoader to load the 50 images. They were loaded into the database sequentially.
One test we have done is to compare loading speed by changing the JVM parameter –Xms. The -Xms sets the initial Java heap size while the –Xmx sets the maximum Java heap size. Typically the larger the –Xmx size, the better. With a fixed –Xmx size, the –Xms parameter can be used to adjust the initial Java heap size, which in turn affects the speed of loading. Taking one of the 50 images as one example, different reblocking cases were tested.
In this test, the –Xmx parameter was set to the same value, 512M, two cases with different -Xms values were tested: (1) The JVM parameter –Xms was set to 512M. (2) The –Xms parameter was not set, which means it was set to be 2M by default.
Oracle Database 10g GeoRaster: Scalability and Performance Analysis Page 7
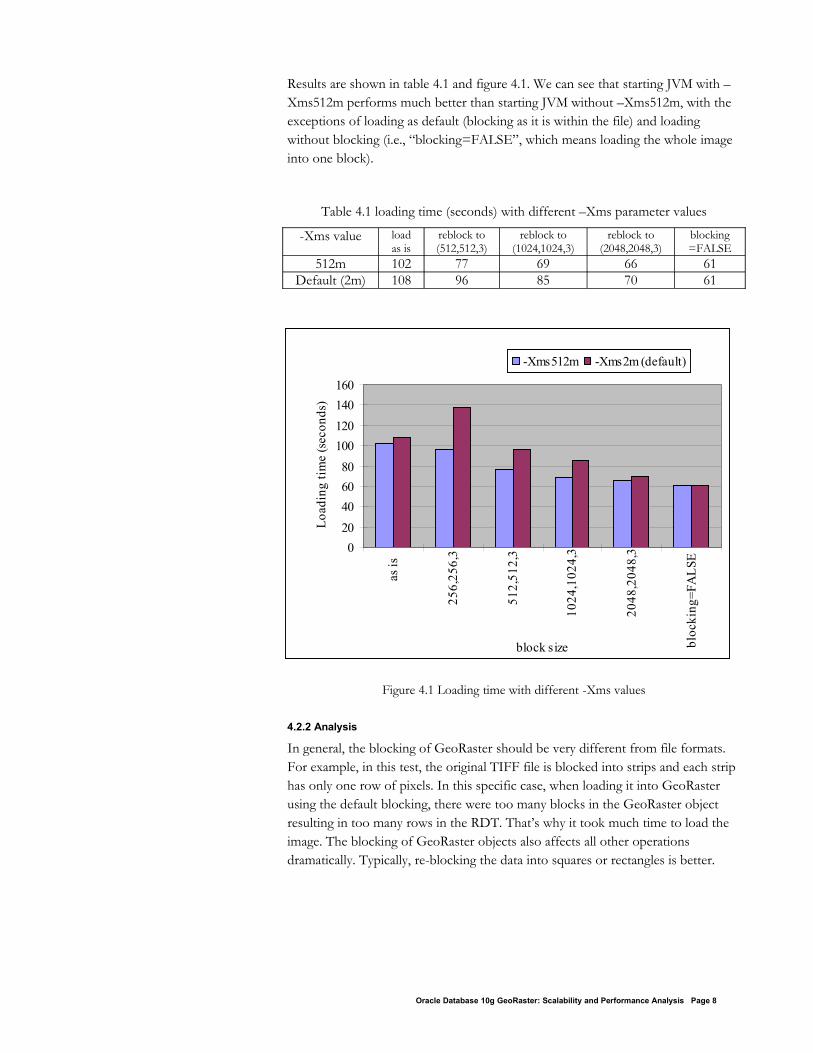
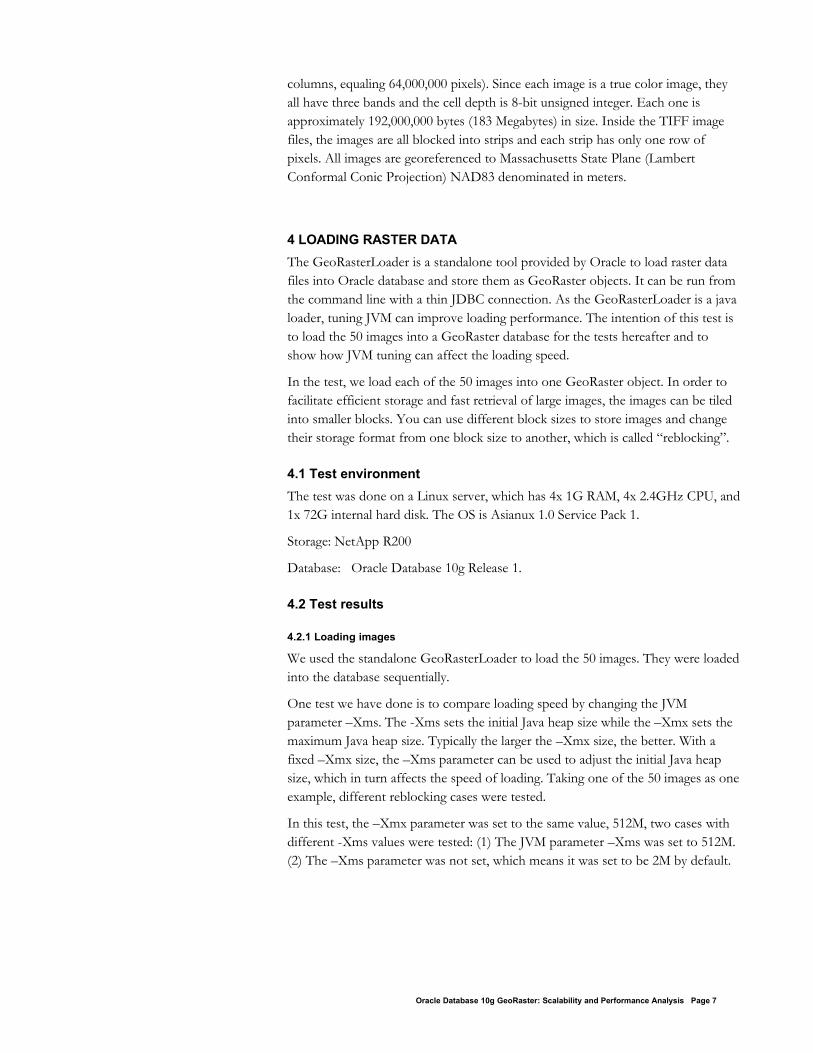
Results are shown in table 4.1 and figure 4.1. We can see that starting JVM with –Xms512m performs much better than starting JVM without –Xms512m, with the exceptions of loading as default (blocking as it is within the file) and loading without blocking (i.e., “blocking=FALSE”, which means loading the whole image into one block).
Table 4.1 loading time (seconds) with different –Xms parameter values
-Xms value loadas is
reblock to (512,512,3)
reblock to (1024,1024,3)
reblock to (2048,2048,3)
blocking=FALSE
512m 102 77 69 66 61Default (2m) 108 96 85 70 61
Figure 4.1 Loading time with different -Xms values
4.2.2 Analysis
In general, the blocking of GeoRaster should be very different from file formats. For example, in this test, the original TIFF file is blocked into strips and each strip has only one row of pixels. In this specific case, when loading it into GeoRaster using the default blocking, there were too many blocks in the GeoRaster object resulting in too many rows in the RDT. That’s why it took much time to load the image. The blocking of GeoRaster objects also affects all other operations dramatically. Typically, re-blocking the data into squares or rectangles is better.
Oracle Database 10g GeoRaster: Scalability and Performance Analysis Page 8
020406080
100120140160
as is
256,
256,
3
512,
512,
3
1024
,102
4,3
2048
,204
8,3
bloc
king
=FA
LSE
block size
Load
ing
time
(sec
onds
)
-Xms512m -Xms2m (default)
When loading data with other reblocking sizes, increasing the value of the –Xms parameter to a larger number like 512m may improve the performance of the loader. For most applications, the row and column block sizes should be equal to or larger than 512. For concurrent raster data loading and how it would affect loading performance, see section 5.
5 CREATING A HUGE GEORASTER OBJECTThe goal of this test is to create a huge GeoRaster object and test the GeoRaster functions and procedures on such a GeoRaster object. In this test, a huge GeoRaster object (a true color image) with the size of 1.16TB was created using GeoRaster procedures. The pyramids of the object were also generated. Including the pyramids, the total size of this GeoRaster object is about 1.5 terrabytes.
5.1 Test environment and workflowThe test was done on two Linux servers.
Server one: 4x 1G RAM, 4x 2.4GHz CPU, 1x 72G internal hard disk. The OS is Asianux 1.0 Service Pack 1, served as the first RAC node.
Server two: 4x 1G RAM, 4x 2.4GHz CPU, 1x 72G internal hard disk. The OS is Asianux 1.0 Service Pack 1, served as the second RAC node.
Storage: NetApp R200
Database: Oracle Database 10g Release 1.
5.1.1 Database configuration
When dealing with huge data set, certain techniques, as explained in the Oracle performance tuning manual, should be followed. Specifically, the following settings and configurations were used to generate the huge GeoRaster object:
1. Set db_cache_size to an appropriate value (192M in this case)
The db_cache_size initialization parameter determines the size of cache buffer in SGA. This parameter can be tuned manually or automatically (with automatic shared memory management). Sometimes it might be important to increase the buffer cache size for the source object. Automatic shared memory management eliminates the need to manually tune the buffer cache parameter and so is recommended for GeoRaster. The related Oracle guidance should be followed.
2. Set undo_management to 'AUTO'
The UNDO_MANAGEMENT initialization parameter determines whether a database instance starts up in automatic undo management mode. This is the default configuration and is always recommended for any GeoRaster operations.
Oracle Database 10g GeoRaster: Scalability and Performance Analysis Page 9
3. Set undo_retention to 0
After the tests, this parameter should be set back to normal, otherwise this setting will affect other transactions negatively. A better alternative is to set "PCTVERSION=0" for the RDT.
4. Use tablespace with 16K database block size and setdb_16k_cache_size=16M
The db_16k_cache_size initialization parameter determines the size of 16K buffer cache. This parameter is needed when tablespace with nonstandard database block size is created.
5. Use 32K chunk size for the rasterBlock storage
CHUNK is a parameter of LOB storage whose default value is controlled by the block size of the tablespace in which the LOB is stored. The default CHUNK size is one tablespace block, and the maximum value is 32KB. In general, the bigger the CHUNK size, the better the LOB I/O performance. But larger CHUNK size also means there could be more storage overhead (wasted space). So, the performance benefits of using a large CHUNK size should be balanced with the storage overhead.
6. Use dedicated temporary tablespace datafile
This is to reduce the competition for temporary tablespace among the GeoRaster process and other database processes. And the datafile should be set to be auto-extendable.
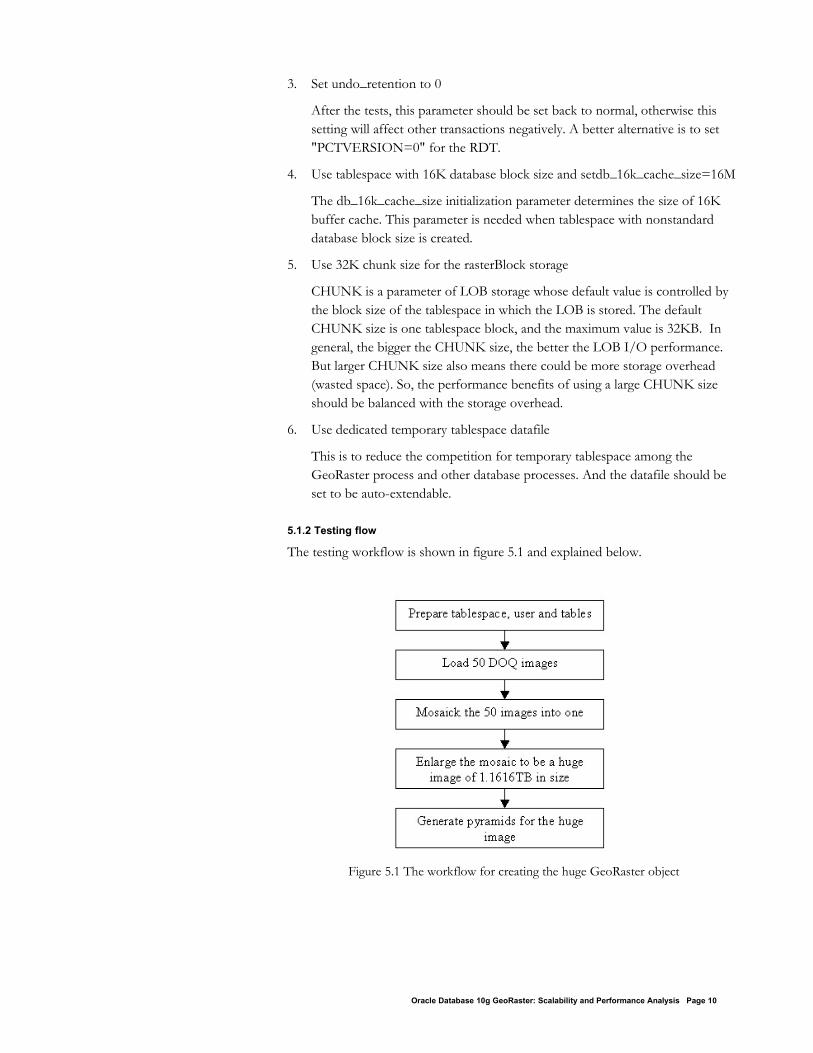
5.1.2 Testing flow
The testing workflow is shown in figure 5.1 and explained below.
Figure 5.1 The workflow for creating the huge GeoRaster object
Oracle Database 10g GeoRaster: Scalability and Performance Analysis Page 10
1. Create a big tablespace, a user and the GeoRaster and RDT tables.
2. Load the 50 DOQ images (each with the size of 183M, 3 bands) into the GeoRaster table using the standalone GeoRasterLoader. Two different loading methods were tested. The first method is to load all the 50 images on one RAC node. The second method is to divide the 50 images into two groups, with each group containing 25 images. The image files of the two groups were put on the local disks of two RAC nodes and loaded concurrently. The blocking parameter “blocksize=(512,512,1)” was used to load the images.
3. Mosaick the 50 images into one single image using the GeoRaster procedure SDO_GEOR.mosaic. The size of the resulting image is 9.6GB.
4. Enlarge the mosaicked image by using the GeoRaster procedure SDO_GEOR.scaleCopy with “scaleFactor=11” along both the row and column dimensions. The size of the result image is 1.1616TB, and its block size is (2048,2048,3).
5. Generating the pyramids for the result image using the GeoRaster procedure SDO_GEOR.generatePyramid.
5.2 Test results
5.2.1 Creating a huge image
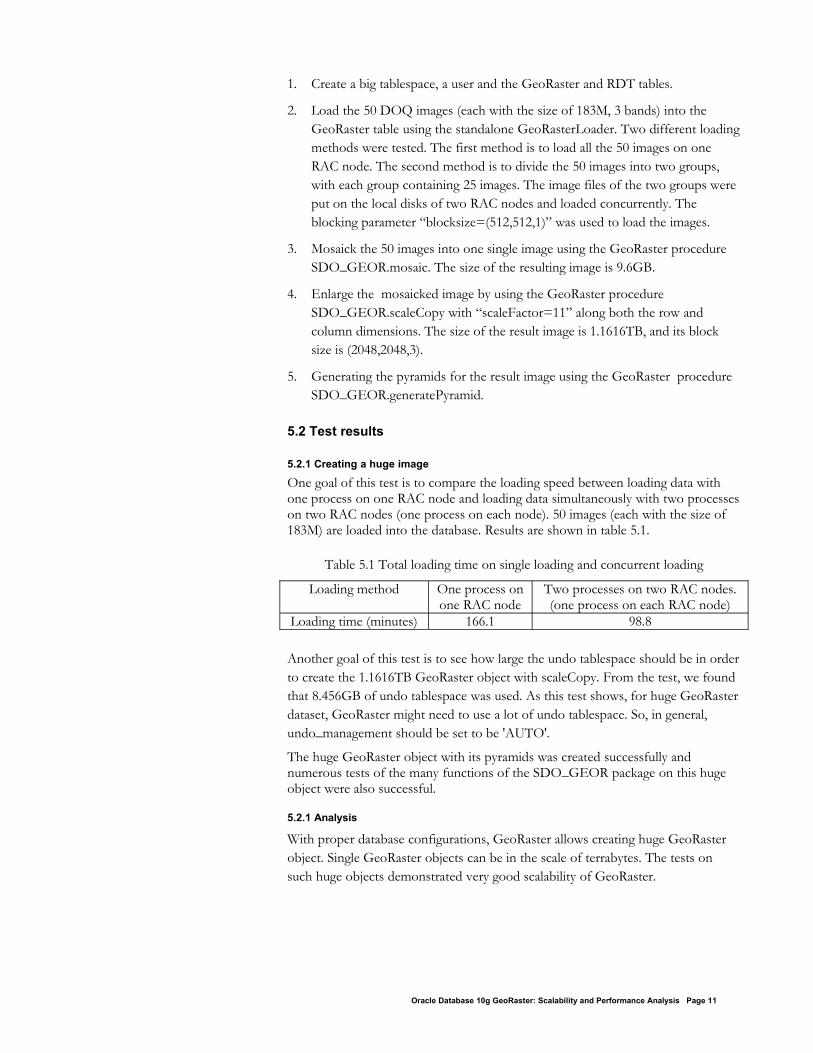
One goal of this test is to compare the loading speed between loading data with one process on one RAC node and loading data simultaneously with two processes on two RAC nodes (one process on each node). 50 images (each with the size of 183M) are loaded into the database. Results are shown in table 5.1.
Table 5.1 Total loading time on single loading and concurrent loading
Loading method One process on one RAC node
Two processes on two RAC nodes.(one process on each RAC node)
Loading time (minutes) 166.1 98.8
Another goal of this test is to see how large the undo tablespace should be in order to create the 1.1616TB GeoRaster object with scaleCopy. From the test, we found that 8.456GB of undo tablespace was used. As this test shows, for huge GeoRaster dataset, GeoRaster might need to use a lot of undo tablespace. So, in general, undo_management should be set to be 'AUTO'.
The huge GeoRaster object with its pyramids was created successfully and numerous tests of the many functions of the SDO_GEOR package on this huge object were also successful.
5.2.1 Analysis
With proper database configurations, GeoRaster allows creating huge GeoRaster object. Single GeoRaster objects can be in the scale of terrabytes. The tests on such huge objects demonstrated very good scalability of GeoRaster.
Oracle Database 10g GeoRaster: Scalability and Performance Analysis Page 11
When dealing with large dataset or huge GeoRaster objects, properly configuring the database server is important. GeoRaster is I/O intensive for most raster operations as well as CPU intensive for many functions. To achieve better performance a good hardware configuration is also needed.
In this loading test, we used a single RDT to store the raster data from different loading processes. The tablespace where the RDT was created has only one datafile but the datafile was actually distributed across the 16 disks on the RAID4 system. The raster block size (512x512x1) was less than 12 times of the lob chunk size (32KB). Under this strict condition, loading raster data on two database grid nodes concurrently reduced loading time significantly, as shown in table 5.1. With large raster dataset to be loaded into GeoRaster databases, concurrent loading can be considered. However, due to bug 3180333 (described in LOB Performance Guidelines, i.e., Note 268476.1 on Oracle Metalink), when raster data are loaded into the same RDT or RDT partition by concurrent loading processes, the raster block size should be less than 12 times of the lob chunk size. While there are no such restrictions when raster data are concurrently loaded into different RDTs or RDT partitions, the common practice should be followed to distribute the tables or table partitions and the performance depends upon the distribution of the physical storage of the raster data (table) as well.
6 TESTING THE GEORASTER TUNING PROCEDUREThe SDO_GEOR.changeFormatCopy is a very important procedure for GeoRaster. It allows you to internally and automatically change the storage format of the GeoRaster objects, which includes the blocking size, the interleaving, the cell depth, the compressions and the pyramids. So it functions as a very good tuning tool to optimize the storage format of GeoRaster objects to best fit into different applications. In this paper, we focus on the testing of changing raster block sizes.
6.1 Test environmentThe test was done on one of the Linux servers (4x 1G RAM, 4x 2.4GHz CPU, 1x 72G internal hard disk).
6.2 Test approach1. In our test, buffer cache and shared pool are flushed.
After buffer cache flushing, in-memory copies of data blocks will be flushed out of memory, and so other sessions cannot get the same data directly from memory. After shared pool flushing, the parsed SQL statements or PL/SQL blocks in memory (library cache of shared pool) will be flushed out of memory, and so other sessions will need to re-parse them when users want o execute the same SQL statements or PL/SQL blocks.
Oracle Database 10g GeoRaster: Scalability and Performance Analysis Page 12
The purpose of doing this is to make sure every measure on the procedure is of a new execution of the procedure itself.
2. The size of each GeoRaster object used in our test is 96M. It has 8000 rows, 4000 columns and 3 bands. The cell depth is 8 bit unsigned. The interleaving type is BIP. They are all three-band true-color images.
6.3 Test results
6.3.1 Changing GeoRaster block sizes
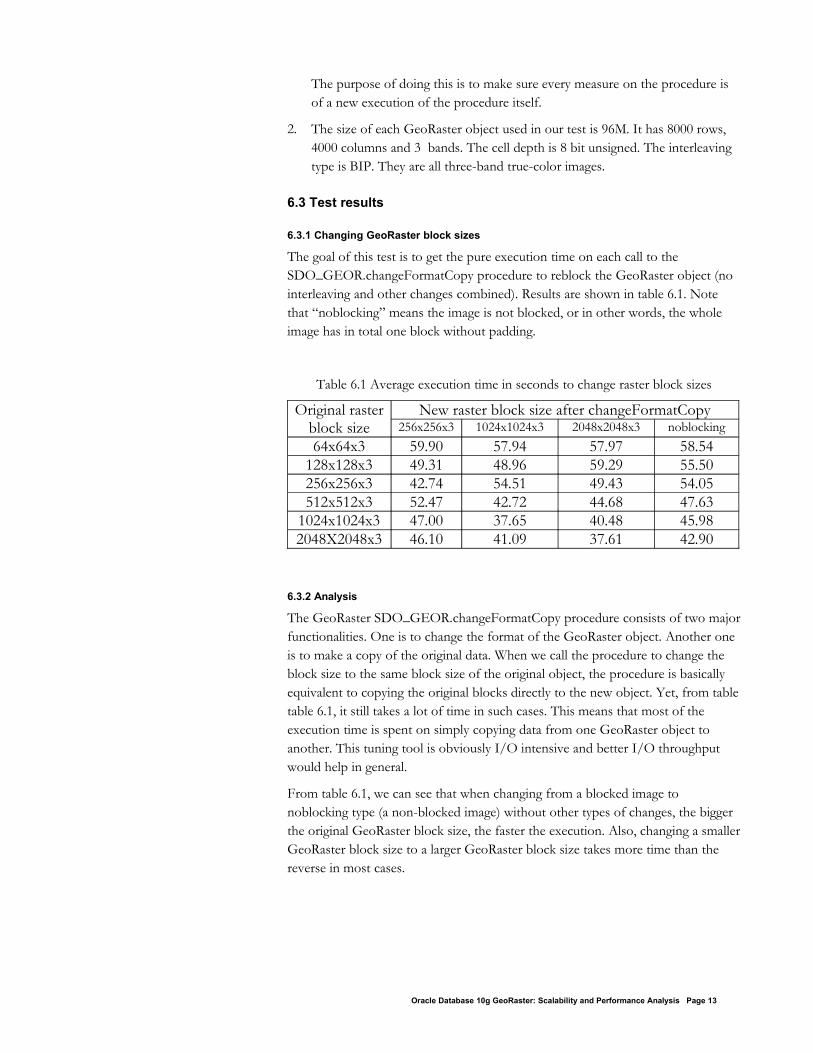
The goal of this test is to get the pure execution time on each call to the SDO_GEOR.changeFormatCopy procedure to reblock the GeoRaster object (no interleaving and other changes combined). Results are shown in table 6.1. Note that “noblocking” means the image is not blocked, or in other words, the whole image has in total one block without padding.
Table 6.1 Average execution time in seconds to change raster block sizes
Original raster block size
New raster block size after changeFormatCopy256x256x3 1024x1024x3 2048x2048x3 noblocking
64x64x3 59.90 57.94 57.97 58.54128x128x3 49.31 48.96 59.29 55.50256x256x3 42.74 54.51 49.43 54.05512x512x3 52.47 42.72 44.68 47.63
1024x1024x3 47.00 37.65 40.48 45.982048X2048x3 46.10 41.09 37.61 42.90
6.3.2 Analysis
The GeoRaster SDO_GEOR.changeFormatCopy procedure consists of two major functionalities. One is to change the format of the GeoRaster object. Another one is to make a copy of the original data. When we call the procedure to change the block size to the same block size of the original object, the procedure is basically equivalent to copying the original blocks directly to the new object. Yet, from table table 6.1, it still takes a lot of time in such cases. This means that most of the execution time is spent on simply copying data from one GeoRaster object to another. This tuning tool is obviously I/O intensive and better I/O throughput would help in general.
From table 6.1, we can see that when changing from a blocked image to noblocking type (a non-blocked image) without other types of changes, the bigger the original GeoRaster block size, the faster the execution. Also, changing a smaller GeoRaster block size to a larger GeoRaster block size takes more time than the reverse in most cases.
Oracle Database 10g GeoRaster: Scalability and Performance Analysis Page 13
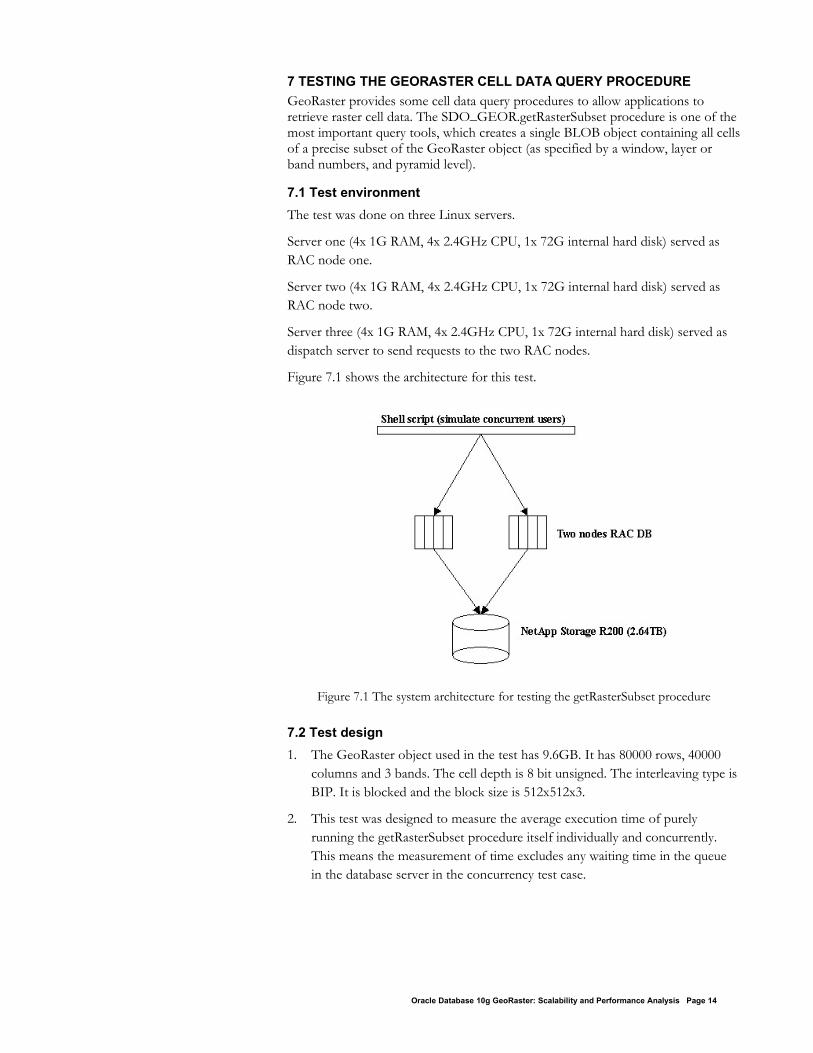
7 TESTING THE GEORASTER CELL DATA QUERY PROCEDUREGeoRaster provides some cell data query procedures to allow applications to retrieve raster cell data. The SDO_GEOR.getRasterSubset procedure is one of the most important query tools, which creates a single BLOB object containing all cells of a precise subset of the GeoRaster object (as specified by a window, layer or band numbers, and pyramid level).
7.1 Test environmentThe test was done on three Linux servers.
Server one (4x 1G RAM, 4x 2.4GHz CPU, 1x 72G internal hard disk) served as RAC node one.
Server two (4x 1G RAM, 4x 2.4GHz CPU, 1x 72G internal hard disk) served as RAC node two.
Server three (4x 1G RAM, 4x 2.4GHz CPU, 1x 72G internal hard disk) served as dispatch server to send requests to the two RAC nodes.
Figure 7.1 shows the architecture for this test.
Figure 7.1 The system architecture for testing the getRasterSubset procedure
7.2 Test design1. The GeoRaster object used in the test has 9.6GB. It has 80000 rows, 40000
columns and 3 bands. The cell depth is 8 bit unsigned. The interleaving type is BIP. It is blocked and the block size is 512x512x3.
2. This test was designed to measure the average execution time of purely running the getRasterSubset procedure itself individually and concurrently. This means the measurement of time excludes any waiting time in the queue in the database server in the concurrency test case.
Oracle Database 10g GeoRaster: Scalability and Performance Analysis Page 14
3. We did concurrency tests based on one RAC nodes and two RAC nodes respectively. The test stops when either one of the following conditions is met:
a. With the number of requests increasing, the pressure on RAC nodes increases. When the pressure becomes so huge that the RAC nodes can’t handle all requests, there will be failures due to the pressure, and then the test stops.
b. The total number of concurrent requests grows up to 10,000.
In this concurrency test, the time measured is the pure execution time of the getRasterSubset procedure and excludes the waiting time in the queue inside the database server. However, we didn’t flush the database caches and so the concurrent requests of getRasterSubset took advantages of the database caches.
4. We also did tests on single requests of the getRasterSubset procedure, in which we ran the test script 50 times continuously on single node to get the average execution time as test results. In this test, the buffer cache and shared pool were flushed out before every execution of the getRasterSubset procedure. This basically makes sure the measures are the pure running time of each independent call of the getRasterSubset and do not take advantages of database caches (unlike the concurrency tests). This is described in section 7.3.3.
5. Different query window sizes are used in this test. But relatively we measured the best cases based on the original image block sizes. If the retrieving window is the same as or smaller than the GeoRaster block size, we restrict the query to access only one block., otherwise four blocks or sixteen blocks depending on the query window size. So the query windows cover the raster blocks as less as possible.
7.3 Test results and analysis
7.3.1 Total concurrent requests and the average response time
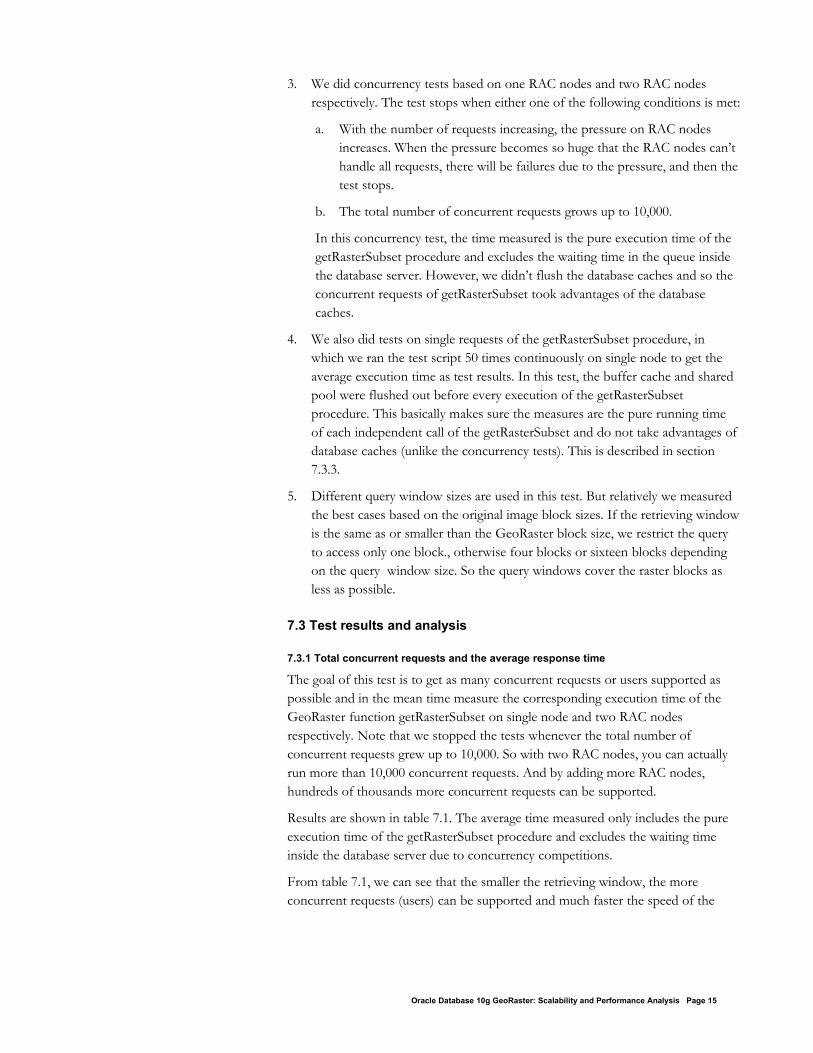
The goal of this test is to get as many concurrent requests or users supported as possible and in the mean time measure the corresponding execution time of the GeoRaster function getRasterSubset on single node and two RAC nodes respectively. Note that we stopped the tests whenever the total number of concurrent requests grew up to 10,000. So with two RAC nodes, you can actually run more than 10,000 concurrent requests. And by adding more RAC nodes, hundreds of thousands more concurrent requests can be supported.
Results are shown in table 7.1. The average time measured only includes the pure execution time of the getRasterSubset procedure and excludes the waiting time inside the database server due to concurrency competitions.
From table 7.1, we can see that the smaller the retrieving window, the more concurrent requests (users) can be supported and much faster the speed of the
Oracle Database 10g GeoRaster: Scalability and Performance Analysis Page 15
raster data queries. Adding more database RAC nodes to database grid can significantly improve the performance of GeoRaster function getRasterSubset and increases the total number of concurrent requests. GeoRaster uses oracle database cache. In each case of the test we used the same window to access the same GeoRaster object, so every time getRasterSubset can directly access the raster data in the database cache without going back to the BLOBs for every call. That helps improve the query speed dramatically during this concurrency test.
Table 7.1 Total concurrent requests and the average execution time when concurrently running getRasterSubset on one RAC node and two RAC nodes
Single RAC node Two RAC nodesRetrieving
window sizeTotal number of concurrent
requests
Average execution
time (seconds)
Total number of concurrent
requests
Average execution
time (seconds)
256x256x3 1400 0.0722 10000 0.0567512x512x3 1300 0.272 10000 0.129
1024x1024x3 700 3.261 2000 2.1282048x2048x3 120 26.922 250 30.884
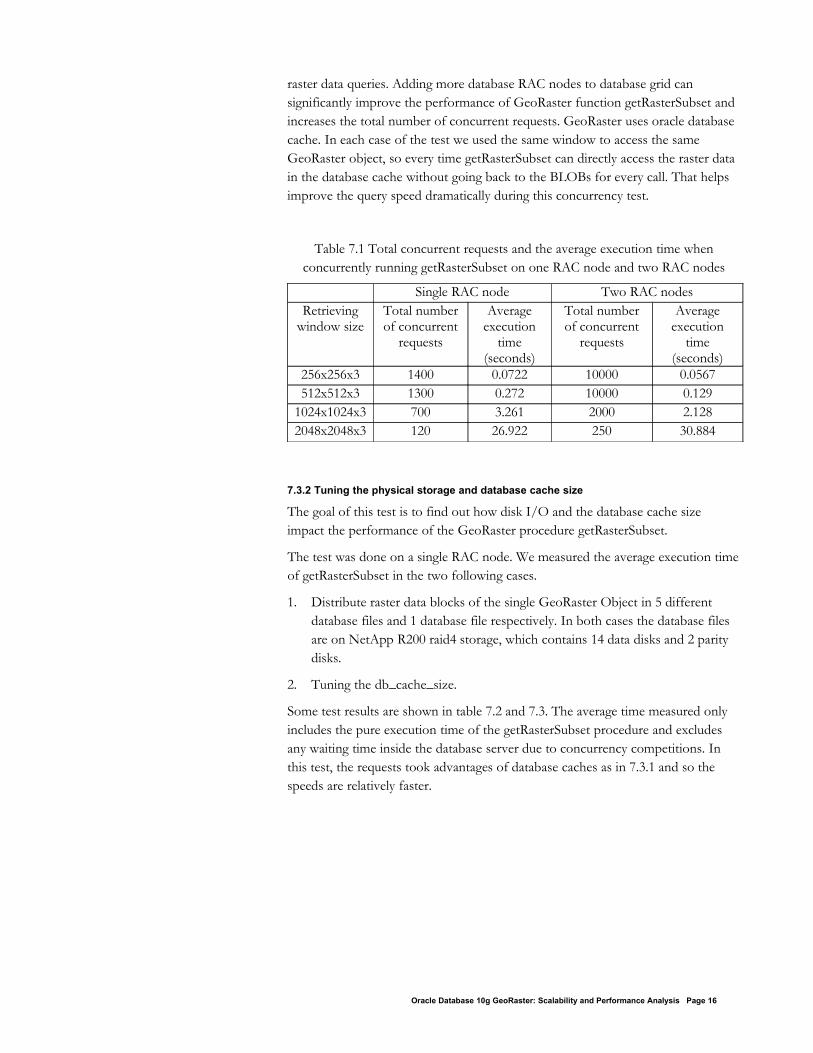
7.3.2 Tuning the physical storage and database cache size
The goal of this test is to find out how disk I/O and the database cache size impact the performance of the GeoRaster procedure getRasterSubset.
The test was done on a single RAC node. We measured the average execution time of getRasterSubset in the two following cases.
1. Distribute raster data blocks of the single GeoRaster Object in 5 different database files and 1 database file respectively. In both cases the database files are on NetApp R200 raid4 storage, which contains 14 data disks and 2 parity disks.
2. Tuning the db_cache_size.
Some test results are shown in table 7.2 and 7.3. The average time measured only includes the pure execution time of the getRasterSubset procedure and excludes any waiting time inside the database server due to concurrency competitions. In this test, the requests took advantages of database caches as in 7.3.1 and so the speeds are relatively faster.
Oracle Database 10g GeoRaster: Scalability and Performance Analysis Page 16
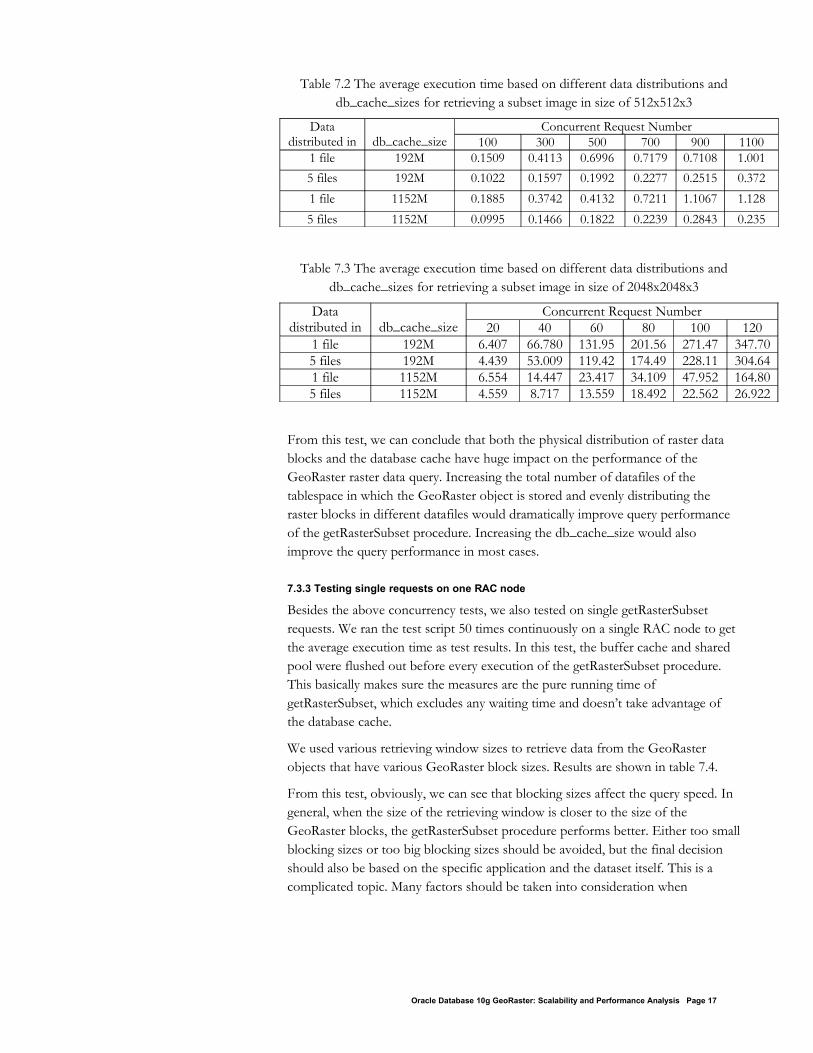
Table 7.2 The average execution time based on different data distributions and db_cache_sizes for retrieving a subset image in size of 512x512x3
Data distributed in db_cache_size
Concurrent Request Number100 300 500 700 900 1100
1 file 192M 0.1509 0.4113 0.6996 0.7179 0.7108 1.0015 files 192M 0.1022 0.1597 0.1992 0.2277 0.2515 0.3721 file 1152M 0.1885 0.3742 0.4132 0.7211 1.1067 1.1285 files 1152M 0.0995 0.1466 0.1822 0.2239 0.2843 0.235
Table 7.3 The average execution time based on different data distributions and db_cache_sizes for retrieving a subset image in size of 2048x2048x3
Data distributed in db_cache_size
Concurrent Request Number20 40 60 80 100 120
1 file 192M 6.407 66.780 131.95 201.56 271.47 347.705 files 192M 4.439 53.009 119.42 174.49 228.11 304.641 file 1152M 6.554 14.447 23.417 34.109 47.952 164.805 files 1152M 4.559 8.717 13.559 18.492 22.562 26.922
From this test, we can conclude that both the physical distribution of raster data blocks and the database cache have huge impact on the performance of the GeoRaster raster data query. Increasing the total number of datafiles of the tablespace in which the GeoRaster object is stored and evenly distributing the raster blocks in different datafiles would dramatically improve query performance of the getRasterSubset procedure. Increasing the db_cache_size would also improve the query performance in most cases.
7.3.3 Testing single requests on one RAC node
Besides the above concurrency tests, we also tested on single getRasterSubset requests. We ran the test script 50 times continuously on a single RAC node to get the average execution time as test results. In this test, the buffer cache and shared pool were flushed out before every execution of the getRasterSubset procedure. This basically makes sure the measures are the pure running time of getRasterSubset, which excludes any waiting time and doesn’t take advantage of the database cache.
We used various retrieving window sizes to retrieve data from the GeoRaster objects that have various GeoRaster block sizes. Results are shown in table 7.4.
From this test, obviously, we can see that blocking sizes affect the query speed. In general, when the size of the retrieving window is closer to the size of the GeoRaster blocks, the getRasterSubset procedure performs better. Either too small blocking sizes or too big blocking sizes should be avoided, but the final decision should also be based on the specific application and the dataset itself. This is a complicated topic. Many factors should be taken into consideration when
Oracle Database 10g GeoRaster: Scalability and Performance Analysis Page 17
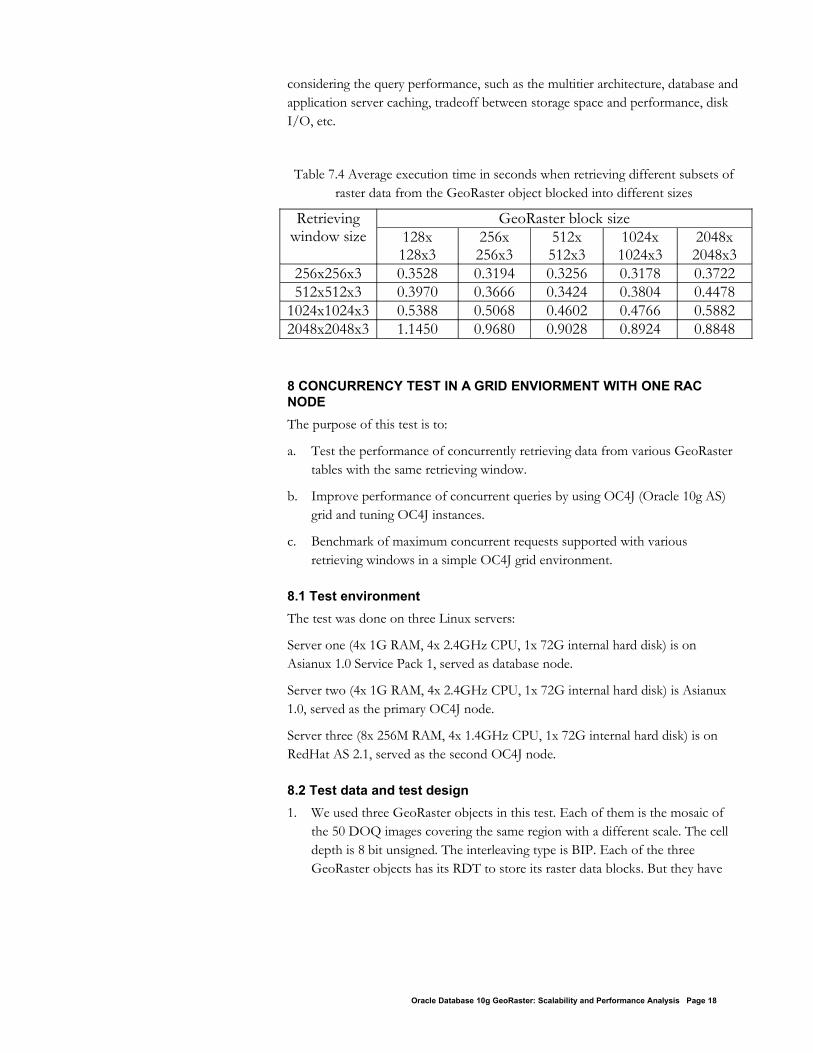
considering the query performance, such as the multitier architecture, database and application server caching, tradeoff between storage space and performance, disk I/O, etc.
Table 7.4 Average execution time in seconds when retrieving different subsets of raster data from the GeoRaster object blocked into different sizes
Retrieving window size
GeoRaster block size128x128x3
256x256x3
512x512x3
1024x1024x3
2048x2048x3
256x256x3 0.3528 0.3194 0.3256 0.3178 0.3722512x512x3 0.3970 0.3666 0.3424 0.3804 0.4478
1024x1024x3 0.5388 0.5068 0.4602 0.4766 0.58822048x2048x3 1.1450 0.9680 0.9028 0.8924 0.8848
8 CONCURRENCY TEST IN A GRID ENVIORMENT WITH ONE RAC NODEThe purpose of this test is to:
a. Test the performance of concurrently retrieving data from various GeoRaster tables with the same retrieving window.
b. Improve performance of concurrent queries by using OC4J (Oracle 10g AS) grid and tuning OC4J instances.
c. Benchmark of maximum concurrent requests supported with various retrieving windows in a simple OC4J grid environment.
8.1 Test environmentThe test was done on three Linux servers:
Server one (4x 1G RAM, 4x 2.4GHz CPU, 1x 72G internal hard disk) is on Asianux 1.0 Service Pack 1, served as database node.
Server two (4x 1G RAM, 4x 2.4GHz CPU, 1x 72G internal hard disk) is Asianux 1.0, served as the primary OC4J node.
Server three (8x 256M RAM, 4x 1.4GHz CPU, 1x 72G internal hard disk) is on RedHat AS 2.1, served as the second OC4J node.
8.2 Test data and test design1. We used three GeoRaster objects in this test. Each of them is the mosaic of
the 50 DOQ images covering the same region with a different scale. The cell depth is 8 bit unsigned. The interleaving type is BIP. Each of the three GeoRaster objects has its RDT to store its raster data blocks. But they have
Oracle Database 10g GeoRaster: Scalability and Performance Analysis Page 18
different blocking sizes and different image sizes (i.e., different spatial resolutions in this specific case).
a. Image1: this GeoRaster object has 9.6GB. It has 80000 rows, 40000 columns and 3 bands. It is blocked and the block size is 512x512x3.
b. Image2: this GeoRaster object has 240G. It has 400000 rows, 200000 columns and 3 bands. It is blocked and the block size is 1024x1024x3.
c. Image3: this GeoRaster object has 1.1616T. It has 880000 rows, 440000 columns and 3 bands. It is blocked and the block size is 2048x2048x3.
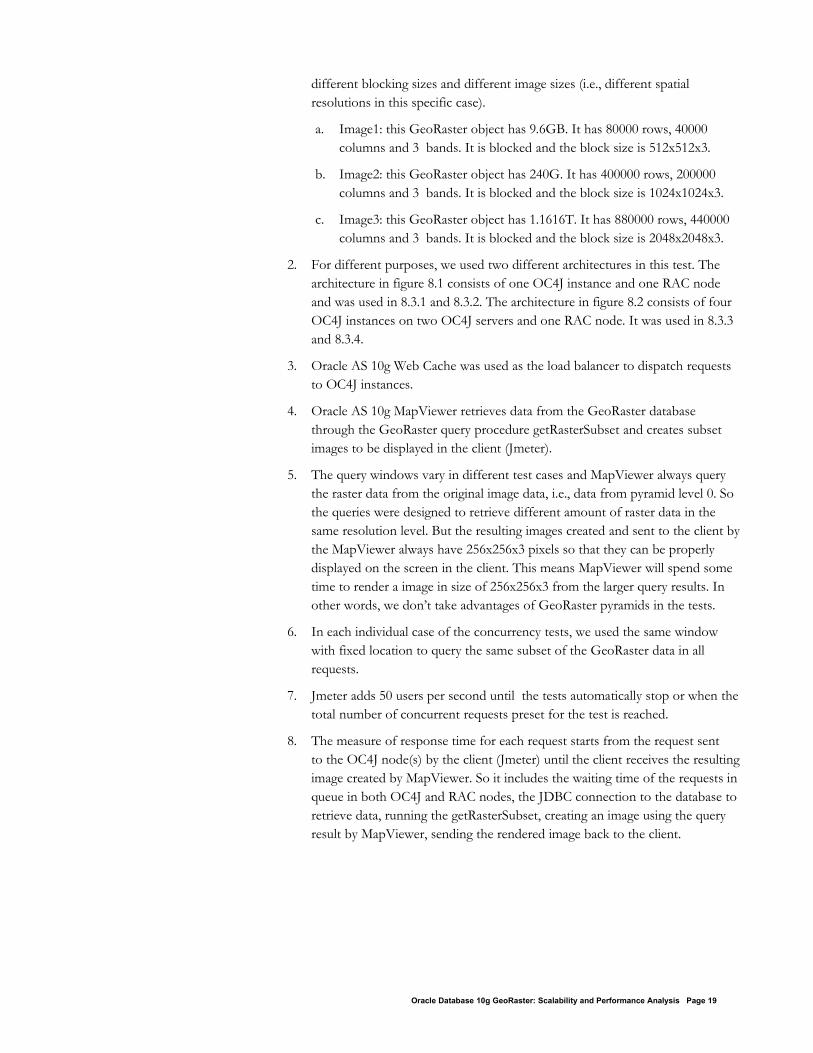
2. For different purposes, we used two different architectures in this test. The architecture in figure 8.1 consists of one OC4J instance and one RAC node and was used in 8.3.1 and 8.3.2. The architecture in figure 8.2 consists of four OC4J instances on two OC4J servers and one RAC node. It was used in 8.3.3 and 8.3.4.
3. Oracle AS 10g Web Cache was used as the load balancer to dispatch requests to OC4J instances.
4. Oracle AS 10g MapViewer retrieves data from the GeoRaster database through the GeoRaster query procedure getRasterSubset and creates subset images to be displayed in the client (Jmeter).
5. The query windows vary in different test cases and MapViewer always query the raster data from the original image data, i.e., data from pyramid level 0. So the queries were designed to retrieve different amount of raster data in the same resolution level. But the resulting images created and sent to the client by the MapViewer always have 256x256x3 pixels so that they can be properly displayed on the screen in the client. This means MapViewer will spend some time to render a image in size of 256x256x3 from the larger query results. In other words, we don’t take advantages of GeoRaster pyramids in the tests.
6. In each individual case of the concurrency tests, we used the same window with fixed location to query the same subset of the GeoRaster data in all requests.
7. Jmeter adds 50 users per second until the tests automatically stop or when the total number of concurrent requests preset for the test is reached.
8. The measure of response time for each request starts from the request sent to the OC4J node(s) by the client (Jmeter) until the client receives the resulting image created by MapViewer. So it includes the waiting time of the requests in queue in both OC4J and RAC nodes, the JDBC connection to the database to retrieve data, running the getRasterSubset, creating an image using the query result by MapViewer, sending the rendered image back to the client.
Oracle Database 10g GeoRaster: Scalability and Performance Analysis Page 19
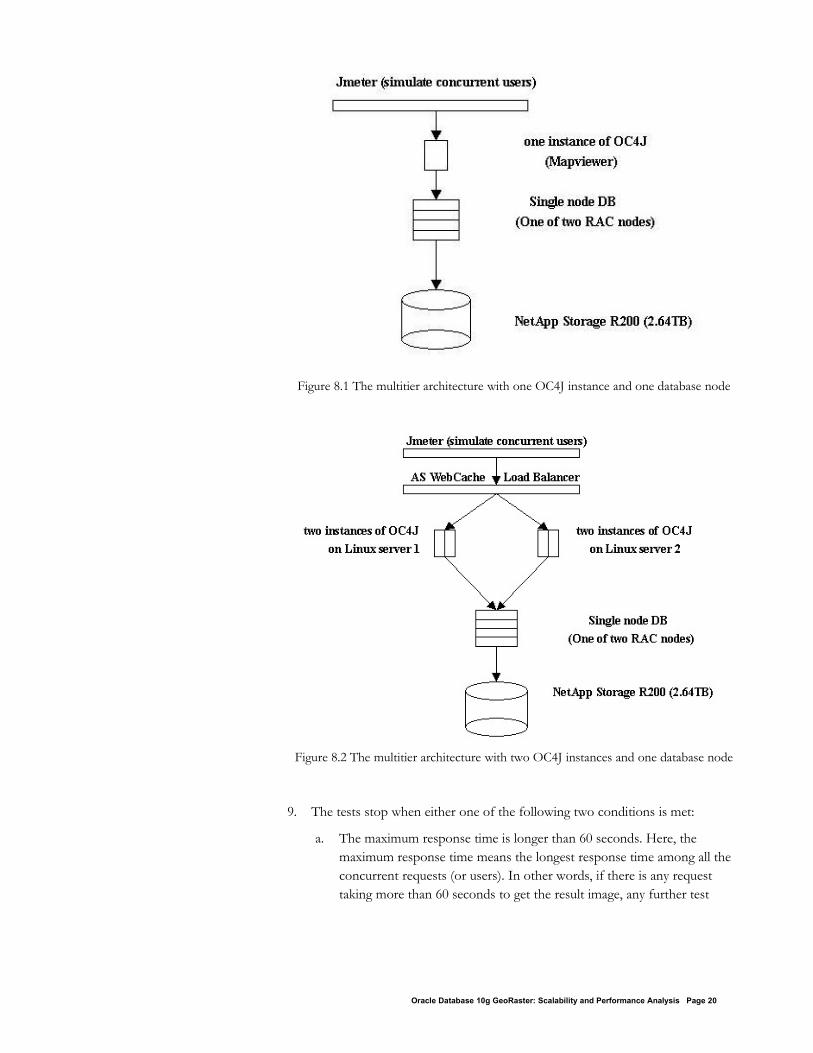
Figure 8.1 The multitier architecture with one OC4J instance and one database node
Figure 8.2 The multitier architecture with two OC4J instances and one database node
9. The tests stop when either one of the following two conditions is met:
a. The maximum response time is longer than 60 seconds. Here, the maximum response time means the longest response time among all the concurrent requests (or users). In other words, if there is any request taking more than 60 seconds to get the result image, any further test
Oracle Database 10g GeoRaster: Scalability and Performance Analysis Page 20
would be stopped. But note that it does not mean that the system can’t support more concurrent requests (or users). It only means beyond this total number of requests (or users), at least one of the requests will take more than 60 seconds to get the result image.
b. With the increase of concurrent requests, the pressure on Jmeter will increase. When the pressure becomes so big that Jmeter cannot handle all requests, there would be a failure in Jmeter and the test would stop at this time.
8.3 Test results and analysis
8.3.1 Query concurrency on different GeoRaster objects
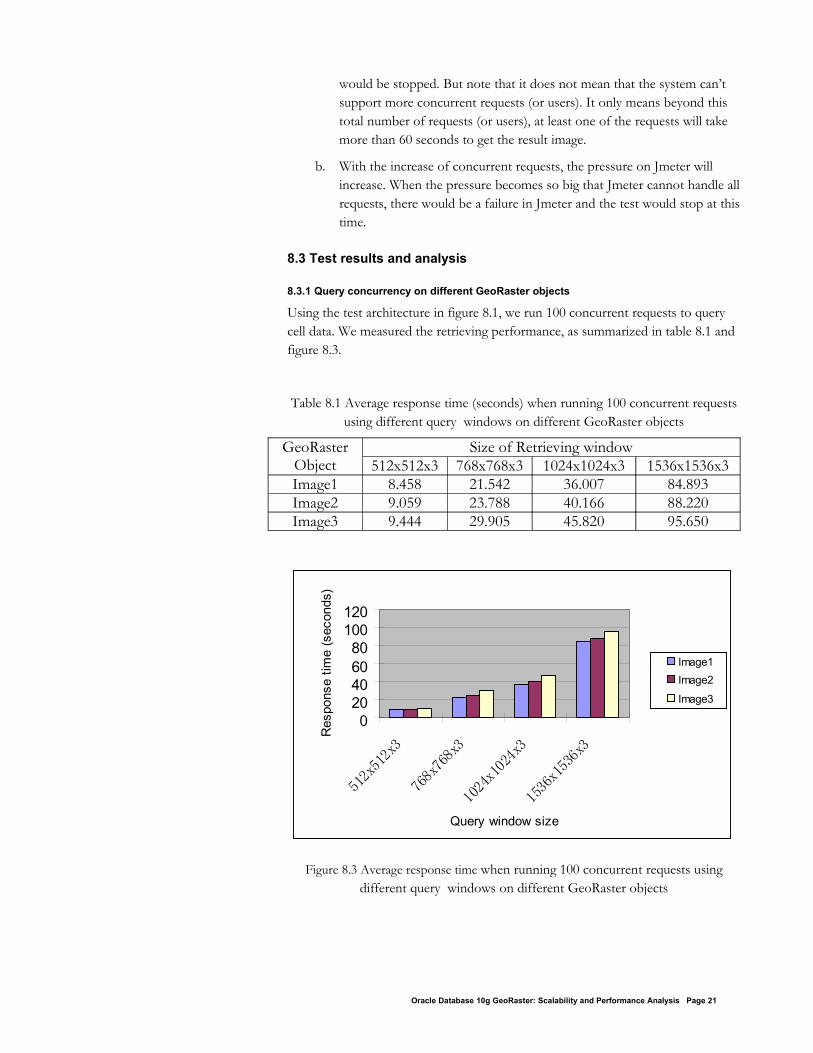
Using the test architecture in figure 8.1, we run 100 concurrent requests to query cell data. We measured the retrieving performance, as summarized in table 8.1 and figure 8.3.
Table 8.1 Average response time (seconds) when running 100 concurrent requests using different query windows on different GeoRaster objects
GeoRaster Object
Size of Retrieving window512x512x3 768x768x3 1024x1024x3 1536x1536x3
Image1 8.458 21.542 36.007 84.893Image2 9.059 23.788 40.166 88.220Image3 9.444 29.905 45.820 95.650
Figure 8.3 Average response time when running 100 concurrent requests using different query windows on different GeoRaster objects
Oracle Database 10g GeoRaster: Scalability and Performance Analysis Page 21
020406080
100120
512x512x3
768x768x3
1024x1024x3
1536x1536x3
Query window size
Res
pons
e tim
e (s
econ
ds)
Image1Image2
Image3
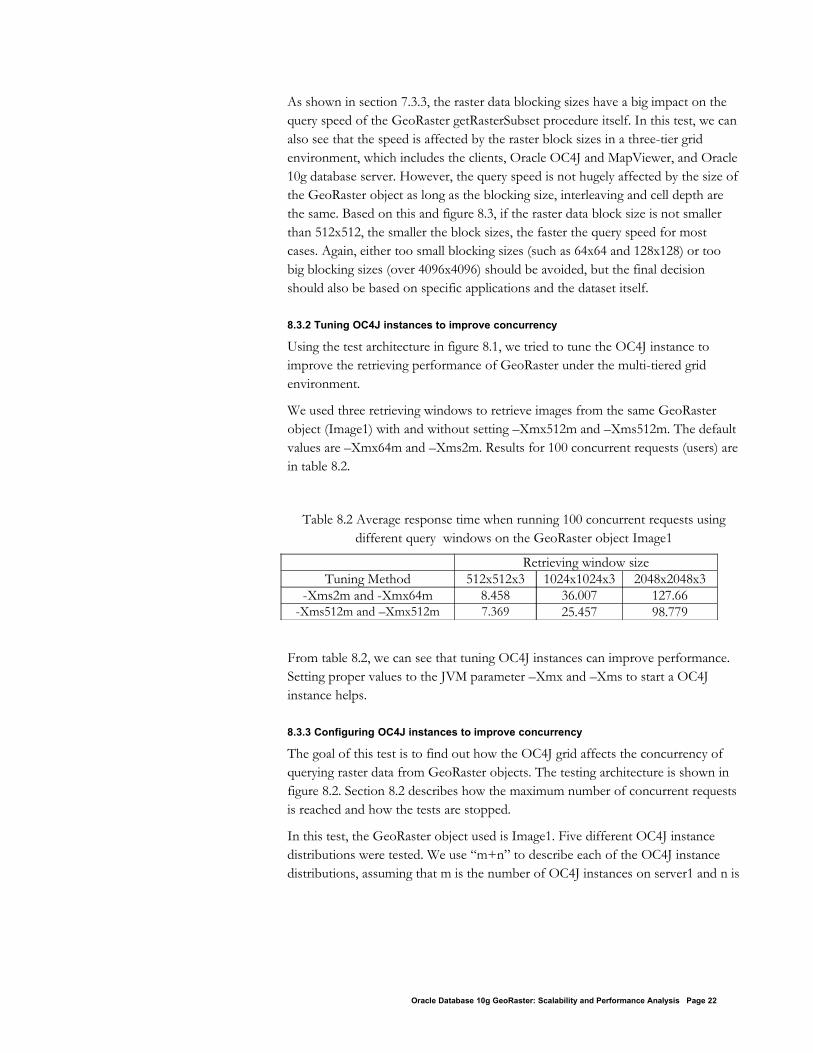
As shown in section 7.3.3, the raster data blocking sizes have a big impact on the query speed of the GeoRaster getRasterSubset procedure itself. In this test, we can also see that the speed is affected by the raster block sizes in a three-tier grid environment, which includes the clients, Oracle OC4J and MapViewer, and Oracle 10g database server. However, the query speed is not hugely affected by the size of the GeoRaster object as long as the blocking size, interleaving and cell depth are the same. Based on this and figure 8.3, if the raster data block size is not smaller than 512x512, the smaller the block sizes, the faster the query speed for most cases. Again, either too small blocking sizes (such as 64x64 and 128x128) or too big blocking sizes (over 4096x4096) should be avoided, but the final decision should also be based on specific applications and the dataset itself.
8.3.2 Tuning OC4J instances to improve concurrency
Using the test architecture in figure 8.1, we tried to tune the OC4J instance to improve the retrieving performance of GeoRaster under the multi-tiered grid environment.
We used three retrieving windows to retrieve images from the same GeoRaster object (Image1) with and without setting –Xmx512m and –Xms512m. The default values are –Xmx64m and –Xms2m. Results for 100 concurrent requests (users) are in table 8.2.
Table 8.2 Average response time when running 100 concurrent requests using different query windows on the GeoRaster object Image1
Retrieving window sizeTuning Method 512x512x3 1024x1024x3 2048x2048x3
-Xms2m and -Xmx64m 8.458 36.007 127.66-Xms512m and –Xmx512m 7.369 25.457 98.779
From table 8.2, we can see that tuning OC4J instances can improve performance. Setting proper values to the JVM parameter –Xmx and –Xms to start a OC4J instance helps.
8.3.3 Configuring OC4J instances to improve concurrency
The goal of this test is to find out how the OC4J grid affects the concurrency of querying raster data from GeoRaster objects. The testing architecture is shown in figure 8.2. Section 8.2 describes how the maximum number of concurrent requests is reached and how the tests are stopped.
In this test, the GeoRaster object used is Image1. Five different OC4J instance distributions were tested. We use “m+n” to describe each of the OC4J instance distributions, assuming that m is the number of OC4J instances on server1 and n is
Oracle Database 10g GeoRaster: Scalability and Performance Analysis Page 22
the number of OC4J instances on server2 (see figure 8.2). The retrieving window was 256x256x3 and the results are shown in table 8.3 and figure 8.4.
In table 8.3 and figure 8.4, the OC4J distributions are as follows.
a. “1” means the Jmeter accesses one OC4J instance directly.
b. “1+0” means the Jmeter accesses one OC4J instance through a load balancer.
c. “2+0’ means the Jmeter accesses two OC4J instances distributed on one server through a load balancer.
d. “1+1’ means the Jmeter accesses two OC4J instances distributed evenly on two servers through a load balancer.
e. “2+2’ means the Jmeter accesses four OC4J instances distributed evenly on two servers through a load balancer.
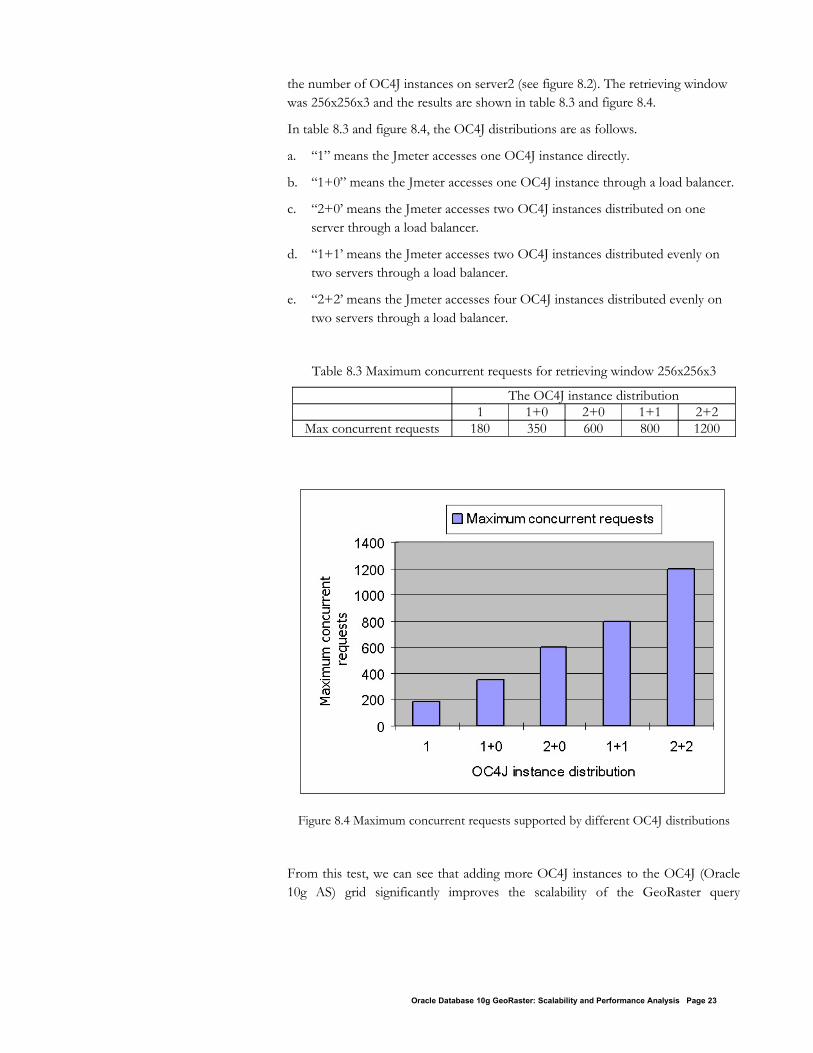
Table 8.3 Maximum concurrent requests for retrieving window 256x256x3
The OC4J instance distribution1 1+0 2+0 1+1 2+2
Max concurrent requests 180 350 600 800 1200
Figure 8.4 Maximum concurrent requests supported by different OC4J distributions
From this test, we can see that adding more OC4J instances to the OC4J (Oracle 10g AS) grid significantly improves the scalability of the GeoRaster query
Oracle Database 10g GeoRaster: Scalability and Performance Analysis Page 23
concurrency. Distributing OC4J instances evenly on different servers also helps. Accessing OC4J instances through the Oracle AS WebCache load balancer increases the total number of concurrent requests (users) as well.
8.3.4 Query concurrency on different window sizes
This test used the architecture shown in figure 8.2. It was intended to find out how the retrieving window sizes affect the GeoRaster query concurrency. Section 8.2 describes how the maximum number of concurrent requests is reached and how the tests are stopped.
In this test, the GeoRaster object used is Image1. Four OC4J instances are distributed on two servers evenly. We got the total numbers of concurrent requests for four different retrieving window sizes and the results are shown in table 8.4.
Table 8.4 The total concurrent requests and corresponding average response time for different retrieving windows
Query window size Total concurrent requests
Average response time (seconds)
256x256x3 1200 17.388512x512x3 600 24.875
1024x1024x3 180 33.9302048x2048x3 40 39.550
From table 8.4 we can see that increasing the size of the retrieving window reduces the total number of concurrent requests significantly and increases the average response time.
9 CONCURRENCY TEST IN A GRID ENVIRONMENT WITH TWO RAC NODESThe purpose of this test is similar to that in section 8. We added one more database RAC node to the grid and tested on the concurrency scalability and performance of GeoRaster queries under such an enterprise environment.
9.1 Test environmentThe testing environment is the same as that in section 8 except that we added one more Linux server, which is 4x 1G RAM, 4x 2.4GHz CPU, 1x 72G internal hard disk, with Asianux 1.0 Service Pack 1 and was served as the second RAC node.
9.2 Test data and design1. The architecture of the testing system is shown in figure 9.1. Two levels of
load balancing were used. The first level is the 10g AS load balancer (i.e., Web
Oracle Database 10g GeoRaster: Scalability and Performance Analysis Page 24
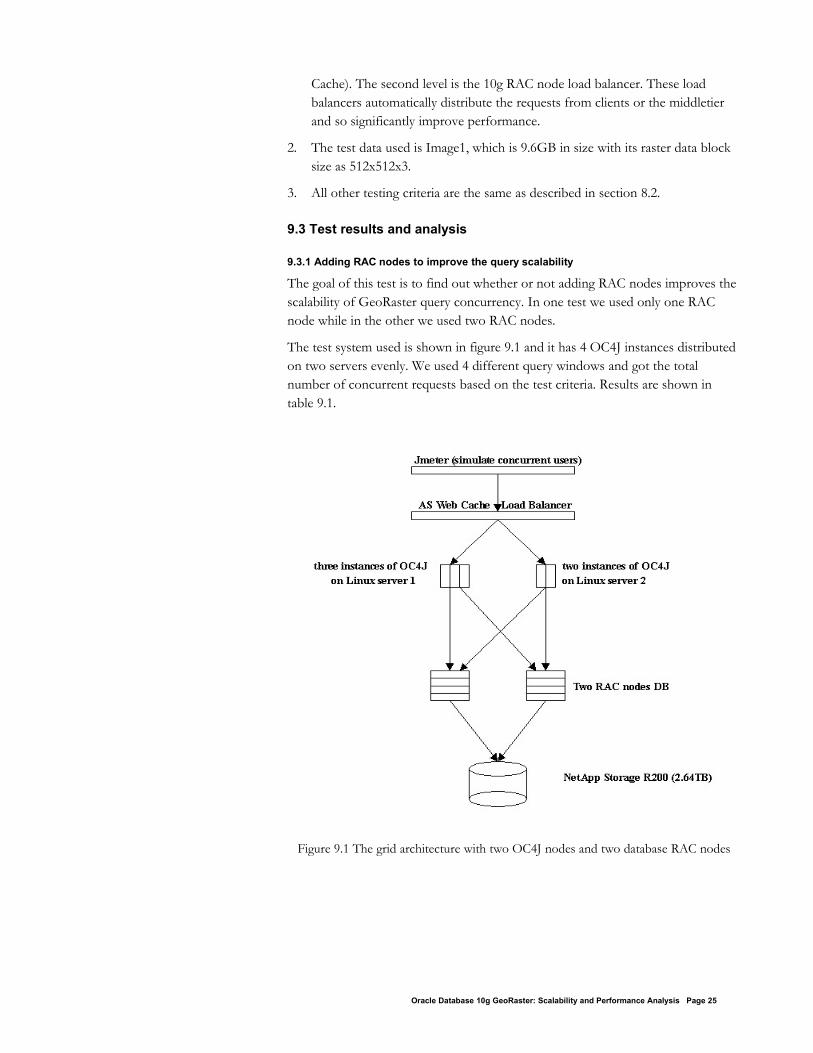
Cache). The second level is the 10g RAC node load balancer. These load balancers automatically distribute the requests from clients or the middletier and so significantly improve performance.
2. The test data used is Image1, which is 9.6GB in size with its raster data block size as 512x512x3.
3. All other testing criteria are the same as described in section 8.2.
9.3 Test results and analysis
9.3.1 Adding RAC nodes to improve the query scalability
The goal of this test is to find out whether or not adding RAC nodes improves the scalability of GeoRaster query concurrency. In one test we used only one RAC node while in the other we used two RAC nodes.
The test system used is shown in figure 9.1 and it has 4 OC4J instances distributed on two servers evenly. We used 4 different query windows and got the total number of concurrent requests based on the test criteria. Results are shown in table 9.1.
Figure 9.1 The grid architecture with two OC4J nodes and two database RAC nodes
Oracle Database 10g GeoRaster: Scalability and Performance Analysis Page 25
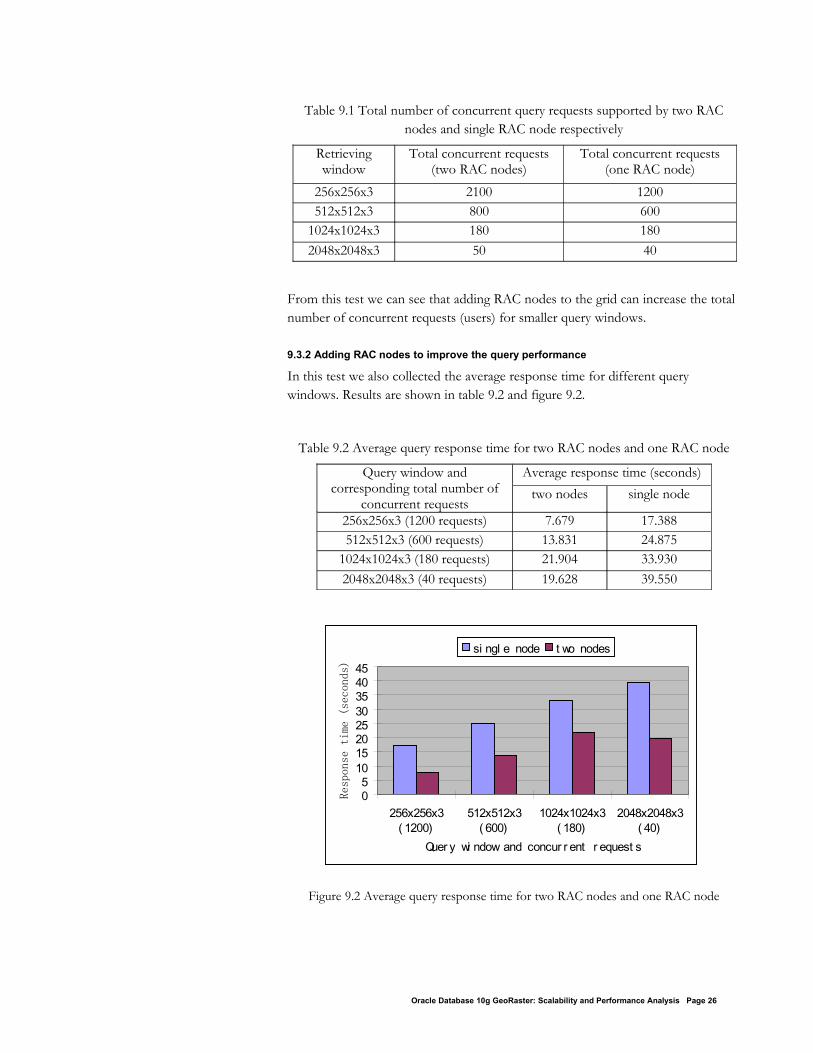
Table 9.1 Total number of concurrent query requests supported by two RAC nodes and single RAC node respectively
Retrieving window
Total concurrent requests (two RAC nodes)
Total concurrent requests (one RAC node)
256x256x3 2100 1200512x512x3 800 600
1024x1024x3 180 1802048x2048x3 50 40
From this test we can see that adding RAC nodes to the grid can increase the total number of concurrent requests (users) for smaller query windows.
9.3.2 Adding RAC nodes to improve the query performance
In this test we also collected the average response time for different query windows. Results are shown in table 9.2 and figure 9.2.
Table 9.2 Average query response time for two RAC nodes and one RAC node
Query window and corresponding total number of
concurrent requests
Average response time (seconds)two nodes single node
256x256x3 (1200 requests) 7.679 17.388512x512x3 (600 requests) 13.831 24.875
1024x1024x3 (180 requests) 21.904 33.9302048x2048x3 (40 requests) 19.628 39.550
Figure 9.2 Average query response time for two RAC nodes and one RAC node
Oracle Database 10g GeoRaster: Scalability and Performance Analysis Page 26
05
1015202530354045
256x256x3( 1200)
512x512x3( 600)
1024x1024x3( 180)
2048x2048x3( 40)
Quer y wi ndow and concur r ent r equest s
Response time (seconds)
si ngl e node t wo nodes
Obviously, with an enterprise grid environment, adding RAC nodes can improve significantly the performance of concurrent GeoRaster queries.
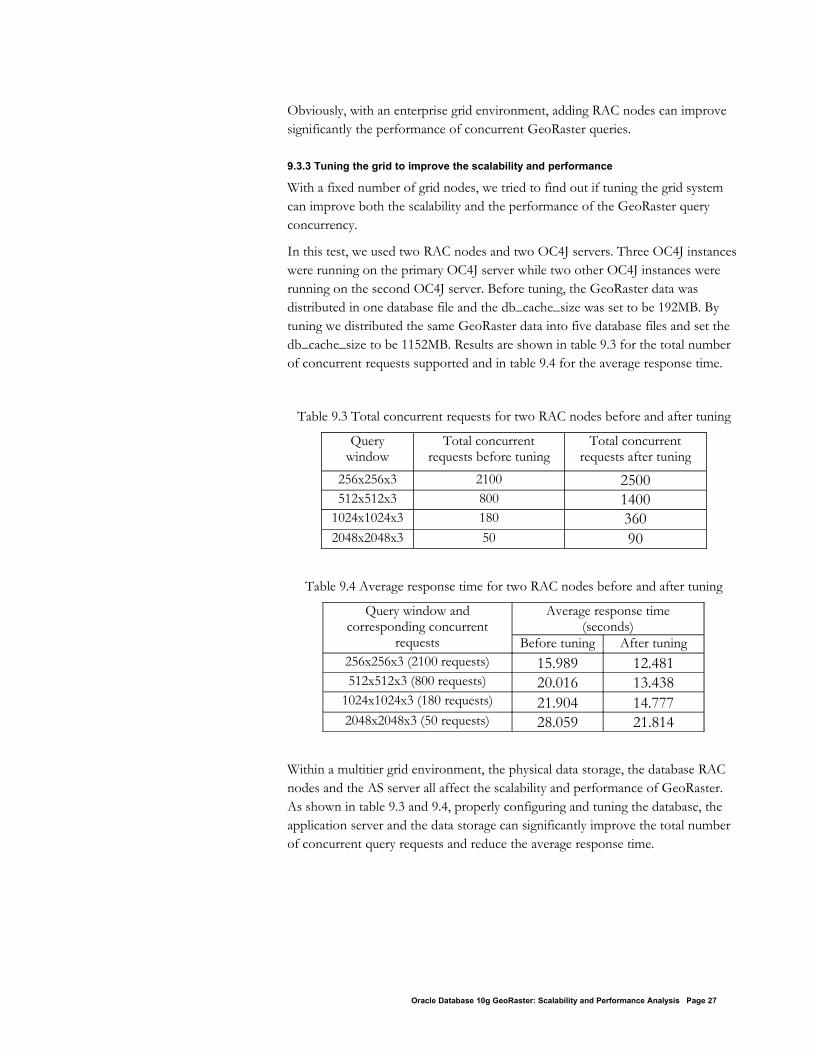
9.3.3 Tuning the grid to improve the scalability and performance
With a fixed number of grid nodes, we tried to find out if tuning the grid system can improve both the scalability and the performance of the GeoRaster query concurrency.
In this test, we used two RAC nodes and two OC4J servers. Three OC4J instances were running on the primary OC4J server while two other OC4J instances were running on the second OC4J server. Before tuning, the GeoRaster data was distributed in one database file and the db_cache_size was set to be 192MB. By tuning we distributed the same GeoRaster data into five database files and set the db_cache_size to be 1152MB. Results are shown in table 9.3 for the total number of concurrent requests supported and in table 9.4 for the average response time.
Table 9.3 Total concurrent requests for two RAC nodes before and after tuning
Query window
Total concurrent requests before tuning
Total concurrent requests after tuning
256x256x3 2100 2500512x512x3 800 1400
1024x1024x3 180 3602048x2048x3 50 90
Table 9.4 Average response time for two RAC nodes before and after tuning
Query window and corresponding concurrent
requests
Average response time (seconds)
Before tuning After tuning256x256x3 (2100 requests) 15.989 12.481512x512x3 (800 requests) 20.016 13.438
1024x1024x3 (180 requests) 21.904 14.7772048x2048x3 (50 requests) 28.059 21.814
Within a multitier grid environment, the physical data storage, the database RAC nodes and the AS server all affect the scalability and performance of GeoRaster. As shown in table 9.3 and 9.4, properly configuring and tuning the database, the application server and the data storage can significantly improve the total number of concurrent query requests and reduce the average response time.
Oracle Database 10g GeoRaster: Scalability and Performance Analysis Page 27
10 SUMMARYOne of the biggest challenges we face for large-scale image and raster data archiving and management is the huge volume of such data. Numerous remote sensors of different types on different platforms are collecting real time data about the Earth and our environment for different purposes on a daily basis. Oracle Spatial GeoRaster is the new component in Oracle 10g designed to effectively and efficiently solve the problems for raster data archiving and management. Individual GeoRaster object can be very small but it can be huge in the scale of terrabytes as well. A GeoRaster database can have millions of such GeoRaster objects, i.e., images or raster gridded datasets. The tests presented in this paper demonstrate very good scalability of Oracle Spatial GeoRaster in handling such databases and their applications. While the performance is affected in different ways by many factors, such as the raster data block size, the interleaving, the cell depth, and the compression, GeoRaster provides unique tuning tools and query functions to improve the performance. These tools and functions can be flexibly applied on the GeoRaster databases to make them best fit into different applications.
To manage huge spatial raster databases, the Oracle 10g grid technology with the new GeoRaster component provides an enterprise environment with very good scalability, robustness, security and performance. Adding database grid nodes and AS grid nodes can improve the GeoRaster concurrency and performance significantly. With proper setup of such grid computing systems, tuning the database nodes, the AS nodes and the physical data storage systems can also play a big role in the performance and scalability improvement.
Oracle Database 10g GeoRaster: Scalability and Performance Analysis Page 28

Oracle Database 10g GeoRaster: Scalability and Performance AnalysisAugust 2005Author: Jeffrey Xie, Zhun Li and Terry XuContributing Authors: Dean Tan
Oracle CorporationWorld Headquarters500 Oracle ParkwayRedwood Shores, CA 94065U.S.A.
Worldwide Inquiries:Phone: +1.650.506.7000Fax: +1.650.506.7200oracle.com
Copyright © 2005, Oracle. All rights reserved.This document is provided for information purposes only and the contents hereof are subject to change without notice.This document is not warranted to be error-free, nor subject to any other warranties or conditions, whether expressed orally or implied in law, including implied warranties and conditions of merchantability or fitness for a particular purpose. We specifically disclaim any liability with respect to this document and no contractual obligations are formed either directly or indirectly by this document. This document may not be reproduced or transmitted in any form or by any means, electronic or mechanical, for any purpose, without our prior written permission.Oracle, JD Edwards, and PeopleSoft are registered trademarks of Oracle Corporation and/or its affiliates. Other names may be trademarks of their respective owners.


