19
Oracle Enterprise Gateway An Oracle White Paper October 2011 Oracle Enterprise Manager 12c Grid Control Integration Guide OEG Gateway 11.1.1.6.0 Software

Oracle Enterprise Gateway
An Oracle White PaperOctober 2011
Oracle Enterprise Manager 12c Grid Control Integration Guide
OEG Gateway 11.1.1.6.0Software

Oracle Enterprise Gateway
Disclaimer
The following is intended to outline our general product direction. It is intended for information purposes only, and may not be incorporated into any contract. It is not a commitment to deliver any material, code, or functionality, and should not be relied upon in making purchasing decisions. The development, release, and timing of any features or functionality described for Oracle’s products remains at the sole discretion of Oracle.

Oracle Enterprise Gateway
1. Introduction.......................................................................................4Setup Used in this Guide..................................................................4
2. Adding the Gateway OEM Plugin to OEM.........................................5Prerequisite before Adding the Plugin...............................................5Add the Plugin..................................................................................5Deploy the Plugin to the Management Server and Agent..................5Select the Target Configuration........................................................6Configure the Plugin to Connect to the Gateway..............................6
3. Examples of Monitoring a Gateway in OEM......................................94. Viewing the Metrics Collected...........................................................11
Response..........................................................................................11System Statistics..............................................................................13Web Service.....................................................................................14Web Service Client...........................................................................14

Oracle Enterprise Gateway
1. Introduction
This guide describes how to monitor the Gateway using the Oracle Enterprise Manager (OEM) Grid Control. The Gateway is bundled with an OEM plugin that polls a Gateway for its status and renders the result in OEM. This plugin has been tested and confirmed to work with OEM 12g BETA.This guide describes the following:
1. The Gateway’s OEM plugin is uploaded, and deployed into OEM.2. The following Gateway status is displayed in OEM:
• Gateway uptime, memory, and CPU usage
• Web Service usage
• Client usage (when the client is an authenticated subject)
You can register multiple Gateways to be monitored in OEM.
Setup Used in this Guide
The following product versions are used in this guide:• OEG Gateway 11.1.1.6.0 or higher
• Oracle Enterprise Manager 12g BETA
4 / 19
Oracle Enterprise Gateway
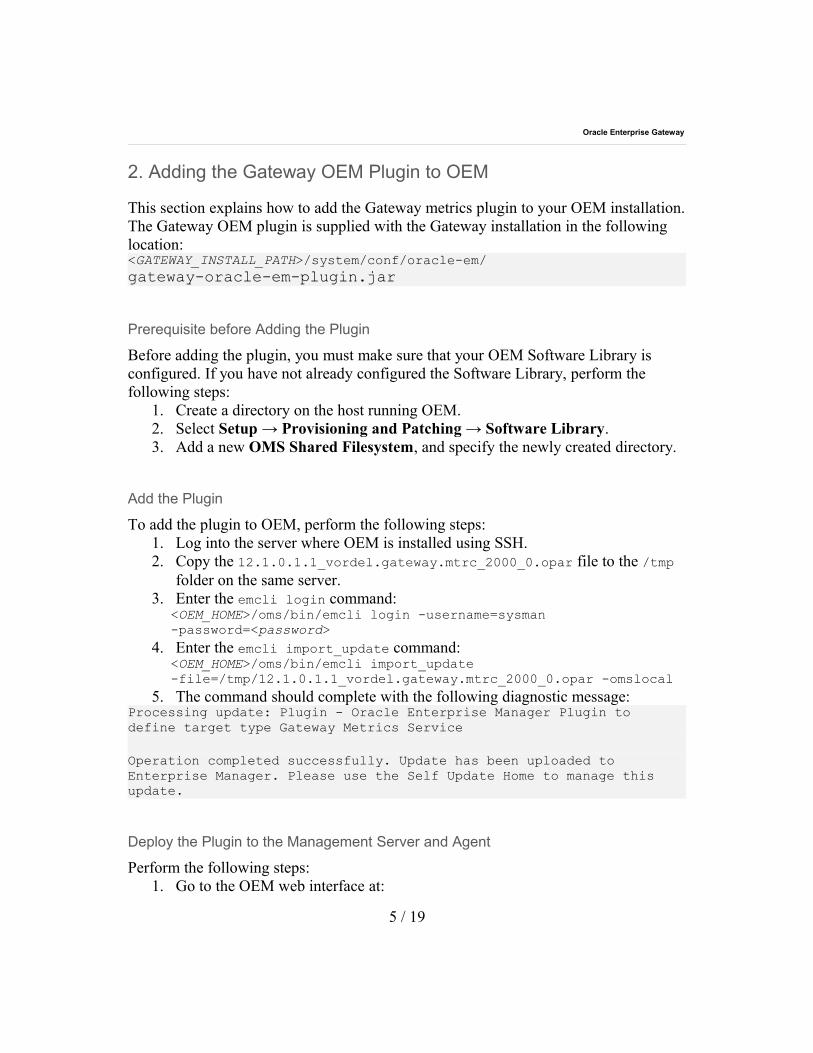
2. Adding the Gateway OEM Plugin to OEM
This section explains how to add the Gateway metrics plugin to your OEM installation. The Gateway OEM plugin is supplied with the Gateway installation in the following location:<GATEWAY_INSTALL_PATH>/system/conf/oracle-em/gateway-oracle-em-plugin.jar
Prerequisite before Adding the Plugin
Before adding the plugin, you must make sure that your OEM Software Library is configured. If you have not already configured the Software Library, perform the following steps:
1. Create a directory on the host running OEM.2. Select Setup → Provisioning and Patching → Software Library.3. Add a new OMS Shared Filesystem, and specify the newly created directory.
Add the Plugin
To add the plugin to OEM, perform the following steps:1. Log into the server where OEM is installed using SSH.2. Copy the 12.1.0.1.1_vordel.gateway.mtrc_2000_0.opar file to the /tmp
folder on the same server.3. Enter the emcli login command:
<OEM_HOME>/oms/bin/emcli login -username=sysman -password=<password>
4. Enter the emcli import_update command:<OEM_HOME>/oms/bin/emcli import_update -file=/tmp/12.1.0.1.1_vordel.gateway.mtrc_2000_0.opar -omslocal
5. The command should complete with the following diagnostic message:Processing update: Plugin - Oracle Enterprise Manager Plugin to define target type Gateway Metrics Service
Operation completed successfully. Update has been uploaded to Enterprise Manager. Please use the Self Update Home to manage this update.
Deploy the Plugin to the Management Server and Agent
Perform the following steps:1. Go to the OEM web interface at:
5 / 19

Oracle Enterprise Gateway
https://<OEM_HOST>:<OEM_PORT>:/em2. Log in.3. Click the Setup menu at the top, and choose Extensibility → Plugins.4. Locate Gateway Metrics Plugin in the table, and select it.5. Deploy the plugin on the Management Server by clicking Deploy On →
Management Servers in the table header. 6. Follow the steps in the wizard. In one of the steps, you must enter the password
of the SYS user of the database that you used to setup OEM.7. Deploy the plugin on the Agent by clicking Deploy On → Management
Agent, and follow the steps in the wizard. When the deployment process is complete, you have successfully deployed the Gateway Metrics Plugin to OEM.
Select the Target Configuration
Perform the following steps:1. When the plugin has been deployed to the agent, you must add it as a target.
Click the Targets tab at the top of the page. 2. Click Add target → Add Targets Manually.3. On the new page, select Add Non-Host Targets by Specifying Target
Monitoring Properties.4. Select Gateway Metrics Service from the Target Type drop-down list.5. Select the Monitoring Agent where you want to create the target by clicking the
magnifying glass icon.6. Click the Add Manually button, and the Add Gateway Metrics Service
screen is displayed enabling you to configure the plugin.
Configure the Plugin to Connect to the Gateway
The plugin must now be configured to connect to the Gateway. Perform the following steps:
1. Enter a Target Name. 2. Enter the connection details of the Gateway. Screenshot 1 shows an example
screen:
6 / 19

Oracle Enterprise Gateway
Screenshot 1: Gateway Target Configuration in OEM
7 / 19

Oracle Enterprise Gateway
Table 1 describes each target configuration setting:Entry DescriptionHostname IP address or fully qualified domain name of the host on
which the Gateway is running.Port The port number of the management interface of the
Gateway. In a default installation, this is 8090.Username The administrator of the Gateway’s user name. In a default
installation, this is admin.Password The password corresponding to the username. In a default
installation, this is changeme.Table 1: Target Configuration Settings
3. You can repeat this process if multiple targets need to be monitored. Repeat the steps in Section 2.3, Select the Target Configuration, and configure the plugin as described.
4. Click OK when the configuration is complete. 5. At this point, the Gateway target should be listed in OEM. Click the Gateway
target to view the status gathered by OEM.
8 / 19

Oracle Enterprise Gateway
3. Examples of Monitoring a Gateway in OEM
This section shows some example screenshots of monitoring a Gateway in OEM 12g BETA.
Gateway Home PageThe home page of the monitored Gateway is displayed in Screenshot 2. This page shows the uptime of the Gateway and the number of messages that have been successfully processed or rejected:
Screenshot 2: Gateway Home Page in OEM
9 / 19
Oracle Enterprise Gateway
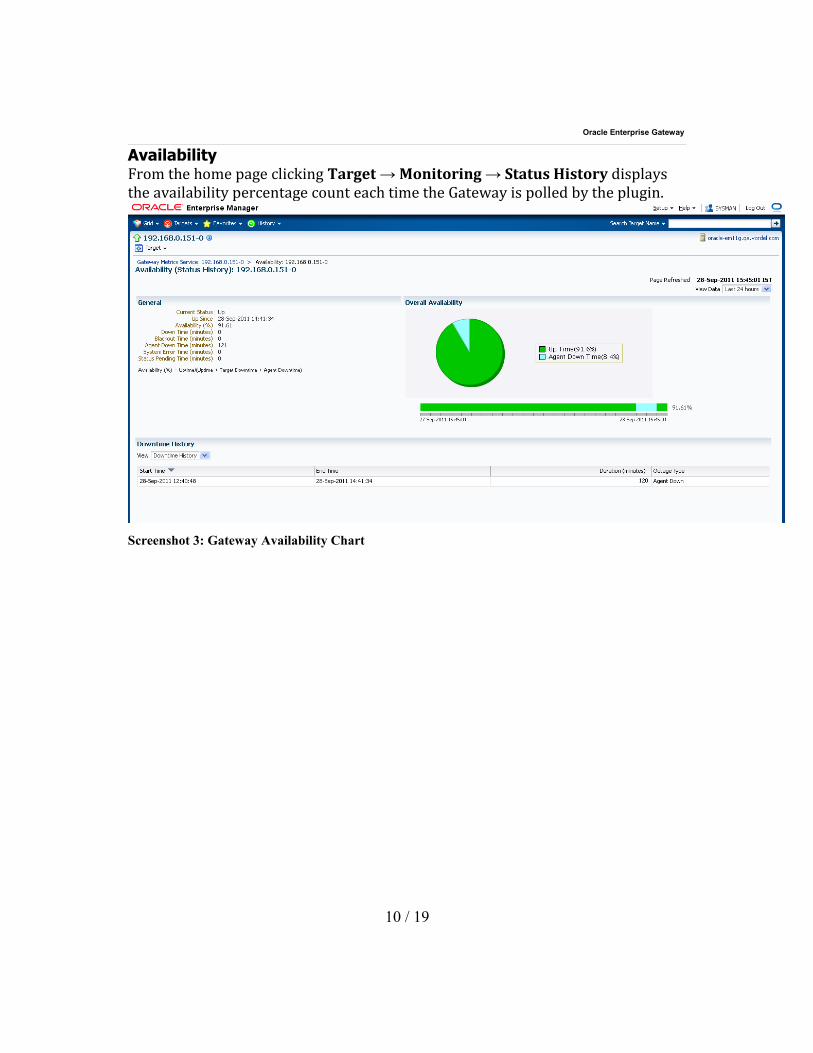
AvailabilityFrom the home page clicking Target → Monitoring → Status History displays the availability percentage count each time the Gateway is polled by the plugin.
Screenshot 3: Gateway Availability Chart
10 / 19

Oracle Enterprise Gateway
4. Viewing the Metrics Collected
To view the metrics collected from the Gateway, click Target → Monitoring → All Metrics at the top of the page.The following data is monitored for the Gateway:
• Response—availability of the Gateway
• System Statistics—CPU usage, uptime, memory, and message counts
• Web Service—Usage per web service
• Web Service Clients—Client usage per web service
Screenshot 4 shows the summary of the metrics collected:
Screenshot 4: All Metrics Collected
Response
The Response can be successful or not. The plugin polls the Gateway service to check its availability at each collection point. A chart is available from the home page to show the current and historical availability of the Gateway.Name DescriptionResponse The availability of the Gateway is either true or false.
Table 2: Response Metric
11 / 19

Oracle Enterprise Gateway
Screenshot 5: Response Metric Displayed
12 / 19

Oracle Enterprise Gateway
System Statistics
Clicking System Statistics displays the general metrics for the Gateway. For each target, there is a count maintained of Total, Successes, Failures and Exceptions.Name DescriptionCPU Usage CPU usage of the Gateway systemException Count Count of Exception messagesFailure Count Count of Failure messagesMemory Free Amount of free memory on the Gateway systemSuccess Count Count of Successful messagesTotal Count Count of All messages processed through the GatewayUptime Uptime of the Gateway processTable 3: System Statistics Metrics
Screenshot 6: System Statistics Metrics Displayed
Message CountersThe message counters are described as follows:
• A Success Count is where a filter in a policy processes a message and informs the Gateway to proceed filtering the message along the default route in the circuit.
• A Failure Count is where the filter decides to inform the Gateway to route the message along the alternative route (failure path).
13 / 19

Oracle Enterprise Gateway
• An Exception Count– if a filter aborts, the exception count increases. A filter aborts if it hits an abnormality in its processing (for example, if an LDAP directory is down).
• The Total Count is the combination of success, failures, and exceptions.
Web Service
Clicking Web Service displays a list of web service processes in the Gateway. For each web service listed, the associated metrics are displayed in the same row. Clicking the number in a particular column displays a graph of historical data for that metric and service. Name DescriptionException Count Count of Exception messagesFailure Count Count of Failure messagesSuccess Count Count of Successful messagesTotal Count Totals of the Exception, Failure, and Success Counts
Table 4: Web Service Metrics
Screenshot 7: Web Service Metrics Displayed
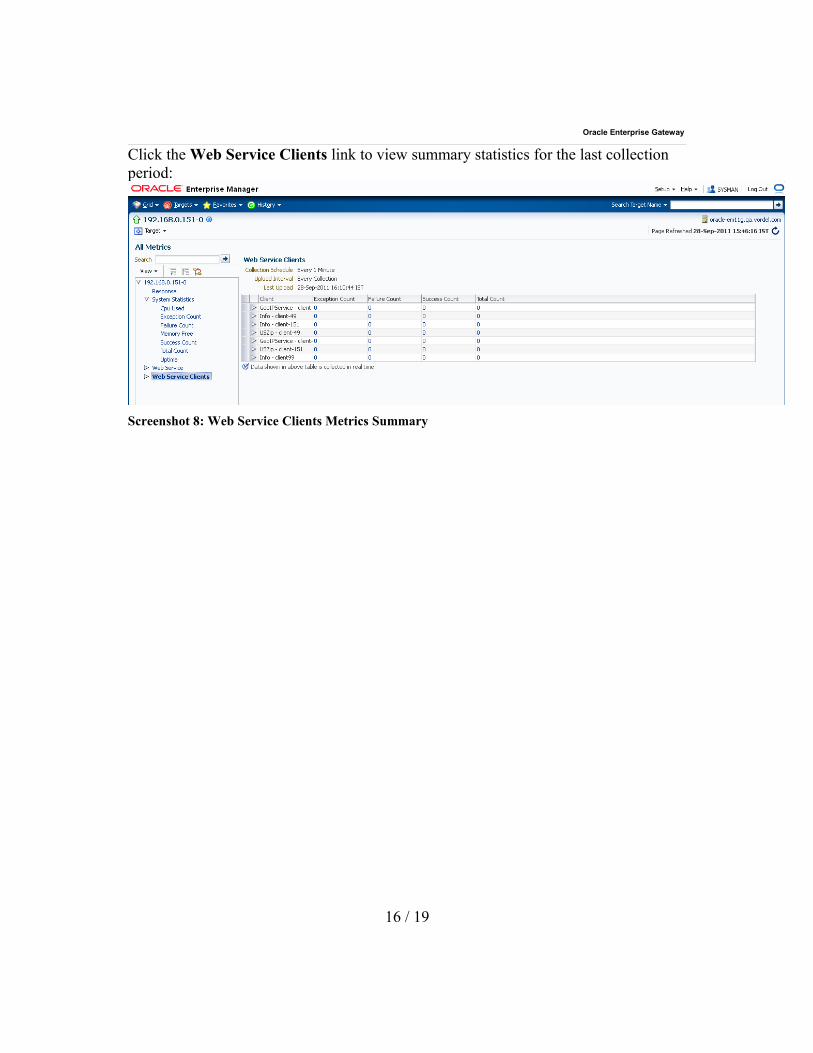
Web Service Client
Statistics for authenticated clients that connect to a Web Service are stored in the Web Service Clients metrics. Clicking the number in a particular column displays a graph of data for that metric with the Client Web Service usage. The names are delimited by a hyphen (-), the first part is the Web Service name, and the second part is the authenticated client’s subject name.
14 / 19

Oracle Enterprise Gateway
Name DescriptionException Count Count of Exception messagesFailure Count Count of Failure messagesSuccess Count Count of Successful messagesTotal Count Totals of the Exception, Failure and Success Counts
Table 5: Web Service Clients Metrics
15 / 19
Oracle Enterprise Gateway
Click the Web Service Clients link to view summary statistics for the last collection period:
Screenshot 8: Web Service Clients Metrics Summary
16 / 19

Oracle Enterprise Gateway
Appendix A. Format of Gateway Metric Data
A request to the OEG Gateway on the URL http://localhost:8090/metrics retrieves XML content that describes the metric targets present in the service at the time of the request. The following XML fragment is a sample of this metric data:<data><system uptime="337795" cpuUsed="4" memoryFree="1633676" numMessagesProcessed="38753" monitoringEnabled="true" messageMonitoringEnabled="false" metricsStoringEnabled="true"metricsStoreError="0" metricsStoreFatalError="0" serverTitle="VordelGateway" serverHost="Colmmonk-laptop" processSignature="Colmmonk-laptop:VordelGateway"/><statTarget target="System overview" type="StatTarget" id="1" uptime="337802" successes="34141" failures="4562" exceptions="50" numClients="6" numAlerts="0" numSLABreaches="0"/><statTargetClass target="Remote hosts" type="Container" id="2" classId="2" uptime="0"><statTarget target="www.webservicemart.com:80" type="StatTarget" id="6" uptime="337799" numInConnections="0" numOutConnections="0" numTransactions="0" volumeBytesIn="0" volumeBytesOut="0"respStatRange1="0" respStatRange2="0" respStatRange3="0" respStatRange4="0" respStatRange5="0" respTimeRange1="0" respTimeRange2="0" respTimeRange3="0" respTimeRange4="0" respTimeRange5="0"respTimeRange6="0" respTimeRange7="0" respTimeRange8="0" respTimeRange9="0" respTimeRange10="0" numReportedDowns="0" numReportedUps="0"/><statTarget target="footballpool.dataaccess.eu:80" type="StatTarget" id="7" uptime="337799" numInConnections="0" numOutConnections="0" numTransactions="29616" volumeBytesIn="737593366"volumeBytesOut="16619543" respStatRange1="0" respStatRange2="29616" respStatRange3="0" respStatRange4="0" respStatRange5="0" respTimeRange1="44" respTimeRange2="1071" respTimeRange3="3222"respTimeRange4="522" respTimeRange5="5" respTimeRange6="1" respTimeRange7="2" respTimeRange8="0" respTimeRange9="0" respTimeRange10="24749" numReportedDowns="0" numReportedUps="0"/><statTarget target="www.restfulwebservices.net:80" type="StatTarget" id="8" uptime="337799" numInConnections="0" numOutConnections="0" numTransactions="0" volumeBytesIn="0" volumeBytesOut="0"respStatRange1="0" respStatRange2="0" respStatRange3="0" respStatRange4="0" respStatRange5="0" respTimeRange1="0" respTimeRange2="0" respTimeRange3="0" respTimeRange4="0" respTimeRange5="0"respTimeRange6="0" respTimeRange7="0" respTimeRange8="0" respTimeRange9="0" respTimeRange10="0" numReportedDowns="0" numReportedUps="0"/></statTargetClass><statTargetClass target="Messaging system" type="Container" id="3" classId="6" uptime="0"/><statTargetClass target="Web Service Statistics Container" type="Container" id="4" classId="10" uptime="0"><statTarget target="Info" type="StatTarget" id="41" uptime="274351" numMessages="15979" successes="14794" failures="1141" exceptions="44"><statTarget target="client-151" type="StatTarget" id="42" uptime="274351" numMessages="7934" successes="7347" failures="566" exceptions="21"/><statTarget target="client99" type="StatTarget" id="43" uptime="274349" numMessages="7935" successes="7345" failures="567" exceptions="23"/><statTarget target="client-49" type="StatTarget" id="48" uptime="272224" numMessages="110" successes="102" failures="8" exceptions="0"/></statTarget><statTarget target="GeoIPService" type="StatTarget" id="44" uptime="274308" numMessages="573" successes="0" failures="573" exceptions="0"><statTarget target="client-151" type="StatTarget" id="45" uptime="274308" numMessages="566" successes="0" failures="566" exceptions="0"/><statTarget target="client-49" type="StatTarget" id="49" uptime="272128" numMessages="7" successes="0" failures="7" exceptions="0"/></statTarget><statTarget target="USZip" type="StatTarget" id="46" uptime="274307" numMessages="573" successes="0" failures="573" exceptions="0"><statTarget target="client-151" type="StatTarget" id="47" uptime="274307" numMessages="566" successes="0" failures="566" exceptions="0"/><statTarget target="client-49" type="StatTarget" id="50" uptime="272123" numMessages="7" successes="0" failures="7" exceptions="0"/></statTarget></statTargetClass><statTargetClass target="Client Statistics Container" type="Container" id="5" classId="12" uptime="0"/>
17 / 19

Oracle Enterprise Gateway
<statTarget target="AccumalativeWebServiceCount" type="StatTarget" id="39" uptime="274351" numMessages="17125"/><statTarget target="AccumalativeClientsCount" type="StatTarget" id="40" uptime="274351" numMessages="0"/><sttvc>20-50</sttvc></data>Each statTarget element represents a potential source of metric data. The id attribute associated with this element identifies the target so that metrics associated with that particular target can be retrieved.To retrieve metrics for a particular target of interest, append a query string that specifies the target to the URL. For example, http://localhost:8090/metrics?target=7 retrieves metric data for the metric target associated with the statTarget for which the id attribute value is 7.The following XML sample demonstrates the format of the data returned. This data is inserted near the end of the original XML reply. The stat element is repeated a number of times for sequential timestamps.<total time="1143" successes="0" failures="0" exceptions="0" /><stat twl="5" timestamp="1231431545" successes="0" failures="0" exceptions="0" />
The total element provides metric data for the target from the time that it was instantiated. The time attribute specifies the time in seconds since the target was created.
18 / 19
Oracle Enterprise Gateway
Oracle Enterprise GatewayMay 2011Author:
Oracle CorporationWorld Headquarters500 Oracle ParkwayRedwood Shores, CA 94065U.S.A.
Worldwide Inquiries:Phone: +1.650.506.7000Fax: +1.650.506.7200oracle.com
Copyright © 2011, Oracle and/or its affiliates. All rights reserved. This document is provided for information purposes only and the contents hereof are subject to change without notice. This document is not warranted to be error-free, nor subject to any other warranties or conditions, whether expressed orally or implied in law, including implied warranties and conditions of merchantability or fitness for a particular purpose. We specifically disclaim any liability with respect to this document and no contractual obligations are formed either directly or indirectly by this document. This document may not be reproduced or transmitted in any form or by any means, electronic or mechanical, for any purpose, without our prior written permission.
Oracle and Java are registered trademarks of Oracle and/or its affiliates. Other names may be trademarks of their respective owners.
AMD, Opteron, the AMD logo, and the AMD Opteron logo are trademarks or registered trademarks of Advanced Micro Devices. Intel and Intel Xeon are trademarks or registered trademarks of Intel Corporation. All SPARC trademarks are used under license and are trademarks or registered trademarks of SPARC International, Inc. UNIX is a registered trademark licensed through X/Open Company, Ltd. 0410
19 / 19

![Gateway Documentation - FCUBSPDService Oracle FLEXCUBE ... · Gateway Documentation - FCUBSPDService Oracle FLEXCUBE Universal Banking Release FCUBS_12.1.0.0.0 [October][2015]](https://static.documents.pub/doc/80x56/5d13a68588c993f1238bf0e8/gateway-documentation-fcubspdservice-oracle-flexcube-gateway-documentation.jpg)


![Gateway Documentation - FCUBSSMService Oracle FLEXCUBE ......Gateway Documentation - FCUBSSMService Oracle FLEXCUBE Universal Banking Release FCUBS_12.1.0.0.0 [October][2015]](https://static.documents.pub/doc/80x56/612ea8de1ecc51586942f3e2/gateway-documentation-fcubssmservice-oracle-flexcube-gateway-documentation.jpg)


