104
Oracle Financial Services Liquidity Risk Management Analytics User Guide Release 8.0.6.0.0

Oracle Financial Services
Liquidity Risk Management
Analytics User Guide
Release 8.0.6.0.0

Analytics User Guide: Oracle Financial Services Liquidity Risk Management
Release 8.0.6.0.0
ii
Oracle Financial Services Liquidity Risk Management Analytics User Guide, Release 8.0.6.0.0
Copyright © 2018, Oracle and/or its affiliates. All rights reserved.
Primary Author: Vineeta Mishra
Contributor: Januelle Pinto
Oracle and Java are registered trademarks of Oracle and/or its affiliates. Other names may be
trademarks of their respective owners.
Intel and Intel Xeon are trademarks or registered trademarks of Intel Corporation. All SPARC trademarks
are used under license and are trademarks or registered trademarks of SPARC International, Inc. AMD,
Opteron, the AMD logo, and the AMD Opteron logo are trademarks or registered trademarks of Advanced
Micro Devices. UNIX is a registered trademark of The Open Group.
This software and related documentation are provided under a license agreement containing restrictions
on use and disclosure and are protected by intellectual property laws. Except as expressly permitted in
your license agreement or allowed by law, you may not use, copy, reproduce, translate, broadcast,
modify, license, transmit, distribute, exhibit, perform, publish, or display any part, in any form, or by any
means. Reverse engineering, disassembly, or decompilation of this software, unless required by law for
interoperability, is prohibited.
The information contained herein is subject to change without notice and is not warranted to be error-free.
If you find any errors, please report them to us in writing. If this is software or related documentation that
is delivered to the U.S. Government or anyone licensing it on behalf of the U.S. Government, the
following notice is applicable:
U.S. GOVERNMENT END USERS: Oracle programs, including any operating system, integrated
software, any programs installed on the hardware, and/or documentation, delivered to U.S. Government
end users are "commercial computer software" pursuant to the applicable Federal Acquisition Regulation
and agency-specific supplemental regulations. As such, use, duplication, disclosure, modification, and
adaptation of the programs, including any operating system, integrated software, any programs installed
on the hardware, and/or documentation, shall be subject to license terms and license restrictions
applicable to the programs. No other rights are granted to the U.S. Government.
This software or hardware is developed for general use in a variety of information management
applications. It is not developed or intended for use in any inherently dangerous applications, including
applications that may create a risk of personal injury. If you use this software or hardware in dangerous
applications, then you shall be responsible to take all appropriate fail-safe, backup, redundancy, and
other measures to ensure its safe use. Oracle Corporation and its affiliates disclaim any liability for any
damages caused by use of this software or hardware in dangerous applications.
Analytics User Guide: Oracle Financial Services Liquidity Risk Management
Release 8.0.6.0.0
iii
This software or hardware and documentation may provide access to or information on content, products,
and services from third parties. Oracle Corporation and its affiliates are not responsible for and expressly
disclaim all warranties of any kind with respect to third-party content, products, and services. Oracle
Corporation and its affiliates will not be responsible for any loss, costs, or damages incurred due to your
access to or use of third-party content, products, or services.

Analytics User Guide: Oracle Financial Services Liquidity Risk Management
Release 8.0.6.0.0
4
TTAABBLLEE OOFF CCOONNTTEENNTTSS
ABOUT THE GUIDE ......................................................................................................................................... 8
SCOPE OF THE GUIDE .................................................................................................................................... 8
DOCUMENTATION ACCESSIBILITY .................................................................................................................. 8
ACCESS TO ORACLE SUPPORT ...................................................................................................................... 8
WHAT’S NEW IN THIS RELEASE ...................................................................................................................... 10
1 LIQUIDITY RISK REPORTS ...................................................................................................................... 11
1.1 Overview .................................................................................................................................................. 11
2 LIQUIDITY GAP SUBJECT AREA .............................................................................................................. 13
2.1 Liquidity Gap Summary – Base Currency ................................................................................................ 14
2.2 Liquidity Gap Summary – <Currency Type> ............................................................................................ 15
2.3 Liquidity Gap Historical Variance Analysis ............................................................................................... 17
2.4 Liquidity Gap Variance Analysis Across Runs......................................................................................... 19
2.5 Dynamic Balance Sheet - Base Currency ................................................................................................ 22
2.6 Dynamic Balance Sheet - <Currency Type> ............................................................................................ 22
3 DETAILED GAP ANALYSIS SUBJECT AREA .............................................................................................. 23
3.1 Detailed Bucket-wise Gap Analysis .......................................................................................................... 24
3.2 Liquidity Gap across Stress Scenarios - Reporting Currency .................................................................. 26
3.3 Gap Analysis - Top N Large Customers ................................................................................................... 27
3.4 Liquidity Gap Trend Analysis ................................................................................................................... 28
4 COUNTERBALANCING SUBJECT AREA .................................................................................................... 30
4.1 Liquidity Gap Analysis Post Counterbalancing ......................................................................................... 30
5 LIQUIDITY RATIOS SUBJECT AREA ......................................................................................................... 33
5.1 Liquidity Ratios ......................................................................................................................................... 33
5.2 Liquidity Coverage Ratio Components ..................................................................................................... 35
5.3 Net Stable Funding Ratio Components .................................................................................................... 37
5.4 Liquidity Coverage Ratio by Significant Currencies.................................................................................. 39
5.5 Liquidity Ratio Historical Variance Analysis ............................................................................................. 40
6 LCR DETAILS SUBJECT AREA ............................................................................................................... 41
6.1 High Quality Liquid Assets ....................................................................................................................... 42
6.2 Break-up of Stock of High Quality Liquid Assets ...................................................................................... 43

Analytics User Guide: Oracle Financial Services Liquidity Risk Management
Release 8.0.6.0.0
5
6.3 Break-up of Stock of HQLA Denominated in Significant Currencies ........................................................ 45
6.4 Liquidity Transferability Restrictions ......................................................................................................... 46
6.5 Liquidity Ratio Trend Analysis .................................................................................................................. 47
7 NSFR DETAILS SUBJECT AREA ............................................................................................................. 49
7.1 NSFR Constituents by Product Type s ..................................................................................................... 49
7.2 NSFR Break-up by Maturity ..................................................................................................................... 50
7.3 Off-Balance Sheet Items by Absolute Value ............................................................................................ 50
7.4 RSF Assets by Encumbrance Period ....................................................................................................... 51
7.5 NSFR Trend Analysis ............................................................................................................................... 51
8 REGULATION YY SUBJECT AREA ........................................................................................................... 53
8.1 Available and Required Liquidity Buffer ................................................................................................... 53
8.2 Buffer and Buffer Requirements Across Stress Horizons ......................................................................... 54
8.3 Cash Flow Projections ............................................................................................................................. 55
8.4 Available Buffer Composition ................................................................................................................... 56
9 INTRA-DAY LIQUIDITY METRICS SUBJECT AREA ...................................................................................... 59
9.1 Daily Maximum Intra-day Liquidity Usage ................................................................................................ 60
9.2 Start of Day Available Intra-day Liquidity ................................................................................................. 60
9.3 Total Payments ........................................................................................................................................ 61
9.4 Time-Specific Obligations ........................................................................................................................ 61
9.5 Value of Payments Made on Behalf of Correspondent Banking Customers ............................................ 62
9.6 Intraday Credit Lines Extended to Correspondent Banking Customers ................................................... 63
9.7 Intra-day Throughput ................................................................................................................................ 64
10 INTRA-DAY REAL TIME MONITORING SUBJECT AREA .............................................................................. 65
10.1 Available Credit Lines .............................................................................................................................. 65
10.2 Available Intraday Eligible Sources of Liquidity ........................................................................................ 66
10.3 Time Specific Obligations ......................................................................................................................... 67
10.4 Payments Snapshot ................................................................................................................................. 67
10.5 Cumulative Net Position ........................................................................................................................... 68
10.6 Payments Received ................................................................................................................................. 68
10.7 Payments Sent ......................................................................................................................................... 69
11 INTERIM RESULTS SUBJECT AREA ......................................................................................................... 70
11.1 Interim Results across Buckets ................................................................................................................ 70
11.2 Interim Liquidity Gaps across Business Assumptions .............................................................................. 71
12 FUNDING CONCENTRATION SUBJECT AREA ............................................................................................ 73

Analytics User Guide: Oracle Financial Services Liquidity Risk Management
Release 8.0.6.0.0
6
12.1 Concentration of Funding Liabilities across Dimensions .......................................................................... 73
12.2 Funding Concentration Trend Analysis .................................................................................................... 74
12.3 List of Assets by Significant Currencies ................................................................................................... 75
12.4 List of Liabilities by Significant Currencies ............................................................................................... 76
13 DATA ANALYSIS SUBJECT AREA ............................................................................................................ 77
13.1 Deposit Balances ..................................................................................................................................... 77
13.2 Loan Balances ......................................................................................................................................... 78
13.3 Marketable Assets .................................................................................................................................... 79
13.4 Repos ....................................................................................................................................................... 79
13.5 Delinquency Report .................................................................................................................................. 80
13.6 Delinquent Customer ............................................................................................................................... 81
14 FORWARD LIQUIDITY ANALYSIS SUBJECT AREA ..................................................................................... 83
14.1 Forward Liquidity Gap - <Currency Type> ............................................................................................... 83
14.2 Forward Liquidity Ratio Analysis .............................................................................................................. 85
14.3 Balance Sheet Mismatch ......................................................................................................................... 86
14.4 Forward Balance Position ........................................................................................................................ 87
15 FORWARD LIQUIDITY ACROSS DATES SUBJECT AREA ............................................................................ 89
15.1 Forward Liquidity Gap Variance Analysis - <Currency Type> .................................................................. 90
15.2 Forward Liquidity Gap Across Dates- <Currency Type> .......................................................................... 92
15.3 Forward Liquidity Ratio Variance Analysis ............................................................................................... 93
15.4 Forward Liquidity Ratio Across Dates ...................................................................................................... 94
15.5 Forward Balance Analysis Across Dates ................................................................................................. 96
16 ANNEXURE A: LIST OF LRM REPORTS ................................................................................................... 98
Analytics User Guide: Oracle Financial Services Liquidity Risk Management
Release 8.0.6.0.0
7
DDOOCCUUMMEENNTT CCOONNTTRROOLL
Version Number Revision Date Changes Done
1.0 Created May 2018 Captured updates for 8.0.6.0.0 release
This document provides a comprehensive knowledge about the reports in Oracle Financial
Services Liquidity Risk Management, Release 8.0.6.0.0. The latest copy of this guide can be
accessed from OHC Documentation Library.

Analytics User Guide: Oracle Financial Services Liquidity Risk Management
Release 8.0.6.0.0
8
AABBOOUUTT TTHHEE GGUUIIDDEE
This section provides a brief description of the scope, the audience, the references, the organization of
the user guide and conventions incorporated into the user guide. The topics in this section are organized
as follows:
Scope of the guide
Intended Audience
Documentation Accessibility
Access to Oracle Support
Related Information Sources
SSCCOOPPEE OOFF TTHHEE GGUUIIDDEE
The objective of this user guide is to provide a comprehensive knowledge about the reports available in
Oracle Financial Services Liquidity Risk Management, Release 8.0.6.0.0. This analytics user guide is
intended to help you understand the reports which are part of Oracle Financial Services Liquidity Risk
Management (LRM) release 8.0.6.0.0 and details the dashboard reports and regulatory templates used in
the computation and management of Liquidity Risk.
INTENDED AUDIENCE
Welcome to release 8.0.6.0.0 of the Oracle Financial Services Liquidity Risk Management Analytics user
guide. This manual is intended for the following audience:
Business User: This user reviews the functional requirements and information sources, like reports.
Strategists: This user identifies strategies to maintain an ideal liquidity ratio and liquidity gap based on the estimated inflow and outflow of cash.
Data Analyst: This user would be involved with cleaning, validation, and importing of data into the OFSAA Download Specification Format.
DDOOCCUUMMEENNTTAATTIIOONN AACCCCEESSSSIIBBIILLIITTYY
For information about Oracle's commitment to accessibility, visit the Oracle Accessibility Program website
at http://www.oracle.com/pls/topic/lookup?ctx=acc&id=docacc.
AACCCCEESSSS TTOO OORRAACCLLEE SSUUPPPPOORRTT
Oracle customers have access to electronic support through My Oracle Support. For information, visit
http://www.oracle.com/pls/topic/lookup?ctx=acc&id=info or visit
http://www.oracle.com/pls/topic/lookup?ctx=acc&id=trs if you are hearing impaired.

Analytics User Guide: Oracle Financial Services Liquidity Risk Management
Release 8.0.6.0.0
9
RELATED INFORMATION SOURCES OFSAA Liquidity Risk Management 8.0.6.0.0 Installation Guide on OHC Documentation Library
OFS Liquidity Risk Management Release 8.0.6.0.0 User Guide on OHC Documentation Library
OFS Liquidity Risk Management Release - Regulatory Calculations V8.0.6.0.0 User Guide on OHC Documentation Library
OFS Analytical Applications Infrastructure User Guide on OHC Documentation Library
Analytics User Guide: Oracle Financial Services Liquidity Risk Management
Release 8.0.6.0.0
10
WWhhaatt’’ss NNeeww iinn tthhiiss RReelleeaassee
The Oracle Financial Services Liquidity Risk Management Release 8.0.6.0.0 is an enhancement of the
existing Oracle Financial Services Liquidity Risk Management Release 8.0.5.0.0 which has the following
enhanced features:
This release includes bug fixes.
Note: Oracle Financial Services Liquidity Risk Management (OFS LRM) Application pack was previously
known as Oracle Financial Services Treasury Risk (OFS TR) Application pack. OFS TR application pack
has been renamed to Oracle Financial Services Liquidity Risk Management (OFS LRM) application pack,
Release 8.0.6.0.0 onwards.

Analytics User Guide: Oracle Financial Services Liquidity Risk Management
Release 8.0.6.0.0
11
11 LLiiqquuiiddiittyy RRiisskk RReeppoorrttss
11..11 OOvveerrvviieeww
Regulatory requirements, whether regional or global such as BCBS 239, require banks to have stringent
risk reporting practices throughout the organization. Banks across jurisdictions are gearing up to comply
with the new stringent reporting requirements in order to comply with frequent regulatory submissions and
management reporting. Oracle Financial Services Liquidity Risk Management helps drive this with an
extensive set of pre-configured regulatory templates, graphical reports and dashboards to address
complex reporting requirements on-demand.
Oracle Financial Services Liquidity Risk Management aims to provide a complete solution to their liquidity
risk reporting challenges. This document also details the liquidity risk related business requirements for
intra-day monitoring metrics. BIS has issued guidelines for calculating and monitoring intra-day liquidity
management. These guidelines are meant to complement its earlier set of guidelines on risk management
and supervision of funding liquidity including the Basel III guidelines.
For viewing the liquidity position of a bank as of a forward date/s under contractual, BAU and stress
conditions Liquidity Risk Forecasting Reports are introduced. LRM Forecasting is required to measure
and monitor the liquidity metrics within the limit boundaries, regulatory requirements and market
expectations.
Oracle Financial Services Liquidity Risk Mangement Analytics, provides a pre-configured set of
Forecasting canned dashboards, with graphical and tabular reports, and detailed drill down reports.
This document provides details around the dashboard reports and regulatory templates supported by the
application.
The reports are divided and displayed into two dashboards: Management Reports and Graphical Reports
for which detailed drill-throughs are available in Liquidity Risk dashboard. Whereas, the regulatory
templates and associated reports are available in the Regulatory Reporting dasboard.
The reports which form part of the Liquidity Risk dashboard are grouped into the following subject areas
based on their functionality:
Liquidity Gap
Detailed Gap Analysis
Counterbalancing
Liquidity Ratios
LCR Details
NSFR Details
Regulation YY
Intra-day Liquidity Metrics
Real Time Monitoring
Interim Results
Funding Concentration

Analytics User Guide: Oracle Financial Services Liquidity Risk Management
Release 8.0.6.0.0
12
Data Analysis
Forward Liquidity Analysis
Forward Liquidity Across Dates
For a complete list of reports refer Annexure A: List of LRM Reports.
Note:
The liquidity risk reports, which were earlier being packaged along with OFS Asset Liability Managemnet
Analytics, are now available as part of OFS Liquidity Risk Management. The reports continue to be
available as part of OFS ALM Analytics up to version 6.2 to support reporting for OFS LRM v3.0. This
change is applicable from version OFS LRM v8.0 onwards.

Analytics User Guide: Oracle Financial Services Liquidity Risk Management
Release 8.0.6.0.0
13
22 LLiiqquuiiddiittyy GGaapp SSuubbjjeecctt AArreeaa
Liquidity Gap tab consists of the following page level filters which are applicable to all the reports in this
subject area.
Dashboard Name Liquidity Risk
Subject Area Liquidity Gap
Page Level Filters
As of Date: This is a selection from the calendar.
Process/Run: This is a drop down selection. The drop down list is
filtered based on the date selected.
Scenario: This is a drop down selection. The drop down list is filtered
based on the Run selected.
Run Execution ID: This is a drop down selection. The drop down list
is filtered based on As of Date, Run and Scenario selected.
Legal Entity: This is a drop down selection. The drop down list is
filtered based on As of Date, Run and Scenario selected.
Currency Type: This is a drop down selection of one of the following
options: Local Currency and Reporting Currency.
Reporting Bucket Definition: This is a drop down selection. The drop
down list is displayed based on the Time Bucket Definition selected in the given Run.
Bucket Level: This is a drop down selection. The drop down list is
filtered based on the Reporting Time Bucket selected.
Time Bucket Display: This is a drop down selection of one of the
following options: Bucket Name and Bucket Start and End Date. All reports displaying the time buckets will either display the bucket name or the start & end date of each bucket based on this selection.
Page Level Display Parameters
Run Type
Consolidation Type
The following reports are displayed as part of the Liquidity Gap subject area:
Liquidity Gap Analysis – Base Currency
Liquidity Gap Analysis – <Currency Type>
Liquidity Gap Historical Variance Analysis
Liquidity Gap Variance Analysis across Runs
Dynamic Balance Sheet – Base Currency
Dynamic Balance Sheet – <Currency Type>

Analytics User Guide: Oracle Financial Services Liquidity Risk Management
Release 8.0.6.0.0
14
22..11 LLiiqquuiiddiittyy GGaapp SSuummmmaarryy –– BBaassee CCuurrrreennccyy
Report Name Liquidity Gap Analysis - Base Currency
Report Level Filters Not applicable
Report Description
This report displays the liquidity gap results in each selected natural currency for the time bucket selected. Both the graphical and tabular report display the gap in terms of both principal and interest. The time buckets are displayed based on the bucket level selected as part of the page level filter.
Report Type
Graphical Report:
Combination of Line and Stacked Column Chart
Time Buckets of the selected bucket level are displayed on the x-axis. Principal and interest gaps are displayed on the y-axis as stacked column values. Cumulative gap is displayed on the y-axis as a line.
Tabular Report:
The following are displayed as row items:
Inflows – Principal, Interest and Total
Outflows – Principal, Interest and Total
Liquidity Gap – Principal, Interest and Total
Gap as % of Total Outflows
Gap Limit
Deviation from Gap Limit
Cumulative Gap – Principal, Interest and Total
The time buckets corresponding to the bucket level selected as part of the page level filter are displayed as column items.
Dimensions
Legal Entity
Currency
Principal/Interest Cash Flows
Line of Business
Product Type
Product
Customer Type
Customer
Account
Base Measures
Principal Cash Flows
Interest Cash Flows
Gap Limit

Analytics User Guide: Oracle Financial Services Liquidity Risk Management
Release 8.0.6.0.0
15
Computed Measures
Total Inflows
Total Outflows
Liquidity Gap – Principal, Interest and Total
Gap as % of Total Outflows
Deviation from Gap Limit
Cumulative Gap – Principal, Interest and Total
Drill-through On
Graphical Report:
Clicking each column in the column chart.
Tabular Report:
Row level drill-through on the principal, interest and total components of Inflows, Outflows and Liquidity Gap. Column drill-through on each time bucket column is no longer required.
Drill-through’s
The drill-through sequence remains unchanged for both the tabular and graphical reports as follows:
Level 1: Line of Business
Level 2: Product Type
Level 3: Product
Level 4: Customer Type
Level 5: Customer
Level 6: Account
Graphical Report:
On clicking each column the drill-through report will display the break-up of all 3 measures, such as principal, interest and cumulative gap across the dimension on the drill- through. All drill- through reports are combination of line and stacked column charts as per the original report.
Tabular Report:
Drill-through is enabled on the following row items as per the existing drill- through sequence:
Inflows – Principal, Interest and Total
Outflows – Principal, Interest and Total
Liquidity Gap – Principal, Interest and Total
22..22 LLiiqquuiiddiittyy GGaapp SSuummmmaarryy –– <<CCuurrrreennccyy TTyyppee>>
Report Name Liquidity Gap Analysis - <Currency Type>
Report Level Filters Not applicable
Report Description
The name of this report changes based on the Currency Type selected as part of the page level filters. For instance if the currency type is selected as Reporting Currency, the name of this report is displayed as Liquidity Gap Analysis – Reporting Currency.

Analytics User Guide: Oracle Financial Services Liquidity Risk Management
Release 8.0.6.0.0
16
This report displays the liquidity gap results in the selected currency type for the time bucket selected. Both the graphical and tabular report display the gap in terms of both principal and interest. Time buckets are displayed based on the bucket level selected as part of the page level filter.
Report Type
Graphical Report:
Combination of Line and Stacked Column Chart
Time Buckets of the selected bucket level are displayed on the x-axis. Principal and interest gaps are displayed on the y-axis as stacked column values. Cumulative gap is displayed on the y-axis as a line.
Tabular Report:
The following are displayed as row items:
Inflows – Principal, Interest and Total
Outflows – Principal, Interest and Total
Liquidity Gap – Principal, Interest and Total
Gap as % of Total Outflows
Gap Limit
Deviation from Gap Limit
Cumulative Gap – Principal, Interest and Total
The time buckets corresponding to the bucket level selected as part of the page level filter are displayed as column items.
Dimensions
Legal Entity
Currency
Principal/Interest Cash Flows
Line of Business
Product Type
Product
Customer Type
Customer
Account
Base Measures
Principal Cash Flows
Interest Cash Flows
Gap Limit
Computed Measures
Total Inflows
Total Outflows
Liquidity Gap – Principal, Interest and Total
Gap as % of Total Outflows
Deviation from Gap Limit
Cumulative Gap – Principal, Interest and Total

Analytics User Guide: Oracle Financial Services Liquidity Risk Management
Release 8.0.6.0.0
17
Drill-through On
Graphical Report:
Clicking each column in the column chart.
Tabular Report:
Row level drill- through on the principal, interest and total components of Inflows, Outflows and Liquidity Gap. Column drill- through on each time bucket column is no longer required. This is taken care of by selecting the bucket level as a page level filter.
Drill-through’s
The drill- through sequence remains unchanged for both the tabular and graphical reports as follows:
Level 1: Line of Business
Level 2: Product Type
Level 3: Product
Level 4: Customer Type
Level 5: Customer
Level 6: Account
Graphical Report:
On clicking each column the drill-through report will display the break-up of all three measures such as principal, interest and cumulative gap across the dimension on the drill- through. All drill- through reports are combination of line and stacked column charts as per the original report.
Tabular Report:
Drill-through is enabled on the following row items as per the existing drill-through sequence:
Inflows – Principal, Interest and Total
Outflows – Principal, Interest and Total
Liquidity Gap – Principal, Interest and Total
22..33 LLiiqquuiiddiittyy GGaapp HHiissttoorriiccaall VVaarriiaannccee AAnnaallyyssiiss
Report Name Liquidity Gap Historical Variance Analysis
Report Level Filters
Gap Type: This is a drop down selection of one of the following
options: Liquidity Gap and Cumulative Gap.
Variance as: This is a drop down selection of one of the following
options: Amount and Percentage.
As of Date 1: This is a selection of a date from the calendar and
represents the original value against which variance is calculated.
Run Execution ID 1: This is a drop selection listing all the Execution
IDs of the selected Run executed on As of Date 1.
As of Date 2: This is a selection of a date from the calendar and must
be greater than or equal to As of Date 1.
Run Execution ID 2: This is a drop selection listing all the Execution

Analytics User Guide: Oracle Financial Services Liquidity Risk Management
Release 8.0.6.0.0
18
IDs of the selected Run executed on As of Date 2.
Report Description
This report displays the absolute and percentage variance between liquidity gaps in each time bucket across 2 historical time periods. The graphical report displays the liquidity gap or cumulative gap in each time bucket during each period as well as the variance between the 2 periods. The tabular report displays the detailed variance between 2 periods. Time buckets are displayed based on the bucket level selected as part of the page level filter.
Report Type
Graphical Report:
Combination of Line and Column Chart
Time Buckets of the selected bucket level are displayed on the X-axis. Liquidity gaps or cumulative gaps are displayed on the primary Y-axis as column values based on the gap type filter selected. Variance is displayed as a line on the secondary Y-axis in terms of absolute amount or percentage based on the variance as filter selection. Variance is calculated as follows:
Variance Amount = Amount as on Date 2 – Amount as on Date 1
Variance Percentage = (Amount as on Date 2 – Amount as on Date 1) / Amount as on Date 1
Tabular Report:
The following are displayed as row items:
Inflows – Principal, Interest and Total
Outflows – Principal, Interest and Total
Liquidity Gap – Principal, Interest and Total
Cumulative Gap – Principal, Interest and Total
The time buckets corresponding to the bucket level selected as part of the page level filter are displayed as column items. Variance between the two dates is displayed as column values as an amount or percentage depending on the variance as filter selection.
Note:
Gap type filter is not applicable for the tabular report.
Dimensions
Legal Entity
Currency
Principal/Interest Cash Flows
Line of Business
Product Type
Product
Customer Type
Customer
Account
Base Measures Principal Cash Flows
Interest Cash Flows

Analytics User Guide: Oracle Financial Services Liquidity Risk Management
Release 8.0.6.0.0
19
Computed Measures
Total Inflows
Total Outflows
Liquidity Gap – Principal, Interest and Total
Cumulative Gap – Principal, Interest and Total
Variance Amount
Variance Percentage
Drill-through On
Graphical Report:
Clicking each column in the column chart.
Tabular Report:
Row level drill- through on the principal, interest and total components of Inflows, Outflows and Liquidity Gap.
Drill-through’s
The drill- through sequence remains unchanged for both the tabular and graphical reports as follows:
Level 1: Line of Business
Level 2: Product Type
Level 3: Product
Level 4: Customer Type
Level 5: Customer
Level 6: Account
Graphical Report:
On clicking each column the drill-through report will display the break-up of all 3 measures such as amount as of date 1, amount as of date 2 and variance across the dimension on the drill-through. All drill- through reports are combination of line and column charts as per the original report.
Tabular Report:
Drill- through is enabled on the following row items as per the drill- through sequence available as part of the Liquidity Gap Analysis - <Currency Type> report:
Inflows – Principal, Interest and Total
Outflows – Principal, Interest and Total
Liquidity Gap – Principal, Interest and Total
The measure displayed is variance as an absolute amount or a percentage based on the report level selection.
22..44 LLiiqquuiiddiittyy GGaapp VVaarriiaannccee AAnnaallyyssiiss AAccrroossss RRuunnss
Report Name Liquidity Gap Variance Analysis Across Runs
Report Level Filters Gap Type: This is a drop down selection of one of the following
options: Liquidity Gap and Cumulative Gap.
Variance as: This is a drop down selection of one of the following

Analytics User Guide: Oracle Financial Services Liquidity Risk Management
Release 8.0.6.0.0
20
options: Amount and Percentage.
Run: This is a drop down containing a list of runs that are mapped to
the underlying contractual run of the run selected as part of the page level filter.
Run Execution ID: This is a drop down selection containing a list of
run execution ID’s for the selected second run. The drop down list displays only those executions that have a FIC_MIS_Date equal to the As-of-Date selected at the page level.
Report Description
This report displays the absolute and percentage variance between liquidity gaps in each time bucket across two runs. The graphical report displays the liquidity gap or cumulative gap calculated as part of both runs in each time bucket as well as the variance between the two runs. The tabular report displays the detailed variance between two runs. Time buckets are displayed based on the bucket level selected as part of the page level filter.
The Run selected as part of the page level filters is considered as the main Run against which the variance is calculated.
Report Type
Graphical Report:
Combination of Line and Column Chart
Time Buckets of the selected bucket level are displayed on the X-axis. Liquidity gaps or cumulative gaps are displayed on the primary Y-axis across two runs as column values based on the gap type filter selected. Variance is displayed as a line on the secondary Y-axis in terms of absolute amount or percentage based on the variance as filter selection. Variance is calculated as follows:
Variance Amount = Run 2 Amount – Run 1 Amount
Variance Percentage = (Run 2 Amount – Run 1 Amount) / Run 1 Amount
Tabular Report:
The following are displayed as row items:
Inflows – Principal, Interest and Total
Outflows – Principal, Interest and Total
Liquidity Gap – Principal, Interest and Total
Cumulative Gap – Principal, Interest and Total
The time buckets corresponding to the bucket level selected as part of the page level filter are displayed as column items. Variance between two runs is displayed as column values as an amount or percentage depending on the variance as filter selection.
Note:
Gap type filter is not applicable for the tabular report.
Dimensions
Legal Entity
Currency
Principal/Interest Cash Flows
Line of Business
Product Type

Analytics User Guide: Oracle Financial Services Liquidity Risk Management
Release 8.0.6.0.0
21
Product
Customer Type
Customer
Account
Base Measures Principal Cash Flows
Interest Cash Flows
Computed Measures
Total Inflows
Total Outflows
Liquidity Gap – Principal, Interest and Total
Cumulative Gap – Principal, Interest and Total
Variance Amount
Variance Percentage
Drill-through On
Graphical Report:
Clicking each column in the column chart.
Tabular Report:
Row level drill- through on the principal, interest and total components of Inflows, Outflows and Liquidity Gap.
Drill-through’s
The drill- through sequence remains unchanged for both the tabular and graphical reports as follows:
Level 1: Line of Business
Level 2: Product Type
Level 3: Product
Level 4: Customer Type
Level 5: Customer
Level 6: Account
Graphical Report:
On clicking each column the drill-through report will display the break-up of all three measures such as Run 1 amount, Run 2 amount and variance across the dimension on the drill-through. All drill- through reports is a combination of line and column charts as per the original report.
Tabular Report:
Drill- through is enabled on the following row items as per the drill- through sequence available as part of the Liquidity Gap Analysis - <Currency Type> report:
Inflows – Principal, Interest and Total
Outflows – Principal, Interest and Total
Liquidity Gap – Principal, Interest and Total
The measure displayed is variance as an absolute amount or a percentage based on the report level selection.

Analytics User Guide: Oracle Financial Services Liquidity Risk Management
Release 8.0.6.0.0
22
22..55 DDyynnaammiicc BBaallaannccee SShheeeett -- BBaassee CCuurrrreennccyy
Report Name Dynamic Balance Sheet - Base Currency
Report Level Filters Not Applicable
Report Description This report is displays the time buckets corresponding to the bucket level selected as part of the page level filter are displayed as column items.
Report Type Tabular Report
Dimensions Balance Sheet Items
Base Measures Cash Flows
Computed Measures Opening Balance
Drill-through On As per existing report
Drill-through’s The drill through for assets and liabilities will be at each individual asset/liability level respectively.
22..66 DDyynnaammiicc BBaallaannccee SShheeeett -- <<CCuurrrreennccyy TTyyppee>>
Report Name Dynamic Balance Sheet - <Selected Currency>
Report Level Filters Not applicable
Report Description
The name of this report changes based on the Currency Type selected as part of the page level filters. For instance if the currency type is selected as Local Currency, the name of this report is displayed as Dynamic Balance Sheet – Local Currency.
This report is displays the time buckets corresponding to the bucket level selected as part of the page level filter are displayed as column items.
Report Type Tabular Report
Dimensions Balance Sheet Items
Base Measures Cash Flows
Computed Measures Opening Balance
Drill-through On As per existing report
Drill-through’s The drill through for assets and liabilities will be at each individual asset/liability level respectively.

Analytics User Guide: Oracle Financial Services Liquidity Risk Management
Release 8.0.6.0.0
23
33 DDeettaaiilleedd GGaapp AAnnaallyyssiiss SSuubbjjeecctt AArreeaa
Detailed Gap Analysis tab consists of the following page level filters which are applicable to all the reports
in this subject area.
Dashboard Name Liquidity Risk
Subject Area Detailed Gap Analysis
Page Level Filters
As of Date: This is a selection from the calendar.
Process/Run: This is a drop down selection. The drop down list is
filtered based on the date selected.
Scenario: This is a drop down selection. The drop down list is filtered
based on the Run selected.
Run Execution ID: This is a drop down selection. The drop down list
is filtered based on As of Date, Run and Scenario selected.
Legal Entity: This is a drop down selection. The drop down list is
filtered based on As of Date, Run and Scenario selected.
Currency Type: This is a drop down selection of one of the following
options: Local Currency and Reporting Currency
Reporting Bucket Definition: This is a drop down selection. The drop
down list is displayed based on the Time Bucket Definition selected in the given Run.
Bucket Level: This is a drop down selection. The drop down list is
filtered based on the Reporting Time Bucket selected.
Time Bucket Display: This is a drop down selection of one of the
following options: Bucket Name and Bucket Start and End Date. All reports displaying the time buckets will display either the bucket name or, the start and end date of each bucket based on this selection.
Page Level Display Parameters
Run Type
Consolidation Type
The following reports are displayed as part of the Detailed Gap Analysis subject area:
Detailed Bucket-wise Gap Analysis
Liquidity Gap across Stress Scenarios - Reporting Currency
Gap Analysis - Top N Large Customers

Analytics User Guide: Oracle Financial Services Liquidity Risk Management
Release 8.0.6.0.0
24
33..11 DDeettaaiilleedd BBuucckkeett--wwiissee GGaapp AAnnaallyyssiiss
Report Name Detailed Bucket-wise Gap Analysis
Report Level Filters Dimension
Dimension Member
Report Description The report displays tabular and graphical report as part of a single report.
Report Type
Graphical Report:
Combination of Line and Column Chart
The graphical chart displays the time buckets for the selected bucket level on the x-axis. The liquidity gap for the selected dimension member is displayed on the y-axis as a column chart. The cumulative gap is displayed on the y-axis as a line graph.
Tabular Report:
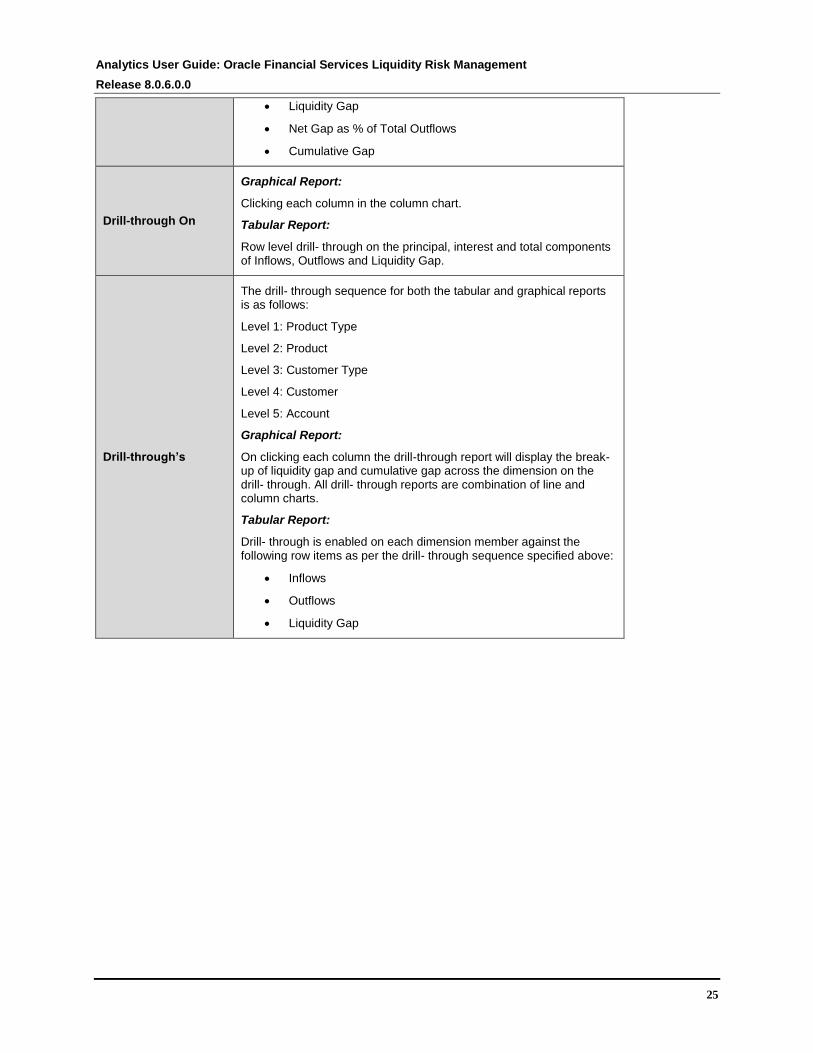
The following are displayed as row items across all members of the selected dimension:
Inflows
Outflows
Liquidity Gap
Net Gap as % of Total Outflows
Cumulative Gap
The time buckets corresponding to the bucket level selected as part of the page level filter are displayed as column items.
Note:
Dimension member selection only affects the graphical report. The tabular report remains unaffected. It displays the rows based on all members of the selected dimension.
Dimensions
Legal Entity
Currency
Line of Business
Product Type
Product
Customer Type
Geography
Base Measures Cash Flows
Computed Measures Total Inflows
Total Outflows
Analytics User Guide: Oracle Financial Services Liquidity Risk Management
Release 8.0.6.0.0
25
Liquidity Gap
Net Gap as % of Total Outflows
Cumulative Gap
Drill-through On
Graphical Report:
Clicking each column in the column chart.
Tabular Report:
Row level drill- through on the principal, interest and total components of Inflows, Outflows and Liquidity Gap.
Drill-through’s
The drill- through sequence for both the tabular and graphical reports is as follows:
Level 1: Product Type
Level 2: Product
Level 3: Customer Type
Level 4: Customer
Level 5: Account
Graphical Report:
On clicking each column the drill-through report will display the break-up of liquidity gap and cumulative gap across the dimension on the drill- through. All drill- through reports are combination of line and column charts.
Tabular Report:
Drill- through is enabled on each dimension member against the following row items as per the drill- through sequence specified above:
Inflows
Outflows
Liquidity Gap

Analytics User Guide: Oracle Financial Services Liquidity Risk Management
Release 8.0.6.0.0
26
33..22 LLiiqquuiiddiittyy GGaapp aaccrroossss SSttrreessss SScceennaarriiooss -- RReeppoorrttiinngg CCuurrrreennccyy
Report Name Liquidity Gap across Stress Scenarios
Report Level Filters Time Bucket
Report Description
This report displays the liquidity gaps in each time bucket across multiple stress scenarios in the form of a column chart. This report allows comparison of liquidity gaps across multiple stress scenarios mapped to a business-as-usual Run and enables identification of the worst case scenarios.
The drop-down values in the time bucket selection displays based on the bucket level selected as part of the page level filters. In addition to the liquidity gap, the cumulative gap up to the selected time bucket is displayed.
Report Type
Column Chart
The scenarios, baseline and stress, mapped to a given contractual Run are displayed on the x-axis while the gap for the selected time bucket is displayed on the y-axis.
Dimensions
Stress Scenario
Line of Business
Product Type
Product
Customer Type
Customer
Base Measures Liquidity Gap
Computed Measures Not Applicable
Drill-through On Scenario
Drill-through’s
On drill- through, both the liquidity gap and cumulative gap under each scenario will be displayed across the following dimensions:
Level 1: Line of Business
Level 2: Product Type
Level 3: Product
Level 4: Customer Type
Level 5: Customer

Analytics User Guide: Oracle Financial Services Liquidity Risk Management
Release 8.0.6.0.0
27
33..33 GGaapp AAnnaallyyssiiss -- TToopp NN LLaarrggee CCuussttoommeerrss
Report Name Gap Analysis - Top N Large Customers
Report Level Filters
Top N – Specified by the user as a numeric value
Large Customer Name – The top N customers are displayed in the drop down for selection
Report Description This report displays the Top N details entered where N corresponding to the number of large customers for which the report is to be displayed.
Report Type
Graphical Report:
Combination of Line and Column Chart
The graphical chart displays the time buckets for the selected bucket level on the x-axis. The liquidity gap for the top N large customers is displayed on the y-axis as a column chart. The cumulative gap is displayed on the y-axis as a line graph.
Tabular Report:
The following are displayed as row items for each top N customer:
Inflows
Outflows
Liquidity Gap
The time buckets corresponding to the bucket level selected as part of the page level filter are displayed as column items.
Note:
Customer selection only affects the graphical report. The tabular report remains unaffected. It displays the rows based on all top N customers.
Dimensions Inflows
Outflows
Base Measures Liquidity Gap
Cumulative Gap
Computed Measures
Not Applicable
Drill-through On
Graphical Report:
Clicking each column in the column chart.
Tabular Report:
Row level drill- through on the Inflows, Outflows and Liquidity Gap. Column drill- through on each time bucket column.
Drill-through’s
The drill- through sequence for both the tabular and graphical reports is as follows:
Level 1: Product Type
Level 2: Product
Analytics User Guide: Oracle Financial Services Liquidity Risk Management
Release 8.0.6.0.0
28
Level 3: Account
Graphical Report:
On clicking each column the drill-through report will display the break-up of liquidity gap and cumulative gap across the dimension on the drill- through. All drill- through reports are combination of line and column charts.
Tabular Report:
Drill- through is enabled on each dimension member against the following row items as per the existing drill- through sequence:
Inflows
Outflows
Liquidity Gap
Note:
The Large Customer Flag is added as part of Aggregate Dimension Selection in Application
Preferences window. This report is displayed if Large Customer dimension is selected under the
members list in Application Preferences.
In the set up master table V_COMPONENT_CODE signifies:
The “LARGE_CUSTOMER_POPULATE_LIMIT” component shows the amount we
consider for classifying the customer as large customer. By default the limit is set as
2,50,000.
The “'LARGE_CUSTOMER_POPULATE_CURRENCY” component shows the currency
in which the amount is considered. By default the currency is in US dollars.
For all the liability products we consider the large customer dimension. For a customer, the list of
liability products are checked and the balance is agreegated based on the liability products. If the
value is greater than 2,50,000, then it is classified as a Large Customer. This default value can be
changed in set up master table.
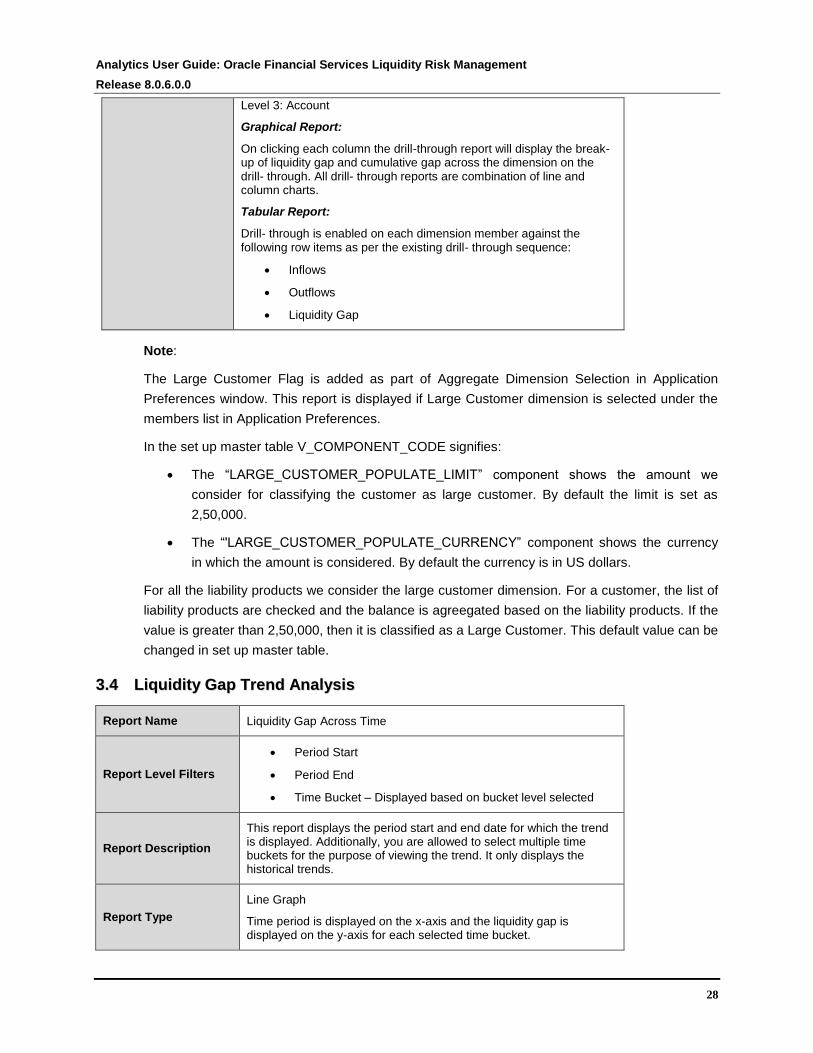
33..44 LLiiqquuiiddiittyy GGaapp TTrreenndd AAnnaallyyssiiss
Report Name Liquidity Gap Across Time
Report Level Filters
Period Start
Period End
Time Bucket – Displayed based on bucket level selected
Report Description
This report displays the period start and end date for which the trend is displayed. Additionally, you are allowed to select multiple time buckets for the purpose of viewing the trend. It only displays the historical trends.
Report Type
Line Graph
Time period is displayed on the x-axis and the liquidity gap is displayed on the y-axis for each selected time bucket.

Analytics User Guide: Oracle Financial Services Liquidity Risk Management
Release 8.0.6.0.0
29
Dimensions Time Period
Base Measures Cash Flows
Computed Measures Liquidity Gap
Drill-through On Not Applicable
Drill-through’s Not Applicable

Analytics User Guide: Oracle Financial Services Liquidity Risk Management
Release 8.0.6.0.0
30
44 CCoouunntteerrbbaallaanncciinngg SSuubbjjeecctt AArreeaa
Counterbalancing tab consists of the following page level filters which are applicable to all the reports in
this subject area.
Dashboard Name Liquidity Risk
Subject Area Counterbalancing
Page Level Filters
As of Date: This is a selection from the calendar.
Process/Run: This is a drop down selection. The drop down list is
filtered based on the date selected.
Scenario: This is a drop down selection. The drop down list is filtered
based on the Run selected.
Run Execution ID: This is a drop down selection. The drop down list
is filtered based on As of Date, Run and Scenario selected.
Time Bucket Display: This is a drop down selection of one of the
following options: Bucket Name and Bucket Start and End Date. All reports displaying the time buckets will display either the bucket name or the start and end date of each bucket based on this selection.
Counterbalancing Strategy: This is a drop down selection. The drop
down list is displayed based on the Run and scenario selected.
Page Level Display Parameters
Run Type
Consolidation Type
Legal Entity
Currency Type
Time Bucket Level
The following reports are displayed as part of the Counterbalancing subject area.
Counterbalancing tab consists the following option:
Liquidity Gap Analysis Post Counterbalancing
44..11 LLiiqquuiiddiittyy GGaapp AAnnaallyyssiiss PPoosstt CCoouunntteerrbbaallaanncciinngg
Report Name Liquidity Gap Analysis Post Counterbalancing
Report Level Filters Not Applicable
Report Description This report is available under a single report title. A new counterbalancing method, rollover of reverse repos, is included in the tabular report.
Report Type
Graphical Report:
Combination of Line and Column Chart
The time buckets of the bucket level selected as part of the counterbalancing strategy are displayed on the X-axis. Liquidity gap is

Analytics User Guide: Oracle Financial Services Liquidity Risk Management
Release 8.0.6.0.0
31
displayed on the Y-axis as column values. Cumulative gap is displayed on the Y-axis as a line.
Tabular Report:
The following are displayed as row items:
Pre-Counterbalancing Metrics
o Inflows
o Outflows
o Liquidity Gap
Post Counterbalancing Metrics
o Total Counterbalancing Inflows
o Counterbalancing Inflows under each Counterbalancing Method
o Total Counterbalancing Outflows
o Counterbalancing Outflows under each Counterbalancing Method
o Net Gap post Counterbalancing
o Net Gap as % of Total Outflows
o Cumulative Net Gap
The time buckets of the bucket level selected as part of the counterbalancing strategy are displayed as column items.
Dimensions
Legal Entity
Currency
Line of Business
Product Type
Product
Customer Type
Customer
Counterbalancing Position
Base Measures Inflows
Outflows
Computed Measures
Liquidity Gap
Net Gap post Counterbalancing
Net Gap as % of Total Outflows
Cumulative Net Gap
Drill-through On
Graphical Report:
Clicking each column in the column chart.
Tabular Report:
Row level drill- through on the following post counterbalancing metrics:
Counterbalancing Inflows under each Counterbalancing

Analytics User Guide: Oracle Financial Services Liquidity Risk Management
Release 8.0.6.0.0
32
Method
Counterbalancing Outflows under each Counterbalancing Method
Net Gap Post Counterbalancing
Drill-through’s
Graphical Report:
On clicking each column the drill-through report will display the break-up of all liquidity gap and cumulative gap across the following dimensions:
Level 1: Line of Business
Level 2: Product Type
Level 3: Product
Level 4: Customer Type
Level 5: Customer
All drill- through reports are combination of line and stacked column charts as per the original report.
Tabular Report:
Drill- through is enabled on the counterbalancing inflows and outflows under each counterbalancing method to the level of each individual counterbalancing position, as currently existing.
Drill- through is enabled on the net gap post counterbalancing as follows:
Level 1: Line of Business
Level 2: Product Type
Level 3: Product
Level 4: Customer Type
Level 5: Customer
Drill- through is not available here for pre-counterbalancing liquidity metrics.

Analytics User Guide: Oracle Financial Services Liquidity Risk Management
Release 8.0.6.0.0
33
55 LLiiqquuiiddiittyy RRaattiiooss SSuubbjjeecctt AArreeaa
Liquidity Ratios tab consists of the following page level filters which are applicable to all the reports in this
subject area.
Dashboard Name Liquidity Risk
Subject Area Liquidity Ratios
Page Level Filters
As of Date: This is a selection from the calendar.
Process/Run: This is a drop down selection. The drop down list is
filtered based on the date selected.
Scenario Name: This is a drop down selection. The drop down list is
filtered based on the Run selected.
Run Execution ID: This is a drop down selection. The drop down list
is filtered based on As of Date, Run and Scenario selected.
Legal Entity: This is a drop down selection. The drop down list is
filtered based on As of Date, Run and Scenario selected.
Currency Type: This is a drop down selection of one of the following
options: Local Currency and Reporting Currency
Page Level Display Parameters
Consolidation Type
The following reports are displayed as part of the Liquidity Ratios subject area:
Liquidity Ratios
Liquidity Coverage Ratio Components
Net Stable Funding Ratio Components
Liquidity Coverage Ratio by Significant Currencies
Liquidity Ratio Historical Variance Analysis
55..11 LLiiqquuiiddiittyy RRaattiiooss
Report Name Liquidity Ratios
Report Level Filters Not Applicable
Report Description This report displays the pre and post option values. The high quality liquid assets drill- through report displays additional asset levels.
Report Type
Tabular Report
The following are displayed as row items in the first table:
Liquidity Coverage Ratio

Analytics User Guide: Oracle Financial Services Liquidity Risk Management
Release 8.0.6.0.0
34
Net Stable Funding Ratio
Each significant currency is listed as a separate row item in the second table.
The pre-option and post option values for each ratio are displayed as column values.
Dimensions
Legal Entity
Significant Currency
Asset Level
Cash Flow Type
Product Type
Product
Base Measures
Liquidity Coverage Ratio
Net Stable Funding Ratio
High Quality Liquid Assets
Cash Flows
Computed Measures Not Applicable
Drill-through On Pre and post option column values of LCR and significant currency LCR.
Drill-through’s
Level 1:
Page Level Display Parameters: The following parameters are
displayed:
As of Date
Process/Run
Run Execution ID
Run Type
Consolidation Type
Legal Entity
Significant Currency (if drill-through is from Significant Currency LCR)
Page Level Filters: Currency Type is a page level filter.
Report 1:
Report Name: High Quality Liquid Assets by Product Type
Report Level Filters: Asset Level (other assets are not displayed)
Report Type: Column Chart
The product types are displayed on the x-axis and the values for the selected high quality asset level are displayed as columns on the y-axis.
Level 2 Drill- through On: Column
Report 2:

Analytics User Guide: Oracle Financial Services Liquidity Risk Management
Release 8.0.6.0.0
35
Report Name: Cash Flows by Product Type (No change in this
report)
Report Level Filters: Cash Flow Type
Report Type: Column Chart
The product types are displayed on the x-axis and the values for the selected cash flow type are displayed as columns on the y-axis.
Level 2 Drill- through On: Column
Report 1 Level 2:
Page Level Display Parameters: The following parameters are
displayed in addition to the parameters displayed in the High Quality Liquid Assets by Product Type:
Asset Level
Product Type
Report Name: High Quality Liquid Assets by Product
Report Type: Column Chart
The products are displayed on the X-axis and the values for the selected high quality asset level and product type combination are displayed as columns on the Y-axis.
Level 2 Drill- through On: Not applicable
Report 2 Level 2:
Page Level Display Parameters: The following parameters are
displayed in addition to the parameters displayed in the Cash Flows by Product Type:
Cash Flow Type
Product Type
Report Name: Cash Flows by Product (no change in this report)
Report Level Filters: Cash Flow Type
Report Type: Column Chart
The products are displayed on the X-axis and the values for the selected cash flow type and product type combination are displayed as columns on the y-axis.
Level 2 Drill- through On: Not Applicable
Note: If the run purpose in the Run Management window is selected as U.S. Fed Liquidity Ratio
Calculation then, Liquidity Ratios report is not applicable.
55..22 LLiiqquuiiddiittyy CCoovveerraaggee RRaattiioo CCoommppoonneennttss
Report Name Liquidity Coverage Ratio Components
Report Level Filters Not applicable
Analytics User Guide: Oracle Financial Services Liquidity Risk Management
Release 8.0.6.0.0
36
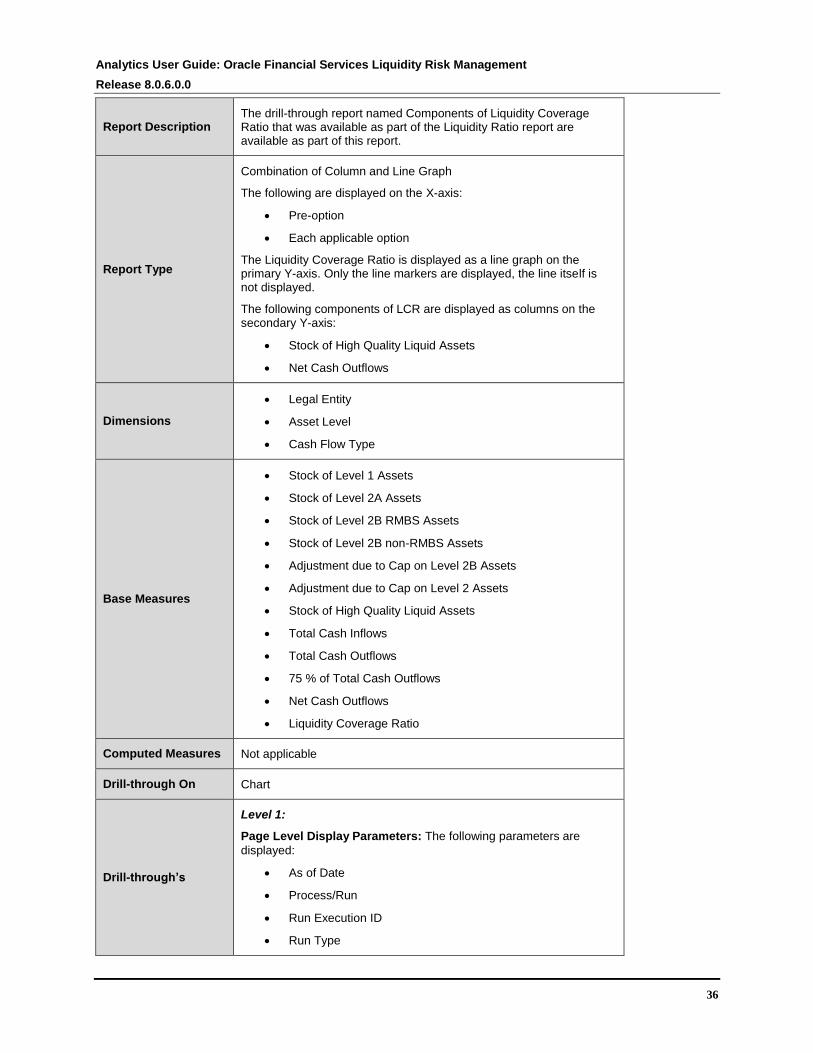
Report Description The drill-through report named Components of Liquidity Coverage Ratio that was available as part of the Liquidity Ratio report are available as part of this report.
Report Type
Combination of Column and Line Graph
The following are displayed on the X-axis:
Pre-option
Each applicable option
The Liquidity Coverage Ratio is displayed as a line graph on the primary Y-axis. Only the line markers are displayed, the line itself is not displayed.
The following components of LCR are displayed as columns on the secondary Y-axis:
Stock of High Quality Liquid Assets
Net Cash Outflows
Dimensions
Legal Entity
Asset Level
Cash Flow Type
Base Measures
Stock of Level 1 Assets
Stock of Level 2A Assets
Stock of Level 2B RMBS Assets
Stock of Level 2B non-RMBS Assets
Adjustment due to Cap on Level 2B Assets
Adjustment due to Cap on Level 2 Assets
Stock of High Quality Liquid Assets
Total Cash Inflows
Total Cash Outflows
75 % of Total Cash Outflows
Net Cash Outflows
Liquidity Coverage Ratio
Computed Measures Not applicable
Drill-through On Chart
Drill-through’s
Level 1:
Page Level Display Parameters: The following parameters are
displayed:
As of Date
Process/Run
Run Execution ID
Run Type

Analytics User Guide: Oracle Financial Services Liquidity Risk Management
Release 8.0.6.0.0
37
Consolidation Type
Legal Entity
Page Level Filters: Currency Type
Report Name: Break-up of Liquidity Coverage Ratio Components
The pre and post option LCR is displayed.
Chart 1:
Chart Name: Stock of HQLA Components
Report Type: Column Chart
The stock of HQLA and its components are displayed on the x-axis and the values prior to option and post each option are displayed as columns on the y-axis.
Level 2 Drill- through On: Not applicable
Chart 2:
Chart Name: Net Cash Outflow Components
Report Type: Column Chart
Net cash outflow and its components are displayed on the x-axis and the values prior to option and post each option are displayed as columns on the y-axis.
Level 2 Drill- through On: Not applicable
Note: If the run purpose in the Run Management window is selected as U.S. Fed Liquidity Ratio
Calculation then, Liquidity Coverage Ratio Components report is not applicable.
55..33 NNeett SSttaabbllee FFuunnddiinngg RRaattiioo CCoommppoonneennttss
Report Name Net Stable Funding Ratio Components
Report Level Filters Not applicable
Report Description
This report breaks down the Net Stable Funding Ratio into it components in the form of a bar chart. The available stable funding and required stable funding, which are the components of the NSFR formula, are displayed.
Report Type
Combination of Column and Line Graph
The following are displayed on the X-axis:
Available Stable Funding
Required Stable Option
Their values are displayed on the Y-axis.
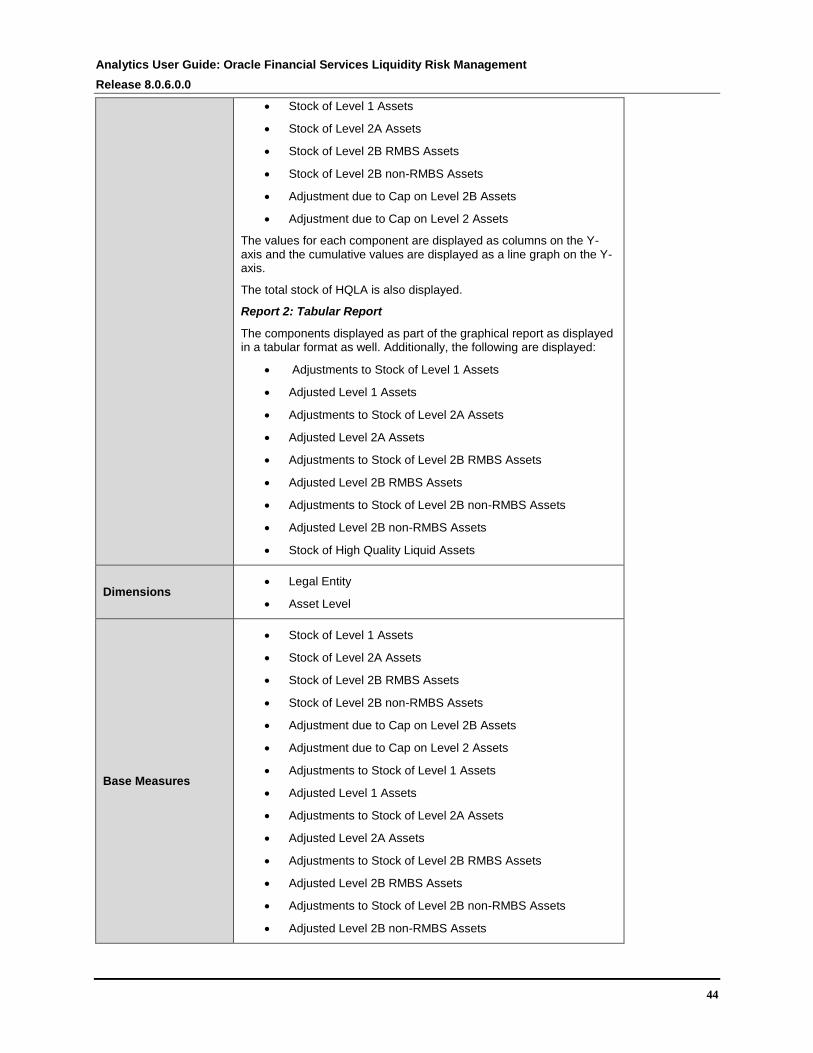
Dimensions
Legal Entity
Asset Level
Cash Flow Type
Base Measures Stock of Level 1 Assets
Stock of Level 2A Assets

Analytics User Guide: Oracle Financial Services Liquidity Risk Management
Release 8.0.6.0.0
38
Stock of Level 2B RMBS Assets
Stock of Level 2B non-RMBS Assets
Adjustment due to Cap on Level 2B Assets
Adjustment due to Cap on Level 2 Assets
Stock of High Quality Liquid Assets
Total Cash Inflows
Total Cash Outflows
75 % of Total Cash Outflows
Net Cash Outflows
Liquidity Coverage Ratio
Computed Measures Not Applicable
Drill-through On Chart
Drill-through’s
Level 1:
Page Level Display Parameters: The following parameters are
displayed:
As of Date
Process/Run
Run Execution ID
Run Type
Consolidation Type
Legal Entity
Page Level Filters: Currency Type
Report Name: Break-up of Net Stable Funding Ratio Components
The pre and post option Net Stable Funding Ratio is displayed.
Chart 1:
Chart Name: Stock of HQLA Components
Report Type: Column Chart
The available stable funding and required stable funding components are displayed on the X-axis and the values prior to option and post each option are displayed as columns on the Y-axis.
Level 2 Drill-through On: Not applicable
Chart 2:
Chart Name: Net Cash Outflow Components
Report Type: Column Chart
Net cash outflow and its components are displayed on the X-axis and the values prior to option and post each option are displayed as columns on the Y-axis.
Level 2 Drill-through On: Not applicable

Analytics User Guide: Oracle Financial Services Liquidity Risk Management
Release 8.0.6.0.0
39
Note: If the run purpose in the Run Management window is selected as U.S. Fed Liquidity Ratio
Calculation then, Net Stable Funding Ratio Components report is not applicable.
55..44 LLiiqquuiiddiittyy CCoovveerraaggee RRaattiioo bbyy SSiiggnniiffiiccaanntt CCuurrrreenncciieess
Report Name Liquidity Coverage Ratio by Significant Currencies
Report Level Filters Significant Currency
Report Description
This report displays the Liquidity Coverage Ratio for each significant current in the form of a column chart. LCR for each significant currency displayed the following conditions:
Pre-Option
Post Option 1: Drawdown on Liquidity Facilities from Central Bank
Post Option 2: Foreign Currency Liquid Assets
Post Option 3: Additional Use of Level 2 Assets
Report Type
Combination of Line and Column Chart
The following significant currency are displayed on the x-axis:
Stock of Level 1 Assets
Stock of Level 2A Assets
Stock of Level 2B RMBS Assets
Stock of Level 2B non-RMBS Assets
Adjustment due to Cap on Level 2B Assets
Adjustment due to Cap on Level 2 Assets
The liquidity coverage ratio is reported on the Y-axis. The options are displayed in the order of execution i.e. in the order that they are applied.
Dimensions
Legal Entity
Significant Currency
Asset Level
Base Measures
Stock of Level 1 Assets
Stock of Level 2A Assets
Stock of Level 2B RMBS Assets
Stock of Level 2B non-RMBS Assets
Adjustment due to Cap on Level 2B Assets
Adjustment due to Cap on Level 2 Assets
Computed Measures Not applicable
Drill-through On Not applicable
Drill-through’s Not applicable
Analytics User Guide: Oracle Financial Services Liquidity Risk Management
Release 8.0.6.0.0
40
Note: If the run purpose in the Run Management window is selected as U.S. Fed Liquidity Ratio
Calculation then, Liquidity Coverage Ratio by Significant Currencies report is not applicable.
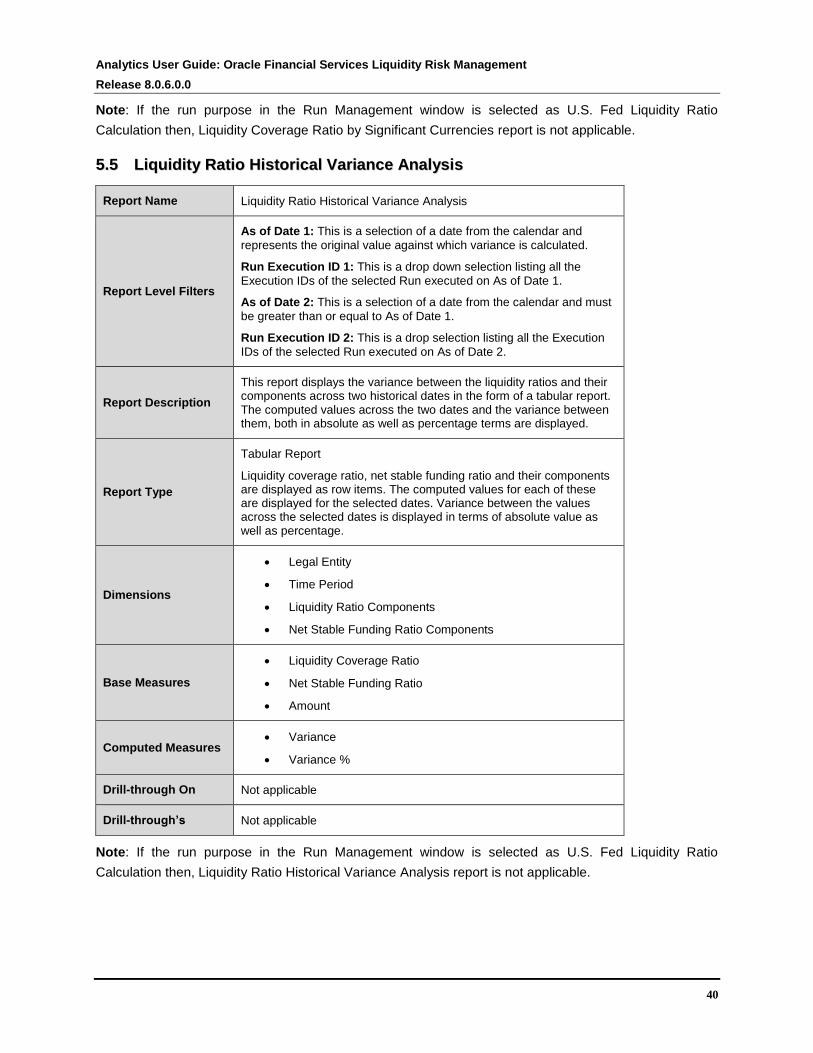
55..55 LLiiqquuiiddiittyy RRaattiioo HHiissttoorriiccaall VVaarriiaannccee AAnnaallyyssiiss
Report Name Liquidity Ratio Historical Variance Analysis
Report Level Filters
As of Date 1: This is a selection of a date from the calendar and
represents the original value against which variance is calculated.
Run Execution ID 1: This is a drop down selection listing all the
Execution IDs of the selected Run executed on As of Date 1.
As of Date 2: This is a selection of a date from the calendar and must
be greater than or equal to As of Date 1.
Run Execution ID 2: This is a drop selection listing all the Execution
IDs of the selected Run executed on As of Date 2.
Report Description
This report displays the variance between the liquidity ratios and their components across two historical dates in the form of a tabular report. The computed values across the two dates and the variance between them, both in absolute as well as percentage terms are displayed.
Report Type
Tabular Report
Liquidity coverage ratio, net stable funding ratio and their components are displayed as row items. The computed values for each of these are displayed for the selected dates. Variance between the values across the selected dates is displayed in terms of absolute value as well as percentage.
Dimensions
Legal Entity
Time Period
Liquidity Ratio Components
Net Stable Funding Ratio Components
Base Measures
Liquidity Coverage Ratio
Net Stable Funding Ratio
Amount
Computed Measures Variance
Variance %
Drill-through On Not applicable
Drill-through’s Not applicable
Note: If the run purpose in the Run Management window is selected as U.S. Fed Liquidity Ratio
Calculation then, Liquidity Ratio Historical Variance Analysis report is not applicable.

Analytics User Guide: Oracle Financial Services Liquidity Risk Management
Release 8.0.6.0.0
41
66 LLCCRR DDeettaaiillss SSuubbjjeecctt AArreeaa
LCR Details tab consists of the following page level filters which are applicable to all the reports in this
subject area.
Dashboard Name LCR Details
Subject Area LCR Details
Page Level Filters
Calendar Date: This is a selection from the calendar.
Process/Run: This is a drop down selection. The drop down list is
filtered based on the date selected.
Scenario Name: This is a drop down selection. The drop down list is
filtered based on the Run selected.
Run Execution ID: This is a drop down selection. The drop down list
is filtered based on As of Date, Run and Scenario selected.
Legal Entity: This is a drop down selection. The drop down list is
filtered based on As of Date, Run and Scenario selected.
Currency Type: This is a drop down selection of one of the following
options: Local Currency and Reporting Currency
Page Level Display Parameters
Consolidation Type
The following reports are displayed as part of the LCR Details subject area:
High Quality Liquid Assets
Break-up of Stock of High Quality Liquid Assets
Break-up of Stock of HQLA Denominated in Significant Currencies
Liquidity Transferability Restrictions
Liquidity Ratio Trend Analysis

Analytics User Guide: Oracle Financial Services Liquidity Risk Management
Release 8.0.6.0.0
42
66..11 HHiigghh QQuuaalliittyy LLiiqquuiidd AAsssseettss
Report Name High Quality Liquid Assets
Report Level Filters Encumbrance Status
Report Description This report displays the break-up of encumbered and unencumbered high quality liquid assets across each asset level in the form of a pie chart.
Report Type
Pie Chart
The pie chart displays the break-up of HQLA across the following asset levels:
Level 1 Assets
Level 2A Assets
Level 2B RMBS Assets
Level 2B Non-RMBS Assets
Dimensions
Legal Entity
Asset Level
Account
Base Measures Asset Value
Computed Measures Not applicable
Drill-through On Each segment of the pie chart
Drill-through’s
Level 1:
Page Level Display Parameters: The following parameters are
displayed:
As of Date
Process/Run
Scenario
Run Execution ID
Run Type
Consolidation Type
Legal Entity
Currency Type
Report Level Filters: The following filters are displayed for selection:
Product Type
Product

Analytics User Guide: Oracle Financial Services Liquidity Risk Management
Release 8.0.6.0.0
43
Natural Currency
Location
Maturity Date
An icon is available to filter the tabular report row items based on the filter selection. A reset icon is available to reset all filter selection and to restore the original number of rows. This filter selection is not mandatory.
Report Name: <Selected Encumbrance Status> <Selected Asset
Level> Details
The name changes based on the report-level parameter selection. For example, if encumbrance status is selected as Unencumbered and the Level 2A Assets segment is selected in the pie chart, the report name will be displayed as Unencumbered Level 2A Asset Details
Report Type: Tabular Report
The following details are displayed for each asset whose attributes correspond to the selected encumbrance status and asset level:
Asset
Product Type
Natural Currency
Location
Maturity Date
Units Available
Maturity Value
Haircut (%)
Market Value
Expected Value
Level 2 Drill-through On: Not applicable
Note: If the run purpose in the Run Management window is selected as U.S. Fed Liquidity Ratio
Calculation then, High Quality Liquid Assets report is not applicable.
66..22 BBrreeaakk--uupp ooff SSttoocckk ooff HHiigghh QQuuaalliittyy LLiiqquuiidd AAsssseettss
Report Name Break-up of Stock of High Quality Liquid Assets
Report Level Filters Not applicable
Report Description This report displays the break-up of the stock of HQLA across it components in the form of a line-column chart as well as a tabular report.
Report Type
Report 1: Graphical Report
Combination of Line and Column Chart
The following components of the stock of HQLA are displayed on the X-axis:
Analytics User Guide: Oracle Financial Services Liquidity Risk Management
Release 8.0.6.0.0
44
Stock of Level 1 Assets
Stock of Level 2A Assets
Stock of Level 2B RMBS Assets
Stock of Level 2B non-RMBS Assets
Adjustment due to Cap on Level 2B Assets
Adjustment due to Cap on Level 2 Assets
The values for each component are displayed as columns on the Y-axis and the cumulative values are displayed as a line graph on the Y-axis.
The total stock of HQLA is also displayed.
Report 2: Tabular Report
The components displayed as part of the graphical report as displayed in a tabular format as well. Additionally, the following are displayed:
Adjustments to Stock of Level 1 Assets
Adjusted Level 1 Assets
Adjustments to Stock of Level 2A Assets
Adjusted Level 2A Assets
Adjustments to Stock of Level 2B RMBS Assets
Adjusted Level 2B RMBS Assets
Adjustments to Stock of Level 2B non-RMBS Assets
Adjusted Level 2B non-RMBS Assets
Stock of High Quality Liquid Assets
Dimensions Legal Entity
Asset Level
Base Measures
Stock of Level 1 Assets
Stock of Level 2A Assets
Stock of Level 2B RMBS Assets
Stock of Level 2B non-RMBS Assets
Adjustment due to Cap on Level 2B Assets
Adjustment due to Cap on Level 2 Assets
Adjustments to Stock of Level 1 Assets
Adjusted Level 1 Assets
Adjustments to Stock of Level 2A Assets
Adjusted Level 2A Assets
Adjustments to Stock of Level 2B RMBS Assets
Adjusted Level 2B RMBS Assets
Adjustments to Stock of Level 2B non-RMBS Assets
Adjusted Level 2B non-RMBS Assets
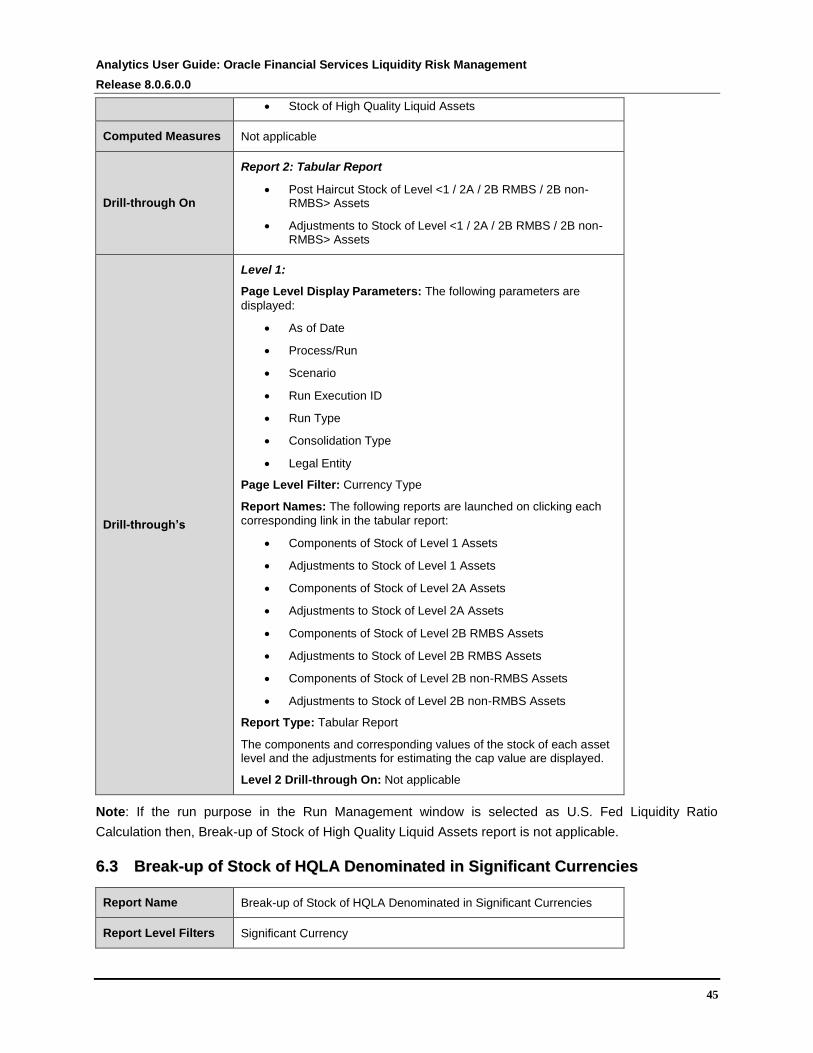
Analytics User Guide: Oracle Financial Services Liquidity Risk Management
Release 8.0.6.0.0
45
Stock of High Quality Liquid Assets
Computed Measures Not applicable
Drill-through On
Report 2: Tabular Report
Post Haircut Stock of Level <1 / 2A / 2B RMBS / 2B non-RMBS> Assets
Adjustments to Stock of Level <1 / 2A / 2B RMBS / 2B non-RMBS> Assets
Drill-through’s
Level 1:
Page Level Display Parameters: The following parameters are
displayed:
As of Date
Process/Run
Scenario
Run Execution ID
Run Type
Consolidation Type
Legal Entity
Page Level Filter: Currency Type
Report Names: The following reports are launched on clicking each
corresponding link in the tabular report:
Components of Stock of Level 1 Assets
Adjustments to Stock of Level 1 Assets
Components of Stock of Level 2A Assets
Adjustments to Stock of Level 2A Assets
Components of Stock of Level 2B RMBS Assets
Adjustments to Stock of Level 2B RMBS Assets
Components of Stock of Level 2B non-RMBS Assets
Adjustments to Stock of Level 2B non-RMBS Assets
Report Type: Tabular Report
The components and corresponding values of the stock of each asset level and the adjustments for estimating the cap value are displayed.
Level 2 Drill-through On: Not applicable
Note: If the run purpose in the Run Management window is selected as U.S. Fed Liquidity Ratio
Calculation then, Break-up of Stock of High Quality Liquid Assets report is not applicable.
66..33 BBrreeaakk--uupp ooff SSttoocckk ooff HHQQLLAA DDeennoommiinnaatteedd iinn SSiiggnniiffiiccaanntt CCuurrrreenncciieess
Report Name Break-up of Stock of HQLA Denominated in Significant Currencies
Report Level Filters Significant Currency

Analytics User Guide: Oracle Financial Services Liquidity Risk Management
Release 8.0.6.0.0
46
Report Description This report displays the break-up of the stock of HQLA denominated in each significant currency across it components in the form of a line-column chart.
Report Type
Combination of Line and Column Chart
The following components of the stock of HQLA denominated in the selected significant currency are displayed on the x-axis:
Stock of Level 1 Assets
Stock of Level 2A Assets
Stock of Level 2B RMBS Assets
Stock of Level 2B non-RMBS Assets
Adjustment due to Cap on Level 2B Assets
Adjustment due to Cap on Level 2 Assets
The values for each component are displayed as columns on the y-axis and the cumulative values are displayed as a line graph on the y-axis.
The total stock of HQLA is also displayed.
Dimensions
Legal Entity
Significant Currency
Asset Level
Base Measures
Stock of Level 1 Assets
Stock of Level 2A Assets
Stock of Level 2B RMBS Assets
Stock of Level 2B non-RMBS Assets
Adjustment due to Cap on Level 2B Assets
Adjustment due to Cap on Level 2 Assets
Computed Measures Not applicable
Drill-through On Not applicable
Drill-through’s Not applicable
Note: If the run purpose in the Run Management window is selected as U.S. Fed Liquidity Ratio
Calculation then, Break-up of Stock of HQLA Denominated in Significant Currencies report is not
applicable.
66..44 LLiiqquuiiddiittyy TTrraannssffeerraabbiilliittyy RReessttrriiccttiioonnss
Report Name Liquidity Transferability Restrictions
Report Level Filters Not applicable
Report Description This report identifies portion of HQLA from each legal entity that is not consolidated due to the liquidity transferability restrictions. Additionally,

Analytics User Guide: Oracle Financial Services Liquidity Risk Management
Release 8.0.6.0.0
47
the consolidated HQLA and net cash outflows are displayed at the consolidation level selected as part of the Run.
Report Type
Combination of Stacked Bar Chart and Line Graph
The subsidiary legal entities are displayed on the x-axis. The following are displayed on the y-axis in the form of stacked bars:
Restricted HQLA – Consolidated (orange color)
Unrestricted HQLA – Consolidated (green color)
Restricted HQLA – Not Consolidated (red color)
Net cash outflow is displayed on the Y-axis in the form of a line graph.
Additionally, the consolidated HQLA and net cash outflows at the level of the consolidated legal entity are displayed.
Dimensions
Legal Entity
Time Period
HQLA Transferability Restriction
Base Measures
Consolidated and Unconsolidated Portions of Restricted HQLA
Unrestricted HQLA
Consolidated Stock of HQLA
Standalone Net Cash Outflows
Consolidated Net Cash Outflows
Computed Measures Not applicable
Drill-through On Not applicable
Drill-through’s Not applicable
66..55 LLiiqquuiiddiittyy RRaattiioo TTrreenndd AAnnaallyyssiiss
Report Name Liquidity Ratio Trend Analysis
Report Level Filters
Liquidity Ratio: This is a drop down containing the options Liquidity
Coverage Ratio and Net Stable Funding Ratio
Period Start
Period End
Value Type: This is a drop down containing the options Daily Value
and 90-Day Average.
Report Description
This report displays the period start and end date for which the trend is displayed is selected by the user. The report displays the values of the selected ratio as well as its components in terms of either a daily value or a 90-day average value based on the selection.
Report Type Combination of Column and Line Graph
The time period is displayed on the x-axis. The daily value or the 90-
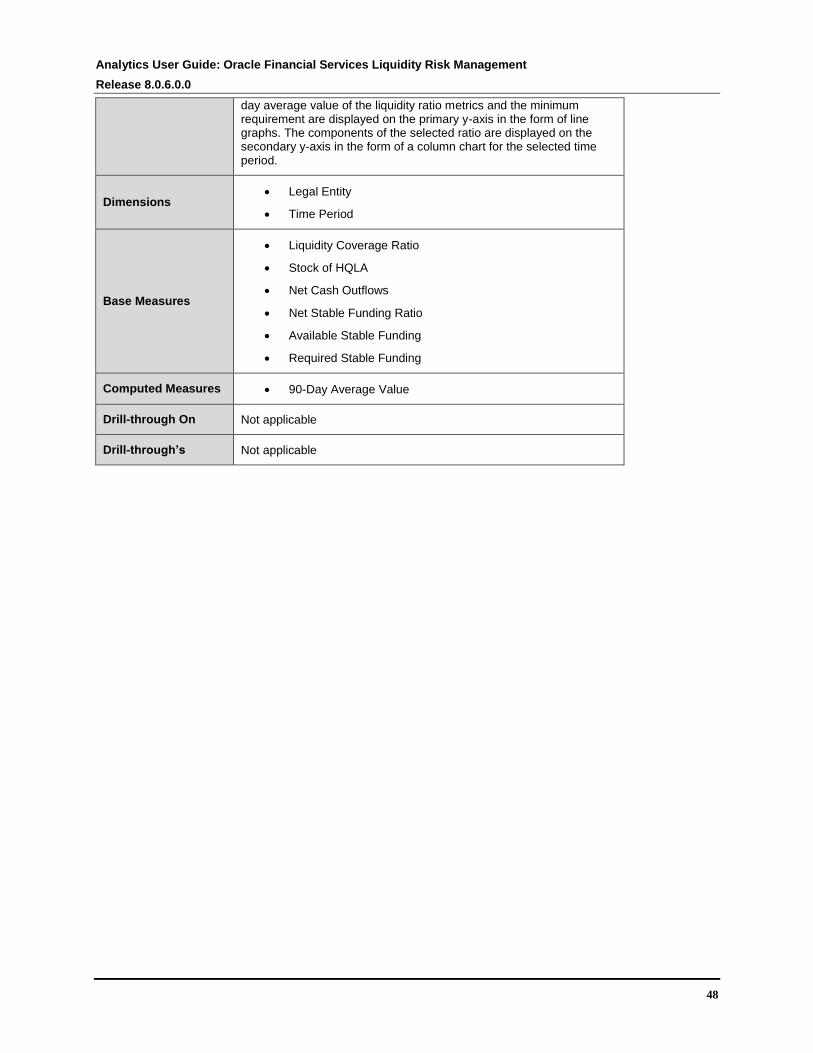
Analytics User Guide: Oracle Financial Services Liquidity Risk Management
Release 8.0.6.0.0
48
day average value of the liquidity ratio metrics and the minimum requirement are displayed on the primary y-axis in the form of line graphs. The components of the selected ratio are displayed on the secondary y-axis in the form of a column chart for the selected time period.
Dimensions Legal Entity
Time Period
Base Measures
Liquidity Coverage Ratio
Stock of HQLA
Net Cash Outflows
Net Stable Funding Ratio
Available Stable Funding
Required Stable Funding
Computed Measures 90-Day Average Value
Drill-through On Not applicable
Drill-through’s Not applicable

Analytics User Guide: Oracle Financial Services Liquidity Risk Management
Release 8.0.6.0.0
49
77 NNSSFFRR DDeettaaiillss SSuubbjjeecctt AArreeaa
NSFR Details tab consists of the following page level filters which are applicable to all the reports in this
subject area.
Dashboard Name Liquidity Risk
Subject Area NSFR Details
Page Level Filters
As of Date: This is a selection from the calendar.
Process/Run: This is a drop down selection. The drop down list is
filtered based on the date selected.
Scenario: This is a drop down selection. The drop down list is filtered
based on the Run selected.
Run Execution ID: This is a drop down selection. The drop down list
is filtered based on As of Date, Run and Scenario selected.
Legal Entity: This is a drop down selection. The drop down list is
filtered based on As of Date, Run and Scenario selected.
Currency Type: This is a drop down selection of one of the following
options: Local Currency and Reporting Currency.
Page Level Display Parameters
Net Stable Funding Ratio
Available Stable Funding
Required Stable Funding
The following reports are displayed as part of the NSFR Details subject area:
NSFR Constituents by Product Types
NSFR Break-up by Maturity
Off-Balance Sheet Items by Absolute Value
RSF Assets by Encumbrance Period
NSFR Trend Analysis
77..11 NNSSFFRR CCoonnssttiittuueennttss bbyy PPrroodduucctt TTyyppee ss
Report Name NSFR Constituents by Product Types
Report Level Filters Not Applicable
Report Description This report displays the break-up of available stable funding (ASF) and required stable funding (RSF) by product types in the form of pie charts.
Report Type
Pie Chart
The pie chart displays the percentage of total of ASF amount and RSF amount across the standard product types.
Dimensions Standard Product Type

Analytics User Guide: Oracle Financial Services Liquidity Risk Management
Release 8.0.6.0.0
50
Standard Accounting Head
Base Measures Available Stable Funding
Required Stable Funding
Computed Measures Not Applicable
Drill-through On Not Applicable
Drill-through’s Not Applicable
77..22 NNSSFFRR BBrreeaakk--uupp bbyy MMaattuurriittyy
Report Name NSFR Break-up by Maturity
Report Level Filters Not applicable
Report Description This report displays the break-up of the ASF and RSF amounts across standard maturity bands in the form of a column chart.
Report Type
Column Chart
The following NSFR maturity bands are displayed on the X-axis:
Open
Less than 6 months
Greater than or equal to 6 months and less than 1 Year
Greater than or equal to 1 Year
The ASF and RSF amounts are displayed as columns on the Y-axis.
Dimensions NSFR Maturity Band
Base Measures Available Stable Funding
Required Stable Funding
Computed Measures Not applicable
Drill-through On Not applicable
Drill-through’s Not applicable
77..33 OOffff--BBaallaannccee SShheeeett IItteemmss bbyy AAbbssoolluuttee VVaalluuee
Report Name Off-Balance Sheet Items by Absolute Value
Report Level Filters Not applicable
Report Description This report displays the break-up of RSF amount related to off-balance sheet items across product types in the form of a bar graph.
Report Type Bar Graph

Analytics User Guide: Oracle Financial Services Liquidity Risk Management
Release 8.0.6.0.0
51
The standard product types corresponding to off-balance sheet items are displayed on the x-axis. The RSF amount is displayed as bars on the y-axis.
Dimensions Standard Product Type
Base Measures Required Stable Funding
Computed Measures Not Applicable
Drill-through On Not Applicable
Drill-through’s Not Applicable
77..44 RRSSFF AAsssseettss bbyy EEnnccuummbbrraannccee PPeerriioodd
Report Name RSF Assets by Encumbrance Period
Report Level Filters Not applicable
Report Description This report displays the break-up of the RSF amount by the encumbrance period of the assets in the form of a pie chart.
Report Type
Pie chart
The pie chart displays the break-up of RSF amounts across the following NSFR encumbrance bands:
Less than 6 months
Greater than or equal to 6 months and less than 1 Year
Greater than or equal to 1 Year
Dimensions NSFR Encumbrance Band
Base Measures Required Stable Funding
Computed Measures Not applicable
Drill-through On Not Applicable
Drill-through’s Not Applicable
77..55 NNSSFFRR TTrreenndd AAnnaallyyssiiss
Report Name NSFR Trend Analysis
Report Level Filters Period Start
Period End
Report Description This report displays the NSFR as well as its components across time for the selected time period from the start date to the end date in the form a line and column chart.

Analytics User Guide: Oracle Financial Services Liquidity Risk Management
Release 8.0.6.0.0
52
Report Type
Combination of Line and Column Chart
The time period is displayed on the x-axis. The NSFR is displayed on the primary y-axis in the form of a line graph. The ASF and RSF amounts are displayed on the secondary y-axis in the form of a column chart for the selected time period.
Dimensions Legal Entity
Date
Base Measures
Available Stable Funding
Required Stable Funding
Net Stable Funding Ratio
Computed Measures Not applicable
Drill-through On Not Applicable
Drill-through’s Not Applicable

Analytics User Guide: Oracle Financial Services Liquidity Risk Management
Release 8.0.6.0.0
53
88 RReegguullaattiioonn YYYY SSuubbjjeecctt AArreeaa
Regulation YY tab consists of the following page level filters which are applicable to all the reports in this
subject area.
Dashboard Name Liquidity Risk
Subject Area Regulation YY
Page Level Filters
As of Date: This is a selection from the calendar.
Run Type: This is a drop down selection. The drop down list is filtered
based on the As of Date selected.
Run Name: This is a drop down selection. The drop down list is
filtered based on the As of Date and Run Type selected.
Run Execution ID: This is a drop down selection. The drop down list
is filtered based on As of Date, Run t and Scenario selected.
Legal Entity: This is a drop down selection. The drop down list is
filtered based on As of Date, Run Type and Run Name selected.
Page Level Display Parameters
Run Type
Consolidation Type
Page Level User Input
Buffer Ratio Tolerance: This is a user specified tolerance value in
percentage terms. The default value is 100.
The following reports are displayed as part of the Liquidity Ratios subject area:
Available and Required Liquidity Buffer
Buffer and Buffer Requirements Across Stress Horizons
Available Buffer Composition
Cash Flow Projections
88..11 AAvvaaiillaabbllee aanndd RReeqquuiirreedd LLiiqquuiiddiittyy BBuuffffeerr
Report Name Available and Required Liquidity Buffer
Report Level Filters Not Applicable
Report Description This report displays the required buffer, available buffer and the buffer ratio.
Report Type
Custom Report Type
The report displays the Buffer Ratio, Net Cash Flow Needs and Available Buffer.

Analytics User Guide: Oracle Financial Services Liquidity Risk Management
Release 8.0.6.0.0
54
Net Cash Flow Needs includes:
Net External Cash Flow Needs and Net Internal Cash Flow Needs in case of FBOs
Cash Flow Needs and Cash Flow Sources in case of BHCs
The color of Buffer Ratio and Available Buffer varies based on the Buffer Ratio Tolerance specified as follows:
Green Color: Buffer ratio >= 100% of Buffer Ratio Tolerance
Amber Color: Buffer ratio >=90% and < 100% of Buffer Ratio Tolerance
Red Color: Buffer ratio < 90% of Buffer Ratio Tolerance
Cash Flow Needs are displayed in Red color whereas Cash Flow Sources are displayed in Green.
Dimensions Legal Entity
Base Measures Cash Flows
Available Buffer
Computed Measures Buffer Ratio
Drill-through On Not Applicable
Drill-through’s Not Applicable
88..22 BBuuffffeerr aanndd BBuuffffeerr RReeqquuiirreemmeennttss AAccrroossss SSttrreessss HHoorriizzoonnss
Report Name Buffer and Buffer Requirement across Stress Horizons
Report Level Filters Not Applicable
Report Description This report displays the available buffer computed for the Buffer Horizon, Net Cash Outflows, Buffer Ratio and Buffer Tolerance across multiple user specified stress horizons.
Report Type
Combination of Column and Line Graph
The user specified stress horizons are displayed on the x-axis.
The following are displayed as columns on the primary y-axis:
Available Buffer
Net Cash Flow Needs
The following are displayed as a line graphs on the secondary y-axis.
Buffer Ratio
Buffer Ratio Tolerance
Dimensions Legal Entity
Stress Horizons
Base Measures Available Buffer

Analytics User Guide: Oracle Financial Services Liquidity Risk Management
Release 8.0.6.0.0
55
Net Cash Flow Needs
Buffer Ratio Tolerance
Buffer Ratio
Computed Measures Not Applicable
Drill-through On Not Applicable
Drill-through’s Not Applicable
88..33 CCaasshh FFllooww PPrroojjeeccttiioonnss
Report Name Cash Flow Projections
Report Level Filters Reporting Bucket Definition
Bucket Level
Report Description This report displays the components of net cash flows across time buckets based on the bucket level selected.
Report Type
Combination of Column and Line Graph
The time buckets at the user selected bucket level are displayed on the x-axis.
FBO View:
The following are displayed as columns on the primary y-axis:
Intragroup Cash Inflow
Intragroup Cash Outflow
External Cash Inflow
External Cash Outflow
The following are displayed as a line graphs on the secondary y-axis.
Intragroup Cumulative Inflow
Intragroup Cumulative Outflow
External Cumulative Inflow
External Cumulative Outflow
BHC View:
The following are displayed as columns on the primary y-axis:
Cash Inflow
Cash Outflow
The following are displayed as a line graphs on the secondary y-axis.
Cumulative Inflow
Cumulative Outflow
Dimensions Legal Entity
Time Bucket Definition

Analytics User Guide: Oracle Financial Services Liquidity Risk Management
Release 8.0.6.0.0
56
Base Measures
Intragroup Cash Inflow
Intragroup Cash Outflow
External Cash Inflow
External Cash Outflow
Cash Inflow
Cash Outflow
Computed Measures
Intragroup Cumulative Inflow
Intragroup Cumulative Outflow
External Cumulative Inflow
External Cumulative Outflow
Cumulative Inflow
Cumulative Outflow
Drill-through On Not Applicable
Drill-through’s Not Applicable
88..44 AAvvaaiillaabbllee BBuuffffeerr CCoommppoossiittiioonn
Report Name Available Buffer Composition
Report Level Filters Buffer Composition By: This is a drop selection.
Report Description This report displays the break-up of the available buffer across different dimensions and provides multiple views of the buffer composition.
Report Type
Custom Report
The available buffer is displayed as square badge.
Pie Chart – Buffer Composition by Type
The break-up of available buffer is displayed across the following asset types:
Cash
US Government Securities
US Government Agency Securities
US GSE Securities
Other Securities
Pie Chart – Buffer Composition by Asset Class
The break- up of available buffer is displayed across the following asset classes:
Level 1 Assets
Level 2A Assets
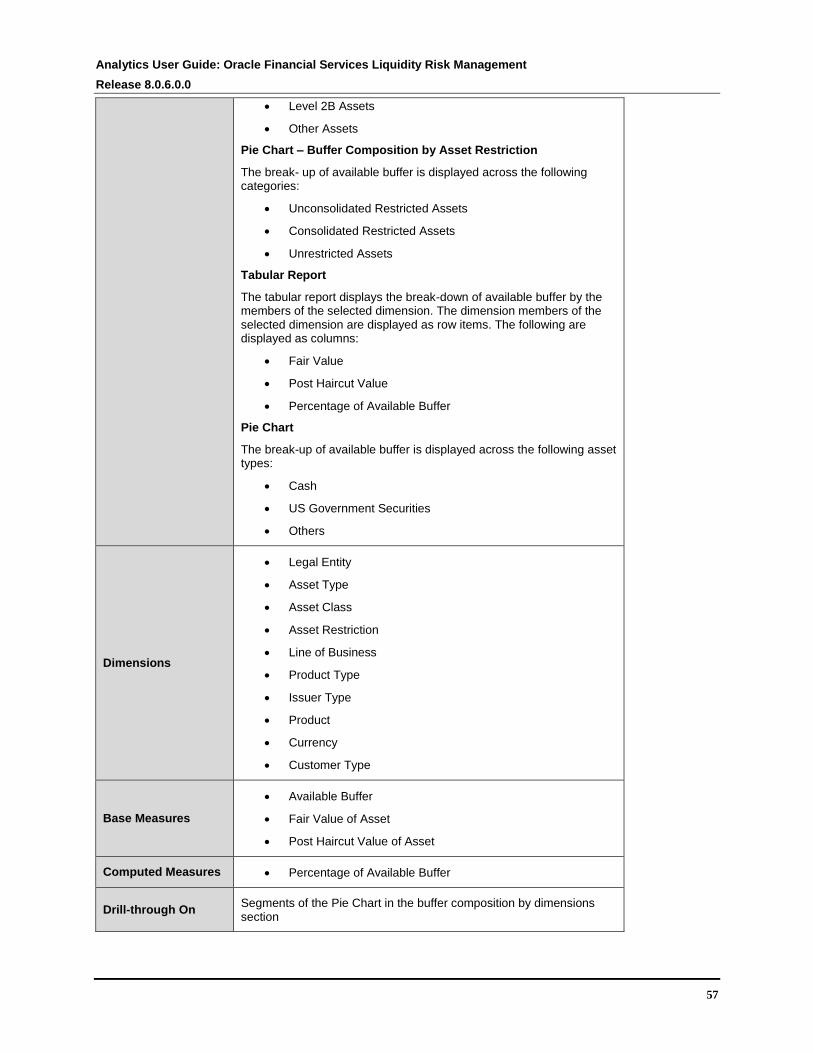
Analytics User Guide: Oracle Financial Services Liquidity Risk Management
Release 8.0.6.0.0
57
Level 2B Assets
Other Assets
Pie Chart – Buffer Composition by Asset Restriction
The break- up of available buffer is displayed across the following categories:
Unconsolidated Restricted Assets
Consolidated Restricted Assets
Unrestricted Assets
Tabular Report
The tabular report displays the break-down of available buffer by the members of the selected dimension. The dimension members of the selected dimension are displayed as row items. The following are displayed as columns:
Fair Value
Post Haircut Value
Percentage of Available Buffer
Pie Chart
The break-up of available buffer is displayed across the following asset types:
Cash
US Government Securities
Others
Dimensions
Legal Entity
Asset Type
Asset Class
Asset Restriction
Line of Business
Product Type
Issuer Type
Product
Currency
Customer Type
Base Measures
Available Buffer
Fair Value of Asset
Post Haircut Value of Asset
Computed Measures Percentage of Available Buffer
Drill-through On Segments of the Pie Chart in the buffer composition by dimensions section

Analytics User Guide: Oracle Financial Services Liquidity Risk Management
Release 8.0.6.0.0
58
Drill-through’s
Level 1:
Report Type: Pie Chart
The selected segment of the pie chart is broken-down across the members of the selected dimension.
Level 2 Drill-thru On: Not Applicable

Analytics User Guide: Oracle Financial Services Liquidity Risk Management
Release 8.0.6.0.0
59
99 IInnttrraa--ddaayy LLiiqquuiiddiittyy MMeettrriiccss SSuubbjjeecctt AArreeaa
Intra-day Liquidity Metrics tab consists of the following page level filters which are applicable to all the
reports in this subject area:
Dashboard Name Liquidity Risk
Subject Area Intra-day Liquidity Risk Metrics
Page Level Filters
As of Date: This is a selection from the calendar.
Run: This is a drop down selection. The drop down list is filtered
based on the date selected.
Run Execution ID: This is a drop down selection. The drop down list
is filtered based on As of Date, Run and Scenario selected.
Legal Entity: This is a drop down selection. The drop down list is
filtered based on As of Date, Run and Scenario selected.
Currency Type: This is a drop down selection of one of the following
options: Local Currency and Reporting Currency.
Payment System: This is a drop down selection. The drop down list is
filtered based on the Run and legal entity selected.
Currency: This is a drop down selection. The drop down list is filtered
based on legal entity and payment system selected.
Page Level Display Parameters
Run Type
Consolidation Type
The following reports are displayed as part of the Intra-day Liquidity Metrics subject area:
Daily Maximum Intra-day Liquidity Usage
Start of Day Available Intra-day Liquidity
Total Payments
Time-Specific Obligations
Value of Payments Made on Behalf of Correspondent Banking Customers
Intraday Credit Lines Extended to Correspondent Banking Customers
Intra-day Throughput
Consolidated Payment System Run
Real Time Reporting
Intraday Projection

Analytics User Guide: Oracle Financial Services Liquidity Risk Management
Release 8.0.6.0.0
60
99..11 DDaaiillyy MMaaxxiimmuumm IInnttrraa--ddaayy LLiiqquuiiddiittyy UUssaaggee
Report Name Daily Maximum Intra-day Liquidity Usage
Report Level Filters Not applicable
Report Description This report displays the daily maximum intra-day liquidity requirements of a legal entity in the respective payment system.
Report Type
Line Chart
The time buckets at level zero, are represented on the x-axis. The Intraday liquidity usage (net cumulative positions) at each time instant is displayed in the form of a line chart.
Additionally, the largest negative and positive net cumulative positions are reported at a legal entity-payment system level.
Dimensions Legal Entity
Payment system
Base Measures Largest Positive Net Cumulative Position
Largest Negative Net Cumulative Position
Computed Measures Net Intraday liquidity usage
Cumulative Net Intraday liquidity usage
Drill-through On Not applicable
Drill-through’s Not applicable
99..22 SSttaarrtt ooff DDaayy AAvvaaiillaabbllee IInnttrraa--ddaayy LLiiqquuiiddiittyy
Report Name Start of Day Available Intra-day Liquidity
Report Level Filters Not applicable
Report Description This report displays the start of the day and minimum available intra-day liquidity for the legal entity and each intra-day liquidity source.
Report Type
Column Chart
The intra-day liquidity sources are displayed on the x-axis while the start of the day available intraday liquidity is available as columns on the y-axis. The cumulative available intra-day liquidity is displayed as a line chart on the y-axis.
Additionally, the start of the day available intra-day liquidity at the legal entity- payment system level is displayed.
Dimensions Legal Entity
Intra-day Liquidity Sources
Base Measures Start of the Day Available Intra-Day Liquidity for each source

Analytics User Guide: Oracle Financial Services Liquidity Risk Management
Release 8.0.6.0.0
61
Computed Measures Start of the Day Available Intra-Day Liquidity- Total value
Drill-through On Type of Source
Clicking each column on the bar chart
Drill-through’s
On clicking each type of source, the drill through enables a user to view the constituent products that form the particular source of liquidity, along with the number of units and their total values.
Level 1: Page level display parameters:
As of date
Process/Run
Legal entity
Currency
Report Name: Start of Day Available Intra-day Liquidity
Tabular graph:
The table columns represent the various dimensions, product, number of units and currency.
99..33 TToottaall PPaayymmeennttss
Report Name Total Payments
Report Level Filters Not applicable
Report Description This report is a total number displayed each for payments made and payments received throughout the course of a working day for a particular legal entity- payment system- currency combination.
Report Type Total Number is displayed
Dimensions Legal Entity
Payment system
Base Measures Total payments made
Total payments received
Computed Measures Not applicable
Drill-through On Not applicable
Drill-through’s Not applicable
99..44 TTiimmee--SSppeecciiffiicc OObblliiggaattiioonnss
Report Name Time-Specific Obligations
Report Level Filters Not applicable
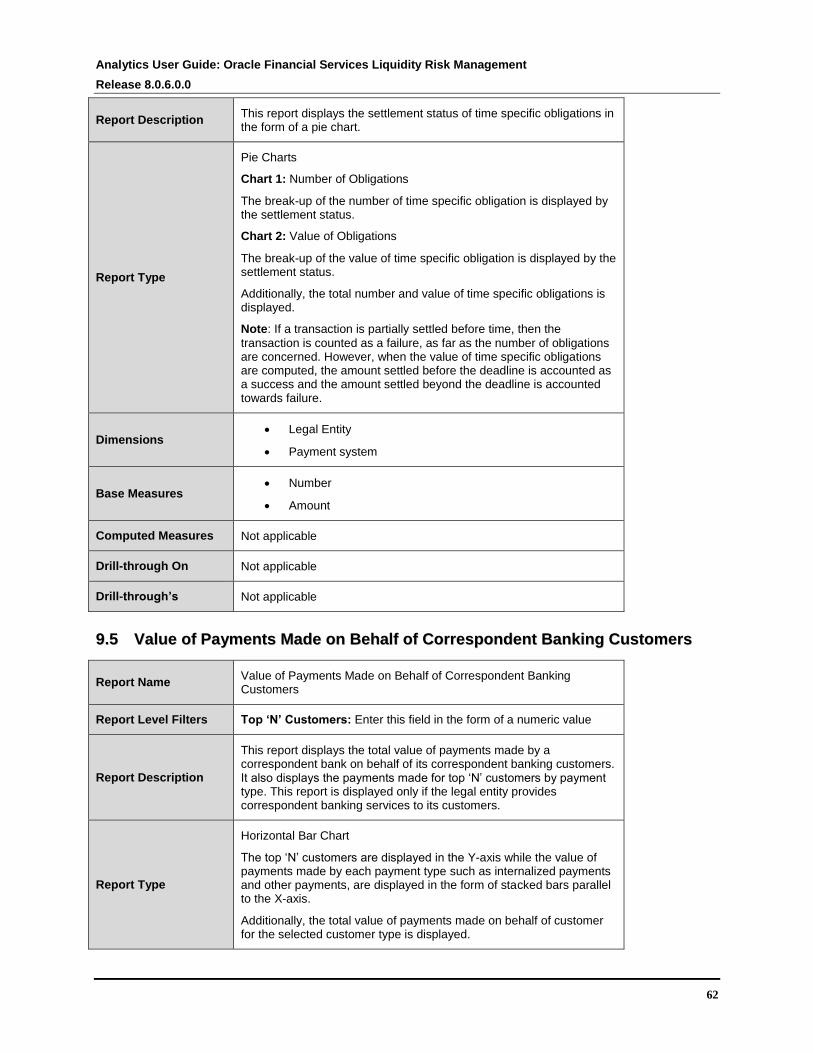
Analytics User Guide: Oracle Financial Services Liquidity Risk Management
Release 8.0.6.0.0
62
Report Description This report displays the settlement status of time specific obligations in the form of a pie chart.
Report Type
Pie Charts
Chart 1: Number of Obligations
The break-up of the number of time specific obligation is displayed by the settlement status.
Chart 2: Value of Obligations
The break-up of the value of time specific obligation is displayed by the settlement status.
Additionally, the total number and value of time specific obligations is displayed.
Note: If a transaction is partially settled before time, then the
transaction is counted as a failure, as far as the number of obligations are concerned. However, when the value of time specific obligations are computed, the amount settled before the deadline is accounted as a success and the amount settled beyond the deadline is accounted towards failure.
Dimensions Legal Entity
Payment system
Base Measures Number
Amount
Computed Measures Not applicable
Drill-through On Not applicable
Drill-through’s Not applicable
99..55 VVaalluuee ooff PPaayymmeennttss MMaaddee oonn BBeehhaallff ooff CCoorrrreessppoonnddeenntt BBaannkkiinngg CCuussttoommeerrss
Report Name Value of Payments Made on Behalf of Correspondent Banking Customers
Report Level Filters Top ‘N’ Customers: Enter this field in the form of a numeric value
Report Description
This report displays the total value of payments made by a correspondent bank on behalf of its correspondent banking customers. It also displays the payments made for top ‘N’ customers by payment type. This report is displayed only if the legal entity provides correspondent banking services to its customers.
Report Type
Horizontal Bar Chart
The top ‘N’ customers are displayed in the Y-axis while the value of payments made by each payment type such as internalized payments and other payments, are displayed in the form of stacked bars parallel to the X-axis.
Additionally, the total value of payments made on behalf of customer for the selected customer type is displayed.

Analytics User Guide: Oracle Financial Services Liquidity Risk Management
Release 8.0.6.0.0
63
Dimensions Legal Entity
Currency
Base Measures Total Payments
Computed Measures Total Payments made on behalf of Correspondent banking
customers
Drill-through On Not applicable
Drill-through’s Not applicable
99..66 IInnttrraaddaayy CCrreeddiitt LLiinneess EExxtteennddeedd ttoo CCoorrrreessppoonnddeenntt BBaannkkiinngg CCuussttoommeerrss
Report Name Intraday Credit Lines Extended to Correspondent Banking Customers
Report Level Filters Top ‘N’ Customers: Enter this field in the form a numeric value
Report Description
This report displays the value of intra-day credit lines extended by a legal entity to its correspondent banking customers and their peak usage by customer type. It also displays these metrics for top ‘N’ customers. This report is displayed only if the legal entity provides correspondent banking services to its customers.
Report Type
The following values must be displayed for all correspondent banking customers. For example, if the bank has 10 customers, for all these customers, the total value of the following must be displayed:
Total Value of Intraday Credit Lines extended, Total Committed lines extended, Total secured lines extended.
Total Usage of Intraday Credit lines extended, Total usage of Secured lines, Total Usage of Committed lines, Total Peak usage of the lines
Tabular Report with Embedded Graph
Top ‘N’ customers by the selected customer type are displayed as rows. Example, Out of the 10, the bank can chose 5 as N. These 5 customers would be the top 5 customers with respect to maximum Amount of Intraday Credit lines extended.
The following are displayed in columns
Total Intra-day Credit Line Usage
Secured Intra-day Credit Line Usage
Committed Intra-day Credit Line Usage
The graph embedded in each cell displays the value of intra-day credit line extended as a column colored Grey. The maximum daily usage is displayed as a column within the grey colored column and its color varies based on the utilization of the line of credit as follows:
Green color: 0% to 75% Usage
Amber color: >75% to 90% Usage
Red color: >90% Usage
Peak Usage is a total number and must be monitored at every time instant of the day. Peak usage should also be displayed against the
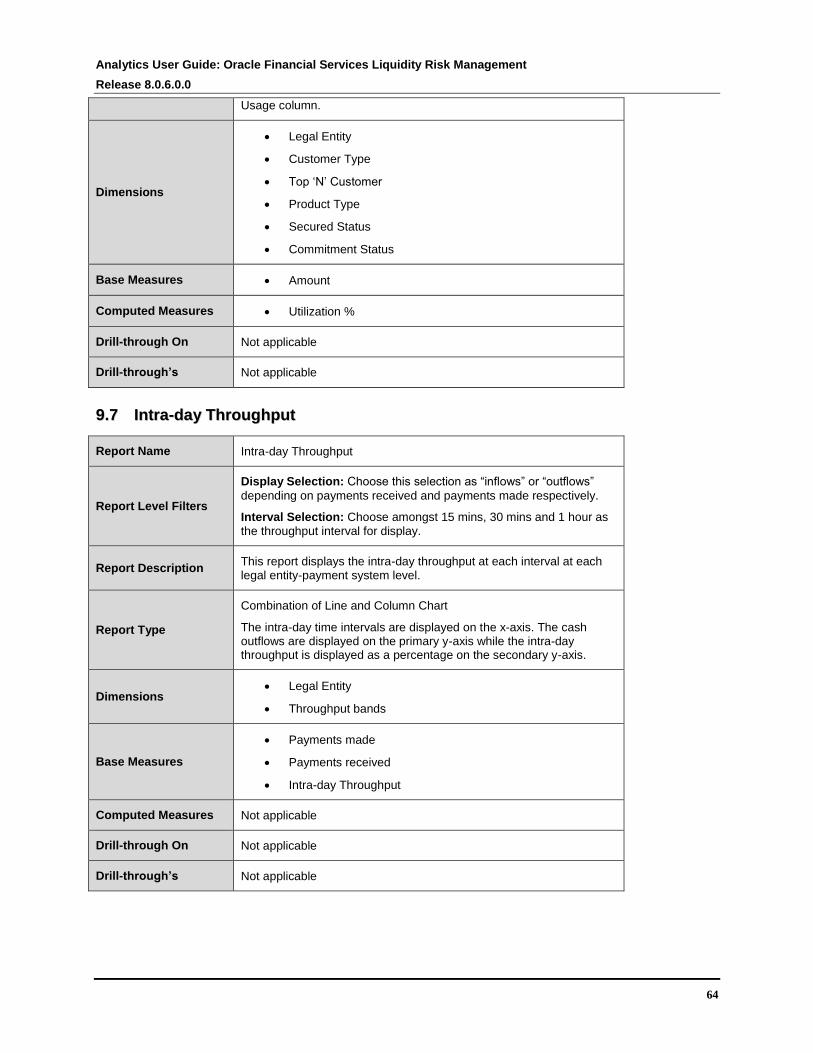
Analytics User Guide: Oracle Financial Services Liquidity Risk Management
Release 8.0.6.0.0
64
Usage column.
Dimensions
Legal Entity
Customer Type
Top ‘N’ Customer
Product Type
Secured Status
Commitment Status
Base Measures Amount
Computed Measures Utilization %
Drill-through On Not applicable
Drill-through’s Not applicable
99..77 IInnttrraa--ddaayy TThhrroouugghhppuutt
Report Name Intra-day Throughput
Report Level Filters
Display Selection: Choose this selection as “inflows” or “outflows”
depending on payments received and payments made respectively.
Interval Selection: Choose amongst 15 mins, 30 mins and 1 hour as
the throughput interval for display.
Report Description This report displays the intra-day throughput at each interval at each legal entity-payment system level.
Report Type
Combination of Line and Column Chart
The intra-day time intervals are displayed on the x-axis. The cash outflows are displayed on the primary y-axis while the intra-day throughput is displayed as a percentage on the secondary y-axis.
Dimensions Legal Entity
Throughput bands
Base Measures
Payments made
Payments received
Intra-day Throughput
Computed Measures Not applicable
Drill-through On Not applicable
Drill-through’s Not applicable

Analytics User Guide: Oracle Financial Services Liquidity Risk Management
Release 8.0.6.0.0
65
1100 IInnttrraa--DDaayy RReeaall TTiimmee MMoonniittoorriinngg SSuubbjjeecctt AArreeaa
Intra-day Real Time Monitoring tab consists of the following page level filters which are applicable to all
the reports in this subject area:
Dashboard Name Liquidity Risk
Subject Area Intra-day Real Time Reporting
Page Level Filters
Legal Entity: This is a drop down selection. The drop down list is
filtered based on As of Date, Run and Scenario selected.
Currency: This is a drop down selection. The drop down list is filtered
based on legal entity and payment system selected.
Page Level Display Parameters
Legal Entity
Currency
The following reports are displayed as part of Real Time Monitoring subject area:
Available Credit Lines
Available Intraday Eligibile Sources of Liquidity
Time Specific Obligations
Payments Snapshot
Cumulative Net Position
Payments Received
Payments Sent
1100..11 AAvvaaiillaabbllee CCrreeddiitt LLiinneess
This is a real time report that displays each intraday lines of credit available to the bank. The report
displays total value of the credit line available along with withdrawn amount.
Report Name Available Credit lines
Report Level Filters Not Applicable
Report Description This is a real time report that displays each intraday line of credit available to the bank.
Report Type
Bar Chart
The available intraday credit lines are displayed on the x-axis. The total usage and available undrawn amount is displayed on the Y axis
Dimensions Legal Entity
Currency

Analytics User Guide: Oracle Financial Services Liquidity Risk Management
Release 8.0.6.0.0
66
Base Measures Not applicable
Computed Measures Not applicable
Drill-through On Not applicable
Drill-through’s Not applicable
1100..22 AAvvaaiillaabbllee IInnttrraaddaayy EElliiggiibbllee SSoouurrcceess ooff LLiiqquuiiddiittyy
This is a real time report that displays total intraday eligible sources as available to the bank throughout
the day. The report displays available liquidity at the start of the day and at any time during the day.
Report Name Available Intraday eligible sources of liquidity
Report Level Filters Not applicable
Report Description This is a real time report that displays total intraday eligible sources as available to the bank throughout the day.
Report Type
Horizontal Bar Chart
The various categories of intraday sources are displayed at the Y axis. The total amount and available amount is displayed alone the X axis
Dimensions Legal Entity
Currency
Base Measures Not applicable
Computed Measures Not applicable
Drill-through On Type of Source
Clicking each column on the bar chart
Drill-through’s
On clicking each type of source, the drill through enables a user to view the constituent products that form the particular source of liquidity, along with the number of units and their total values.
Level 1: Page level display parameters:
As of date
Process/Run
Legal entity
Currency
Report Name: Available intraday eligible sources of liquidity
Tabular graph:
The table columns represent the various dimensions, product, number of units and currency. Each row is further classified under the various sub-categories of available intraday eligible sources of liquidity, such

Analytics User Guide: Oracle Financial Services Liquidity Risk Management
Release 8.0.6.0.0
67
as Central bank reserves, Collateral pledged etc.
1100..33 TTiimmee SSppeecciiffiicc OObblliiggaattiioonnss
This is a real time report that displays all the time specific obligations for a legal entity for the day, along
with the settlement status, success/failure to settle within time, of each transaction.
Report Name Time specific obligations
Report Level Filters Not applicable
Report Description This is a real time report that displays all the time specific obligations for a legal entity for the day
Report Type
List
The various obligations are listed as a list. Settlement status and settled amount are reported in the same list. Color coding is used to depict success/failure of each transaction within time.
Dimensions Legal Entity
Currency
Base Measures Not applicable
Computed Measures Not applicable
Drill-through On Not applicable
Drill-through’s Not applicable
1100..44 PPaayymmeennttss SSnnaappsshhoott
This is a real time report that displays a snapshot of all payment sent and received up to present time.
The payments are grouped and displayed in time bands of 15 minutes.
Report Name Payments snapshot
Report Level Filters Not applicable
Report Description This is a real time report that displays a snapshot of all payment sent and received up to present time
Report Type
List
The payments made and received are grouped into 15 minute constant intervals and displayed along with the total amount.
Dimensions
Legal Entity
Currency
Payment system
Base Measures Not applicable

Analytics User Guide: Oracle Financial Services Liquidity Risk Management
Release 8.0.6.0.0
68
Computed Measures Not applicable
Drill-through On Not applicable
Drill-through’s Not applicable
1100..55 CCuummuullaattiivvee NNeett PPoossiittiioonn
This is a real time report that displays a cumulative net position of all payments within a payment system
at the granularity of each second.
Report Name Cumulative net position
Report Level Filters Not applicable
Report Description This is a real time report that displays the cumulative net amount up to present time at a second time interval granularity.
Report Type
Line graph
The X axis represents time intervals, Y axis represent cumulative net position. Early warning indicators can be configured through the report and the same is displayed as a constant line parallel to the X axis
Dimensions
Legal Entity
Currency
Payment system
Base Measures Not applicable
Computed Measures Not applicable
Drill-through On Not applicable
Drill-through’s Not Applicable
1100..66 PPaayymmeennttss RReecceeiivveedd
This is a real time report that displays payments received at each time instant. The total payments
received upto present time is also displayed.
Report Name Payments Received
Report Level Filters Not applicable
Report Description This is a real time report that displays payments received at each time instant
Report Type
Bar Chart
The X axis represents time intervals, Y axis represent amount of each payment received.

Analytics User Guide: Oracle Financial Services Liquidity Risk Management
Release 8.0.6.0.0
69
Dimensions
Legal Entity
Currency
Payment system
Base Measures Not applicable
Computed Measures Not applicable
Drill-through On Not applicable
Drill-through’s Not applicable
1100..77 PPaayymmeennttss SSeenntt
This is a real time report that displays payments sent at each time instant. The total payments sent upto
present time is also displayed.
Report Name Payments sent
Report Level Filters Not applicable
Report Description This is a real time report that displays payments sent at each time instant
Report Type
Bar Chart
The X axis represents time intervals, Y axis represent amount of each payment sent.
Dimensions
Legal Entity
Currency
Payment system
Base Measures Not applicable
Computed Measures Not applicable
Drill-through On Not applicable
Drill-through’s Not applicable

Analytics User Guide: Oracle Financial Services Liquidity Risk Management
Release 8.0.6.0.0
70
1111 IInntteerriimm RReessuullttss SSuubbjjeecctt AArreeaa
Interim Results tab consists of the following page level filters which are applicable to all the reports in this
subject area.
Dashboard Name Liquidity Risk
Subject Area Interim Results
Page Level Filters
Calendar Date: This is a selection from the calendar.
Process/Run: This is a drop down selection. The drop down list is
filtered based on the date selected.
Scenario Name: This is a drop down selection. The drop down list is
filtered based on the Run selected.
Run Execution ID: This is a drop down selection. The drop down list
is filtered based on As of Date, Run and Scenario selected.
Legal Entity: This is a drop down selection. The drop down list is
filtered based on As of Date, Run and Scenario selected.
Currency Type: This is a drop down selection of one of the following
options: Local Currency and Reporting Currency
Reporting Bucket Definition: This is a drop down selection. The drop
down list is displayed based on the Time Bucket Definition selected in the given Run.
Bucket Level: This is a drop down selection. The drop down list is
filtered based on the Reporting Time Bucket selected.
Page Level Display Parameters
Consolidation Type
The following reports are displayed as part of the Interim Results subject area:
Interim Results across Buckets
Interim Liquidity Gaps across Business Assumptions
1111..11 IInntteerriimm RReessuullttss aaccrroossss BBuucckkeettss
Report Name Interim Results across Buckets
Report Level Filters
Business Assumption: A drop down list containing the following
options:
Contractual
Business Assumptions (displayed in the order of execution)
Business-as-Usual/Stress
Report Description
This report displays the changes in cash flows in each time bucket due to the application of the selected business assumptions in the form of a column chart. It enables the assessment of the impact of each business assumption on the contractual cash flows occurring in each time bucket.
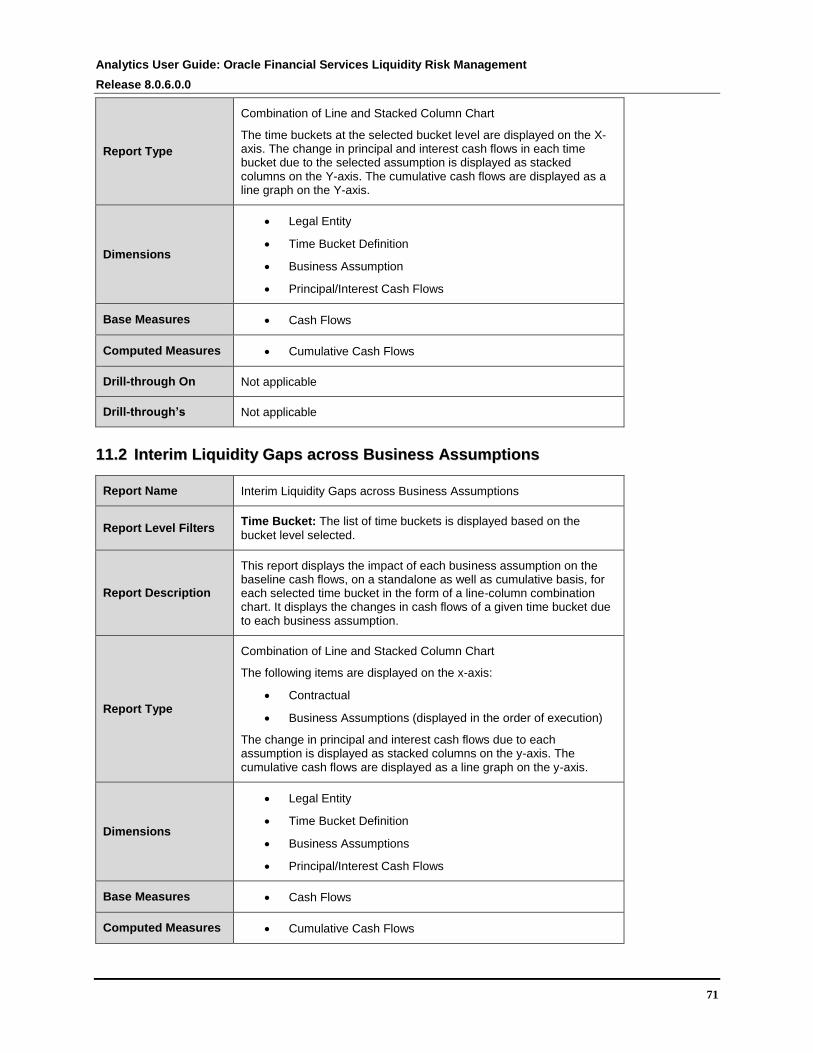
Analytics User Guide: Oracle Financial Services Liquidity Risk Management
Release 8.0.6.0.0
71
Report Type
Combination of Line and Stacked Column Chart
The time buckets at the selected bucket level are displayed on the X-axis. The change in principal and interest cash flows in each time bucket due to the selected assumption is displayed as stacked columns on the Y-axis. The cumulative cash flows are displayed as a line graph on the Y-axis.
Dimensions
Legal Entity
Time Bucket Definition
Business Assumption
Principal/Interest Cash Flows
Base Measures Cash Flows
Computed Measures Cumulative Cash Flows
Drill-through On Not applicable
Drill-through’s Not applicable
1111..22 IInntteerriimm LLiiqquuiiddiittyy GGaappss aaccrroossss BBuussiinneessss AAssssuummppttiioonnss
Report Name Interim Liquidity Gaps across Business Assumptions
Report Level Filters Time Bucket: The list of time buckets is displayed based on the
bucket level selected.
Report Description
This report displays the impact of each business assumption on the baseline cash flows, on a standalone as well as cumulative basis, for each selected time bucket in the form of a line-column combination chart. It displays the changes in cash flows of a given time bucket due to each business assumption.
Report Type
Combination of Line and Stacked Column Chart
The following items are displayed on the x-axis:
Contractual
Business Assumptions (displayed in the order of execution)
The change in principal and interest cash flows due to each assumption is displayed as stacked columns on the y-axis. The cumulative cash flows are displayed as a line graph on the y-axis.
Dimensions
Legal Entity
Time Bucket Definition
Business Assumptions
Principal/Interest Cash Flows
Base Measures Cash Flows
Computed Measures Cumulative Cash Flows

Analytics User Guide: Oracle Financial Services Liquidity Risk Management
Release 8.0.6.0.0
72
Drill-through On Not applicable
Drill-through’s Not applicable

Analytics User Guide: Oracle Financial Services Liquidity Risk Management
Release 8.0.6.0.0
73
1122 FFuunnddiinngg CCoonncceennttrraattiioonn SSuubbjjeecctt AArreeaa
Funding Concentration tab consists of the following page level filters which are applicable to all the
reports in this subject area.
Dashboard Name Liquidity Risk
Subject Area Funding Concentration
Page Level Filters
Calendar Date: This is a selection from the calendar.
Process/Run: This is a drop down selection. The drop down list is
filtered based on the date selected.
Scenario Name: This is a drop down selection. The drop down list is
filtered based on the Run selected.
Run Execution ID: This is a drop down selection. The drop down list
is filtered based on As of Date, Run and Scenario selected.
Legal Entity: This is a drop down selection. The drop down list is
filtered based on As of Date, Run and Scenario selected.
Currency Type: This is a drop down selection of one of the following
options: Local Currency and Reporting Currency
Reporting Bucket Definition: This is a drop down selection. The drop
down list is displayed based on the Time Bucket Definition selected in the given Run.
Bucket Level: This is a drop down selection. The drop down list is
filtered based on the Reporting Time Bucket selected.
Page Level Display Parameters
Consolidation Type
The following reports are displayed as part of the Funding Concentration subject area:
Concentration of Funding Liabilities across Dimensions
Funding Concentration Trend Analysis
List of Assets by Significant Currencies
List of Liabilities by Significant Currencies
1122..11 CCoonncceennttrraattiioonn ooff FFuunnddiinngg LLiiaabbiilliittiieess aaccrroossss DDiimmeennssiioonnss
Report Name Concentration of Funding Liabilities across Dimensions
Report Level Filters
Dimension: This is a drop down filter of the following options:
Counterparty
Currency
Product/Instrument Type
Product/Instrument

Analytics User Guide: Oracle Financial Services Liquidity Risk Management
Release 8.0.6.0.0
74
Measure: This is a drop down filter of the following options:
Funding Amount
Percentage of Total Funding
Report Description This report displays Concentration of Funding Liabilities across Dimensions. The total funding concentration by each significant dimension member and for each time bucket is displayed.
Report Type
Graphical Report:
Pie Chart
The break-up of funding received is displayed by each member of the dimension selected. The significant dimension members are displayed individually, whereas the non-significant members are grouped as Others.
Tabular Report:
Each significant member of the selected dimension in displayed as a row item. The column heading for this will change based on the dimension selected. The concentration is displayed across time buckets of the selected bucket level. Additionally the total funding concentration by each significant dimension member and for each time bucket is displayed.
Dimensions
Legal Entity
Time Bucket Definition
Counterparty
Currency
Product/Instrument Type
Product/Instrument
Significance
Base Measures Funding Amount
Computed Measures Percentage of Total Funding
Drill-through On Not Applicable
Drill-through’s Not Applicable
1122..22 FFuunnddiinngg CCoonncceennttrraattiioonn TTrreenndd AAnnaallyyssiiss
Report Name Funding Concentration Trend Analysis
Report Level Filters
Dimension
Period Start
Period End
Report Description This report displays the total funding provided by significant dimension

Analytics User Guide: Oracle Financial Services Liquidity Risk Management
Release 8.0.6.0.0
75
members over a trailing 30-day period in the form of a line graph. The report displays the funding liabilities across time buckets as a percentage of the total funding liabilities of the institution.
Report Type
Combination of Line and Column Chart
The time period is displayed on the a-axis. The total funding liabilities received by the legal entity as well as the total funding received for significant members of the selected dimension are displayed as columns on the primary y-axis. The funding concentration across significant dimension members is displayed on the secondary y-axis as a percentage of total funding in the form of a line graph.
Additionally, the selected dimension is displayed for informational purpose.
Dimensions
Legal Entity
Counterparty
Currency
Product/Instrument Type
Product/Instrument
Significance
Base Measures Funding Amount
Computed Measures Total Funding from Significant Dimension Members
Funding Concentration
Drill-through On Not applicable
Drill-through’s Not applicable
1122..33 LLiisstt ooff AAsssseettss bbyy SSiiggnniiffiiccaanntt CCuurrrreenncciieess
Report Name List of Assets by Significant Currencies
Report Level Filters Significant Currency
Report Description
This report displays the list of assets denominated in each selected significant currency in the form of a tabular report. The asset balances are displayed across time buckets based on their maturity. Significant currencies are available for selection as a drop-down list.
Report Type
Tabular Report
The assets denominated in the selected significant currency are displayed as row items. The asset value is displayed for each time bucket in columns.
Dimensions
Legal Entity
Asset/Liability
Significant Currency

Analytics User Guide: Oracle Financial Services Liquidity Risk Management
Release 8.0.6.0.0
76
Base Measures Amount
Computed Measures Not applicable
Drill-through On Not applicable
Drill-through’s Not applicable
1122..44 LLiisstt ooff LLiiaabbiilliittiieess bbyy SSiiggnniiffiiccaanntt CCuurrrreenncciieess
Report Name List of Liabilities by Significant Currencies
Report Level Filters Significant Currency
Report Description
This report displays the list of liabilities denominated in each selected significant currency in the form of a tabular report. The liability balances are displayed across time buckets based on their maturity. Significant currencies are available for selection as a drop-down list.
Report Type
Tabular Report
The liabilities denominated in the selected significant currency are displayed as row items. The liability value is displayed for each time bucket in columns.
Dimensions
Legal Entity
Asset/Liability
Significant Currency
Base Measures Amount
Computed Measures Not applicable
Drill-through On Not applicable
Drill-through’s Not applicable
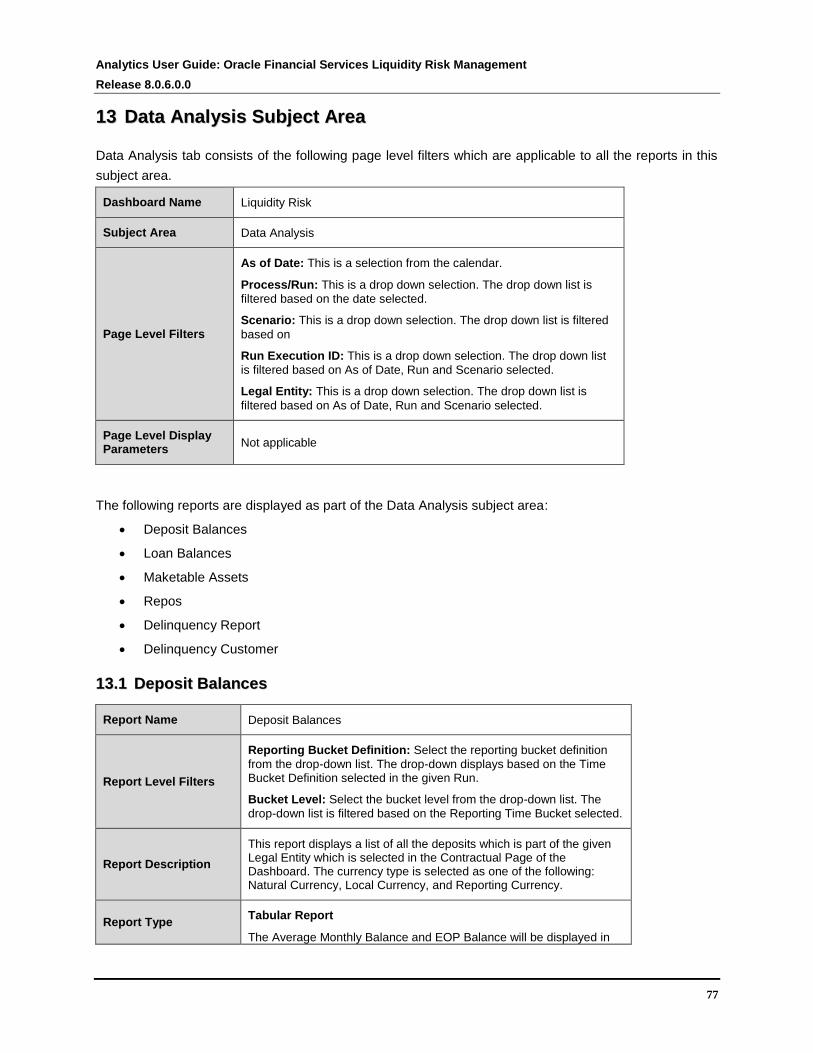
Analytics User Guide: Oracle Financial Services Liquidity Risk Management
Release 8.0.6.0.0
77
1133 DDaattaa AAnnaallyyssiiss SSuubbjjeecctt AArreeaa
Data Analysis tab consists of the following page level filters which are applicable to all the reports in this
subject area.
Dashboard Name Liquidity Risk
Subject Area Data Analysis
Page Level Filters
As of Date: This is a selection from the calendar.
Process/Run: This is a drop down selection. The drop down list is
filtered based on the date selected.
Scenario: This is a drop down selection. The drop down list is filtered
based on
Run Execution ID: This is a drop down selection. The drop down list
is filtered based on As of Date, Run and Scenario selected.
Legal Entity: This is a drop down selection. The drop down list is
filtered based on As of Date, Run and Scenario selected.
Page Level Display Parameters
Not applicable
The following reports are displayed as part of the Data Analysis subject area:
Deposit Balances
Loan Balances
Maketable Assets
Repos
Delinquency Report
Delinquency Customer
1133..11 DDeeppoossiitt BBaallaanncceess
Report Name Deposit Balances
Report Level Filters
Reporting Bucket Definition: Select the reporting bucket definition
from the drop-down list. The drop-down displays based on the Time Bucket Definition selected in the given Run.
Bucket Level: Select the bucket level from the drop-down list. The
drop-down list is filtered based on the Reporting Time Bucket selected.
Report Description
This report displays a list of all the deposits which is part of the given Legal Entity which is selected in the Contractual Page of the Dashboard. The currency type is selected as one of the following: Natural Currency, Local Currency, and Reporting Currency.
Report Type Tabular Report
The Average Monthly Balance and EOP Balance will be displayed in

Analytics User Guide: Oracle Financial Services Liquidity Risk Management
Release 8.0.6.0.0
78
the denomination of the currency type selected. For instance if the natural currency of the account is Indian Rupees, the currency type is selected as reporting currency and the reporting currency mapped to the selected legal entity is US Dollars, then the balances will be converted to US Dollar based on the exchange rate prevalent on the Run Execution Date and displayed in dollars.
Dimensions
Product
Customer Type
Customer
Account
Base Measures Delinquent Amount
Computed Measures Not applicable
Drill-through On Not applicable
Drill-through’s Not applicable
1133..22 LLooaann BBaallaanncceess
Report Name Loan Balances
Report Level Filters
Reporting Bucket Definition: Select the reporting bucket definition
from the drop-down list. The drop-down displays based on the Time Bucket Definition selected in the given Run.
Bucket Level: Select the bucket level from the drop-down list. The
drop-down list is filtered based on the Reporting Time Bucket selected.
Report Description
This report displays a list of all the loan accounts which are part of the given Legal Entity which is selected in the Contractual Page of the Dashboard. The currency type is selected as one of the following: Natural Currency, Local Currency, and Reporting Currency.
Report Type
Tabular Report
The Credit Limit, Limit Utilization and EOP Balance will be displayed in the denomination of the currency type selected. For instance if the natural currency of the account is Indian Rupees, the currency type is selected as reporting currency and the reporting currency mapped to the selected legal entity is US Dollars, then the limits and balances will be converted to US Dollar based on the exchange rate prevalent on the Run Execution Date and displayed in dollars.
Dimensions
Product
Customer Type
Customer
Account
Base Measures Delinquent Amount
Computed Measures Not applicable

Analytics User Guide: Oracle Financial Services Liquidity Risk Management
Release 8.0.6.0.0
79
Drill-through On Not applicable
Drill-through’s Not applicable
1133..33 MMaarrkkeettaabbllee AAsssseettss
Report Name Marketable Assets
Report Level Filters
Reporting Bucket Definition: Select the reporting bucket definition
from the drop-down list. The drop-down displays based on the Time Bucket Definition selected in the given Run.
Bucket Level: Select the bucket level from the drop-down list. The
drop-down list is filtered based on the Reporting Time Bucket selected.
Report Description
This report displays a list of all the marketable assets which are part of the given Legal Entity which is selected in the Contractual Page of the Dashboard. The currency type is selected as one of the following: Natural Currency, Local Currency and Reporting Currency.
Report Type
Tabular Report
The Face Value and Market Value will be displayed in the denomination of the currency type selected. For instance if the natural currency of the account is Indian Rupees, the currency type is selected as reporting currency and the reporting currency mapped to the selected legal entity is US Dollars, then the values will be converted to US Dollar based on the exchange rate prevalent on the Run Execution Date and displayed in dollars.
Asset Type
Interest Rate Instruments
Equity Instruments
Commodity Instruments
Currency Instruments
Securitized Products
Property
Base Measures Delinquent Amount
Computed Measures Not applicable
Drill-through On Not applicable
Drill-through’s Not applicable
1133..44 RReeppooss
Report Name Repos
Report Level Filters
Reporting Bucket Definition: Select the reporting bucket definition
from the drop-down list. The drop-down displays based on the Time Bucket Definition selected in the given Run.
Bucket Level: Select the bucket level from the drop-down list. The

Analytics User Guide: Oracle Financial Services Liquidity Risk Management
Release 8.0.6.0.0
80
drop-down list is filtered based on the Reporting Time Bucket selected.
Report Description
This report displays a list of all the repo transactions of the given Legal Entity which is selected in the Contractual Page of the Dashboard. The currency type is selected as one of the following: Natural Currency, Local Currency and Reporting Currency.
Report Type
Tabular Report
The Collateral Value, Haircut, Market Value and Maturity Amount will be displayed in the denomination of the currency type selected. For instance if the natural currency of the account is Indian Rupees, the currency type is selected as reporting currency and the reporting currency mapped to the selected legal entity is US Dollars, then the values will be converted to US Dollar based on the exchange rate prevalent on the Run Execution Date and displayed in dollars.
Asset Type
Interest Rate Instruments
Equity Instruments
Commodity Instruments
Currency Instruments
Securitized Products
Property
Base Measures Delinquent Amount
Computed Measures Not applicable
Drill-through On Not applicable
Drill-through’s Not applicable
1133..55 DDeelliinnqquueennccyy RReeppoorrtt
Report Name Delinquency Report
Report Level Filters
Reporting Bucket Definition: This is a drop down selection. The drop
down list is displayed based on the Time Bucket Definition selected in the given Run.
Bucket Level: This is a drop down selection. The drop down list is
filtered based on the Reporting Time Bucket selected.
Report Description
This is a tabular report displaying the delinquent amount in each time bucket across product types. Additionally, two report level parameters, Reporting Bucket Definition and Bucket Level have been introduced for this report.
Report Type
Tabular Report
Product types are displayed as row items while time buckets based on the bucket level selected are displayed as column headers. The delinquent amounts in each time bucket are displayed as column values.

Analytics User Guide: Oracle Financial Services Liquidity Risk Management
Release 8.0.6.0.0
81
Dimensions
Legal Entity
Reporting Time Bucket
Delinquency Status
Product Type
Product
Customer Type
Customer
Account
Base Measures Delinquent Amount
Computed Measures Not applicable
Drill-through On As currently available on each product type
Drill-through’s
The drill-through sequence for this report will continue as existing currently to the following levels:
Level 1: Product
Level 2: Customer Type
Level 3: Customer
Level 4: Account
1133..66 DDeelliinnqquueenntt CCuussttoommeerr
Report Name Delinquency Customer
Report Level Filters
Reporting Bucket Definition: Select the reporting bucket definition
from the drop-down list. The drop-down displays based on the Time Bucket Definition selected in the given Run.
Bucket Level: Select the bucket level from the drop-down list. The
drop-down list is filtered based on the Reporting Time Bucket selected.
Report Description
This is a tabular report that displays the following details of each delinquent customer:
Account Number
Product Type
Product
Customer Type
Customer
Tenor
Delinquent Days
Delinquent Amount.

Analytics User Guide: Oracle Financial Services Liquidity Risk Management
Release 8.0.6.0.0
82
Report Type
Tabular Report
Product types are displayed as row items while time buckets based on the bucket level selected are displayed as column headers. The delinquent amounts in each time bucket are displayed as column values.
Dimensions
Product
Customer Type
Customer
Account
Base Measures Delinquent Amount
Computed Measures Not applicable
Drill-through On Not applicable
Drill-through’s Not applicable

Analytics User Guide: Oracle Financial Services Liquidity Risk Management
Release 8.0.6.0.0
83
1144 FFoorrwwaarrdd LLiiqquuiiddiittyy AAnnaallyyssiiss SSuubbjjeecctt AArreeaa
Forward Liquidity Analysis consists of the following page level and report level filters. Page Level filters are applicable
to all the reports in this subject area.
Dashboard Name Liquidity Risk
Subject Area Forward Liquidity Analysis
Page Level Filters Calender Date: Select date from the calendar
Process/Run: Select the Process/Run from the dropdown list. The
dropdown list is filtered based on the As of date selected
Scenario Name: Select the scenario from the dropdown list. The
dropdown list is filtered based on the Process/Run selected
Run Execution Id: Select the Run Execution from the dropdown list.
The dropdown list is filtered based on the combination of As Of
Date,Process/Run, Scenario selected.
Legal Entity: Select the Legal Entity from the dropdown list. The drop
down list is filtered based on the combination of As Of Date,
Process/Run and Scenario selected
Currency Type: Select the currency type from the dropdown list. The
dropdown list displays following options: Reporting Currency and Local
Currency
Forward Date: Select date from the dropdown list. The dropdown list is
filtered based on As of Date, Process/Run,Scenario and Run Execution
ID.
Page Level Display
Parameters
Not Applicable
The following reports are displayed as part of Forward Liquidity Analysis subject area:
Forward Liquidity Gap -<Currency Type>
Forward Liquidity Ratio Analysis
Balance Sheet Mismatch
Forward Balance Position
1144..11 FFoorrwwaarrdd LLiiqquuiiddiittyy GGaapp -- <<CCuurrrreennccyy TTyyppee>>
Report Name Forward Liquidity Gap - <Currency Type>

Analytics User Guide: Oracle Financial Services Liquidity Risk Management
Release 8.0.6.0.0
84
Report Level Filters
Reporting Bucket Definition: This is a drop down selection. The drop
down list is displayed based on the Time Bucket Definition selected in
the given Run.
Bucket Level : This is a drop down selection. The drop down list is
filtered based on the Reporting Time Bucket selected.
Report Description
The name of this report changes based on the Currency Type selected
as part of the Page Level Filters. For instance if the currency type is
selected as Reporting Currency, the name of this report is displayed as
Forward Liquidity Gap– Reporting Currency.
This report displays the liquidity gap results in currency type selected
for the time bucket and forward date selected. Both the graphical and
tabular report display the gap in terms of principal. The time buckets are
displayed based on the bucket level selected as part of the report level
filter.
Report Type
Graphical Report:
Combination of Bar and Line Chart
Time Buckets of the selected bucket level are displayed on the x-axis. Gap (Inflow – Outflow) is displayed on the y-axis as stacked column values. Cumulative gap is displayed on the y-axis as a line. Tabular Report:
The following are displayed as row items:
Total Inflows
Total Outflows
Liquidity Gap
Gap as % of Total Outflows
Cumulative Gap
The time buckets corresponding to the bucket level selected as part of
the report level filter are displayed as column items.
Dimensions
Time Buckets
Calendar
Forward Date
Legal Entity
Standard Product Type
Currency
Customer Type
Base Measures Cash flows
Computed Measures Total Inflows
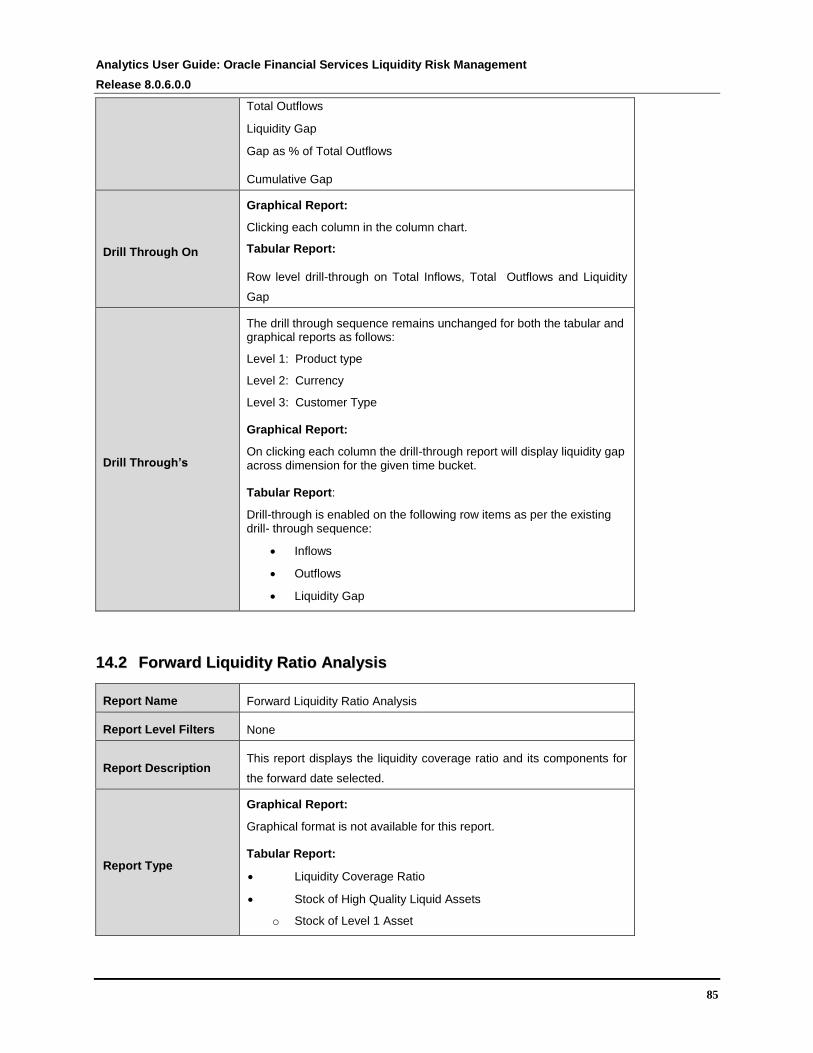
Analytics User Guide: Oracle Financial Services Liquidity Risk Management
Release 8.0.6.0.0
85
Total Outflows
Liquidity Gap
Gap as % of Total Outflows
Cumulative Gap
Drill Through On
Graphical Report:
Clicking each column in the column chart.
Tabular Report:
Row level drill-through on Total Inflows, Total Outflows and Liquidity
Gap
Drill Through’s
The drill through sequence remains unchanged for both the tabular and graphical reports as follows:
Level 1: Product type
Level 2: Currency
Level 3: Customer Type Graphical Report:
On clicking each column the drill-through report will display liquidity gap across dimension for the given time bucket. Tabular Report:
Drill-through is enabled on the following row items as per the existing drill- through sequence:
Inflows
Outflows
Liquidity Gap
1144..22 FFoorrwwaarrdd LLiiqquuiiddiittyy RRaattiioo AAnnaallyyssiiss
Report Name Forward Liquidity Ratio Analysis
Report Level Filters None
Report Description This report displays the liquidity coverage ratio and its components for
the forward date selected.
Report Type
Graphical Report:
Graphical format is not available for this report. Tabular Report:
Liquidity Coverage Ratio
Stock of High Quality Liquid Assets
o Stock of Level 1 Asset

Analytics User Guide: Oracle Financial Services Liquidity Risk Management
Release 8.0.6.0.0
86
o Stock of Level 2A Asset
o Stock of Level 2B Asset
o Adjustment due to cap on Level 2 Assets
o Adjustment due to cap on Level 2B Assets
Net Cash out flows
o Cash outflows
o Cash inflows
Dimensions
Calendar
Legal entity
Base Measures
Liquidity Coverage Ratio
Stock of HQLA
Net Cash Out Flow
Computed Measures
Stock of Level 1 Asset
Stock of Level 2A Asset
Stock of Level 2B Asset
Adjustment due to cap on Level 2 Assets
Adjustment due to cap on Level 2B Assets
Cash outflows
Cash inflows
Add on
Drill-through on No drill down available
Drill-through’s No drill down available
1144..33 BBaallaannccee SShheeeett MMiissmmaattcchh
Report Name Balance Sheet Mismatch
Report Level Filters None
Report Description
This report displays the aggregate of forward balance, adjusted forward
balance and current balance for Total assets, Total liabilities and
Balance Sheet Mismatch.
Report Type
Graphical Report:
Graphical format is not available for this report. Tabular Report:
The following are displayed as row items:
Total Assets – Current Balance, Forward Balance and

Analytics User Guide: Oracle Financial Services Liquidity Risk Management
Release 8.0.6.0.0
87
Adjusted Forward Balance.
Total Liabilities – Current Balance, Forward Balance and
Adjusted Forward Balance.
Balance Sheet Mismatch – Current Balance, Forward Balance
and Adjusted Forward Balance
Dimensions
Product
Legal Entity
Calendar
Standard Product Type
Base Measures Assets
Liabilities
Computed Measures
Current Balances
Forward Balances
Adjusted Forward Balances
Drill-through on None
Drill-through’s None
1144..44 FFoorrwwaarrdd BBaallaannccee PPoossiittiioonn
Report Name Forward Balance Position
Report Level Filters None
Report Description This report displays forward balance, adjusted forward balance and
current balance for assets and liabilities.
Report Type
Graphical Report:
Graphical format is not available for this report. Tabular Report:
The following are displayed as row items:
• Assets – Current Balance, Forward Balance and Adjusted Forward Balance.
• Liabilities – Current Balance, Forward Balance and Adjusted Forward
Balance.
Dimensions
Product
Legal Entity
Calendar
Standard Product Type
Customer Type
Currency

Analytics User Guide: Oracle Financial Services Liquidity Risk Management
Release 8.0.6.0.0
88
Base Measures Assets
Liabilities
Computed Measures
Current Balances
Forward Balances
Adjusted Forward Balances
Drill- through On
Graphical Report:
Graphical format is not available for this report.
Tabular Report:
Row level drill-through on the following dimensions for Assets and Liabilities
Product Type
Currency
Customer Type
Drill through’s
The drill-through sequence is:
Level 1: Product type
Level 2: Currency
Level 3: Customer Type
Graphical Report:
Graphical format is not available for this report.
Tabular Report:
Drill-through is enabled on the following row items as per the existing drill- through sequence:
Product Type
Currency
Customer Type

Analytics User Guide: Oracle Financial Services Liquidity Risk Management
Release 8.0.6.0.0
89
1155 FFoorrwwaarrdd LLiiqquuiiddiittyy AAccrroossss DDaatteess SSuubbjjeecctt AArreeaa
Forward Liquidity Across Dates consists of the following page level and report level filters. Page level
filters are applicable to all the reports in this subject area.
Dashboard Name Liquidity Risk
Subject Area Forward Liquidity Across Dates
Page Level Filters Calender Date: Select date from the calendar
Process/Run: Select the Process/Run from the dropdown list. The
dropdown list is filtered based on the As of date selected
Scenario Name: Select the scenario from the dropdown list. The
dropdown list is filtered based on the Process/Run selected
Run Execution Id: Select the Run Execution from the dropdown list. The
dropdown list is filtered based on the combination of As Of Date,
Process/Run, Scenario selected.
Legal Entity: Select the Legal Entity from the dropdown list. The drop
down list is filtered based on the combination of As Of Date, Process/Run
and Scenario selected
Currency Type: Select the currency type from the dropdown list. The
dropdown list displays following options: Reporting Currency and Local
Currency
Page Level Display
Parameters
Not applicable
The following reports are displayed as part of Forward Liquidity Across Dates subject area:
Forward Liquidity Gap Variance Analysis - <Currency Type>
Forward Liquidity Gap Across Dates - <Currency Type>
Forward Liquidity Ratio Variance Analysis
Forward Liquidity Ratio Across Dates
Forward Balance Analysis Across Dates

Analytics User Guide: Oracle Financial Services Liquidity Risk Management
Release 8.0.6.0.0
90
1155..11 FFoorrwwaarrdd LLiiqquuiiddiittyy GGaapp VVaarriiaannccee AAnnaallyyssiiss -- <<CCuurrrreennccyy TTyyppee>>
Report Name Forward Liquidity Gap Variance Analysis - <Currency Type>
Report Level Filters
Reporting Bucket Definition: This is a drop down selection. The drop
down list is displayed based on the Time Bucket Definition selected in the
given Run.
Bucket Level : This is a drop down selection. The drop down list is
filtered based on the Reporting Time Bucket selected.
Date 1: This is a drop down selection of forward dates. The dropdown list
is filtered based on the AsOfDate,Process/Run,Scenario and Run
Execution Id selected as page level parameters.
Date 2: This is a drop down selection of forward dates. The dropdown list
is filtered based on the AsOfDate,Process/Run,Scenario and Run
Execution Id selected as page level parameters.
Varaince As : This is a dropdown selection. There are two options
available :
Percentage
Amount
Report Description
This report that displays the absolute and percentage variance between
liquidity gaps in each time bucket across two forward dates.
The name of this report changes based on the Currency Type selected as
part of the Page Level Filters. For instance if the currency type is selected
as Reporting Currency, the name of this report is displayed as Forward
Liquidity Gap Variance Analysis in Reporting Currency.
Report Type
Graphical Report:
Combination of Line and Column Chart
Time Buckets of the selected bucket level are displayed on the x-axis.
Liquidity gaps or cumulative gaps are displayed on the primary y-axis as
column values based on the gap type filter selected. Variance is displayed
as a line on the secondary y-axis in terms of absolute amount or
percentage based on the variance as filter selection.
Variance is calculated as follows:
Variance Amount = Amount as on Date 2 – Amount as on Date 1
Variance Percentage = (Amount as on Date 2 – Amount as on Date 1) /
Amount as on Date 1
Tabular Report:
The following are displayed as row items:
• Total Inflows
• Total Outflows
• Liquidity Gap
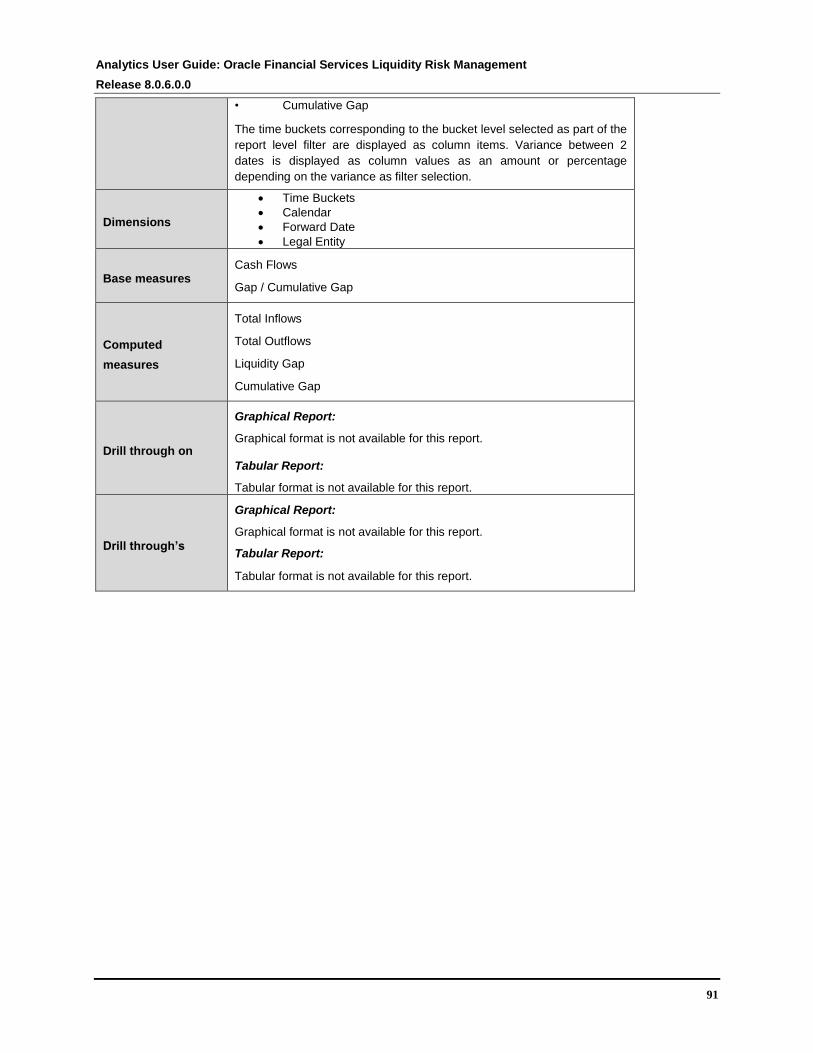
Analytics User Guide: Oracle Financial Services Liquidity Risk Management
Release 8.0.6.0.0
91
• Cumulative Gap
The time buckets corresponding to the bucket level selected as part of the
report level filter are displayed as column items. Variance between 2
dates is displayed as column values as an amount or percentage
depending on the variance as filter selection.
Dimensions
Time Buckets
Calendar
Forward Date
Legal Entity
Base measures Cash Flows
Gap / Cumulative Gap
Computed
measures
Total Inflows
Total Outflows
Liquidity Gap
Cumulative Gap
Drill through on
Graphical Report:
Graphical format is not available for this report. Tabular Report:
Tabular format is not available for this report.
Drill through’s
Graphical Report:
Graphical format is not available for this report.
Tabular Report:
Tabular format is not available for this report.

Analytics User Guide: Oracle Financial Services Liquidity Risk Management
Release 8.0.6.0.0
92
1155..22 FFoorrwwaarrdd LLiiqquuiiddiittyy GGaapp AAccrroossss DDaatteess-- <<CCuurrrreennccyy TTyyppee>>
Report Name Forward Liquidity Gap Across Dates - <Currency Type>
Report Level Filters
Reporting Bucket Definition: This is a drop down selection. The drop
down list is displayed based on the Time Bucket Definition selected in
the given Run.
Bucket Level: This is a drop down selection. The drop down list is
filtered based on the Reporting Time Bucket selected.
Period From – To: Select the forward date for the calendar
Report Description
This report that displays the absolute and percentage variance between liquidity gaps in each time bucket across two forward dates.
The name of this report changes based on the Currency Type selected
as part of the Page Level Filters. For instance if the currency type is
selected as Reporting Currency, the name of this report is displayed as
Forward Liquidity Gap Across Dates in Reporting Currency.
Report Type
Graphical Report:
Column chart description. The inflows, outflows and liquidity gap are
displayed as column chart across forward dates.
Tabular Report:
The following are displayed as row items for each forward dates
Total Inflows
Total Outflows
Liquidity Gap
The highest and lowest amount for each row items is highlighted.
Dimensions
Time Buckets
Calendar
Forward Date
Legal Entity
Base Measures Cash Flows
Gap / Cumulative Gap
Computed Measures
Total Inflows
Total Outflows
Liquidity Gap
Cumulative Gap
Drill-through on Graphical Report:

Analytics User Guide: Oracle Financial Services Liquidity Risk Management
Release 8.0.6.0.0
93
Graphical format is not available for this report. Tabular Report:
Tabular format is not available for this report.
Drill-through’s
Graphical Report:
Graphical format is not available for this report.
Tabular Report:
Tabular format is not available for this report.
1155..33 FFoorrwwaarrdd LLiiqquuiiddiittyy RRaattiioo VVaarriiaannccee AAnnaallyyssiiss
Report Name Forward Liquidity Ratio Variance Analysis
Report Level Filters
Date 1 : Select the forward date from the dropdown list.
The dropdown list is filtered based on the
AsOfDate,Process/Run,Scenario and Run Execution Id selected as page
level parameters
Date 2: Select the forward date from the dropdown list.
The dropdown list is filtered based on the
AsOfDate,Process/Run,Scenario and Run Execution Id selected as page
level parameters.
Variance As : This is a dropdown selection. There are two options
available :
Percentage
Amount
Report Description
This report displays the liquidity coverage ratio and its components
across two forward dates or as of date and forward date.
Variance is calculated as follows:
Variance Amount = Amount as on Date 2 – Amount as on Date 1
Variance Percentage = (Amount as on Date 2 – Amount as on Date 1) / Amount as on Date 1
Report Type
Graphical Report:
Column chart description. The stock of high Quality liquid Assets and Net Cash out flows is displayed as columns in the chart. Liquidity coverage ratio is displayed in a secondary axis.
Tabular Report:
The following are displayed a row items
Liquidity coverage Ratio
Stock of High Quality Liquid Assets
o Stock of Level 1 Asset

Analytics User Guide: Oracle Financial Services Liquidity Risk Management
Release 8.0.6.0.0
94
o Stock of Level 2A Asset
o Stock of Level 2B Asset
o Adjustment due to cap on Level 2 Assets
o Adjustment due to cap on Level 2B Assets
Net Cash out flows
o Cash outflows
o Cash inflows
Dimensions
Calendar
Legal Entity
Base Measures
Liquidity Coverage Ratio
Stock of HQLA
Net Cash Out Flow
Computed Measures
Stock of Level 1 Asset
Stock of Level 2A Asset
Stock of Level 2B Asset
Adjustment due to cap on Level 2 Assets
Adjustment due to cap on Level 2B Assets
Cash outflows
Cash inflows
Drill-through On No drill down available.
Drill-through’s No drill down available.
1155..44 FFoorrwwaarrdd LLiiqquuiiddiittyy RRaattiioo AAccrroossss DDaatteess
Report Name Forward Liquidity Ratio Across Dates
Report Level Filters Period Start - End : Select the forward date from the calendar.
Report Description
This report displays the liquidity coverage ratio and its components
across forward dates. The report level filters are period start date and
period end date.

Analytics User Guide: Oracle Financial Services Liquidity Risk Management
Release 8.0.6.0.0
95
Report Type
Graphical Report:
Column chart description. The stock of high Quality liquid Assets and Net Cash out flows is displayed as columns in the chart. Liquidity coverage ratio is displayed in a secondary axis.
Tabular Report:
The following are displayed a row items
Liquidity coverage Ratio
Stock of High Quality Liquid Assets
o Stock of Level 1 Asset
o Stock of Level 2A Asset
o Stock of Level 2B Asset
o Adjustment due to cap on Level 2 Assets
o Adjustment due to cap on Level 2B Assets
Net Cash out flows
o Cash outflows
o Cash inflows
o Add on
The highest and lowest amount for each row items is highlighted.
Dimensions
Calendar
Legal Entity
Base Measures
Liquidity Coverage Ratio
Stock of HQLA
Net Cash Out Flow
Computed Measures
Stock of Level 1 Asset
Stock of Level 2A Asset
Stock of Level 2B Asset
Adjustment due to cap on Level 2 Assets
Adjustment due to cap on Level 2B Assets
Cash outflows
Cash inflows
Drill-through on No drill down available.
Drill-through’s No drill down available.

Analytics User Guide: Oracle Financial Services Liquidity Risk Management
Release 8.0.6.0.0
96
1155..55 FFoorrwwaarrdd BBaallaannccee AAnnaallyyssiiss AAccrroossss DDaatteess
Report Name Forward Balance Analysis Across Dates
Report Level Filters
Balance Sheet Category: Select balance sheet category from
dropdown list.
Product: Select standard product type from dropdown list. The
dropdown list is filtered based on balance sheet category selected
Customer Type: Select the customer type from drop down list.
Legal Entity: Select the legal entity from drop down list.
Currency: Select the currency from drop down list.
Period Start-End: Select the forward date from the calendar.
Report Description This report displays forward balance, adjusted forward balance and
current balance for assets and liabilities across forward dates.
Report Type
Graphical Report:
Column chart description.
The forward balance, adjusted forward balance and current balance are displayed as columns across forward dates.
Tabular Report:
The following measures are displayed across forward dates
1. Forward Balance
2. Adjusted Forward Balance
3. Current Balance
Dimensions
Calendar
Legal Entity
Standard Product Type
Currency
Customer Type
Base Measures Assets
Liabilities
Computed Measures
Current Balances
Forward Balances
Adjusted Forward Balances
Drill-through On Graphical Report:
No drill available on chart.
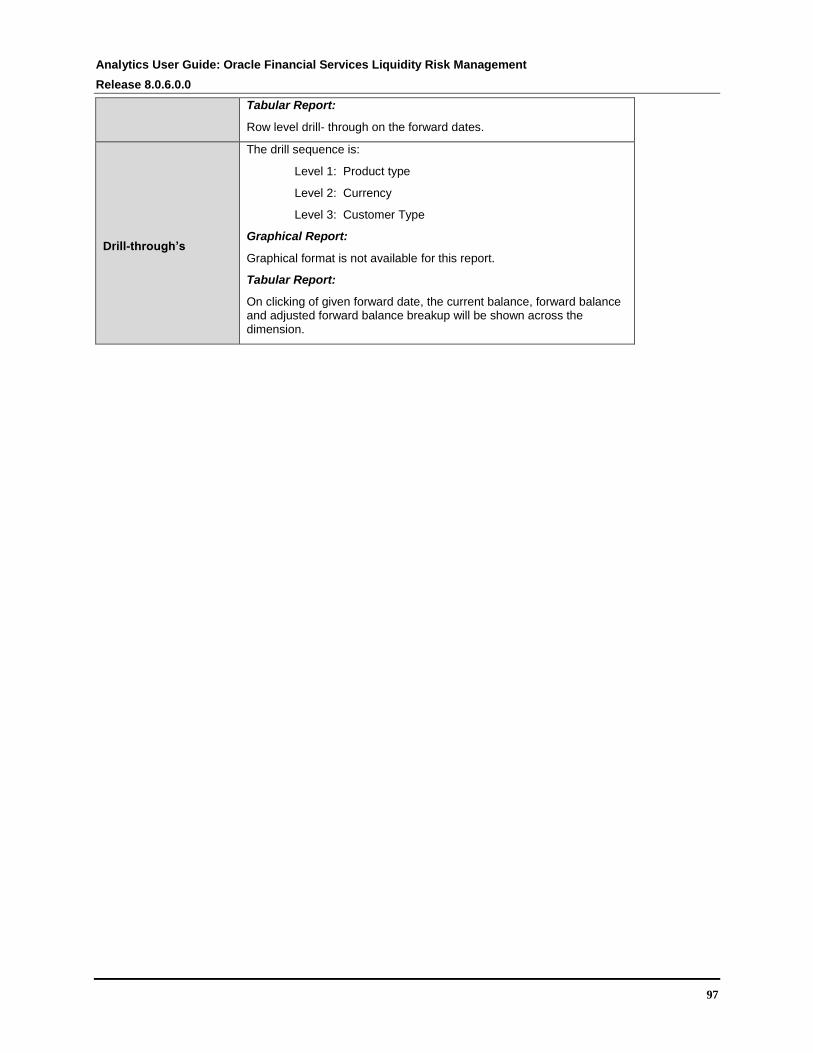
Analytics User Guide: Oracle Financial Services Liquidity Risk Management
Release 8.0.6.0.0
97
Tabular Report:
Row level drill- through on the forward dates.
Drill-through’s
The drill sequence is:
Level 1: Product type
Level 2: Currency
Level 3: Customer Type
Graphical Report:
Graphical format is not available for this report.
Tabular Report:
On clicking of given forward date, the current balance, forward balance and adjusted forward balance breakup will be shown across the dimension.

Analytics User Guide: Oracle Financial Services Liquidity Risk Management
Release 8.0.6.0.0
98
1166 AAnnnneexxuurree AA:: LLiisstt ooff LLRRMM RReeppoorrttss
Following is the list of Liquidity Risk Reports.
Sl. No.
Report No.
Report Name Report Category Subject
Area Dashboard
1 1 Liquidity Gap Analysis - Base Currency Main Report
Liquidity Gap
Liquidity Risk
2 1.1 Liquidity Gap Analysis by Line of Business - Base Currency
Drill-through (from Graph)
3 1.1.1 Liquidity Gap Analysis by Product Type - Base Currency
4 1.1.1.1 Liquidity Gap Analysis by Product - Base Currency
5 1.1.1.1.1
Liquidity Gap Analysis by Customer Type - Base Currency
6 1.1.1.1.1.1
Liquidity Gap Analysis by Customer - Base Currency
7 1.1.1.1.1.1.1
Liquidity Gap Analysis by Account - Base Currency
8 1.2 Liquidity Gap Report by Line of Business - Base Currency
Drill-through (from Table)
9 1.2.1 Liquidity Gap Report by Product Type - Base Currency
10 1.2.1.1 Liquidity Gap Report by Product - Base Currency
11 1.2.1.1.1
Liquidity Gap Report by Customer Type - Base Currency
12 1.2.1.1.1.1
Liquidity Gap Report by Customer - Base Currency
13 1.2.1.1.1.1.1
Liquidity Gap Report by Account - Base Currency
14 2 Liquidity Gap Analysis - <Currency Type> Main Report
15 2.1 Liquidity Gap Analysis by Line of Business - <Currency Type>
Drill-through (from Graph)
16 2.1.1 Liquidity Gap Analysis by Product Type - <Currency Type>
17 2.1.1.1 Liquidity Gap Analysis by Product - <Currency Type>
18 2.1.1.1.1
Liquidity Gap Analysis by Customer Type - <Currency Type>
19 2.1.1.1.1.1
Liquidity Gap Analysis by Customer - <Currency Type>
20 2.1.1.1.1.1.1
Liquidity Gap Analysis by Account - <Currency Type>
21 2.2 Liquidity Gap Report by Line of Business - <Currency Type>
Drill-through (from Table)
22 2.2.1 Liquidity Gap Report by Product Type - <Currency Type>
23 2.2.1.1 Liquidity Gap Report by Product - <Currency Type>
24 2.2.1.1.1
Liquidity Gap Report by Customer Type - <Currency Type>
25 2.2.1.1.1.1
Liquidity Gap Report by Customer - <Currency Type>
26 2.2.1.1.1.1.1
Liquidity Gap Report by Account - <Currency Type>
27 3 Dynamic Balance Sheet - Base Currency Main Report
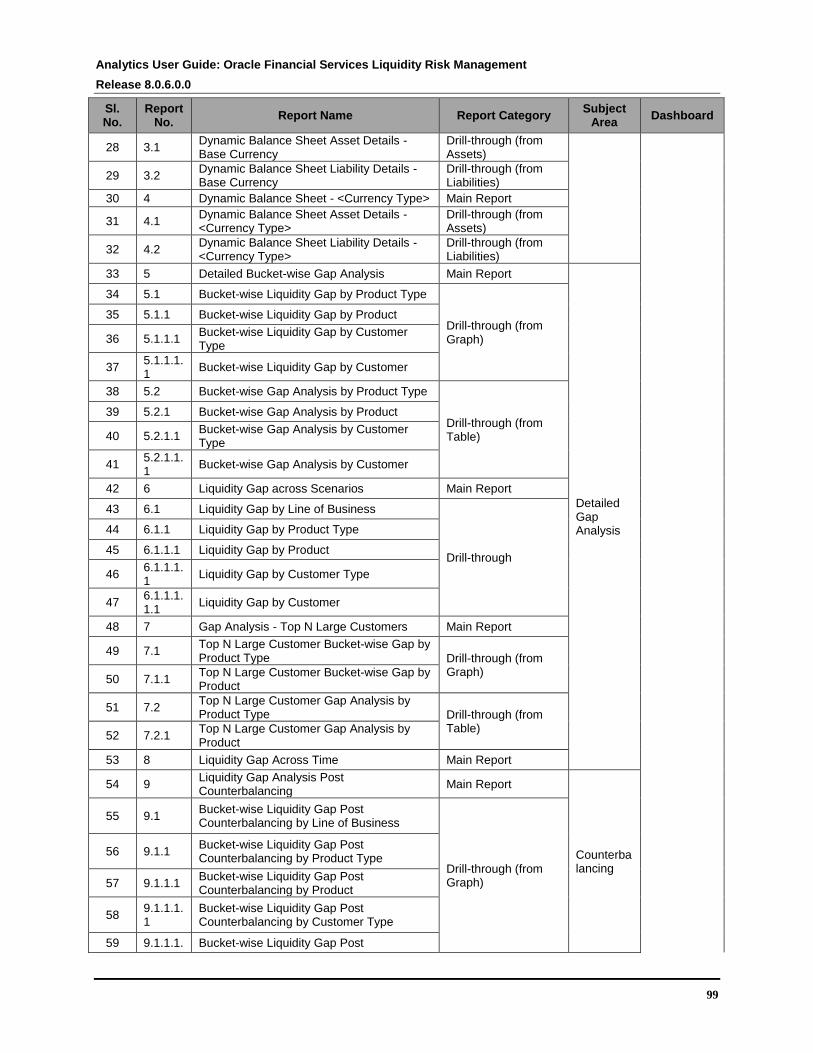
Analytics User Guide: Oracle Financial Services Liquidity Risk Management
Release 8.0.6.0.0
99
Sl. No.
Report No.
Report Name Report Category Subject
Area Dashboard
28 3.1 Dynamic Balance Sheet Asset Details - Base Currency
Drill-through (from Assets)
29 3.2 Dynamic Balance Sheet Liability Details - Base Currency
Drill-through (from Liabilities)
30 4 Dynamic Balance Sheet - <Currency Type> Main Report
31 4.1 Dynamic Balance Sheet Asset Details - <Currency Type>
Drill-through (from Assets)
32 4.2 Dynamic Balance Sheet Liability Details - <Currency Type>
Drill-through (from Liabilities)
33 5 Detailed Bucket-wise Gap Analysis Main Report
Detailed Gap Analysis
34 5.1 Bucket-wise Liquidity Gap by Product Type
Drill-through (from Graph)
35 5.1.1 Bucket-wise Liquidity Gap by Product
36 5.1.1.1 Bucket-wise Liquidity Gap by Customer Type
37 5.1.1.1.1
Bucket-wise Liquidity Gap by Customer
38 5.2 Bucket-wise Gap Analysis by Product Type
Drill-through (from Table)
39 5.2.1 Bucket-wise Gap Analysis by Product
40 5.2.1.1 Bucket-wise Gap Analysis by Customer Type
41 5.2.1.1.1
Bucket-wise Gap Analysis by Customer
42 6 Liquidity Gap across Scenarios Main Report
43 6.1 Liquidity Gap by Line of Business
Drill-through
44 6.1.1 Liquidity Gap by Product Type
45 6.1.1.1 Liquidity Gap by Product
46 6.1.1.1.1
Liquidity Gap by Customer Type
47 6.1.1.1.1.1
Liquidity Gap by Customer
48 7 Gap Analysis - Top N Large Customers Main Report
49 7.1 Top N Large Customer Bucket-wise Gap by Product Type Drill-through (from
Graph) 50 7.1.1
Top N Large Customer Bucket-wise Gap by Product
51 7.2 Top N Large Customer Gap Analysis by Product Type Drill-through (from
Table) 52 7.2.1
Top N Large Customer Gap Analysis by Product
53 8 Liquidity Gap Across Time Main Report
54 9 Liquidity Gap Analysis Post Counterbalancing
Main Report
Counterbalancing
55 9.1 Bucket-wise Liquidity Gap Post Counterbalancing by Line of Business
Drill-through (from Graph)
56 9.1.1 Bucket-wise Liquidity Gap Post Counterbalancing by Product Type
57 9.1.1.1 Bucket-wise Liquidity Gap Post Counterbalancing by Product
58 9.1.1.1.1
Bucket-wise Liquidity Gap Post Counterbalancing by Customer Type
59 9.1.1.1. Bucket-wise Liquidity Gap Post

Analytics User Guide: Oracle Financial Services Liquidity Risk Management
Release 8.0.6.0.0
100
Sl. No.
Report No.
Report Name Report Category Subject
Area Dashboard
1.1 Counterbalancing by Customer
60 9.2 Counterbalancing Inflows by Position
Drill-through (from Counterbalancing Inflows section of the Table)
61 9.3 Counterbalancing Outflows by Position
Drill-through (from Counterbalancing Outflows section of the Table)
62 10 Liquidity Ratios Main Report
Liquidity Ratios
63 10.1 High Quality Liquid Assets by Product Type Drill-through
64 10.1.1 High Quality Liquid Assets by Product Drill-through
65 10.2 Cash Flows by Product Type Drill-through
66 10.2.1 Cash Flows by Product Drill-through
67 11 Liquidity Coverage Ratio Components Main Report
68 11.1 Break-up of Liquidity Coverage Ratio Components
Drill-through
69 12 Net Stable Funding Ratio Components Main Report
70 13 Liquidity Coverage Ratio by Significant Currencies
Main Report
71 14 Liquidity Ratio Historical Variance Analysis Main Report
72 15 High Quality Liquid Assets Main Report
LCR Details
73 15.1 <Selected Encumbrance Status> <Selected Asset Level> Details
Drill-through
74 16 Break-up of Stock of High Quality Liquid Assets
Main Report
75 16.1 Components of Stock of Level 1 Assets Drill-through (from Table)
76 16.2 Adjustments to Stock of Level 1 Assets Drill-through (from Table)
77 16.3 Components of Stock of Level 2A Assets Drill-through (from Table)
78 16.4 Adjustments to Stock of Level 2A Assets Drill-through (from Table)
79 16.5 Components of Stock of Level 2B RMBS Assets
Drill-through (from Table)
80 16.6 Adjustments to Stock of Level 2B RMBS Assets
Drill-through (from Table)
81 16.7 Components of Stock of Level 2B Non-RMBS Assets
Drill-through (from Table)
82 16.8 Adjustments to Stock of Level 2B Non-RMBS Assets
Drill-through (from Table)
83 17 Break-up of Stock of HQLA Denominated in Significant Currencies
Main Report
84 18 Liquidity Transferability Restrictions Main Report
85 19 Liquidity Ratio Trend Analysis Main Report
86 20 NSFR Constituents By Product Types Main Report
NSFR Details
87 21 NSFR Break-up By Maturity Main Report
88 22 Off-Balance Sheet Items by Absolute Value Main Report
89 23 RSF Assets By Encumbrance Period Main Report
90 24 NSFR Trend Analysis Main Report
91 25 Available and Required Liquidity Buffer Main Report Regulation

Analytics User Guide: Oracle Financial Services Liquidity Risk Management
Release 8.0.6.0.0
101
Sl. No.
Report No.
Report Name Report Category Subject
Area Dashboard
92 26 Buffer and Buffer requirements across stress horizons
Main Report YY
93 27 Available Buffer Composition Main Report
94 28 Cash Flow Projections Main Report
95 29 Daily Maximum Intra-day Liquidity Usage Main Report
Intra-day Liquidity Metrics
96 30 Start of Day Available Intra-day Liquidity Main Report
97 30.1 Start of Day Available Intra-day Liquidity Drill-through
98 31 Total Payments Main Report
99 32 Time-Specific Obligations Main Report
100 33 Value of Payments Made on Behalf of Correspondent Banking Customers
Main Report
101 34 Intraday Credit Lines Extended to Correspondent Banking Customers
Main Report
102 35 Intra-day Throughput Main Report
103 36 Available Credit Lines Main Report
Real Time Monitoring
104 37 Available Intraday Eligible Sources of Liquidity
Main Report
105 38.1 Available Intraday Eligible Sources of Liquidity
Drill-through
106 39 Time Specific Obligations Main Report
107 40 Payments Snapshot Main Report
108 41 Cumulative Net Position Main Report
109 42 Payments Received Main Report
110 43 Payments Sent Main Report
111 44 Interim Results across Buckets Main Report Interim Results 112 45
Interim Liquidity Gaps across Business Assumptions
Main Report
113 46 Concentration of Funding Liabilities across Dimensions
Main Report Funding Concentration
114 47 Funding Concentration Trend Analysis Main Report
115 48 List of Assets by Significant Currencies Main Report
116 49 List of Liabilities by Significant Currencies Main Report
117 50 Deposit Balances Main Report
Data Analysis
118 51 Loan Balances Main Report
119 52 Marketable Assets Main Report
120 53 Repos Main Report
121 54 Delinquency Report Main Report
122 55.1 Delinquency Report by Product Type Drill-through
123 55.1.1 Delinquency Report by Product Drill-through
124 55.1.1.1
Delinquency Report by Customer Type Drill-through
125 55.1.1.1.1
Delinquency Report by Customer Drill-through
126 56 Delinquent Customer Main Report
127 57 Forward Liquidity Gap Main Report
Forward Liquidity Analysis
128 57.1 Forward Liquidity Gap - <Currency Type> Drill-through
129 58 Forward Liquidity Ratio Analysis Main Report
130 59 Balance Sheet Mismatch Main Report
131 60 Forward Balance Position Main Report
132 60.1 Forward Balance Position Drill-through
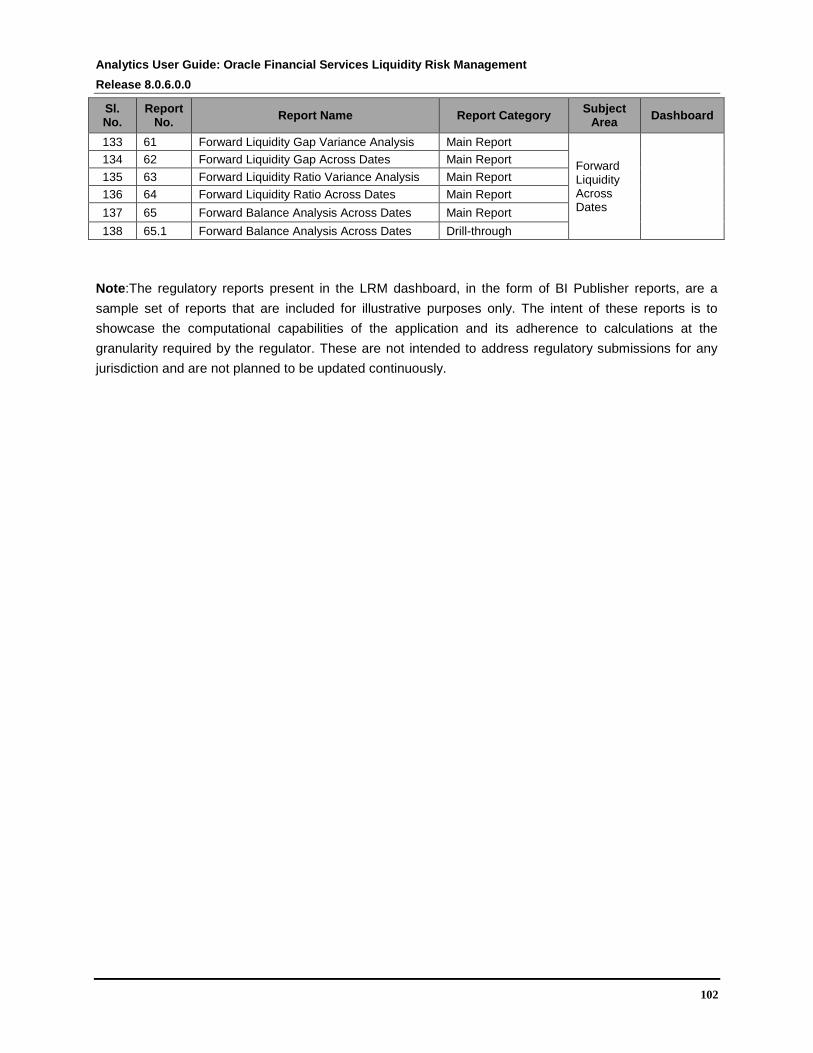
Analytics User Guide: Oracle Financial Services Liquidity Risk Management
Release 8.0.6.0.0
102
Sl. No.
Report No.
Report Name Report Category Subject
Area Dashboard
133 61 Forward Liquidity Gap Variance Analysis Main Report
Forward Liquidity Across Dates
134 62 Forward Liquidity Gap Across Dates Main Report
135 63 Forward Liquidity Ratio Variance Analysis Main Report
136 64 Forward Liquidity Ratio Across Dates Main Report
137 65 Forward Balance Analysis Across Dates Main Report
138 65.1 Forward Balance Analysis Across Dates Drill-through
Note:The regulatory reports present in the LRM dashboard, in the form of BI Publisher reports, are a
sample set of reports that are included for illustrative purposes only. The intent of these reports is to
showcase the computational capabilities of the application and its adherence to calculations at the
granularity required by the regulator. These are not intended to address regulatory submissions for any
jurisdiction and are not planned to be updated continuously.
Analytics User Guide: Oracle Financial Services Liquidity Risk Management
Release 8.0.6.0.0
103

Analytics User Guide: Oracle Financial Services Liquidity Risk Management
Release 8.0.6.0.0
104
Oracle Financial Services Liquidity Risk
Management
May 2018
Oracle Corporation
World Headquarters
500 Oracle Parkway
Redwood Shores, CA 94065
U.S.A.
Worldwide Inquiries:
Phone: +1.650.506.7000
Fax: +1.650.506.7200
oracle.com
Copyright © 2018, Oracle and/or its affiliates. All rights reserved. This document is provided for information purposes only and the
contents hereof are subject to change without notice. This document is not warranted to be error-free, nor subject to any other
warranties or conditions, whether expressed orally or implied in law, including implied warranties and conditions of merchantability or
fitness for a particular purpose. We specifically disclaim any liability with respect to this document and no contractual obligations are
formed either directly or indirectly by this document. This document may not be reproduced or transmitted in any form or by any
means, electronic or mechanical, for any purpose, without our prior written permission.
Oracle and Java are registered trademarks of Oracle and/or its affiliates. Other names may be trademarks of their respective owners.
Intel and Intel Xeon are trademarks or registered trademarks of Intel Corporation. All SPARC trademarks are used under license and
are trademarks or registered trademarks of SPARC International, Inc. AMD, Opteron, the AMD logo, and the AMD Opteron logo are
trademarks or registered trademarks of Advanced Micro Devices. UNIX is a registered trademark licensed through X/Open
Company, Ltd. 0611


