222
Oracle® Linux DTrace Guide E38608-23 August 2019

Oracle® Linux
DTrace Guide
E38608-23August 2019
Oracle Legal Notices
Copyright © 2013, 2019, Oracle and/or its affiliates. All rights reserved.
This software and related documentation are provided under a license agreement containing restrictions on use and disclosure and are protectedby intellectual property laws. Except as expressly permitted in your license agreement or allowed by law, you may not use, copy, reproduce,translate, broadcast, modify, license, transmit, distribute, exhibit, perform, publish, or display any part, in any form, or by any means. Reverseengineering, disassembly, or decompilation of this software, unless required by law for interoperability, is prohibited.
The information contained herein is subject to change without notice and is not warranted to be error-free. If you find any errors, please report themto us in writing.
If this is software or related documentation that is delivered to the U.S. Government or anyone licensing it on behalf of the U.S. Government, thenthe following notice is applicable:
U.S. GOVERNMENT END USERS: Oracle programs, including any operating system, integrated software, any programs installed on the hardware,and/or documentation, delivered to U.S. Government end users are "commercial computer software" pursuant to the applicable Federal AcquisitionRegulation and agency-specific supplemental regulations. As such, use, duplication, disclosure, modification, and adaptation of the programs,including any operating system, integrated software, any programs installed on the hardware, and/or documentation, shall be subject to licenseterms and license restrictions applicable to the programs. No other rights are granted to the U.S. Government.
This software or hardware is developed for general use in a variety of information management applications. It is not developed or intended foruse in any inherently dangerous applications, including applications that may create a risk of personal injury. If you use this software or hardwarein dangerous applications, then you shall be responsible to take all appropriate fail-safe, backup, redundancy, and other measures to ensure itssafe use. Oracle Corporation and its affiliates disclaim any liability for any damages caused by use of this software or hardware in dangerousapplications.
Oracle and Java are registered trademarks of Oracle and/or its affiliates. Other names may be trademarks of their respective owners.
Intel and Intel Xeon are trademarks or registered trademarks of Intel Corporation. All SPARC trademarks are used under license and aretrademarks or registered trademarks of SPARC International, Inc. AMD, Opteron, the AMD logo, and the AMD Opteron logo are trademarks orregistered trademarks of Advanced Micro Devices. UNIX is a registered trademark of The Open Group.
This software or hardware and documentation may provide access to or information about content, products, and services from third parties.Oracle Corporation and its affiliates are not responsible for and expressly disclaim all warranties of any kind with respect to third-party content,products, and services unless otherwise set forth in an applicable agreement between you and Oracle. Oracle Corporation and its affiliates will notbe responsible for any loss, costs, or damages incurred due to your access to or use of third-party content, products, or services, except as setforth in an applicable agreement between you and Oracle.
Abstract
This guide provides information about the Dynamic Tracing (DTrace) facility for Oracle Linux engineered by Oracle.
Document generated on: 2019-08-16 (revision: 8162)

iii
Table of ContentsPreface .............................................................................................................................................. ix1 About DTrace ................................................................................................................................. 1
1.1 Getting Started With DTrace ................................................................................................. 11.2 Providers and Probes ........................................................................................................... 4
2 The D Programming Language ........................................................................................................ 72.1 D Program Structure ............................................................................................................ 8
2.1.1 Probe Clauses and Declarations ................................................................................ 82.1.2 Probe Descriptions .................................................................................................... 82.1.3 Clause Predicates .................................................................................................... 102.1.4 Probe Actions .......................................................................................................... 102.1.5 Order of Execution ................................................................................................... 102.1.6 Use of the C Preprocessor ....................................................................................... 10
2.2 Compilation and Instrumentation ......................................................................................... 112.3 Variables and Arithmetic Expressions .................................................................................. 122.4 Predicate Examples ............................................................................................................ 142.5 Output Formatting Examples ............................................................................................... 172.6 Array Overview ................................................................................................................... 19
2.6.1 Associative Array Example ....................................................................................... 192.7 External Symbols and Types ............................................................................................... 212.8 Types, Operators, and Expressions ..................................................................................... 22
2.8.1 Identifier Names and Keywords ................................................................................ 222.8.2 Data Types and Sizes .............................................................................................. 222.8.3 Constants ................................................................................................................ 242.8.4 Arithmetic Operators ................................................................................................ 252.8.5 Relational Operators ................................................................................................ 252.8.6 Logical Operators .................................................................................................... 262.8.7 Bitwise Operators .................................................................................................... 272.8.8 Assignment Operators .............................................................................................. 272.8.9 Increment and Decrement Operators ........................................................................ 282.8.10 Conditional Expressions ......................................................................................... 282.8.11 Type Conversions .................................................................................................. 292.8.12 Operator Precedence ............................................................................................. 30
2.9 Variables ............................................................................................................................ 312.9.1 Scalar Variables ...................................................................................................... 322.9.2 Associative Arrays ................................................................................................... 332.9.3 Thread-Local Variables ............................................................................................ 342.9.4 Clause-Local Variables ............................................................................................. 362.9.5 Built-In Variables ...................................................................................................... 382.9.6 External Variables .................................................................................................... 40
2.10 Pointers and Scalar Arrays ............................................................................................... 402.10.1 Pointers and Addresses ......................................................................................... 402.10.2 Pointer Safety ........................................................................................................ 412.10.3 Array Declarations and Storage .............................................................................. 422.10.4 Pointer and Array Relationship ............................................................................... 422.10.5 Pointer Arithmetic ................................................................................................... 432.10.6 Generic Pointers .................................................................................................... 442.10.7 Multi-Dimensional Arrays ........................................................................................ 442.10.8 Pointers to DTrace Objects .................................................................................... 442.10.9 Pointers and Address Spaces ................................................................................. 45
2.11 DTrace Support for Strings ............................................................................................... 452.11.1 String Representation ............................................................................................. 45
Oracle® Linux
iv
2.11.2 String Constants .................................................................................................... 462.11.3 String Assignment .................................................................................................. 462.11.4 String Conversion .................................................................................................. 472.11.5 String Comparison ................................................................................................. 47
2.12 Structs and Unions ........................................................................................................... 482.12.1 Structs ................................................................................................................... 482.12.2 Pointers to Structs ................................................................................................. 492.12.3 Unions ................................................................................................................... 502.12.4 Member Sizes and Offsets ..................................................................................... 512.12.5 Bit-Fields ............................................................................................................... 51
2.13 Type and Constant Definitions ........................................................................................... 522.13.1 typedefs ................................................................................................................. 522.13.2 Enumerations ......................................................................................................... 522.13.3 Inlines .................................................................................................................... 532.13.4 Type Namespaces ................................................................................................. 54
3 Aggregations ................................................................................................................................. 573.1 Aggregation Concepts ......................................................................................................... 573.2 Basic Aggregation Statement .............................................................................................. 583.3 Aggregation Examples ........................................................................................................ 59
3.3.1 Basic Aggregation .................................................................................................... 593.3.2 Using Keys .............................................................................................................. 593.3.3 Using the avg Function ............................................................................................ 613.3.4 Using the stddev Function ........................................................................................ 623.3.5 Using the quantize Function ..................................................................................... 623.3.6 Using the lquantize Function .................................................................................... 64
3.4 Printing Aggregations .......................................................................................................... 663.5 Data Normalization ............................................................................................................. 663.6 Clearing Aggregations ......................................................................................................... 693.7 Truncating Aggregations ..................................................................................................... 703.8 Minimizing Drops ................................................................................................................ 71
4 Actions and Subroutines ................................................................................................................ 734.1 Action Functions ................................................................................................................. 74
4.1.1 Default Action .......................................................................................................... 744.1.2 Data Recording Actions ........................................................................................... 744.1.3 Destructive Actions .................................................................................................. 794.1.4 Special Actions ........................................................................................................ 82
4.2 Subroutine Functions .......................................................................................................... 824.2.1 alloca ...................................................................................................................... 834.2.2 basename ............................................................................................................... 834.2.3 bcopy ...................................................................................................................... 834.2.4 cleanpath ................................................................................................................. 834.2.5 copyin ..................................................................................................................... 834.2.6 copyinstr .................................................................................................................. 834.2.7 copyinto ................................................................................................................... 844.2.8 d_path ..................................................................................................................... 844.2.9 dirname ................................................................................................................... 844.2.10 getmajor ................................................................................................................ 844.2.11 getminor ................................................................................................................ 844.2.12 htonl ...................................................................................................................... 844.2.13 htonll ..................................................................................................................... 854.2.14 htons ..................................................................................................................... 854.2.15 index ..................................................................................................................... 854.2.16 inet_ntoa ............................................................................................................... 854.2.17 inet_ntoa6 .............................................................................................................. 85

Oracle® Linux
v
4.2.18 inet_ntop ............................................................................................................... 854.2.19 lltostr ..................................................................................................................... 854.2.20 mutex_owned ........................................................................................................ 864.2.21 mutex_owner ......................................................................................................... 864.2.22 mutex_type_adaptive .............................................................................................. 864.2.23 mutex_type_spin .................................................................................................... 864.2.24 ntohl ...................................................................................................................... 864.2.25 ntohll ..................................................................................................................... 864.2.26 ntohs ..................................................................................................................... 864.2.27 progenyof .............................................................................................................. 864.2.28 rand ....................................................................................................................... 864.2.29 rindex .................................................................................................................... 874.2.30 rw_iswriter ............................................................................................................. 874.2.31 rw_read_held ......................................................................................................... 874.2.32 rw_write_held ......................................................................................................... 874.2.33 speculation ............................................................................................................ 874.2.34 strchr ..................................................................................................................... 874.2.35 strjoin .................................................................................................................... 874.2.36 strlen ..................................................................................................................... 884.2.37 strrchr .................................................................................................................... 884.2.38 strstr ...................................................................................................................... 884.2.39 strtok ..................................................................................................................... 884.2.40 substr .................................................................................................................... 88
5 Buffers and Buffering ..................................................................................................................... 895.1 Principal Buffers ................................................................................................................. 895.2 Principal Buffer Policies ...................................................................................................... 89
5.2.1 switch Policy ............................................................................................................ 895.2.2 fill Policy .................................................................................................................. 905.2.3 fill Policy and END Probes ....................................................................................... 905.2.4 ring Policy ............................................................................................................... 90
5.3 Other Buffers ...................................................................................................................... 915.4 Buffer Sizes ....................................................................................................................... 915.5 Buffer Resizing Policy ......................................................................................................... 92
6 Output Formatting ......................................................................................................................... 936.1 printf Action ........................................................................................................................ 93
6.1.1 Conversion Specifications ........................................................................................ 946.1.2 Flag Specifiers ......................................................................................................... 946.1.3 Width and Precision Specifiers ................................................................................. 956.1.4 Size Prefixes ........................................................................................................... 956.1.5 Conversion Formats ................................................................................................. 96
6.2 printa Action ....................................................................................................................... 986.3 trace Default Format ........................................................................................................... 99
7 Speculative Tracing ..................................................................................................................... 1017.1 About Speculative Tracing ................................................................................................. 1017.2 Speculation Interfaces ....................................................................................................... 1017.3 Creating a Speculation ...................................................................................................... 1027.4 Using a Speculation .......................................................................................................... 1027.5 Committing a Speculation ................................................................................................. 1027.6 Discarding a Speculation ................................................................................................... 1037.7 Example of a Speculation ................................................................................................. 1037.8 Speculation Options and Tuning ........................................................................................ 104
8 dtrace Command Reference ........................................................................................................ 1058.1 dtrace Command Description ............................................................................................ 1058.2 dtrace Command Options ................................................................................................. 105

Oracle® Linux
vi
8.3 dtrace Command Operands .............................................................................................. 1098.4 dtrace Command Exit Status ............................................................................................. 109
9 Scripting ...................................................................................................................................... 1119.1 Interpreter Files ................................................................................................................ 1119.2 Macro Variables ................................................................................................................ 1129.3 Macro Arguments ............................................................................................................. 1139.4 Target Process ID ............................................................................................................ 114
10 Options and Tunables ................................................................................................................ 11710.1 Consumer Options .......................................................................................................... 11710.2 Modifying Options ........................................................................................................... 121
11 DTrace Providers ....................................................................................................................... 12311.1 dtrace Provider ............................................................................................................... 124
11.1.1 BEGIN Probe ....................................................................................................... 12411.1.2 END Probe .......................................................................................................... 12411.1.3 ERROR Probe ..................................................................................................... 12511.1.4 dtrace Stability ..................................................................................................... 126
11.2 profile Provider ............................................................................................................... 12611.2.1 profile-n Probes ................................................................................................... 12711.2.2 tick-n Probes ....................................................................................................... 12711.2.3 profile Probe Arguments ....................................................................................... 12711.2.4 profile Probe Creation .......................................................................................... 12811.2.5 prof Stability ......................................................................................................... 128
11.3 fbt Provider ..................................................................................................................... 12811.3.1 fbt Probes ............................................................................................................ 12911.3.2 fbt Probe Arguments ............................................................................................ 12911.3.3 fbt Examples ........................................................................................................ 12911.3.4 Module Loading and fbt ........................................................................................ 13011.3.5 fbt Stability ........................................................................................................... 130
11.4 syscall Provider .............................................................................................................. 13011.4.1 syscall Probes ...................................................................................................... 13011.4.2 syscall Probe Arguments ...................................................................................... 13311.4.3 syscall Stability .................................................................................................... 133
11.5 sdt provider .................................................................................................................... 13311.5.1 Creating sdt Probes ............................................................................................. 13311.5.2 sdt Stability .......................................................................................................... 134
11.6 pid Provider .................................................................................................................... 13511.6.1 Naming pid Probes .............................................................................................. 13511.6.2 pid Probe Arguments ........................................................................................... 13611.6.3 pid Stability .......................................................................................................... 136
11.7 proc Provider .................................................................................................................. 13611.7.1 proc Probes ......................................................................................................... 13711.7.2 proc Probe Arguments ......................................................................................... 13811.7.3 proc Examples ..................................................................................................... 14011.7.4 proc Stability ........................................................................................................ 143
11.8 sched Provider ................................................................................................................ 14311.8.1 sched Probes ....................................................................................................... 14311.8.2 sched Probe Arguments ....................................................................................... 14411.8.3 sched Examples ................................................................................................... 14511.8.4 sched Stability ...................................................................................................... 156
11.9 io Provider ...................................................................................................................... 15711.9.1 io Probes ............................................................................................................. 15711.9.2 io Probe Arguments ............................................................................................. 15711.9.3 io Examples ......................................................................................................... 16011.9.4 io Stability ............................................................................................................ 163

Oracle® Linux
vii
11.10 fasttrap Provider ............................................................................................................ 16311.10.1 fasttrap Probes ................................................................................................... 16311.10.2 fasttrap Stability ................................................................................................. 163
12 User Process Tracing ................................................................................................................ 16512.1 copyin and copyinstr Subroutines .................................................................................... 165
12.1.1 Avoiding Errors .................................................................................................... 16612.2 Eliminating dtrace Interference ........................................................................................ 16612.3 Using the syscall Provider ............................................................................................... 16712.4 ustack Action .................................................................................................................. 16812.5 uregs[] Array ................................................................................................................... 16912.6 Using the pid Provider .................................................................................................... 170
12.6.1 User Function Boundary Tracing ........................................................................... 17012.6.2 Tracing Arbitrary Instructions ................................................................................ 172
13 Statically Defined Tracing of User Applications ............................................................................ 17513.1 Choosing the Probe Points .............................................................................................. 17513.2 Adding Probes to an Application ...................................................................................... 175
13.2.1 Defining Providers and Probes ............................................................................. 17613.2.2 Adding Probes to Application Code ....................................................................... 17613.2.3 Testing if a Probe Is Enabled ............................................................................... 17713.2.4 Building Applications With Probes ......................................................................... 17713.2.5 Using Statically Defined Probes ............................................................................ 178
14 Statically Defined Tracing of Kernel Modules .............................................................................. 18314.1 Inserting Static Probe Points ........................................................................................... 18314.2 Building Modules With Static Probes ............................................................................... 18614.3 Using DTrace to Test Modules With Static Probes ............................................................ 188
15 Performance Considerations ...................................................................................................... 19315.1 Limit Enabled Probes ...................................................................................................... 19315.2 Using Aggregations ......................................................................................................... 19315.3 Using Cacheable Predicates ............................................................................................ 194
16 DTrace Stability Features ........................................................................................................... 19716.1 Stability Levels ................................................................................................................ 19716.2 Dependency Classes ...................................................................................................... 19816.3 Interface Attributes .......................................................................................................... 19916.4 Stability Computations and Reports ................................................................................. 20016.5 Stability Enforcement ...................................................................................................... 201
17 Translators ................................................................................................................................ 20317.1 Translator Declarations ................................................................................................... 20317.2 xlate D Operator ............................................................................................................. 20417.3 Process Model Translators .............................................................................................. 20517.4 Stable Translations ......................................................................................................... 205
18 DTrace Versioning ..................................................................................................................... 20718.1 Versions and Releases ................................................................................................... 20718.2 Versioning Options .......................................................................................................... 20818.3 Provider Versioning ......................................................................................................... 209

viii

ix
PrefaceThe Oracle® Linux: DTrace Guide describes how to use DTrace. The guide also describes some DTraceproviders in detail. Most of the information in this document is generic and applies to all releases of OracleLinux 6 and Oracle Linux 7, with support for the Unbreakable Enterprise Kernel Release 4 (UEK R4) andUnbreakable Enterprise Kernel Release 5 (UEK R5) kernels. Note that UEK R5 is not supported on OracleLinux 6.
Note
This release of DTrace supports systems that use the x86_64 processorarchitecture, but not systems that use 32-bit x86 processors.
DTrace support has also been extended to the 64-bit Arm architecture in thisrelease. However, note that some providers might not be supported on thisarchitecture.
AudienceThis document is intended for administrators and developers who want a reference document thatdescribes DTrace and the D programming language. The guide also includes tools that help youunderstand how your system works, how to track down performance problems, and how to locate thecauses of aberrant behavior.
Basic familiarity with a programming language such as C, or a scripting language such as awk or perl, willhelp you learn DTrace and the D programming language faster. However, you do not need to be an expertin any of these areas.
Document OrganizationThe document is organized as follows:
• Chapter 1, About DTrace describes DTrace and provides and overview of the feature.
• Chapter 2, The D Programming Language describes the D programming language.
• Chapter 3, Aggregations describes how to aggregate the data that is provided by the probes.
• Chapter 4, Actions and Subroutines describes the actions and subroutines that are supported byDTrace.
• Chapter 5, Buffers and Buffering describes data buffering and the management service that is providedby DTrace.
• Chapter 6, Output Formatting describes how to format the output of D programs.
• Chapter 7, Speculative Tracing describes the speculative tracing facility that is provided by DTrace.
• Chapter 8, dtrace Command Reference describes the options that are supported by the dtracecommand-line tools.
• Chapter 9, Scripting describes how to create interpreter files by using D programs. Interpreter files aresimilar to shell scripts that you can install as reusable interactive DTrace tools.
• Chapter 10, Options and Tunables describes the options and tuning parameters that are supported bythe dtrace command.

Related Books
x
• Chapter 11, DTrace Providers describes the providers that are supported by DTrace.
• Chapter 12, User Process Tracing describes how to use DTrace to understand the behavior of userprocesses.
• Chapter 13, Statically Defined Tracing of User Applications describes how to develop customized staticprobes for tracing user-space applications.
• Chapter 14, Statically Defined Tracing of Kernel Modules describes how to insert static probes in kernelmodules.
• Chapter 15, Performance Considerations describes performance considerations that you need tounderstand when using DTrace.
• Chapter 16, DTrace Stability Features describes the concepts that are related to stability in the context ofD programs.
• Chapter 17, Translators describes the translators that are supported in D programs.
• Chapter 18, DTrace Versioning, describes the concepts that are related to versioning in the context ofDTrace.
Related BooksThe following books are recommended and related to tasks that you might perform with DTrace:
• Kernighan, Brian W. and Ritchie, Dennis M. The C Programming Language. Prentice Hall, 1988. ISBN0–13–110370–9
• Bovet, Daniel P. and Cesati, Marco. Understanding the Linux Kernel, Third Edition. O'Reilly Media, 2005.ISBN 0-59-600565-2
• Love, Robert. Linux Kernel Development, Third Edition. Addison Wesley, 2010. ISBN 0-672-32946-8.
Related DocumentsThe documentation for this product is available at:
https://docs.oracle.com/en/operating-systems/linux.html.
ConventionsThe following text conventions are used in this document:
Convention Meaning
boldface Boldface type indicates graphical user interface elements associated with anaction, or terms defined in text or the glossary.
italic Italic type indicates book titles, emphasis, or placeholder variables for whichyou supply particular values.
monospace Monospace type indicates commands within a paragraph, URLs, code inexamples, text that appears on the screen, or text that you enter.
Documentation AccessibilityFor information about Oracle's commitment to accessibility, visit the Oracle Accessibility Program websiteat
Access to Oracle Support
xi
http://www.oracle.com/pls/topic/lookup?ctx=acc&id=docacc.
Access to Oracle Support
Oracle customers that have purchased support have access to electronic support through My OracleSupport. For information, visithttp://www.oracle.com/pls/topic/lookup?ctx=acc&id=info or visit http://www.oracle.com/pls/topic/lookup?ctx=acc&id=trs if you are hearing impaired.

xii

1
Chapter 1 About DTrace
Table of Contents1.1 Getting Started With DTrace ......................................................................................................... 11.2 Providers and Probes ................................................................................................................... 4
DTrace provides dynamic tracing, which is the ability to instrument a running operating system kernel.
DTrace enables you to associate actions, such as collecting or printing stack traces, function arguments,timestamps, and statistical aggregates, with probes, which can be runtime events or source-code locations.The D language is powerful, yet simple. DTrace is dynamic, has low overhead, and is safe to use onproduction systems. It enables you to examine the behavior of user programs and the operating system,to understand how your system works, to track down performance problems, and to locate the causes ofaberrant behavior.
DTrace is a kernel framework that dynamically traces data into buffers that are read by consumers. OnOracle Linux, you will probably only use one consumer, the dtrace command-line utility, which containsthe D language that grants you full access to the framework's power.
This guide is largely a reference manual. For information about how to use DTrace and step-by-stepexamples, see Oracle® Linux: DTrace Tutorial.
1.1 Getting Started With DTraceNote
Most uses of DTrace require root privileges.
Prior to installing the dtrace_utils package, ensure that you are subscribed to the ULN channel thatcorresponds to the UEK kernel that you are running. For example, if you are running Oracle Linux 7 withUEK R5, the dtrace_utils package is available in the ol7_UEKR5 channel. For more information aboutsubscribing to channels on ULN, see the Oracle Linux Unbreakable Linux Network Guide.
For information about updating your Oracle Linux release, see the documentation at https://docs.oracle.com/cd/E52668_01/.
For information about updating your UEK release, see the documentation at https://docs.oracle.com/cd/E93554_01/index.html.
Install the dtrace-utils package:
# yum install dtrace-utils
If you want to implement a libdtrace consumer:
# yum install dtrace-utils-devel
If you want to develop a DTrace provider:
# yum install dtrace-modules-provider-headers
To confirm that dtrace is properly installed on your system and that you have all of the requiredprivileges, use the dtrace -l command. Running this command should load any of the required kernelmodules and the output should indicate any available probes.

Getting Started With DTrace
2
Note
The dtrace-utils package installs dtrace in /usr/sbin/dtrace. Make sureyour path detects this path instead of the similarly named utility that is located in /usr/bin/dtrace, which is installed by the systemtap-sdt-devel package.
A provider is a set of probes with a particular kind of instrumentation.
Note
To use a provider's probes, the kernel module that supports that provider must beloaded. Typically, dtrace automatically handles this for you. Upon first use, it willload the dtrace module and all of the modules that are listed in /etc/dtrace-modules, which the system administrator can edit.
In some cases, the kernel module that supports the desired provider must beloaded manually, for example:
# more /etc/dtrace-modulessdtsystraceprofilefasttrap# modprobe sdt# modprobe systrace# modprobe profile# modprobe fasttrap
These required modules are different from the modules, if any, that areinstrumented by the provider's probes and are found in the dtrace -l output.For example, while the module that is required to support proc probes is sdt, themodule that these probes instrument is vmlinux, as shown in the following output:
# dtrace -l -P proc ID PROVIDER MODULE FUNCTION NAME 197 proc vmlinux _do_fork lwp-create 198 proc vmlinux _do_fork create 225 proc vmlinux do_exit lwp-exit 226 proc vmlinux do_exit exit 275 proc vmlinux do_sigtimedwait signal-clear...
You dynamically assign actions to be taken at probes, which can be runtime events or source-codelocations. Every probe in DTrace has two names: a unique integer ID, which is assigned as the probes areloaded, and a human-readable string name. You can start learning about DTrace by building some verysimple requests that use the probe named BEGIN. The BEGIN probe fires once each time you start a newtracing request.
Use the dtrace command with the -n option to enable a probe by specifying its name:
# dtrace -n BEGINdtrace: description 'BEGIN' matched 1 probeCPU ID FUNCTION:NAME 0 1 :BEGIN ^C#
The default output of the previous example displays the following information: the probes that werematched, column headers, and then one row each time a probe fires. The default per row is the CPUwhere the probe fired and information about which probe fired. DTrace remains paused, waiting for otherprobes to fire. To exit, press Ctrl-C.

Getting Started With DTrace
3
You can construct DTrace requests by using arbitrary numbers of probes and actions. For example,create a simple request using two probes by adding the END probe to the command shown in the previousexample. The END probe fires once when tracing is completed.
Type the following command, and then press Ctrl-C in your shell again, after you see the line of outputfor the BEGIN probe:
# dtrace -n BEGIN -n END dtrace: description 'BEGIN' matched 1 probedtrace: description 'END' matched 1 probeCPU ID FUNCTION:NAME 0 1 :BEGIN ^C 1 2 :END
Pressing Ctrl-C to exit dtrace triggers the END probe. The dtrace command reports this probe firingbefore exiting.
In addition to constructing DTrace experiments on the command line, you can also write DTraceexperiments in text files by using the D programming language.
In a text editor, create a new file named hello.d and type your first D program:
BEGIN{ trace("hello, world"); exit(0);}
After you save the program, you can run it by using the dtrace -s command, as shown in the followingexample:
# dtrace -s hello.ddtrace: script 'hello.d' matched 1 probeCPU ID FUNCTION:NAME 0 1 :BEGIN hello, world #
The dtrace command printed the same output as the previous example, followed by the text, ”hello,world”. However, unlike the previous example, you did not have to wait and then press Ctrl-C. Thesechanges were the result of the actions that you specified for the BEGIN probe in hello.d.
To understand what happened, let us explore the structure of your D program in more detail.
• Each D program consists of a series of clauses, and each clause describes one or more probes toenable, as well as an optional set of actions to perform when the probes fires.
• The actions are listed as a series of statements that are enclosed in braces ({}) that follow the probename. Each statement ends with a semicolon (;).
• The first statement uses the trace() function to indicate that DTrace should record the specifiedargument, the string, ”hello, world”, when the BEGIN probe fires and then print it out.
• The second statement uses the exit() function to indicate that DTrace should cease tracing and exitthe dtrace command.
DTrace provides a set of useful functions such as trace() and exit() for you to call in your Dprograms.
To call a function, you specify its name, followed by a parenthesized list of arguments. See Chapter 4,Actions and Subroutines for the complete set of D functions.

Providers and Probes
4
If you are familiar with the C programming language, you probably have noticed that DTrace's Dprogramming language is very similar to C. Indeed, D is derived from a large subset of C, combinedwith a special set of functions and variables to help make tracing easy. These features are described inmore detail in subsequent chapters. If you have written a C program previously, you should be able toimmediately transfer most of your knowledge to building tracing programs in D. If you have never writtena C program, learning D is still relatively easy. By the end of this chapter, you will understand all of thesyntax. First, let us take a step back from language rules and learn more about how DTrace works. Then,later in this guide, you will learn how to build more interesting D programs.
1.2 Providers and ProbesIn the preceding examples, you learned how to use two simple probes named BEGIN and END. DTraceprobes come in sets that are called providers, each of which performs a particular kind of instrumentationto create probes. When you use DTrace, each provider is given an opportunity to publish the probes thatit can provide to the DTrace framework. You can then enable and bind your tracing actions to any of theprobes that have been published.
You can list all of the available probes on your system by typing the following command:
# dtrace -l ID PROVIDER MODULE FUNCTION NAME 1 dtrace BEGIN 2 dtrace END 3 dtrace ERROR 4 syscall vmlinux read entry 5 syscall vmlinux read return 6 syscall vmlinux write entry 7 syscall vmlinux write return ...
Note that it might take some time for all of the output to be displayed.
To count all of the probes, type the following command:
# dtrace -l | wc -l4097
Note that you might observe a different total on your system, as the number of probes can vary, dependingon the following: your operating platform, the software you have installed, and the provider modules youhave loaded. Note also that this output is not the complete list. As will be described later, some providersoffer the ability to create new probes on-the-fly, based on your tracing requests, which makes the actualnumber of DTrace probes virtually unlimited. Notice that each probe has the two names previouslymentioned: an integer ID and a human-readable name. The human-readable name is composed of fourparts that are displayed as separate columns in the dtrace output and are as follows:
provider A name of the DTrace provider that is publishing this probe.
module If this probe corresponds to a specific program location, the name ofthe kernel module, library, or user-space program in which the probe islocated.
function If this probe corresponds to a specific program location, the name of theprogram function in which the probe is located.
name A name that provides some idea of the probe's semantic meaning, suchas BEGIN or END.
When writing the full human-readable name of a probe, write all four parts of the name separated by colonslike this:

Providers and Probes
5
provider:module:function:name
Notice that some of the probes in the list do not have a module and function, such as the BEGIN and ENDprobes that were used previously. Some probes leave these two fields blank because these probes do notcorrespond to any specific instrumented program function or location. Instead, these probes refer to a moreabstract concept, such as the idea of the end of your tracing request.
By convention, if you do not specify all of the fields of a probe name, DTrace matches your request toall of the probes with matching values in the parts of the name that you do specify. In other words, whenyou used the probe name BEGIN in the previous exercise, you were actually directing DTrace to matchany probe with the name field BEGIN, regardless of the value of the provider, module, and function fields.Because there is only one probe matching that description, the result is the same. You now know that thetrue name of the BEGIN probe is dtrace:::BEGIN, which indicates that this probe is provided by theDTrace framework itself and is not specific to any function. Therefore, the hello.d program could bewritten as follows and would produce the same result:
dtrace:::BEGIN{ trace("hello, world"); exit(0);}

6

7
Chapter 2 The D Programming Language
Table of Contents2.1 D Program Structure .................................................................................................................... 8
2.1.1 Probe Clauses and Declarations ........................................................................................ 82.1.2 Probe Descriptions ............................................................................................................ 82.1.3 Clause Predicates ............................................................................................................ 102.1.4 Probe Actions .................................................................................................................. 102.1.5 Order of Execution ........................................................................................................... 102.1.6 Use of the C Preprocessor ............................................................................................... 10
2.2 Compilation and Instrumentation ................................................................................................. 112.3 Variables and Arithmetic Expressions .......................................................................................... 122.4 Predicate Examples .................................................................................................................... 142.5 Output Formatting Examples ....................................................................................................... 172.6 Array Overview ........................................................................................................................... 19
2.6.1 Associative Array Example ............................................................................................... 192.7 External Symbols and Types ....................................................................................................... 212.8 Types, Operators, and Expressions ............................................................................................. 22
2.8.1 Identifier Names and Keywords ........................................................................................ 222.8.2 Data Types and Sizes ...................................................................................................... 222.8.3 Constants ........................................................................................................................ 242.8.4 Arithmetic Operators ........................................................................................................ 252.8.5 Relational Operators ........................................................................................................ 252.8.6 Logical Operators ............................................................................................................ 262.8.7 Bitwise Operators ............................................................................................................ 272.8.8 Assignment Operators ...................................................................................................... 272.8.9 Increment and Decrement Operators ................................................................................ 282.8.10 Conditional Expressions ................................................................................................. 282.8.11 Type Conversions .......................................................................................................... 292.8.12 Operator Precedence ..................................................................................................... 30
2.9 Variables .................................................................................................................................... 312.9.1 Scalar Variables .............................................................................................................. 322.9.2 Associative Arrays ........................................................................................................... 332.9.3 Thread-Local Variables .................................................................................................... 342.9.4 Clause-Local Variables ..................................................................................................... 362.9.5 Built-In Variables .............................................................................................................. 382.9.6 External Variables ............................................................................................................ 40
2.10 Pointers and Scalar Arrays ....................................................................................................... 402.10.1 Pointers and Addresses ................................................................................................. 402.10.2 Pointer Safety ................................................................................................................ 412.10.3 Array Declarations and Storage ...................................................................................... 422.10.4 Pointer and Array Relationship ....................................................................................... 422.10.5 Pointer Arithmetic ........................................................................................................... 432.10.6 Generic Pointers ............................................................................................................ 442.10.7 Multi-Dimensional Arrays ................................................................................................ 442.10.8 Pointers to DTrace Objects ............................................................................................ 442.10.9 Pointers and Address Spaces ......................................................................................... 45
2.11 DTrace Support for Strings ....................................................................................................... 452.11.1 String Representation ..................................................................................................... 452.11.2 String Constants ............................................................................................................ 462.11.3 String Assignment .......................................................................................................... 46

D Program Structure
8
2.11.4 String Conversion .......................................................................................................... 472.11.5 String Comparison ......................................................................................................... 47
2.12 Structs and Unions ................................................................................................................... 482.12.1 Structs ........................................................................................................................... 482.12.2 Pointers to Structs ......................................................................................................... 492.12.3 Unions ........................................................................................................................... 502.12.4 Member Sizes and Offsets ............................................................................................. 512.12.5 Bit-Fields ....................................................................................................................... 51
2.13 Type and Constant Definitions .................................................................................................. 522.13.1 typedefs ......................................................................................................................... 522.13.2 Enumerations ................................................................................................................. 522.13.3 Inlines ............................................................................................................................ 532.13.4 Type Namespaces ......................................................................................................... 54
The D systems programming language enables you to interface with operating system APIs and with thehardware. This chapter formally describes the overall structure of a D program and the various features forconstructing probe descriptions that match more than one probe. The chapter also discusses the use of theC preprocessor, cpp, with D programs.
2.1 D Program Structure
A D program, also known as a script, consists of a set of clauses that describe the probes to enableand the predicates and actions to bind to these probes. D programs can also contain declarations ofvariables and definitions of new types. See Section 2.9, “Variables” and Section 2.13, “Type and ConstantDefinitions” for more details.
2.1.1 Probe Clauses and Declarations
As shown in the examples in this guide thus far, a D program source file consists of one or more probeclauses that describe the instrumentation to be enabled by DTrace. Each probe clause uses the followinggeneral form:
probe descriptions / predicate / { action statements}
Note that the predicate and list of action statements may be omitted. Any directives that are foundoutside of probe clauses are referred to as declarations. Declarations may only be used outside of probeclauses. No declarations are permitted inside of the enclosing braces ({}). Also, declarations may not beinterspersed between the elements of the probe clause in previous example. You can use white space toseparate any D program elements and to indent action statements.
Declarations can be used to declare D variables and external C symbols or to define new types for usein D. For more details, see Section 2.9, “Variables” and Section 2.13, “Type and Constant Definitions”.Special D compiler directives, called pragmas, may also appear anywhere in a D program, includingoutside of probe clauses. D pragmas are specified on lines beginning with a # character. For example, Dpragmas are used to set DTrace runtime options. See Chapter 10, Options and Tunables for more details.
2.1.2 Probe Descriptions
Every program clause begins with a list of one or more probe descriptions, each taking the following usualform:

Probe Descriptions
9
provider:module:function:name
If one or more fields of the probe description are omitted, the specified fields are interpreted from right toleft by the D compiler. For example, the probe description foo:bar would match a probe with the functionfoo and name bar, regardless of the value of the probe's provider and module fields. Therefore, a probedescription is really more accurately viewed as a pattern that can be used to match one or more probesbased on their names.
You should write your D probe descriptions specifying all four field delimiters so that you can specify thedesired provider on the left-hand side. If you don't specify the provider, you might obtain unexpectedresults if multiple providers publish probes with the same name. Similarly, subsequent versions ofDTrace might include new providers with probes that unintentionally match your partially specified probedescriptions. You can specify a provider but match any of its probes by leaving any of the module, function,and name fields blank. For example, the description syscall::: can be used to match every probe thatis published by the DTrace syscall provider.
Probe descriptions also support a pattern-matching syntax similar to the shell globbing pattern matchingsyntax that is described in the sh(1) manual page. Before matching a probe to a description, DTracescans each description field for the characters *, ?, and [. If one of these characters appears in a probedescription field and is not preceded by a \, the field is regarded as a pattern. The description patternmust match the entire corresponding field of a given probe. To successfully match and enable a probe, thecomplete probe description must match on every field. A probe description field that is not a pattern mustexactly match the corresponding field of the probe. Note that a description field that is empty matches anyprobe.
The special characters in the following table are recognized in probe name patterns.
Table 2.1 Probe Name Pattern Matching Characters
Symbol Description
* Matches any string, including the null string.
? Matches any single character.
[...] Matches any one of the enclosed characters. A pair of characters separated by - matchesany character between the pair, inclusive. If the first character after the [ is !, anycharacter not enclosed in the set is matched.
\ Interpret the next character as itself, without any special meaning.
Pattern match characters can be used in any or all of the four fields of your probe descriptions. Youcan also use patterns to list matching probes by them on the command line by using the dtrace -lcommand. For example, the dtrace -l -f kmem_* command lists all of the DTrace probes in functionswith names that begin with the prefix kmem_.
If you want to specify the same predicate and actions for more than one probe description, or descriptionpattern, you can place the descriptions in a comma-separated list. For example, the following D programwould trace a timestamp each time probes associated with entry to system calls containing the strings“read” or “write” fire:
syscall::*read*:entry, syscall::*write*:entry{ trace(timestamp);}
A probe description can also specify a probe by using its integer probe ID, for example, the followingclause could be used to enable probe ID 12345, as reported by dtrace -l -i 12345:

Clause Predicates
10
12345{ trace(timestamp);}
Note
You should always write your D programs using human-readable probedescriptions. Integer probe IDs are not guaranteed to remain consistent as DTraceprovider kernel modules are loaded and unloaded or following a reboot.
2.1.3 Clause Predicates
Predicates are expressions that are enclosed in a pair of slashes (//) that are then evaluated at probefiring time to determine whether the associated actions should be executed. Predicates are the primaryconditional construct that are used for building more complex control flow in a D program. You can omitthe predicate section of the probe clause entirely for any probe. In which case, the actions are alwaysexecuted when the probe fires.
Predicate expressions can use any of the D operators and can refer to any D data objects such asvariables and constants. The predicate expression must evaluate to a value of integer or pointer type sothat it can be considered as true or false. As with all D expressions, a zero value is interpreted as false andany non-zero value is interpreted as true.
2.1.4 Probe Actions
Probe actions are described by a list of statements that are separated by semicolons (;) and enclosed inbraces ({}). An empty set of braces with no statements included, leads to the default actions, which are toprint the CPU and the probe.
2.1.5 Order of Execution
The actions for a probe are executed in program order, regardless of whether those actions are in thesame clause or in different clauses.
No other ordering constraints are imposed. It is not uncommon for the output from two distinct probesto appear interspersed or in an opposite order from which the probes fired. Also, output might appearmisordered if it came from different CPUs.
2.1.6 Use of the C Preprocessor
The C programming language that is used for defining Linux system interfaces includes a preprocessorthat performs a set of initial steps in C program compilation. The C preprocessor is commonly used todefine macro substitutions, where one token in a C program is replaced with another predefined set oftokens, or to include copies of system header files. You can use the C preprocessor in conjunction withyour D programs by specifying the dtrace command with the -c option. This option causes the dtracecommand to execute the cpp preprocessor on your program source file and then pass the results to the Dcompiler. The C preprocessor is described in more detail in The C Programming Language by Kernighanand Ritchie, details of which are referenced in Preface.
The D compiler automatically loads the set of C type descriptions that is associated with the operatingsystem implementation. However, you can use the preprocessor to include other type definitions suchas the types that are used in your own C programs. You can also use the preprocessor to perform othertasks such as creating macros that expand to chunks of D code and other program elements. If you use

Compilation and Instrumentation
11
the preprocessor with your D program, you may only include files that contain valid D declarations. The Dcompiler can correctly interpret C header files that include only external declarations of types and symbols.However, the D compiler cannot parse C header files that include additional program elements, such as Cfunction source code, which produces an appropriate error message.
2.2 Compilation and Instrumentation
When you write traditional programs, you often use a compiler to convert your program from source codeinto object code that you can execute. When you use the dtrace command you are invoking the compilerfor the D language that was used in a previous example to write the hello.d program. When yourprogram is compiled, it is sent into the operating system kernel for execution by DTrace. There, the probesnamed in your program are enabled and the corresponding provider performs whatever instrumentation isrequired in order to activate them.
All of the instrumentation in DTrace is completely dynamic: probes are enabled discretely only when youare using them. No instrumented code is present for inactive probes, so your system does not experienceany kind of performance degradation when you are not using DTrace. After your experiment is completeand the dtrace command exits, all of the probes that you used are automatically disabled and theirinstrumentation is removed, returning your system to its exact original state. No effective difference existsbetween a system where DTrace is not active and a system where the DTrace software is not installed,other than a few megabytes of disk space that is required for type information and for DTrace itself.
The instrumentation for each probe is performed dynamically on the live, running operating system or onuser processes that you select. The system is not quiesced or paused in any way and instrumentationcode is added only for the probes that you enable. As a result, the probe effect of using DTrace is limitedto exactly what you direct DTrace to do: no extraneous data is traced and no one, big “tracing switch” isturned on in the system. All of the DTrace instrumentation is designed to be as efficient as possible. Thesefeatures enable you to use DTrace in production to solve real problems in real time.
The DTrace framework also provides support for an arbitrary number of virtual clients. You can run asmany simultaneous DTrace experiments and commands as you like, limited only by your system's memorycapacity. The commands all operate independently using the same underlying instrumentation. Thissame capability also permits any number of distinct users on the system to take advantage of DTracesimultaneously: developers, administrators, and service personnel can all work together, or on distinctproblems, using DTrace on the same system without interfering with one another.
Unlike programs that are written in C and C++, and similar to programs that are written in the Javaprogramming language, DTrace D programs are compiled into a safe, intermediate form that is used forexecution when your probes fire. This intermediate form is validated for safety when your program is firstexamined by the DTrace kernel software. The DTrace execution environment also handles any runtimeerrors that might occur during your D program's execution, including dividing by zero, dereferencing invalidmemory, and so on, and reports them to you. As a result, you can never construct an unsafe programthat would cause DTrace to inadvertently damage the operating system kernel or one of the processesrunning on your system. These safety features enable you to use DTrace in a production environmentwithout being concerned about crashing or corrupting your system. If you make a programming mistake,DTrace reports the error to you and disables your instrumentation, enabling you to correct the mistake andtry again. The DTrace error reporting and debugging features are described later in this guide.
Figure 2.1, “Overview of the DTrace Architecture and Components” shows the different components of theDTrace architecture.

Variables and Arithmetic Expressions
12
Figure 2.1 Overview of the DTrace Architecture and Components
Now that you understand how DTrace works, let us return to the tour of the D programming language andstart writing some more interesting programs.
2.3 Variables and Arithmetic ExpressionsOur next example program makes use of the DTrace profile provider to implement a simple time-based counter. The profile provider is able to create new probes based on the descriptions found in yourD program. If you create a probe named profile:::tick-nsec for some integer n, the profile providercreates a probe that fires every n seconds. Type the following source code and save it in a file namedcounter.d:
/* * Count off and report the number of seconds elapsed */
dtrace:::BEGIN{ i = 0; }
profile:::tick-1sec{ i = i + 1; trace(i);}
dtrace:::END { trace(i);}
When executed, the program counts off the number of elapsed seconds until you press Ctrl-C, and thenprints the total at the end:
# dtrace -s counter.d

Variables and Arithmetic Expressions
13
dtrace: script 'counter.d' matched 3 probesCPU ID FUNCTION:NAME 1 638 :tick-1sec 1 1 638 :tick-1sec 2 1 638 :tick-1sec 3 1 638 :tick-1sec 4 1 638 :tick-1sec 5 1 638 :tick-1sec 6 1 638 :tick-1sec 7^C 1 638 :tick-1sec 8 0 2 :END 8
The first three lines of the program are a comment to explain what the program does. Similar to C, C++, and the Java programming language, the D compiler ignores any characters between the /* and */symbols. Comments can be used anywhere in a D program, including both inside and outside your probeclauses.
The BEGIN probe clause defines a new variable named i and assigns it the integer value zero using thestatement:
i = 0;
Unlike C, C++, and the Java programming language, D variables can be created by simply using them ina program statement; explicit variable declarations are not required. When a variable is used for the firsttime in a program, the type of the variable is set based on the type of its first assignment. Each variablehas only one type over the lifetime of the program, so subsequent references must conform to the sametype as the initial assignment. In counter.d, the variable i is first assigned the integer constant zero, soits type is set to int. D provides the same basic integer data types as C, including those in the followingtable.
Data Type Description
char Character or single byte integer
int Default integer
short Short integer
long Long integer
long long Extended long integer
The sizes of these types are dependent on the operating system kernel's data model, described inSection 2.8, “Types, Operators, and Expressions”. D also provides built-in friendly names for signed andunsigned integer types of various fixed sizes, as well as thousands of other types that are defined by theoperating system.
The central part of counter.d is the probe clause that increments the counter i:
profile:::tick-1sec{ i = i + 1; trace(i);}
This clause names the probe profile:::tick-1sec, which tells the profile provider to create a newprobe that fires once per second on an available processor. The clause contains two statements, the firstincrementing i, and the second tracing (printing) the new value of i. All the usual C arithmetic operatorsare available in D. For the complete list, see Section 2.8, “Types, Operators, and Expressions”. The trace function takes any D expression as its argument, so you could write counter.d more concisely asfollows:

Predicate Examples
14
profile:::tick-1sec{ trace(++i);}
If you want to explicitly control the type of the variable i, you can surround the desired type in parentheseswhen you assign it in order to cast the integer zero to a specific type. For example, if you wanted todetermine the maximum size of a char in D, you could change the BEGIN clause as follows:
dtrace:::BEGIN{ i = (char)0;}
After running counter.d for a while, you should see the traced value grow and then wrap around backto zero. If you grow impatient waiting for the value to wrap, try changing the profile probe name toprofile:::tick-100msec to make a counter that increments once every 100 milliseconds, or 10 timesper second.
2.4 Predicate Examples
For runtime safety, one major difference between D and other programming languages such as C, C++, and the Java programming language is the absence of control-flow constructs such as if-statementsand loops. D program clauses are written as single straight-line statement lists that trace an optional, fixedamount of data. D does provide the ability to conditionally trace data and modify control flow using logicalexpressions called predicates. A predicate expression is evaluated at probe firing time prior to executingany of the statements associated with the corresponding clause. If the predicate evaluates to true,represented by any non-zero value, the statement list is executed. If the predicate is false, represented bya zero value, none of the statements are executed and the probe firing is ignored.
Type the following source code for the next example and save it in a file named countdown.d:
dtrace:::BEGIN { i = 10;}
profile:::tick-1sec/i > 0/{ trace(i--);}
profile:::tick-1sec/i == 0/{ trace("blastoff!"); exit(0);}
This D program implements a 10-second countdown timer using predicates. When executed,countdown.d counts down from 10 and then prints a message and exits:
# dtrace -s countdown.ddtrace: script 'countdown.d' matched 3 probesCPU ID FUNCTION:NAME 0 638 :tick-1sec 10 0 638 :tick-1sec 9 0 638 :tick-1sec 8 0 638 :tick-1sec 7 0 638 :tick-1sec 6

Predicate Examples
15
0 638 :tick-1sec 5 0 638 :tick-1sec 4 0 638 :tick-1sec 3 0 638 :tick-1sec 2 0 638 :tick-1sec 1 0 638 :tick-1sec blastoff! #
This example uses the BEGIN probe to initialize an integer i to 10 to begin the countdown. Next, asin the previous example, the program uses the tick-1sec probe to implement a timer that fires onceper second. Notice that in countdown.d, the tick-1sec probe description is used in two differentclauses, each with a different predicate and action list. The predicate is a logical expression surrounded byenclosing slashes // that appears after the probe name and before the braces {} that surround the clausestatement list.
The first predicate tests whether i is greater than zero, indicating that the timer is still running:
profile:::tick-1sec/i > 0/{ trace(i--);}
The relational operator > means greater than and returns the integer value zero for false and one fortrue. All of the C relational operators are supported in D. For the complete list, see Section 2.8, “Types,Operators, and Expressions”. If i is not yet zero, the script traces i and then decrements it by one usingthe -- operator.
The second predicate uses the == operator to return true when i is exactly equal to zero, indicating thatthe countdown is complete:
profile:::tick-1sec/i == 0/{ trace("blastoff!"); exit(0);}
Similar to the first example, hello.d, countdown.d uses a sequence of characters enclosed in doublequotes, called a string constant, to print a final message when the countdown is complete. The exitfunction is then used to exit dtrace and return to the shell prompt.
If you look back at the structure of countdown.d, you will see that by creating two clauses with the sameprobe description but different predicates and actions, we effectively created the logical flow:
i = 10once per second, if i is greater than zero trace(i--); if i is equal to zero trace("blastoff!"); exit(0);
When you wish to write complex programs using predicates, try to first visualize your algorithm in thismanner, and then transform each path of your conditional constructs into a separate clause and predicate.
Now let us combine predicates with a new provider, the syscall provider, and create our first real Dtracing program. The syscall provider permits you to enable probes on entry to or return from any OracleLinux system call. The next example uses DTrace to observe every time your shell performs a read() orwrite() system call. First, open two windows, one to use for DTrace and the other containing the shell

Predicate Examples
16
process that you are going to watch. In the second window, type the following command to obtain theprocess ID of this shell:
# echo $$2860
Now go back to your first window and type the following D program and save it in a file named rw.d. Asyou type in the program, replace the integer constant 2860 with the process ID of the shell that was printedin response to your echo command.
syscall::read:entry,syscall::write:entry/pid == 2860/{}
Notice that the body of rw.d's probe clause is left empty because the program is only intended to tracenotification of probe firings and not to trace any additional data. Once you have typed in rw.d, use dtraceto start your experiment and then go to your second shell window and type a few commands, pressingreturn after each command. As you type, you should see dtrace report probe firings in your first window,similar to the following example:
# dtrace -s rw.ddtrace: script 'rw.d' matched 2 probesCPU ID FUNCTION:NAME 1 7 write:entry 1 5 read:entry 0 7 write:entry 0 5 read:entry 0 7 write:entry 0 5 read:entry 0 7 write:entry 0 5 read:entry 0 7 write:entry 1 7 write:entry 1 7 write:entry 1 5 read:entry...^C
You are now watching your shell perform read() and write() system calls to read a character fromyour terminal window and echo back the result. This example includes many of the concepts described sofar and a few new ones as well. First, to instrument read() and write() in the same manner, the scriptuses a single probe clause with multiple probe descriptions by separating the descriptions with commaslike this:
syscall::read:entry,syscall::write:entry
For readability, each probe description appears on its own line. This arrangement is not strictly required,but it makes for a more readable script. Next the script defines a predicate that matches only those systemcalls that are executed by your shell process:
/pid == 2860/
The predicate uses the predefined DTrace variable pid, which always evaluates to the process IDassociated with the thread that fired the corresponding probe. DTrace provides many built-in variabledefinitions for useful things like the process ID. The following table lists a few DTrace variables you canuse to write your first D programs.
Variable Name Data Type Meaning
errno int Current errno value for system calls

Output Formatting Examples
17
Variable Name Data Type Meaning
execname string Name of the current process's executable file
pid pid_t Process ID of the current process
tid id_t Thread ID of the current thread
probeprov string Current probe description's provider field
probemod string Current probe description's module field
probefunc string Current probe description's function field
probename string Current probe description's name field
Now that you've written a real instrumentation program, try experimenting with it on different processesrunning on your system by changing the process ID and the system call probes that are instrumented.Then, you can make one more simple change and turn rw.d into a very simple version of a system calltracing tool like strace. An empty probe description field acts as a wildcard, matching any probe, sochange your program to the following new source code to trace any system call executed by your shell:
syscall:::entry/pid == 2860/{}
Try typing a few commands in the shell such as cd, ls, and date and see what your DTrace programreports.
2.5 Output Formatting Examples
System call tracing is a powerful way to observe the behavior of many user processes. The followingexample improves upon the earlier rw.d program by formatting its output so you can more easilyunderstand the output. Type the following program and save it in a file called stracerw.d:
syscall::read:entry,syscall::write:entry/pid == $1/{ printf("%s(%d, 0x%x, %4d)", probefunc, arg0, arg1, arg2);}
syscall::read:return,syscall::write:return/pid == $1/{ printf("\tt = %d\n", arg1);}
In this example, the constant 2860 is replaced with the label $1 in each predicate. This label enablesyou to specify the process of interest as an argument to the script: $1 is replaced by the value of the firstargument when the script is compiled. To execute stracerw.d, use the dtrace options -q and -s,followed by the process ID of your shell as the final argument. The -q option indicates that dtrace shouldbe quiet and suppress the header line and the CPU and ID columns shown in the preceding examples.As a result, you only see the output for the data that you explicitly trace. Type the following command,replacing 2860 with the process ID of a shell process, and then press return a few times in the specifiedshell:
# dtrace -q -s stracerw.d 2860 t = 1write(2, 0x7fa621b9b000, 1) t = 1write(1, 0x7fa621b9c000, 22) t = 22
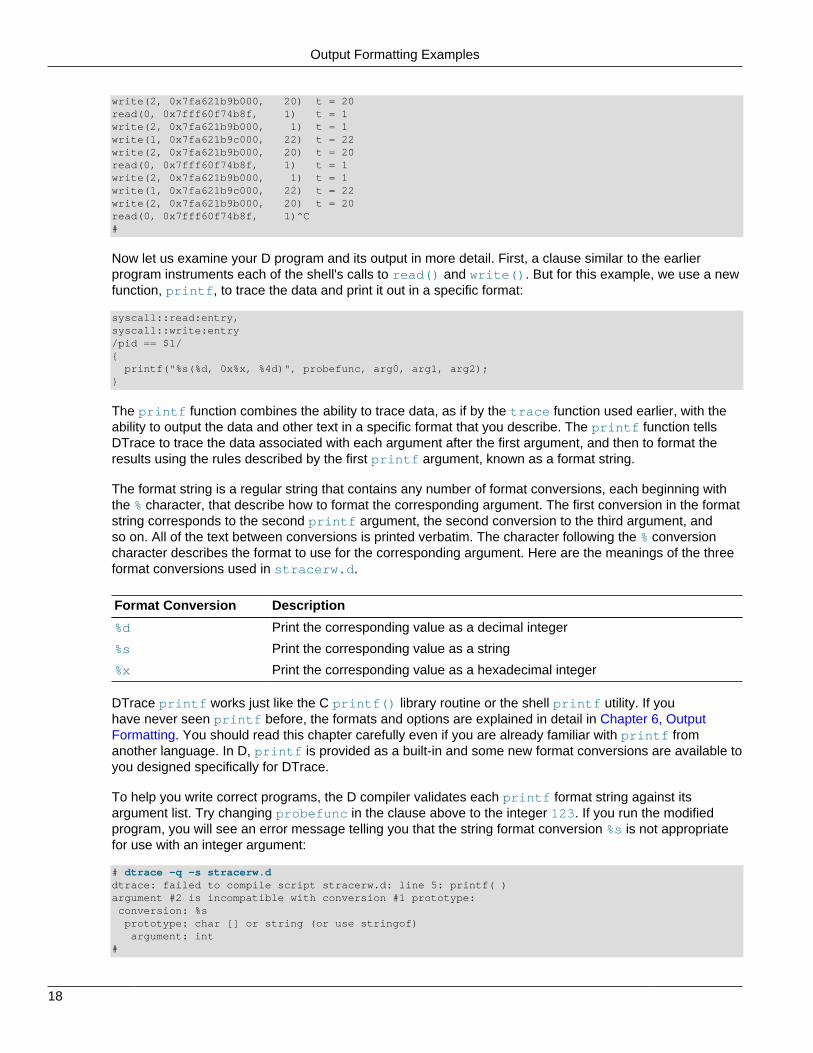
Output Formatting Examples
18
write(2, 0x7fa621b9b000, 20) t = 20read(0, 0x7fff60f74b8f, 1) t = 1write(2, 0x7fa621b9b000, 1) t = 1write(1, 0x7fa621b9c000, 22) t = 22write(2, 0x7fa621b9b000, 20) t = 20read(0, 0x7fff60f74b8f, 1) t = 1write(2, 0x7fa621b9b000, 1) t = 1write(1, 0x7fa621b9c000, 22) t = 22write(2, 0x7fa621b9b000, 20) t = 20read(0, 0x7fff60f74b8f, 1)^C#
Now let us examine your D program and its output in more detail. First, a clause similar to the earlierprogram instruments each of the shell's calls to read() and write(). But for this example, we use a newfunction, printf, to trace the data and print it out in a specific format:
syscall::read:entry,syscall::write:entry/pid == $1/{ printf("%s(%d, 0x%x, %4d)", probefunc, arg0, arg1, arg2);}
The printf function combines the ability to trace data, as if by the trace function used earlier, with theability to output the data and other text in a specific format that you describe. The printf function tellsDTrace to trace the data associated with each argument after the first argument, and then to format theresults using the rules described by the first printf argument, known as a format string.
The format string is a regular string that contains any number of format conversions, each beginning withthe % character, that describe how to format the corresponding argument. The first conversion in the formatstring corresponds to the second printf argument, the second conversion to the third argument, andso on. All of the text between conversions is printed verbatim. The character following the % conversioncharacter describes the format to use for the corresponding argument. Here are the meanings of the threeformat conversions used in stracerw.d.
Format Conversion Description
%d Print the corresponding value as a decimal integer
%s Print the corresponding value as a string
%x Print the corresponding value as a hexadecimal integer
DTrace printf works just like the C printf() library routine or the shell printf utility. If youhave never seen printf before, the formats and options are explained in detail in Chapter 6, OutputFormatting. You should read this chapter carefully even if you are already familiar with printf fromanother language. In D, printf is provided as a built-in and some new format conversions are available toyou designed specifically for DTrace.
To help you write correct programs, the D compiler validates each printf format string against itsargument list. Try changing probefunc in the clause above to the integer 123. If you run the modifiedprogram, you will see an error message telling you that the string format conversion %s is not appropriatefor use with an integer argument:
# dtrace -q -s stracerw.ddtrace: failed to compile script stracerw.d: line 5: printf( )argument #2 is incompatible with conversion #1 prototype: conversion: %s prototype: char [] or string (or use stringof) argument: int#

Array Overview
19
To print the name of the read or write system call and its arguments, use the printf statement:
printf("%s(%d, 0x%x, %4d)", probefunc, arg0, arg1, arg2);
to trace the name of the current probe function and the first three integer arguments to the system call,available in the DTrace variables arg0, arg1, and arg2. For more information about probe arguments,see Section 2.9.5, “Built-In Variables”. The first argument to read() and write() is a file descriptor,printed in decimal. The second argument is a buffer address, formatted as a hexadecimal value. The finalargument is the buffer size, formatted as a decimal value. The format specifier %4d is used for the thirdargument to indicate that the value should be printed using the %d format conversion with a minimum fieldwidth of 4 characters. If the integer is less than 4 characters wide, printf inserts extra blanks to align theoutput.
To print the result of the system call and complete each line of output, use the following clause:
syscall::read:return,syscall::write:return/pid == $1/{ printf("\tt = %d\n", arg1);}
Notice that the syscall provider also publishes a probe named return for each system call in additionto entry. The DTrace variable arg1 for the syscall return probes evaluates to the system call's returnvalue. The return value is formatted as a decimal integer. The character sequences beginning withbackwards slashes in the format string expand to tab (\t) and newline (\n) respectively. These escapesequences help you print or record characters that are difficult to type. D supports the same set of escapesequences as C, C++, and the Java programming language. For a complete list of escape sequences, seeSection 2.8.3, “Constants”.
2.6 Array Overview
D permits you to define variables that are integers, as well as other types to represent strings andcomposite types called structs and unions. If you are familiar with C programming, you will be happy toknow you can use any type in D that you can in C. If you are not a C expert, do not worry: the differentkinds of data types are all described in Section 2.8, “Types, Operators, and Expressions”.
D also supports arrays. Linearly indexed scalar arrays, familiar to C programmers, are discussed inSection 2.10.3, “Array Declarations and Storage”.
More powerful and commonly used are associative arrays, which are indexed with tuples. Each associativearray has a particular type signature. That is, its tuples all have the same number of elements, thoseelements of consistent type and in the same order, and its values are all of the same type. D associativearrays are described further in Section 2.9.2, “Associative Arrays”.
2.6.1 Associative Array Example
For example, the following D statements access an associative array, whose values must all be type intand whose tuples must all have signature string,int, setting an element to 456 and then incrementing itto 457:
a["hello", 123] = 456;a["hello", 123]++;
Now let us use an associative array in a D program. Type the following program and save it in a file namedrwtime.d:

Associative Array Example
20
syscall::read:entry,syscall::write:entry/pid == $1/{ ts[probefunc] = timestamp;}syscall::read:return,syscall::write:return/pid == $1 && ts[probefunc] != 0/{ printf("%d nsecs", timestamp - ts[probefunc]);}
As with stracerw.d, specify the ID of the shell process when you execute rwtime.d. If you type a fewshell commands, you will see the time elapsed during each system call. Type in the following commandand then press return a few times in your other shell:
# dtrace -s rwtime.d `/usr/bin/pgrep -n bash`dtrace: script 'rwtime.d' matched 4 probesCPU ID FUNCTION:NAME 0 8 write:return 51962 nsecs 0 8 write:return 45257 nsecs 0 8 write:return 40787 nsecs 1 6 read:return 925959305 nsecs 1 8 write:return 46934 nsecs 1 8 write:return 41626 nsecs 1 8 write:return 176839 nsecs...^C#
To trace the elapsed time for each system call, you must instrument both the entry to and return fromread() and write() and measure the time at each point. Then, on return from a given system call, youmust compute the difference between our first and second timestamp. You could use separate variablesfor each system call, but this would make the program annoying to extend to additional system calls.Instead, it is easier to use an associative array indexed by the probe function name. The following is thefirst probe clause:
syscall::read:entry,syscall::write:entry/pid == $1/{ ts[probefunc] = timestamp;}
This clause defines an array named ts and assigns the appropriate member the value of the DTracevariable timestamp. This variable returns the value of an always-incrementing nanosecond counter.When the entry timestamp is saved, the corresponding return probe samples timestamp again andreports the difference between the current time and the saved value:
syscall::read:return,syscall::write:return/pid == $1 && ts[probefunc] != 0/{ printf("%d nsecs", timestamp - ts[probefunc]);}
The predicate on the return probe requires that DTrace is tracing the appropriate process and that thecorresponding entry probe has already fired and assigned ts[probefunc] a non-zero value. This trickeliminates invalid output when DTrace first starts. If your shell is already waiting in a read() system callfor input when you execute dtrace, the read:return probe fires without a preceding read:entry forthis first read() and ts[probefunc] will evaluate to zero because it has not yet been assigned.
External Symbols and Types
21
2.7 External Symbols and Types
DTrace instrumentation executes inside the Oracle Linux operating system kernel. So, in addition toaccessing special DTrace variables and probe arguments, you can also access kernel data structures,symbols, and types. These capabilities enable advanced DTrace users, administrators, service personnel,and driver developers to examine low-level behavior of the operating system kernel and device drivers.The reading list at the start of this guide includes books that can help you learn more about Oracle Linuxoperating system internals.
D uses the back quote character (`) as a special scoping operator for accessing symbols that are definedin the operating system and not in your D program. For example, the Oracle Linux kernel contains a Cdeclaration of a system variable named max_pfn. This variable is declared in C in the kernel source codeas follows:
unsigned long max_pfn
To trace the value of this variable in a D program, you can write the following D statement:
trace(`max_pfn);
DTrace associates each kernel symbol with the type that is used for the symbol in the correspondingoperating system C code, which provides easy source-based access to the native operating system datastructures.
To use external operating system variables, you will need access to the corresponding operating systemsource code.
Kernel symbol names are kept in a separate namespace from D variable and function identifiers, so youdo not need to be concerned about these names conflicting with your D variables. When you prefix avariable with a back quote, the D compiler searches the known kernel symbols and uses the list of loadedmodules to find a matching variable definition. Because the Oracle Linux kernel supports dynamicallyloaded modules with separate symbol namespaces, the same variable name might be used more thanonce in the active operating system kernel. You can resolve these name conflicts by specifying the nameof the kernel module that contains the variable to be accessed prior to the back quote in the symbol name.For example, you would refer to the address of the _bar function that is provided by a kernel modulenamed foo as follows:
foo`_bar
You can apply any of the D operators to external variables, except for those that modify values, subject tothe usual rules for operand types. When required, the D compiler loads the variable names that correspondto active kernel modules, so you do not need to declare these variables. You may not apply any operator toan external variable that modifies its value, such as = or +=. For safety reasons, DTrace prevents you fromdamaging or corrupting the state of the software that you are observing.
When you access external variables from a D program, you are accessing the internal implementationdetails of another program, such as the operating system kernel or its device drivers. Theseimplementation details do not form a stable interface upon which you can rely. Any D programs you writethat depend on these details might cease to work when you next upgrade the corresponding piece ofsoftware. For this reason, external variables are typically used to debug performance or functionalityproblems by using DTrace. To learn more about the stability of your D programs, see Chapter 16, DTraceStability Features.
You have now completed a whirlwind tour of DTrace and have learned many of the basic DTrace buildingblocks that are necessary to build larger and more complex D programs. The remaining portions of

Types, Operators, and Expressions
22
this chapter describe the complete set of rules for D and demonstrate how DTrace can make complexperformance measurements and functional analysis of the system easy. Later, you will learn how to useDTrace to connect user application behavior to system behavior, which provides you with the capability toanalyze your entire software stack.
2.8 Types, Operators, and Expressions
D provides the ability to access and manipulate a variety of data objects: variables and data structures canbe created and modified, data objects that are defined in the operating system kernel and user processescan be accessed, and integer, floating-point, and string constants can be declared. D provides a supersetof the ANSI C operators that are used to manipulate objects and create complex expressions. This sectiondescribes the detailed set of rules for types, operators, and expressions.
2.8.1 Identifier Names and Keywords
D identifier names are composed of uppercase and lowercase letters, digits, and underscores, where thefirst character must be a letter or underscore. All identifier names beginning with an underscore (_) arereserved for use by the D system libraries. You should avoid using these names in your D programs. Byconvention, D programmers typically use mixed-case names for variables and all uppercase names forconstants.
D language keywords are special identifiers that are reserved for use in the programming language syntaxitself. These names are always specified in lowercase and must not be used for the names of D variables.The following table lists the keywords that are reserved for use by the D language.
Table 2.2 D Keywords
auto* do* if* register* string+ unsigned
break* double import*+ restrict* stringof+ void
case* else* inline return* struct volatile
char enum int self+ switch* while*
const extern long short this+ xlate+
continue* float offsetof+ signed translator+
counter*+ for* probe*+ sizeof typedef
default* goto* provider*+ static* union
D reserves for use as keywords a superset of the ANSI C keywords. The keywords reserved for future useby the D language are marked with “*”. The D compiler produces a syntax error if you attempt to use akeyword that is reserved for future use. The keywords that are defined by D but not defined by ANSI C aremarked with “+”. D provides the complete set of types and operators found in ANSI C. The major differencein D programming is the absence of control-flow constructs. Note that keywords associated with control-flow in ANSI C are reserved for future use in D.
2.8.2 Data Types and Sizes
D provides fundamental data types for integers and floating-point constants. Arithmetic may only beperformed on integers in D programs. Floating-point constants may be used to initialize data structures,but floating-point arithmetic is not permitted in D. In Oracle Linux, D provides a 64-bit data model for usein writing programs. However, a 32-bit data model is not supported. The data model used when executingyour program is the native data model that is associated with the active operating system kernel, whichmust also be 64-bit.

Data Types and Sizes
23
The names of the integer types and their sizes in the 64-bit data model are shown in the following table.Integers are always represented in twos-complement form in the native byte-encoding order of yoursystem.
Table 2.3 D Integer Data Types
Type Name 64-bit Size
char 1 byte
short 2 bytes
int 4 bytes
long 8 bytes
long long 8 bytes
Integer types can be prefixed with the signed or unsigned qualifier. If no sign qualifier is present, it isassumed that the type is signed. The D compiler also provides the type aliases that are listed in thefollowing table.
Table 2.4 D Integer Type Aliases
Type Name Description
int8_t 1-byte signed integer
int16_t 2-byte signed integer
int32_t 4-byte signed integer
int64_t 8-byte signed integer
intptr_t Signed integer of size equal to a pointer
uint8_t 1-byte unsigned integer
uint16_t 2-byte unsigned integer
uint32_t 4-byte unsigned integer
uint64_t 8-byte unsigned integer
uintptr_t Unsigned integer of size equal to a pointer
These type aliases are equivalent to using the name of the corresponding base type listed in the previoustable and are appropriately defined for each data model. For example, the uint8_t type name is an aliasfor the type unsigned char. See Section 2.13, “Type and Constant Definitions” for information about howto define your own type aliases for use in D programs.
Note
The predefined type aliases cannot be used in files that are included by thepreprocessor.
D provides floating-point types for compatibility with ANSI C declarations and types. Floating-pointoperators are not supported in D, but floating-point data objects can be traced and formatted with theprintf function. You can use the floating-point types that are listed in the following table.
Table 2.5 D Floating-Point Data Types
Type Name 64-bit Size
float 4 bytes
double 8 bytes
long double 16 bytes

Constants
24
D also provides the special type string to represent ASCII strings. Strings are discussed in more detail inSection 2.11, “DTrace Support for Strings”.
2.8.3 Constants
Integer constants can be written in decimal (12345), octal (012345), or hexadecimal (0x12345) format.Octal (base 8) constants must be prefixed with a leading zero. Hexadecimal (base 16) constants must beprefixed with either 0x or 0X. Integer constants are assigned the smallest type among int, long, andlong long that can represent their value. If the value is negative, the signed version of the type is used. Ifthe value is positive and too large to fit in the signed type representation, the unsigned type representationis used. You can apply one of the suffixes listed in the following table to any integer constant to explicitlyspecify its D type.
Suffix D type
u or U unsigned version of the type selected by the compiler
l or L long
ul or UL unsigned long
ll or LL long long
ull or ULL unsigned long long
Floating-point constants are always written in decimal format and must contain either a decimal point(12.345), an exponent (123e45), or both ( 123.34e-5). Floating-point constants are assigned the typedouble by default. You can apply one of the suffixes listed in the following table to any floating-pointconstant to explicitly specify its D type.
Suffix D type
f or F float
l or L long double
Character constants are written as a single character or escape sequence that is enclosed in a pair ofsingle quotes ('a'). Character constants are assigned the int type rather than char and are equivalentto an integer constant with a value that is determined by that character's value in the ASCII character set.See the ascii(7) manual page for a list of characters and their values. You can also use any of thespecial escape sequences that are listed in the following table in your character constants. D supports thesame escape sequences as those found in ANSI C.
Table 2.6 Character Escape Sequences
Escape Sequence Represents Escape Sequence Represents
\a alert \\ backslash
\b backspace \? question mark
\f form feed \' single quote
\n newline \" double quote
\r carriage return \0oo octal value 0oo
\t horizontal tab \xhh hexadecimal value 0xhh
\v vertical tab \0 null character
You can include more than one character specifier inside single quotes to create integers with individualbytes that are initialized according to the corresponding character specifiers. The bytes are read left-to-

Arithmetic Operators
25
right from your character constant and assigned to the resulting integer in the order corresponding to thenative endianness of your operating environment. Up to eight character specifiers can be included in asingle character constant.
Strings constants of any length can be composed by enclosing them in a pair of double quotes ("hello").A string constant may not contain a literal newline character. To create strings containing newlines, usethe \n escape sequence instead of a literal newline. String constants can contain any of the specialcharacter escape sequences that are shown for character constants previously. Similar to ANSI C, stringsare represented as arrays of characters terminated by a null character (\0) that is implicitly added to eachstring constant you declare. String constants are assigned the special D type string. The D compilerprovides a set of special features for comparing and tracing character arrays that are declared as strings.See Section 2.11, “DTrace Support for Strings” for more information.
2.8.4 Arithmetic Operators
D provides the binary arithmetic operators that are described in the following table for use in yourprograms. These operators all have the same meaning for integers that they do in ANSI C.
Table 2.7 Binary Arithmetic Operators
Operator Description
+ Integer addition
- Integer subtraction
* Integer multiplication
/ Integer division
% Integer modulus
Arithmetic in D may only be performed on integer operands or on pointers. See Section 2.10, “Pointers andScalar Arrays”. Arithmetic may not be performed on floating-point operands in D programs. The DTraceexecution environment does not take any action on integer overflow or underflow. You must specificallycheck for these conditions in situations where overflow and underflow can occur.
However, the DTrace execution environment does automatically check for and report division by zeroerrors resulting from improper use of the / and % operators. If a D program executes an invalid divisionoperation, DTrace automatically disables the affected instrumentation and reports the error. Errors that aredetected by DTrace have no effect on other DTrace users or on the operating system kernel. You thereforedo not need to be concerned about causing any damage if your D program inadvertently contains one ofthese errors.
In addition to these binary operators, the + and - operators can also be used as unary operators as well,and these operators have higher precedence than any of the binary arithmetic operators. The order ofprecedence and associativity properties for all of the D operators is presented in Table 2.12, “D OperatorPrecedence and Associativity”. You can control precedence by grouping expressions in parentheses (()).
2.8.5 Relational Operators
D provides the binary relational operators that are described in the following table for use in your programs.These operators all have the same meaning that they do in ANSI C.
Table 2.8 D Relational Operators
Operator Description
< Left-hand operand is less than right-operand

Logical Operators
26
Operator Description
<= Left-hand operand is less than or equal to right-hand operand
> Left-hand operand is greater than right-hand operand
>= Left-hand operand is greater than or equal to right-hand operand
== Left-hand operand is equal to right-hand operand
!= Left-hand operand is not equal to right-hand operand
Relational operators are most frequently used to write D predicates. Each operator evaluates to a value oftype int, which is equal to one if the condition is true, or zero if it is false.
Relational operators can be applied to pairs of integers, pointers, or strings. If pointers are compared, theresult is equivalent to an integer comparison of the two pointers interpreted as unsigned integers. If stringsare compared, the result is determined as if by performing a strcmp() on the two operands. The followingtable shows some example D string comparisons and their results.
D string comparison Result
"coffee" < "espresso" Returns 1 (true)
"coffee" == "coffee" Returns 1 (true)
"coffee"" >= "mocha" Returns 0 (false)
Relational operators can also be used to compare a data object associated with an enumeration type withany of the enumerator tags defined by the enumeration. Enumerations are a facility for creating namedinteger constants and are described in more detail in Section 2.13, “Type and Constant Definitions”.
2.8.6 Logical Operators
D provides the binary logical operators that are listed in the following table for use in your programs. Thefirst two operators are equivalent to the corresponding ANSI C operators.
Table 2.9 D Logical Operators
Operator Description
&& Logical AND: true if both operands are true
|| Logical OR: true if one or both operands are true
^^ Logical XOR: true if exactly one operand is true
Logical operators are most frequently used in writing D predicates. The logical AND operator performsthe following short-circuit evaluation: if the left-hand operand is false, the right-hand expression is notevaluated. The logical OR operator also performs the following short-circuit evaluation: if the left-handoperand is true, the right-hand expression is not evaluated. The logical XOR operator does not short-circuit.Both expression operands are always evaluated.
In addition to the binary logical operators, the unary ! operator can be used to perform a logical negation ofa single operand: it converts a zero operand into a one and a non-zero operand into a zero. By convention,D programmers use ! when working with integers that are meant to represent boolean values and == 0when working with non-boolean integers, although the expressions are equivalent.
The logical operators may be applied to operands of integer or pointer types. The logical operatorsinterpret pointer operands as unsigned integer values. As with all logical and relational operators in D,operands are true if they have a non-zero integer value and false if they have a zero integer value.

Bitwise Operators
27
2.8.7 Bitwise Operators
D provides the binary operators that are listed in the following table for manipulating individual bits inside ofinteger operands. These operators all have the same meaning as in ANSI C.
Table 2.10 D Bitwise Operators
Operator Description
& Bitwise AND
| Bitwise OR
^ Bitwise XOR
<< Shift the left-hand operand left by the number of bits specified by the right-handoperand
>> Shift the left-hand operand right by the number of bits specified by the right-hand operand
The binary & operator is used to clear bits from an integer operand. The binary | operator is used to setbits in an integer operand. The binary ^ operator returns one in each bit position, exactly where one of thecorresponding operand bits is set.
The shift operators are used to move bits left or right in a given integer operand. Shifting left fills empty bitpositions on the right-hand side of the result with zeroes. Shifting right using an unsigned integer operandfills empty bit positions on the left-hand side of the result with zeroes. Shifting right using a signed integeroperand fills empty bit positions on the left-hand side with the value of the sign bit, also known as anarithmetic shift operation.
Shifting an integer value by a negative number of bits or by a number of bits larger than the number of bitsin the left-hand operand itself produces an undefined result. The D compiler produces an error message ifthe compiler can detect this condition when you compile your D program.
In addition to the binary logical operators, the unary ~ operator may be used to perform a bitwise negationof a single operand: it converts each zero bit in the operand into a one bit, and each one bit in the operandinto a zero bit.
2.8.8 Assignment Operators
D provides the binary assignment operators that are listed in the folloiwng table for modifying D variables.You can only modify D variables and arrays. Kernel data objects and constants may not be modified usingthe D assignment operators. The assignment operators have the same meaning as they do in ANSI C.
Table 2.11 D Assignment Operators
Operator Description
= Set the left-hand operand equal to the right-hand expression value.
+= Increment the left-hand operand by the right-hand expression value
-= Decrement the left-hand operand by the right-hand expression value.
*= Multiply the left-hand operand by the right-hand expression value.
/= Divide the left-hand operand by the right-hand expression value.
%= Modulo the left-hand operand by the right-hand expression value.

Increment and Decrement Operators
28
Operator Description
|= Bitwise OR the left-hand operand with the right-hand expression value.
&= Bitwise AND the left-hand operand with the right-hand expression value.
^= Bitwise XOR the left-hand operand with the right-hand expression value.
<<= Shift the left-hand operand left by the number of bits specified by the right-handexpression value.
>>= Shift the left-hand operand right by the number of bits specified by the right-hand expression value.
Aside from the assignment operator =, the other assignment operators are provided as shorthand for usingthe = operator with one of the other operators that were described earlier. For example, the expressionx = x + 1 is equivalent to the expression x += 1, except that the expression x is evaluated one time.These assignment operators adhere to the same rules for operand types as the binary forms describedearlier.
The result of any assignment operator is an expression equal to the new value of the left-hand expression.You can use the assignment operators or any of the operators described thus far in combination to formexpressions of arbitrary complexity. You can use parentheses () to group terms in complex expressions.
2.8.9 Increment and Decrement Operators
D provides the special unary ++ and -- operators for incrementing and decrementing pointers andintegers. These operators have the same meaning as they do in ANSI C. These operators can only beapplied to variables and they may be applied either before or after the variable name. If the operatorappears before the variable name, the variable is first modified and then the resulting expression is equalto the new value of the variable. For example, the following two code fragments produce identical results:
x += 1; y = x;
y = ++x;
If the operator appears after the variable name, then the variable is modified after its current value isreturned for use in the expression. For example, the following two code fragments produce identicalresults:
y = x; x -= 1;
y = x--;
You can use the increment and decrement operators to create new variables without declaring them. Ifa variable declaration is omitted and the increment or decrement operator is applied to a variable, thevariable is implicitly declared to be of type int64_t.
The increment and decrement operators can be applied to integer or pointer variables. When applied tointeger variables, the operators increment or decrement the corresponding value by one. When appliedto pointer variables, the operators increment or decrement the pointer address by the size of the datatype that is referenced by the pointer. Pointers and pointer arithmetic in D are discussed in Section 2.10,“Pointers and Scalar Arrays”.
2.8.10 Conditional Expressions
Although D does not provide support for if-then-else constructs, it does provide support for simpleconditional expressions by using the ? and : operators. These operators enable a triplet of expressions tobe associated, where the first expression is used to conditionally evaluate one of the other two.

Type Conversions
29
For example, the following D statement could be used to set a variable x to one of two strings, dependingon the value of i:
x = i == 0 ? "zero" : "non-zero";
In the previous example, the expression i == 0 is first evaluated to determine whether it is true or false.If the expression is true, the second expression is evaluated and its value is returned. If the expression isfalse, the third expression is evaluated and its value is returned.
As with any D operator, you can use multiple ?: operators in a single expression to create more complexexpressions. For example, the following expression would take a char variable c containing one ofthe characters 0-9, a-f, or A-F, and return the value of this character when interpreted as a digit in ahexadecimal (base 16) integer:
hexval = (c >= '0' && c <= '9') ? c - '0' : (c >= 'a' && c <= 'f') ? c + 10 - 'a' : c + 10 - 'A';
To be evaluated for its truth value, the first expression that is used with ?: must be a pointer or integer.The second and third expressions can be of any compatible types. You may not construct a conditionalexpression where, for example, one path returns a string and another path returns an integer. The secondand third expressions also may not invoke a tracing function such as trace or printf. If you wantto conditionally trace data, use a predicate instead. See Section 2.4, “Predicate Examples” for moreinformation.
2.8.11 Type Conversions
When expressions are constructed by using operands of different but compatible types, type conversionsare performed to determine the type of the resulting expression. The D rules for type conversions are thesame as the arithmetic conversion rules for integers in ANSI C. These rules are sometimes referred to asthe usual arithmetic conversions.
A simple way to describe the conversion rules is as follows: each integer type is ranked in the order char,short, int, long, long long, with the corresponding unsigned types assigned a rank higher than itssigned equivalent, but below the next integer type. When you construct an expression using two integeroperands such as x + y and the operands are of different integer types, the operand type with the highestrank is used as the result type.
If a conversion is required, the operand with the lower rank is first promoted to the type of the higherrank. Promotion does not actually change the value of the operand: it simply extends the value to a largercontainer according to its sign. If an unsigned operand is promoted, the unused high-order bits of theresulting integer are filled with zeroes. If a signed operand is promoted, the unused high-order bits are filledby performing sign extension. If a signed type is converted to an unsigned type, the signed type is firstsign-extended and then assigned the new, unsigned type that is determined by the conversion.
Integers and other types can also be explicitly cast from one type to another. In D, pointers and integerscan be cast to any integer or pointer types, but not to other types. Rules for casting and promoting stringsand character arrays are discussed in Section 2.11, “DTrace Support for Strings”.
An integer or pointer cast is formed using an expression such as the following:
y = (int)x;
In this example, the destination type is enclosed in parentheses and used to prefix the source expression.Integers are cast to types of higher rank by performing promotion. Integers are cast to types of lower rankby zeroing the excess high-order bits of the integer.
Because D does not permit floating-point arithmetic, no floating-point operand conversion or casting ispermitted and no rules for implicit floating-point conversion are defined.

Operator Precedence
30
2.8.12 Operator Precedence
Table 2.12, “D Operator Precedence and Associativity” lists the D rules for operator precedence andassociativity. These rules are somewhat complex, but they are necessary to provide precise compatibilitywith the ANSI C operator precedence rules. The following entries in the following table are in order fromhighest precedence to lowest precedence.
Table 2.12 D Operator Precedence and Associativity
Operators Associativity
() [] -> . Left to right
! ~ ++ -- + - * & (type) sizeof stringof offsetof xlate Right to left
* / % Left to right
+ - Left to right
<< >> Left to right
< <= > >= Left to right
== != Left to right
& Left to right
^ Left to right
| Left to right
&& Left to right
^^ Left to right
|| Left to right
?: Right to left
= += -= *= /= %= &= ^= ?= <<= >>= Right to left
, Left to right
Several operators listed in the previous table that have not been discussed yet. These operators aredescribed in subsequent chapters. The following table lists several miscellaneous operators that areprovided by the D language.
Operators Description For More Information
sizeof Computes the size of an object. Section 2.12, “Structs and Unions”
offsetof Computes the offset of a type member. Section 2.12, “Structs and Unions”
stringof Converts the operand to a string. Section 2.11, “DTrace Support forStrings”
xlate Translates a data type. Chapter 17, Translators
unary & Computes the address of an object. Section 2.10, “Pointers and ScalarArrays”
unary * Dereferences a pointer to an object. Section 2.10, “Pointers and ScalarArrays”
-> and . Accesses a member of a structure or union type. Section 2.12, “Structs and Unions”
The comma (,) operator that is listed in the table is for compatibility with the ANSI C comma operator. Itcan be used to evaluate a set of expressions in left-to-right order and return the value of the right mostexpression. This operator is provided strictly for compatibility with C and should generally not be used.

Variables
31
The () entry listed in the table of operator precedence represents a function call. For examples of callsto functions, such as printf and trace, see Chapter 6, Output Formatting. A comma is also used in Dto list arguments to functions and to form lists of associative array keys. Note that this comma is not thesame as the comma operator and does not guarantee left-to-right evaluation. The D compiler provides noguarantee regarding the order of evaluation of arguments to a function or keys to an associative array.Note that you should be careful of using expressions with interacting side-effects, such as the pair ofexpressions i and i++, in these contexts.
The [] entry listed in the table of operator precedence represents an array or associative array reference.Examples of associative arrays are presented in Section 2.9.2, “Associative Arrays”. A special kind ofassociative array, called an aggregation, is described in Chapter 3, Aggregations. The [] operator canalso be used to index into fixed-size C arrays as well. See Section 2.10, “Pointers and Scalar Arrays”.
2.9 Variables
D provides two basic types of variables for use in your tracing programs: scalar variables and associativearrays. An aggregation is a special kind of array variable. See Chapter 3, Aggregations for moreinformation about aggregations.
To understand the scope of variables, consider the following figure.
Figure 2.2 Scope of Variables
In the figure, system execution is illustrated, showing elapsed time along the horizontal axis and threadnumber along the vertical axis. D probes fire at different times on different threads, and each time a probefires, the D script is run. Any D variable would have one of the scopes that are described in the followingtable.
Scope Syntax Initial Value Thread-safe? Description
global myname 0 No Any probe that fires on any threadaccesses the same instance of thevariable.
Thread-local self->myname 0 Yes Any probe that fires on a threadaccesses the thread-specificinstance of the variable.

Scalar Variables
32
Scope Syntax Initial Value Thread-safe? Description
Clause-local this->myname Not defined Yes Any probe that fires accesses aninstance of the variable specific tothat particular firing of the probe.
Note
Note the following additional information:
• Scalar variables and associative arrays have a global scope and are not multi-processor safe (MP-safe). Because the value of such variables can be changedby more than one processor, there is a chance that a variable can becomecorrupted if more than one probe modifies it.
• Aggregations are MP-safe even though they have a global scope becauseindependent copies are updated locally before a final aggregation produces theglobal result.
2.9.1 Scalar Variables
Scalar variables are used to represent individual, fixed-size data objects, such as integers and pointers.Scalar variables can also be used for fixed-size objects that are composed of one or more primitive orcomposite types. D provides the ability to create arrays of objects, as well as composite structures. DTracealso represents strings as fixed-size scalars by permitting them to grow to a predefined maximum length.Control over string length in your D program is discussed further in Section 2.11, “DTrace Support forStrings”.
Scalar variables are created automatically the first time you assign a value to a previously undefinedidentifier in your D program. For example, to create a scalar variable named x of type int, you cansimply assign it a value of type int in any probe clause, for example:
BEGIN{ x = 123;}
Scalar variables that are created in this manner are global variables: each one is defined once and isvisible in every clause of your D program. Any time that you reference the x identifier, you are referring to asingle storage location associated with this variable.
Unlike ANSI C, D does not require explicit variable declarations. If you do want to declare a global variableand assign its name and type explicitly before using it, you can place a declaration outside of the probeclauses in your program, as shown in the following example:
int x; /* declare an integer x for later use */BEGIN{ x = 123; ...}
Explicit variable declarations are not necessary in most D programs, but sometimes are useful whenyou want to carefully control your variable types or when you want to begin your program with a set ofdeclarations and comments documenting your program's variables and their meanings.
Unlike ANSI C declarations, D variable declarations may not assign initial values. You must use a BEGINprobe clause to assign any initial values. All global variable storage is filled with zeroes by DTrace beforeyou first reference the variable.

Associative Arrays
33
The D language definition places no limit on the size and number of D variables. Limits are defined by theDTrace implementation and by the memory that is available on your system. The D compiler enforces anyof the limitations that can be applied at the time you compile your program. See Chapter 10, Options andTunables for more about how to tune options related to program limits.
2.9.2 Associative Arrays
Associative arrays are used to represent collections of data elements that can be retrieved by specifyinga name, which is called a key. D associative array keys are formed by a list of scalar expression values,called a tuple. You can think of the array tuple as an imaginary parameter list to a function that is called toretrieve the corresponding array value when you reference the array. Each D associative array has a fixedkey signature consisting of a fixed number of tuple elements, where each element has a given, fixed type.You can define different key signatures for each array in your D program.
Associative arrays differ from normal, fixed-size arrays in that they have no predefined limit on the numberof elements: the elements can be indexed by any tuple, as opposed to just using integers as keys, and theelements are not stored in preallocated, consecutive storage locations. Associative arrays are useful insituations where you would use a hash table or other simple dictionary data structure in a C, C++, or Javalanguage program. Associative arrays provide the ability to create a dynamic history of events and statecaptured in your D program, which you can use to create more complex control flows.
To define an associative array, you write an assignment expression of the following form:
name [ key ] = expression ;
where name is any valid D identifier and key is a comma-separated list of one or more expressions.
For example, the following statement defines an associative array a with key signature [ int, string ]and stores the integer value 456 in a location named by the tuple [123, "hello"]:
a[123, "hello"] = 456;
The type of each object that is contained in the array is also fixed for all elements in a given array. Becauseit was first assigned by using the integer 456, every subsequent value that is stored in the array will alsobe of type int. You can use any of the assignment operators that are defined in Section 2.8, “Types,Operators, and Expressions” to modify associative array elements, subject to the operand rules definedfor each operator. The D compiler produces an appropriate error message if you attempt an incompatibleassignment. You can use any type with an associative array key or value that can be used with a scalarvariable.
You can reference an associative array by using any tuple that is compatible with the array key signature.The rules for tuple compatibility are similar to those for function calls and variable assignments. That is, thetuple must be of the same length and each type in the list of actual parameters and must be compatiblewith the corresponding type in the formal key signature. For example, for an associative array x that isdefined as follows:
x[123ull] = 0;
The key signature is of type unsigned long long and the values are of type int. This array can also bereferenced by using the expression x['a'] because the tuple consisting of the character constant 'a',of type int and length one, is compatible with the key signature unsigned long long, according to thearithmetic conversion rules. These rules are described in Section 2.8.11, “Type Conversions”.
If you need to explicitly declare a D associative array before using it, you can create a declaration of thearray name and key signature outside of the probe clauses in your program source code, for example:
int x[unsigned long long, char];

Thread-Local Variables
34
BEGIN{ x[123ull, 'a'] = 456;}
Storage is allocated only for array elements with a nonzero value.
Note
When an associative array is defined, references to any tuple of a compatiblekey signature are permitted, even if the tuple in question has not been previouslyassigned. Accessing an unassigned associative array element is defined to returna zero-filled object. A consequence of this definition is that underlying storage isnot allocated for an associative array element until a non-zero value is assigned tothat element. Conversely, assigning an associative array element to zero causesDTrace to deallocate the underlying storage.
This behavior is important because the dynamic variable space out of whichassociative array elements are allocated is finite; if it is exhausted when anallocation is attempted, the allocation fails and an error message indicating adynamic variable drop is generated. Always assign zero to associative arrayelements that are no longer in use. See Chapter 10, Options and Tunables forinformation about techniques that you can use to eliminate dynamic variable drops.
2.9.3 Thread-Local Variables
DTrace provides the ability to declare variable storage that is local to each operating system thread, asopposed to the global variables demonstrated earlier in this chapter. Thread-local variables are useful insituations where you want to enable a probe and mark every thread that fires the probe with some tag orother data. Creating a program to solve this problem is easy in D because thread-local variables share acommon name in your D code, but refer to separate data storage that is associated with each thread.
Thread-local variables are referenced by applying the -> operator to the special identifier self, forexample:
syscall::read:entry{ self->read = 1;}
This D fragment example enables the probe on the read() system call and associates a thread-localvariable named read with each thread that fires the probe. Similar to global variables, thread-localvariables are created automatically on their first assignment and assume the type that is used on the right-hand side of the first assignment statement, which is int in this example.
Each time the self->read variable is referenced in your D program, the data object that is referenced isthe one associated with the operating system thread that was executing when the corresponding DTraceprobe fired. You can think of a thread-local variable as an associative array that is implicitly indexed by atuple that describes the thread's identity in the system. A thread's identity is unique over the lifetime of thesystem: if the thread exits and the same operating system data structure is used to create a new thread,this thread does not reuse the same DTrace thread-local storage identity.
When you have defined a thread-local variable, you can reference it for any thread in the system, even ifthe variable in question has not been previously assigned for that particular thread. If a thread's copy ofthe thread-local variable has not yet been assigned, the data storage for the copy is defined to be filledwith zeroes. As with associative array elements, underlying storage is not allocated for a thread-local

Thread-Local Variables
35
variable until a non-zero value is assigned to it. Also, as with associative array elements, assigning zero toa thread-local variable causes DTrace to deallocate the underlying storage. Always assign zero to thread-local variables that are no longer in use. For other techniques to fine-tune the dynamic variable space fromwhich thread-local variables are allocated, see Chapter 10, Options and Tunables.
Thread-local variables of any type can be defined in your D program, including associative arrays. Thefollowing are some example thread-local variable definitions:
self->x = 123; /* integer value */
self->s = "hello"; /* string value */
self->a[123, 'a'] = 456; /* associative array */
Like any D variable, you do not need to explicitly declare thread-local variables prior to using them. If youwant to create a declaration anyway, you can place one outside of your program clauses by pre-pendingthe keyword self, for example:
self int x; /* declare int x as a thread-local variable */ syscall::read:entry{ self->x = 123;}
Thread-local variables are kept in a separate namespace from global variables so that you can reusenames. Remember that x and self->x are not the same variable if you overload names in your program.
The following example shows how to use thread-local variables. In an editor, type the following programand save it in a file named rtime.d:
syscall::read:entry{ self->t = timestamp;}
syscall::read:return/self->t != 0/{ printf("%d/%d spent %d nsecs in read()\n", pid, tid, timestamp - self->t); /* * We are done with this thread-local variable; assign zero to it * to allow the DTrace runtime to reclaim the underlying storage. */ self->t = 0;}
Next, in your shell, start the program running. Wait a few seconds and you should begin to see someoutput. If no output appears, try running a few commands:
# dtrace -q -s rtime.d3987/3987 spent 12786263 nsecs in read()2183/2183 spent 13410 nsecs in read()2183/2183 spent 12850 nsecs in read()2183/2183 spent 10057 nsecs in read()3583/3583 spent 14527 nsecs in read()3583/3583 spent 12571 nsecs in read()3583/3583 spent 9778 nsecs in read()3583/3583 spent 9498 nsecs in read()3583/3583 spent 9778 nsecs in read()2183/2183 spent 13968 nsecs in read()2183/2183 spent 72076 nsecs in read()...^C

Clause-Local Variables
36
#
The rtime.d program uses a thread-local variable that is named to capture a timestamp on entry toread() by any thread. Then, in the return clause, the program prints the amount of time spent in read()by subtracting self->t from the current timestamp. The built-in D variables pid and tid report theprocess ID and thread ID of the thread that is performing the read(). Because self->t is no longerneeded after this information is reported, it is then assigned 0 to enable DTrace to reuse the underlyingstorage that is associated with t for the current thread.
Typically, you see many lines of output without doing anything because server processes and daemonsare executing read() all the time behind the scenes. Try changing the second clause of rtime.d to usethe execname variable to print out the name of the process performing a read(), for example:
printf("%s/%d spent %d nsecs in read()\n", execname, tid, timestamp - self->t);
If you find a process that is of particular interest, add a predicate to learn more about its read() behavior,as shown in the following example:
syscall::read:entry/execname == "Xorg"/{ self->t = timestamp;}
2.9.4 Clause-Local Variables
The value of a D variable can be accessed whenever a probe fires. Section 2.9, “Variables” describes howvariables could have a different scope. For a global variable, the same instance of the variable is accessedfrom every thread. For thread-local, the instance of the variable is thread-specific.
Meanwhile, for a clause-local variable, the instance of the variable is specific to that particular firing ofthe probe. Clause-local is the narrowest scope. When a probe fires on a CPU, the D script is executed inprogram order. Each clause-local variable is instantiated with an undefined value the first time it is usedin the script. The same instance of the variable is used in all clauses until the D script has completedexecution for that particular firing of the probe.
Clause-local variables can be referenced and assigned by prefixing with this->:
BEGIN{ this->secs = timestamp / 1000000000; ...}
If you want to declare a clause-local variable explicitly before using it, you can do so by using the thiskeyword:
this int x; /* an integer clause-local variable */this char c; /* a character clause-local variable */
BEGIN{ this->x = 123; this->c = 'D';}
Note that if your program contains multiple clauses for a single probe, any clause-local variables remainintact as the clauses are executed, as shown in the following example. Type the following source code andsave it in a file named clause.d:
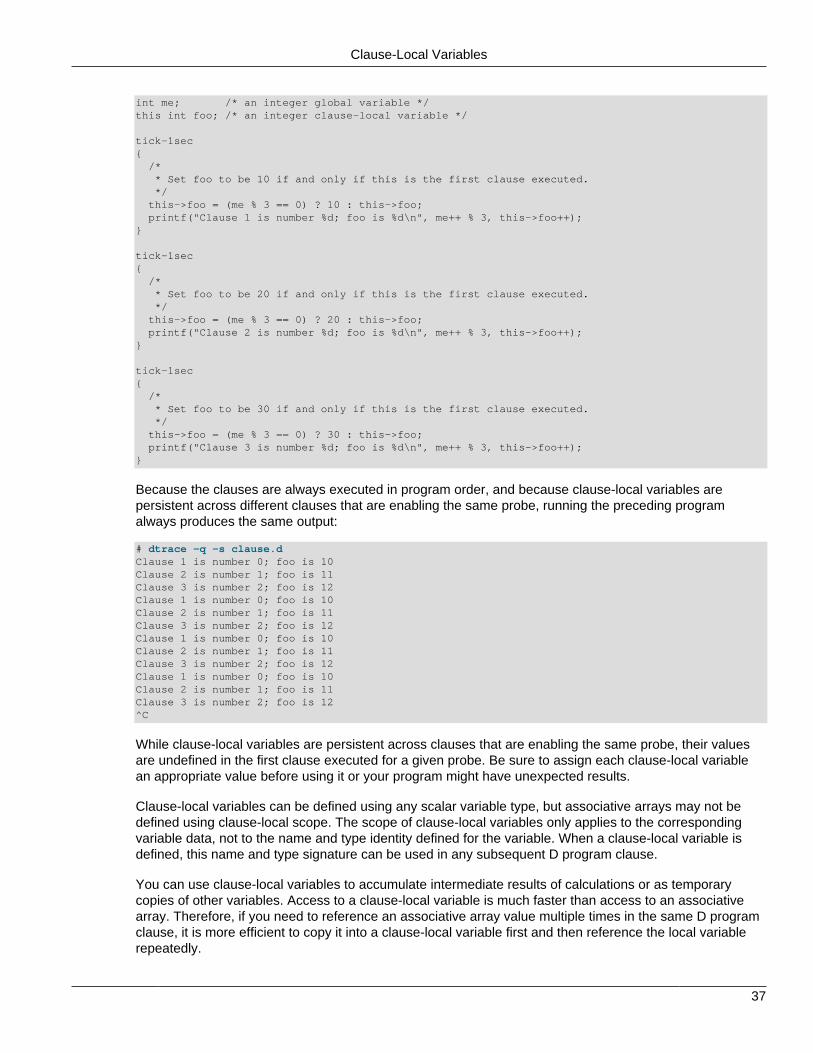
Clause-Local Variables
37
int me; /* an integer global variable */this int foo; /* an integer clause-local variable */
tick-1sec{ /* * Set foo to be 10 if and only if this is the first clause executed. */ this->foo = (me % 3 == 0) ? 10 : this->foo; printf("Clause 1 is number %d; foo is %d\n", me++ % 3, this->foo++);}
tick-1sec{ /* * Set foo to be 20 if and only if this is the first clause executed. */ this->foo = (me % 3 == 0) ? 20 : this->foo; printf("Clause 2 is number %d; foo is %d\n", me++ % 3, this->foo++);}
tick-1sec{ /* * Set foo to be 30 if and only if this is the first clause executed. */ this->foo = (me % 3 == 0) ? 30 : this->foo; printf("Clause 3 is number %d; foo is %d\n", me++ % 3, this->foo++);}
Because the clauses are always executed in program order, and because clause-local variables arepersistent across different clauses that are enabling the same probe, running the preceding programalways produces the same output:
# dtrace -q -s clause.dClause 1 is number 0; foo is 10Clause 2 is number 1; foo is 11Clause 3 is number 2; foo is 12Clause 1 is number 0; foo is 10Clause 2 is number 1; foo is 11Clause 3 is number 2; foo is 12Clause 1 is number 0; foo is 10Clause 2 is number 1; foo is 11Clause 3 is number 2; foo is 12Clause 1 is number 0; foo is 10Clause 2 is number 1; foo is 11Clause 3 is number 2; foo is 12^C
While clause-local variables are persistent across clauses that are enabling the same probe, their valuesare undefined in the first clause executed for a given probe. Be sure to assign each clause-local variablean appropriate value before using it or your program might have unexpected results.
Clause-local variables can be defined using any scalar variable type, but associative arrays may not bedefined using clause-local scope. The scope of clause-local variables only applies to the correspondingvariable data, not to the name and type identity defined for the variable. When a clause-local variable isdefined, this name and type signature can be used in any subsequent D program clause.
You can use clause-local variables to accumulate intermediate results of calculations or as temporarycopies of other variables. Access to a clause-local variable is much faster than access to an associativearray. Therefore, if you need to reference an associative array value multiple times in the same D programclause, it is more efficient to copy it into a clause-local variable first and then reference the local variablerepeatedly.

Built-In Variables
38
2.9.5 Built-In Variables
The following table provides a complete list of built-in D variables. All of these variables are scalar globalvariables.
Table 2.13 DTrace Built-In Variables
Variable Description
args[] The typed arguments, if any, to the current probe. The args[] arrayis accessed using an integer index, but each element is defined to bethe type corresponding to the given probe argument. For informationabout any typed arguments, use dtrace -l with the verbose option-v and check Argument Types.
int64_t arg0, ..., arg9 The first ten input arguments to a probe, represented as raw 64-bitintegers. Values are meaningful only for arguments defined for thecurrent probe.
uintptr_t caller The program counter location of the current kernel thread at the timethe probe fired.
chipid_t chip The CPU chip identifier for the current physical chip.
processorid_t cpu The CPU identifier for the current CPU. See Section 11.8, “schedProvider” for more information.
cpuinfo_t *curcpu The CPU information for the current CPU. See Section 11.8, “schedProvider”.
lwpsinfo_t *curlwpsinfo The process state of the current thread. See Section 11.7, “procProvider”.
psinfo_t *curpsinfo The process state of the process associated with the current thread.See Section 11.7, “proc Provider”.
task_struct *curthread Is a vmlinux data type, for which members can be found bysearching for "task_struct" on the Internet.
string cwd The name of the current working directory of the process associatedwith the current thread.
uint_t epid The enabled probe ID (EPID) for the current probe. This integeruniquely identifies a particular probe that is enabled with a specificpredicate and set of actions.
int errno The error value returned by the last system call executed by thisthread.
string execname The name that was passed to execve() to execute the currentprocess.
fileinfo_t fds[] The files that the current process has opened in an fileinfo_tarray, indexed by file descriptor number. See Section 11.9.2.3,“fileinfo_t”.
Note
You must load the sdt kernel module forfds[] to be available.
gid_t gid The real group ID of the current process.
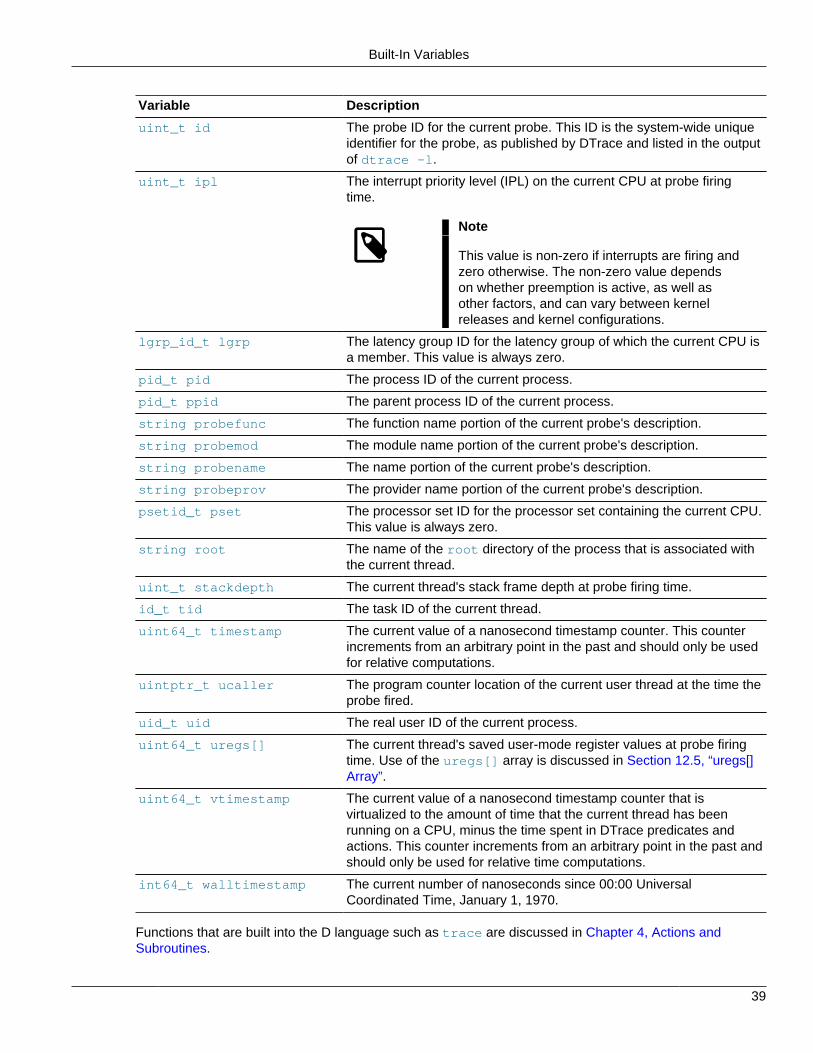
Built-In Variables
39
Variable Description
uint_t id The probe ID for the current probe. This ID is the system-wide uniqueidentifier for the probe, as published by DTrace and listed in the outputof dtrace -l.
uint_t ipl The interrupt priority level (IPL) on the current CPU at probe firingtime.
Note
This value is non-zero if interrupts are firing andzero otherwise. The non-zero value dependson whether preemption is active, as well asother factors, and can vary between kernelreleases and kernel configurations.
lgrp_id_t lgrp The latency group ID for the latency group of which the current CPU isa member. This value is always zero.
pid_t pid The process ID of the current process.
pid_t ppid The parent process ID of the current process.
string probefunc The function name portion of the current probe's description.
string probemod The module name portion of the current probe's description.
string probename The name portion of the current probe's description.
string probeprov The provider name portion of the current probe's description.
psetid_t pset The processor set ID for the processor set containing the current CPU.This value is always zero.
string root The name of the root directory of the process that is associated withthe current thread.
uint_t stackdepth The current thread's stack frame depth at probe firing time.
id_t tid The task ID of the current thread.
uint64_t timestamp The current value of a nanosecond timestamp counter. This counterincrements from an arbitrary point in the past and should only be usedfor relative computations.
uintptr_t ucaller The program counter location of the current user thread at the time theprobe fired.
uid_t uid The real user ID of the current process.
uint64_t uregs[] The current thread's saved user-mode register values at probe firingtime. Use of the uregs[] array is discussed in Section 12.5, “uregs[]Array”.
uint64_t vtimestamp The current value of a nanosecond timestamp counter that isvirtualized to the amount of time that the current thread has beenrunning on a CPU, minus the time spent in DTrace predicates andactions. This counter increments from an arbitrary point in the past andshould only be used for relative time computations.
int64_t walltimestamp The current number of nanoseconds since 00:00 UniversalCoordinated Time, January 1, 1970.
Functions that are built into the D language such as trace are discussed in Chapter 4, Actions andSubroutines.

External Variables
40
2.9.6 External Variables
The D language uses the back quote character (`) as a special scoping operator for accessing variablesthat are defined in the operating system and not in your D program. For more information, see Section 2.7,“External Symbols and Types”.
2.10 Pointers and Scalar Arrays
Pointers are memory addresses of data objects in the operating system kernel or in the address space ofa user process. D provides the ability to create and manipulate pointers and store them in variables andassociative arrays. This section describes the D syntax for pointers, operators that can be applied to createor access pointers, and the relationship between pointers and fixed-size scalar arrays. Also discussed areissues relating to the use of pointers in different address spaces.
Note
If you are an experienced C or C++ programmer, you can skim most of thissection as the D pointer syntax is the same as the corresponding ANSI C syntax.Howevver, you should read Section 2.10.1, “Pointers and Addresses” andSection 2.10.8, “Pointers to DTrace Objects”, as these sections describe featuresand issues that are specific to DTrace.
2.10.1 Pointers and Addresses
The Linux operating system uses a technique called virtual memory to provide each user process withits own virtual view of the memory resources on your system. A virtual view of memory resources isreferred to as an address space. An address space associates a range of address values, either [0 ...0xffffffff] for a 32-bit address space or [0 ... 0xffffffffffffffff] for a 64-bit addressspace, with a set of translations that the operating system and hardware use to convert each virtualaddress to a corresponding physical memory location. Pointers in D are data objects that store an integervirtual address value and associate it with a D type that describes the format of the data stored at thecorresponding memory location.
You can explicitly declare a D variable to be of pointer type by first specifying the type of the referenceddata and then appending an asterisk (*) to the type name. Doing so indicates you want to declare a pointertype, as shown in the following statement:
int *p;
This statement declares a D global variable named p that is a pointer to an integer. The declaration meansthat p is a 64-bit integer with a value that is the address of another integer located somewhere in memory.Because the compiled form of your D code is executed at probe firing time inside the operating systemkernel itself, D pointers are typically pointers associated with the kernel's address space. You can use thearch command to determine the number of bits that are used for pointers by the active operating systemkernel.
If you want to create a pointer to a data object inside of the kernel, you can compute its address by usingthe & operator. For example, the operating system kernel source code declares an unsigned longmax_pfn variable. You could trace the address of this variable by tracing the result of applying the &operator to the name of that object in D:
trace(&`max_pfn);
The * operator can be used to refer to the object addressed by the pointer, and acts as the inverse of the &operator. For example, the following two D code fragments are equivalent in meaning:

Pointer Safety
41
q = &`max_pfn; trace(*q);
trace(`max_pfn);
In this example, the first fragment creates a D global variable pointer q. Because the max_pfn object isof type unsigned long, the type of &`max_pfn is unsigned long * (that is, pointer to unsignedlong), implicitly setting the type of q. Tracing the value of *qfollows the pointer back to the data objectmax_pfn. This fragment is therefore the same as the second fragment, which directly traces the value ofthe data object by using its name.
2.10.2 Pointer Safety
If you are a C or C++ programmer, you might be a bit apprehensive after reading the previous sectionbecause you know that misuse of pointers in your programs can cause your programs to crash. DTrace,however, is a robust, safe environment for executing your D programs. Take note that these types ofmistakes cannot cause program crashes. You might write a buggy D program, but invalid D pointeraccesses do not cause DTrace or the operating system kernel to fail or crash in any way. Instead, theDTrace software detects any invalid pointer accesses, disables your instrumentation, and reports theproblem back to you for debugging.
If you have previously programmed in the Java programming language, you are probably aware thatthe Java language does not support pointers for precisely the same reasons of safety. Pointers areneeded in D because they are an intrinsic part of the operating system's implementation in C, but DTraceimplements the same kind of safety mechanisms that are found in the Java programming language toprevent buggy programs from damaging themselves or each other. DTrace's error reporting is similar to theruntime environment for the Java programming language that detects a programming error and reports anexception.
To observe DTrace's error handling and reporting, you could write a deliberately bad D program usingpointers. For example, in an editor, type the following D program and save it in a file named badptr.d:
BEGIN{ x = (int *)NULL; y = *x; trace(y);}
The badptr.d program creates a D pointer named x that is a pointer to int. The program assignsthis pointer the special invalid pointer value NULL, which is a built-in alias for address 0. By convention,address 0 is always defined as invalid so that NULL can be used as a sentinel value in C and D programs.The program uses a cast expression to convert NULL to be a pointer to an integer. The program thendereferences the pointer by using the expression *x, assigns the result to another variable y, and thenattempts to trace y. When the D program is executed, DTrace detects an invalid pointer access when thestatement y = *x is executed and reports the following error:
# dtrace -s badptr.ddtrace: script 'badptr.d' matched 1 probedtrace: error on enabled probe ID 1 (ID 1: dtrace:::BEGIN):invalid address (0x0) in action #2 at DIF offset 4^C#
Notice that the D program moves past the error and continues to execute; the system and all observedprocesses remain unperturbed. You can also add an ERROR probe to your script to handle D errors. Fordetails about the DTrace error mechanism, see Section 11.1.3, “ERROR Probe”.

Array Declarations and Storage
42
2.10.3 Array Declarations and Storage
In addition to the dynamic associative arrays that are described in Section 2.9, “Variables”, D supportsscalar arrays. Scalar arrays are a fixed-length group of consecutive memory locations that each store avalue of the same type. Scalar arrays are accessed by referring to each location with an integer, startingfrom zero. Scalar arrays correspond directly in concept and syntax with arrays in C and C++. Scalar arraysare not used as frequently in D as associative arrays and their more advanced counterparts aggregations.You might, however, need to use scalar arrays to access existing operating system array data structuresthat are declared in C. Aggregations are described in Chapter 3, Aggregations.
A D scalar array of 5 integers is declared by using the type int and suffixing the declaration with thenumber of elements in square brackets, for example:
int a[5];
Figure 2.3, “Scalar Array Representation” shows a visual representation of the array storage:
Figure 2.3 Scalar Array Representation
The D expression a[0] refers to the first array element, a[1] refers to the second, and so on. From asyntactic perspective, scalar arrays and associative arrays are very similar. You can declare an associativearray of integers referenced by an integer key as follows:
int a[int];
You can also reference this array using the expression a[0]. But, from a storage and implementationperspective, the two arrays are very different. The static array a consists of five consecutive memorylocations numbered from zero, and the index refers to an offset in the storage that is allocated for the array.On the other hand, an associative array has no predefined size and does not store elements in consecutivememory locations. In addition, associative array keys have no relationship to the corresponding valuestorage location. You can access associative array elements a[0] and a[-5] and only two words ofstorage are allocated by DTrace, and these might or might not be consecutive. Associative array keys areabstract names for the corresponding values and have no relationship to the value storage locations.
If you create an array using an initial assignment and use a single integer expression as the arrayindex , for example, a[0] = 2, the D compiler always creates a new associative array, even though inthis expression a could also be interpreted as an assignment to a scalar array. Scalar arrays must bepredeclared in this situation so that the D compiler can recognize the definition of the array size and inferthat the array is a scalar array.
2.10.4 Pointer and Array Relationship
Pointers and scalar arrays have a special relationship in D, just as they do in ANSI C. A scalar arrayis represented by a variable that is associated with the address of its first storage location. A pointer isalso the address of a storage location with a defined type. Thus, D permits the use of the array [] indexnotation with both pointer variables and array variables. For example, the following two D fragments areequivalent in meaning:
p = &a[0]; trace(p[2]);
trace(a[2]);
In the first fragment, the pointer p is assigned to the address of the first element in scalar array a byapplying the & operator to the expression a[0]. The expression p[2] traces the value of the third arrayelement (index 2). Because p now contains the same address associated with a, this expression yields the

Pointer Arithmetic
43
same value as a[2], shown in the second fragment. One consequence of this equivalence is that C and Dpermit you to access any index of any pointer or array. Array bounds checking is not performed for you bythe compiler or the DTrace runtime environment. If you access memory beyond the end of a scalar array'spredefined size, you either get an unexpected result or DTrace reports an invalid address error, as shownin the previous example. As always, you cannot damage DTrace itself or your operating system, but you doneed to debug your D program.
The difference between pointers and arrays is that a pointer variable refers to a separate piece of storagethat contains the integer address of some other storage. Whereas, an array variable names the arraystorage itself, not the location of an integer that in turn contains the location of the array. Figure 2.4,“Pointer and Array Storage” illustrates this difference.
Figure 2.4 Pointer and Array Storage
This difference is manifested in the D syntax if you attempt to assign pointers and scalar arrays. If x andy are pointer variables, the expression x = y is legal; it copies the pointer address in y to the storagelocation that is named by x. If x and y are scalar array variables, the expression x = y is not legal. Arraysmay not be assigned as a whole in D. However, an array variable or symbol name can be used in anycontext where a pointer is permitted. If p is a pointer and a is a scalar array, the statement p = a ispermitted. This statement is equivalent to the statement p = &a[0].
2.10.5 Pointer Arithmetic
Because pointers are just integers that are used as addresses of other objects in memory, D providesa set of features for performing arithmetic on pointers. However, pointer arithmetic is not identical tointeger arithmetic. Pointer arithmetic implicitly adjusts the underlying address by multiplying or dividing theoperands by the size of the type referenced by the pointer.
The following D fragment illustrates this property:
int *x;
BEGIN{ trace(x); trace(x + 1); trace(x + 2);}
This fragment creates an integer pointer x and then traces its value, its value incremented by one, and itsvalue incremented by two. If you create and execute this program, DTrace reports the integer values 0, 4,and 8.
Since x is a pointer to an int (size 4 bytes), incrementing x adds 4 to the underlying pointer value.This property is useful when using pointers to refer to consecutive storage locations such as arrays. Forexample, if x was assigned to the address of an array a, similar to what is shown in Figure 2.4, “Pointerand Array Storage”, the expression x + 1 would be equivalent to the expression &a[1]. Similarly, theexpression *(x + 1) would refer to the value a[1]. Pointer arithmetic is implemented by the D compilerwhenever a pointer value is incremented by using the +, ++, or =+ operators. Pointer arithmetic is alsoapplied as follows; when an integer is subtracted from a pointer on the left-hand side, when a pointer issubtracted from another pointer, or when the -- operator is applied to a pointer.

Generic Pointers
44
For example, the following D program would trace the result 2:
int *x, *y;int a[5];
BEGIN{ x = &a[0]; y = &a[2]; trace(y - x);}
2.10.6 Generic Pointers
Sometimes it is useful to represent or manipulate a generic pointer address in a D program withoutspecifying the type of data referred to by the pointer. Generic pointers can be specified by using the typevoid *, where the keyword void represents the absence of specific type information, or by using thebuilt-in type alias uintptr_t, which is aliased to an unsigned integer type of size that is appropriate for apointer in the current data model. You may not apply pointer arithmetic to an object of type void *, andthese pointers cannot be dereferenced without casting them to another type first. You can cast a pointer tothe uintptr_t type when you need to perform integer arithmetic on the pointer value.
Pointers to void can be used in any context where a pointer to another data type is required, such asan associative array tuple expression or the right-hand side of an assignment statement. Similarly, apointer to any data type can be used in a context where a pointer to void is required. To use a pointer to anon-void type in place of another non-void pointer type, an explicit cast is required. You must always useexplicit casts to convert pointers to integer types, such as uintptr_t, or to convert these integers back tothe appropriate pointer type.
2.10.7 Multi-Dimensional Arrays
Multi-dimensional scalar arrays are used infrequently in D, but are provided for compatibility with ANSIC and are for observing and accessing operating system data structures that are created by using thiscapability in C. A multi-dimensional array is declared as a consecutive series of scalar array sizes enclosedin square brackets [] following the base type. For example, to declare a fixed-size, two-dimensionalrectangular array of integers of dimensions that is 12 rows by 34 columns, you would write the followingdeclaration:
int a[12][34];
A multi-dimensional scalar array is accessed by using similar notation. For example, to access the valuestored at row 0 and column 1, you would write the D expression as follows:
a[0][1]
Storage locations for multi-dimensional scalar array values are computed by multiplying the row number bythe total number of columns declared and then adding the column number.
Be careful not to confuse the multi-dimensional array syntax with the D syntax for associative arrayaccesses, that is, a[0][1], is not the same as a[0,1]). If you use an incompatible tuple with anassociative array or attempt an associative array access of a scalar array, the D compiler reports anappropriate error message and refuses to compile your program.
2.10.8 Pointers to DTrace Objects
The D compiler prohibits you from using the & operator to obtain pointers to DTrace objects such asassociative arrays, built-in functions, and variables. You are prohibited from obtaining the address ofthese variables so that the DTrace runtime environment is free to relocate them as needed between probe

Pointers and Address Spaces
45
firings . In this way, DTrace can more efficiently manage the memory required for your programs. If youcreate composite structures, it is possible to construct expressions that do retrieve the kernel address ofyour DTrace object storage. You should avoid creating such expressions in your D programs. If you needto use such an expression, do not rely on the address being the same across probe firings.
In ANSI C, pointers can also be used to perform indirect function calls or to perform assignments, suchas placing an expression using the unary * dereference operator on the left-hand side of an assignmentoperator. In D, these types of expressions using pointers are not permitted. You may only assign valuesdirectly to D variables by specifying their name or by applying the array index operator [] to a D scalar orassociative array. You may only call functions that are defined by the DTrace environment by name, asspecified in Chapter 4, Actions and Subroutines. Indirect function calls using pointers are not permitted inD.
2.10.9 Pointers and Address Spaces
A pointer is an address that provides a translation within some virtual address space to a piece of physicalmemory. DTrace executes your D programs within the address space of the operating system kernel itself.The Linux system manages many address spaces: one for the operating system kernel and one for eachuser process. Because each address space provides the illusion that it can access all of the memory onthe system, the same virtual address pointer value can be reused across address spaces, but translate todifferent physical memory. Therefore, when writing D programs that use pointers, you must be aware of theaddress space corresponding to the pointers you intend to use.
For example, if you use the syscall provider to instrument entry to a system call that takes a pointer toan integer or array of integers as an argument, for example, pipe(), it would not be valid to dereferencethat pointer or array using the * or [] operators because the address in question is an address in theaddress space of the user process that performed the system call. Applying the * or [] operators to thisaddress in D would result in kernel address space access, which would result in an invalid address error orin returning unexpected data to your D program, depending on whether the address happened to match avalid kernel address.
To access user-process memory from a DTrace probe, you must apply one of the copyin, copyinstr, orcopyinto functions that are described in Chapter 4, Actions and Subroutines to the user address spacepointer. To avoid confusion, take care when writing your D programs to name and comment variablesstoring user addresses appropriately. You can also store user addresses as uintptr_t so that you do notaccidentally compile D code that dereferences them. Techniques for using DTrace on user processes aredescribed in Chapter 12, User Process Tracing.
2.11 DTrace Support for Strings
DTrace provides support for tracing and manipulating strings. This section describes the complete set ofD language features for declaring and manipulating strings. Unlike ANSI C, strings in D have their ownbuilt-in type and operator support to enable you to easily and unambiguously use them in your tracingprograms.
2.11.1 String Representation
In DTrace, strings are represented as an array of characters terminated by a null byte (that is, a bytewhose value is zero, usually written as '\0'). The visible part of the string is of variable length, dependingon the location of the null byte, but DTrace stores each string in a fixed-size array so that each probetraces a consistent amount of data. Strings cannot exceed the length of the predefined string limit.However, the limit can be modified in your D program or on the dtrace command line by tuning thestrsize option. See Chapter 10, Options and Tunables for more information about tunable DTraceoptions. The default string limit is 256 bytes.
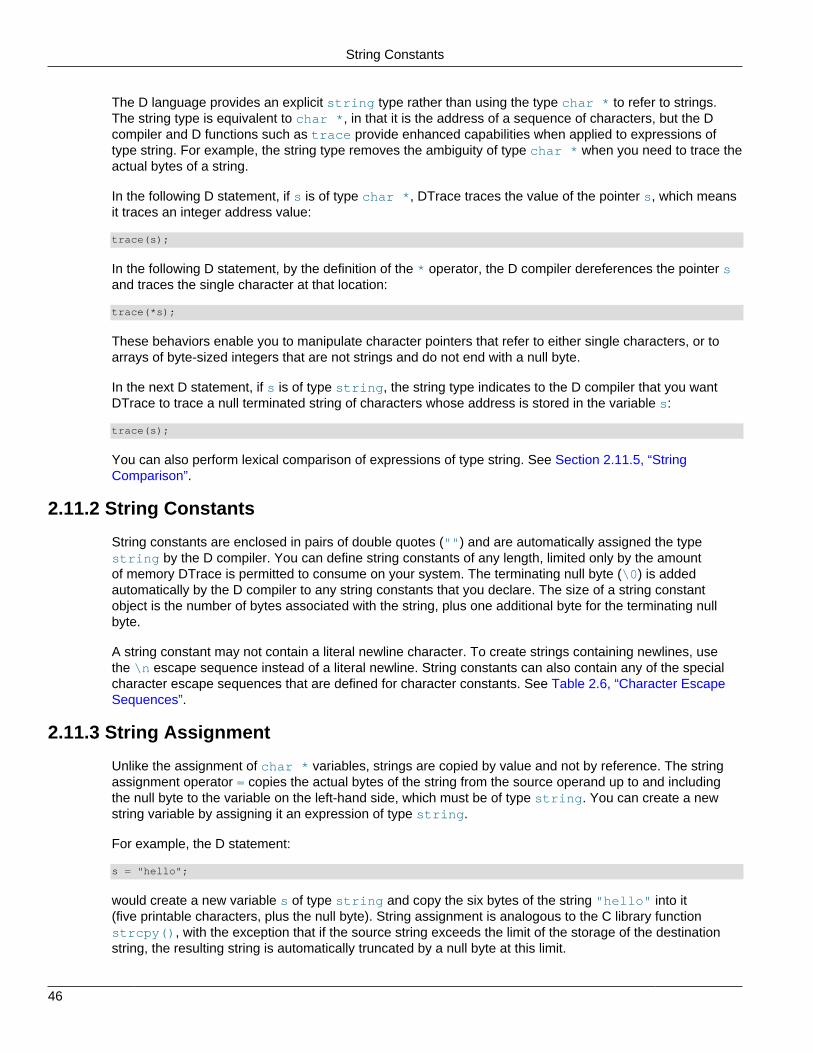
String Constants
46
The D language provides an explicit string type rather than using the type char * to refer to strings.The string type is equivalent to char *, in that it is the address of a sequence of characters, but the Dcompiler and D functions such as trace provide enhanced capabilities when applied to expressions oftype string. For example, the string type removes the ambiguity of type char * when you need to trace theactual bytes of a string.
In the following D statement, if s is of type char *, DTrace traces the value of the pointer s, which meansit traces an integer address value:
trace(s);
In the following D statement, by the definition of the * operator, the D compiler dereferences the pointer sand traces the single character at that location:
trace(*s);
These behaviors enable you to manipulate character pointers that refer to either single characters, or toarrays of byte-sized integers that are not strings and do not end with a null byte.
In the next D statement, if s is of type string, the string type indicates to the D compiler that you wantDTrace to trace a null terminated string of characters whose address is stored in the variable s:
trace(s);
You can also perform lexical comparison of expressions of type string. See Section 2.11.5, “StringComparison”.
2.11.2 String Constants
String constants are enclosed in pairs of double quotes ("") and are automatically assigned the typestring by the D compiler. You can define string constants of any length, limited only by the amountof memory DTrace is permitted to consume on your system. The terminating null byte (\0) is addedautomatically by the D compiler to any string constants that you declare. The size of a string constantobject is the number of bytes associated with the string, plus one additional byte for the terminating nullbyte.
A string constant may not contain a literal newline character. To create strings containing newlines, usethe \n escape sequence instead of a literal newline. String constants can also contain any of the specialcharacter escape sequences that are defined for character constants. See Table 2.6, “Character EscapeSequences”.
2.11.3 String Assignment
Unlike the assignment of char * variables, strings are copied by value and not by reference. The stringassignment operator = copies the actual bytes of the string from the source operand up to and includingthe null byte to the variable on the left-hand side, which must be of type string. You can create a newstring variable by assigning it an expression of type string.
For example, the D statement:
s = "hello";
would create a new variable s of type string and copy the six bytes of the string "hello" into it(five printable characters, plus the null byte). String assignment is analogous to the C library functionstrcpy(), with the exception that if the source string exceeds the limit of the storage of the destinationstring, the resulting string is automatically truncated by a null byte at this limit.

String Conversion
47
You can also assign to a string variable an expression of a type that is compatible with strings. In thiscase, the D compiler automatically promotes the source expression to the string type and performs a stringassignment. The D compiler permits any expression of type char * or of type char[n], that is, a scalararray of char of any size, to be promoted to a string.
2.11.4 String Conversion
Expressions of other types can be explicitly converted to type string by using a cast expression or byapplying the special stringof operator, which are equivalent in the following meaning:
s = (string) expression;
s = stringof (expression);
The expression is interpreted as an address to the string.
The stringof operator binds very tightly to the operand on its right-hand side. Typically, parentheses areused to surround the expression for clarity. Although, they are not strictly necessary.
Any expression that is a scalar type, such as a pointer or integer, or a scalar array address may beconverted to string. Expressions of other types such as void may not be converted to string. If youerroneously convert an invalid address to a string, the DTrace safety features prevents you from damagingthe system or DTrace, but you might end up tracing a sequence of undecipherable characters.
2.11.5 String Comparison
D overloads the binary relational operators and permits them to be used for string comparisons, as wellas integer comparisons. The relational operators perform string comparison whenever both operandsare of type string or when one operand is of type string and the other operand can be promoted totype string. See Section 2.11.3, “String Assignment” for a detailed description. See also Table 2.14, “DRelational Operators for Strings”, which lists the relational operators that can be used to compare strings.
Table 2.14 D Relational Operators for Strings
Operator Description
< Left-hand operand is less than right-operand.
<= Left-hand operand is less than or equal to right-hand operand.
> Left-hand operand is greater than right-hand operand.
>= Left-hand operand is greater than or equal to right-hand operand.
== Left-hand operand is equal to right-hand operand.
!= Left-hand operand is not equal to right-hand operand.
As with integers, each operator evaluates to a value of type int, which is equal to one if the condition istrue or zero if it is false.
The relational operators compare the two input strings byte-by-byte, similarly to the C library routinestrcmp(). Each byte is compared by using its corresponding integer value in the ASCII character setuntil a null byte is read or the maximum string length is reached. See the ascii(7) manual page for moreinformation. Some example D string comparisons and their results are shown in the following table.
D string comparison Result
"coffee" < "espresso" Returns 1 (true)
"coffee" == "coffee" Returns 1 (true)
"coffee"" >= "mocha" Returns 0 (false)
Structs and Unions
48
Note
Seemingly identical Unicode strings might compare as being different if one or theother of the strings is not normalized.
2.12 Structs and UnionsCollections of related variables can be grouped together into composite data objects called structsand unions. You define these objects in D by creating new type definitions for them. You can use yournew types for any D variables, including associative array values. This section explores the syntax andsemantics for creating and manipulating these composite types and the D operators that interact with them.
2.12.1 Structs
The D keyword struct, short for structure, is used to introduce a new type that is composed of a groupof other types. The new struct type can be used as the type for D variables and arrays, enabling youto define groups of related variables under a single name. D structs are the same as the correspondingconstruct in C and C++. If you have programmed in the Java programming language previously, think of aD struct as a class that contains only data members and no methods.
Suppose you want to create a more sophisticated system call tracing program in D that records a numberof things about each read() and write() system call that is executed by your shell, for example, theelapsed time, number of calls, and the largest byte count passed as an argument.
You could write a D clause to record these properties in three separate associative arrays, as shown in thefollowing example:
int maxbytes[string]; /* declare maxbytes */ syscall::read:entry, syscall::write:entry/pid == 12345/{ ts[probefunc] = timestamp; calls[probefunc]++; maxbytes[probefunc] = arg2 > maxbytes[probefunc] ? arg2 : maxbytes[probefunc];}
This clause, however, is inefficient because DTrace must create three separate associative arrays andstore separate copies of the identical tuple values corresponding to probefunc for each one. Instead, youcan conserve space and make your program easier to read and maintain by using a struct.
First, declare a new struct type at the top of the D program source file:
struct callinfo { uint64_t ts; /* timestamp of last syscall entry */ uint64_t elapsed; /* total elapsed time in nanoseconds */ uint64_t calls; /* number of calls made */ size_t maxbytes; /* maximum byte count argument */};
The struct keyword is followed by an optional identifier that is used to refer back to the new type, whichis now known as struct callinfo. The struct members are then enclosed in a set of braces {} andthe entire declaration is terminated by a semicolon (;). Each struct member is defined by using the samesyntax as a D variable declaration, with the type of the member listed first followed by an identifier namingthe member and another semicolon (;).
The struct declaration simply defines the new type. It does not create any variables or allocate anystorage in DTrace. When declared, you can use struct callinfo as a type throughout the remainderof your D program. Each variable of type struct callinfo stores a copy of the four variables that are
Pointers to Structs
49
described by our structure template. The members are arranged in memory in order, according to themember list, with padding space introduced between members, as required for data object alignmentpurposes.
You can use the member identifier names to access the individual member values using the “.” operatorby writing an expression of the following form:
variable-name.member-name
The following example is an improved program that uses the new structure type. In a text editor, type thefollowing D program and save it in a file named rwinfo.d:
struct callinfo { uint64_t ts; /* timestamp of last syscall entry */ uint64_t elapsed; /* total elapsed time in nanoseconds */ uint64_t calls; /* number of calls made */ size_t maxbytes; /* maximum byte count argument */};
struct callinfo i[string]; /* declare i as an associative array */
syscall::read:entry, syscall::write:entry/pid == $1/{ i[probefunc].ts = timestamp; i[probefunc].calls++; i[probefunc].maxbytes = arg2 > i[probefunc].maxbytes ? arg2 : i[probefunc].maxbytes;}
syscall::read:return, syscall::write:return/i[probefunc].ts != 0 && pid == $1/{ i[probefunc].elapsed += timestamp - i[probefunc].ts;}
END{ printf(" calls max bytes elapsed nsecs\n"); printf("------ ----- --------- -------------\n"); printf(" read %5d %9d %d\n", i["read"].calls, i["read"].maxbytes, i["read"].elapsed); printf(" write %5d %9d %d\n", i["write"].calls, i["write"].maxbytes, i["write"].elapsed);}
When you have typed the program, run the dtrace -q -s rwinfo.d command, specifying one ofyour shell processes. Then, type a few commands in your shell. When you have finished typing the shellcommands, type Ctrl-C to fire the END probe and print the results:
# dtrace -q -s rwinfo.d `pgrep -n bash`^C calls max bytes elapsed nsecs------ ----- --------- ------------- read 25 1024 8775036488 write 33 22 1859173
2.12.2 Pointers to Structs
Referring to structs by using pointers is very common in C and D. You can use the operator -> toaccess struct members through a pointer. If struct s has a member m, and you have a pointer to thisstruct named sp, where sp is a variable of type struct s *, you can either use the * operator to firstdereference the sp pointer to access the member:

Unions
50
struct s *sp;(*sp).m
Or, you can use the -> operator as shorthand for this notation. The following two D fragments areequivalent if sp is a pointer to a struct:
(*sp).m sp->m
DTrace provides several built-in variables that are pointers to structs. For example, the pointer curpsinforefers to struct psinfo and its content provides a snapshot of information about the state of the processassociated with the thread that fired the current probe. The following table lists a few example expressionsthat use curpsinfo, including their types and their meanings.
Example Expression Type Meaning
curpsinfo->pr_pid pid_t Current process ID
curpsinfo->pr_fname char [] Executable file name
curpsinfo->pr_psargs char [] Initial command-line arguments
For more information, see Section 11.7.2.2, “psinfo_t”.
The next example uses the pr_fname member to identify a process of interest. In an editor, type thefollowing script and save it in a file named procfs.d:
syscall::write:entry/ curpsinfo->pr_fname == "date" /{ printf("%s run by UID %d\n", curpsinfo->pr_psargs, curpsinfo->pr_uid);}
This clause uses the expression curpsinfo->pr_fname to access and match the command name sothat the script selects the correct write() requests before tracing the arguments. Notice that by usingoperator == with a left-hand argument that is an array of char and a right-hand argument that is a string,the D compiler infers that the left-hand argument should be promoted to a string and a string comparisonshould be performed. Type the command dtrace -q -s procs.d in one shell and then type the datecommand several times in another shell. The output that is displayed by DTrace is similar to the following:
# dtrace -q -s procfs.d date run by UID 500/bin/date run by UID 500date -R run by UID 500...^C#
Complex data structures are used frequently in C programs, so the ability to describe and reference structsfrom D also provides a powerful capability for observing the inner workings of the Oracle Linux operatingsystem kernel and its system interfaces.
2.12.3 Unions
Unions are another kind of composite type that is supported by ANSI C and D and are closely related tostructs. A union is a composite type where a set of members of different types are defined and the memberobjects all occupy the same region of storage. A union is therefore an object of variant type, where onlyone member is valid at any given time, depending on how the union has been assigned. Typically, someother variable or piece of state is used to indicate which union member is currently valid. The size of aunion is the size of its largest member. The memory alignment that is used for the union is the maximumalignment required by the union members.
Member Sizes and Offsets
51
2.12.4 Member Sizes and Offsets
You can determine the size in bytes of any D type or expression, including a struct or union, by usingthe sizeof operator. The sizeof operator can be applied either to an expression or to the name of atype surrounded by parentheses, as illustrated in the following two examples:
sizeof expression sizeof (type-name)
For example, the expression sizeof (uint64_t) would return the value 8, and the expression sizeof(callinfo.ts) would also return 8, if inserted into the source code of the previous example program.The formal return type of the sizeof operator is the type alias size_t, which is defined as an unsignedinteger that is the same size as a pointer in the current data model and is used to represent byte counts.When the sizeof operator is applied to an expression, the expression is validated by the D compiler, butthe resulting object size is computed at compile time and no code for the expression is generated. You canuse sizeof anywhere an integer constant is required.
You can use the companion operator offsetof to determine the offset in bytes of a struct or unionmember from the start of the storage that is associated with any object of the struct or union type. Theoffsetof operator is used in an expression of the following form:
offsetof (type-name, member-name)
Here, type-name is the name of any struct or union type or type alias, and member-name is theidentifier naming a member of that struct or union. Similar to sizeof, offsetof returns a size_t andyou can use it anywhere in a D program that an integer constant can be used.
2.12.5 Bit-Fields
D also permits the definition of integer struct and union members of arbitrary numbers of bits, known as bit-fields. A bit-field is declared by specifying a signed or unsigned integer base type, a member name, and asuffix indicating the number of bits to be assigned for the field, as shown in the following example:
struct s { int a : 1; int b : 3; int c : 12;};
The bit-field width is an integer constant that is separated from the member name by a trailing colon.The bit-field width must be positive and must be of a number of bits not larger than the width of thecorresponding integer base type. Bit-fields that are larger than 64 bits may not be declared in D. D bit-fieldsprovide compatibility with and access to the corresponding ANSI C capability. Bit-fields are typically usedin situations when memory storage is at a premium or when a struct layout must match a hardware registerlayout.
A bit-field is a compiler construct that automates the layout of an integer and a set of masks to extract themember values. The same result can be achieved by simply defining the masks yourself and using the &operator. The C and D compilers attempt to pack bits as efficiently as possible, but they are free to do soin any order or fashion they desire. Therefore, bit-fields are not guaranteed to produce identical bit layoutsacross differing compilers or architectures. If you require stable bit layout, you should construct the bitmasks yourself and extract the values by using the & operator.
A bit-field member is accessed by simply specifying its name in combination with the “.” or -> operators,like any other struct or union member. The bit-field is automatically promoted to the next largest integertype for use in any expressions. Because bit-field storage cannot be aligned on a byte boundary or be
Type and Constant Definitions
52
a round number of bytes in size, you may not apply the sizeof or offsetof operators to a bit-fieldmember. The D compiler also prohibits you from taking the address of a bit-field member by using the &operator.
2.13 Type and Constant Definitions
This section describes how to declare type aliases and named constants in D. It also discusses D type andnamespace management for program and operating system types and identifiers.
2.13.1 typedefs
The typedef keyword is used to declare an identifier as an alias for an existing type. Like all D typedeclarations, typedef is used outside of probe clauses in a declaration of the following form:
typedef existing-type new-type ;
where existing-type is any type declaration and new-type is an identifier to be used as the alias forthis type. For example, the D compiler uses the following declaration internally to create the uint8_t typealias:
typedef unsigned char uint8_t;
You can use type aliases anywhere that a normal type can be used, such as the type of a variable orassociative array value or tuple member. You can also combine typedef with more elaborate declarationssuch as the definition of a new struct, as shown in the following example:
typedef struct foo { int x; int y;} foo_t;
In the previous example, struct foo is defined using the same type as its alias, foo_t. Linux C systemheaders often use the suffix _t to denote a typedef alias.
2.13.2 Enumerations
Defining symbolic names for constants in a program eases readability and simplifies the process ofmaintaining the program in the future. One method is to define an enumeration, which associates a setof integers with a set of identifiers called enumerators that the compiler recognizes and replaces with thecorresponding integer value. An enumeration is defined by using a declaration such as the following:
enum colors { RED, GREEN, BLUE};
The first enumerator in the enumeration, RED, is assigned the value zero and each subsequent identifier isassigned the next integer value.
You can also specify an explicit integer value for any enumerator by suffixing it with an equal sign and aninteger constant, as shown in the following example:
enum colors { RED = 7, GREEN = 9, BLUE};

Inlines
53
The enumerator BLUE is assigned the value 10 by the compiler because it has no value specified and theprevious enumerator is set to 9. When an enumeration is defined, the enumerators can be used anywherein a D program that an integer constant is used. In addition, the enumeration enum colors is also definedas a type that is equivalent to an int. The D compiler allows a variable of enum type to be used anywherean int can be used and will allow any integer value to be assigned to a variable of enum type. You canalso omit the enum name in the declaration, if the type name is not needed.
Enumerators are visible in all subsequent clauses and declarations in your program. Therefore, you cannotdefine the same enumerator identifier in more than one enumeration. However, you can define more thanone enumerator with the same value in either the same or different enumerations. You may also assignintegers that have no corresponding enumerator to a variable of the enumeration type.
The D enumeration syntax is the same as the corresponding syntax in ANSI C. D also provides accessto enumerations that are defined in the operating system kernel and its loadable modules. Note thatthese enumerators are not globally visible in your D program. Kernel enumerators are only visible if youspecify one as an argument in a comparison with an object of the corresponding enumeration type. Thisfeature protects your D programs against inadvertent identifier name conflicts, with the large collection ofenumerations that are defined in the operating system kernel.
The following example D program displays information about I/O requests. The program uses theenumerators B_READ and B_WRITE to differentiate between read and write operations:
io:::done,io:::start,io:::wait-done,io:::wait-start{ printf("%8s %10s: %d %16s (%s size %d @ sect %d)\n", args[1]->dev_statname, probename, timestamp, execname, args[0]->b_flags & B_READ ? "R" : args[0]->b_flags & B_WRITE ? "W" : "?", args[0]->b_bcount, args[0]->b_blkno);}
2.13.3 Inlines
D named constants can also be defined by using inline directives, which provide a more general meansof creating identifiers that are replaced by predefined values or expressions during compilation. Inlinedirectives are a more powerful form of lexical replacement than the #define directive provided by the Cpreprocessor because the replacement is assigned an actual type and is performed by using the compiledsyntax tree and not simply a set of lexical tokens. An inline directive is specified by using a declarationof the following form:
inline type name = expression;
where type is a type declaration of an existing type, name is any valid D identifier that is not previouslydefined as an inline or global variable, and expression is any valid D expression. After the inline directiveis processed, the D compiler substitutes the compiled form of expression for each subsequent instanceof name in the program source.
For example, the following D program would trace the string "hello" and integer value 123:
inline string hello = "hello";inline int number = 100 + 23;
BEGIN{ trace(hello); trace(number);

Type Namespaces
54
}
An inline name can be used anywhere a global variable of the corresponding type is used. If the inlineexpression can be evaluated to an integer or string constant at compile time, then the inline name can alsobe used in contexts that require constant expressions, such as scalar array dimensions.
The inline expression is validated for syntax errors as part of evaluating the directive. The expression resulttype must be compatible with the type that is defined by the inline, according to the same rules usedfor the D assignment operator (=). An inline expression may not reference the inline identifier itself:recursive definitions are not permitted.
The DTrace software packages install a number of D source files in the system directory /usr/lib64/dtrace/installed-version, which contain inline directives that you can use in your D programs.
For example, the signal.d library includes directives of the following form:
inline int SIGHUP = 1;inline int SIGINT = 2;inline int SIGQUIT = 3;...
These inline definitions provide you with access to the current set of Oracle Linux signal names, asdescribed in the sigaction(2) manual page. Similarly, the errno.d library contains inline directives forthe C errno constants that are described in the errno(3) manual page.
By default, the D compiler includes all of the provided D library files automatically so that you can usethese definitions in any D program.
2.13.4 Type Namespaces
In traditional languages such as ANSI C, type visibility is determined by whether a type is nested inside ofa function or other declaration. Types declared at the outer scope of a C program are associated with asingle global namespace and are visible throughout the entire program. Types that are defined in C headerfiles are typically included in this outer scope. Unlike these languages, D provides access to types frommultiple outer scopes.
D is a language that facilitates dynamic observability across multiple layers of a software stack, includingthe operating system kernel, an associated set of loadable kernel modules, and user processes that arerunning on the system. A single D program can instantiate probes to gather data from multiple kernelmodules or other software entities that are compiled into independent binary objects. Therefore, more thanone data type of the same name, perhaps with different definitions, might be present in the universe oftypes that are available to DTrace and the D compiler. To manage this situation, the D compiler associateseach type with a namespace, which is identified by the containing program object. Types from a particularprogram object can be accessed by specifying the object name and the back quote (`) scoping operator inany type name.
For example, for a kernel module named foo that contains the following C type declaration:
typedef struct bar { int x;} bar_t;
The types struct bar and bar_t could be accessed from D using the following type names:
struct foo`barfoo`bar_t
The back quote operator can be used in any context where a type name is appropriate, including whenspecifying the type for D variable declarations or cast expressions in D probe clauses.

Type Namespaces
55
The D compiler also provides two special, built-in type namespaces that use the names C and D,respectively. The C type namespace is initially populated with the standard ANSI C intrinsic types, suchas int. In addition, type definitions that are acquired by using the C preprocessor (cpp), by running thedtrace -C command, are processed by and added to the C scope. As a result, you can include C headerfiles containing type declarations that are already visible in another type namespace without causing acompilation error.
The D type namespace is initially populated with the D type intrinsics, such as int and string, as wellas the built-in D type aliases, such as uint64_t. Any new type declarations that appear in the D programsource are automatically added to the D type namespace. If you create a complex type such as a structin a D program consisting of member types from other namespaces, the member types are copied into theD namespace by the declaration.
When the D compiler encounters a type declaration that does not specify an explicit namespace using theback quote operator, the compiler searches the set of active type namespaces to find a match by usingthe specified type name. The C namespace is always searched first, followed by the D namespace. If thetype name is not found in either the C or D namespace, the type namespaces of the active kernel modulesare searched in load address order, which does not guarantee any ordering properties among the loadablemodules. To avoid type name conflicts with other kernel modules, you should use the scoping operatorwhen accessing types that are defined in loadable kernel modules.
The D compiler uses the compressed ANSI C debugging information that is provided with the core Linuxkernel modules to automatically access the types that are associated with the operating system sourcecode, without the need to access the corresponding C include files. Note that this symbolic debugginginformation might not be available for all kernel modules on your system. The D compiler reports an errorif you attempt to access a type within the namespace of a module that lacks the compressed C debugginginformation that is intended for use with DTrace.

56

57
Chapter 3 Aggregations
Table of Contents3.1 Aggregation Concepts ................................................................................................................. 573.2 Basic Aggregation Statement ...................................................................................................... 583.3 Aggregation Examples ................................................................................................................ 59
3.3.1 Basic Aggregation ............................................................................................................ 593.3.2 Using Keys ...................................................................................................................... 593.3.3 Using the avg Function .................................................................................................... 613.3.4 Using the stddev Function ................................................................................................ 623.3.5 Using the quantize Function ............................................................................................. 623.3.6 Using the lquantize Function ............................................................................................ 64
3.4 Printing Aggregations .................................................................................................................. 663.5 Data Normalization ..................................................................................................................... 663.6 Clearing Aggregations ................................................................................................................. 693.7 Truncating Aggregations ............................................................................................................. 703.8 Minimizing Drops ........................................................................................................................ 71
When instrumenting the system to answer performance-related questions, it is useful to consider howdata can be aggregated to answer a specific question, rather than thinking in terms of data gathered byindividual probes. For example, if you want to know the number of system calls by user ID, you would notnecessarily care about the datum collected at each system call. In this cae, you simply want to see a tableof user IDs and system calls. Historically, you would answer this question by gathering data at each systemcall and post-processing the data using a tool like awk or perl. Whereas, in DTrace, the aggregating ofdata is a first-class operation. This chapter describes the DTrace facilities for manipulating aggregations.
3.1 Aggregation ConceptsAn aggregating function is one that has the following property:
func(func(x0) U func(x1) U ... U func(xn)) = func(x0 U x1 U ... U xn)
where xn is a set of arbitrary data, which is to say, applying an aggregating function to subsets of thewhole and then applying it again to the results yields the same result as applying it to the whole itself.For example, consider the SUM function, which yields the summation of a given data set. If the raw dataconsists of {2, 1, 2, 5, 4, 3, 6, 4, 2}, the result of applying SUM to the entire set is {29}. Similarly, the result ofapplying SUM to the subset consisting of the first three elements is {5}, the result of applying SUM to the setconsisting of the subsequent three elements is {12}, and the result of applying SUM to the remaining threeelements is also {12}. SUM is an aggregating function because applying it to the set of these results, {5, 12,12}, yields the same result, {29}, as though applying SUM to the original data.
Not all functions are aggregating functions. An example of a non-aggregating function is the MEDIANfunction. This function determines the median element of the set. The median is defined to be that elementof a set for which as many elements in the set are greater than the element, as those that are less thanit. The MEDIAN is derived by sorting the set and selecting the middle element. Returning to the originalraw data, if MEDIAN is applied to the set consisting of the first three elements, the result is {2}. The sortedset is {1, 2, 2}; {2} is the set consisting of the middle element. Likewise, applying MEDIAN to the nextthree elements yields {4} and applying MEDIAN to the final three elements yields {4}. Thus, applyingMEDIAN to each of the subsets yields the set {2, 4, 4}. Applying MEDIAN to this set yields the result {4}.Note that sorting the original set yields {1, 2, 2, 2, 3, 4, 4, 5, 6}. Thus, applying MEDIAN to this set yields{3}. Because these results do not match, MEDIAN is not an aggregating function. Nor is MODE, the mostcommon element of a set.

Basic Aggregation Statement
58
Many common functions that are used to understand a set of data are aggregating functions. Thesefunctions include the following:
• Counting the number of elements in the set.
• Computing the minimum value of the set.
• Computing the maximum value of the set.
• Summing all of the elements in the set.
• Histogramming the values in the set, as quantized into certain bins.
Moreover, some functions, which strictly speaking are not aggregating functions themselves, cannonetheless be constructed as such. For example, average (arithmetic mean) can be constructed byaggregating the count of the number of elements in the set and the sum of all elements in the set, reportingthe ratio of the two aggregates as the final result. Another important example is standard deviation.
Applying aggregating functions to data as it is traced has a number of advantages, including the following:
• The entire data set need not be stored. Whenever a new element is to be added to the set, theaggregating function is calculated, given the set consisting of the current intermediate result and the newelement. When the new result is calculated, the new element can be discarded. This process reducesthe amount of storage that is required by a factor of the number of data points, which is often quite large.
• Data collection does not induce pathological scalability problems. Aggregating functions enableintermediate results to be kept per-CPU instead of in a shared data structure. DTrace then appliesthe aggregating function to the set consisting of the per-CPU intermediate results to produce the finalsystem-wide result.
3.2 Basic Aggregation StatementDTrace stores the results of aggregating functions in objects called aggregations. In D, the syntax for anaggregation is as follows:
@name[ keys ] = aggfunc( args );
The aggregation name is a D identifier that is prefixed with the special character @. All aggregations thatare named in your D programs are global variables. There are no thread-local or clause-local aggregations.The aggregation names are kept in an identifier namespace that is separate from other D global variables.If you reuse names, remember that a and @a are not the same variable. The special aggregation name @can be used to name an anonymous aggregation in simple D programs. The D compiler treats this nameas an alias for the aggregation name @_.
Aggregations are indexed with keys, where keys are a comma-separated list of D expressions, similarto the tuples of expressions used for associative arrays. Keys can also be actions with non-void returnvalues, such as stack, func, sym, mod, ustack, uaddr, and usym.
The aggfunc is one of the DTrace aggregating functions, and args is a comma-separated list ofarguments that is appropriate to that function. The DTrace aggregating functions are described in thefollowing table. Most aggregating functions take just a single argument that represents the new datum.
Table 3.1 DTrace Aggregating Functions
Function Name Arguments Result
count None Number of times called.
sum Scalar expression Total value of the specified expressions.

Aggregation Examples
59
Function Name Arguments Result
avg Scalar expression Arithmetic average of the specifiedexpressions.
min Scalar expression Smallest value among the specifiedexpressions.
max Scalar expression Largest value among the specifiedexpressions.
stddev Scalar expression Standard deviation of the specifiedexpressions.
quantize Scalar expression [, increment] Power-of-two frequency distribution(histogram) of the values of the specifiedexpressions. An optional increment(weight) can be specified.
lquantize Scalar expression, lower bound, upperbound [, step value [, increment]]
Lnear frequency distribution of the valuesof the specified expressions, sized by thespecified range.
Note that the default step value is 1.
llquantize Scalar expression, base, lowerexponent, upper exponent, numberof steps per order of magnitude [,increment]
Log-linear frequency distribution. Thelogarithmic base is specified, along withlower and upper exponents and thenumber of steps per order of magnitude.
3.3 Aggregation Examples
The following is a series of examples that illustrate aggregations.
3.3.1 Basic Aggregation
To count the number of write() system calls in the system, you could use an informative string as a keyand the count aggregating function and save it to file named writes.d:
syscall::write:entry{ @counts["write system calls"] = count();}
The dtrace command prints aggregation results by default when the process terminates, either as theresult of an explicit END action or when you press Ctrl-C. The following example shows the result ofrunning this command, waiting a few seconds, and then pressing Ctrl-C:
# dtrace -s writes.ddtrace: script './writes.d' matched 1 probe^Cwrite system calls 179#
3.3.2 Using Keys
You can count system calls per process name by specifying the execname variable as the key to anaggregation and saving it in a file named writesbycmd.d:
syscall::write:entry
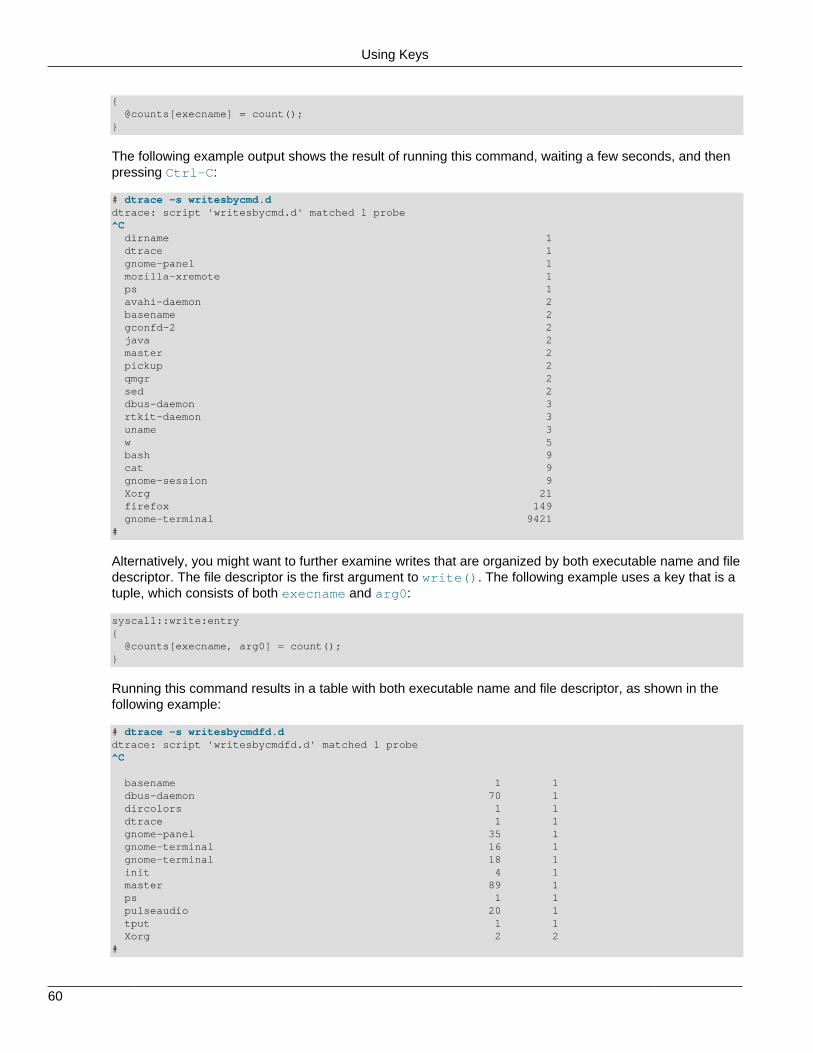
Using Keys
60
{ @counts[execname] = count();}
The following example output shows the result of running this command, waiting a few seconds, and thenpressing Ctrl-C:
# dtrace -s writesbycmd.ddtrace: script 'writesbycmd.d' matched 1 probe^C dirname 1 dtrace 1 gnome-panel 1 mozilla-xremote 1 ps 1 avahi-daemon 2 basename 2 gconfd-2 2 java 2 master 2 pickup 2 qmgr 2 sed 2 dbus-daemon 3 rtkit-daemon 3 uname 3 w 5 bash 9 cat 9 gnome-session 9 Xorg 21 firefox 149 gnome-terminal 9421#
Alternatively, you might want to further examine writes that are organized by both executable name and filedescriptor. The file descriptor is the first argument to write(). The following example uses a key that is atuple, which consists of both execname and arg0:
syscall::write:entry{ @counts[execname, arg0] = count();}
Running this command results in a table with both executable name and file descriptor, as shown in thefollowing example:
# dtrace -s writesbycmdfd.ddtrace: script 'writesbycmdfd.d' matched 1 probe^C
basename 1 1 dbus-daemon 70 1 dircolors 1 1 dtrace 1 1 gnome-panel 35 1 gnome-terminal 16 1 gnome-terminal 18 1 init 4 1 master 89 1 ps 1 1 pulseaudio 20 1 tput 1 1 Xorg 2 2#

Using the avg Function
61
A limited set of actions can be used as aggregation keys. Consider the following use of the mod() andstack() actions:
profile-10{ @hotmod[mod(arg0)] = count(); @hotstack[stack()] = count();}
Here, the hotmod aggregation counts probe firings by module, using the profile probe's arg0 todetermine the kernel program counter. The hotstack aggregation counts probe firings by stack. Theaggregation output reveals which modules and kernel call stacks are the hottest.
3.3.3 Using the avg Function
The following example displays the average time spent in the write() system call, organized by processname. This example uses the avg aggregating function, specifying the expression to average as theargument. The example averages the wall clock time spent in the system call and is saved in a file namedwritetime.d:
syscall::write:entry{ self->ts = timestamp;}
syscall::write:return/self->ts/{ @time[execname] = avg(timestamp - self->ts); self->ts = 0;}
The following output shows the result of running this command, waiting a few seconds, and then pressingCtrl-C:
# dtrace -s writetime.d dtrace: script 'writetime.d' matched 2 probes^C
gnome-session 8260 udisks-part-id 9279 gnome-terminal 9378 mozilla-xremote 10061 abrt-handle-eve 13414 vgdisplay 13459 avahi-daemon 14043 vgscan 14190 uptime 14533 lsof 14903 ip 15075 date 15371 ... ps 91792 sestatus 98374 pstree 102566 sysctl 175427 iptables 192835 udisks-daemon 250405 python 282544 dbus-daemon 491069 lsblk 582138 Xorg 2337328 gconfd-2 17880523 cat 59752284

Using the stddev Function
62
#
3.3.4 Using the stddev Function
Meanwhile, you can use the stddev aggregating function to characterize the distribution of data points.The following example shows the average and standard deviation of the time that it takes to execprocesses. Save it in a file named stddev.d:
syscall::execve:entry{ self->ts = timestamp;}
syscall::execve:return/ self->ts /{ t = timestamp - self->ts; @execavg[probefunc] = avg(t); @execsd[probefunc] = stddev(t); self->ts = 0;}
END{ printf("AVERAGE:"); printa(@execavg); printf("\nSTDDEV:"); printa(@execsd);}
The sample output is as follows:
# dtrace -q -s stddev.d^CAVERAGE: execve 253839
STDDEV: execve 260226
Note
The standard deviation is approximated as √((Σ(x2)/N)-(Σx/N)2), which is animprecise approximation, but should suffice for most purposes to which DTrace isput.
3.3.5 Using the quantize Function
The average and standard deviation can be useful for crude characterization, but often do not providesufficient detail to understand the distribution of data points. To understand the distribution in further detail,use the quantize aggregating function, as shown in the following example, which is saved in a file namedwrquantize.d:
syscall::write:entry{ self->ts = timestamp;}
syscall::write:return/self->ts/{ @time[execname] = quantize(timestamp - self->ts); self->ts = 0;

Using the quantize Function
63
}
Because each line of output becomes a frequency distribution diagram, the output of this script issubstantially longer than previous scripts. The following example shows a selection of sample output:
# dtrace -s wrquantize.d dtrace: script 'wrquantize.d' matched 2 probes^C... bash value ------------- Distribution ------------- count 8192 | 0 16384 |@@@@@@@@@@@@@@@@@@@@@@@@@@@@@@@@ 4 32768 | 0 65536 | 0 131072 |@@@@@@@@ 1 262144 | 0
gnome-terminal value ------------- Distribution ------------- count 4096 | 0 8192 |@@@@@@@@@@@@@ 5 16384 |@@@@@@@@@@@@@ 5 32768 |@@@@@@@@@@@ 4 65536 |@@@ 1 131072 | 0
Xorg value ------------- Distribution ------------- count 2048 | 0 4096 |@@@@@@@ 4 8192 |@@@@@@@@@@@@@ 8 16384 |@@@@@@@@@@@@ 7 32768 |@@@ 2 65536 |@@ 1 131072 | 0 262144 | 0 524288 | 0 1048576 | 0 2097152 |@@@ 2 4194304 | 0
firefox value ------------- Distribution ------------- count 2048 | 0 4096 |@@@ 22 8192 |@@@@@@@@@@@ 90 16384 |@@@@@@@@@@@@@ 107 32768 |@@@@@@@@@ 72 65536 |@@@ 28 131072 | 3 262144 | 0 524288 | 1 1048576 | 1 2097152 | 0
The rows for the frequency distribution are always power-of-two values. Each row indicates a count of thenumber of elements that are greater than or equal to the corresponding value, but less than the next largerrow's value. For example, the previous output shows that firefox had 107 writes, taking between 16,384nanoseconds and 32,767 nanoseconds, inclusive.
The previous example shows the distribution of numbers of write times. You might also be interested inknowing which write times are contributing to the overall run time the most. You can optionally use theincrement argument with the quantize function for this purpose. Note that the default value is 1, butthis argument can be a D expression, as well as have negative values.

Using the lquantize Function
64
The following example shows a modified script:
syscall::write:entry{ self->ts = timestamp;}
syscall::write:return/self->ts/{ self->delta = timestamp - self->ts; @time[execname] = quantize(self->delta, self->delta); self->ts = 0;}
3.3.6 Using the lquantize Function
While quantize is useful for getting quick insight into data, you might want to examine a distributionacross linear values instead. To display a linear value distribution, use the lquantize aggregatingfunction. The lquantize function takes three arguments in addition to a D expression: a lower bound, anupper bound, and an optional step. Note that the default step value is 1.
For example, if you wanted to look at the distribution of writes by file descriptor, a power-of-twoquantization would not be effective. Instead, as shown in the following example, you could use a linearquantization with a small range, which is saved in a file named wrlquantize.d:
syscall::write:entry{ @fds[execname] = lquantize(arg0, 0, 100, 1);}
Note that you could also omit the last argument because 1 is the default step value.
Running this script for several seconds yields a large amount of information. The following example showsa selection of the typical output:
# dtrace -s wrlquantize.ddtrace: script 'wrlquantize.d' matched 1 probe^C ... gnome-session value ------------- Distribution ------------- count 25 | 0 26 |@@@@@@@@@@@@@@@@@@@@@@@@@@@@@@@@@@@@@@@@ 9 27 | 0
gnome-terminal value ------------- Distribution ------------- count 15 | 0 16 |@@ 1 17 | 0 18 | 0 19 | 0 20 | 0 21 |@@@@@@@@ 4 22 |@@ 1 23 |@@ 1 24 | 0 25 | 0 26 | 0 27 | 0 28 | 0 29 |@@@@@@@@@@@@@ 6 30 |@@@@@@@@@@@@@ 6
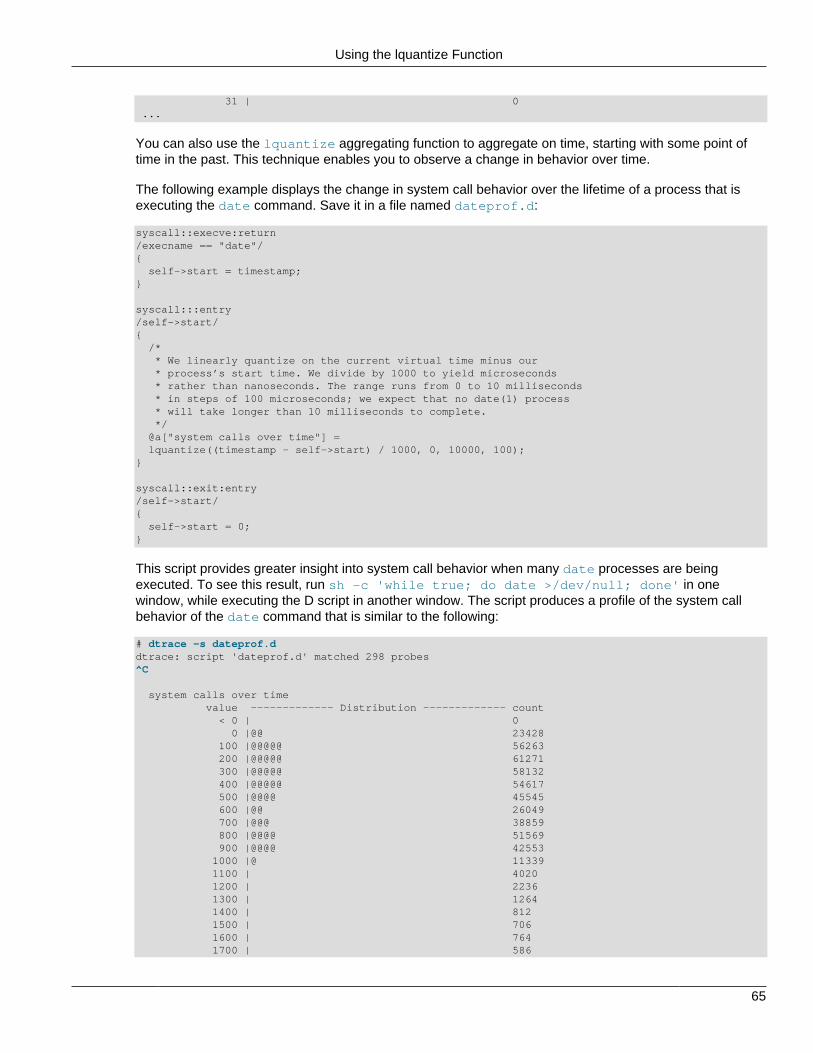
Using the lquantize Function
65
31 | 0 ...
You can also use the lquantize aggregating function to aggregate on time, starting with some point oftime in the past. This technique enables you to observe a change in behavior over time.
The following example displays the change in system call behavior over the lifetime of a process that isexecuting the date command. Save it in a file named dateprof.d:
syscall::execve:return/execname == "date"/{ self->start = timestamp;}
syscall:::entry/self->start/{ /* * We linearly quantize on the current virtual time minus our * process’s start time. We divide by 1000 to yield microseconds * rather than nanoseconds. The range runs from 0 to 10 milliseconds * in steps of 100 microseconds; we expect that no date(1) process * will take longer than 10 milliseconds to complete. */ @a["system calls over time"] = lquantize((timestamp - self->start) / 1000, 0, 10000, 100);}
syscall::exit:entry/self->start/{ self->start = 0;}
This script provides greater insight into system call behavior when many date processes are beingexecuted. To see this result, run sh -c 'while true; do date >/dev/null; done' in onewindow, while executing the D script in another window. The script produces a profile of the system callbehavior of the date command that is similar to the following:
# dtrace -s dateprof.d dtrace: script 'dateprof.d' matched 298 probes^C
system calls over time value ------------- Distribution ------------- count < 0 | 0 0 |@@ 23428 100 |@@@@@ 56263 200 |@@@@@ 61271 300 |@@@@@ 58132 400 |@@@@@ 54617 500 |@@@@ 45545 600 |@@ 26049 700 |@@@ 38859 800 |@@@@ 51569 900 |@@@@ 42553 1000 |@ 11339 1100 | 4020 1200 | 2236 1300 | 1264 1400 | 812 1500 | 706 1600 | 764 1700 | 586

Printing Aggregations
66
1800 | 266 1900 | 155 2000 | 118 2100 | 86 2200 | 93 2300 | 66 2400 | 32 2500 | 32 2600 | 18 2700 | 23 2800 | 26 2900 | 30 3000 | 26 3100 | 1 3200 | 7 3300 | 9 3400 | 3 3500 | 5 3600 | 1 3700 | 6 3800 | 8 3900 | 8 4000 | 8 4100 | 1 4200 | 1 4300 | 6 4400 | 0
The previous output provides a rough idea of the different phases of the date command, with respectto the services that are required of the kernel. To better understand these phases, you might want tounderstand which system calls are being called and when they are called. In this case, you could changethe D script to aggregate on the probefunc variable instead of a constant string.
The log-linear llquantize aggregating function combines the capabilities of both the log and linearfunctions. While the simple quantize function uses base 2 logarithms, with llquantize, you specifythe base, as well as the minimum and maximum exponents. Further, each logarithmic range is subdividedlinearly with a number of steps, as specified.
3.4 Printing Aggregations
By default, multiple aggregations are displayed in the order in which they are introduced in the D program.You can override this behavior by using the printa function to print the aggregations. The printafunction also enables you to precisely format the aggregation data by using a format string, as described inChapter 6, Output Formatting.
If an aggregation is not formatted with a printa statement in your D program, the dtrace commandsnapshots the aggregation data and prints the results after tracing has completed, using the defaultaggregation format. If a given aggregation is formatted with a printa statement, the default behavior isdisabled. You can achieve equivalent results by adding the printa(@aggregation-name) statement toan END probe clause in your program. The default output format for the avg, count, min, max, and sumaggregating functions displays an integer decimal value corresponding to the aggregated value for eachtuple. The default output format for the quantize, lquantize, and llquantize aggregating functionsdisplays an ASCII table with the results. Aggregation tuples are printed as though trace had been appliedto each tuple element.
3.5 Data Normalization
When aggregating data over some period of time, you might want to normalize the data, with respect tosome constant factor. This technique enables you to compare disjointed data more easily. For example,

Data Normalization
67
when aggregating system calls, you might want to output system calls as a per-second rate instead of asan absolute value over the course of the run. The DTrace normalize action enables you to normalizedata in this way. The parameters to normalize are an aggregation and a normalization factor. The outputof the aggregation shows each value divided by the normalization factor.
The following example shows how to aggregate data by system call:
#pragma D option quiet
BEGIN{ /* * Get the start time, in nanoseconds. */ start = timestamp;}
syscall:::entry{ @func[execname] = count();}
END{ /* * Normalize the aggregation based on the number of seconds we have * been running. (There are 1,000,000,000 nanoseconds in one second.) */ normalize(@func, (timestamp - start) / 1000000000);}
Running the previous script for a brief period of time results in the following output:
# dtrace -s normalize.d ^C memballoon 1 udisks-daemon 1 vmstats 1 rtkit-daemon 2 automount 2 gnome-panel 3 gnome-settings- 5 NetworkManager 6 gvfs-afc-volume 6 metacity 6 qpidd 9 hald-addon-inpu 14 gnome-terminal 19 Xorg 35 VBoxClient 52 X11-NOTIFY 104 java 143 dtrace 309 sh 36467 date 68142
The normalize action sets the normalization factor for the specified aggregation, but this action does notmodify the underlying data. The denormalize action takes only an aggregation. Adding the denormalizeaction to the preceding example returns both raw system call counts and per-second rates. Type thefollowing source code and save it in a file named denorm.d:
#pragma D option quiet
BEGIN{
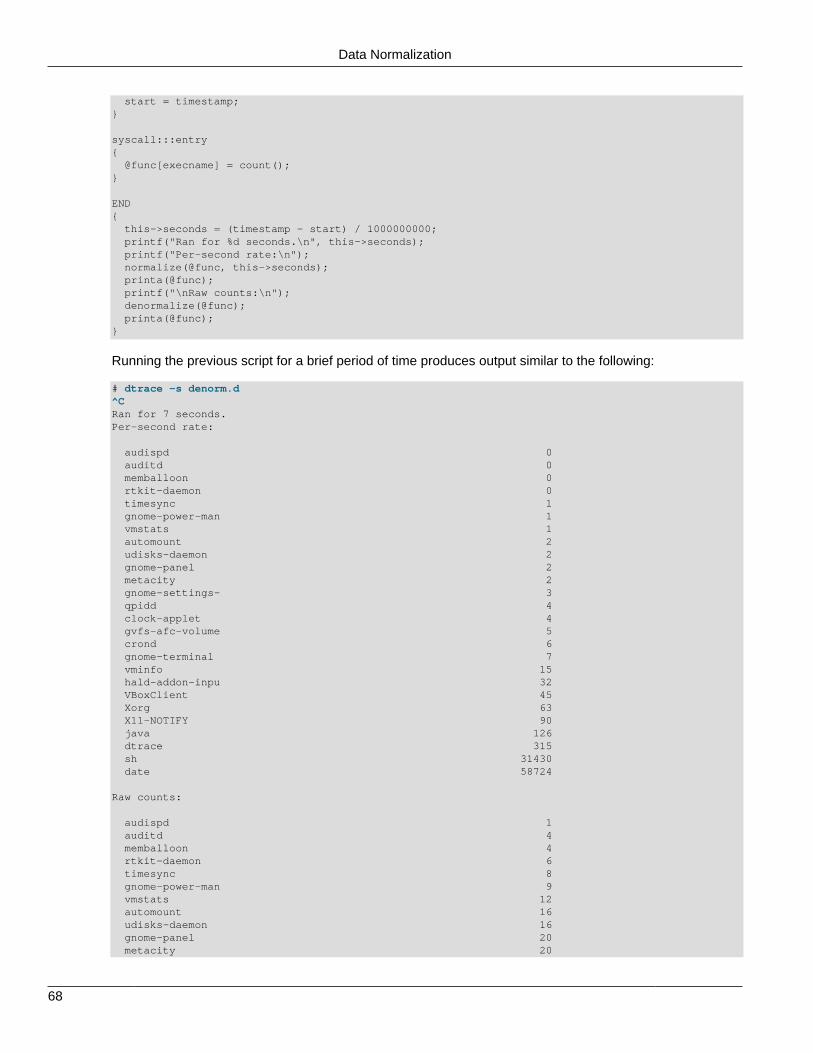
Data Normalization
68
start = timestamp;}
syscall:::entry{ @func[execname] = count();}
END{ this->seconds = (timestamp - start) / 1000000000; printf("Ran for %d seconds.\n", this->seconds); printf("Per-second rate:\n"); normalize(@func, this->seconds); printa(@func); printf("\nRaw counts:\n"); denormalize(@func); printa(@func);}
Running the previous script for a brief period of time produces output similar to the following:
# dtrace -s denorm.d ^CRan for 7 seconds.Per-second rate:
audispd 0 auditd 0 memballoon 0 rtkit-daemon 0 timesync 1 gnome-power-man 1 vmstats 1 automount 2 udisks-daemon 2 gnome-panel 2 metacity 2 gnome-settings- 3 qpidd 4 clock-applet 4 gvfs-afc-volume 5 crond 6 gnome-terminal 7 vminfo 15 hald-addon-inpu 32 VBoxClient 45 Xorg 63 X11-NOTIFY 90 java 126 dtrace 315 sh 31430 date 58724
Raw counts:
audispd 1 auditd 4 memballoon 4 rtkit-daemon 6 timesync 8 gnome-power-man 9 vmstats 12 automount 16 udisks-daemon 16 gnome-panel 20 metacity 20

Clearing Aggregations
69
gnome-settings- 22 qpidd 28 clock-applet 34 gvfs-afc-volume 40 crond 42 gnome-terminal 54 vminfo 105 hald-addon-inpu 225 VBoxClient 318 Xorg 444 X11-NOTIFY 634 java 883 dtrace 2207 sh 220016 date 411073
Aggregations can also be renormalized. If normalize is called more than once for the same aggregation,the normalization factor is the factor specified in the most recent call. The following example displays onlythe per-second system call rates of the top ten system-calling applications in a ten-second period. Type thefollowing source code and save it in a file named truncagg.d:
#pragma D option quiet
BEGIN{ start = timestamp;}
syscall:::entry{ @func[execname] = count();}
tick-10sec{ normalize(@func, (timestamp - start) / 1000000000); printa(@func);}
3.6 Clearing Aggregations
When using DTrace to build simple monitoring scripts, you can periodically clear the values in anaggregation by using the clear function. This function takes an aggregation as its only parameter. Theclear function clears only the aggregation's values, while the aggregation's keys are retained. Therefore,the presence of a key in an aggregation that has an associated value of zero indicates that the key hada non-zero value that was subsequently set to zero as part of a clear. To discard both an aggregation'svalues and its keys, use the trunc function. See Section 3.7, “Truncating Aggregations”.
The following example uses clear to show the system call rate only for the most recent ten-secondperiod:
#pragma D option quiet
BEGIN{ last = timestamp;}
syscall:::entry{ @func[execname] = count();}

Truncating Aggregations
70
tick-10sec{ normalize(@func, (timestamp - last) / 1000000000); printa(@func); clear(@func); last = timestamp;}
3.7 Truncating Aggregations
When looking at aggregation results, you often care only about the top several results. The keys andvalues that are associated with anything other than the highest values are not of interest. You might alsochoose to discard an entire aggregation result, removing both the keys and values. The DTrace truncfunction is used in both of these situations.
The parameters to trunc are an aggregation and an optional truncation value. Without the truncationvalue, trunc discards both the aggregation values and the aggregation keys for the entire aggregation.When a truncation value n is present, trunc discards the aggregation values and keys, except forthose values and keys that are associated with the highest n values. That is to say, trunc(@foo, 10)truncates the aggregation named foo after the top ten values, where trunc(@foo) discards the entireaggregation. The entire aggregation is also discarded if 0 is specified as the truncation value.
To see the bottom n values instead of the top n values, specify a negative truncation value to trunc. Forexample, trunc(@foo, -10) truncates the aggregation named foo after the bottom ten values.
The following example displays only the per-second system call rates of the top ten system-callingapplications in a ten-second period:
#pragma D option quiet
BEGIN{ last = timestamp;}
syscall:::entry{ @func[execname] = count();}
tick-10sec{ trunc(@func, 10); normalize(@func, (timestamp - last) / 1000000000); printa(@func); clear(@func); last = timestamp;}
The following example shows the output from running the previous script on a lightly loaded system:
# dtrace -s truncagg.d
dbus-daemon 0 NetworkManager 1 gmain 1 systemd-logind 1 sendmail 1 systemd 1 httpd 2 tuned 5 dtrace 44

Minimizing Drops
71
rpcbind 0 dbus-daemon 0 gmain 0 sshd 1 systemd-logind 1 sendmail 1 systemd 1 httpd 2 tuned 5 dtrace 41
dbus-daemon 0 gmain 1 sshd 1 systemd-logind 1 sendmail 1 systemd 1 httpd 2 tuned 5 automount 7 dtrace 41^C
#
3.8 Minimizing Drops
Because DTrace buffers some aggregation data in the kernel, space might not be available when a newkey is added to an aggregation. In this case, the data is dropped, the counter is incremented, and dtracegenerates a message indicating an aggregation drop. You should note that this situation rarely occursbecause DTrace keeps state information consisting of the aggregation's key and intermediate results atuser level, where space can grow dynamically. In the unlikely event that an aggregation drop occurs, youcan increase the aggregation buffer size by using the aggsize option, which reduces the likelihood ofdrops.
You can also use this option to minimize the memory footprint of DTrace. As with any size option,aggsize can be specified with any size suffix. The resizing policy of this buffer is dictated by thebufresize option. For more information about buffering, see Chapter 5, Buffers and Buffering.
An alternative method to eliminate aggregation drops is to increase the rate at which aggregation data isconsumed at the user level. This rate defaults to once per second, and may be explicitly tuned with theaggrate option. As with any rate option, aggrate can be specified with any time suffix, but defaults torate-per-second. For more information about the aggsize option, see Chapter 10, Options and Tunables.

72

73
Chapter 4 Actions and Subroutines
Table of Contents4.1 Action Functions ......................................................................................................................... 74
4.1.1 Default Action .................................................................................................................. 744.1.2 Data Recording Actions ................................................................................................... 744.1.3 Destructive Actions .......................................................................................................... 794.1.4 Special Actions ................................................................................................................ 82
4.2 Subroutine Functions .................................................................................................................. 824.2.1 alloca .............................................................................................................................. 834.2.2 basename ....................................................................................................................... 834.2.3 bcopy .............................................................................................................................. 834.2.4 cleanpath ......................................................................................................................... 834.2.5 copyin ............................................................................................................................. 834.2.6 copyinstr .......................................................................................................................... 834.2.7 copyinto ........................................................................................................................... 844.2.8 d_path ............................................................................................................................. 844.2.9 dirname ........................................................................................................................... 844.2.10 getmajor ........................................................................................................................ 844.2.11 getminor ........................................................................................................................ 844.2.12 htonl .............................................................................................................................. 844.2.13 htonll ............................................................................................................................. 854.2.14 htons ............................................................................................................................. 854.2.15 index ............................................................................................................................. 854.2.16 inet_ntoa ....................................................................................................................... 854.2.17 inet_ntoa6 ...................................................................................................................... 854.2.18 inet_ntop ....................................................................................................................... 854.2.19 lltostr ............................................................................................................................. 854.2.20 mutex_owned ................................................................................................................ 864.2.21 mutex_owner ................................................................................................................. 864.2.22 mutex_type_adaptive ...................................................................................................... 864.2.23 mutex_type_spin ............................................................................................................ 864.2.24 ntohl .............................................................................................................................. 864.2.25 ntohll ............................................................................................................................. 864.2.26 ntohs ............................................................................................................................. 864.2.27 progenyof ...................................................................................................................... 864.2.28 rand ............................................................................................................................... 864.2.29 rindex ............................................................................................................................ 874.2.30 rw_iswriter ..................................................................................................................... 874.2.31 rw_read_held ................................................................................................................. 874.2.32 rw_write_held ................................................................................................................. 874.2.33 speculation .................................................................................................................... 874.2.34 strchr ............................................................................................................................. 874.2.35 strjoin ............................................................................................................................ 874.2.36 strlen ............................................................................................................................. 884.2.37 strrchr ............................................................................................................................ 884.2.38 strstr .............................................................................................................................. 884.2.39 strtok ............................................................................................................................. 884.2.40 substr ............................................................................................................................ 88

Action Functions
74
You use D function calls such as trace and printf to invoke two different kinds of services that areprovided by DTrace: actions and subroutines. Actions trace data or modify a state that is external toDTrace, while subroutines affect only the internal DTrace state.
This chapter defines DTrace actions and subroutines and also describes their syntax and semantics.
4.1 Action Functions
Action functions enable your DTrace programs to interact with the system outside of DTrace. The mostcommon actions record data to a DTrace buffer. Other actions are available, such as stopping the currentprocess, raising a specific signal on the current process, and ceasing tracing altogether. Some of theseactions are destructive, in that they change the system, albeit in a well-defined way. These actionsmay only be used if destructive actions have been explicitly enabled. By default, data recording actionsrecord data to the principal buffer. For more information about the principal buffer and buffer policies, seeChapter 5, Buffers and Buffering.
4.1.1 Default Action
A clause can contain any number of actions and variable manipulations. If a clause is left empty, thedefault action is taken. The default action is to trace the enabled probe identifier (EPID) to the principalbuffer. For more information about epid, see Section 2.9.5, “Built-In Variables”. From the EPID, thedtrace command outputs the following information: CPU, probe ID, probe function, and probe name.
The default action facilitates a simple use of the dtrace command. For example, running the followingcommand enables all of the probes in the vmlinux module with the default action:
# dtrace -m vmlinux
The preceding command might produce output similar to the following:
# dtrace -m vmlinuxdtrace: description 'vmlinux' matched 35 probesCPU ID FUNCTION:NAME 0 42 __schedule:sleep 0 34 dequeue_task:dequeue 0 40 __schedule:off-cpu 0 23 finish_task_switch:on-cpu 0 24 enqueue_task:enqueue 0 41 __schedule:preempt 0 40 __schedule:off-cpu 0 23 finish_task_switch:on-cpu 0 11 update_process_times:tick 0 42 __schedule:sleep 0 34 dequeue_task:dequeue 0 40 __schedule:off-cpu 0 23 finish_task_switch:on-cpu 0 24 enqueue_task:enqueue 0 41 __schedule:preempt 0 40 __schedule:off-cpu 0 23 finish_task_switch:on-cpu 0 11 update_process_times:tick 0 12 try_to_wake_up:wakeup 0 42 __schedule:sleep ...
4.1.2 Data Recording Actions
Data recording actions are the core DTrace actions. Each of these actions records data to the principalbuffer by default, but each action can also be used to record data to speculative buffers. See Chapter 5,

Data Recording Actions
75
Buffers and Buffering and Chapter 7, Speculative Tracing for more details on the principal buffer andspeculative buffers.
The following descriptions refer only to the directed buffer, indicating that data is recorded either to theprincipal buffer or to a speculative buffer if the action follows a speculate.
4.1.2.1 freopen
void freopen(string format, ...)
The freopen action changes the file that is associated with stdout to the file that is specified by thearguments in printf fashion.
If the "" string is used, the output is again restored to stdout.
Caution
The freopen action is not only data-recording but also destructive, because youcan use it to overwrite arbitrary files.
4.1.2.2 ftruncate
void ftruncate(void)
The ftruncate action truncates the output stream on stdout.
4.1.2.3 func
_symaddr func(uintptr_t address)
The func action prints the symbol that corresponds to a specified kernel-space address. For example,func((uintptr_t) (&vmlinux`max_pfn)) causes vmlinux`max_pfn to be printed. The funcaction is an alias for sym.
4.1.2.4 mod
_symaddr mod(uintptr_t address)
The mod action prints the name of the module that corresponds to a specified kernel-space address. Forexample, mod((uintptr_t) (&vmlinux`max_pfn)) prints vmlinux.
4.1.2.5 printa
void printa(aggregation)void printa(string format, aggregation)
The printa action enables you to display and format aggregations. See Chapter 3, Aggregations formore details. If format is not specified, printa traces only a directive to the DTrace consumer for whichthe specified aggregation should be processed and is displayed using the default format. If format isspecified, the aggregation is formatted. See Section 6.2, “printa Action” for a detailed description of theprinta format string.
When printa traces only a directive that the aggregation should be processed by the DTrace consumer,it does not process the aggregation in the kernel. Therefore, the time between the tracing of the printadirective and the actual processing of the directive depends on factors that affect buffer processing, whichinclude the following: the aggregation rate, the buffering policy (and if the buffering policy is switching),and the rate at which buffers are switched. See Chapter 3, Aggregations and Chapter 5, Buffers andBuffering for detailed descriptions.
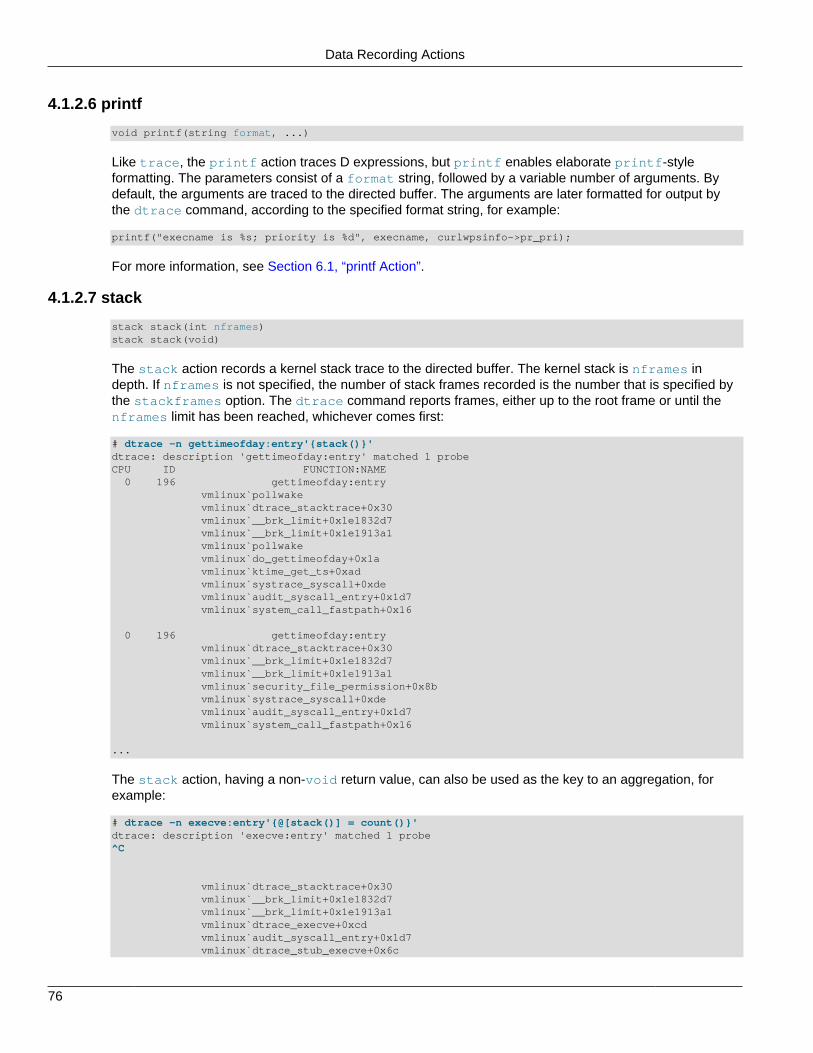
Data Recording Actions
76
4.1.2.6 printf
void printf(string format, ...)
Like trace, the printf action traces D expressions, but printf enables elaborate printf-styleformatting. The parameters consist of a format string, followed by a variable number of arguments. Bydefault, the arguments are traced to the directed buffer. The arguments are later formatted for output bythe dtrace command, according to the specified format string, for example:
printf("execname is %s; priority is %d", execname, curlwpsinfo->pr_pri);
For more information, see Section 6.1, “printf Action”.
4.1.2.7 stack
stack stack(int nframes)stack stack(void)
The stack action records a kernel stack trace to the directed buffer. The kernel stack is nframes indepth. If nframes is not specified, the number of stack frames recorded is the number that is specified bythe stackframes option. The dtrace command reports frames, either up to the root frame or until thenframes limit has been reached, whichever comes first:
# dtrace -n gettimeofday:entry'{stack()}'dtrace: description 'gettimeofday:entry' matched 1 probeCPU ID FUNCTION:NAME 0 196 gettimeofday:entry vmlinux`pollwake vmlinux`dtrace_stacktrace+0x30 vmlinux`__brk_limit+0x1e1832d7 vmlinux`__brk_limit+0x1e1913a1 vmlinux`pollwake vmlinux`do_gettimeofday+0x1a vmlinux`ktime_get_ts+0xad vmlinux`systrace_syscall+0xde vmlinux`audit_syscall_entry+0x1d7 vmlinux`system_call_fastpath+0x16
0 196 gettimeofday:entry vmlinux`dtrace_stacktrace+0x30 vmlinux`__brk_limit+0x1e1832d7 vmlinux`__brk_limit+0x1e1913a1 vmlinux`security_file_permission+0x8b vmlinux`systrace_syscall+0xde vmlinux`audit_syscall_entry+0x1d7 vmlinux`system_call_fastpath+0x16
...
The stack action, having a non-void return value, can also be used as the key to an aggregation, forexample:
# dtrace -n execve:entry'{@[stack()] = count()}'dtrace: description 'execve:entry' matched 1 probe^C
vmlinux`dtrace_stacktrace+0x30 vmlinux`__brk_limit+0x1e1832d7 vmlinux`__brk_limit+0x1e1913a1 vmlinux`dtrace_execve+0xcd vmlinux`audit_syscall_entry+0x1d7 vmlinux`dtrace_stub_execve+0x6c

Data Recording Actions
77
2
vmlinux`dtrace_stacktrace+0x30 vmlinux`__brk_limit+0x1e1832d7 vmlinux`__brk_limit+0x1e1913a1 vmlinux`do_sigaction+0x13a vmlinux`dtrace_execve+0xcd vmlinux`audit_syscall_entry+0x1d7 vmlinux`dtrace_stub_execve+0x6c 13
...
4.1.2.8 sym
_symaddr sym(uintptr_t address)
The sym action prints the symbol that corresponds to a specified kernel-space address. For example,sym((uintptr_t) (&vmlinux`max_pfn)) causes vmlinux`max_pfn to be printed. The sym actionis an alias for func.
4.1.2.9 trace
void trace(expression)
The trace action is the most basic action. This action takes a D expression as its argument and thentraces the result to the directed buffer. The following statements are examples of trace actions:
trace(execname);trace(curlwpsinfo->pr_pri);trace(timestamp / 1000);trace(‘lbolt);trace("somehow managed to get here");
If the trace action is used on a buffer, the output format depends on the data type. If the dtracecommand determines that the data is like an ASCII string, it prints it as text and terminates the output witha null character (0). When dtrace decides that the data is most likely binary, it prints it in hexadecimalformat, for example:
0 342 write:entry 0 1 2 3 4 5 6 7 8 9 a b c d e f 0123456789abcdef 0: c0 de 09 c2 4a e8 27 54 dc f8 9f f1 9a 20 4b d1 ....J.’T..... K. 10: 9c 7a 7a 85 1b 03 0a fb 3a 81 8a 1b 25 35 b3 9a .zz.....:...%5.. 20: f1 7d e6 2b 66 6d 1c 11 f8 eb 40 7f 65 9a 25 f8 .}[email protected].%. 30: c8 68 87 b2 6f 48 a2 a5 f3 a2 1f 46 ab 3d f9 d2 .h..oH.....F.=.. 40: 3d b8 4c c0 41 3c f7 3c cd 18 ad 0d 0d d3 1a 90 =.L.A<.<........
You can force the trace action to always use the binary format by specifying the rawbytes option.
4.1.2.10 tracemem
void tracemem(address, size_t nbytes)void tracemem(address, size_t nbytes, size_t dbytes)
The tracemem action takes a D expression as its first argument, address, and a constant as its secondargument, nbytes. The tracemem action copies the memory from the address specified by address intothe directed buffer for the length specified by nbytes. If only two arguments are provided, dtrace dumpsthe entire contents of the buffer.
In the second format, the tracemem action takes an additional, third argument, dbytes, which is a Dexpression that is computed dynamically. The result is used to limit the number of bytes that are displayed.

Data Recording Actions
78
If the result is less than zero or greater than nbytes, the result is ignored and tracemem behaves asthough it is called by using the two-argument form. Otherwise, dtrace dumps only the dbytes bytes ofthe directed buffer.
4.1.2.11 ustack
Note
If you want to perform symbol lookup in a stripped executable, you must specifythe --export-dynamic option when linking the program. This option causes thelinker to add all symbols to the dynamic symbol table, which is the set of symbolsthat is visible from dynamic objects at run time. If you use gcc to link the objects,specify the option as -Wl,--export-dynamic to pass the correct option to thelinker.
Note also that f you want to look up symbols in shared libraries or unstrippedexecutables, the --export-dynamic option is not required.
DTrace supports the use of the ustack action with both 32-bit and 64-bit binaries, for example:
stack ustack(int nframes, int strsize) stack ustack(int nframes)stack ustack(void)
The ustack action records a user stack trace to the directed buffer. The user stack is nframes in depth.If nframes is not specified, the number of stack frames that is recorded is the number specified by theustackframes option. While ustack is able to determine the address of the calling frames when theprobe fires, the stack frames are not translated into symbols until the ustack action is processed at userlevel by the DTrace consumer. If strsize is specified and is non-zero, ustack allocates the specifiedamount of string space and then uses it to perform address-to-symbol translation directly from the kernel.Such direct user symbol translation is used only with stacktrace helpers that support this usage withDTrace. If such frames cannot be translated, the frames appear only as hexadecimal addresses.
The following example traces a stack with no address-to-symbol translation:
# dtrace -n syscall::write:entry'/pid == $target/{ustack(); exit(0)}' -c "./mytestprog -v"dtrace: description 'syscall::write:entry' matched 1 probemytestprog (Version 1.0)CPU ID FUNCTION:NAME 2 6 write:entry mytestprog`printver+0x2f mytestprog`0x401338 mytestprog`main+0xc7 mytestprog`0x401338 libc.so.6`__libc_start_main+0xfd mytestprog`main mytestprog`0x400ad0 mytestprog`__libc_csu_init mytestprog`0x400ad0 mytestprog`0x400af9
The ustack symbol translation occurs after the stack data is recorded. Therefore, the corresponding userprocess might exit before symbol translation can be performed, making stack frame translation impossible.If the user process exits before symbol translation is performed, dtrace outputs a warning message,followed by the hexadecimal stack frames.
4.1.2.12 uaddr
DTrace supports the use of the uaddr action with both 32-bit and 64-bit binaries.
Destructive Actions
79
_usymaddr uaddr(uintptr_t address)
The uaddr action prints the symbol for a specified address, including hexadecimal offset, which enablesthe same symbol resolution that ustack provides.
4.1.2.13 usym
DTrace supports the use of the usym action with both 32-bit and 64-bit binaries.
_usymaddr usym(uintptr_t address)
The usym action prints the symbol for a specified address, which is analogous to how uaddr works, butwithout the hexadecimal offsets.
4.1.3 Destructive Actions
Some DTrace actions are destructive, in that they change the state of the system in some well-definedway. Destructive actions may not be used unless they have been explicitly enabled. When using dtrace,you enable destructive actions by using the -w option. If you attempt to perform destructive actions withoutexplicitly enabling them, dtrace fails with a message similar to the following:
dtrace: failed to enable 'syscall': destructive actions not allowed
Process-destructive actions are destructive only to a particular process. Whereas, kernel-destructiveactions are destructive to the entire system. Therefore, these actions must be used extremely carefully, assuch actions affect every process on the system and any other system, implicitly or explicitly, dependingupon the affected system's network services.
The following information pertains to both process-destructive and kernel-destructive actions.
4.1.3.1 copyout (Process-Destructive)
void copyout(void *buf, uintptr_t addr, size_t nbytes)
The copyout action copies nbytes from the buffer that is specified by buf to the address that isspecified by addr, in the address space of the process that associated with the current thread. If the user-space address does not correspond to a valid, faulted-in page in the current address space, an error isgenerated.
4.1.3.2 copyoutstr (Process-Destructive)
void copyoutstr(string str, uintptr_t addr, size_t maxlen)
The copyoutstr action copies the string tha tis specified by str to the address that is specified by addrin the address space of the process associated with the current thread. If the user-space address doesnot correspond to a valid, faulted-in page in the current address space, an error is generated. Note thatthe string length is limited to the value that is set by the strsize option. See Chapter 10, Options andTunables.
4.1.3.3 raise (Process-Destructive)
void raise(int signal)
The raise action sends the specified signal to the currently running process. This action is similar to usingthe kill command to send a signal to a process. The raise action can be used to send a signal at aprecise point in the execution of a process.

Destructive Actions
80
4.1.3.4 stop (Process-Destructive)
void stop(void)
The stop action forces the process that is firing the enabled probe to stop when it next leaves the kernel,as if stopped by a proc action. The stop action can be used to stop a process at any DTrace probe point.This action can be used to capture a program in a particular state that would be difficult to achieve with asimple breakpoint and then attach a traditional debugger such as gdb to the process. You can also use thegcore utility to save the state of a stopped process in a core file for later analysis.
4.1.3.5 system (Process-Destructive)
void system(string program, ...)
The system action causes the specified program to be executed as though given to the shell as input.The program string can contain any of the printf or printa format conversions. Arguments that matchthe format conversions must be specified. See Chapter 6, Output Formatting for details on valid formatconversions.
The following example runs the date command once per second:
# dtrace -wqn tick-1sec'{system("date")}'Tue Oct 16 10:21:34 BST 2012Tue Oct 16 10:21:35 BST 2012Tue Oct 16 10:21:36 BST 2012^C#
The following example shows a more elaborate use of the action by using printf conversions in theprogram string, along with traditional filtering tools such as pipes. Type the following source code and saveit in a file named whosend.d:
#pragma D option destructive#pragma D option quiet
proc:::signal-send/args[2] == SIGINT/{ printf("SIGINT sent to %s by ", args[1]->pr_fname); system("getent passwd %d | cut -d: -f5", uid);}
Running the previous script results in output similar to the following:
# dtrace -s whosend.dSIGINT sent to top by rootSIGINT sent to bash by rootSIGINT sent to bash by A Nother^CSIGINT sent to dtrace by root
The execution of the specified command does not occur in the context of the firing probe. Rather, it occurswhen the buffer containing the details of the system action are processed at user level. How and whenthis processing occurs depends on the buffering policy, as described in Chapter 5, Buffers and Buffering.With the default buffering policy, the buffer processing rate is specified by the switchrate option.
You can see the delay that is inherent in system if you explicitly tune the switchrate higher than its one-second default, as shown in the following example. Save it in a file named time.d:
#pragma D option quiet#pragma D option destructive
Destructive Actions
81
#pragma D option switchrate=5sec
tick-1sec/n++ < 5/{ printf("walltime : %Y\n", walltimestamp); printf("date : "); system("date"); printf("\n");}
tick-1sec/n == 5/{ exit(0);}
Running the previous script results in output similar to the following:
# dtrace -s time.dwalltime : 2012 Oct 16 10:26:07date : Tue Oct 16 10:26:11 BST 2012
walltime : 2012 Oct 16 10:26:08date : Tue Oct 16 10:26:11 BST 2012
walltime : 2012 Oct 16 10:26:09date : Tue Oct 16 10:26:11 BST 2012
walltime : 2012 Oct 16 10:26:10date : Tue Oct 16 10:26:11 BST 2012
walltime : 2012 Oct 16 10:26:11date : Tue Oct 16 10:26:11 BST 2012
In the previous output, notice that the walltime values differ, but the date values are identical. Thisresult reflects the fact that the execution of the date command occurred when the buffer was processed,not when the system action was recorded.
4.1.3.6 chill (Kernel-Destructive)
void chill(int nanoseconds)
The chill action causes DTrace to spin for the specified number of nanoseconds. This action is primarilyuseful for exploring problems that might be timing related. For example, you can use this action to openrace condition windows or bring periodic events into or out of phase with one another. Because interruptsare disabled while in DTrace probe context, any use of the chill action results in an interrupt, scheduling,or dispatch latency. Therefore, chill can cause unexpected systemic effects and therefore should notbe used indiscriminately. Because system activity relies on periodic interrupt handling, DTrace refuses toexecute the chill action for more than 500 milliseconds out of each one-second interval on any givenCPU. If the maximum chill interval is exceeded, DTrace reports an illegal operation error:
# dtrace -w -n syscall::openat:entry'{chill(500000001)}'dtrace: allowing destructive actionsdtrace: description 'syscall::openat:entry' matched 1 probe dtrace: 57 errorsCPU ID FUNCTION:NAME dtrace: error on enabled probe ID 1 (ID 14: syscall::openat:entry): \illegal operation in action #1
This limit is enforced even if the time is spread across multiple calls to chill or multiple DTraceconsumers of a single probe. For example, the same error would be generated by running the followingcommand:

Special Actions
82
# dtrace -w -n syscall::openat:entry'{chill(250000000); chill(250000001);}'
4.1.3.7 panic (Kernel-Destructive)
void panic(void)
When triggered, the panic action causes a kernel panic. This action should be used to force a systemcrash dump at a time of interest. You can use this action along with ring buffering to understand a problem.For more information, see Chapter 5, Buffers and Buffering . When the panic action is used, a panicmessage appears denoting the probe that is causing the panic. rsyslogd also emits a message uponreboot. The message buffer of the crash dump contains the probe and event control block (ECB) that isresponsible for the panic action.
4.1.4 Special Actions
The following are special actions that are not data recording actions or destructive actions.
4.1.4.1 Speculative Actions
The actions associated with speculative tracing are speculate, commit, and discard. These actionsare described in more detail in Chapter 7, Speculative Tracing.
4.1.4.2 exit
void exit(int status)
The exit action is used to immediately stop tracing and inform the DTrace consumer that it should do thefollowing: cease tracing, perform any final processing, and call exit() with the specified status value.Because exit returns a status to user level, it is considered a data recording action, However, unlike otherdata storing actions, exit cannot be speculatively traced. The exit action causes the DTrace consumerto exit regardless of buffer policy. Note that because exit is a data recording action, it can be dropped.
When exit is called, only those DTrace actions that are already in progress on other CPUs arecompleted. No new actions occur on any CPU. The only exception to this rule is the processing of theEND probe, which is called after the DTrace consumer has processed the exit action, and indicates thattracing should stop.
4.1.4.3 setopt
void setopt(const char *opt_name)void setopt(const char *opt_name, const char *opt_value)
The setopt action enables you to specify a DTrace option dynamically, for example:
setopt("quiet");setopt("bufsize", "50m");setopt("aggrate", "2hz");
4.2 Subroutine Functions
Subroutine functions differ from actions because they generally only affect the internal DTrace state.Therefore, no destructive subroutines exist. Also, subroutines never trace data into buffers. Manysubroutines have analogs in the application programming interfaces. See the Section 3 manual pages formore details.
A number of these subroutines require temporary buffers, which persist only for duration of the clause. Pre-allocated scratch memory is used for such buffers.

alloca
83
4.2.1 allocavoid *alloca(size_t size)
The alloca function allocates size bytes out of scratch memory, and returns a pointer to the allocatedmemory. The returned pointer is guaranteed to have 8–byte alignment. Scratch memory is only valid forthe duration of a clause. Memory that is allocated with alloca is deallocated when the clause completes.If insufficient scratch memory is available, no memory is allocated and an error is generated.
4.2.2 basenamestring basename(char *str)
The basename function creates a string that consists of a copy of the specified string, but excludes anyprefix that ends in /, such as a directory path. The returned string is allocated out of scratch memory, andis therefore valid only for the duration of the clause. If insufficient scratch memory is available, basenamedoes not execute and an error is generated.
4.2.3 bcopyvoid bcopy(void *src, void *dest, size_t size)
The bcopy function copies size bytes from the memory that is pointed to by src to the memory thatis pointed to by dest. All of the source memory must lie outside of scratch memory, and all of thedestination memory must lie within it. If these conditions are not met, no copying takes place and an erroris generated.
4.2.4 cleanpathstring cleanpath(char *str)
The cleanpath function creates a string consisting of a copy of the path indicated by str, but withcertain redundant elements eliminated. In particular, /./ elements in the path are removed, and /../elements are collapsed. The collapsing of /../ elements in the path occurs without regard to symboliclinks. Therefore, it is possible that cleanpath could take a valid path and return a shorter, invalid path.
For example, if str were “/foo/../bar” and /foo were a symbolic link to /net/foo/export,cleanpath would return the string “/bar”, even though bar might only exist in /net/foo and not in/. This limitation is due to the fact that cleanpath is called in the context of a firing probe, where fullsymbolic link resolution of arbitrary names is not possible. The returned string is allocated out of scratchmemory and is therefore valid only for the duration of the clause. If insufficient scratch memory is available,cleanpath does not execute and an error is generated.
4.2.5 copyinvoid *copyin(uintptr_t addr, size_t size)
The copyin function copies the specified size in bytes from the specified user address (addr) into aDTrace scratch buffer and returns the address of this buffer. The user address is interpreted as an addressin the space of the process that is associated with the current thread. The resulting buffer pointer isguaranteed to have 8-byte alignment. The address in question must correspond to a faulted-in page in thecurrent process. If the address does not correspond to a faulted-in page, or if insufficient scratch memory isavailable, NULL is returned and an error is generated.
4.2.6 copyinstrstring copyinstr(uintptr_t addr)

copyinto
84
string copyinstr(uintptr_t addr, size_t maxlen)
The copyinstr function copies a null-terminated C string from the specified user address (addr) into aDTrace scratch buffer and returns the address of this buffer. The user address is interpreted as an addressin the space of the process that is associated with the current thread. The maxlen parameter, if specified,sets a limit on the number of bytes past addr that are examined (the resulting string is always null-terminated). The resulting string's length is limited to the value set by the strsize option. See Chapter 10,Options and Tunables for details. As with the copyin function, the specified address must correspondto a faulted-in page in the current process. If the address does not correspond to a faulted-in page, or ifinsufficient scratch memory is available, NULL is returned and an error is generated.
4.2.7 copyintovoid copyinto(uintptr_t addr, size_t size, void *dest)
The copyinto function copies the specified size in bytes from the specified user address (addr) intothe DTrace scratch buffer that is specified by dest. The user address is interpreted as an address in thespace of the process that is associated with the current thread. The address in question must correspondto a faulted-in page in the current process. If the address does not correspond to a faulted-in page, orif any of the destination memory lies outside of scratch memory, no copying takes place and an error isgenerated.
4.2.8 d_pathstring d_path(struct path *ptr)
The d_path function creates a string containing the absolute pathname of the struct path that ispointed to by ptr. The returned string is allocated out of scratch memory and is therefore valid only for theduration of the clause. If insufficient scratch memory is available, d_path does not execute and an error isgenerated.
4.2.9 dirnamestring dirname(char *str)
The dirname function creates a string that consists of all but the last level of the pathname that isspecified by str. The returned string is allocated out of scratch memory and is therefore valid only for theduration of the clause. If insufficient scratch memory is available, dirname does not execute and an erroris generated.
4.2.10 getmajordev_t getmajor(dev_t dev)
The getmajor function returns the major device number for the device that is specified by dev.
4.2.11 getminordev_t getminor(dev_t dev)
The getminor function returns the minor device number for the device that is specified by dev.
4.2.12 htonluint32_t htonl(uint32_t hostlong)
The htonl function converts hostlong from host-byte order to network-byte order.

htonll
85
4.2.13 htonlluint64_t htonll(uint64_t hostlonglong)
The htonll function converts hostlonglong from host-byte order to network-byte order.
4.2.14 htonsuint16_t htons(uint16_t hostshort)
The htons function converts hostshort from host-byte order to network-byte order.
4.2.15 indexint index(const char *s, const char *subs)int index(const char *s, const char *subs, int start)
The index function locates the position of the first occurrence of the substring (subs) in the s string,starting at the optional position start. If the specified value of start is less than 0, it is implicitly set to 0.If s is an empty string, index returns 0. If no match is found for subs in s, index returns 1.
4.2.16 inet_ntoastring inet_ntoa(ipaddr_t *addr)
The inet_ntoa function takes a pointer addr to an IPv4 address and returns it as a dotted, quad decimalstring. The returned string is allocated out of scratch memory and is therefore valid only for the durationof the clause. If insufficient scratch memory is available, inet_ntoa does not execute and an error isgenerated.
4.2.17 inet_ntoa6string inet_ntoa6(in6_addr_t *addr)
The inet_ntoa6 function takes a pointer addr to an IPv6 address and returns it as an RFC 1884convention 2 string, with lowercase hexadecimal digits. The returned string is allocated out of scratchmemory and is therefore valid only for the duration of the clause. If insufficient scratch memory is available,inet_ntoa6 does not execute and an error is generated.
4.2.18 inet_ntopstring inet_ntop(int af, void *addr)
The inet_ntop function takes a pointer addr to an IP address and returns a string version that dependson the provided address family. Supported address families are AF_INET and AF_INET6, both of whichare defined for use in D programs. The returned string is allocated out of scratch memory and is thereforevalid only for the duration of the clause. If insufficient scratch memory is available, inet_ntop does notexecute and an error is generated.
4.2.19 lltostrstring lltostr(int64_t longlong)
The lltostr function converts longlong to a string. The returned string is allocated out of scratchmemory and is therefore valid only for the duration of the clause. If insufficient scratch memory is available,lltostr does not execute and an error is generated.

mutex_owned
86
4.2.20 mutex_ownedint mutex_owned(kmutex_t *mutex)
The mutex_owned function returns non-zero if the calling thread currently holds the specified kernelmutex, or zero otherwise.
4.2.21 mutex_ownerkthread_t *mutex_owner(kmutex_t *mutex)
The mutex_owner function returns the thread pointer of the current owner of the specified adaptive kernelmutex. mutex_owner returns NULL if the specified adaptive mutex is currently unowned or if the specifiedmutex is a spin mutex.
4.2.22 mutex_type_adaptiveint mutex_type_adaptive(kmutex_t *mutex)
All mutexes in the Oracle Linux kernel are adaptive, so the mutex_type_adaptive function alwaysreturns 1.
4.2.23 mutex_type_spinint mutex_type_spin(kmutex_t *mutex)
All mutexes in the Oracle Linux kernel are adaptive, so the mutex_type_spin function always returns 0.
4.2.24 ntohluint32_t ntohl(uint32_t netlong)
The ntohl function converts netlong from network-byte order to host-byte order.
4.2.25 ntohlluint64_t ntohll(uint64_t netlonglong)
The ntohll function converts netlonglong from network-byte order to host-byte order.
4.2.26 ntohsuint16_t ntohs(uint16_t netshort)
The ntohs function converts netshort from network-byte order to host-byte order.
4.2.27 progenyofint progenyof(pid_t pid)
The progenyof function returns non-zero if the calling process (the process associated with the threadthat is currently triggering the matched probe) is among the progeny of the specified process ID pid.
4.2.28 randint rand(void)

rindex
87
The rand function returns a pseudo-random integer. Because the number that is returned is a weakpseudo-random number, it therefore should not be used for any cryptographic application.
4.2.29 rindexint rindex(const char *s, const char *subs)int rindex(const char *s, const char *subs, int start)
The rindex function locates the position of the last occurrence of the substring subs in the string s,starting at the optional position, start. If the specified value of start is less than 0, it is implicitly set to 0.If s is an empty string, rindex returns 0. If no match is found for subs in s, rindex returns -1.
4.2.30 rw_iswriterint rw_iswriter(krwlock_t *rwlock)
The rw_iswriter function returns non-zero if the specified reader-writer lock (rwlock) is either held ordesired by a writer. If the lock is held only by readers and no writer is blocked, or if the lock is not held atall, rw_iswriter returns zero.
4.2.31 rw_read_heldint rw_read_held(krwlock_t *rwlock)
The rw_read_held function returns non-zero if the specified reader-writer lock (rwlock) is currently heldby a reader. If the lock is held only by writers or is not held at all, rw_read_held returns zero.
4.2.32 rw_write_heldint rw_write_held(krwlock_t *rwlock)
The rw_write_held function returns non-zero if the specified reader-writer lock (rwlock) is currentlyheld by a writer. If the lock is held only by readers or is not held at all, rw_write_held returns zero.
4.2.33 speculationint speculation(void)
The speculation function reserves a speculative trace buffer for use with speculate and returns anidentifier for this buffer. See Chapter 7, Speculative Tracing for details.
4.2.34 strchrstring strchr(const char *s, char c)
The strchr function returns a pointer to the first occurrence of the character c in the string s. If no matchis found, strstr returns 0. Note that this function does not work with wide characters or multi-bytecharacters.
4.2.35 strjoinstring strjoin(char *str1, char *str2)
The strjoin functon creates a string that consists of str1 concatenated with str2. The returned stringis allocated out of scratch memory and is therefore valid only for the duration of the clause. If insufficientscratch memory is available, strjoin does not execute and an error is generated.

strlen
88
4.2.36 strlensize_t strlen(string str)
The strlen function returns the length of the specified string str in bytes, excluding the terminating nullbyte.
4.2.37 strrchrstring strrchr(const char *s, char c)
The strrchr function returns a pointer to the last occurrence of the character c in the string s. If no matchis found, strrstr returns 0. This function does not work with wide characters or multi-byte characters.
4.2.38 strstrstring strstr(const char *s, const char *subs)
The strstr function returns a pointer to the first occurrence of the substring subs in the string s. If s is anempty string, strstr returns a pointer to an empty string. If no match is found, strstr returns 0.
4.2.39 strtokstring strtok(const char *str, const char *delim)
The strtok function parses a string into a sequence of tokens by using delim as the delimiting string .When you initially call strtok, specify the string to be parsed in str. In each subsequent call to obtainthe next token, specify str as NULL. You can specify a different delimiter for each call. The internal pointerthat strtok uses to traverse str is only valid within multiple enablings of the same probe, meaning itbehaves like an implicit clause-local variable. The strtok function returns NULL if there are no moretokens.
4.2.40 substrstring substr(const char *s, int index)string substr(const char *s, int index, int length)
The substr function returns the substring of the s, string, starting at the index position. If length isspecified, substr limits the substring to that length.

89
Chapter 5 Buffers and Buffering
Table of Contents5.1 Principal Buffers ......................................................................................................................... 895.2 Principal Buffer Policies .............................................................................................................. 89
5.2.1 switch Policy .................................................................................................................... 895.2.2 fill Policy .......................................................................................................................... 905.2.3 fill Policy and END Probes ............................................................................................... 905.2.4 ring Policy ....................................................................................................................... 90
5.3 Other Buffers .............................................................................................................................. 915.4 Buffer Sizes ............................................................................................................................... 915.5 Buffer Resizing Policy ................................................................................................................. 92
Data buffering and management is an essential service that is provided by the DTrace framework for itclients, for example, the dtrace command. This chapter explores data buffering in detail and describesoptions that you can use to change DTrace's buffer management policies.
5.1 Principal Buffers
By default, the principal buffer is present in every DTrace invocation and is the buffer to which tracingactions record their data. These actions include the following: printa, printf, stack, trace, andtracemem.
The principal buffers are always allocated on a per-CPU basis. This policy is not tunable, but you canrestrict tracing and buffer allocation to a single CPU by using the cpu option.
5.2 Principal Buffer Policies
DTrace permits tracing in highly constrained contexts in the kernel. In particular, DTrace permits tracing incontexts in which kernel software might not reliably allocate memory. One consequence of this flexibilityof context is that there always exists a possibility that DTrace might attempt to trace data when there isno space available. DTrace must have a policy to deal with such situations as they arise. However, youmight choose to tune the policy based on the needs of a given experiment. Sometimes the appropriatepolicy might be to discard the new data. Other times, it might be desirable to reuse the space containingthe oldest recorded data to enable the tracing of new data. Most often, the desired policy is to minimizethe likelihood of running out of available space in the first place. To accommodate these varying demands,DTrace supports several different buffer policies. This support is implemented with the bufpolicy optionand can be set on a per-consumer basis. See Chapter 10, Options and Tunables for more details.
5.2.1 switch Policy
By default, the principal buffer has a switch buffer policy. Under this policy, per-CPU buffers are allocatedin pairs, where one buffer is active and the other buffer is inactive. When a DTrace consumer attemptsto read a buffer, the kernel first switches the inactive and active buffers. Buffer switching is done in sucha manner that there is no window in which tracing data can be lost. When the buffers are switched, thenewly inactive buffer is copied out to the DTrace consumer. This policy assures that the consumer alwayssees a self-consistent buffer. Note that a buffer is never simultaneously traced to and copied out. Thistechnique also avoids introducing a window of time in which tracing is paused or otherwise prevented.The rate at which the buffer is switched and read out is controlled by the consumer with the switchrate

fill Policy
90
option. As with any rate option, switchrate can be specified with the any time suffix, but defaults to rate-per-second. For more information about switchrate and other options, see Chapter 10, Options andTunables.
Under the switch policy, if a given enabled probe would trace more data than there is space available inthe active principal buffer, the data is dropped and a per-CPU drop count is incremented. In the event ofone or more drops, dtrace displays a message similar to the following:
dtrace: 11 drops on CPU 0
If a given record is larger than the total buffer size, the record is dropped, regardless of buffer policy. Youcan reduce or eliminate drops, either by increasing the size of the principal buffer with the bufsize option,or by increasing the switching rate with the switchrate option.
Under the switch policy, scratch memory for DTrace subroutines is allocated out of the active buffer.
5.2.2 fill Policy
For some problems, you might want to use a single, in-kernel buffer. While this approach can beimplemented with the switch policy and appropriate D constructs by incrementing a variable in D andpredicating an exit action appropriately, such an implementation does not eliminate the possibility ofdrops. To request a single, large in-kernel buffer and continue tracing until one or more of the per-CPUbuffers has filled, use the fill buffer policy. Under this policy, tracing continues until an enabled probeattempts to trace more data than can fit in the remaining principal buffer space. When insufficient spaceremains, the buffer is marked as filled and the consumer is notified that at least one of its per-CPU buffersis filled. When dtrace detects a single filled buffer, tracing is stopped, all buffers are processed, anddtrace exits. No further data is traced to a filled buffer even if the data would fit in the buffer.
To use the fill policy, set the bufpolicy option to fill. For example, the following command tracesevery system call entry into a per-CPU 2 KB buffer with the buffer policy set to fill:
# dtrace -n syscall:::entry -b 2k -x bufpolicy=fill
5.2.3 fill Policy and END Probes
END probes usually do not fire until tracing has been explicitly stopped by the DTrace consumer. ENDprobes are guaranteed to fire only on one CPU, but the CPU on which the probe fires is undefined. Withfill buffers, tracing is explicitly stopped when at least one of the per-CPU principal buffers has beenmarked as filled. If the fill policy is selected, the END probe might fire on a CPU that has a filled buffer.To accommodate END tracing in fill buffers, DTrace calculates the amount of space that is potentiallyconsumed by END probes and subtracts this space from the size of the principal buffer. If the net size isnegative, DTrace does not start and dtrace outputs the following error message:
dtrace: END enablings exceed size of principal buffer
The reservation mechanism ensures that a full buffer always has sufficient space for any END probes.
5.2.4 ring Policy
The DTrace ring buffer policy assists with tracing the events leading up to a failure. If reproducing thefailure takes hours or days, you might want to keep only the most recent data. When a principal buffer hasfilled, tracing wraps around to the first entry, overwriting older tracing data. You establish the ring buffer byspecifying bufpolicy=ring as follows:
# dtrace -s foo.d -x bufpolicy=ring
Other Buffers
91
When used to create a ring buffer, dtrace does not display any output until the process is terminated. Atthat time, the ring buffer is consumed and processed. The dtrace command processes each ring bufferin CPU order. Within a CPU's buffer, trace records are displayed in order from oldest to youngest. Justas with the switch buffering policy, no ordering exists between records from different CPUs. If such anordering is required, you should trace the timestamp variable as part of your tracing request.
The following example demonstrates the use of a #pragma option directive to enable ring buffering:
#pragma D option bufpolicy=ring#pragma D option bufsize=16k
syscall:::entry/execname == $1/{ trace(timestamp);}
syscall::exit:entry{ exit(0);}
5.3 Other Buffers
Principal buffers exist in every DTrace enabling. Beyond principal buffers, some DTrace consumers mighthave additional in-kernel data buffers, such as an aggregation buffer, and one or more speculative buffers.See Chapter 3, Aggregations and Chapter 7, Speculative Tracing for more details.
5.4 Buffer Sizes
The size of each buffer can be tuned on a per-consumer basis. Separate options are provided to tune eachbuffer size, as shown in the following table.
Buffer Size Option
Aggregation aggsize
Principal bufsize
Speculative specsize
Each of these options is set with a value that denotes the size. As with any size option, the value mighthave an optional size suffix. See Chapter 10, Options and Tunables for more details.
For example, you would set the buffer size to 10 megabytes on the dtrace command line as follows:
# dtrace -P syscall -x bufsize=10m
Alternatively, you can use the -b option with the dtrace command:
# dtrace -P syscall -b 10m
Finally, you can set bufsize by using a pragma, for example:
#pragma D option bufsize=10m
The buffer size that you select denotes the size of the buffer on each CPU. Moreover, for the switchbuffer policy, bufsize denotes the size of each buffer on each CPU. The default buffer size is fourmegabytes.

Buffer Resizing Policy
92
5.5 Buffer Resizing Policy
Occasionally, the system might not have adequate free kernel memory to allocate a buffer of the desiredsize, either because not enough memory is available or because the DTrace consumer has exceededone of the tunable limits that are described in Chapter 10, Options and Tunables. You can configure thepolicy for buffer allocation failure by using the bufresize option, which defaults to auto. Under the autobuffer resize policy, the size of a buffer is halved until a successful allocation occurs. dtrace generates amessage if a buffer, as allocated, is smaller than the requested size, as shown in the following example:
# dtrace -P syscall -b 4gdtrace: description 'syscall' matched 430 probesdtrace: buffer size lowered to 128m ...
Or, a message similar to the following is generated:
# dtrace -P syscall'{@a[probefunc] = count()}' -x aggsize=1gdtrace: description 'syscall' matched 430 probesdtrace: aggregation size lowered to 128m ...
Alternatively, you can require manual intervention after buffer allocation failure by setting bufresize tomanual. Under this policy, an allocation failure prevents DTrace from starting:
# dtrace -P syscall -x bufsize=1g -x bufresize=manualdtrace: description 'syscall' matched 430 probesdtrace: could not enable tracing: Not enough space#
The buffer resizing policy for all buffers (principal, speculative and aggregation) is dictated by thebufresize option.

93
Chapter 6 Output Formatting
Table of Contents6.1 printf Action ................................................................................................................................ 93
6.1.1 Conversion Specifications ................................................................................................ 946.1.2 Flag Specifiers ................................................................................................................. 946.1.3 Width and Precision Specifiers ......................................................................................... 956.1.4 Size Prefixes ................................................................................................................... 956.1.5 Conversion Formats ......................................................................................................... 96
6.2 printa Action ............................................................................................................................... 986.3 trace Default Format ................................................................................................................... 99
DTrace provides the built-in printf and printaformatting functions, which you can use from your Dprograms to format output. The D compiler provides features that are not found in the C library's printf()routine, so be sure to read this chapter even if you are already familiar with printf.
This chapter also discusses the formatting behavior of the trace function and the default output formatthat is used by the dtrace command to display aggregations.
6.1 printf Action
The printf action combines the ability to trace data, as if by the trace function, but with the ability tooutput the data and other text in a specific format that you describe. The printf function directs DTraceto trace the data associated with each argument after the first argument and then format the results usingthe rules described by the first printf argument, known as a format string. The format string is a regularstring that contains any number of format conversions, each beginning with a % character, that describehow to format the corresponding argument. The first conversion in the format string corresponds to thesecond printf argument, the second conversion to the third argument, and so on. All of the text betweenconversions is printed verbatim. The character following the % conversion character describes the format touse for the corresponding argument.
Unlike the C library's printf() function, DTrace's printf function is a built-in function that is recognizedby the D compiler. The D compiler provides several useful services for the DTrace printf function thatare not found in printf(), including the following:
• The D compiler compares the arguments to the conversions in the format string. If an argument's typeis incompatible with the format conversion, the D compiler provides an error message explaining theproblem.
• The D compiler does not require the use of size prefixes with printf format conversions. The Cprintf routine requires that you indicate the size of arguments by adding prefixes such as %ld forlong, or %lld for long long. The D compiler is aware of the size and type of your arguments, sothese prefixes are not required in your D printf statements.
• DTrace provides additional format characters that are useful for debugging and observability. Forexample, the %a format conversion can be used to print a pointer as a symbol name and offset.
To implement these features, you must specify the format string in the DTrace printf function as a stringconstant in your D program. Format strings cannot be dynamic variables of type string.

Conversion Specifications
94
6.1.1 Conversion Specifications
Each conversion specification in the format string is introduced by the % character, after which the followinginformation appears in sequence:
• Zero or more flags (in any order), that modify the meaning of the conversion specification, as describedin Section 6.1.2, “Flag Specifiers”.
• An optional minimum field width. If the converted value has fewer bytes than the field width, the value ispadded with spaces on the left, by default, or on the right, if the left-adjustment flag (-) is specified. Thefield width can also be specified as an asterisk (*), in which case the field width is set dynamically, basedon the value of an additional argument of type int.
• An optional precision specifier that indicates the following:
• The minimum number of digits to appear for the d, i, o, u, x, and X conversions— the field is paddedwith leading zeroes—the number of digits to appear after the radix character for the e, E, and fconversions.
• The maximum number of significant digits for the g and G conversions.
• Or the maximum number of bytes to be printed from a string by the s conversion.
The precision specifier takes the form of a period (.), followed by either an asterisk (*), as described inSection 6.1.3, “Width and Precision Specifiers”, or a decimal digit string.
• An optional sequence of size prefixes that indicate the size of the corresponding argument. Size prefixesare not required in D, but are provided for compatibility with the C printf() function.
• A conversion specifier that indicates the type of conversion to be applied to the argument.
The C printf() function also supports conversion specifications of the form %n$, where n is a decimalinteger. Note that the DTrace printf function does not support this type of conversion specification.
6.1.2 Flag Specifiers
The printf conversion flags are enabled by specifying one or more of the following characters, which canappear in any order, as described in the following table.
Flag Specifier Description
' The integer portion of the result of a decimal conversion (%d, %f, %g, %G, %i,or %u) is formatted with thousands of grouping characters by using the non-monetary grouping character. Some locales, including the POSIX C locale,do not provide non-monetary grouping characters for use with this flag. (Therelevant locale is the locale in which dtrace is running.)
- The result of the conversion is left-justified within the field. The conversion isright-justified if this flag is not specified.
+ The result of signed conversion always begins with a sign (+ or -). If this flag isnot specified, the conversion begins with a sign only when a negative value isconverted.
space If the first character of a signed conversion is not a sign or if a signedconversion results in no characters, a space is placed before the result. If thespace and + flags both appear, the space flag is ignored.

Width and Precision Specifiers
95
Flag Specifier Description
# The value is converted to an alternate form if an alternate form is defined forthe selected conversion. The alternate formats for conversions are describedalong with the corresponding conversion.
0 For d, e, E, f, g, G, i, o, u, x, and X conversions, leading zeroes (following anyindication of sign or base) are used to pad the field width and no space paddingis performed. If the 0 and - flags both appear, the 0 flag is ignored. For d, i, o,u, x and X conversions, if a precision is specified, the 0 flag is ignored. If the 0and ' flags both appear, the grouping characters are inserted before the zeropadding.
6.1.3 Width and Precision Specifiers
The minimum field width can be specified as a decimal-digit string following any flag specifier, in whichcase the field width is set to the specified number of columns. The field width can also be specified asasterisk (*) in which case an additional argument of type int is accessed to determine the field width.
For example, to print an integer x in a field width determined by the value of the int variable w, you wouldwrite the following D statement:
printf("%*d", w, x);
The field width can also be specified with a ? character to indicate that the field width should be set basedon the number of characters required to format an address (in hexadecimal) in the data model of theoperating system kernel. The width is set to 8, if the kernel is using the 32-bit data model, or to 16, if thekernel is using the 64-bit data model. The precision for the conversion can be specified as a decimal digitstring following a period (.), or by an asterisk (*) following a period. If an asterisk is used to specify theprecision, an additional argument of type int before the conversion argument provides the precision. Ifboth width and precision are specified as asterisks, the order of arguments to printf for the conversionshould appear in the following order: width, precision, value.
6.1.4 Size Prefixes
Size prefixes are required in ANSI C programs that use printf() to indicate the size and type of theconversion argument. The D compiler performs this processing for your printf calls automatically, sosize prefixes are not required. Although size prefixes are provided for C compatibility, their use is explicitlydiscouraged in D programs because they bind your code to a particular data model when using derivedtypes.
For example, if a typedef is redefined to different integer base types depending on the data model, it isnot possible to use a single C conversion that works in both data models without explicitly knowing thetwo underlying types and including a cast expression or defining multiple format strings. The D compilersolves this problem automatically by enabling you to omit size prefixes and automatically determining theargument size.
Size prefixes can be placed just prior to the format conversion name and after any flags, widths, andprecision specifiers and are as follows:
• An optional h specifies that a following d, i, o, u, x, or X conversion applies to a short or unsignedshort.
• An optional l specifies that a following d, i, o, u, x, or X conversion applies to a long or unsignedlong.
• An optional ll specifies that a following d, i, o, u, x, or X conversion applies to a long long orunsigned long long.
Conversion Formats
96
• An optional L specifies that a following e, E, f, g, or G conversion applies to a long double.
• An optional l specifies that a following c conversion applies to a wint_t argument, and that a followings conversion character applies to a pointer to a wchar_t argument.
6.1.5 Conversion Formats
Each conversion character sequence results in fetching zero or more arguments. If insufficient argumentsare provided for the format string, if the format string is exhausted and arguments remain, or if anundefined conversion format is specified, then the D compiler issues an appropriate error message. Thefollowing table describes the conversion character sequences.
Conversion Characters Description
a The pointer or uintptr_t argument is printed as a kernel symbol name in theform module'symbol-name, plus an optional hexadecimal byte offset. If thevalue does not fall within the range that is defined by a known kernel symbol,the value is printed as a hexadecimal integer.
A Identical to %a, but is used for user symbols.
c The char, short, or int argument is printed as an ASCII character.
C The char, short, or int argument is printed as an ASCII character if thecharacter is a printable ASCII character. If the character is not a printablecharacter, it is printed by using the corresponding escape sequence, as shownin Table 2.6, “Character Escape Sequences”.
d The char, int, long, long long, or short argument is printed as a decimal(base 10) integer. If the argument is signed, it is printed as a signed value. Ifthe argument is unsigned, it is printed as an unsigned value. This conversionhas the same meaning as i.
e, E The double, float, or long double argument is converted to the style[-]d.ddde[+-]dd, where there is one digit before the radix character andthe number of digits that follow is equal to the precision. The radix characteris non-zero if the argument is non-zero. If the precision is not specified, thedefault precision value is 6. If the precision is 0 and the # flag is not specified,no radix character appears. The E conversion format produces a number with Eintroducing the exponent, instead of e. The exponent always contains at leasttwo digits. The value is rounded up to the appropriate number of digits.
f The double, float, or long double argument is converted to the style[-]ddd.ddd, where the number of digits after the radix character is equal tothe precision specification. If the precision is not specified, the default precisionvalue is 6. If the precision is 0 and the # flag is not specified, no radix characterappears. If a radix character appears, at least one digit appears before it. Thevalue is rounded up to the appropriate number of digits.
g, G The double, float, or long double argument is printed in the style f ore (or in style E in the case of a G conversion character), with the precisionspecifying the number of significant digits. If an explicit precision is 0, it is takenas 1. The style that is used depends on the value converted: style e (or E)is used only if the exponent resulting from the conversion is less than -4, orgreater than or equal to the precision. Trailing zeroes are removed from thefractional part of the result. A radix character appears only if it is followed by adigit. If the # flag is specified, trailing zeroes are not removed from the result.
i The char, int, long, long long, or short argument is printed as a decimal(base 10) integer. If the argument is signed, it is printed as a signed value. If

Conversion Formats
97
Conversion Characters Descriptionthe argument is unsigned, it is printed as an unsigned value. This conversionhas the same meaning as d.
k The stack argument is printed as if by a call to trace() and handles kernel-level stacks. This argument is valid only with printa because stack cannotbe called from a D expression, as a D program context is required.
o The char, int, long, long long, and short argument is printed as anunsigned octal (base 8) integer. Arguments that are signed or unsigned maybe used with this conversion. If the # flag is specified, the precision of the resultis increased to force the first digit of the result to be a zero, if necessary.
p The pointer or uintptr_t argument is printed as a hexadecimal (base 16)integer. D accepts pointer arguments of any type. If the # flag is specified, anon-zero result has 0x prepended to it.
s The argument must be an array of char or a string. Bytes from the array orstring are read up to a terminating null character or the end of the data andinterpreted and printed as ASCII characters. If the precision is not specified,it is taken to be infinite so that all characters up to the first null character areprinted. If the precision is specified, only the portion of the character array thatis displayed in the corresponding number of screen columns is printed. If anargument of type char * is to be formatted, it should be cast to string orprefixed with the D stringof operator to indicate that DTrace should trace thebytes of the string and format them.
S The argument must be an array of char or string. The argument isprocessed as if by the %s conversion, but any ASCII characters that are notprintable are replaced by the corresponding escape sequence, as described inTable 2.6, “Character Escape Sequences”.
u The char, int, long, long long, or short argument is printed as anunsigned decimal (base 10) integer. Arguments that are signed or unsignedcan be used with this conversion. The result is always formatted as unsigned.
wc The int argument is converted to a wide character (wchar_t) and theresulting wide character is printed.
ws The argument must be an array of wchar_t. Bytes from the array are readup to a terminating null character or the end of the data and interpreted andprinted as wide characters. If the precision is not specified, it is taken to beinfinite, so all wide characters up to the first null character are printed. If theprecision is specified, only that portion of the wide character array that isdisplayed in the corresponding number of screen columns is printed.
x, X The char, int, long, long long, or short argument is printed as anunsigned hexadecimal (base 16) integer. Arguments that are signed orunsigned may be used with this conversion. If the x form of the conversion isused, the letter digits abcdef are used. If the X form of the conversion is used,the letter digits ABCDEF are used. If the # flag is specified, a non-zero resulthas 0x (for %x) or 0X (for %X) that is prepended to it.
Y The uint64_t argument is interpreted to be the number of nanoseconds,since 00:00 Universal Coordinated Time, January 1, 1970, and is printed in thefollowing format: "%Y %a %b %e %T %Z". The current number of nanosecondssince 00:00 UTC, January 1, 1970 is available as the walltimestampvariable.

printa Action
98
Conversion Characters Description
% Print a literal % character. No argument is converted. The entire conversionspecification must be %%.
6.2 printa Action
The printa action enables you to format the results of aggregations in a D program. The function isinvoked by using one of following two forms:
printa(@aggregation-name); printa(format-string, @aggregation-name);
If the first form of the function is used, the dtrace command takes a consistent snapshot of theaggregation data and produces output that is equivalent to the default output format used for aggregations.See Chapter 3, Aggregations. If the second form of the function is used, the dtrace command takes aconsistent snapshot of the aggregation data and produces output according to the conversions that arespecified in the format string, according to the following rules:
• The format conversions must match the tuple signature that is used to create the aggregation. Eachtuple element can only appear once. For example, if you aggregate a count by using the following Dstatements:
@a["hello", 123] = count(); @a["goodbye", 456] = count();
Then, you add the D statement printa(format-string, @a) to a probe clause, dtrace takes asnapshot of the aggregation data and produces output as though you entered these statements:
printf(format-string, "hello", 123); printf(format-string, "goodbye", 456);
Then, continue similarly on for each tuple defined in the aggregation.
• Unlike printf, the format string that you use for printa does not need to include all elements of thetuple: you can have a tuple of length 3 and only one format conversion. Therefore, you can omit anytuple keys from your printa output by changing your aggregation declaration to move the keys youwant to omit to the end of the tuple and then omit any corresponding conversion specifiers for them inthe printa format string.
• The aggregation result is included in the output by using the additional @ format flag character, which isonly valid when used with printa. The @ flag can be combined with any appropriate format conversionspecifier. Also, the flag can appear more than once in a format string so that your tuple result canappear anywhere in the output, as well as appear more than once. The set of conversion specifiers thatcan be used with each aggregating function are implied by the aggregating function's result type. Theaggregation result types are listed in the following table.
Aggregation Result Type
avg uint64_t
count uint64_t
llquantize int64_t
lquantize int64_t
max uint64_t
min uint64_t

trace Default Format
99
Aggregation Result Type
quantize int64_t
sum uint64_t
For example, to format the results of avg, you can apply the %d, %i, %o, %u, or %x format conversions. Thequantize, lquantize, and llquantize functions format their results as an ASCII table rather than asa single value.
The following D program shows an example of printa using the profile provider to sample the value ofcaller, then formatting the results as a simple table. Type the following source code and save it in a filenamed printa.d:
profile:::tick-1000{ @myagg[caller] = count();}
END{ printa("%@8u %a\n", @myagg);}
If you use the dtrace command to execute this program, wait a few seconds, then press Ctrl-C. Youshould see output similar to the following:
# dtrace -qs printa.d ^C 1 vmlinux`do_syscall_64+0x2f 1 vmlinux`___bpf_prog_run+0x528 1 vmlinux`page_frag_free+0x3e 1 vmlinux`__legitimize_mnt 1 vmlinux`seq_printf+0x1b 1 vmlinux`selinux_sb_show_options+0x39 1 vmlinux`strchr+0x1f 1 ip6_tables`ip6t_do_table+0xbb 2 vmlinux`__raw_callee_save___pv_queued_spin_unlock+0x10 14 libata`__dta_ata_sff_pio_task_1036+0x9e 12975 vmlinux`native_safe_halt+0x6
6.3 trace Default Format
If you use trace rather than printf to capture data, the dtrace command formats the results by usinga default output format. If the data is 1, 2, 4, or 8 bytes in size, the result is formatted as a decimal integervalue. If the data is any other size, and is a sequence of printable characters if interpreted as a sequenceof bytes, it is printed as an ASCII string. If the data is any other size, and is not a sequence of printablecharacters, it is printed as a series of byte values that is formatted as hexadecimal integers.

100
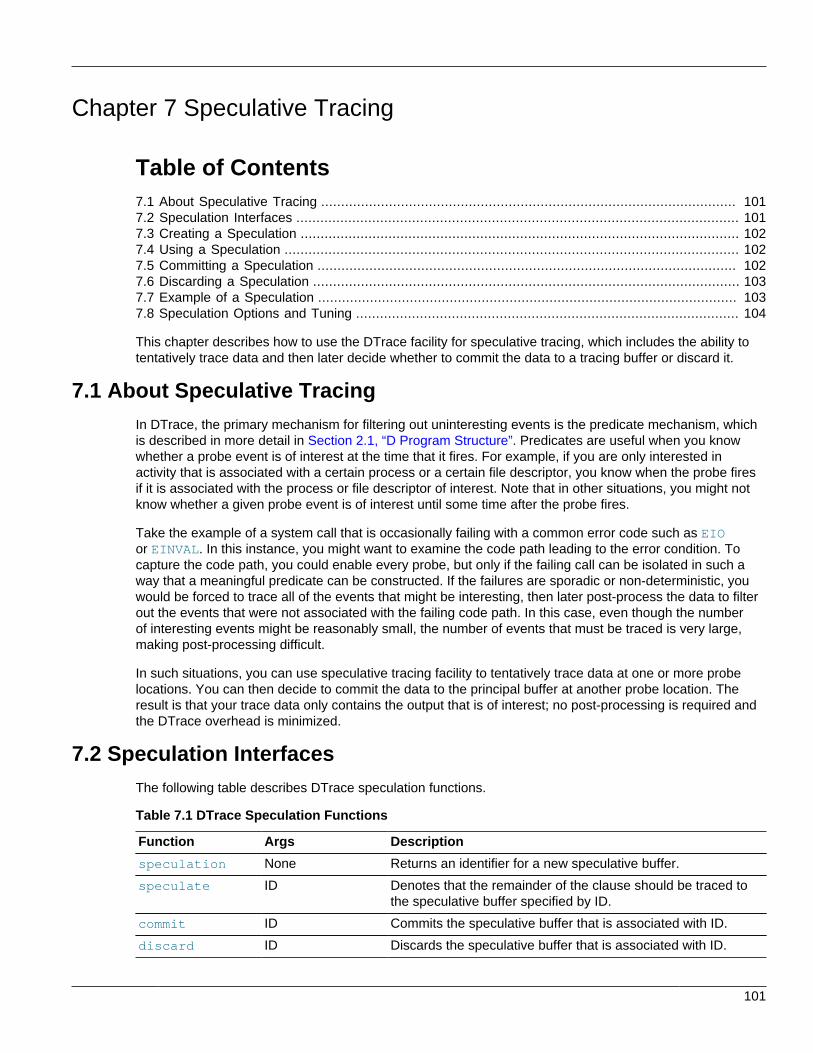
101
Chapter 7 Speculative Tracing
Table of Contents7.1 About Speculative Tracing ........................................................................................................ 1017.2 Speculation Interfaces ............................................................................................................... 1017.3 Creating a Speculation .............................................................................................................. 1027.4 Using a Speculation .................................................................................................................. 1027.5 Committing a Speculation ......................................................................................................... 1027.6 Discarding a Speculation ........................................................................................................... 1037.7 Example of a Speculation ......................................................................................................... 1037.8 Speculation Options and Tuning ................................................................................................ 104
This chapter describes how to use the DTrace facility for speculative tracing, which includes the ability totentatively trace data and then later decide whether to commit the data to a tracing buffer or discard it.
7.1 About Speculative TracingIn DTrace, the primary mechanism for filtering out uninteresting events is the predicate mechanism, whichis described in more detail in Section 2.1, “D Program Structure”. Predicates are useful when you knowwhether a probe event is of interest at the time that it fires. For example, if you are only interested inactivity that is associated with a certain process or a certain file descriptor, you know when the probe firesif it is associated with the process or file descriptor of interest. Note that in other situations, you might notknow whether a given probe event is of interest until some time after the probe fires.
Take the example of a system call that is occasionally failing with a common error code such as EIOor EINVAL. In this instance, you might want to examine the code path leading to the error condition. Tocapture the code path, you could enable every probe, but only if the failing call can be isolated in such away that a meaningful predicate can be constructed. If the failures are sporadic or non-deterministic, youwould be forced to trace all of the events that might be interesting, then later post-process the data to filterout the events that were not associated with the failing code path. In this case, even though the numberof interesting events might be reasonably small, the number of events that must be traced is very large,making post-processing difficult.
In such situations, you can use speculative tracing facility to tentatively trace data at one or more probelocations. You can then decide to commit the data to the principal buffer at another probe location. Theresult is that your trace data only contains the output that is of interest; no post-processing is required andthe DTrace overhead is minimized.
7.2 Speculation InterfacesThe following table describes DTrace speculation functions.
Table 7.1 DTrace Speculation Functions
Function Args Description
speculation None Returns an identifier for a new speculative buffer.
speculate ID Denotes that the remainder of the clause should be traced tothe speculative buffer specified by ID.
commit ID Commits the speculative buffer that is associated with ID.
discard ID Discards the speculative buffer that is associated with ID.

Creating a Speculation
102
7.3 Creating a SpeculationThe speculation function allocates a speculative buffer and returns a speculation identifier. Thespeculation identifier should be used in subsequent calls to the speculate function. Speculative buffersare a finite resource. If no speculative buffer is available when speculation is called, an ID of zero isreturned and a corresponding DTrace error counter is incremented. An ID of zero is always invalid, butit can be passed to the speculate, commit and discard functions. If a call to speculation fails,dtrace generates a message similar to the following:
dtrace: 2 failed speculations (no speculative buffer space available)
The number of speculative buffers defaults to one but can be optionally tuned higher. See Section 7.8,“Speculation Options and Tuning”.
7.4 Using a SpeculationTo use a speculation, an identifier that is returned from speculation must be passed to the speculatefunction in a clause prior to any data-recording actions. All subsequent data-recording actions in a clausecontaining a speculate are speculatively traced. The D compiler generates a compile-time error if acall to speculate follows data-recording actions in a D probe clause. Therefore, clauses might containspeculative tracing or non-speculative tracing requests, but not both.
Aggregating actions, destructive actions, and the exit action may never be speculative. Any attemptto take one of these actions in a clause containing a speculate results in a compile-time error. Also, aspeculate may not follow a speculate. Only one speculation is permitted per clause. A clause thatcontains only a speculate speculatively traces the default action, which is defined to trace only theenabled probe ID. See Chapter 4, Actions and Subroutines for a description of the default action.
Typically, you assign the result of speculation to a thread-local variable and then use that variable asa subsequent predicate to other probes, as well as an argument to speculate, as shown in the followingexample:
syscall::openat:entry{ self->spec = speculation();}
syscall:::/self->spec/{ speculate(self->spec); printf("this is speculative");}
7.5 Committing a SpeculationYou commit speculations by using the commit function. When a speculative buffer is committed, its datais copied into the principal buffer. If there is more data in the specified speculative buffer than there isavailable space in the principal buffer, no data is copied and the drop count for the buffer is incremented.If the buffer has been speculatively traced on more than one CPU, the speculative data on the committingCPU is copied immediately, while speculative data on other CPUs is copied some time after the commit.Thus, some time might elapse between a commit that begins on one CPU, while the data is being copiedfrom speculative buffers to principal buffers on all CPUs. This length of time is guaranteed to be no longerthan the time dictated by the cleaning rate. See Section 7.8, “Speculation Options and Tuning”.
A committing speculative buffer is not made available to subsequent speculation calls until each per-CPU speculative buffer has been completely copied into its corresponding per-CPU principal buffer.

Discarding a Speculation
103
Similarly, subsequent calls to speculate to the committing buffer are silently discarded, and subsequentcalls to commit or discard silently fail. Finally, a clause containing a commit cannot contain a datarecording action. However, a clause can contain multiple commit calls to commit disjoint buffers.
7.6 Discarding a Speculation
You discard speculations by using the discard function. When a speculative buffer is discarded, itscontents are also discarded. If the speculation has only been active on the CPU calling discard, thebuffer is immediately available for subsequent calls to speculation. If the speculation has been activeon more than one CPU, the discarded buffer will be available for subsequent speculation some timeafter the call to discard. The length of time between a discard on one CPU and the buffer being madeavailable for subsequent speculations is guaranteed to be no longer than the time that is dictated by thecleaning rate. If, at the time speculation is called, no buffer is available because all speculative buffersare currently being discarded or committed, dtrace generates a message similar to the following:
dtrace: 905 failed speculations (available buffer(s) still busy)
You can reduce the likelihood of all buffers being unavailable by tuning the number of speculation buffersor the cleaning rate. See Section 7.8, “Speculation Options and Tuning”.
7.7 Example of a Speculation
One potential use for speculations is to highlight a particular code path. The following example shows theentire code path under the open() system call when the call fails. Type the following source code andsave it in a file named specopen.d:
#!/usr/sbin/dtrace -Fs
syscall::open:entry{ /* * The call to speculation() creates a new speculation. If this fails, * dtrace will generate an error message indicating the reason for * the failed speculation(), but subsequent speculative tracing will be * silently discarded. */ self->spec = speculation(); speculate(self->spec);
/* * Because this printf() follows the speculate(), it is being * speculatively traced; it will only appear in the data buffer if the * speculation is subsequently committed. */ printf("%s", copyinstr(arg0));}
syscall::open:return/self->spec/{ /* * To balance the output with the -F option, we want to be sure that * every entry has a matching return. Because we speculated the * open entry above, we want to also speculate the open return. * This is also a convenient time to trace the errno value. */ speculate(self->spec); trace(errno);}
syscall::open:return
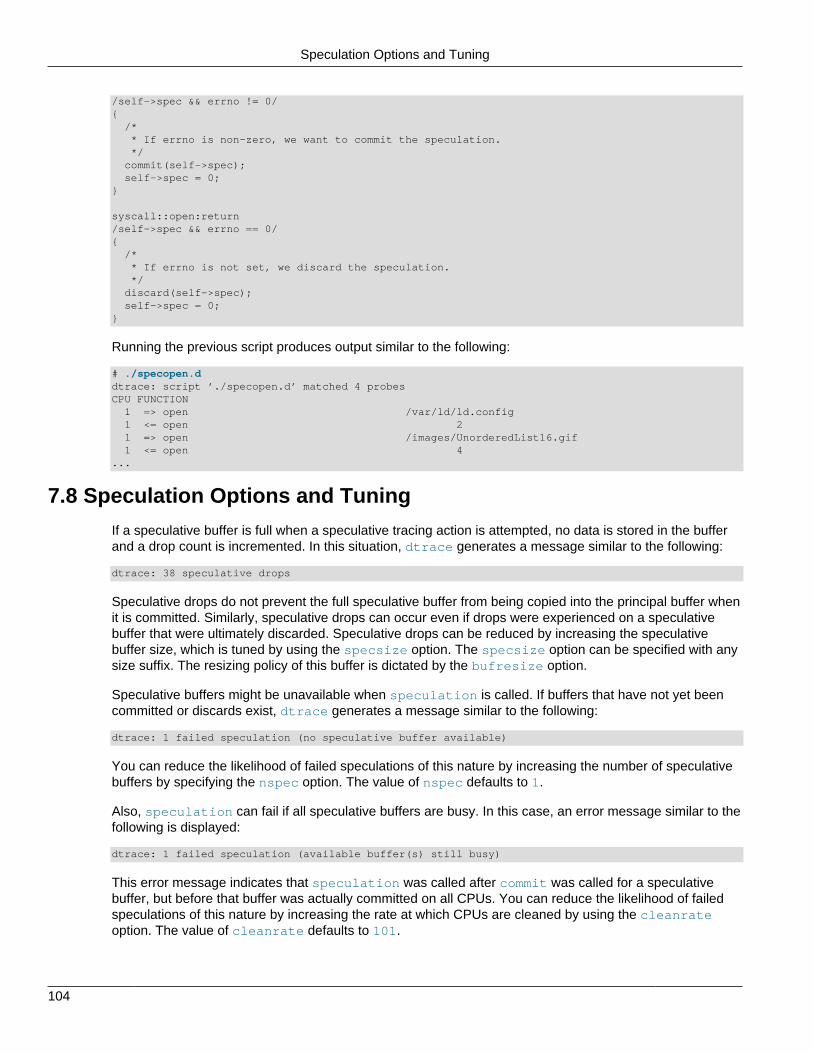
Speculation Options and Tuning
104
/self->spec && errno != 0/{ /* * If errno is non-zero, we want to commit the speculation. */ commit(self->spec); self->spec = 0;}
syscall::open:return/self->spec && errno == 0/{ /* * If errno is not set, we discard the speculation. */ discard(self->spec); self->spec = 0;}
Running the previous script produces output similar to the following:
# ./specopen.ddtrace: script ’./specopen.d’ matched 4 probesCPU FUNCTION 1 => open /var/ld/ld.config 1 <= open 2 1 => open /images/UnorderedList16.gif 1 <= open 4...
7.8 Speculation Options and Tuning
If a speculative buffer is full when a speculative tracing action is attempted, no data is stored in the bufferand a drop count is incremented. In this situation, dtrace generates a message similar to the following:
dtrace: 38 speculative drops
Speculative drops do not prevent the full speculative buffer from being copied into the principal buffer whenit is committed. Similarly, speculative drops can occur even if drops were experienced on a speculativebuffer that were ultimately discarded. Speculative drops can be reduced by increasing the speculativebuffer size, which is tuned by using the specsize option. The specsize option can be specified with anysize suffix. The resizing policy of this buffer is dictated by the bufresize option.
Speculative buffers might be unavailable when speculation is called. If buffers that have not yet beencommitted or discards exist, dtrace generates a message similar to the following:
dtrace: 1 failed speculation (no speculative buffer available)
You can reduce the likelihood of failed speculations of this nature by increasing the number of speculativebuffers by specifying the nspec option. The value of nspec defaults to 1.
Also, speculation can fail if all speculative buffers are busy. In this case, an error message similar to thefollowing is displayed:
dtrace: 1 failed speculation (available buffer(s) still busy)
This error message indicates that speculation was called after commit was called for a speculativebuffer, but before that buffer was actually committed on all CPUs. You can reduce the likelihood of failedspeculations of this nature by increasing the rate at which CPUs are cleaned by using the cleanrateoption. The value of cleanrate defaults to 101.

105
Chapter 8 dtrace Command Reference
Table of Contents8.1 dtrace Command Description .................................................................................................... 1058.2 dtrace Command Options ......................................................................................................... 1058.3 dtrace Command Operands ...................................................................................................... 1098.4 dtrace Command Exit Status ..................................................................................................... 109
The dtrace command is a generic front-end utility for the DTrace facility. The command implements asimple interface to invoke the D language compiler. The dtrace command also has the ability to retrievebuffered trace data from the DTrace kernel facility and a includes a set of basic routines to format and printtraced data. This chapter provides a complete reference for the dtrace command.
8.1 dtrace Command DescriptionThe dtrace command provides a generic interface to all of the essential services that are provided by theDTrace facility, including options to do the following:
• List the set of probes and providers currently published by DTrace.
• Enable probes directly by using any of the probe description specifiers (provider, module, function,name).
• Run the D compiler and compile one or more D program files or programs written directly on thecommand line.
• Generate program stability reports. See Chapter 16, DTrace Stability Features.
• Modify DTrace tracing and buffering behavior and enable additional D compiler features. SeeChapter 10, Options and Tunables.
You can also use the dtrace command to create D scripts by using the command in a #! declaration tocreate an interpreter file. See Chapter 9, Scripting. Finally, you can use the -e option to dtrace to compileD programs and determine their properties without actually enabling any tracing.
8.2 dtrace Command OptionsThe dtrace command accepts the following options:
dtrace [-CeFGhHlqSvVwZ][-b bufsz] [-c command] [-D name[=value]] [-I pathname] [-L pathname][-o pathname] [-p PID] [-s source_pathname][-U name] [-x option[=value]] [-X a|c|s|t][-P provider[[predicate]action]][-m [[provider:]module[[predicate]action]]][-f [[provider:]module:]function[[predicate]action]][-n [[[provider:]module:]function:]name[[predicate]action]][-i probe-id[[predicate]action]]
where predicate is any D predicate enclosed in slashes // and action is any D statement list enclosedin braces {}, according to the D language syntax.
If D program code is provided as an argument to the -P, -m, -f, -n, or -i options, this text must beappropriately quoted to avoid interpretation by the shell.

dtrace Command Options
106
The options are as follows:
-b bufsize Set the principal trace buffer size, which can include anyof the size suffixes k (kilobyte), m (megabyte), g (gigabyte), or t(terabyte). If the buffer space cannot be allocated, dtraceattempts to reduce the buffer size or exits, depending on the setting ofthe bufresize property.
-c command Run the specified command and exit upon its completion. If youspecify more than one -c option, dtrace exits when all of thecommands have exited, and then reports the exit status for each childprocess as it terminates. The dtrace commandmakes the process ID of the first command availableto D programs as the $target macro variable.
-C Run the C preprocessor (cpp) on D programs before compilingthem. You can pass options to the C preprocessor by using the -D, -H, -I, and -U options. Use the -X option to selectthe degree of conformance with the C standard.
-D name[=value] Define the specified macro name and optional valuewhen invoking cpp with the -C option. You can specify the -D option tothe command multiple times.
-e Exit after compiling any requests and before enabling any probes. Youcan combine this option with the -D option to verify that yourD programs compile without executing them or enabling thecorresponding instrumentation.
-f [[provider:]module:]function[[predicate]action]
Specify a function (optionally specifying the provider and module) thatyou want to trace or list. You can append an optional D-probe clause.You can specify the -f option multiple times to the command.
-F Reduce trace output by combining the output for function andsystem call entry and return points. The dtrace command indentsentry probe reports and leaves return probe reports unindented. Thecommand prefixes the output from function entry probe reports with ->and the output from function return probe reports with <-. The dtracecommand prefixes the output from system call entry probe reportswith => and the output from system call return probe reports with <=.
-G Generate an ELF file that contains an embedded D program. Thecommand saves the DTrace probes that are specified in the program byusing a relocatable ELF object that can be linked with another program.If you specify the -o option, dtrace saves the ELF file to the specifiedpath name. If you do not specify the -o option, the ELF file is assignedthe same name as the source file for the D program, except with a.o extension rather than the .s extension. Otherwise, the ELF file issaved with the name d.out.
-h Create a header file based on probe definitions in the file that isspecified as the argument to the -s option. If you specify the -o option,the command saves the header file to the specified path name. If you donot specify the -o option, the header file is assigned the same name asthe source file for the D program, except with a .h extension rather thana .d extension. You should amend the source file of the program to betraced so that it includes this header file.

dtrace Command Options
107
-H Print the path names of included files on stderr when you invoke cppwith the -C option.
-i probe_ID[[predicate]action]
Specify a probe identifier that you want to trace or list. You must specifythe probe ID as a decimal integer, as displayed by dtrace -l. Youcan append an optional D-probe clause. You can specify the -i optionmultiple times to the command.
-I pathname Add the specified directory path to the search path for #include fileswhen you invoke cpp with the -C option. The specified directory isinserted at the head of the default directory list.
-l List probes instead of enabling them. The dtrace command filtersthe list of probes based on the arguments to the -f, -i, -m, -n, -P, and -s options. If no options are specified, the command lists all ofthe probes.
-L pathname Add the specified directory path to the end of the librarysearch path. Use this option to specify the path to DTrace libraries,which contain common definitions for D programs.
-m [[provider:]module[[predicate]action]]
Specify a module that you want to trace or list. You can optionallyspecify the provider. You can append an optional D-probe clause. Youcan specify the -m option multiple times to the command.
-n [[[provider:]module:]function:]name[[predicate]action]
Specify a probe name that you want to trace or list. You can appendan optional D-probe clause. You can optionally specify the provider,module, and function. You can specify the -n option multiple times tothe command.
-o pathname Specify the output file for the -G and -l options, or for traced data.
-p PID Grab a process by specifying its processID, cache its symbol tables, and exit upon its completion. If youspecify more than one -p option, dtrace exits whenall of the processes have exited. In addition, the commandreports the exit status for each process as it terminates. The dtracecommand makes the first process ID that is specified availableto D programs as the macro variable $target.
-P provider['D-probe_clause']
Specify a provider that you want to trace or list. You can append anoptional D-probe clause. You can specify the -P option multiple times tothe command.
-q Set quiet mode. The dtrace command suppressesinformational messages, column headers, CPU ID, probe ID, andadditional newlines. Only the data that is traced and formatted by theprinta(), printf(), and trace() D programstatements is displayed on stdout. This option is equivalent tospecifying #pragma D option quiet in a D program.
-s source_pathname Specify the name of a D program source file to be compiled by thedtrace command, as follows:
• If you specify the -h option, dtrace creates a header file using theprobe definitions in the file.

dtrace Command Options
108
• If you specify the -G option, dtrace generates a relocatable ELFobject that can be linked with another program.
• If you specify the -e option, dtrace compiles the program, but doesnot enable any instrumentation.
• If you specify the -l option, dtrace compilesthe program and lists the set of matching probes, but it does notenable any instrumentation.
• If you do not specify an option, dtrace enables the instrumentationthat is specified by the D program and begins tracing.
-S Show the D compiler intermediate code. The D compiler writes areport of the intermediate code that wasgenerated for each D program to stderr.
-U name Undefine the specified name when invoking cpp with the -C option. Youcan specify the -U option multiple times to the command.
-v Set verbose mode. The dtrace command produces aprogram stability report showing the minimum interface stability anddependency level for any specified D programs.
-V Write the highest D programming interface version that is supported bydtrace to stdout.
The combination -vV adds other version information, such as theversion of the user-space binaries from the dtrace-utils package.
-w Permit destructive actions by D programs. Note that if youdo not specify this option, the command does not compile orenable a D program that contains destructive actions. This option isequivalent to specifying #pragma D option destructive in a Dprogram.
-x option[=value] Enable or modify a DTrace runtime option or D compiler option.
-X a|c|t Include the option -std=gnu99 (conformance with 1999 C standardincluding GNU extensions) when invoking cpp with the -C option.
-Xs Include the option -traditional-cpp (conformance with K&R C)when invoking cpp with the -C option.
Regardless of the -X mode, the following additional C preprocessordefinitions are always specified and valid in all modes:
• __linux
• __unix
• __SVR4
• __`uname -s` (for example, __Linux)
• __SUNW_D=1
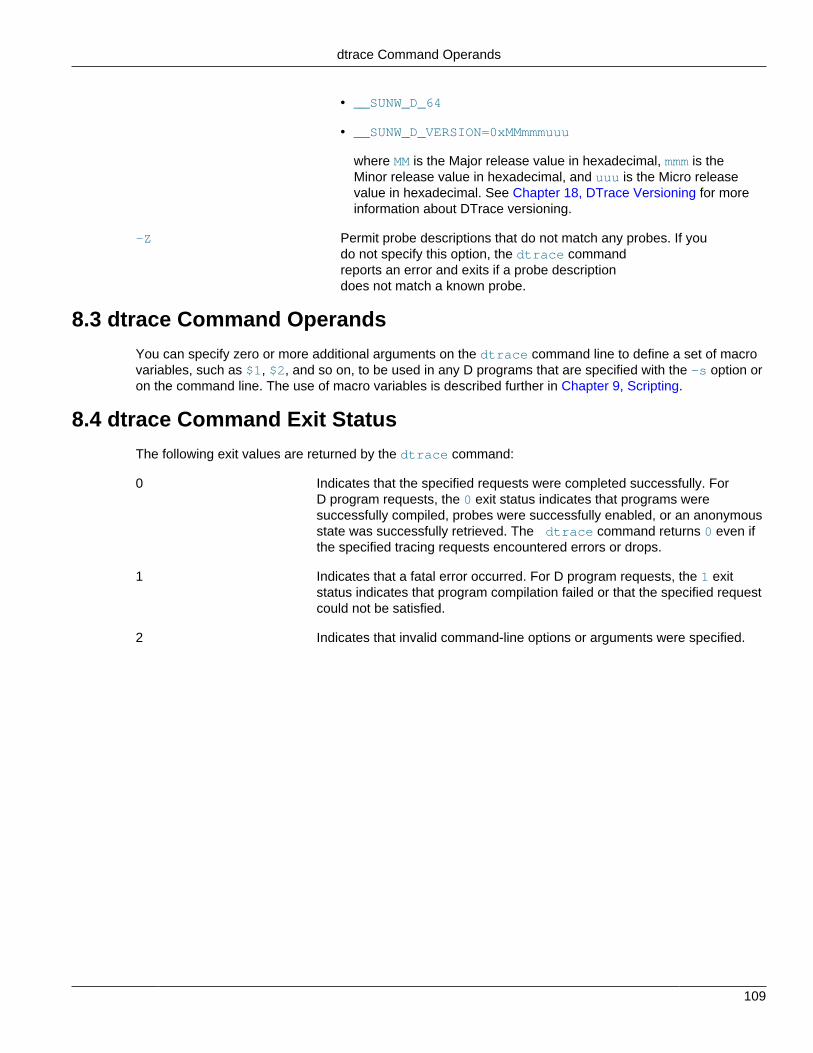
dtrace Command Operands
109
• __SUNW_D_64
• __SUNW_D_VERSION=0xMMmmmuuu
where MM is the Major release value in hexadecimal, mmm is theMinor release value in hexadecimal, and uuu is the Micro releasevalue in hexadecimal. See Chapter 18, DTrace Versioning for moreinformation about DTrace versioning.
-Z Permit probe descriptions that do not match any probes. If youdo not specify this option, the dtrace commandreports an error and exits if a probe descriptiondoes not match a known probe.
8.3 dtrace Command Operands
You can specify zero or more additional arguments on the dtrace command line to define a set of macrovariables, such as $1, $2, and so on, to be used in any D programs that are specified with the -s option oron the command line. The use of macro variables is described further in Chapter 9, Scripting.
8.4 dtrace Command Exit Status
The following exit values are returned by the dtrace command:
0 Indicates that the specified requests were completed successfully. ForD program requests, the 0 exit status indicates that programs weresuccessfully compiled, probes were successfully enabled, or an anonymousstate was successfully retrieved. The dtrace command returns 0 even ifthe specified tracing requests encountered errors or drops.
1 Indicates that a fatal error occurred. For D program requests, the 1 exitstatus indicates that program compilation failed or that the specified requestcould not be satisfied.
2 Indicates that invalid command-line options or arguments were specified.

110

111
Chapter 9 Scripting
Table of Contents9.1 Interpreter Files ........................................................................................................................ 1119.2 Macro Variables ........................................................................................................................ 1129.3 Macro Arguments ..................................................................................................................... 1139.4 Target Process ID .................................................................................................................... 114
You can use the dtrace command to create interpreter files from D programs, which are similar toshell scripts that can be installed as reusable interactive DTrace tools. The D compiler and the dtracecommand provide a set of macro variables that are expanded by the D compiler to make it easy to createDTrace scripts. This chapter provides a reference for the macro variable facility and tips for creatingpersistent scripts.
9.1 Interpreter Files
Similar to your shell and utilities such as awk and perl, you can use the dtrace command to createexecutable interpreter files.
An interpreter file begins with a line of the following form:
#!pathname [arg]
where pathname is the path of the interpreter and arg is a single, optional argument. When an interpreterfile is executed, the system invokes the specified interpreter. If arg was specified in the interpreter file, it ispassed as an argument to the interpreter. The path to the interpreter file and any additional arguments thatwere specified when it was executed are then appended to the interpreter argument list. Therefore, youalways need to create DTrace interpreter files with at least the following arguments:
#!/usr/sbin/dtrace -s
When your interpreter file is executed, the argument to the -s option is the pathname of the interpreterfile. The dtrace command then reads, compiles, and executes this file as if you had typed the followingcommand in your shell:
# dtrace -s interpreter-file
The following example shows how you would create and execute a dtrace interpreter file. First, type thefollowing D source code and save it in a file named interp.d:
#!/usr/sbin/dtrace -sBEGIN{ trace("hello"); exit(0);}
Then, make the interp.d file executable and execute it as follows:
# chmod a+rx interp.d# ./interp.ddtrace: script './interp.d' matched 1 probeCPU ID FUNCTION:NAME 0 1 :BEGIN hello

Macro Variables
112
#
Remember that the #! directive must comprise the first two characters of your file with no intervening orpreceding white space. The D compiler automatically ignores this line when it processes the interpreter file.
The dtrace command uses getopt() to process command-line options so that you can combinemultiple options in your single interpreter argument. For example, to add the -q option to the previousexample you could change the interpreter directive to the following:
#!/usr/sbin/dtrace -qs
Note
If you specify multiple options, the -s option must always end the list of optionsso that the next argument, the interpreter file name, is correctly processed as theargument to the -s option.
If you need to specify more than one option that requires an argument in your interpreter file, use the#pragma D option directive to set your options. Several dtrace command-line options have #pragmaequivalents that you can use. See Chapter 10, Options and Tunables.
9.2 Macro Variables
The D compiler defines a set of built-in macro variables that you can use when writing D programs orinterpreter files. Macro variables are identifiers that are prefixed with a dollar sign ($) and are expandedonce by the D compiler when processing your input file. The following table describes the macro variablesthat the D compiler provides.
Table 9.1 D Macro Variables
Name Description Reference
$[0-9]+ Macro arguments Section 9.3, “Macro Arguments”
$egid Effective group ID See the getegid(2) manual page.
$euid Effective user ID See the geteuid(2) manual page.
$gid Real group ID See the getgid(2) manual page.
$pid Process ID See the getpid(2) manual page.
$pgid Process group ID See the getpgid(2) manual page.
$ppid Parent process ID See the getppid(2) manual page.
$sid Session ID See the getsid(2) manual page.
$target Target process ID Section 9.4, “Target Process ID”
$uid Real user ID See the getuid(2) manual page
With the exception of the $[0-9]+ macro arguments and the $target macro variable, all of the macrovariables expand to integers that correspond to system attributes, such as the process ID and the userID. The variables expand to the attribute value associated with the current dtrace process or whateverprocess is running the D compiler.
Using macro variables in interpreter files enables you to create persistent D programs that you do notneed to edit every time you want to use them. For example, to count all system calls, except those that areexecuted by the dtrace command, you would use the following D program clause containing $pid:
syscall:::entry/pid != $pid/

Macro Arguments
113
{ @calls = count();}
This clause always produces the desired result, even though each invocation of the dtrace command hasa different process ID. Macro variables can be used in a D program anywhere that an integer, identifier, orstring can be used.
Macro variables are expanded only one time when the input file is parsed, not recursively.
Except in probe descriptions, each macro variable is expanded to form a separate input token and cannotbe concatenated with other text to yield a single token.
For example, if $pid expands to the value 456, the D code in the following example would expand to thetwo adjacent tokens 123 and 456, resulting in a syntax error, rather than the single integer token 123456:
123$pid
However, in probe descriptions, macro variables are expanded and concatenated with adjacent text. Forexample, the following clause uses the DTrace pid provider to instrument the dtrace command:
# dtrace -c ./a.out -n 'pid$target:libc.so::entry'
Macro variables are only expanded one time within each probe description field and they may not containprobe description delimiters (:).
9.3 Macro Arguments
The D compiler also provides a set of macro variables corresponding to any additional argument operandsthat are specified as part of the dtrace command invocation. These macro arguments are accessedby using the built-in names $0, for the name of the D program file or dtrace command, $1, for the firstadditional operand, $2 for the second operand, and so on. If you use the -s option, $0 expands to thevalue of the name of the input file that is used with this option. For D programs that are specified on thecommand line, $0 expands to the value of argv[0], which is used to execute the dtrace command itself.
Macro arguments can expand to integers, identifiers, or strings, depending on the form of thecorresponding text. As with all macro variables, macro arguments can be used anywhere integer, identifier,and string tokens can be used in a D program.
All of the following examples could form valid D expressions assuming appropriate macro argumentvalues:
execname == $1 /* with a string macro argument */
x += $1 /* with an integer macro argument */
trace(x->$1) /* with an identifier macro argument */
Macro arguments can be used to create DTrace interpreter files that act like real Linux commands and useinformation that is specified by a user or by another tool to modify their behavior.
For example, the following D interpreter file traces write() system calls that are executed by a particularprocess ID and saved in a file named tracewrite:
#!/usr/sbin/dtrace -s syscall::write:entry/pid == $1/{}

Target Process ID
114
If you make this interpreter file executable, you can specify the value of $1 by using an additionalcommand-line argument to your interpreter file, for example:
# chmod a+rx ./tracewrite# ./tracewrite 12345
The resulting command invocation counts each write() system call that is executed by the process ID12345.
If your D program references a macro argument that is not provided on the command line, an appropriateerror message is printed and your program fails to compile, as shown in the following example:
# ./tracewritedtrace: failed to compile script ./tracewrite: line 4: macro argument $1 is not defined
D programs can reference unspecified macro arguments if you set the defaultargs option. Ifdefaultargs is set, unspecified arguments have the value 0. See Chapter 10, Options and Tunables formore information about D compiler options. The D compiler also produces an error message if additionalarguments that are not referenced by your D program are specified on the command line.
The macro argument values must match the form of an integer, identifier, or string. If the argument doesnot match any of these forms, the D compiler reports an appropriate error message. When specifying stringmacro arguments to a DTrace interpreter file, you should surround the argument in an extra pair of singlequotes to avoid interpretation of the double quotes and string contents by your shell:
# ./foo '"a string argument"'
If you want your D macro arguments to be interpreted as string tokens, even if they match the form of aninteger or identifier, prefix the macro variable or argument name with two leading dollar signs, for example,$$1, which forces the D compiler to interpret the argument value as if it were a string surrounded by doublequotes. All of the usual D string escape sequences, per Table 2.6, “Character Escape Sequences”, areexpanded inside of any string macro arguments, regardless of whether they are referenced by using the$arg or $$arg form of the macro. If the defaultargs option is set, unspecified arguments that arereferenced with the $$arg form have the value of the empty string ("").
9.4 Target Process ID
Use the $target macro variable to create scripts to be applied to the user process of interest that youspecify with the -p option or that you create by using the dtrace command with the -c option. The Dprograms that you specify on the command line or by using the -s option are compiled after processes arecreated or grabbed, and the $target variable expands to the integer process ID of the first such process.
For example, you could use the following D script to determine the distribution of system calls that areexecuted by a particular subject process. Save it in a file named syscall.d:
syscall:::entry/pid == $target/{ @[probefunc] = count();}
To determine the number of system calls executed by the date command, save the script in the file namedsyscall.d, then run the following command:
# dtrace -s syscall.d -c datedtrace: script 'syscall.d' matched 296 probesTue Oct 16 15:12:07 BST 2012

Target Process ID
115
access 1 arch_prctl 1 clock_gettime 1 exit_group 1 getrlimit 1 lseek 1 rt_sigprocmask 1 set_robust_list 1 set_tid_address 1 write 1 futex 2 rt_sigaction 2 brk 3 munmap 3 read 5 open 6 mprotect 7 close 8 newfstat 8 mmap 16

116

117
Chapter 10 Options and Tunables
Table of Contents10.1 Consumer Options .................................................................................................................. 11710.2 Modifying Options ................................................................................................................... 121
To enable customization, DTrace affords its consumers several important degrees of freedom. Tominimize the likelihood of requiring specific tuning, DTrace is implemented with reasonable default valuesand flexible default policies, but situations might arise that require tuning the behavior of DTrace on aconsumer-by-consumer basis. This chapter describes DTrace options and tunables and the interfaces thatyou can use to modify them.
10.1 Consumer OptionsDTrace is tuned by setting or enabling options. The available options for tuning DTrace are described inthe following table. For some options, a corresponding dtrace command-line option is also provided.
Table 10.1 DTrace Consumer Options
Option Name Type Value Description
aggpercpu Compile-time Aggregate per CPU.
See Chapter 3, Aggregations.
aggrate Dynamicruntime
time Rate of aggregation reading.
See Chapter 3, Aggregations.
aggsize Runtime size Aggregation buffer size/
See Chapter 3, Aggregations.
aggsortkey Dynamicruntime
false or true Sort aggregations by key.
See Chapter 3, Aggregations.
aggsortkeypos Dynamicruntime
scalar Number of the aggregation key on which to sort.
See Chapter 3, Aggregations.
aggsortpos Dynamicruntime
scalar Number of the aggregation variable on which to sort
See Chapter 3, Aggregations.
aggsortrev Dynamicruntime
false or true Sort aggregations in reverse order.
See Chapter 3, Aggregations.
amin Compile-time string Stability attribute minimum.
See Section 16.5, “Stability Enforcement”
argref Compile-time Do not require all macro arguments to be used.
bufpolicy Runtime fill, ring, orswitch
Buffer policy.
See Chapter 5, Buffers and Buffering .
bufresize Runtime auto ormanual
Buffer resizing policy.

Consumer Options
118
Option Name Type Value DescriptionSee Chapter 5, Buffers and Buffering .
bufsize Runtime size Principal buffer size (equivalent to the dtrace -b).
See Chapter 5, Buffers and Buffering .
cleanrate Runtime time Cleaning rate.
See Chapter 7, Speculative Tracing.
core Compile-time Enable core dumping by dtrace.
cpp Compile-time Use cpp to pre-process the input file.
cpphdrs Compile-time Specify the -H option to cpp to print the name ofeach header file that is used.
cpppath Compile-time string Specify the path name of cpp.
cpu Runtime scalar CPU on which to enable tracing.
See Chapter 5, Buffers and Buffering.
ctypes Compile-time string Write out Compact Type Format (CTF) definitionsof all C types used in a program at the end of a Dcompilation run.
debug Compile-time Enable DTrace debugging mode (equivalent tosetting the environment variable DTRACE_DEBUG).
defaultargs Compile-time Allow references to unspecified macro arguments.Use 0 as the value for an unspecified argument.
See Chapter 9, Scripting.
define Compile-time string Define a macro name and optional value in the formname[=value]. (equivalent to dtrace -D).
destructive Runtime Allow destructive actions (equivalent to dtrace -w).
See Chapter 4, Actions and Subroutines.
droptags Compile-time Specifies that drop tags are used.
dtypes Compile-time string Write out CTF definitions of all D types that are usedin a program at the end of a D compilation run.
dynvarsize Runtime size Dynamic variable space size.
See Section 2.9, “Variables”.
empty Compile-time Permit compilation of empty D source files.
errtags Compile-time Prefix default error message with error tags.
evaltime Compile-time exec, main,postinit, orpreinit
Control when DTrace starts tracing a new process.For dynamically linked binaries, tracing starts:
exec After exec().
preinit After initializationof the dynamiclinker to load thebinary.

Consumer Options
119
Option Name Type Value Descriptionpostinit (default) After constructor
execution.
main Before main()starts. Same aspostinit.
For statically linked binaries, preinit is equivalentto exec.
For stripped, statically linked binaries, postinitand main are equivalent to preinit.
flowindent Dynamicruntime
Indent function entry and prefix with ->.
Unindent function return and prefix with <-.
Indent system call entry and prefix with =>.
Unindent system call return and prefix with <=.
Equivalent to dtrace -F.
See Chapter 8, dtrace Command Reference.
incdir Compile-time string Add a #include directory to the preprocessorsearch path (equivalent to dtrace -I).
iregs Compile-time scalar Size of the DTrace Intermediate Format (DIF)integer register set. The default value is 8.
kdefs Compile-time Do not permit unresolved kernel symbols.
knodefs Compile-time Permit unresolved kernel symbols.
late Compile-time dynamic orstatic
Specify whether references to dynamic translatorsare permitted:
dynamic Allow referencesto dynamictranslators.
static Requiretranslators to bestatically defined.
lazyload Compile-time false or true Specify that the DTrace Object Format (DOF)should be lazily loaded rather than actively loaded.
ldpath Compile-time string Specify the path of the dynamic linker loader (ld).
libdir Compile-time string Add a library directory to the library search path.
linkmode Compile-time dynamic,kernel, orstatic
Specify the symbol linking mode that is used bythe assembler when processing external symbolreferences:
dynamic All symbolsare treated asdynamic.

Consumer Options
120
Option Name Type Value Descriptionkernel Kernel symbols
are treatedas static anduser symbolsare treated asdynamic.
static All symbols aretreated as static.
linktype Compile-time dof or elf Specify the output file type:
dof Produce astandalone DOFfile.
elf Produce an ELFfile that containsDOF.
modpath Compile-time string Module path. The default path is /lib/modules/version.
nolibs Compile-time Do not process D system libraries.
nspec Runtime scalar Number of speculations.
See Chapter 7, Speculative Tracing.
pgmax Compile-time scalar Limit on the number of threads that DTrace can grabfor tracing. The default value is 8.
preallocate Compile-time scalar Amount of memory to preallocate.
procfspath Compile-time string Path to the procfs file system. The default path is/proc.
pspec Compile-time Interpret ambiguous specifiers as probe names.
quiet Dynamicruntime
Output only explicitly traced data (equivalent todtrace -q).
See Chapter 8, dtrace Command Reference.
quietresize Dynamicruntime
Suppress buffer-resize messages.
See Chapter 5, Buffers and Buffering.
rawbytes Dynamicruntime
Always print trace output in hexadecimal.
See Chapter 4, Actions and Subroutines.
specsize Runtime size Speculation buffer size.
See Chapter 7, Speculative Tracing.
stackframes Runtime scalar Number of stack frames.
See Chapter 4, Actions and Subroutines.
stackindent Dynamicruntime
scalar Number of white space characters to use whenindenting stack and ustack output.

Modifying Options
121
Option Name Type Value DescriptionSee Chapter 4, Actions and Subroutines.
statusrate Runtime time Rate of status checking.
stdc Compile-time a, c, s, or t Specify ISO C conformance settings for thepreprocessor when invoking cpp with the -C option.
The a, c, and t settings include the-std=gnu99option (conformance with 1999 C standard includingGNU extensions).
The s setting includes the -traditional-cppoption (conformance with K&R C).
strip Compile-time Strip non-loadable sections from the program.
strsize Runtime size String size.
See Section 2.11, “DTrace Support for Strings”.
switchrate Dynamicruntime
time Rate of buffer switching.
See Chapter 5, Buffers and Buffering .
syslibdir Compile-time string Path name of system libraries.
tree Compile-time scalar Value of the DTrace tree dump bitmap.
tregs Compile-time scalar Size of the DIF tuple register set. The default valueis 8.
udefs Compile-time Do not permit unresolved user symbols.
undef Compile-time string Undefine a symbol when invoking the preprocessor.Equivalent to dtrace -U.
unodefs Compile-time Permit unresolved user symbols.
ustackframes Runtime scalar Number of user-land stack frames.
See Chapter 4, Actions and Subroutines.
verbose Compile-time DIF verbose mode, which shows each compiled DIFobject (DIFO).
version Compile-time string Request a specific version of the native DTracelibrary.
zdefs Compile-time Permit probe definitions that match zero probes.
Values that denote sizes can be given an optional suffix of k, m, g, or t to denote kilobytes, megabytes,gigabytes, and terabytes, respectively. Values that denote times can be given an optional suffix of ns,us, ms, s or hz to denote nanoseconds, microseconds, milliseconds, seconds, and number per second,respectively.
10.2 Modifying Options
You can set options in a D script by using #pragma D followed by the string option and the option name.If the option takes a value, the option name should be followed by an equal sign (=) and the option value.The following are examples of valid option settings:
#pragma D option nspec=4

Modifying Options
122
#pragma D option bufsize=2g
#pragma D option switchrate=10hz
#pragma D option aggrate=100us
#pragma D option bufresize=manual
The dtrace command also accepts option settings on the command line as an argument to the -x option,for example:
# dtrace -x nspec=4 -x bufsize=2g \-x switchrate=10hz -x aggrate=100us -x bufresize=manual
If an invalid option is specified, dtrace indicates that the option name is invalid and exits, as shown in thefollowing example:
# dtrace -x wombats=25dtrace: failed to set option -x wombats: Invalid option name
Similarly, if a value is not valid for the given option, dtrace indicates that the value is invalid, as shownhere:
# dtrace -x bufsize=100wombatsdtrace: failed to set option -x bufsize: Invalid value for specified option
If an option is set more than once, subsequent settings overwrite earlier settings. Some options can onlybe set. The presence of such an option sets it, and you cannot subsequently unset it.

123
Chapter 11 DTrace Providers
Table of Contents11.1 dtrace Provider ....................................................................................................................... 124
11.1.1 BEGIN Probe ............................................................................................................... 12411.1.2 END Probe .................................................................................................................. 12411.1.3 ERROR Probe ............................................................................................................. 12511.1.4 dtrace Stability ............................................................................................................. 126
11.2 profile Provider ....................................................................................................................... 12611.2.1 profile-n Probes ........................................................................................................... 12711.2.2 tick-n Probes ............................................................................................................... 12711.2.3 profile Probe Arguments ............................................................................................... 12711.2.4 profile Probe Creation .................................................................................................. 12811.2.5 prof Stability ................................................................................................................. 128
11.3 fbt Provider ............................................................................................................................. 12811.3.1 fbt Probes .................................................................................................................... 12911.3.2 fbt Probe Arguments .................................................................................................... 12911.3.3 fbt Examples ................................................................................................................ 12911.3.4 Module Loading and fbt ................................................................................................ 13011.3.5 fbt Stability ................................................................................................................... 130
11.4 syscall Provider ...................................................................................................................... 13011.4.1 syscall Probes .............................................................................................................. 13011.4.2 syscall Probe Arguments .............................................................................................. 13311.4.3 syscall Stability ............................................................................................................ 133
11.5 sdt provider ............................................................................................................................ 13311.5.1 Creating sdt Probes ..................................................................................................... 13311.5.2 sdt Stability .................................................................................................................. 134
11.6 pid Provider ............................................................................................................................ 13511.6.1 Naming pid Probes ...................................................................................................... 13511.6.2 pid Probe Arguments ................................................................................................... 13611.6.3 pid Stability .................................................................................................................. 136
11.7 proc Provider .......................................................................................................................... 13611.7.1 proc Probes ................................................................................................................. 13711.7.2 proc Probe Arguments ................................................................................................. 13811.7.3 proc Examples ............................................................................................................. 14011.7.4 proc Stability ................................................................................................................ 143
11.8 sched Provider ........................................................................................................................ 14311.8.1 sched Probes ............................................................................................................... 14311.8.2 sched Probe Arguments ............................................................................................... 14411.8.3 sched Examples ........................................................................................................... 14511.8.4 sched Stability .............................................................................................................. 156
11.9 io Provider .............................................................................................................................. 15711.9.1 io Probes ..................................................................................................................... 15711.9.2 io Probe Arguments ..................................................................................................... 15711.9.3 io Examples ................................................................................................................. 16011.9.4 io Stability .................................................................................................................... 163
11.10 fasttrap Provider ................................................................................................................... 16311.10.1 fasttrap Probes ........................................................................................................... 16311.10.2 fasttrap Stability ......................................................................................................... 163
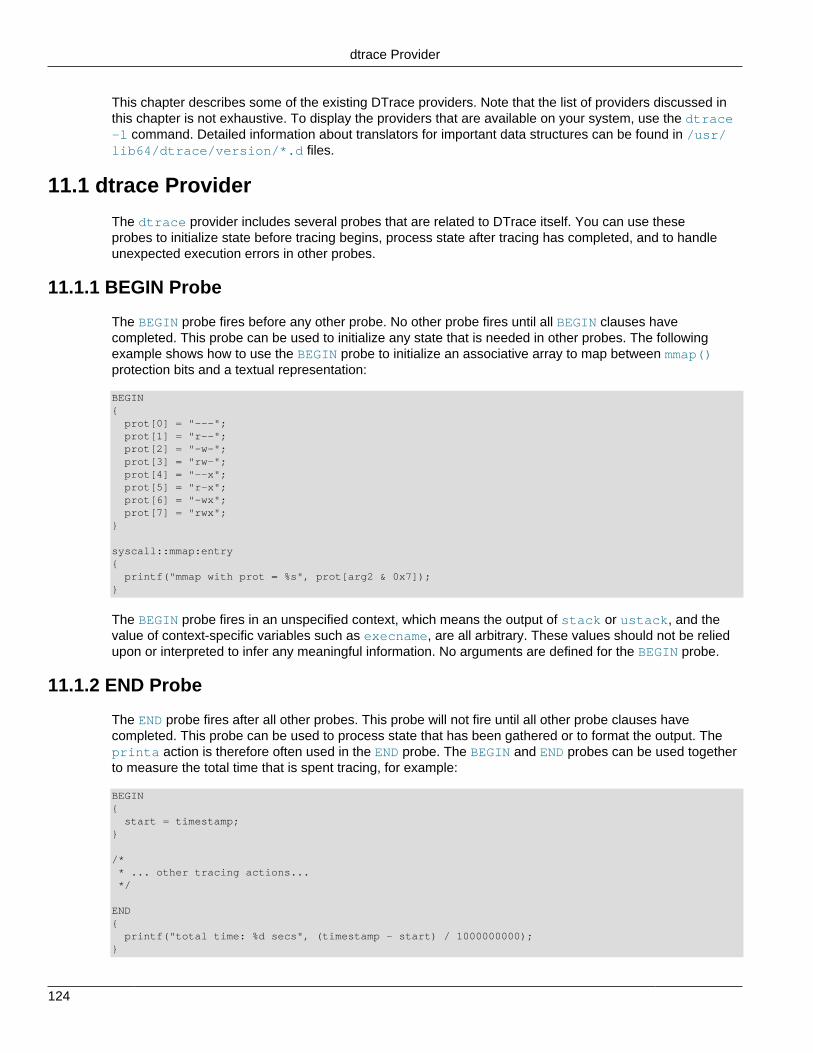
dtrace Provider
124
This chapter describes some of the existing DTrace providers. Note that the list of providers discussed inthis chapter is not exhaustive. To display the providers that are available on your system, use the dtrace-l command. Detailed information about translators for important data structures can be found in /usr/lib64/dtrace/version/*.d files.
11.1 dtrace Provider
The dtrace provider includes several probes that are related to DTrace itself. You can use theseprobes to initialize state before tracing begins, process state after tracing has completed, and to handleunexpected execution errors in other probes.
11.1.1 BEGIN Probe
The BEGIN probe fires before any other probe. No other probe fires until all BEGIN clauses havecompleted. This probe can be used to initialize any state that is needed in other probes. The followingexample shows how to use the BEGIN probe to initialize an associative array to map between mmap()protection bits and a textual representation:
BEGIN{ prot[0] = "---"; prot[1] = "r--"; prot[2] = "-w-"; prot[3] = "rw-"; prot[4] = "--x"; prot[5] = "r-x"; prot[6] = "-wx"; prot[7] = "rwx";}
syscall::mmap:entry{ printf("mmap with prot = %s", prot[arg2 & 0x7]);}
The BEGIN probe fires in an unspecified context, which means the output of stack or ustack, and thevalue of context-specific variables such as execname, are all arbitrary. These values should not be reliedupon or interpreted to infer any meaningful information. No arguments are defined for the BEGIN probe.
11.1.2 END Probe
The END probe fires after all other probes. This probe will not fire until all other probe clauses havecompleted. This probe can be used to process state that has been gathered or to format the output. Theprinta action is therefore often used in the END probe. The BEGIN and END probes can be used togetherto measure the total time that is spent tracing, for example:
BEGIN{ start = timestamp;}
/* * ... other tracing actions... */
END{ printf("total time: %d secs", (timestamp - start) / 1000000000);}

ERROR Probe
125
See Section 3.5, “Data Normalization” and Section 6.2, “printa Action” for other common uses of the ENDprobe.
As with the BEGIN probe, no arguments are defined for the END probe. The context in which the END probefires is arbitrary and should not be depended upon.
When tracing with the bufpolicy option set to fill, adequate space is reserved to accommodate anyrecords that are traced in the END probe. See Section 5.2.3, “fill Policy and END Probes” for details.
Note
The exit action causes tracing to stop and the END probe to fire. However, thereis some delay between the invocation of the exit action and when the END probefires. During this delay, no probes will fire. After a probe invokes the exit action,the END probe is not fired until the DTrace consumer determines that exit hasbeen called and stops tracing. The rate at which the exit status is checked can beset by using statusrate option. For more information, see Chapter 10, Optionsand Tunables.
11.1.3 ERROR Probe
The ERROR probe fires when a runtime error occurs during the execution of a clause for a DTrace probe.As shown in the following example, if a clause attempts to dereference a NULL pointer, the ERROR probefires. Save it in a file named error.d:
BEGIN{ *(char *)NULL;}
ERROR{ printf("Hit an error!");}
When you run this program, output similar to the following is displayed:
# dtrace -s error.d dtrace: script 'error.d' matched 2 probesCPU ID FUNCTION:NAME 1 3 :ERROR Hit an error!dtrace: error on enabled probe ID 1 (ID 1: dtrace:::BEGIN):invalid address (0x0) in action #1 at DIF offset 16^C
The previous output indicates that the ERROR probe fired and that dtrace reported the error. dtrace hasits own enabling of the ERROR probe so that it can report errors. Using the ERROR probe, you can createyour own custom error handling.
The arguments to the ERROR probe are described in the following table.
Argument Description
arg1 The enabled probe identifier (EPID) of the probe that caused the error.
arg2 The index of the action that caused the fault.
arg3 The DIF offset into the action or -1 if not applicable.
arg4 The fault type.
arg5 Value that is particular to the fault type.

dtrace Stability
126
The following table describes the various fault types that can be specified in arg4 and the values thatarg5 can take for each fault type.
arg4 Value Description arg5 Meaning
DTRACEFLT_UNKNOWN Unknown fault type None
DTRACEFLT_BADADDR Access to unmapped or invalidaddress
Address accessed
DTRACEFLT_BADALIGN Unaligned memory access Address accessed
DTRACEFLT_ILLOP Illegal or invalid operation None
DTRACEFLT_DIVZERO Integer divide by zero None
DTRACEFLT_NOSCRATCH Insufficient scratch memory tosatisfy scratch allocation
None
DTRACEFLT_KPRIV Attempt to access a kerneladdress or property withoutsufficient privileges
Address accessed or 0 if notapplicable
DTRACEFLT_UPRIV Attempt to access a user addressor property without sufficientprivileges
Address accessed or 0 if notapplicable
DTRACEFLT_TUPOFLOW DTrace internal parameter stackoverflow
None
DTRACEFLT_BADSTACK Invalid user process stack Address of invalid stack pointer
If the actions that are taken in the ERROR probe cause an error, that error is silently dropped. The ERRORprobe is not recursively invoked.
11.1.4 dtrace Stability
The dtrace provider uses DTrace's stability mechanism to describe its stabilities. These values are listedin the following table.
Element Name Stability Data Stability Dependency Class
Provider Stable Stable Common
Module Private Private Unknown
Function Private Private Unknown
Name Stable Stable Common
Arguments Stable Stable Common
For more information about the stability mechanism, see Chapter 16, DTrace Stability Features.
11.2 profile Provider
The profile provider includes probes that are associated with an interrupt that fires at some regular,specified time interval. Such probes are not associated with any particular point of execution, but ratherwith the asynchronous interrupt event. You can use these probes to sample some aspect of the systemstate and then use the samples to infer system behavior. If the sampling rate is high or the samplingtime is long, an accurate inference is possible. Using DTrace actions, you can use the profile providerto sample practically any aspect of the system. For example, you could sample the state of the currentthread, the state of the CPU, or the current machine instruction.

profile-n Probes
127
11.2.1 profile-n Probes
The profile-n probes fire at a fixed interval, at a high-interrupt level on all active CPUs. The units ofn default to a frequency that is expressed as a rate of firing per second, but the value can also have anoptional suffix , as shown in Table 11.1, “Valid Time Suffixes”, which specifies either a time interval or afrequency. The following table describes valid time suffixes for a tick-n probe.
Table 11.1 Valid Time Suffixes
Suffix Time Units
nsec or ns nanoseconds
usec or us microseconds
msec or ms milliseconds
sec or s seconds
min or m minutes
hour or h hours
day or d days
hz hertz (frequency expressed as rate per second)
11.2.2 tick-n Probes
The tick-n probes fire at fixed intervals, at a high interrupt level on only one CPU per interval. Unlikeprofile-n probes, which fire on every CPU, tick-n probes fire on only one CPU per interval and theCPU on which they fire can change over time. The units of n default to a frequency expressed as a rate offiring per second, but the value can also have an optional time suffix as shown in Table 11.1, “Valid TimeSuffixes”, which specifies either a time interval or a frequency.
The tick-n probes have several uses, such as providing some periodic output or taking a periodic action.
Note
By default, the highest supported tick frequency is 5000 Hz (tick-5000).
11.2.3 profile Probe Arguments
The following table describes the arguments for the profile probes.
Table 11.2 profile Probe Arguments
Probe arg0 arg1 arg2
profile-n pc upc nsecs
tick-n pc upc —
The arguments are as follows:
• pc: kernel program counter
• upc: user-space program counter
• nsecs: elapsed number of nanoseconds

profile Probe Creation
128
11.2.4 profile Probe Creation
Unlike other providers, the profile provider creates probes dynamically on an as-needed basis. Thus,the desired probe might not appear in a listing of all probes, for example, when using the dtrace -l -Pprofile command, but the probe is created when it is explicitly enabled.
A time interval that is too short causes the machine to continuously field time-based interrupts and deniesservice on the machine. The profile provider silently refuses to create a probe that would result in aninterval of less than two hundred microseconds.
11.2.5 prof Stability
The profile provider uses DTrace's stability mechanism to describe its stabilities. These stability valuesare listed in the following table.
Element Name Stability Data Stability Dependency Class
Provider Evolving Evolving Common
Module Unstable Unstable Unknown
Function Private Private Unknown
Name Evolving Evolving Common
Arguments Evolving Evolving Common
For more information, see Chapter 16, DTrace Stability Features.
11.3 fbt ProviderThe fbt (Function Boundary Tracing) provider includes probes that are associated with the entry to andreturn from most functions in the Oracle Linux kernel. Therefore, there could well be tens of thousands offbt probes.
To confirm that the fbt provider is available on your processor's architecture, you should be able to loadthe module that provides fbt instrumentation and successfully list several probes. Note that this processcould take several seconds due to the large number of such probes. For example, consider the followingcommand, which is executed as root:
# dtrace -l -P fbt | wc -ldtrace: failed to match fbt:::: No probe matches description1# modprobe fbt# dtrace -l -P fbt | wc -l88958
In the previous example, the first dtrace command automatically loads modules that are listed in /etc/dtrace-modules, but also confirms that fbt was not among them. After fbt is loaded manually, manyfbt probes appear. For more information, see Section 11.3.4, “Module Loading and fbt”.
Like other DTrace providers, Function Boundary Tracing (FBT) has no probe effect when notexplicitly enabled. When enabled, FBT only induces a probe effect in probed functions. While the FBTimplementation is highly specific to the instruction set architecture, FBT has been implemented on bothx86 and 64-bit Arm platforms. For each instruction set, there are a small number of leaf functions that donot call other functions and are highly optimized by the compiler, which cannot be instrumented by FBT.Probes for these functions are not present in DTrace.
An effective use of FBT probes requires knowledge of the operating system implementation. It is thereforerecommended that you use FBT only when developing kernel software or when other providers are not

fbt Probes
129
sufficient. You can use other DTrace providers such as syscall, sched, proc, and io to answer mostsystem analysis questions without requiring operating system implementation knowledge.
11.3.1 fbt Probes
FBT provides a probe at the entry and return of most functions in the kernel, named entry and return,respectively. All FBT probes have a function name and module name.
11.3.2 fbt Probe Arguments
The arguments to entry probes are the same as the arguments to the corresponding operating systemkernel function. These arguments can be accessed as int64_t values by using the arg0, arg1, arg2, ...variables.
If the function has a return value, the return value is stored in arg1 of the return probe. If a function doesnot have a return value, arg1 is not defined.
While a given function only has a single point of entry, it might have many different points where it returnsto its caller. FBT collects a function's multiple return sites into a single return probe. If you want to knowthe exact return path, you can examine the return probe arg0 value, which indicates the offset in bytesof the returning instruction in the function text.
11.3.3 fbt Examples
You can easily use the fbt provider to explore the kernel's implementation. The following example scriptrecords the first gettimeofday call from any clock process and then follows the subsequent code paththrough the kernel. Type the following D source code and save it in a file named xgettimeofday.d:
/* * To make the output more readable, indent every function entry * and unindent every function return. This is done by setting the * "flowindent" option. */#pragma D option flowindent
syscall::gettimeofday:entry/execname == "clock" && guard++ == 0/{ self->traceme = 1; printf("start");}
fbt:::/self->traceme/{}
syscall::gettimeofday:return/self->traceme/{ self->traceme = 0; exit(0);}
Running this script results in output that is similar to the following:
# dtrace -s ./xgettimeofday.ddtrace: script './xgettimeofday.d' matched 92115 probesCPU FUNCTION 0 => gettimeofday start 0 -> SyS_gettimeofday 0 -> getnstimeofday64

Module Loading and fbt
130
0 -> __getnstimeofday64 0 <- __getnstimeofday64 0 <- getnstimeofday64 0 -> _copy_to_user 0 <- _copy_to_user 0 <- SyS_gettimeofday 0 <= gettimeofday
The previous output shows the internal kernel functions that are called when the gettimeofday systemcall is made.
11.3.4 Module Loading and fbt
While the Oracle Linux kernel can dynamically load and unload kernel modules, for fbt probes, the fbtkernel module must be loaded to support the instrumentation. For more information about loading kernelmodules, see the note in Section 1.1, “Getting Started With DTrace”. If fbt is not listed in /etc/dtrace-modules, or if the dtrace -l command lists no fbt probes, use the following command:
# modprobe fbt
Conversely, you can unload the fbt instrumentation with the following command:
# modprobe -r fbt
When the fbt module is loaded, FBT automatically provides probes to instrument all other loadedmodules, including any new modules that are dynamically loaded. If a loaded module has no enabledFBT probes, the module might be unloaded and the corresponding probes are destroyed as the moduleis unloaded. If a loaded module has enabled FBT probes, the module is considered busy and cannot beunloaded.
11.3.5 fbt Stability
The fbt provider uses DTrace's stability mechanism to describe its stabilities. These stability values arelisted in the following table.
Element Name Stability Data Stability Dependency Class
Provider Evolving Evolving Common
Module Private Private Unknown
Function Private Private ISA
Name Evolving Evolving Common
Arguments Private Private ISA
For more information, see Chapter 16, DTrace Stability Features.
11.4 syscall ProviderThe syscall provider makes available a probe at the entry to and return from every system call in thesystem. Because system calls are the primary interface between user-level applications and the operatingsystem kernel, the syscall provider can offer tremendous insight into application behavior with respect tothe system.
11.4.1 syscall Probes
syscall provides a pair of probes for each system call: an entry probe that fires before the systemcall is entered, and a return probe that fires after the system call has completed, but before control has

syscall Probes
131
been transferred back to user-level. For all syscall probes, the function name is set as the name of theinstrumented system call.
Often, the system call names that are provided by syscall correspond to names in the Section 2 manualpages. However, some syscall provider probes do not directly correspond to any documented systemcall. Some common reasons for this discrepancy are described in the following sections.
11.4.1.1 System Call Anachronisms
In some cases, the name of the system call, as provided by the syscall provider, might be a reflection ofan ancient implementation detail.
11.4.1.2 Subcoded System Calls
Some system calls might be implemented as sub operations of another system call. For example,socketcall(), is the common kernel entry point for the socket system calls.
11.4.1.3 New System Calls
Oracle Linux implements at-suffixed system interfaces as individual system calls, for example:
• faccessat()
• fchmodat()
• fchownat()
• fstatat64()
• futimensat()
• linkat()
• mkdirat()
• mknodat()
• name_to_handle_at()
• newfstatat()
• open_by_handle_at()
• openat()
• readlinkat()
• renameat()
• symlinkat()
• unlinkat()
• utimensat()
These system calls implement a superset of the functionality of their old non-at-suffixed counterparts.They take an additional first argument that is either an open directory file descriptor. In which case, the

syscall Probes
132
operation on a relative pathname is taken relative to the specified directory, or is the reserved valueAT_FDCWD, in which case the operation takes place relative to the current working directory.
11.4.1.4 Replaced System Calls
In Oracle Linux, the following older system calls have been replaced and are not called by the newerglibc interfaces. These legacy interfaces remain, but are reimplemented, not as system calls in theirown right, but as calls to the newer system calls. The following table lists the legacy call and its new callequivalent.
Legacy System Call New System Call
access(p, m) faccessat(AT_FDCWD, p, m, 0)
chmod(p, m) fchmodat(AT_FDCWD, p, m, 0)
chown(p, u, g) fchownat(AT_FDCWD, p, u, g, 0)
creat(p, m) openat(AT_FDCWD, p, O_WRONLY|O_CREAT|O_TRUNC, m)
fchmod(fd, m) fchmodat(fd, NULL, m, 0)
fchown(fd, u, g) fchownat(fd, NULL, u, g, 0)
fstat(fd, s) fstatat(fd, NULL, s, 0)
lchown(p, u, g) fchownat(AT_FDCWD, p, u, g,AT_SYMLINK_NOFOLLOW)
link(p1, p2) linkat(AT_FDCWD, p1, AT_FDCWD, p2, 0)
lstat(p, s) fstatat(AT_FDCWD, p, s,AT_SYMLINK_NOFOLLOW)
mkdir(p, m) mkdirat(AT_FDCWD, p, m)
mknod(p, m, d) mknodat(AT_FDCWD, p, m, d)
open(p, o, m) openat(AT_FDCWD, p, o, m)
readlink(p, b, s) readlinkat(AT_FDCWD, p, b, s)
rename(p1, p2) renameat(AT_FDCWD, p1, AT_FDCWD, p2)
rmdir(p) unlinkat(AT_FDCWD, p, AT_REMOVEDIR)
stat(p, s) fstatat(AT_FDCWD, p, s, 0)
symlink(p1, p2) symlinkat(p1, AT_FDCWD, p2)
unlink(p) unlinkat(AT_FDCWD, p, 0)
11.4.1.5 Large File System Calls
A 32-bit program that supports large files that exceed two gigabytes in size must be able to process 64-bit file offsets. Because large files require the use of large offsets, large files are manipulated through aparallel set of system interfaces. The following table lists some of the syscall probes for the large filesystem call interfaces.
Table 11.3 syscall Large File Probes
Large File syscall Probe System Call
getdents64 getdents()
pread64 * pread()
pwrite64 * pwrite()

syscall Probe Arguments
133
11.4.1.6 Private System Calls
Some system calls are private implementation details of Oracle Linux subsystems that span the user-kernel boundary.
11.4.2 syscall Probe Arguments
For entry probes, the arguments, arg0 ... argn, are arguments to the system call. For return probes,both arg0 and arg1 contain the return value. A non-zero value in the D variable errno indicates a systemcall failure.
11.4.3 syscall Stability
The syscall provider uses DTrace's stability mechanism to describe its stabilities. These stability valuesare listed in the following table.
Element Name Stability Data Stability Dependency Class
Provider Evolving Evolving Common
Module Private Private Unknown
Function Private Private Instruction setarchitecture (ISA)
Name Evolving Evolving Common
Arguments Private Private ISA
For more information about the stability mechanism, see Chapter 16, DTrace Stability Features.
11.5 sdt provider
The Statically Defined Tracing (SDT) provider (sdt) creates probes at sites that a software programmerhas formally designated. The SDT mechanism enables programmers to consciously choose locationsof interest to users of DTrace and to convey some semantic knowledge about each location through theprobe name.
Importantly, SDT can act as a metaprovider by registering probes so that they appear to come from otherproviders, such as io, proc, and sched, which do not have dedicated modules of their own. Thus, theSDT provider is chiefly of interest only to developers of new providers. Most users will access SDT onlyindirectly by using other providers.
Note
Because the sdt probes that are defined for the Oracle Linux kernel are likely tochange over time, they are not listed here. Both the name stability and the datastability of the probes are Private, which reflects the kernel's implementation andshould not be interpreted as a commitment to preserve these interfaces. For moreinformation, see Chapter 16, DTrace Stability Features.
11.5.1 Creating sdt Probes
If you are a device driver developer, you might be interested in creating your own sdt probes for yourOracle Linux driver. The disabled probe effect of SDT is essentially the cost of several no-operationmachine instructions. You are therefore encouraged to add sdt probes to your device drivers as needed.

sdt Stability
134
Unless these probes negatively affect performance, you can leave them in your shipping code. SeeChapter 14, Statically Defined Tracing of Kernel Modules.
DTrace also provides a mechanism for application developers to define user-space static probes. SeeChapter 13, Statically Defined Tracing of User Applications.
11.5.1.1 Declaring Probes
The sdt probes are declared by using the DTRACE_PROBE macro from <linux/sdt.h>.
The module name and function name of an SDT-based probe correspond to the kernel module andfunction of the probe, respectively. DTrace includes the kernel module name and function name as part ofthe tuple identifying a probe, so you do not need to include this information in the probe name to preventname space collisions. Use the dtrace -l -m module command to list the probes that your drivermodule has installed and the full names that are seen by DTrace users.
The name of the probe depends on the name that is provided in the DTRACE_PROBE macro. If the namedoes not contain two consecutive underscores (__), the name of the probe is as written in the macro. Ifthe name contains two consecutive underscores, the probe name converts the consecutive underscoresto a single dash (-). For example, if a DTRACE_PROBE macro specifies transaction__start, the SDTprobe is named transaction-start. This substitution enables C code to provide macro names that arenot valid C identifiers without specifying a string.
SDT can also act as a metaprovider by registering probes so that they appear to come from otherproviders, such as io, proc, and sched, which do not have dedicated modules of their own. For example,kernel/exit.c contains calls to the DTRACE_PROC macro, which are defined as follows in <linux/sdt.h>:
# define DTRACE_PROC(name) \ DTRACE_PROBE(__proc_##name);
Probes that use such macros appear to come from a provider other than sdt. The leading doubleunderscore, provider name, and trailing underscore in the name argument are used to match the providerand are not included in the probe name. Note that the functionality for creating probes for providers otherthan those that are hard-coded into DTrace is not currently available.
11.5.1.2 sdt Probe Arguments
The arguments for each sdt probe are the arguments that are specified in the kernel source code in thecorresponding DTRACE_PROBE macro reference. When declaring your sdt probes, you can minimize theirdisabled probe effect by not dereferencing pointers and by not loading from global variables in the probearguments. Both pointer dereferencing and global variable loading may be done safely in D actions thatenable probes, so DTrace users can request these actions only when they are needed.
11.5.2 sdt Stability
The sdt provider uses DTrace's stability mechanism to describe its stabilities. These values are listed inthe following table.
Element Name Stability Data Stability Dependency Class
Provider Evolving Evolving ISA
Module Private Private Unknown
Function Private Private Unknown
Name Private Private ISA

pid Provider
135
Element Name Stability Data Stability Dependency Class
Arguments Private Private ISA
For more information about the stability mechanism, refer to Chapter 16, DTrace Stability Features.
11.6 pid ProviderThe pid provider enables tracing of any user process, as specified by its pid.
The pid provider enables tracing function entry and return in user programs just like the fbt providerprovides that capability for the kernel. Note that most of the examples in this guide that use the fbtprovider to trace kernel function calls can be modified slightly to apply to user processes.
The pid provider also enables tracing of any instruction, as specified by an absolute address or functionoffset.
The pid provider has no probe effect when probes are not enabled. When probes are enabled, the probesonly induce probe effect on those processes that are traced.
Note
When the compiler inlines a function, the pid provider's probe does not fire. Useone of the following methods to compile a particular C function so that it will not beinlined.
• Sun Studio: #pragma no_inline (funcname[, funcname])
• gcc: funcname __attribute__ ((noinline))
Consult your compiler documentation for updates.
11.6.1 Naming pid Probes
The pid provider actually defines a class of providers. Each process can potentially have its ownassociated pid provider. For example, a process with ID 123, would be traced by using the pid123provider.
The module portion of the probe description refers to an object loaded in the corresponding process'saddress space. To see which objects will be loaded for my_exec or are loaded for process ID 123, use thefollowing commands:
# ldd my_exec...# pldd 123123: /tmp/my_execlinux-vdso.so.1/lib64/libc.so.6/lib64/ld-linux-x86-64.so.2p
In the probe description, you name the object by the name of the file, not by its full path name. You canalso omit the .6 or so.6 suffix. All of the following examples name the same probe:
pid123:libc.so.6:strcpy:entrypid123:libc.so:strcpy:entrypid123:libc:strcpy:entry
The first example is the actual name of the probe. The other examples are convenient aliases that arereplaced with the full load object name internally.

pid Probe Arguments
136
For the load object of the executable, you can use the a.out alias. The following two probe descriptionsname the same probe:
pid123:my_exec:main:returnpid123:a.out:main:return
The function field of the probe description names a function in the module. A user application binarymight have several names for the same function. For example, __gnu_get_libc_version might be analternate name for the function gnu_get_libc_version in libc.so.6. DTrace chooses one canonicalname for such a function and uses that name internally.
The following example illustrates how DTrace internally remaps module and function names to a canonicalform:
# dtrace -q -n 'pid123:libc:__gnu_get_libc_version: { printf("%s\n%s\n", probemod, probefunc)}'libc.so.6gnu_get_libc_version
For examples of how to use the pid provider effectively, see Chapter 12, User Process Tracing.
11.6.2 pid Probe Arguments
An entry probe fires when the traced function is invoked. The arguments to entry probes are the values ofthe arguments to the traced function.
A return probe fires when the traced function returns or makes a tail call to another function. The arg1probe argument holds the function return value.
An offset probe fires whenever execution reaches the instruction at the specified offset in thefunction. For example, to trace the instruction at the address 4 bytes into function main, you can usepid123:a.out:main:4. The arguments for offset probes are undefined. The uregs[] array will helpyou when examining the process state at these probe sites. See Section 12.5, “uregs[] Array”.
11.6.3 pid Stability
The pid provider uses DTrace's stability mechanism to describe its stabilities. These values are listed inthe following table.
Element Name Stability Data Stability Dependency Class
Provider Evolving Evolving ISA
Module Private Private Unknown
Function Private Private Unknown
Name Evolving Evolving ISA
Arguments Private Private Unknown
For more information about the stability mechanism, see Chapter 16, DTrace Stability Features.
11.7 proc Provider
The proc provider makes available the probes that pertain to the following activities: process creation andtermination, LWP creation and termination, execution of new program images, and signal sending andhandling.

proc Probes
137
11.7.1 proc Probes
The probes for the proc provider are listed in the following table.
Table 11.4 proc Probes
Probe Description
create Fires when a process (or process thread) is created using fork() orvfork(), which both invoke clone(). The psinfo_t corresponding to thenew child process is pointed to by args[0].
exec Fires whenever a process loads a new process image using a variant of theexecve() system call. The exec probe fires before the process image isloaded. Process variables like execname and curpsinfo therefore containthe process state before the image is loaded. Some time after the exec probefires, either the exec-failure or exec-success probe subsequentlyfires in the same thread. The path of the new process image is pointed to byargs[0].
exec-failure Fires when an exec() variant has failed. The exec-failure probe firesonly after the exec probe has fired in the same thread. The errno value isprovided in args[0].
exec-success Fires when an exec() variant has succeeded. Like the exec-failure probe,the exec-success probe fires only after the exec probe has fired in the samethread. By the time that the exec-success probe fires, process variables likeexecname and curpsinfo contain the process state after the new processimage has been loaded.
exit Fires when the current process is exiting. The reason for exit, which isexpressed as one of the SIGCHLD <asm-generic/signal.h> codes, iscontained in args[0].
lwp-create Fires when a process thread is created, the latter typically as a result ofpthread_create(). The lwpsinfo_t corresponding to the new thread ispointed to by args[0]. The psinfo_t of the process that created the threadis pointed to by args[1].
lwp-exit Fires when a process or process thread is exiting, due either to a signal or toan explicit call to exit or pthread_exit().
lwp-start Fires within the context of a newly created process or process thread. Thelwp-start probe fires before any user-level instructions are executed. If thethread is the first created for the process, the start probe fires, followed bylwp-start.
signal-clear Probes that fires when a pending signal is cleared because the targetthread was waiting for the signal in sigwait(), sigwaitinfo(), orsigtimedwait(). Under these conditions, the pending signal is cleared andthe signal number is returned to the caller. The signal number is in args[0].signal-clear fires in the context of the formerly waiting thread.
signal-discard Fires when a signal is sent to a single-threaded process and the signal is bothunblocked and ignored by the process. Under these conditions, the signalis discarded on generation. The lwpsinfo_t and psinfo_t of the targetprocess and thread are in args[0] and args[1], respectively. The signalnumber is in args[2].
signal-handle Fires immediately before a thread handles a signal. The signal-handleprobe fires in the context of the thread that will handle the signal. The signal
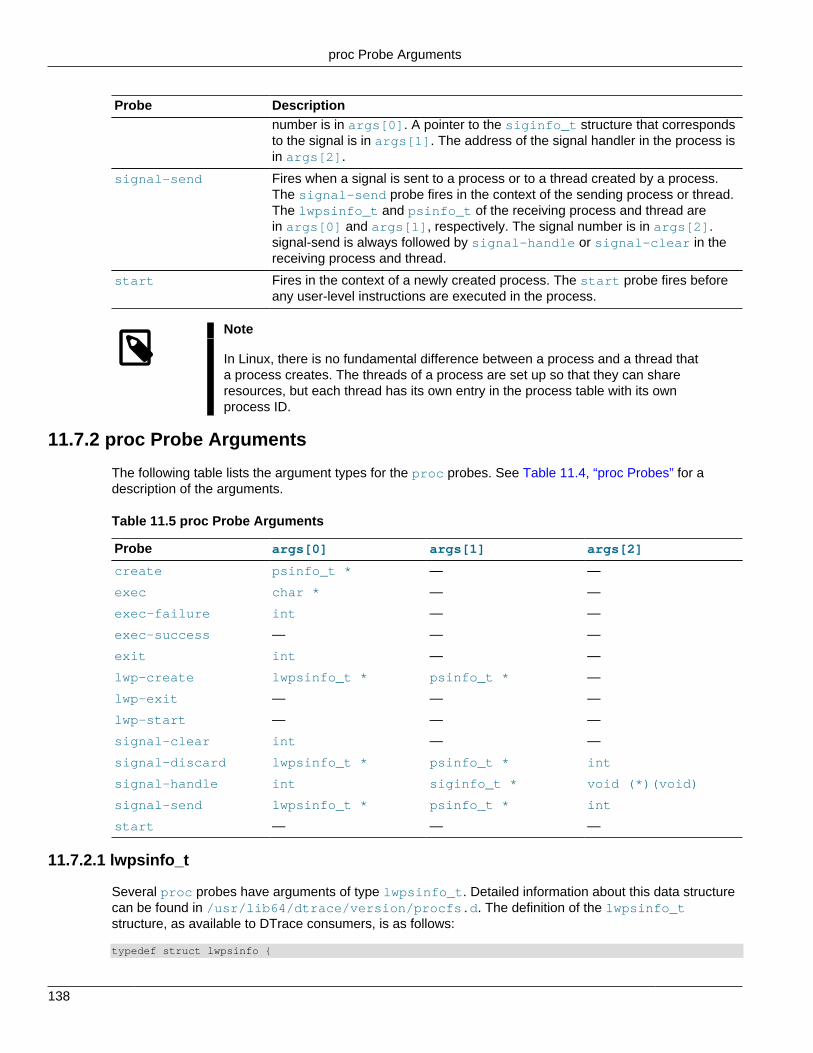
proc Probe Arguments
138
Probe Descriptionnumber is in args[0]. A pointer to the siginfo_t structure that correspondsto the signal is in args[1]. The address of the signal handler in the process isin args[2].
signal-send Fires when a signal is sent to a process or to a thread created by a process.The signal-send probe fires in the context of the sending process or thread.The lwpsinfo_t and psinfo_t of the receiving process and thread arein args[0] and args[1], respectively. The signal number is in args[2].signal-send is always followed by signal-handle or signal-clear in thereceiving process and thread.
start Fires in the context of a newly created process. The start probe fires beforeany user-level instructions are executed in the process.
Note
In Linux, there is no fundamental difference between a process and a thread thata process creates. The threads of a process are set up so that they can shareresources, but each thread has its own entry in the process table with its ownprocess ID.
11.7.2 proc Probe Arguments
The following table lists the argument types for the proc probes. See Table 11.4, “proc Probes” for adescription of the arguments.
Table 11.5 proc Probe Arguments
Probe args[0] args[1] args[2]
create psinfo_t * — —
exec char * — —
exec-failure int — —
exec-success — — —
exit int — —
lwp-create lwpsinfo_t * psinfo_t * —
lwp-exit — — —
lwp-start — — —
signal-clear int — —
signal-discard lwpsinfo_t * psinfo_t * int
signal-handle int siginfo_t * void (*)(void)
signal-send lwpsinfo_t * psinfo_t * int
start — — —
11.7.2.1 lwpsinfo_t
Several proc probes have arguments of type lwpsinfo_t. Detailed information about this data structurecan be found in /usr/lib64/dtrace/version/procfs.d. The definition of the lwpsinfo_tstructure, as available to DTrace consumers, is as follows:
typedef struct lwpsinfo {
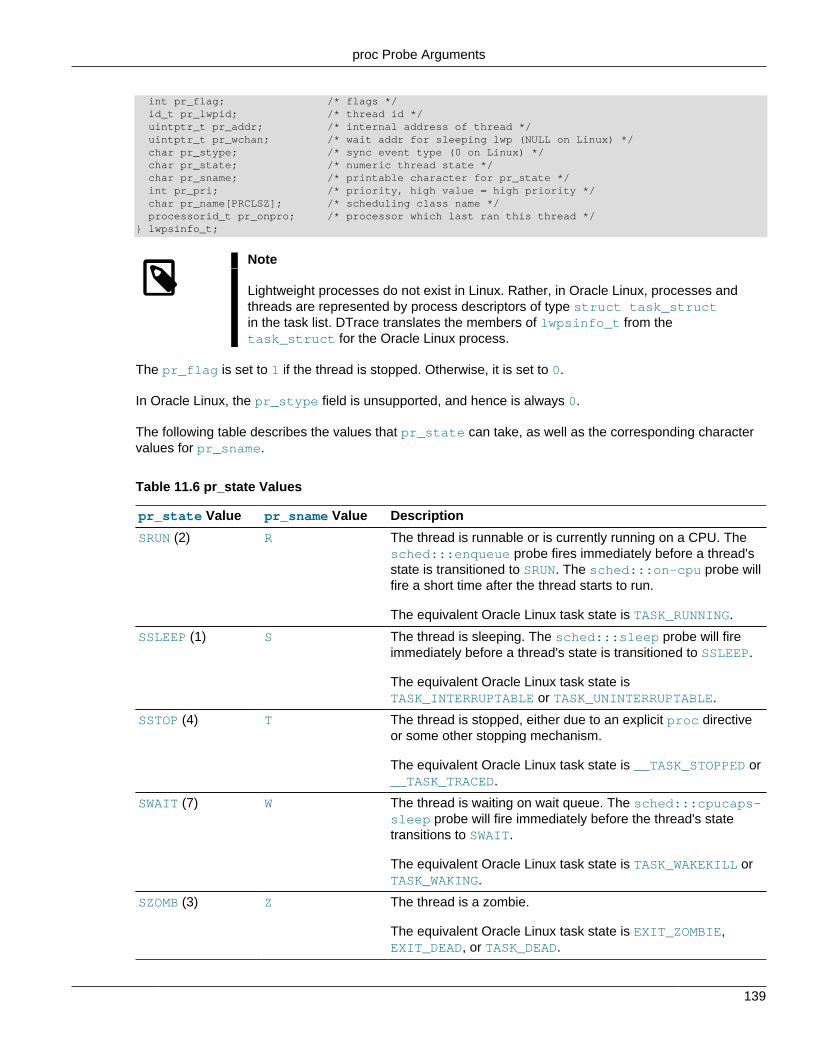
proc Probe Arguments
139
int pr_flag; /* flags */ id_t pr_lwpid; /* thread id */ uintptr_t pr_addr; /* internal address of thread */ uintptr_t pr_wchan; /* wait addr for sleeping lwp (NULL on Linux) */ char pr_stype; /* sync event type (0 on Linux) */ char pr_state; /* numeric thread state */ char pr_sname; /* printable character for pr_state */ int pr_pri; /* priority, high value = high priority */ char pr_name[PRCLSZ]; /* scheduling class name */ processorid_t pr_onpro; /* processor which last ran this thread */} lwpsinfo_t;
Note
Lightweight processes do not exist in Linux. Rather, in Oracle Linux, processes andthreads are represented by process descriptors of type struct task_structin the task list. DTrace translates the members of lwpsinfo_t from thetask_struct for the Oracle Linux process.
The pr_flag is set to 1 if the thread is stopped. Otherwise, it is set to 0.
In Oracle Linux, the pr_stype field is unsupported, and hence is always 0.
The following table describes the values that pr_state can take, as well as the corresponding charactervalues for pr_sname.
Table 11.6 pr_state Values
pr_state Value pr_sname Value Description
SRUN (2) R The thread is runnable or is currently running on a CPU. Thesched:::enqueue probe fires immediately before a thread'sstate is transitioned to SRUN. The sched:::on-cpu probe willfire a short time after the thread starts to run.
The equivalent Oracle Linux task state is TASK_RUNNING.
SSLEEP (1) S The thread is sleeping. The sched:::sleep probe will fireimmediately before a thread's state is transitioned to SSLEEP.
The equivalent Oracle Linux task state isTASK_INTERRUPTABLE or TASK_UNINTERRUPTABLE.
SSTOP (4) T The thread is stopped, either due to an explicit proc directiveor some other stopping mechanism.
The equivalent Oracle Linux task state is __TASK_STOPPED or__TASK_TRACED.
SWAIT (7) W The thread is waiting on wait queue. The sched:::cpucaps-sleep probe will fire immediately before the thread's statetransitions to SWAIT.
The equivalent Oracle Linux task state is TASK_WAKEKILL orTASK_WAKING.
SZOMB (3) Z The thread is a zombie.
The equivalent Oracle Linux task state is EXIT_ZOMBIE,EXIT_DEAD, or TASK_DEAD.

proc Examples
140
11.7.2.2 psinfo_t
Several proc probes have an argument of type psinfo_t. Detailed information about this data structurecan be found in /usr/lib64/dtrace/version/procfs.d. The definition of the psinfo_t structure,as available to DTrace consumers, is as follows:
typedef struct psinfo { int pr_nlwp; /* not supported */ pid_t pr_pid; /* unique process id */ pid_t pr_ppid; /* process id of parent */ pid_t pr_pgid; /* pid of process group leader */ pid_t pr_sid; /* session id */ uid_t pr_uid; /* real user id */ uid_t pr_euid; /* effective user id */ uid_t pr_gid; /* real group id */ uid_t pr_egid; /* effective group id */ uintptr_t pr_addr; /* address of process */ size_t pr_size; /* not supported */ size_t pr_rssize; /* not supported */ struct tty_struct *pr_ttydev; /* controlling tty (or -1) */ ushort_t pr_pctcpu; /* not supported */ ushort_t pr_pctmem; /* not supported */ timestruc_t pr_start; /* not supported */ timestruc_t pr_time; /* not supported */ timestruc_t pr_ctime; /* not supported */ char pr_fname[16]; /* name of exec'ed file */ char pr_psargs[80]; /* initial chars of arg list */ int pr_wstat; /* not supported */ int pr_argc; /* initial argument count */ uintptr_t pr_argv; /* address of initial arg vector */ uintptr_t pr_envp; /* address of initial env vector */ char pr_dmodel; /* data model */ taskid_t pr_taskid; /* not supported */ projid_t pr_projid; /* not supported */ int pr_nzomb; /* not supported */ poolid_t pr_poolid; /* not supported */ zoneid_t pr_zoneid; /* not supported */ id_t pr_contract; /* not supported */ lwpsinfo_t pr_lwp; /* not supported */} psinfo_t;
Note
Lightweight processes do not exist in Linux. In Oracle Linux, processes and threadsare represented by process descriptors of type struct task_struct in the tasklist. DTrace translates the members of psinfo_t from the task_struct for theOracle Linux process.
pr_dmodel is set to either PR_MODEL_ILP32, denoting a 32–bit process, or PR_MODEL_LP64, denoting a64–bit process.
11.7.3 proc Examples
The following examples illustrate the use of the probes that are published by the proc provider.
11.7.3.1 exec
The following example shows how you can use the exec probe to easily determine which programs arebeing executed, and by whom. Type the following D source code and save it in a file named whoexec.d:
#pragma D option quiet
proc:::exec

proc Examples
141
{ self->parent = execname;}
proc:::exec-success/self->parent != NULL/{ @[self->parent, execname] = count(); self->parent = NULL;}
proc:::exec-failure/self->parent != NULL/{ self->parent = NULL;}
END{ printf("%-20s %-20s %s\n", "WHO", "WHAT", "COUNT"); printa("%-20s %-20s %@d\n", @);}
Running the example script for a short period of time results in output similar to the following:
# dtrace -s ./whoexec.d ^CWHO WHAT COUNTabrtd abrt-handle-eve 1firefox basename 1firefox mkdir 1firefox mozilla-plugin- 1firefox mozilla-xremote 1firefox run-mozilla.sh 1firefox uname 1gnome-panel firefox 1kworker/u:1 modprobe 1modprobe modprobe.ksplic 1mozilla-plugin- plugin-config 1mozilla-plugin- uname 1nice sosreport 1run-mozilla.sh basename 1run-mozilla.sh dirname 1run-mozilla.sh firefox 1run-mozilla.sh uname 1sh abrt-action-sav 1sh blkid 1sh brctl 1sh cut 1...
11.7.3.2 start and exit Probes
If you want to know how long programs are running, from creation to termination, you can enable thestart and exit probes, as shown in the following example. Save it in a file named progtime.d:
proc:::start{ self->start = timestamp;}
proc:::exit/self->start/{ @[execname] = quantize(timestamp - self->start); self->start = 0;

proc Examples
142
}
Running the example script on a build server for several seconds results in output similar to the following:
# dtrace -s ./progtime.ddtrace: script ’./progtime.d’ matched 2 probes^C...cc value ------------- Distribution ------------- count 33554432 | 0 67108864 |@@@ 3 134217728 |@ 1 268435456 | 0 536870912 |@@@@ 4 1073741824 |@@@@@@@@@@@@@@ 13 2147483648 |@@@@@@@@@@@@ 11 4294967296 |@@@ 3 8589934592 | 0
sh value ------------- Distribution ------------- count 262144 | 0 524288 |@ 5 1048576 |@@@@@@@ 29 2097152 | 0 4194304 | 0 8388608 |@@@ 12 16777216 |@@ 9 33554432 |@@ 9 67108864 |@@ 8 134217728 |@ 7 268435456 |@@@@@ 20 536870912 |@@@@@@ 26 1073741824 |@@@ 14 2147483648 |@@ 11 4294967296 | 3 8589934592 | 1 17179869184 | 0...
11.7.3.3 signal-send
The following example shows how you can use the signal-send probe to determine the sending andreceiving of process associated with any signal. Type the following D source code and save it in a filenamed sig.d:
#pragma D option quiet
proc:::signal-send{ @[execname, stringof(args[1]->pr_fname), args[2]] = count();}
END{ printf("%20s %20s %12s %s\n", "SENDER", "RECIPIENT", "SIG", "COUNT"); printa("%20s %20s %12d %@d\n", @);}
Running this script results in output similar to the following:
# dtrace -s sig.d^C SENDER RECIPIENT SIG COUNT

proc Stability
143
gnome-panel Xorg 29 1 kworker/0:2 dtrace 2 1 Xorg Xorg 29 3 java Xorg 29 6 firefox Xorg 29 14 kworker/0:0 Xorg 29 1135
11.7.4 proc Stability
The proc provider uses DTrace's stability mechanism to describe its stabilities. These values are listed inthe following table.
Element Name Stability Data Stability Dependency Class
Provider Evolving Evolving ISA
Module Private Private Unknown
Function Private Private Unknown
Name Evolving Evolving ISA
Arguments Evolving Evolving ISA
For more information about the stability mechanism, see Chapter 16, DTrace Stability Features.
11.8 sched ProviderThe sched provider makes available probes that are related to CPU scheduling. Because CPUs are theone resource that all threads must consume, the sched provider is very useful for understanding systemicbehavior. For example, using the sched provider, you can understand when and why threads sleep, run,change priority, or wake other threads.
11.8.1 sched Probes
The following table describes the probes for the sched provider.
Table 11.7 sched Probes
Probe Description
change-pri Fires whenever a thread's priority is about to be changed. The lwpsinfo_t of thethread is pointed to by args[0]. The thread's current priority is in the pr_pri fieldof this structure. The psinfo_t of the process containing the thread is pointed to byargs[1]. The thread's new priority is contained in args[2].
dequeue Fires immediately before a runnable thread is dequeued from a run queue. Thelwpsinfo_t of the thread being dequeued is pointed to by args[0]. Thepsinfo_t of the process containing the thread is pointed to by args[1]. Thecpuinfo_t of the CPU from which the thread is being dequeued is pointed to byargs[2]. If the thread is being dequeued from a run queue that is not associatedwith a particular CPU, the cpu_id member of this structure will be -1.
enqueue Fires immediately before a runnable thread is enqueued to a run queue. Thelwpsinfo_t of the thread being enqueued is pointed to by args[0]. Thepsinfo_t of the process containing the thread is pointed to by args[1]. Thecpuinfo_t of the CPU to which the thread is being enqueued is pointed to byargs[2]. If the thread is being enqueued from a run queue that is not associatedwith a particular CPU, the cpu_id member of this structure will be -1. The value inargs[3] is a boolean indicating whether the thread will be enqueued to the front ofthe run queue. The value is non-zero if the thread will be enqueued at the front ofthe run queue, and zero if the thread will be enqueued at the back of the run queue.

sched Probe Arguments
144
Probe Description
off-cpu Fires when the current CPU is about to end execution of a thread. The curcpuvariable indicates the current CPU. The curlwpsinfo variable indicates the threadthat is ending execution. The lwpsinfo_t of the thread that the current CPU willnext execute is pointed to by args[0]. The psinfo_t of the process containingthe next thread is pointed to by args[1].
on-cpu Fires when a CPU has just begun execution of a thread. The curcpu variableindicates the current CPU. The curlwpsinfo variable indicates the thread that isbeginning execution. The curpsinfo variable describes the process containing thecurrent thread.
preempt Fires immediately before the current thread is preempted. After this probe fires,the current thread will select a thread to run and the off-cpu probe will fire forthe current thread. In some cases, a thread on one CPU will be preempted, butthe preempting thread will run on another CPU in the meantime. In this situation,the preempt probe will fire, but the dispatcher will be unable to find a higher prioritythread to run and the remain-cpu probe will fire instead of the off-cpu probe.
remain-cpu Fires when a scheduling decision has been made, but the dispatcher has elected tocontinue to run the current thread. The curcpu variable indicates the current CPU.The curlwpsinfo variable indicates the thread that is beginning execution. Thecurpsinfo variable describes the process containing the current thread.
sleep Fires immediately before the current thread sleeps on a synchronization object.The type of the synchronization object is contained in the pr_stype member ofthe lwpsinfo_t pointed to by curlwpsinfo. The address of the synchronizationobject is contained in the pr_wchan member of the lwpsinfo_t pointed to bycurlwpsinfo. The meaning of this address is a private implementation detail, butthe address value may be treated as a token unique to the synchronization object.
surrender Fires when a CPU has been instructed by another CPU to make a schedulingdecision — often because a higher-priority thread has become runnable. Thelwpsinfo_t of the current thread is pointed to by args[0]. The psinfo_t of theprocess containing the thread is pointed to by args[1].
tick Fires as a part of clock tick-based accounting. In clock tick-based accounting, CPUaccounting is performed by examining which threads and processes are runningwhen a fixed-interval interrupt fires. The lwpsinfo_t that corresponds to the threadthat is being assigned CPU time is pointed to by args[0]. The psinfo_t thatcorresponds to the process that contains the thread is pointed to by args[1].
wakeup Fires immediately before the current thread wakes a thread sleeping on asynchronization object. The lwpsinfo_t of the sleeping thread is pointed toby args[0]. The psinfo_t of the process containing the sleeping thread ispointed to by args[1]. The type of the synchronization object is contained in thepr_stype member of the lwpsinfo_t of the sleeping thread. The address of thesynchronization object is contained in the pr_wchan member of the lwpsinfo_t ofthe sleeping thread. The meaning of this address is a private implementation detail,but the address value may be treated as a token unique to the synchronizationobject.
11.8.2 sched Probe Arguments
The following table describes the argument types for the sched probes. See Table 11.7, “sched Probes”for descriptions of the arguments.
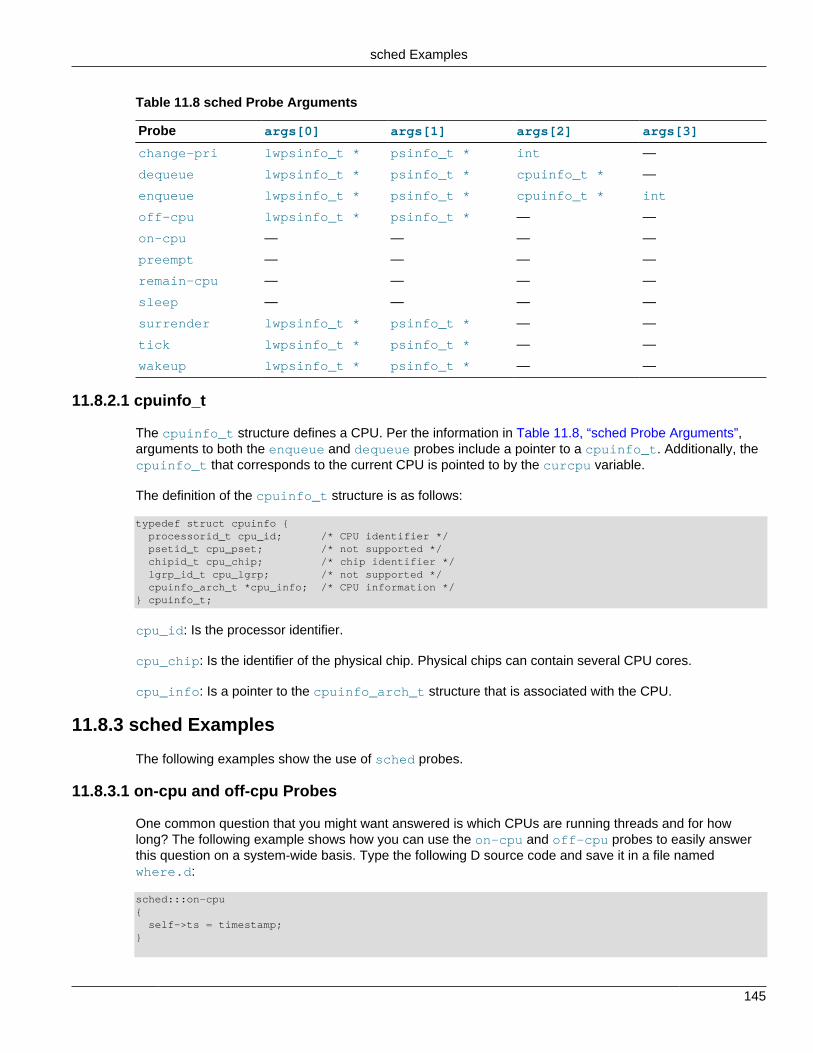
sched Examples
145
Table 11.8 sched Probe Arguments
Probe args[0] args[1] args[2] args[3]
change-pri lwpsinfo_t * psinfo_t * int —
dequeue lwpsinfo_t * psinfo_t * cpuinfo_t * —
enqueue lwpsinfo_t * psinfo_t * cpuinfo_t * int
off-cpu lwpsinfo_t * psinfo_t * — —
on-cpu — — — —
preempt — — — —
remain-cpu — — — —
sleep — — — —
surrender lwpsinfo_t * psinfo_t * — —
tick lwpsinfo_t * psinfo_t * — —
wakeup lwpsinfo_t * psinfo_t * — —
11.8.2.1 cpuinfo_t
The cpuinfo_t structure defines a CPU. Per the information in Table 11.8, “sched Probe Arguments”,arguments to both the enqueue and dequeue probes include a pointer to a cpuinfo_t. Additionally, thecpuinfo_t that corresponds to the current CPU is pointed to by the curcpu variable.
The definition of the cpuinfo_t structure is as follows:
typedef struct cpuinfo { processorid_t cpu_id; /* CPU identifier */ psetid_t cpu_pset; /* not supported */ chipid_t cpu_chip; /* chip identifier */ lgrp_id_t cpu_lgrp; /* not supported */ cpuinfo_arch_t *cpu_info; /* CPU information */} cpuinfo_t;
cpu_id: Is the processor identifier.
cpu_chip: Is the identifier of the physical chip. Physical chips can contain several CPU cores.
cpu_info: Is a pointer to the cpuinfo_arch_t structure that is associated with the CPU.
11.8.3 sched Examples
The following examples show the use of sched probes.
11.8.3.1 on-cpu and off-cpu Probes
One common question that you might want answered is which CPUs are running threads and for howlong? The following example shows how you can use the on-cpu and off-cpu probes to easily answerthis question on a system-wide basis. Type the following D source code and save it in a file namedwhere.d:
sched:::on-cpu{ self->ts = timestamp;}

sched Examples
146
sched:::off-cpu/self->ts/{ @[cpu] = quantize(timestamp - self->ts); self->ts = 0;}
Running the previous script results in output that is similar to the following:
# dtrace -s ./where.ddtrace: script ’./where.d’ matched 2 probes^C 0 value ------------- Distribution ------------- count 2048 | 0 4096 |@@ 37 8192 |@@@@@@@@@@@@@ 212 16384 |@ 30 32768 | 10 65536 |@ 17 131072 | 12 262144 | 9 524288 | 6 1048576 | 5 2097152 | 1 4194304 | 3 8388608 |@@@@ 75 16777216 |@@@@@@@@@@@@ 201 33554432 | 6 67108864 | 0
1 value ------------- Distribution ------------- count 2048 | 0 4096 |@ 6 8192 |@@@@ 23 16384 |@@@ 18 32768 |@@@@ 22 65536 |@@@@ 22 131072 |@ 7 262144 | 5 524288 | 2 1048576 | 3 2097152 |@ 9 4194304 | 4 8388608 |@@@ 18 16777216 |@@@ 19 33554432 |@@@ 16 67108864 |@@@@ 21 134217728 |@@ 14 268435456 | 0
The previous output shows that on CPU 1 threads tend to run for less than 131072 nanoseconds (on orderof 100 microseconds) at a stretch, or for 8388608 to 134217728 nanoseconds (approximately 10 to 100milliseconds). A noticeable gap between the two clusters of data is shown in the histogram. You also mightbe interested in knowing which CPUs are running a particular process.
You can also use the on-cpu and off-cpu probes for answering this question. The following scriptdisplays which CPUs run a specified application over a period of ten seconds. Save it in a file namedwhererun.d.:
#pragma D option quietdtrace:::BEGIN{ start = timestamp;

sched Examples
147
}
sched:::on-cpu/execname == $$1/{ self->ts = timestamp;}
sched:::off-cpu/self->ts/{ @[cpu] = sum(timestamp - self->ts); self->ts = 0;}
profile:::tick-1sec/++x >= 10/{ exit(0);}
dtrace:::END{ printf("CPU distribution over %d seconds:\n\n", (timestamp - start) / 1000000000); printf("CPU microseconds\n--- ------------\n"); normalize(@, 1000); printa("%3d %@d\n", @);}
Running the previous script on a large mail server and specifying the IMAP daemon results in output that issimilar to the following:
# dtrace -s ./whererun.d imapdCPU distribution of imapd over 10 seconds:
CPU microseconds--- ------------ 15 10102 12 16377 21 25317 19 25504 17 35653 13 41539 14 46669 20 57753 22 70088 16 115860 23 127775 18 160517
Oracle Linux takes into account the amount of time that a thread has been sleeping when selecting a CPUon which to run the thread, as a thread that has been sleeping for less time tends not to migrate. Use theoff-cpu and on-cpu probes to observe this behavior. Type the following source code and save it in a filenamed howlong.d:
sched:::off-cpu/curlwpsinfo->pr_state == SSLEEP/{ self->cpu = cpu; self->ts = timestamp;}
sched:::on-cpu/self->ts/{

sched Examples
148
@[self->cpu == cpu ? "sleep time, no CPU migration" : "sleep time, CPU migration"] = lquantize((timestamp - self->ts) / 1000000, 0, 500, 25); self->ts = 0; self->cpu = 0;}
Running the previous script for approximately 30 seconds results in output that is similar to the following:
# dtrace -s ./howlong.ddtrace: script ’./howlong.d’ matched 2 probes^C sleep time, CPU migration value ------------- Distribution ------------- count < 0 | 0 0 |@@@@@@@ 6838 25 |@@@@@ 4714 50 |@@@ 3108 75 |@ 1304 100 |@ 1557 125 |@ 1425 150 | 894 175 |@ 1526 200 |@@ 2010 225 |@@ 1933 250 |@@ 1982 275 |@@ 2051 300 |@@ 2021 325 |@ 1708 350 |@ 1113 375 | 502 400 | 220 425 | 106 450 | 54 475 | 40 >= 500 |@ 1716
sleep time, no CPU migration value ------------- Distribution ------------- count < 0 | 0 0 |@@@@@@@@@@@@ 58413 25 |@@@ 14793 50 |@@ 10050 75 | 3858 100 |@ 6242 125 |@ 6555 150 | 3980 175 |@ 5987 200 |@ 9024 225 |@ 9070 250 |@@ 10745 275 |@@ 11898 300 |@@ 11704 325 |@@ 10846 350 |@ 6962 375 | 3292 400 | 1713 425 | 585 450 | 201 475 | 96 >= 500 | 3946
The previous output reveals that there are many more occurrences of non-migration than migration. Also,when sleep times are longer, migrations are more likely. The distributions are noticeably different in thesub-100 millisecond range, but look very similar as the sleep times get longer. This result would seem toindicate that sleep time is not factored into the scheduling decision when a certain threshold is exceeded.

sched Examples
149
11.8.3.2 enqueue and dequeue Probes
You might want to know on which CPUs processes and threads are waiting to run. You can use theenqueue probe along with the dequeue probe to answer this question. Type the following source codeand save it in a file named qtime.d:
sched:::enqueue{ a[args[0]->pr_lwpid, args[1]->pr_pid, args[2]->cpu_id] = timestamp;}
sched:::dequeue/a[args[0]->pr_lwpid, args[1]->pr_pid, args[2]->cpu_id]/{ @[args[2]->cpu_id] = quantize(timestamp - a[args[0]->pr_lwpid, args[1]->pr_pid, args[2]->cpu_id]); a[args[0]->pr_lwpid, args[1]->pr_pid, args[2]->cpu_id] = 0;}
Running the previous script for several seconds results in output that is similar to the following:
# dtrace -s qtime.d dtrace: script 'qtime.d' matched 16 probes^C
1 value ------------- Distribution ------------- count 8192 | 0 16384 | 1 32768 |@ 47 65536 |@@@@@@@ 365 131072 |@@@@@@@@@@@@ 572 262144 |@@@@@@@@@@@@ 570 524288 |@@@@@@@ 354 1048576 |@ 57 2097152 | 7 4194304 | 1 8388608 | 1 16777216 | 0
0 value ------------- Distribution ------------- count 8192 | 0 16384 | 6 32768 |@ 49 65536 |@@@@@ 261 131072 |@@@@@@@@@@@@@ 753 262144 |@@@@@@@@@@@@ 704 524288 |@@@@@@@@ 455 1048576 |@ 74 2097152 | 9 4194304 | 2 8388608 | 0
Rather than looking at wait times, you might want to examine the length of the run queue over time. Usingthe enqueue and dequeue probes, you can set up an associative array to track the queue length. Typethe following source code and save it in a file named qlen.d:
sched:::enqueue{ this->len = qlen[args[2]->cpu_id]++; @[args[2]->cpu_id] = lquantize(this->len, 0, 100);}
sched:::dequeue

sched Examples
150
/qlen[args[2]->cpu_id]/{ qlen[args[2]->cpu_id]--;}
Running the previous script on a largely idle dual-core processor system for approximately 30 secondsresults in output that is similar to the following:
# dtrace -s qlen.d dtrace: script 'qlen.d' matched 16 probes^C
1 value ------------- Distribution ------------- count < 0 | 0 0 |@@@@@@@@@@@@@@@@@@@@@@@@@@@@@@@@@ 8124 1 |@@@@@@ 1558 2 |@ 160 3 | 51 4 | 24 5 | 13 6 | 11 7 | 9 8 | 6 9 | 0
0 value ------------- Distribution ------------- count < 0 | 0 0 |@@@@@@@@@@@@@@@@@@@@@@@@@@@@@@ 8569 1 |@@@@@@@@@ 2429 2 |@ 292 3 | 25 4 | 8 5 | 5 6 | 4 7 | 4 8 | 1 9 | 0
The output is roughly what you would expect for an idle system: the majority of the time that a runnablethread is enqueued, the run queues were very short (three or fewer threads in length). However, given thatthe system was largely idle, the exceptional data points at the bottom of each table might be unexpected.For example, why were the run queues as long as 8 runnable threads? To explore this question further,you could write a D script that displays the contents of the run queue when the length of the run queue islong. This problem is complicated because D enablings cannot iterate over data structures, and thereforecannot simply iterate over the entire run queue. Even if D enablings could do so, you should avoiddependencies on the kernel's internal data structures.
For this type of script, you would enable the enqueue and dequeue probes and then use bothspeculations and associative arrays. Whenever a thread is enqueued, the script increments the lengthof the queue and records the timestamp in an associative array keyed by the thread. You cannot use athread-local variable in this case because a thread might be enqueued by another thread. The script thenchecks to see if the queue length exceeds the maximum, and if so, the script starts a new speculation,and records the timestamp and the new maximum. Then, when a thread is dequeued, the script comparesthe enqueue timestamp to the timestamp of the longest length: if the thread was enqueued before thetimestamp of the longest length, the thread was in the queue when the longest length was recorded. In thiscase, the script speculatively traces the thread's information. When the kernel dequeues the last threadthat was enqueued at the timestamp of the longest length, the script commits the speculation data. Typethe following source code and save it in a file named whoqueue.d:
#pragma D option quiet#pragma D option nspec=4

sched Examples
151
#pragma D option specsize=100k
int maxlen;int spec[int];sched:::enqueue{ this->len = ++qlen[this->cpu = args[2]->cpu_id]; in[args[0]->pr_addr] = timestamp;}
sched:::enqueue/this->len > maxlen && spec[this->cpu]/{ /* * There is already a speculation for this CPU. We just set a new * record, so we’ll discard the old one. */ discard(spec[this->cpu]);}
sched:::enqueue/this->len > maxlen/{ /* * We have a winner. Set the new maximum length and set the timestamp * of the longest length. */ maxlen = this->len; longtime[this->cpu] = timestamp; /* * Now start a new speculation, and speculatively trace the length. */ this->spec = spec[this->cpu] = speculation(); speculate(this->spec); printf("Run queue of length %d:\n", this->len);}
sched:::dequeue/(this->in = in[args[0]->pr_addr]) && this->in <= longtime[this->cpu = args[2]->cpu_id]/{ speculate(spec[this->cpu]); printf(" %d/%d (%s)\n", args[1]->pr_pid, args[0]->pr_lwpid, stringof(args[1]->pr_fname));}
sched:::dequeue/qlen[args[2]->cpu_id]/{ in[args[0]->pr_addr] = 0; this->len = --qlen[args[2]->cpu_id];}
sched:::dequeue/this->len == 0 && spec[this->cpu]/{ /* * We just processed the last thread that was enqueued at the time * of longest length; commit the speculation, which by now contains * each thread that was enqueued when the queue was longest. */ commit(spec[this->cpu]); spec[this->cpu] = 0;}
Running the previous script on the same system results in output that is similar to the following:
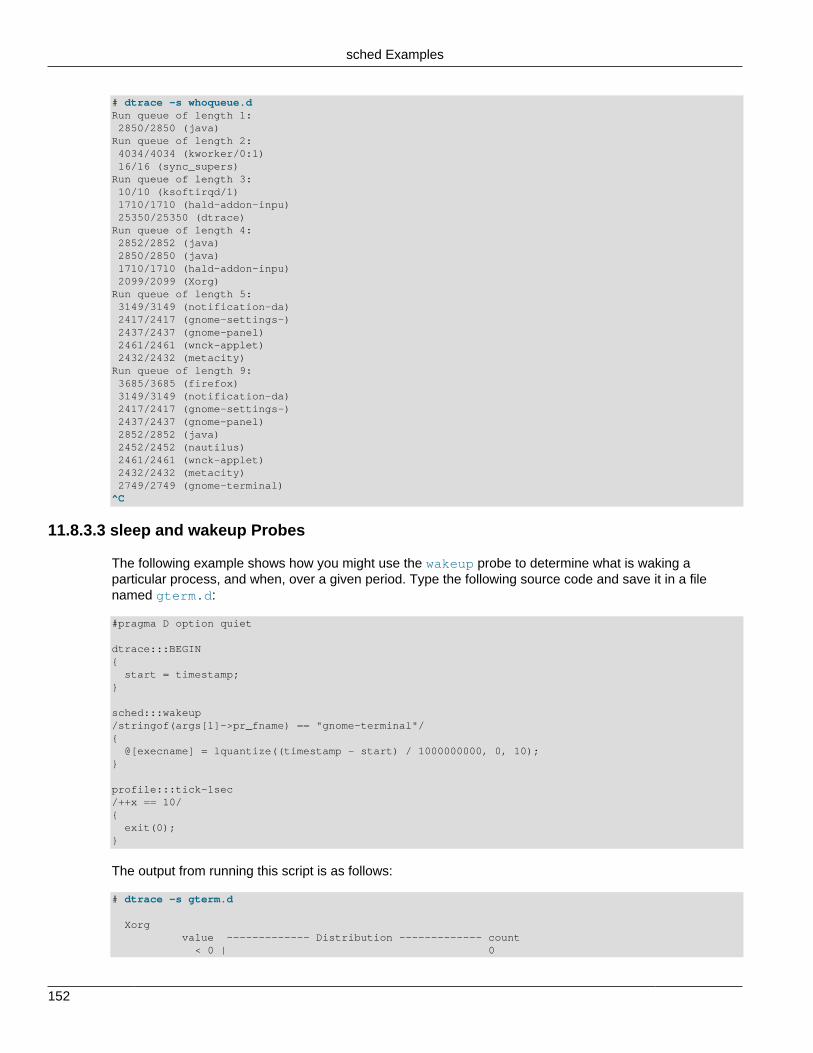
sched Examples
152
# dtrace -s whoqueue.dRun queue of length 1: 2850/2850 (java)Run queue of length 2: 4034/4034 (kworker/0:1) 16/16 (sync_supers)Run queue of length 3: 10/10 (ksoftirqd/1) 1710/1710 (hald-addon-inpu) 25350/25350 (dtrace)Run queue of length 4: 2852/2852 (java) 2850/2850 (java) 1710/1710 (hald-addon-inpu) 2099/2099 (Xorg)Run queue of length 5: 3149/3149 (notification-da) 2417/2417 (gnome-settings-) 2437/2437 (gnome-panel) 2461/2461 (wnck-applet) 2432/2432 (metacity)Run queue of length 9: 3685/3685 (firefox) 3149/3149 (notification-da) 2417/2417 (gnome-settings-) 2437/2437 (gnome-panel) 2852/2852 (java) 2452/2452 (nautilus) 2461/2461 (wnck-applet) 2432/2432 (metacity) 2749/2749 (gnome-terminal)^C
11.8.3.3 sleep and wakeup Probes
The following example shows how you might use the wakeup probe to determine what is waking aparticular process, and when, over a given period. Type the following source code and save it in a filenamed gterm.d:
#pragma D option quiet
dtrace:::BEGIN{ start = timestamp;}
sched:::wakeup/stringof(args[1]->pr_fname) == "gnome-terminal"/{ @[execname] = lquantize((timestamp - start) / 1000000000, 0, 10);}
profile:::tick-1sec/++x == 10/{ exit(0);}
The output from running this script is as follows:
# dtrace -s gterm.d
Xorg value ------------- Distribution ------------- count < 0 | 0

sched Examples
153
0 |@@@@@@@@@@@@@@@ 69 1 |@@@@@@@@ 35 2 |@@@@@@@@@ 42 3 | 2 4 | 0 5 | 0 6 | 0 7 |@@@@ 16 8 | 0 9 |@@@ 15 >= 10 | 0
This output shows that the X server is waking the gnome-terminal process as you interact with thesystem.
Additionally, you could use the sleep probe with the wakeup probe to understand which applications areblocking on other applications, and for how long. Type the following source code and save it in a file namedwhofor.d:
#pragma D option quietsched:::sleep{ bedtime[curlwpsinfo->pr_addr] = timestamp;}
sched:::wakeup/bedtime[args[0]->pr_addr]/{ @[stringof(args[1]->pr_fname), execname] = quantize(timestamp - bedtime[args[0]->pr_addr]); bedtime[args[0]->pr_addr] = 0;}
END{ printa("%s sleeping on %s:\n%@d\n", @);}
The tail of the output from running the previous example script on a desktop system for several seconds issimilar to the following:
# dtrace -s whofor.d ^C...Xorg sleeping on metacity:
value ------------- Distribution ------------- count 65536 | 0 131072 |@@@@@@@@@@@@@@@@@@@@@@@@@@@@@@@@@@@@@@@@ 2 262144 | 0
gnome-power-man sleeping on Xorg:
value ------------- Distribution ------------- count 131072 | 0 262144 |@@@@@@@@@@@@@@@@@@@@@@@@@@@@@@@@@@@@@@@@ 1 524288 | 0...
11.8.3.4 preempt and remain-cpu Probes
Because Oracle Linux is a preemptive system, higher priority threads preempt lower priority threads.Preemption can induce a significant latency bubble in the lower priority thread. Therefore, you might wantto know which threads are being preempted by other threads.

sched Examples
154
The following example shows how you would use the preempt and remain-cpu probes to display thisinformation. Type the following source code and save it in a file named whopreempt.d:
#pragma D option quiet
sched:::preempt{ self->preempt = 1;}
sched:::remain-cpu/self->preempt/{ self->preempt = 0;}
sched:::off-cpu/self->preempt/{ /* * If we were told to preempt ourselves, see who we ended up giving * the CPU to. */ @[stringof(args[1]->pr_fname), args[0]->pr_pri, execname, curlwpsinfo->pr_pri] = count(); self->preempt = 0;}
END{ printf("%30s %3s %30s %3s %5s\n", "PREEMPTOR", "PRI", "PREEMPTED", "PRI", "#"); printa("%30s %3d %30s %3d %5@d\n", @);}
Running the previous script on a desktop system for several seconds results in output that is similar to thefollowing:
# dtrace -s whopreempt.d ^C PREEMPTOR PRI PREEMPTED PRI # firefox 120 kworker/0:0 120 1 gnome-panel 120 swapper 120 1 gnome-panel 120 wnck-applet 120 1 jbd2/dm-0-8 120 swapper 120 1 khugepaged 139 kworker/0:0 120 1 ksoftirqd/1 120 kworker/0:0 120 1 kworker/0:0 120 gnome-terminal 120 1 kworker/0:2 120 Xorg 120 1 kworker/0:2 120 java 120 1 kworker/1:0 120 Xorg 120 1 nautilus 120 Xorg 120 1 rtkit-daemon 0 rtkit-daemon 120 1 rtkit-daemon 120 swapper 120 1 watchdog/0 0 swapper 120 1 watchdog/1 0 kworker/0:0 120 1 wnck-applet 120 Xorg 120 1 wnck-applet 120 swapper 120 1 automount 120 kworker/0:0 120 2 gnome-power-man 120 kworker/0:0 120 2 kworker/0:0 120 swapper 120 2 kworker/1:0 120 dtrace 120 2 metacity 120 kworker/0:0 120 2 notification-da 120 swapper 120 2 udisks-daemon 120 kworker/0:0 120 2 automount 120 swapper 120 3
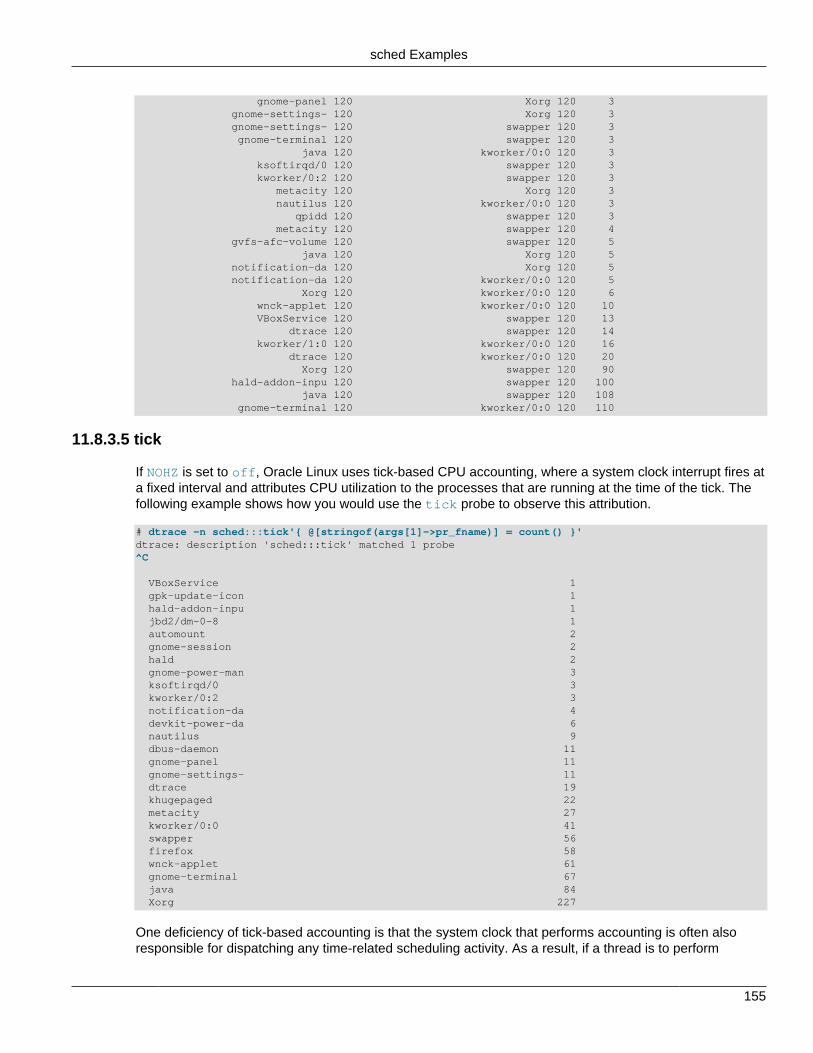
sched Examples
155
gnome-panel 120 Xorg 120 3 gnome-settings- 120 Xorg 120 3 gnome-settings- 120 swapper 120 3 gnome-terminal 120 swapper 120 3 java 120 kworker/0:0 120 3 ksoftirqd/0 120 swapper 120 3 kworker/0:2 120 swapper 120 3 metacity 120 Xorg 120 3 nautilus 120 kworker/0:0 120 3 qpidd 120 swapper 120 3 metacity 120 swapper 120 4 gvfs-afc-volume 120 swapper 120 5 java 120 Xorg 120 5 notification-da 120 Xorg 120 5 notification-da 120 kworker/0:0 120 5 Xorg 120 kworker/0:0 120 6 wnck-applet 120 kworker/0:0 120 10 VBoxService 120 swapper 120 13 dtrace 120 swapper 120 14 kworker/1:0 120 kworker/0:0 120 16 dtrace 120 kworker/0:0 120 20 Xorg 120 swapper 120 90 hald-addon-inpu 120 swapper 120 100 java 120 swapper 120 108 gnome-terminal 120 kworker/0:0 120 110
11.8.3.5 tick
If NOHZ is set to off, Oracle Linux uses tick-based CPU accounting, where a system clock interrupt fires ata fixed interval and attributes CPU utilization to the processes that are running at the time of the tick. Thefollowing example shows how you would use the tick probe to observe this attribution.
# dtrace -n sched:::tick'{ @[stringof(args[1]->pr_fname)] = count() }'dtrace: description 'sched:::tick' matched 1 probe^C
VBoxService 1 gpk-update-icon 1 hald-addon-inpu 1 jbd2/dm-0-8 1 automount 2 gnome-session 2 hald 2 gnome-power-man 3 ksoftirqd/0 3 kworker/0:2 3 notification-da 4 devkit-power-da 6 nautilus 9 dbus-daemon 11 gnome-panel 11 gnome-settings- 11 dtrace 19 khugepaged 22 metacity 27 kworker/0:0 41 swapper 56 firefox 58 wnck-applet 61 gnome-terminal 67 java 84 Xorg 227
One deficiency of tick-based accounting is that the system clock that performs accounting is often alsoresponsible for dispatching any time-related scheduling activity. As a result, if a thread is to perform

sched Stability
156
some amount of work every clock tick (that is, every 10 milliseconds), the system either over-accounts orunder-accounts for the thread, depending on whether the accounting is done before or after time-relateddispatching scheduling activity. If accounting is performed before time-related dispatching, the systemunder-accounts for threads running at a regular interval. If such threads run for less than the clock tickinterval, they can effectively hide behind the clock tick.
The following example examines whether a system has any such threads. Type the following source codeand save it in a file named tick.d:
sched:::tick,sched:::enqueue{ @[probename] = lquantize((timestamp / 1000000) % 10, 0, 10);}
The output of the example script is two distributions of the millisecond offset within a ten millisecondinterval, one for the tick probe and another for enqueue:
# dtrace -s tick.ddtrace: script 'tick.d' matched 9 probes^C
tick value ------------- Distribution ------------- count < 0 | 0 0 |@@@@@ 29 1 |@@@@@@@@@@@@@@@@@@@ 106 2 |@@@@@ 27 3 |@ 7 4 |@@ 10 5 |@@ 12 6 |@ 4 7 |@ 8 8 |@@ 9 9 |@@@ 17 >= 10 | 0
enqueue value ------------- Distribution ------------- count < 0 | 0 0 |@@@@ 82 1 |@@@@ 86 2 |@@@@ 76 3 |@@@ 65 4 |@@@@@ 101 5 |@@@@ 79 6 |@@@@ 75 7 |@@@@ 76 8 |@@@@ 89 9 |@@@@ 75 >= 10 | 0
The output histogram named tick shows that the clock tick is firing at a 1 millisecond offset. In thisexample, the output for enqueue is evenly spread across the ten millisecond interval and no spike isvisible at 1 millisecond, so it appears that the threads are being not being scheduled on a time basis.
11.8.4 sched Stability
The sched provider uses DTrace's stability mechanism to describe its stabilities. These values are listed inthe following table.
Element Name Stability Data Stability Dependency Class
Provider Evolving Evolving ISA

io Provider
157
Element Name Stability Data Stability Dependency Class
Module Private Private Unknown
Function Private Private Unknown
Name Evolving Evolving ISA
Arguments Evolving Evolving ISA
For more information about the stability mechanism, see Chapter 16, DTrace Stability Features.
11.9 io Provider
The io provider makes available probes that relate to data input and output. The io provider enablesquick exploration of behavior that is observed through I/O monitoring tools such as iostat. For example,you can use the io provider to understand I/O by device, I/O type, I/O size, process, or application name .
11.9.1 io Probes
The following table describes the probes for the io provider.
Table 11.9 io Probes
Probe Description
start Fires when an I/O request is about to be made either to a peripheral device orto an NFS server.
done Fires after an I/O request has been fulfilled. The done probe fires after the I/O completes, but before completion processing has been performed on thebuffer. As a result B_DONE is not set in b_flags at the time the done probefires.
wait-start Fires immediately before a thread begins to wait pending completion of a givenI/O request. Some time after the wait-start probe fires, the wait-doneprobe fires in the same thread.
wait-done Fires when a thread finishes waiting for the completion of a given I/O request.The wait-done probe fires only after the wait-start probe has fired in thesame thread.
The io probes fire for all I/O requests to peripheral devices, and for all file read and file write requests toan NFS server. Requests for metadata from an NFS server, for example, do not trigger io probes due to areaddir() request.
11.9.2 io Probe Arguments
The following table describes the arguments for the io probes.
Table 11.10 io Probe Arguments
Argument Type Description
args[0] bufinfo_t * The bufinfo_t for the corresponding I/O request.
args[1] devinfo_t * The devinfo_t for the device for the corresponding I/O request.
args[2] fileinfo_t * The fileinfo_t for the file for the corresponding I/O request.
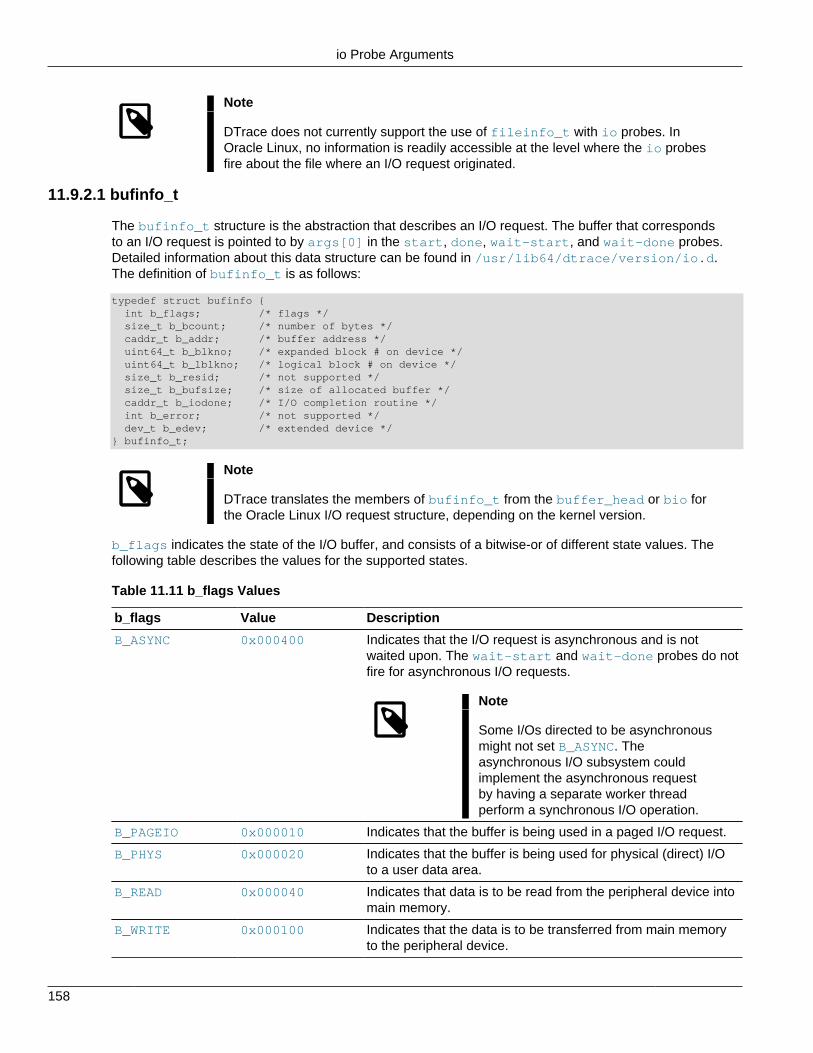
io Probe Arguments
158
Note
DTrace does not currently support the use of fileinfo_t with io probes. InOracle Linux, no information is readily accessible at the level where the io probesfire about the file where an I/O request originated.
11.9.2.1 bufinfo_t
The bufinfo_t structure is the abstraction that describes an I/O request. The buffer that correspondsto an I/O request is pointed to by args[0] in the start, done, wait-start, and wait-done probes.Detailed information about this data structure can be found in /usr/lib64/dtrace/version/io.d.The definition of bufinfo_t is as follows:
typedef struct bufinfo { int b_flags; /* flags */ size_t b_bcount; /* number of bytes */ caddr_t b_addr; /* buffer address */ uint64_t b_blkno; /* expanded block # on device */ uint64_t b_lblkno; /* logical block # on device */ size_t b_resid; /* not supported */ size_t b_bufsize; /* size of allocated buffer */ caddr_t b_iodone; /* I/O completion routine */ int b_error; /* not supported */ dev_t b_edev; /* extended device */} bufinfo_t;
Note
DTrace translates the members of bufinfo_t from the buffer_head or bio forthe Oracle Linux I/O request structure, depending on the kernel version.
b_flags indicates the state of the I/O buffer, and consists of a bitwise-or of different state values. Thefollowing table describes the values for the supported states.
Table 11.11 b_flags Values
b_flags Value Description
B_ASYNC 0x000400 Indicates that the I/O request is asynchronous and is notwaited upon. The wait-start and wait-done probes do notfire for asynchronous I/O requests.
Note
Some I/Os directed to be asynchronousmight not set B_ASYNC. Theasynchronous I/O subsystem couldimplement the asynchronous requestby having a separate worker threadperform a synchronous I/O operation.
B_PAGEIO 0x000010 Indicates that the buffer is being used in a paged I/O request.
B_PHYS 0x000020 Indicates that the buffer is being used for physical (direct) I/Oto a user data area.
B_READ 0x000040 Indicates that data is to be read from the peripheral device intomain memory.
B_WRITE 0x000100 Indicates that the data is to be transferred from main memoryto the peripheral device.
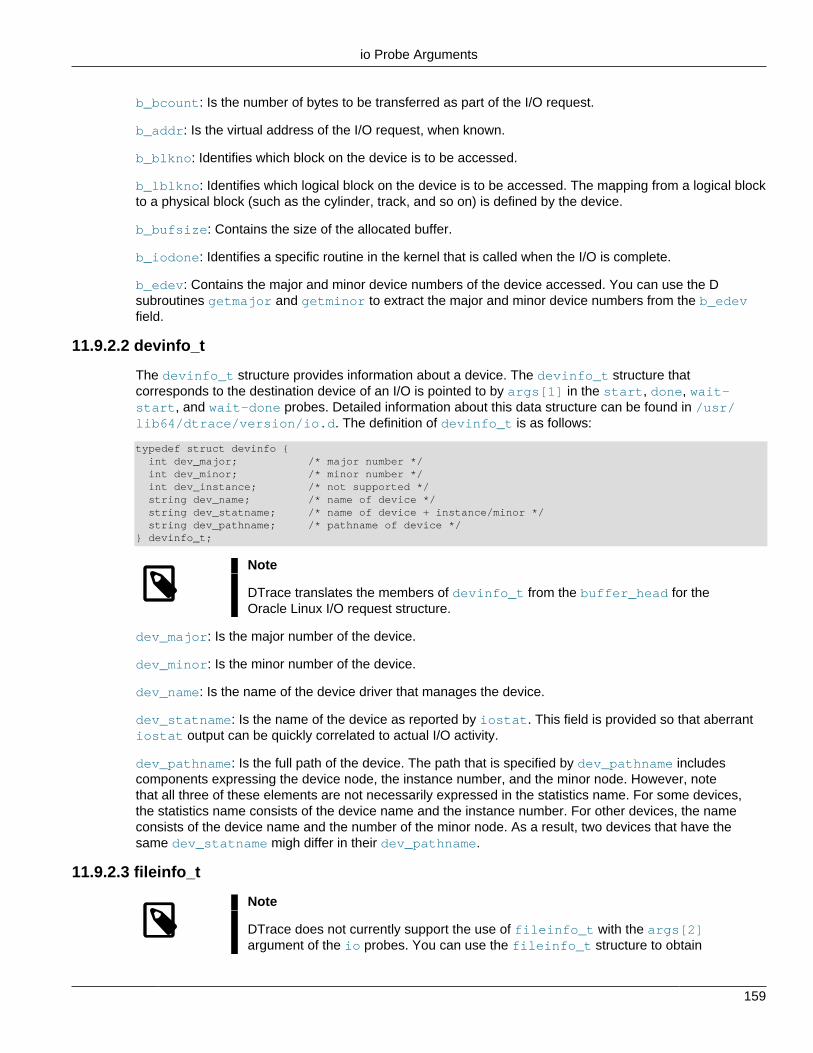
io Probe Arguments
159
b_bcount: Is the number of bytes to be transferred as part of the I/O request.
b_addr: Is the virtual address of the I/O request, when known.
b_blkno: Identifies which block on the device is to be accessed.
b_lblkno: Identifies which logical block on the device is to be accessed. The mapping from a logical blockto a physical block (such as the cylinder, track, and so on) is defined by the device.
b_bufsize: Contains the size of the allocated buffer.
b_iodone: Identifies a specific routine in the kernel that is called when the I/O is complete.
b_edev: Contains the major and minor device numbers of the device accessed. You can use the Dsubroutines getmajor and getminor to extract the major and minor device numbers from the b_edevfield.
11.9.2.2 devinfo_t
The devinfo_t structure provides information about a device. The devinfo_t structure thatcorresponds to the destination device of an I/O is pointed to by args[1] in the start, done, wait-start, and wait-done probes. Detailed information about this data structure can be found in /usr/lib64/dtrace/version/io.d. The definition of devinfo_t is as follows:
typedef struct devinfo { int dev_major; /* major number */ int dev_minor; /* minor number */ int dev_instance; /* not supported */ string dev_name; /* name of device */ string dev_statname; /* name of device + instance/minor */ string dev_pathname; /* pathname of device */} devinfo_t;
Note
DTrace translates the members of devinfo_t from the buffer_head for theOracle Linux I/O request structure.
dev_major: Is the major number of the device.
dev_minor: Is the minor number of the device.
dev_name: Is the name of the device driver that manages the device.
dev_statname: Is the name of the device as reported by iostat. This field is provided so that aberrantiostat output can be quickly correlated to actual I/O activity.
dev_pathname: Is the full path of the device. The path that is specified by dev_pathname includescomponents expressing the device node, the instance number, and the minor node. However, notethat all three of these elements are not necessarily expressed in the statistics name. For some devices,the statistics name consists of the device name and the instance number. For other devices, the nameconsists of the device name and the number of the minor node. As a result, two devices that have thesame dev_statname migh differ in their dev_pathname.
11.9.2.3 fileinfo_t
Note
DTrace does not currently support the use of fileinfo_t with the args[2]argument of the io probes. You can use the fileinfo_t structure to obtain

io Examples
160
information about a process's open files by using the fds[] array. SeeSection 2.9.5, “Built-In Variables”.
The fileinfo_t structure provides information about a file. args[2] in the start, done, wait-start, and wait-done probes points to the file to which an I/O request corresponds. The presence offile information is contingent upon the file system providing this information when dispatching I/O requests.Some file systems, especially third-party file systems, might not provide this information. Also, I/O requestsmight emanate from a file system for which no file information exists. For example, any I/O from or to filesystem metadata is not associated with any one file. Finally, some highly optimized file systems mightaggregate I/O from disjoint files into a single I/O request. In this case, the file system might provide the fileinformation either for the file that represents the majority of the I/O or for the file that represents some ofthe I/O. Alternatively, the file system might provide no file information at all in this case.
Detailed information about this data structure can be found in /usr/lib64/dtrace/version/io.d.The definition of fileinfo_t is as follows:
typedef struct fileinfo { string fi_name; /* name (basename of fi_pathname) */ string fi_dirname; /* directory (dirname of fi_pathname) */ string fi_pathname; /* full pathname */ loff_t fi_offset; /* offset within file */ string fi_fs; /* file system */ string fi_mount; /* not supported */ int fi_oflags; /* open() flags for file descriptor */} fileinfo_t;
The fi_name field contains the name of the file but does not include any directory components. If no fileinformation is associated with an I/O, the fi_name field is set to the string <none>. In some rare cases,the pathname that is associated with a file might be unknown. In this case, the fi_name field is set to thestring <unknown>.
The fi_dirname field contains only the directory component of the file name. As with fi_name, thisstring can be set to <none>, if no file information is present, or <unknown> if the pathname that isassociated with the file is not known.
The fi_pathname field contains the full pathname to the file. As with fi_name, this string can be set to<none>, if no file information is present, or <unknown> if the pathname that is associated with the file isnot known.
The fi_offset field contains the offset within the file , or -1, if either file information is not present or ifthe offset is otherwise unspecified by the file system.
The fi_fs field contains the name of the file system type, or <none>, if no information is present.
The fi_oflags field contains the flags that were specified when opening the file.
11.9.3 io Examples
'The following example script displays information for every I/O as it is issued. Type the following sourcecode and save it in a file named iosnoop.d.
#pragma D option quiet
BEGIN{ printf("%10s %2s\n", "DEVICE", "RW");}
io:::start{

io Examples
161
printf("%10s %2s\n", args[1]->dev_statname, args[0]->b_flags & B_READ ? "R" : "W");}
The output from this script is similar to the following:
# dtrace -s ./iosnoop.d DEVICE RW dm-00 R dm-00 R dm-00 R dm-00 R dm-00 R dm-00 R...
You can make the example script slightly more sophisticated by using an associative array to track the time(in milliseconds) spent on each I/O, as shown in the following example:
#pragma D option quiet
BEGIN{ printf("%10s %2s %7s\n", "DEVICE", "RW", "MS");}
io:::start{ start[args[0]->b_edev, args[0]->b_blkno] = timestamp;}
io:::done/start[args[0]->b_edev, args[0]->b_blkno]/{ this->elapsed = timestamp - start[args[0]->b_edev, args[0]->b_blkno]; printf("%10s %2s %3d.%03d\n", args[1]->dev_statname, args[0]->b_flags & B_READ ? "R" : "W", this->elapsed / 10000000, (this->elapsed / 1000) % 1000); start[args[0]->b_edev, args[0]->b_blkno] = 0;}
The modified script adds a MS (milliseconds) column to the output.
You can aggregate on device, application, process ID and bytes transferred, then save it in a file namedwhoio.d, as shown in the following example:
#pragma D option quiet
io:::start{ @[args[1]->dev_statname, execname, pid] = sum(args[0]->b_bcount);}
END{ printf("%10s %20s %10s %15s\n", "DEVICE", "APP", "PID", "BYTES"); printa("%10s %20s %10d %15@d\n", @);}
Running this script for a few seconds results in output that is similar to the following:
# dtrace -s whoio.d ^C DEVICE APP PID BYTES dm-00 evince 14759 16384 dm-00 flush-252:0 1367 45056

io Examples
162
dm-00 bash 14758 131072 dm-00 gvfsd-metadata 2787 135168 dm-00 evince 14758 139264 dm-00 evince 14338 151552 dm-00 jbd2/dm-0-8 390 356352
If you are copying data from one device to another, you might want to know if one of the devices actsas a limiter on the copy. To answer this question, you need to know the effective throughput of eachdevice, rather than the number of bytes per second that each device is transferring. For exampe, you candetermine throughput by using the following script and saving it in a file named copy.d:
#pragma D option quiet
io:::start{ start[args[0]->b_edev, args[0]->b_blkno] = timestamp;}
io:::done/start[args[0]->b_edev, args[0]->b_blkno]/{ /* * We want to get an idea of our throughput to this device in KB/sec. * What we have, however, is nanoseconds and bytes. That is we want * to calculate: * * bytes / 1024 * ------------------------ * nanoseconds / 1000000000 * * But we cannot calculate this using integer arithmetic without losing * precision (the denominator, for one, is between 0 and 1 for nearly * all I/Os). So we restate the fraction, and cancel: * * bytes 1000000000 bytes 976562 * --------- * ------------- = --------- * ------------- * 1024 nanoseconds 1 nanoseconds * * This is easy to calculate using integer arithmetic. */ this->elapsed = timestamp - start[args[0]->b_edev, args[0]->b_blkno]; @[args[1]->dev_statname, args[1]->dev_pathname] = quantize((args[0]->b_bcount * 976562) / this->elapsed); start[args[0]->b_edev, args[0]->b_blkno] = 0;}
END{ printa(" %s (%s)\n%@d\n", @);}
Running the previous script for several seconds while copying data from a hard disk to a USB drive yieldsthe following output:
# dtrace -s copy.d^Csdc1 (/dev/sdc1)
value ------------- Distribution ------------- count 32 | 0 64 | 3 128 | 1 256 |@@@@@@@@@@@@@@@@@@@@@@@@@@@@@@@@@@@@@@@ 2257 512 | 1 1024 | 0
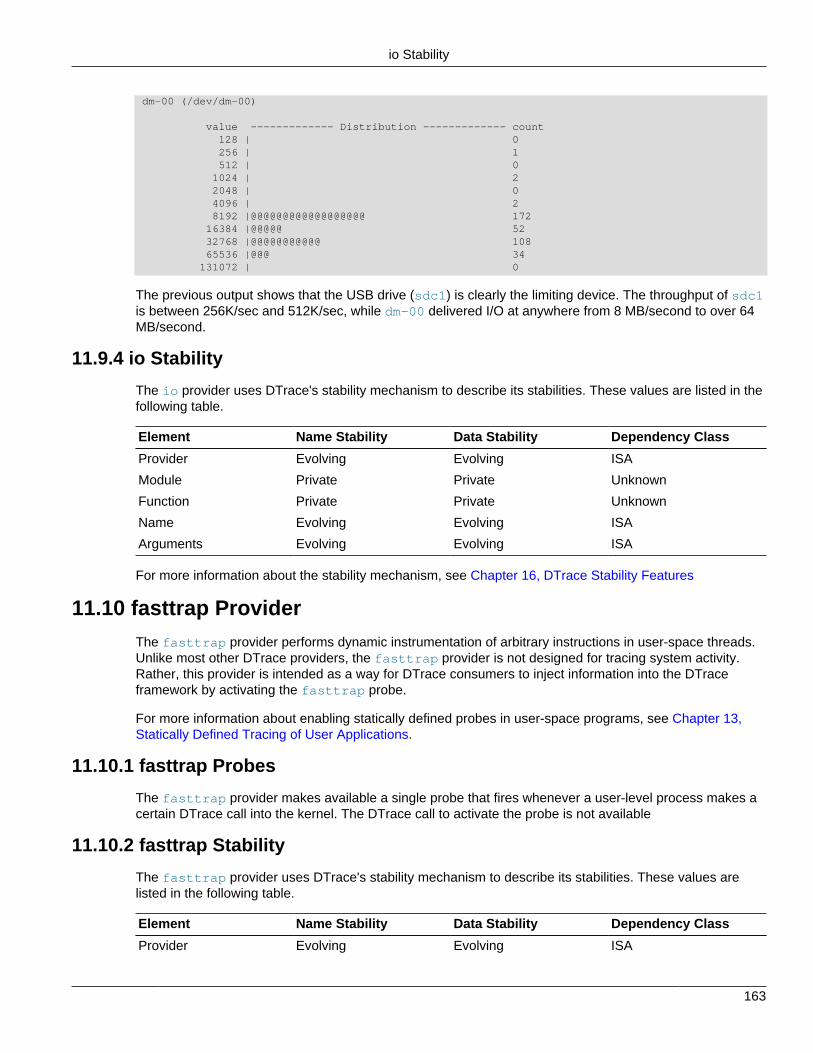
io Stability
163
dm-00 (/dev/dm-00)
value ------------- Distribution ------------- count 128 | 0 256 | 1 512 | 0 1024 | 2 2048 | 0 4096 | 2 8192 |@@@@@@@@@@@@@@@@@@ 172 16384 |@@@@@ 52 32768 |@@@@@@@@@@@ 108 65536 |@@@ 34 131072 | 0
The previous output shows that the USB drive (sdc1) is clearly the limiting device. The throughput of sdc1is between 256K/sec and 512K/sec, while dm-00 delivered I/O at anywhere from 8 MB/second to over 64MB/second.
11.9.4 io Stability
The io provider uses DTrace's stability mechanism to describe its stabilities. These values are listed in thefollowing table.
Element Name Stability Data Stability Dependency Class
Provider Evolving Evolving ISA
Module Private Private Unknown
Function Private Private Unknown
Name Evolving Evolving ISA
Arguments Evolving Evolving ISA
For more information about the stability mechanism, see Chapter 16, DTrace Stability Features
11.10 fasttrap ProviderThe fasttrap provider performs dynamic instrumentation of arbitrary instructions in user-space threads.Unlike most other DTrace providers, the fasttrap provider is not designed for tracing system activity.Rather, this provider is intended as a way for DTrace consumers to inject information into the DTraceframework by activating the fasttrap probe.
For more information about enabling statically defined probes in user-space programs, see Chapter 13,Statically Defined Tracing of User Applications.
11.10.1 fasttrap Probes
The fasttrap provider makes available a single probe that fires whenever a user-level process makes acertain DTrace call into the kernel. The DTrace call to activate the probe is not available
11.10.2 fasttrap Stability
The fasttrap provider uses DTrace's stability mechanism to describe its stabilities. These values arelisted in the following table.
Element Name Stability Data Stability Dependency Class
Provider Evolving Evolving ISA

fasttrap Stability
164
Element Name Stability Data Stability Dependency Class
Module Private Private Unknown
Function Private Private Unknown
Name Evolving Evolving ISA
Arguments Private Private Unknown
For more information about the stability mechanism, see Chapter 16, DTrace Stability Features.

165
Chapter 12 User Process Tracing
Table of Contents12.1 copyin and copyinstr Subroutines ............................................................................................ 165
12.1.1 Avoiding Errors ............................................................................................................ 16612.2 Eliminating dtrace Interference ................................................................................................ 16612.3 Using the syscall Provider ....................................................................................................... 16712.4 ustack Action .......................................................................................................................... 16812.5 uregs[] Array ........................................................................................................................... 16912.6 Using the pid Provider ............................................................................................................ 170
12.6.1 User Function Boundary Tracing ................................................................................... 17012.6.2 Tracing Arbitrary Instructions ........................................................................................ 172
DTrace is a powerful tool for understanding the behavior of user processes. DTrace can be invaluablewhen debugging and analyzing performance problems, or for simply understanding the behavior of acomplex application. This chapter focuses on the DTrace facilities that are relevant to tracing user processactivity and provides examples that illustrate their use.
12.1 copyin and copyinstr Subroutines
DTrace's interaction with processes is slightly different than most traditional debuggers and observabilitytools. Many such tools appear to execute within the scope of the process, allowing users dereferencepointers to program variables directly. Rather than appearing to execute within or as part of the processitself, DTrace probes execute in the Oracle Linux kernel. To access process data, a probe uses thecopyin or copyinstr subroutines to copy user process data into the address space of the kernel.
For example, consider the following write() system call:
ssize_t write(int fd, const void *buf, size_t nbytes);
The following D program illustrates an incorrect attempt to print the contents of a string that is passed tothe write() system call:
syscall::write:entry{ printf("%s", stringof(arg1)); /* incorrect use of arg1 */}
If you attempt to run this script, DTrace produces error messages similar to the following:
dtrace: error on enabled probe ID 1 (ID 37: syscall::write:entry): \invalid address (0x10038a000) in action #1
The arg1 variable, which contains the value of the buf parameter, is an address that refers to memory inthe process executing the system call. To read the string at that address, use the copyinstr subroutineand record its result with the printf action, for example:
syscall::write:entry{ printf("%s", copyinstr(arg1)); /* correct use of arg1 */}
In the previous script, the output shows all of the strings that are being passed to the write() system call.Occasionally, however, you might see irregular output similar to the following:

Avoiding Errors
166
0 37 write:entry mada&^%**&
The copyinstr subroutine acts on an input argument, which is the user address of a null-terminatedASCII string, but buffers that are passed to the write() system call might refer to binary data rather thanASCII strings or to ASCII strings that do not include a terminating null byte. To print only as much of thestring as the caller intended, use the two parameter version of the copyinstr subroutine, which includesthe size of the targeted string buffer:
syscall::write:entry { printf("%s", copyinstr(arg1, arg2)); }
Alternatively, you can use the copyin subroutine, which takes an address and size, for example:
syscall::write:entry{ printf("%s", stringof(copyin(arg1, arg2)));}
Note that the stringof operator is necessary so that DTrace properly converts the user data that isretrieved by copyin to a string. The use of stringof is not necessary with the copyinstr subroutinebecause it always returns the type string.
12.1.1 Avoiding Errors
The copyin and copyinstr subroutines cannot read from user addresses that have not yet beentouched, so even a valid address could cause an error if the page containing that address has not yet beenfaulted in by being accessed. Consider the following example:
# dtrace -n syscall::open:entry'{ trace(copyinstr(arg0)); }'dtrace: description 'syscall::open:entry' matched 1 probeCPU ID FUNCTION:NAME 1 8 open:entry /dev/sr0 1 8 open:entry /var/run/utmp 1 8 open:entry /dev/sr0dtrace: error on enabled probe ID 2 (ID 8: syscall::open:entry): \invalid address (0x9af1b) in action #1 at DIF offset 52
In the example output, the application was functioning properly, and the address in arg0 was valid, but itreferred to a page that had not yet been accessed by the corresponding process. To resolve this issue, youwould need to wait for the kernel or an application to use the data before tracing it.
For example, you might wait until the system call returns to apply copyinstr, as shown here:
# dtrace -n syscall::open:entry'{ self->file = arg0; }' \ -n syscall::open:return'{ trace(copyinstr(self->file)); self->file = 0; }'dtrace: description 'syscall::open:entry' matched 1 probedtrace: description 'syscall::open:return' matched 1 probeCPU ID FUNCTION:NAME 0 9 open:return /dev/sr0 1 9 open:return /usr/lib64/gconv/gconv-modules.cache 0 9 open:return /dev/sr0 0 9 open:return public/pickup 1 9 open:return maildrop 1 9 open:return /dev/sr0 1 9 open:return /dev/sr0 1 9 open:return /var/run/utmp...
12.2 Eliminating dtrace InterferenceIf you trace every call to the write() system call, it causes a cascade of output because each callcauses the dtrace command to call write() as it displays the output, and so on. This feedback loop

Using the syscall Provider
167
is a good example of how the dtrace command can interfere with the desired data. To prevent this typeof unwanted data from being traced, use a simple predicate like the one that is shown in the followingexample and save it in a file named stringof.d:
syscall::write:entry/pid != $pid/{ printf("%s", stringof(copyin(arg1, arg2)));}
In the previous example, the $pid macro variable expands to the process identifier of the process thatenabled the probes. The pid variable contains the process identifier of the process whose thread wasrunning on the CPU where the probe was fired. Therefore, the predicate /pid != $pid/ ensures that thescript does not trace any events related to itself.
12.3 Using the syscall Provider
The syscall provider enables you to trace every system call entry and return. System calls can be agood starting point for understanding the behavior of a process, especially if the process seems to bespending a large amount of time executing or blocked in the kernel, as shown in the output of commandssuch as ps and top.
For example, consider a process with a process ID of 31337 that is consuming a large amount of systemtime. One possible explanation for this behavior is that the process is executing a large number of systemcalls. You can specify a simple D program on the command line to see which system calls are happeningmost often:
# dtrace -n syscall:::entry'/pid == 31337/{ @syscalls[probefunc] = count(); }'dtrace: description ’syscall:::entry’ matched 215 probes^C
kill 1 clone 4 pipe 4 setpgid 4 rt_sigreturn 6 sendmsg 7 socket 7 access 8 getegid 8 geteuid 8 getgid 8 getuid 8 wait4 12 close 15 read 23 newstat 25 write 42 ioctl 65 rt_sigaction 168 rt_sigprocmask 198 write 1092
The previous report shows the system calls that are being called most often, which in this case, is thewrite() system call.
You can use the syscall provider to further examine the source of all of the write() system calls, forexample:
# dtrace -n syscall::write:entry'/pid == 31337/{ @writes = quantize(arg2); }'dtrace: description ’syscall::write:entry’ matched 1 probe
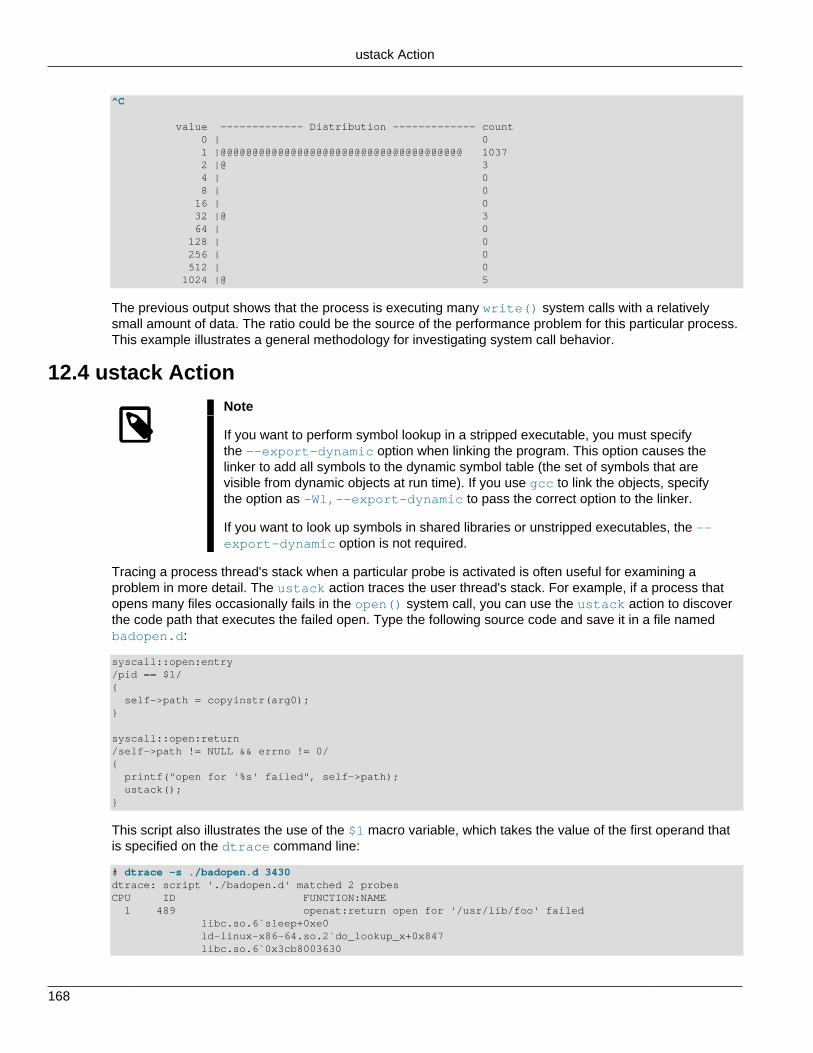
ustack Action
168
^C
value ------------- Distribution ------------- count 0 | 0 1 |@@@@@@@@@@@@@@@@@@@@@@@@@@@@@@@@@@@@@@ 1037 2 |@ 3 4 | 0 8 | 0 16 | 0 32 |@ 3 64 | 0 128 | 0 256 | 0 512 | 0 1024 |@ 5
The previous output shows that the process is executing many write() system calls with a relativelysmall amount of data. The ratio could be the source of the performance problem for this particular process.This example illustrates a general methodology for investigating system call behavior.
12.4 ustack ActionNote
If you want to perform symbol lookup in a stripped executable, you must specifythe --export-dynamic option when linking the program. This option causes thelinker to add all symbols to the dynamic symbol table (the set of symbols that arevisible from dynamic objects at run time). If you use gcc to link the objects, specifythe option as -Wl,--export-dynamic to pass the correct option to the linker.
If you want to look up symbols in shared libraries or unstripped executables, the --export-dynamic option is not required.
Tracing a process thread's stack when a particular probe is activated is often useful for examining aproblem in more detail. The ustack action traces the user thread's stack. For example, if a process thatopens many files occasionally fails in the open() system call, you can use the ustack action to discoverthe code path that executes the failed open. Type the following source code and save it in a file namedbadopen.d:
syscall::open:entry/pid == $1/{ self->path = copyinstr(arg0);}
syscall::open:return/self->path != NULL && errno != 0/{ printf("open for '%s' failed", self->path); ustack();}
This script also illustrates the use of the $1 macro variable, which takes the value of the first operand thatis specified on the dtrace command line:
# dtrace -s ./badopen.d 3430dtrace: script './badopen.d' matched 2 probesCPU ID FUNCTION:NAME 1 489 openat:return open for '/usr/lib/foo' failed libc.so.6`sleep+0xe0 ld-linux-x86-64.so.2`do_lookup_x+0x847 libc.so.6`0x3cb8003630
uregs[] Array
169
libc.so.6`0x3cb8003c48 libc.so.6`0x3cb800e2c8 libc.so.6`0x3cb8003c48 looper`0x400612 libc.so.6`getenv+0x2a looper`0x4003c8 looper`0x4009b0 libc.so.6`0x3cb800e2c8 looper`0x4009b0 looper`doOpenLoop+0x33 looper`0x400e9c looper`main+0x5f looper`0x400ea9 libc.so.6`__libc_start_main+0xfd looper`main looper`0x4009b0 looper`__libc_csu_init
The ustack action records program counter (PC) values for the stack and the dtrace command resolvesthe PC values to symbol names by looking though the process's symbol tables. If dtrace cannot resolvethe PC value to a symbol, it prints out the value as a hexadecimal integer.
If a process exits or is killed before the ustack data is formatted for output, dtrace might be unable toconvert the PC values in the stack trace to symbol names and the command displays them as hexadecimalintegers.
12.5 uregs[] Array
The uregs[] array enables you to access individual user registers. See Table 12.1, “x86 uregs[]Constants”, which lists the index constants into the uregs[] array for each supported architecture.
The following table lists the index constants into the uregs[] array for each supported architecture.
Table 12.1 x86 uregs[] Constants
Constant Register Architecture
R_PC program counter register x86, AMD64
R_SP stack pointer register x86, AMD64
R_R0 first return code x86, AMD64
R_R1 second return code x86, AMD64
R_CS %cs x86, AMD64
R_GS %gs x86, AMD64
R_ES %es x86, AMD64
R_DS %ds x86, AMD64
R_EDI %ed x86, AMD64
R_ESI %es x86, AMD64
R_EBP %ebp x86, AMD64
R_EAX %eax x86, AMD64
R_ESP %esp x86, AMD64
R_EAX %eax x86, AMD64
R_EBX %ebx x86, AMD64
R_ECX %ecx x86, AMD64

Using the pid Provider
170
Constant Register Architecture
R_EDX %edx x86, AMD64
R_TRAPNO %trapno x86, AMD64
R_ERR %err x86, AMD64
R_EIP %eip x86, AMD64
R_CS %cs x86, AMD64
R_EFL %efl x86, AMD64
R_UESP %uesp x86, AMD64
R_SS %ss x86, AMD64
R_RSP %rsp AMD64
R_RFL %rfl AMD64
R_RIP %rip AMD64
R_RAX %rax AMD64
R_RCX %rcx AMD64
R_RDX %rdx AMD64
R_RBP %rbp AMD64
R_RSI %rsi AMD64
R_RDI %rdi AMD64
R_R8 %r8 AMD64
R_R9 %r9 AMD64
R_R10 %r10 AMD64
R_R11 %r11 AMD64
R_R12 %r12 AMD64
R_R13 %r13 AMD64
R_R14 %r14 AMD64
R_R15 %r15 AMD64
12.6 Using the pid ProviderThe pid provider enables you to trace any instruction in a process. Unlike most other providers, pidprobes are created on demand, based on the probe descriptions that are found in your D programs. As aresult, no pid probes are listed in the output of the dtrace -l command until you enable them.
12.6.1 User Function Boundary Tracing
The simplest mode of operation for the pid provider is to provide function boundary tracing in userspace. The following example program traces all of the function entries and returns that are made from asingle function. The $1 macro variable, the first operand on the command line, is the process ID for theprocess to trace. The $2 macro variable, the second operand on the command line, is the name of thefunction from which to trace all function calls. Type the following source code and save it in a file nameduserfunc.d:
#!/usr/sbin/dtrace -s#pragma D option flowindent

User Function Boundary Tracing
171
pid$1::$2:entry{ self->trace = 1;}
pid$1:::entry,pid$1:::return/self->trace/{}
pid$1::$2:return/self->trace/{ self->trace = 0;}
Type the previous example script and save it in a file named userfunc.d, then use the chmod commandto make the file executable. This script produces output with more details on the principal buffer:
# ./userfunc.d 123 executedtrace: script ’./userfunc.d’ matched 11594 probes 0 -> execute 0 -> execute 0 -> Dfix 0 <- Dfix 0 -> s_strsave 0 -> malloc 0 <- malloc 0 <- s_strsave 0 -> set 0 -> malloc 0 <- malloc 0 <- set 0 -> set1 0 -> tglob 0 <- tglob 0 <- set1 0 -> setq 0 -> s_strcmp 0 <- s_strcmp...
The pid provider can only be used on processes that are already running. You can use the $targetmacro variable (see Chapter 9, Scripting) and the dtrace command with the -c and -p options to createand grab processes of interest and instrument them by using DTrace.
For example, you can use the following D script to determine the distribution of function calls that aremade to libc by a particular subject process. Type the following source code and save it in a file namedlibc.d:
pid$target:libc.so::entry{ @[probefunc] = count();}
To determine the distribution of such calls that are made by the date command, save the script in a filenamed libc.d and run the following command:
# dtrace -s libc.d -c datedtrace: script ’libc.d’ matched 2476 probesFri Jul 30 14:08:54 PDT 2004dtrace: pid 109196 has exited
pthread_rwlock_unlock 1
Tracing Arbitrary Instructions
172
_fflush_u 1 rwlock_lock 1 rw_write_held 1 strftime 1 _close 1 _read 1 __open 1 _open 1 strstr 1 load_zoneinfo 1... _ti_bind_guard 47 _ti_bind_clear 94
12.6.2 Tracing Arbitrary Instructions
You can use the pid provider to trace any instruction in any user function. Upon demand, the pidprovider creates a probe for every instruction in a function. The name of each probe is the offset of itscorresponding instruction in the function and is expressed as a hexadecimal integer. For example, toenable a probe that is associated with the instruction at offset 0x1c in the function foo of the modulebar.so in the process with PID 123, you would use the following command:
# dtrace -n pid123:bar.so:foo:1c
To enable all of the probes in the function foo, including the probe for each instruction, you would use thefollowing command:
# dtrace -n pid123:bar.so:foo:
Using the previous command demonstrates an extremely powerful technique for debugging and analyzinguser applications. Infrequent errors can be difficult to debug because they can be difficult to reproduce.Often, you can identify a problem after the failure has occurred, which is too late to reconstruct the codepath.
The following example demonstrates how to combine the pid provider with speculative tracing to solve thisproblem by tracing every instruction in a function. See Chapter 7, Speculative Tracing for a description.
Type the following source code and save it in a file named errorpath.d:
pid$1::$2:entry{ self->spec = speculation(); speculate(self->spec); printf("%x %x %x %x %x", arg0, arg1, arg2, arg3, arg4);}
pid$1::$2:/self->spec/{ speculate(self->spec);}
pid$1::$2:return/self->spec && arg1 == 0/{ discard(self->spec); self->spec = 0;}
pid$1::$2:return/self->spec && arg1 != 0/{ commit(self->spec);

Tracing Arbitrary Instructions
173
self->spec = 0;}
Executing the errorpath.d script results in output similar to the following:
# ./errorpath.d 123 _chdirdtrace: script ’./errorpath.d’ matched 19 probesCPU ID FUNCTION:NAME 0 25253 _chdir:entry 81e08 6d140 ffbfcb20 656c73 0 0 25253 _chdir:entry 0 25269 _chdir:0 0 25270 _chdir:4 0 25271 _chdir:8 0 25272 _chdir:c 0 25273 _chdir:10 0 25274 _chdir:14 0 25275 _chdir:18 0 25276 _chdir:1c 0 25277 _chdir:20 0 25278 _chdir:24 0 25279 _chdir:28 0 25280 _chdir:2c 0 25268 _chdir:return

174

175
Chapter 13 Statically Defined Tracing of User Applications
Table of Contents13.1 Choosing the Probe Points ...................................................................................................... 17513.2 Adding Probes to an Application .............................................................................................. 175
13.2.1 Defining Providers and Probes ..................................................................................... 17613.2.2 Adding Probes to Application Code ............................................................................... 17613.2.3 Testing if a Probe Is Enabled ....................................................................................... 17713.2.4 Building Applications With Probes ................................................................................. 17713.2.5 Using Statically Defined Probes .................................................................................... 178
DTrace provides a facility for user application developers to define customized probes in application codeto augment the capabilities of the pid provider. These static probes impose little to no overhead whendisabled and are dynamically enabled like all other DTrace probes. You can use static probes to describeapplication semantics to users of DTrace without exposing or requiring implementation knowledge ofyour applications. This chapter describes how to define static probes in user applications and how to useDTrace to enable such probes in user processes.
Note
DTrace supports statically defined tracing of user applications for both 32-bit and64-bit binaries.
For information about using static probes with kernel modules, see Chapter 14, Statically Defined Tracingof Kernel Modules.
13.1 Choosing the Probe Points
DTrace enables developers to embed static probe points in application code, including both completeapplications and shared libraries. You can enable these probes wherever the application or library isrunning, either in development or production. You should define probes that have a semantic meaning thatis readily understood by your DTrace user community. For example, you could define query-receiveand query-respond probes for a web server that correspond to a client that is submitting a request andthe web server that is responding to the request. These example probes are easily understood by mostDTrace users and correspond to the highest level abstractions for the application, rather than lower-levelimplementation details. DTrace users can use these probes to understand the time distribution of requests.If your query-receive probe presented the URL request strings as an argument, a DTrace user coulddetermine which requests were generating the most disk I/O by combining this probe with the io provider.
You should also consider the stability of the abstractions you describe when choosing probe namesand locations. For example, will the probe persist in future releases of the application even if theimplementation changes? Does the probe make sense on all system architectures or is it specific toa particular instruction set? This chapter discusses how these decisions can guide your static tracingdefinitions.
13.2 Adding Probes to an Application
DTrace probes for libraries and executables are defined in an ELF section in the corresponding applicationbinary. The following topics are discussed in more detail in this section: defining probes, adding probes toyour application source code, and augmenting your application's build process to include the DTrace probedefinitions.

Defining Providers and Probes
176
13.2.1 Defining Providers and Probes
You define DTrace probes in a .d source file, which is then used when compiling and linking yourapplication. First, select an appropriate name for your user application provider. The provider name thatyou choose is appended with the process identifier for each process that is executing your applicationcode. For example, if you chose the provider name myserv for a web server that was executing asprocess ID 1203, the DTrace provider name that corresponds to this process would be myserv1203. In a.d source file, you would add a provider definition similar to the one that is shown the following example:
provider myserv{ ...};
Next, add a definition for each probe and the corresponding arguments. The following example definesthe two probes that are discussed in Section 13.1, “Choosing the Probe Points”. The first probe has twoarguments, both of type char *. The second probe has no arguments. The D compiler converts twoconsecutive underscores (__) to a dash (-) in the probe name:
provider myserv{ probe query__receive(char *, char *); probe query__respond();};
You can add stability attributes to your provider definition so that consumers of your probes understand thelikelihood of change in future versions of your application. See Chapter 16, DTrace Stability Features formore information on DTrace stability attributes.
The following example illustrates how stability attributes are defined:
#pragma D attributes Evolving/Evolving/Common provider myserv provider#pragma D attributes Private/Private/Unknown provider myserv module#pragma D attributes Private/Private/Unknown provider myserv function#pragma D attributes Evolving/Evolving/Common provider myserv name#pragma D attributes Evolving/Evolving/Common provider myserv args
provider myserv{ probe query__receive(char *, char *); probe query__respond();};
13.2.2 Adding Probes to Application Code
After you have defined your probes in a .d file, you then need to augment your source code to indicate thelocations that should trigger your probes. Consider the following example C application source code:
void main_look(void){ ... query = wait_for_new_query(); process_query(query); ...}
To add probes to an application, use the -h option to the dtrace command, which generates a header filebased on the probe definitions. For example, the following command generates the header file myserv.h,which contains macro definitions corresponding to the probe definitions in myserv.d:
# dtrace -h -s myserv.d

Testing if a Probe Is Enabled
177
This method is recommended, as the coding is easier to implement and understand. The method is alsocompatible with both C and C++. In addition, because the generated macros depend on the types that youdefine in the provider definition, the compiler can perform type checking on them.
For example, you can add a probe site by using the MYSERV_QUERY_RECEIVE macro that dtrace -hdefines in myserv.h:
#include "myserv.h"...void main_look(void){ ... query = wait_for_new_query(); MYSERV_QUERY_RECEIVE(query->clientname, query->msg); process_query(query); ...}
In the previous example, the name of the macro encodes both the provider name and the probe name.
13.2.3 Testing if a Probe Is Enabled
The computational overhead of a DTrace probe is usually equivalent to a few no-op instructions. However,setting up probe arguments can be expensive, particularly in the case of dynamic languages, where thecode has to determine the name of a class or the method at runtime.
In addition to the probe macro, the dtrace -h command creates an is-enabled probe macro for eachprobe that you specify in the provider definition. To ensure that your program computes the arguments toa DTrace probe only when required, you can use the is-enabled probe test to verify whether the probe iscurrently enabled, for example:
if (MYSERV_QUERY_RECEIVE_ENABLED()) MYSERV_QUERY_RECEIVE(query->clientname, query->msg);
If the probe arguments are computationally expensive to calculate, the slight overhead that is incurred byperforming the is-enabled probe test is more than offset when the probe is not enabled.
13.2.4 Building Applications With Probes
You must augment the build process for your application to include the DTrace provider and probedefinitions. A typical build process takes each source file and compiles it to create a corresponding objectfile. The compiled object files are then linked to each other to create the finished application binary, asshown in the following example:
src1.o: src1.c gcc -c src1.c
src2.o: src2.c gcc -c src2.c
myserv: src1.o src2.o gcc -o myserv src1.o src2.o
If you included DTrace probe definitions in your application, you need to add appropriate Makefile rulesto your build process to execute the dtrace command.
The dtrace command post-processes the object files that are created by the preceding compilercommands and generates the object file myserv.o from myserv.d and the other object files. The -Goption is used to link provider and probe definitions with a user application.

Using Statically Defined Probes
178
The -Wl,--export-dynamic link options to gcc are required to support symbol lookup in a strippedexecutable at runtime, for example, by running ustack().
If you inserted probes in the source code by using the macros that were defined in a header file created bydtrace -h, you need to include that command in the Makefile:
myserv.h: myserv.d dtrace -h -s myserv.d
src1.o: src1.c myserv.h gcc -c src1.c
src2.o: src2.c myserv.h gcc -c src2.c
myserv.o: myserv.d src1.o src2.o dtrace -G -s myserv.d src1.o src2.o
myserv: myserv.o gcc -Wl,--export-dynamic,--strip-all -o myserv myserv.o src1.o src2.o
The rules in the Makefile take into account the dependency of the header file on the probe definition.
13.2.5 Using Statically Defined Probes
The DTrace helper device (/dev/dtrace/helper) enables a user-space application that contains USDTprobes to send probe provider information to DTrace.
If the program that is to be traced is run by a user other than root, change the mode of the DTrace helperdevice to allow the user to record tracing information:
# chmod 666 /dev/dtrace/helper
Alternatively, if the acl package is installed on your system, you can use an ACL rule to limit access to aspecific user, as shown in the following example:
# setfacl -m u:guest:rw /dev/dtrace/helper# ls -l /dev/dtracetotal 0crw-rw---- 1 root root 10, 16 Sep 26 10:38 dtracecrw-rw----+ 1 root root 10, 17 Sep 26 10:38 helperdrwxr-xr-x 2 root root 80 Sep 26 10:38 provider# getfacl /dev/dtrace/helpergetfacl: Removing leading '/' from absolute path names# file: dev/dtrace/helper# owner: root# group: rootuser::rw-user:guest:rw-group::rw-mask::rw-other::---
Note
You must change the mode on the device before the user runs the program.
The full name of a probe in a user application takes the usual providerPID:module:function:nameform, where:
provider Is the name of the provider, as defined in the provider definition file.

Using Statically Defined Probes
179
PID Is the process ID of the running executable.
module Is the name of the executable.
function Is the name of the function where the probe is located.
name Is the name of the probe, as defined in the provider definition file withany two consecutive underscores (__) replaced by a dash (-).
For example, for a myserv process with a PID of 1173, the full name of the query-receive probe wouldbe myserv1173:myserv:main_look:query-receive.
The following simple example shows how to invoke a traced process from dtrace:
# dtrace -c ./myserv -qs /dev/stdin <<EOF $target:::query-receive { printf("%s:%s:%s:%s %s %s\n", probeprov, probemod, probefunc, probename, stringof(args[0]), stringof(args[1])); } $target:::query-respond { printf("%s:%s:%s:%s\n", probeprov, probemod, probefunc, probename); }EOF
myserv1173:myserv:main_look:query-receive foo1 msg1myserv1173:myserv:process_query:query-respondmyserv1173:myserv:main_look:query-receive bar2 msg1myserv1173:myserv:process_query:query-respond...
Note
For the query-receive probe, stringof() is used to cast args[0] andargs[1] to type string. Otherwise, a DTrace compilation error similar to thefollowing is displayed:
dtrace: failed to compile script /dev/stdin: line 7:printf( ) argument #5 is incompatible with conversion #4 prototype: conversion: %s prototype: char [] or string (or use stringof) argument: char *
If the probe arguments were defined as type string instead of char * in theprobe definition file, a compilation warning similar to the following would bedisplayed:
In file included from src1.c:5:myserv.h:39: warning: parameter names (without types) in function declaration
In this case, casting the probe arguments to the type string would no longer berequired.
The following script illustrates the complete process of instrumenting, compiling and tracing a simple user-space program. Save it in a file named testscript:
#!/bin/bash
# Define the probescat > prov.d <<EOFprovider myprog

Using Statically Defined Probes
180
{ probe dbquery__entry(char *); probe dbquery__result(int);};EOF
# Create the C programcat > test.c <<EOF#include <stdio.h>#include "prov.h"
intmain(void){ char *query = "select value from table where name = 'foo'"; /* If the dbquery-entry probe is enabled, trigger it */ if (MYPROG_DBQUERY_ENTRY_ENABLED()) MYPROG_DBQUERY_ENTRY(query); /* Pretend to run query and obtain result */ sleep(1); int result = 42; /* If the dbquery-result probe is enabled, trigger it */ if (MYPROG_DBQUERY_RESULT_ENABLED()) MYPROG_DBQUERY_RESULT(result); return (0);}EOF
test.o: test.c prov.h gcc -c test.c
prov.o: prov.d test.o dtrace -G -s prov.d test.o
test: prov.o gcc -o test prov.o test.oEOF
# Make the executablemake test
# Trace the programdtrace -c ./test -qs /dev/stdin <<EOFmyprog\$target:::dbquery-entry{ self->ts = timestamp; printf("Query = %s\n", stringof(args[0]));}
myprog\$target:::dbquery-result{ printf("Query time = %d microseconds; Result = %d\n", (timestamp - self->ts) / 1000, args[0]);}EOF
The output from running this script shows the compilation steps, as well as the results of tracing theprogram:
# chmod +x testscript# ./testscriptdtrace -h -s prov.dgcc -c test.cdtrace -G -s prov.d test.ogcc -o test prov.o test.o

Using Statically Defined Probes
181
Query = select value from table where name = 'foo'Query time = 1000481 microseconds; Result = 42

182

183
Chapter 14 Statically Defined Tracing of Kernel Modules
Table of Contents14.1 Inserting Static Probe Points ................................................................................................... 18314.2 Building Modules With Static Probes ....................................................................................... 18614.3 Using DTrace to Test Modules With Static Probes ................................................................... 188
DTrace provides a facility for developers to define customized probes in kernel modules. These staticprobes appear as additional probes of the sdt provider and impose little to no overhead if the sdt moduleis not loaded. For example, for x86_64, the overhead is a single-byte NOP, followed by a 4-byte NOP. Thischapter provides a full example of how to define and use static probes in a kernel module.
The general principles for naming probes and choosing insertion points are the same for kernel modulesas they are for user-space applications. You should define probes that have a semantic meaning that isreadily understood by your DTrace user community. Typically, you might name probes for the routine inwhich you place them and their position in that routine. For example, if your probes provide informationabout data values on entry to or return from a routine named foo, you might name them foo-entry andfoo-return. The data values that are returned by such probes could present the routine as a black box,rather than return intermediate values from the internal implementation of the module. To gather data fromdeeper within a module, you might insert additional probes with names such as foo-stage1 or foo-post-hardware-init.
In one respect, using static probes with kernel modules can be simpler than for user-space applications.You do not need to modify the build files unless you want to conditionally compile a module to include theprobes. Inserting the probes in the source code is slightly more complex, as you cannot use the dtrace -h command to generate the probe macros. However, using a DTRACE_PROBE macro to insert a probe is arelatively simple change to make to the source code.
You can insert sdt static probes in any Oracle Linux kernel module for which you have the source files andthe necessary build infrastructure, but note that DTrace supports statically defined tracing of 64-bit kernelmodules only.
For more information about the sdt provider, see Section 11.5, “sdt provider”.
For an introduction to the concepts of statically defined tracing as applied to user-space applications, seeChapter 13, Statically Defined Tracing of User Applications.
14.1 Inserting Static Probe Points
You can embed static probes within the source code for which you want to capture the current state of amodule and its data.
The following example pseudo character device driver consists of three source files:
revdev.h Is the header file for the module.
rev_mod.c Defines the module's properties and its init and exit routines.
rev_dev.c Defines the driver's open, read, release, unlocked_ioctl,and write routines. The static probes are inserted in the read,unlocked_ioctl, and write routines, although probes could also beinserted in the other routines, if required.

revdev.h Example
184
revdev.h Example
The module header file revdev.h must be prepared, as indicated in bold font in the following example, byadding lines to include linux/sdt.h and to define probe macros.
#include <asm/uaccess.h>#include <linux/cdev.h>#include <linux/fs.h>#include <linux/kernel.h>#include <linux/miscdevice.h>#include <linux/module.h>#include <linux/mutex.h>#include <linux/types.h>#include <linux/sdt.h>
#define DEVICE "revdev"
#define REVDEV_IOCTL_ENTRY_PROBE(name, file, cmd, arg) \ DTRACE_PROBE3(ioctl__##name, struct file *, file, \ unsigned int, cmd, unsigned long, arg)#define REVDEV_IOCTL_RETURN_PROBE(name, str) \ DTRACE_PROBE1(ioctl__##name, struct char *, str)#define REVDEV_READ_ENTRY_PROBE(name,fp,buf) \ DTRACE_PROBE2(read__##name, file *, fp, char *, buf)#define REVDEV_READ_RETURN_PROBE(name,buf,n) \ DTRACE_PROBE2(read__##name, char *, buf, size_t, n)#define REVDEV_WRITE_ENTRY_PROBE(name,fp,buf,n) \ DTRACE_PROBE3(write__##name, file *, fp, char *, buf, size_t, n)#define REVDEV_WRITE_RETURN_PROBE(name,buf,n) \ DTRACE_PROBE2(write__##name, char *, buf, size_t, n)
The DTRACE_PROBE macros that are defined in /lib/modules/`uname -r`/build/include/linux/sdt.h support from zero to eight arguments.
You can define your own macros for the inserted probes, as shown in the preceding example. Unlikeuser-space static probes, you cannot use the dtrace -h command to create a header file that includessuitable probe definitions. You do not need to create a provider definition file for the probes.
The probes are named according to the first argument of the DTRACE_PROBE macro. The suffix N in themacro name DTRACE_PROBEN refers the number of arguments that are passed to the probe. The firstargument to the probe macro is the probe name. As described in Section 11.5.1.1, “Declaring Probes”,two consecutive underscores are converted to a single dash. The remaining macro arguments are pairsof arguments that define the DTrace argn variables that are assigned when the probe fires. Each pair ofarguments defines the variable type and a variable name, for example:
#define REVDEV_WRITE_ENTRY_PROBE(name, fp, buf, n) \ DTRACE_PROBE3(write__##name, file *, fp, char *, buf, size_t, n)
The values of fp, buf, and n are made available by the arg0, arg1, and arg2 variables in DTrace whenthe probe fires.
The provider, module, and function elements of the complete probe are named for sdt, the driver modulename (without the .ko), and the driver routine.
The probes inherit the stability attributes of the sdt provider.
rev_mod.c Example
No changes are made in the following example, which does not insert any probes in the module's initand exit routines. Note that there is no restriction on inserting probes in these routines.

rev_dev.c Example
185
#include "revdev.h"
MODULE_AUTHOR("DTrace Example");MODULE_DESCRIPTION("Using DTrace SDT probes with a device driver");MODULE_VERSION("v1.0");MODULE_LICENSE("GPL");
extern const struct file_operations revdev_fops;
static struct miscdevice revdev = { .minor = 0, .name = DEVICE, .fops = &revdev_fops,};
DEFINE_MUTEX(revdev_mutex);
static int revdev_entry(void){ /* Register device */ int retval; retval = misc_register(&revdev); if (retval < 0) { printk(KERN_ERR "revdev: Could not register device"); return retval; } mutex_init(&revdev_mutex); return 0;}
static void revdev_exit(void){ misc_deregister(&revdev);}
/* Define module init and exit calls */module_init(revdev_entry);module_exit(revdev_exit);
rev_dev.c Example
No existing lines of code are modified in this example. Only line insertions are required for the entry andreturn probes in each of the read, unlocked_ioctl, and write routines.
The changes in this example appear in bold font.
#include "revdev.h"
static struct device_buffer { char data[80];} devbuf;
static char *oddeven[] = { "Even", "Odd" };
extern struct mutex revdev_mutex;
static long revdev_ioctl(struct file *file, unsigned int cmd, unsigned long arg) { char *cp; REVDEV_IOCTL_ENTRY_PROBE(entry, file, cmd, arg); cp = oddeven[arg%2]; REVDEV_IOCTL_RETURN_PROBE(return, cp); return -EAGAIN;}
static int revdev_open(struct inode *inode, struct file *fp){ if (!mutex_trylock(&revdev_mutex)){ printk(KERN_INFO "revdev: Device already in use"); return -EBUSY;

Building Modules With Static Probes
186
} return 0;}
static void revstr(char *s) { /* After Kernighan and Ritchie */ int i, j, t; for (i = 0, j = strlen(s)-1; i < j; i++, j--) t = s[i], s[i] = s[j], s[j] = t;}
static ssize_t revdev_read(struct file *fp, char* buf, size_t n, loff_t *o){ int retval; REVDEV_READ_ENTRY_PROBE(entry, fp, devbuf.data); revstr(devbuf.data); n = strlen(devbuf.data); retval = copy_to_user(buf, devbuf.data, n); REVDEV_READ_RETURN_PROBE(return, buf, n); if (retval != 0) return -EINVAL; return 0;}
static ssize_t revdev_write(struct file *fp, const char* buf, size_t n, loff_t *o){ int retval; REVDEV_WRITE_ENTRY_PROBE(entry, fp, buf, n); retval = copy_from_user(devbuf.data, buf, n); devbuf.data[n-retval] = '\0'; REVDEV_WRITE_RETURN_PROBE(return, devbuf.data, n); if (retval != 0) return -EINVAL; return 0;}
static int revdev_close(struct inode *inode, struct file *fp){ mutex_unlock(&revdev_mutex); return 0;}
const struct file_operations revdev_fops = { .owner = THIS_MODULE, .read = revdev_read, .write = revdev_write, .unlocked_ioctl = revdev_ioctl, .open = revdev_open, .release = revdev_close,};
14.2 Building Modules With Static Probes
Note
The following example requires that you link the module against a UEK version thatsupports the DTrace modules, which can be either UEK R5 or UEK R4 for OracleLinux 7 or UEK R4 for Oracle Linux 6.
A bug in the current implementation means that a module containing SDT probesmust be built from two or more source files.
The following Kbuild and Makefile are used to build the example pseudo driver module revdev.koand a test program named testrevdev.
Kbuild Example
bj-m += revdev.o

Makefile Example
187
revdev-y := rev_dev.o rev_mod.o
Makefile Example
Note
All of the command lines in the Makefile, such as those beginning with gcc in thefollowing example, must start with tabs.
KERNEL_DIR = /lib/modules/`uname -r`/build
modules:: testrevdev
install:: modules_install
testrevdev: testrevdev.c gcc -o testrevdev testrevdev.c
%:: $(MAKE) -C $(KERNEL_DIR) M=`pwd` $@
The source file for testrevdev is testrevdev.c.
testrevdev.c Example#include <fcntl.h>#include <stdio.h>#include <stdlib.h>#include <string.h>#define DEVICE_FILE "/dev/revdev"
int main() { char buf[81]; int i, fd, n;
if ((fd = open(DEVICE_FILE, O_RDWR)) != 0) { perror("open"); exit(1); }
i=0; while (1) { (i++)%20; printf("Write: "); scanf(" %80[^\n]", buf); n = strlen(buf); if (!strncmp(buf, "exit", 4)) break; else if (!strncmp(buf, "ioctl", 5)) ioctl(fd,128,i); else { write(fd, buf, n); read(fd, buf, n); buf[n]='\0'; printf(" Read: %s\n", buf); } }
close(fd); exit(0);}
When run, testrevdev reads a string that you enter, writes the string to the revdev device, and thenreads the reversed string from the device.

Using DTrace to Test Modules With Static Probes
188
If the input string begins with ioctl, the program calls ioctl on the open file descriptor, which invokesthe device's unlocked_ioctl routine. An input string that begins with exit terminates the program.
To build the module and test program, use the make command:
# makemake -C /lib/modules/`uname -r`/build M=`pwd` modulesmake[1]: Entering directory `/usr/src/kernels/4.1.12-version.el6uek.x86_64' CC [M] /root/revdev/rev_dev.o CC [M] /root/revdev/rev_mod.o SDTSTB /root/revdev/revdev.sdtstub.S AS [M] /root/revdev/revdev.sdtstub.o LD [M] /root/revdev/revdev.o Building modules, stage 2. MODPOST 1 modules SDTINF /root/revdev/revdev.sdtinfo.c CC /root/revdev/revdev.mod.o CTF LD [M] /root/revdev/revdev.komake[1]: Leaving directory `/usr/src/kernels/4.1.12-version.el6uek.x86_64'
14.3 Using DTrace to Test Modules With Static ProbesYou can use DTrace to display information when one of the embedded static probes in a module fires.
To test the example module revdev.ko:
1. Set up a udev rule to create the /dev/revdev device file:
# echo "KERNEL==\"revdev\", MODE=\"0660\"" > /etc/udev/rules.d/10-revdev.rules
2. Load the revdev.ko module:
# insmod revdev.ko
You can use dtrace to test that the probes are now available:
# dtrace -l -m revdev ID PROVIDER MODULE FUNCTION NAME 4 sdt revdev revdev_ioctl ioctl-return 5 sdt revdev revdev_ioctl ioctl-entry 6 sdt revdev revdev_write write-return 7 sdt revdev revdev_write write-entry 8 sdt revdev revdev_read read-return 9 sdt revdev revdev_read read-entry
3. Enter the following DTrace script (traceflow):
#!/usr/sbin/dtrace -qs#pragma D option nspec=10
self int indent;
syscall:::entry/execname == "testrevdev"/{ self->specflag = 0; self->spec = speculation(); self->indent += 2; speculate(self->spec);}
syscall:::entry/self->spec/{
Using DTrace to Test Modules With Static Probes
189
speculate(self->spec); printf("%*s ", self->indent, "->"); printf("%s() entry\n",probefunc); self->indent += 2;}
syscall:::return/self->spec/{ speculate(self->spec); self->indent -= 2; printf("%*s ", self->indent, "<-"); printf("%s() return\n",probefunc);}
syscall:::return/self->spec && self->specflag == 0/{ discard(self->spec); self->indent -= 2; self->spec = 0;}
syscall:::return/self->spec && self->specflag == 1/{ commit(self->spec); self->indent -= 2; self->spec = 0;}
sdt:revdev::ioctl-entry/self->spec/{ speculate(self->spec); self->specflag = 1; printf("%*s ", self->indent, "=>"); printf("%s() entry file: %s cmd: %d arg: %d\n", probefunc, d_path(&(((struct file *)arg0)->f_path)), arg1, arg2);}
sdt:revdev::ioctl-return/self->spec/{ speculate(self->spec); printf("%*s ", self->indent, "<="); printf("%s() return cpstr: %s\n", probefunc, stringof((char*)arg0));}
sdt:revdev::read-entry/self->spec/{ speculate(self->spec); self->specflag = 1; printf("%*s ", self->indent, "=>"); printf("%s() entry file: %s devbuf: %s\n", probefunc, d_path(&(((struct file *)arg0)->f_path)), stringof((char *)arg1));}
sdt:revdev::read-return/self->spec/{ speculate(self->spec); printf("%*s ", self->indent, "<="); printf("%s() return string: %s len: %d\n", probefunc, stringof((char *)arg0), arg1);

Using DTrace to Test Modules With Static Probes
190
}
sdt:revdev::write-entry/self->spec/{ speculate(self->spec); self->specflag = 1; printf("%*s ", self->indent, "=>"); printf("%s() entry file: %s string: %s len: %d\n", probefunc, d_path(&(((struct file *)arg0)->f_path)), stringof((char *)arg1), arg2);}
sdt:revdev::write-return/self->spec/{ speculate(self->spec); printf("%*s ", self->indent, "<="); printf("%s() return string: %s len: %d\n", probefunc, stringof((char *)arg0), arg1);}
When one of the inserted probes fires, traceflow displays information about data values in themodule by using the probe argument variables (arg0, arg1, arg2,...).
Note
Argument variables that return pointer types, such as file * and char *,must be explicitly cast.
The script uses d_path and stringof to create printable file paths and strings. For example,(struct file *)arg0 casts the value of arg0 to a file pointer (struct file *). The f_pathmember of the struct file contains the path structure (struct path) for a file. As d_path takesa path pointer (struct path *) as its argument, the & operator is used to return a pointer to thestruct path.
See Section 4.2.8, “d_path” and Section 2.11.4, “String Conversion” for more information.
4. Make traceflow executable:
# chmod +x traceflow
5. In one window, run traceflow:
# ./traceflow
6. In another window, run testrevdev and enter input, for example:
# ./testrevdevWrite: hello Read: ollehWrite: world Read: dlrowWrite: ioctlWrite: ioctlWrite: exit
In the window that traceflow is running, you should see output similar to the following , as DTraceresponds to the probes in revdev.ko that are firing:
# ./traceflow -> write() entry => revdev_write() entry file: /dev/revdev string: hello len: 5

Using DTrace to Test Modules With Static Probes
191
<= revdev_write() return string: hello len: 5<- write() return-> read() entry => revdev_read() entry file: /dev/revdev devbuf: hello <= revdev_read() return string: olleh len: 5<- read() return-> write() entry => revdev_write() entry file: /dev/revdev string: world len: 5 <= revdev_write() return string: world len: 5<- write() return-> read() entry => revdev_read() entry file: /dev/revdev devbuf: world <= revdev_read() return string: dlrow len: 5<- read() return-> ioctl() entry => revdev_ioctl() entry file: /dev/revdev cmd: 128 arg: 3 <= revdev_ioctl() return cpstr: Odd<- ioctl() return-> ioctl() entry => revdev_ioctl() entry file: /dev/revdev cmd: 128 arg: 4 <= revdev_ioctl() return cpstr: Even<- ioctl() return

192

193
Chapter 15 Performance Considerations
Table of Contents15.1 Limit Enabled Probes .............................................................................................................. 19315.2 Using Aggregations ................................................................................................................. 19315.3 Using Cacheable Predicates .................................................................................................... 194
DTrace creates additional work in the system. Therefore, enabling DTrace always affects systemperformance in some way. Often, this effect is negligible, but it can become substantial if many probes withsignificant enablings are enabled. This chapter describes some techniques for minimizing the performanceeffect of DTrace.
15.1 Limit Enabled ProbesDynamic instrumentation techniques enable DTrace to provide unparalleled tracing coverage of the kerneland arbitrary user processes. While this coverage provides revolutionary new insight into system behavior,it also can cause enormous probe effect. If tens of thousands or hundreds of thousands of probes areenabled, the effect on the system can easily be substantial. Therefore, you should only enable as manyprobes as you need to solve a problem. For example, you should not enable all syscall probes if a moreconcise enabling can answer your question. Your question might require that you concentrate on a specificmodule of interest or a specific function.
Caution
When using the pid provider, be especially careful. Because the pid provider caninstrument every instruction, you could enable millions of probes in an applicationand therefore slow the target process to a crawl.
You can also use DTrace in situations where large numbers of probes must be enabled to answer aquestion. Enabling a large number of probes might slow down the system significantly, but it never inducesfatal failure on the system. You should therefore not hesitate to enable many probes, if so required.
15.2 Using AggregationsAs discussed in Chapter 3, Aggregations, DTrace aggregations provide a scalable way to aggregatedata. Associative arrays might appear to offer functionality that is similar to aggregations, but becausegeneral-purpose variables are global by nature, associative arrays cannot offer the linear scalability ofaggregations. Therefore, the preference is to use aggregations over associative arrays whenever possible.For example, the following D program uses an associative array to aggregate data:
syscall:::entry{ totals[execname]++;}
syscall::rexit:entry{ printf("%40s %d\n", execname, totals[execname]); totals[execname] = 0;}
Whereas, the following D program is preferred, as it uses an aggregation to achieve the same result:
syscall:::entry

Using Cacheable Predicates
194
{ @totals[execname] = count();}
END{ printa("%40s %@d\n", @totals);}
15.3 Using Cacheable Predicates
You use DTrace predicates to filter unwanted data from the experiment by tracing data only if a specifiedcondition is found to be true. When enabling many probes, you generally use predicates of a form thatidentifies a specific thread, or threads of interest, such as /self->traceme/ or /pid == 12345/.Although many of these predicates evaluate to a false value for most threads in most probes, theevaluation itself can become costly when done for many thousands of probes. To reduce this cost, DTracecaches the evaluation of a predicate if it includes only thread-local variables, such as /self->traceme/,or for immutable variables, such as /pid == 12345/. The cost of evaluating a cached predicate is muchless than the cost of evaluating a non-cached predicate, especially if the predicate involves thread-localvariables, string comparisons, or other relatively costly operations. While predicate caching is transparentto the user, it does require some guidelines for constructing optimal predicates. Some guidelines forconstructing optimal predicates are outlined in the following table.
Cacheable Uncacheable
self->mumble mumblecurthread
mumblepid
tid
execname curpsinfo->pr_fname
((struct task_struct *)curthread)->comm
pid curpsinfo->pr_pid
((struct task_struct *)curthread)->pid
tid curlwpsinfo->pr_lwpid
((struct task_struct *)curthread)->pid
curthread curthread->any_member
curlwpsinfo->any_member
curpsinfo->any_member
The following example uses an associative array in the predicate and is not cacheable:
syscall::read:entry{ follow[pid, tid] = 1;}
lockstat:::/follow[pid, tid]/{}
syscall::read:return/follow[pid, tid]/
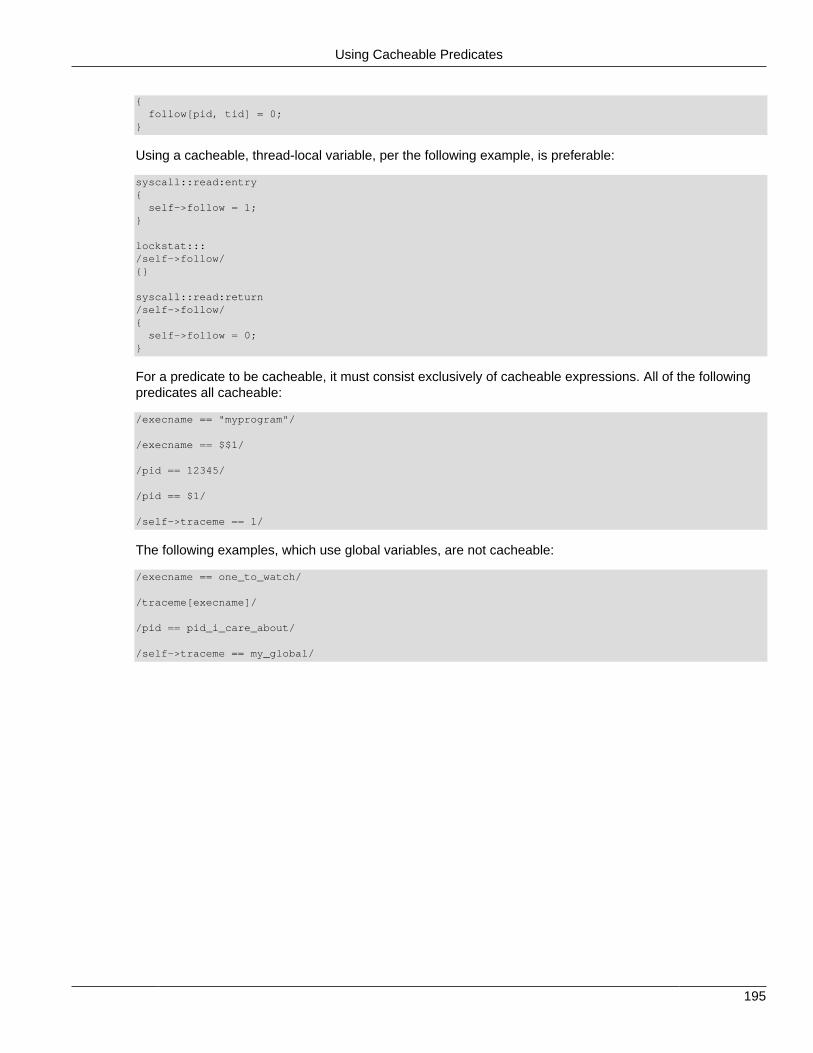
Using Cacheable Predicates
195
{ follow[pid, tid] = 0;}
Using a cacheable, thread-local variable, per the following example, is preferable:
syscall::read:entry{ self->follow = 1;}
lockstat:::/self->follow/{}
syscall::read:return/self->follow/{ self->follow = 0;}
For a predicate to be cacheable, it must consist exclusively of cacheable expressions. All of the followingpredicates all cacheable:
/execname == "myprogram"/
/execname == $$1/
/pid == 12345/
/pid == $1/
/self->traceme == 1/
The following examples, which use global variables, are not cacheable:
/execname == one_to_watch/
/traceme[execname]/
/pid == pid_i_care_about/
/self->traceme == my_global/

196
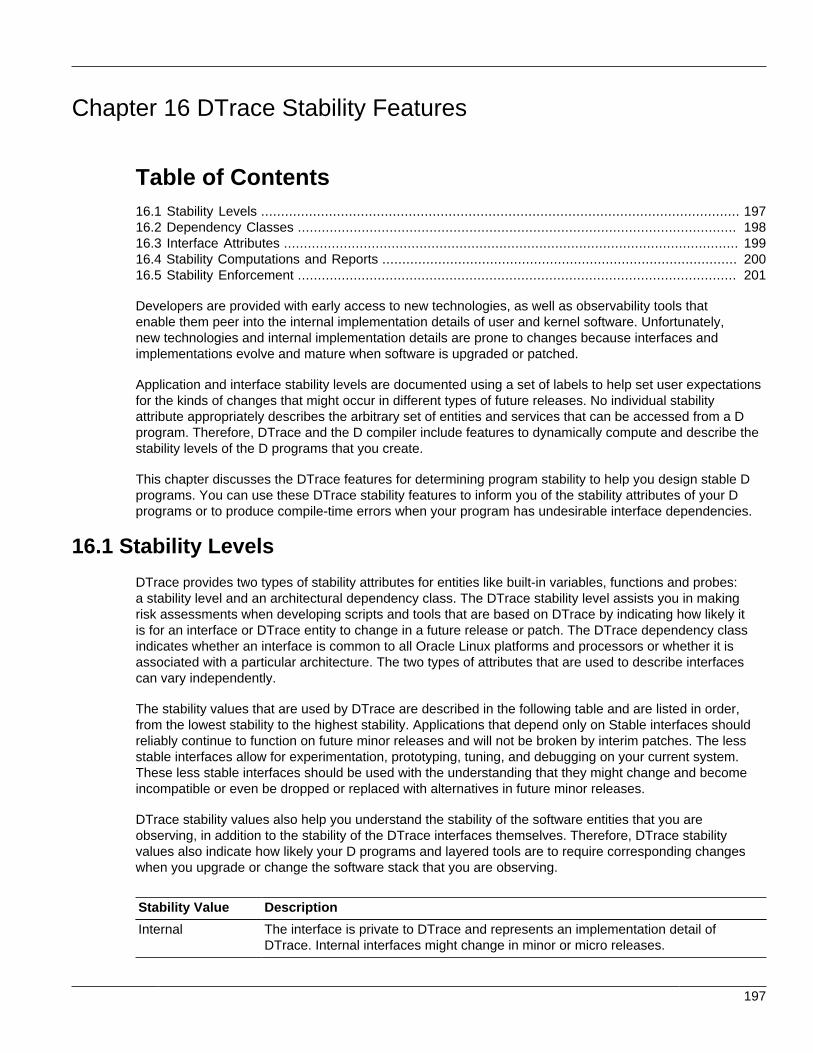
197
Chapter 16 DTrace Stability Features
Table of Contents16.1 Stability Levels ........................................................................................................................ 19716.2 Dependency Classes .............................................................................................................. 19816.3 Interface Attributes .................................................................................................................. 19916.4 Stability Computations and Reports ......................................................................................... 20016.5 Stability Enforcement .............................................................................................................. 201
Developers are provided with early access to new technologies, as well as observability tools thatenable them peer into the internal implementation details of user and kernel software. Unfortunately,new technologies and internal implementation details are prone to changes because interfaces andimplementations evolve and mature when software is upgraded or patched.
Application and interface stability levels are documented using a set of labels to help set user expectationsfor the kinds of changes that might occur in different types of future releases. No individual stabilityattribute appropriately describes the arbitrary set of entities and services that can be accessed from a Dprogram. Therefore, DTrace and the D compiler include features to dynamically compute and describe thestability levels of the D programs that you create.
This chapter discusses the DTrace features for determining program stability to help you design stable Dprograms. You can use these DTrace stability features to inform you of the stability attributes of your Dprograms or to produce compile-time errors when your program has undesirable interface dependencies.
16.1 Stability Levels
DTrace provides two types of stability attributes for entities like built-in variables, functions and probes:a stability level and an architectural dependency class. The DTrace stability level assists you in makingrisk assessments when developing scripts and tools that are based on DTrace by indicating how likely itis for an interface or DTrace entity to change in a future release or patch. The DTrace dependency classindicates whether an interface is common to all Oracle Linux platforms and processors or whether it isassociated with a particular architecture. The two types of attributes that are used to describe interfacescan vary independently.
The stability values that are used by DTrace are described in the following table and are listed in order,from the lowest stability to the highest stability. Applications that depend only on Stable interfaces shouldreliably continue to function on future minor releases and will not be broken by interim patches. The lessstable interfaces allow for experimentation, prototyping, tuning, and debugging on your current system.These less stable interfaces should be used with the understanding that they might change and becomeincompatible or even be dropped or replaced with alternatives in future minor releases.
DTrace stability values also help you understand the stability of the software entities that you areobserving, in addition to the stability of the DTrace interfaces themselves. Therefore, DTrace stabilityvalues also indicate how likely your D programs and layered tools are to require corresponding changeswhen you upgrade or change the software stack that you are observing.
Stability Value Description
Internal The interface is private to DTrace and represents an implementation detail ofDTrace. Internal interfaces might change in minor or micro releases.

Dependency Classes
198
Stability Value Description
Private The interface is private to Oracle and represents an interface developed for use byother Oracle products that are not yet publicly documented for use by customers andISVs (independent software vendors). Private interfaces might change in minor ormicro releases.
Obsolete The interface is supported in the current release but is scheduled to be removed,most likely in a future minor release. The D compiler might produce warningmessages if you attempt to use an Obsolete interface.
External The interface is controlled by an entity other than Oracle. Oracle makes no claimsregarding either source or binary compatibility for External interfaces betweenany two releases. Applications based on these interfaces might not work in futurereleases, including patches that contain External interfaces.
Unstable The interface provides developers early access to new or rapidly changingtechnology or to an implementation artifact that is essential for observing ordebugging system behavior for which a more stable solution is anticipated in thefuture. Oracle makes no claims about either source or binary compatibility forUnstable interfaces from one minor release to another.
Evolving The interface might eventually become Standard or Stable but is still in transition.When non-upward, compatible changes become necessary, they occur in minorand major releases. These changes will be avoided in micro releases wheneverpossible. If such a change is necessary, it will be documented in the release notesfor the affected release. Also, when feasible, migration aids are provided for binarycompatibility and continued D program development.
Stable The interface is a mature interface.
Standard The interface complies with an industry standard. The corresponding documentationfor the interface describes the standard to which the interface conforms. Standardsare typically controlled by a standards development organization. Changes canbe made to the interface in accordance with approved changes to the standard.This stability level can also apply to interfaces that have been adopted (without aformal standard) by an industry convention. Support is provided for only the specifiedversions of a standard; support for later versions is not guaranteed.
16.2 Dependency Classes
Because Oracle Linux and DTrace support a variety of operating platforms and processors, DTrace alsolabels interfaces with a dependency class, which indicates whether an interface is common to all OracleLinux platforms and processors or whether the interface is associated with a particular system architecture.The dependency class is orthogonal to the stability levels previously described in this document. Forexample, a DTrace interface can be Stable, but only supported on x86_64 microprocessors. Or, theinterface can be Unstable, but common to all Oracle Linux platforms. The DTrace dependency classesare described in the following table and listed in order, from least common (most specific to a particulararchitecture), to most common (common to all architectures).
Dependency Class Description
Unknown The interface has an unknown set of architectural dependencies. DTrace doesnot necessarily know the architectural dependencies of all entities, such as thedata types defined in the operating system implementation. The Unknown label istypically applied to interfaces of very low stability for which dependencies cannotbe computed. The interface might not be available when using DTrace on anyarchitecture other than what you are currently using.

Interface Attributes
199
Dependency Class Description
CPU The interface is specific to the CPU model of the current system. Interfaces withCPU model dependencies might not be available on other CPU implementations,even if those CPUs export the same instruction set architecture (ISA).
Platform The interface is specific to the hardware platform for the current system. A platformtypically associates a set of system components and architectural characteristics.To display the current platform name, use the uname -i command. The interfacemight not be available on other hardware platforms.
Group The interface is specific to the hardware platform group for the current system. Aplatform group typically associates a set of platforms with related characteristicstogether under a single name. To display the current platform group name, use theuname -m command. The interface is available on other platforms in the platformgroup, but it might not be available on hardware platforms that are not members ofthe group.
ISA The interface is specific to the ISA that is supported by the microprocessors on thecurrent system. The ISA describes a specification for software that can be executedon the microprocessor, including details such as assembly language instructions andregisters. To display the native instruction sets that are supported by the system, usethe isainfo command. The interface might not be supported on systems that donot export any of the same instruction sets.
Common The interface is common to all Oracle Linux platforms, regardless of the underlyinghardware. DTrace programs and layered applications that depend only on Commoninterfaces can be executed and deployed on other Oracle Linux platforms with thesame Oracle Linux and DTrace revisions. The majority of DTrace interfaces areCommon, so you can use them wherever you use Oracle Linux.
16.3 Interface Attributes
DTrace describes interfaces by using a triplet of attributes consisting of two stability levels and onedependency class. By convention, the interface attributes are written in the following order and areseparated by slashes:
name_stability / data_stability / dependency_class
The name stability of an interface describes the stability level that is associated with its name, as it appearsin your D program or on the dtrace command line. For example, the execname D variable is a Stablename.
The data stability of an interface is distinct from the stability that is associated with the interface name. Thisstability level describes the commitment to maintain the data formats that are used by the interface and anyassociated data semantics.
The dependency class of an interface is distinct from its name and data stability and describes whether theinterface is specific to the current operating platform or microprocessor.
DTrace and the D compiler track the stability attributes for all of the following DTrace interface entities:providers, probe descriptions, D variables, D functions, types, and program statements. These interfaceentities are described later in this chapter. Note that all three values can vary independently. For example,the curthread D variable has Stable/Private/Common attributes: the variable name is Stable and isCommon to all Oracle Linux platforms. Note that this variable provides access to a Private data format thatis an artifact of the Oracle Linux kernel implementation. Most D variables are provided with Stable/Stable/Common attributes, as are the variables you define.

Stability Computations and Reports
200
16.4 Stability Computations and ReportsThe D compiler performs stability computations for each of the probe descriptions and action statementsin your D programs. You can use the dtrace command with the -v option to display a report of yourprogram's stability, as shown in the follow example that uses a program written on the command line:
# dtrace -v -n dtrace:::BEGIN'{exit(0);}'dtrace: description 'dtrace:::BEGIN' matched 1 probe
Stability attributes for description dtrace:::BEGIN:
Minimum Probe Description Attributes Identifier Names: Stable Data Semantics: Stable Dependency Class: Common
Minimum Statement Attributes Identifier Names: Stable Data Semantics: Stable Dependency Class: Common
CPU ID FUNCTION:NAME 0 1 :BEGIN
You can also choose to combine the -v option with the -e option, which directs the dtrace command tocompile, but not execute your D program, so that you can determine program stability without enabling anyprobes and executing your program, as shown in the following stability report:
# dtrace -ev -n dtrace:::BEGIN'{trace(curthread->parent);}'
Stability data for description dtrace:::BEGIN:
Minimum probe description attributes Identifier Names: Evolving Data Semantics: Evolving Dependency Class: Common
Minimum probe statement attributes Identifier Names: Stable Data Semantics: Private Dependency Class: Common
In this example, notice that in the new program, the D curthread variable is referenced. This variablehas a Stable name, but Private data semantics: if you look at it, you are accessing Private implementationdetails of the kernel. This status is now reflected in the program's stability report. Stability attributes in theprogram report are computed by selecting the minimum stability level and class from the correspondingvalues for each interface attributes triplet.
Stability attributes are computed for a probe description by taking the minimum stability attributes of allof the specified probe description fields, according to the attributes that are published by the provider.The attributes of the available DTrace providers are shown in the section corresponding to each provider.DTrace providers export a stability attributes triplet for each of the four description fields for all of theprobes published by that provider. Therefore, a provider's name can have a greater stability than theindividual probes that it exports. For simplicity, most providers use a single set of attributes for all of theindividual module function name values they publish. Providers also specify attributes for the args[] arraybecause the stability of any probe arguments varies by provider.
If the provider field is not specified in a probe description, then the description is assigned the Unstable/Unstable/Common stability attributes because the description might end up matching probes of providersthat do not yet exist when used on a future Oracle Linux release. As such, Oracle does not provideguarantees about the future stability and behavior of this program. You should always explicitly specify the

Stability Enforcement
201
provider when writing your D program clauses. In addition, any probe description fields that contain patternmatching characters or macro variables, such as $1, are treated as unspecified because these descriptionpatterns might expand to match providers or probes to be released in future versions of DTrace and OracleLinux. For more details on pattern matching characters and macro variables, see Section 2.1, “D ProgramStructure”and Chapter 9, Scripting.
Stability attributes are computed for most D language statements by taking the minimum stability andclass of the entities in the statement. The D language entities and their stability attributes are listed in thefollowing table.
Entity Attributes
D built-in variable curthread Stable/Private/Common
D user-defined variable x Stable/Stable/Common
For example, if you write the following D program statement, the resulting attributes of the statement areStable/Private/Common and the minimum attributes are associated with the curthread and x operands:
x += curthread->prio;
The stability of an expression is computed by taking the minimum stability attributes of each of theoperands.
Any D variables that you define in your program are automatically assigned the Stable/Stable/Commonattributes. In addition, the D language grammar and D operators are implicitly assigned these threeattributes. References to kernel symbols by using the back quote (`) operator are always assigned thePrivate/Private/Unknown attributes because they reflect implementation artifacts. Types that you definein your D program source code, specifically those that are associated with the C and D type namespace,are assigned the Stable/Stable/Common attributes. Types that are defined in the operating systemimplementation and provided by other type namespaces are assigned the Private/Private/Unknownattributes. The D type cast operator yields an expression with stability attributes that are the minimum ofthe input expression's attributes and the attributes of the cast output type.
If you use the C preprocessor to include C system header files, these types are associated with the Ctype namespace and are assigned the Stable/Stable/Common attributes, as the D compiler automaticallyassumes you are taking responsibility for these declarations. It is therefore possible to be misled aboutyour program's stability if you use the C preprocessor to include a header file containing implementationartifacts. You should always consult the documentation corresponding to the header files that you areincluding so that you can determine the correct stability levels.
16.5 Stability Enforcement
When developing a DTrace script or layered tool, you might want to identify the specific source ofstability issues or ensure that your program has a desired set of stability attributes. You can use the -x amin=_attributes_ option with the dtrace command to force the D compiler to produce an errorwhenever any attributes computation results in a triplet of attributes less than the minimum values that youspecify on the command line.
The following example demonstrates the use of the -x amin option using a snippet of D program source.Note that attributes are specified with three labels that are delimited /, in the usual order:
# dtrace -x amin=Evolving/Evolving/Common \ -ev -n dtrace:::BEGIN’{trace(curthread->parent);}’dtrace: invalid probe specifier dtrace:::BEGIN{trace(curthread->parent);}: \ in action list: attributes for scalar curthread (Stable/Private/Common) \ are less than predefined minimum

202

203
Chapter 17 Translators
Table of Contents17.1 Translator Declarations ........................................................................................................... 20317.2 xlate D Operator ..................................................................................................................... 20417.3 Process Model Translators ...................................................................................................... 20517.4 Stable Translations ................................................................................................................. 205
Chapter 16, DTrace Stability Features describes how DTrace computes and reports program stabilityattributes. Ideally, you should construct your DTrace programs by consuming only Stable or Evolvinginterfaces. Unfortunately, when debugging a low-level problem or measuring system performance, youmight need to enable probes that are associated with internal operating system routines, such as functionsin the kernel, rather than probes that are associated with more stable interfaces, such as system calls.The available data at probe locations deep within the software stack is often a collection of implementationartifacts rather than more stable data structures, such as those associated with Oracle Linux systemcall interfaces. To assist you with writing stable D programs, DTrace provides a facility for translatingimplementation artifacts into stable data structures that are accessible from your D program statements.
17.1 Translator DeclarationsA translator is a collection of D assignment statements provided by the supplier of an interface. Translatorscan be used to translate an input expression into an object of the struct type. To understand the needfor using translators, consider as an example the ANSI C standard library routines that are defined instdio.h. These routines operate on a data structure named FILE, which contains implementationartifacts that are abstracted away from C programmers. A standard technique for creating a data structureabstraction is to provide only a forward declaration of a data structure in public header files, while keepingthe corresponding struct definition in a separate and private header file.
If you are writing a C program and want to know the file descriptor corresponding to a FILE struct, usethe fileno() function to obtain the descriptor rather than dereferencing a member of the FILE structdirectly. The Oracle Linux header files enforce this rule by defining FILE as an opaque forward declarationtag so that it cannot be dereferenced directly by C programs that include <stdio.h>.
Inside the /lib/libc.so.6 library, consider the following hypothetical example where fileno isimplemented in C, noting that a real-life implementation would not be at all similar to this example:
intfileno(FILE *fp){ struct file_impl *ip = (struct file_impl *)fp; return (ip->fd);}
In the example, the hypothetical fileno takes a FILE pointer as an argument and casts it to a pointer thatcorresponds to the internal libc structure, struct file_impl, then returns the value of the fd memberof the implementation structure.
Unfortunately, observability software like DTrace requires the ability to peer inside the implementationin order to provide useful results. DTrace cannot call arbitrary C functions that are defined in OracleLinux libraries or in the kernel. You could declare a copy of struct file_impl in your D program toinstrument the routines that are declared in stdio.h, but then your D program would rely on Privateimplementation artifacts of the library that might break in a future micro or minor release, or even in a

xlate D Operator
204
patch. Ideally, you want to provide a construct for use in D programs that is bound to the implementationof the library and is updated accordingly, yet still provides an additional layer of abstraction associated withgreater stability.
A new translator is created by using a declaration of the following form:
translator output-type < input-type input-identifier > { member-name = expression ; member-name = expression ; ...};
The output-type names a struct that will be the result type for the translation. The input-typespecifies the type of the input expression, is surrounded in angle brackets <>, and followed by an input-identifier that can be used in the translator expressions as an alias for the input expression. The bodyof the translator is surrounded in braces {} and terminated with a semicolon (;), and consists of a listof member-names and identifiers that correspond to translation expressions. Each member declarationmust name a unique member of the output-type and must be assigned an expression of a type that iscompatible with the member type, according to the rules for the D assignment (=) operator.
For example, you could define a struct of stable information about stdio files based on some of theavailable libc interfaces:
struct file_info { int file_fd; /* file descriptor from fileno() */ int file_eof; /* eof flag from feof() */};
Then, you could define a hypothetical D translator from FILE to file_info:
translator struct file_info < FILE *F > { file_fd = ((struct file_impl *)F)->fd; file_eof = ((struct file_impl *)F)->eof;};
In this hypothetical translator, the input expression is of type FILE * and is assigned the input-identifier F. The identifier F can then be used in the translator member expressions as a variable oftype FILE * that is only visible within the body of the translator declaration. To determine the value ofthe output file_fd member, the translator performs a cast and dereference similar to the hypotheticalimplementation of fileno() shown in the previous example. A similar translation is performed to obtainthe value of the EOF indicator.
17.2 xlate D OperatorThe xlate D operator is used to perform a translation from an input expression to one of the definedtranslation output structures. The xlate operator is used in an expression of the following form:
xlate <output-type> ( input-expression )
For example, to invoke the hypothetical translator for FILE structs that are defined previously andaccess the file_fd member, you would write the expression as follows:
xlate <struct file_info *>(f)->file_fd;
where f is a D variable of type FILE *. The xlate expression itself is assigned the type that is defined bythe output-type. When a translator is defined, it can be used to translate input expressions to either thetranslator output struct type or to a pointer to that struct.
If you translate an input expression to a struct, you can either dereference a particular member of theoutput immediately by using the “.” operator, or you can assign the entire translated struct to another

Process Model Translators
205
D variable to make a copy of the values of all the members. If you dereference a single member, the Dcompiler only generates code that corresponds to the expression for that member. You may not apply the& operator to a translated struct to obtain its address, as the data object itself does not exist until it iscopied or one of its members is referenced.
If you translate an input expression to a pointer to a struct, you can either dereference a particularmember of the output immediately by using the -> operator, or you can dereference the pointer by usingthe unary * operator. In the latter case, the result behaves as though you translated the expression toa struct. If you dereference a single member, the D compiler only generates code corresponding tothe expression for that member. You may not assign a translated pointer to another D variable, as thedata object does not exist until it is copied or one of its members is referenced, and therefore cannot beaddressed.
A translator declaration may omit expressions for one or more members of the output type. If an xlateexpression is used to access a member for which no translation expression is defined, the D compilerproduces an appropriate error message and aborts the program compilation. If the entire output type iscopied by means of a structure assignment, any members for which no translation expressions are definedare filled with zeroes.
To find a matching translator for an xlate operation, the D compiler examines the set of availabletranslators in the following order:
• The compiler checks for a translation from the exact input expression type to the exact output type.
• The compiler resolves the input and output types by following any typedef aliases to the underlyingtype names, and then checks for a translation from the resolved input type to the resolved output type.
• The compiler checks for a translation from a compatible input type to the resolved output type. Thecompiler uses the same rules as those used for determining compatibility of function call arguments withfunction prototypes in order to determine if an input expression type is compatible with a translator'sinput type.
If no matching translator can be found according to these rules, the D compiler produces an appropriateerror message and the program compilation fails.
17.3 Process Model Translators
The DTrace library file, /usr/lib64/dtrace/version/procfs.d, provides a set of translators for usein your D programs to translate from the operating system kernel implementation structure for a processdescriptor (struct task_struct), to the stable structures, psinfo and lwpsinfo. These structuresdefine useful Stable information about processes and threads, such as the process ID, process priority,command name, initial arguments, and other data that is displayed by the ps command. The followingtable describes procfs.d translators.
Table 17.1 procfs.d Translators
Input Type Input Type Attributes Output Type Output Type Attributes
struct task_struct * Private/Private/Common psinfo_t * Stable/Stable/Common
struct task_struct * Private/Private/Common lwpsinfo_t * Stable/Stable/Common
17.4 Stable Translations
Although a translator provides the ability to convert information into a stable data structure, it does notnecessarily resolve all stability issues that can arise in translating data. For example, if the input expression

Stable Translations
206
for an xlate operation references Unstable data, the resulting D program is also Unstable becauseprogram stability is always computed as the minimum stability of the accumulated D program statementsand expressions. Therefore, it is sometimes necessary to define a specific stable input expression for atranslator to permit stable programs to be constructed. To facilitate such stable translations, you can usethe D inline mechanism.
The DTrace procfs.d library provides the curlwpsinfo and curpsinfo variables, which werepreviously described as stable translations. For example, the curpsinfo and curlwpsinfo variables areactually inline and declared as follows:
inline psinfo_t *curpsinfo = xlate <psinfo_t *> (curthread);#pragma D attributes Stable/Stable/Common curpsinfo
inline lwpsinfo_t *curlwpsinfo = xlate <lwpsinfo_t *> (curthread);#pragma D attributes Stable/Stable/Common curlwpsinfo
The curpsinfo and curlwpsinfo are both defined as inline translations from the curthreadvariable, a pointer to the kernel's Private data structure representing a process descriptor, to the Stablelwpsinfo_t type. The D compiler processes this library file and caches the inline declarations, makingcurpsinfo and curlwpsinfo appear as any other D variable. The #pragma statement following thedeclaration is used to explicitly reset the attributes of the curpsinfo and curlwpsinfo identifiers toStable/Stable/Common, masking the reference to curthread in the inline expressions.

207
Chapter 18 DTrace Versioning
Table of Contents18.1 Versions and Releases ........................................................................................................... 20718.2 Versioning Options .................................................................................................................. 20818.3 Provider Versioning ................................................................................................................. 209
In the chapter, Chapter 16, DTrace Stability Features, the DTrace features for determining the stabilityattributes of D programs that you create are described. When you have created a D program with theappropriate stability attributes, you might also choose to bind this program to a particular version of the Dprogramming interface.
The D interface version is a label that is applied to a particular set of types, variables, functions, constants,and translators that are made available to you by the D compiler. If you specify a binding to a specificversion of the D programming interface, you ensure that you can recompile your program on futureversions of DTrace without encountering conflicts between program identifiers that you define, as wellas identifiers that are defined in future versions of the D programming interface. You should establishversion bindings for any D programs that you want to install as persistent scripts or use in layered tools.See Chapter 9, Scripting for more information about using DTrace scripts.
Note
DTrace versioning in Oracle Linux is not currently interoperable with DTraceversioning on other operating system platforms.
18.1 Versions and ReleasesThe D compiler labels sets of types, variables, functions, constants, and translators that correspond to aparticular software release by using a version string. A version string is a period-delimited sequence ofdecimal integers that takes one of the following forms:
x Major release
x.y Minor release
x.y.z Micro release
Version comparisons are made by comparing the integers from left to right. If the leftmost integers are notequal, the string with the greater integer is the greater, and therefore more recent version. If the leftmostintegers are equal, the comparison proceeds to the next integer, in order, from left to right, to determine theresult. All unspecified integers in a version string are interpreted as having the value zero during a versioncomparison.
The DTrace version strings correspond to the standard nomenclature for interface versions. A change inthe D programming interface is accompanied by a new version string. The following table summarizes theversion strings that are used by DTrace and the likely significance of the corresponding DTrace softwarerelease.
Table 18.1 DTrace Release Versions
Release Version Significance
Major x.0 A Major release is likely to contain major feature additions;adhere to different, possibly incompatible Standard revisions;
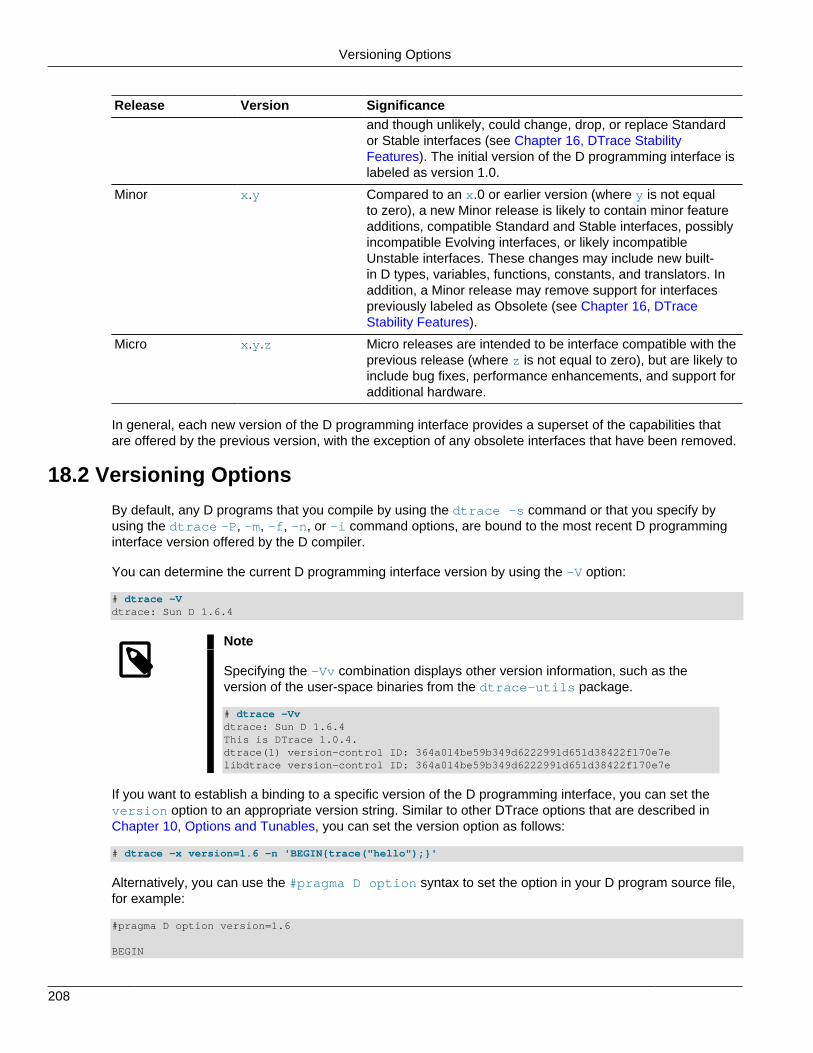
Versioning Options
208
Release Version Significanceand though unlikely, could change, drop, or replace Standardor Stable interfaces (see Chapter 16, DTrace StabilityFeatures). The initial version of the D programming interface islabeled as version 1.0.
Minor x.y Compared to an x.0 or earlier version (where y is not equalto zero), a new Minor release is likely to contain minor featureadditions, compatible Standard and Stable interfaces, possiblyincompatible Evolving interfaces, or likely incompatibleUnstable interfaces. These changes may include new built-in D types, variables, functions, constants, and translators. Inaddition, a Minor release may remove support for interfacespreviously labeled as Obsolete (see Chapter 16, DTraceStability Features).
Micro x.y.z Micro releases are intended to be interface compatible with theprevious release (where z is not equal to zero), but are likely toinclude bug fixes, performance enhancements, and support foradditional hardware.
In general, each new version of the D programming interface provides a superset of the capabilities thatare offered by the previous version, with the exception of any obsolete interfaces that have been removed.
18.2 Versioning Options
By default, any D programs that you compile by using the dtrace -s command or that you specify byusing the dtrace -P, -m, -f, -n, or -i command options, are bound to the most recent D programminginterface version offered by the D compiler.
You can determine the current D programming interface version by using the -V option:
# dtrace -Vdtrace: Sun D 1.6.4
Note
Specifying the -Vv combination displays other version information, such as theversion of the user-space binaries from the dtrace-utils package.
# dtrace -Vvdtrace: Sun D 1.6.4This is DTrace 1.0.4.dtrace(1) version-control ID: 364a014be59b349d6222991d651d38422f170e7elibdtrace version-control ID: 364a014be59b349d6222991d651d38422f170e7e
If you want to establish a binding to a specific version of the D programming interface, you can set theversion option to an appropriate version string. Similar to other DTrace options that are described inChapter 10, Options and Tunables, you can set the version option as follows:
# dtrace -x version=1.6 -n 'BEGIN{trace("hello");}'
Alternatively, you can use the #pragma D option syntax to set the option in your D program source file,for example:
#pragma D option version=1.6
BEGIN

Provider Versioning
209
{ trace("hello");}
If you use the #pragma D option syntax to request a version binding, you must place this directive atthe top of your D program file, prior to any other declarations and probe clauses. If the version bindingargument is not a valid version string or refers to a version that is not offered by the D compiler, anappropriate error message is produced and compilation fails. You can also use the version binding facilityto cause the execution of a D script on an older version of DTrace to fail with an obvious error message.
Before compiling your program declarations and clauses, the D compiler loads the set of D types,functions, constants, and translators for the appropriate interface version into the compiler namespaces.Therefore, any version binding options that you specify simply control the set of identifiers, types, andtranslators that are visible to your program, in addition to the variables, types, and translators that yourprogram defines. Version binding prevents the D compiler from loading newer interfaces that might defineidentifiers or translators that conflict with declarations in your program source code and would thereforecause a compilation error. See Section 2.8.1, “Identifier Names and Keywords” for tips on selectingidentifier names that are unlikely to conflict with interfaces offered by future versions of DTrace.
18.3 Provider Versioning
Unlike interfaces that are offered by the D compiler, interfaces that are offered by DTrace providers, thatis, probes and probe arguments, are not affected by or associated with the D programming interface orthe version binding options previously described. The available provider interfaces are established aspart of loading your compiled instrumentation into the DTrace software in the operating system kernel.These interfaces vary, depending on the following: your instruction set architecture, operating platform,processor, the software that is installed on your Oracle Linux system, and your current security privileges.The D compiler and DTrace runtime examine the probes that are described in your D program clauses andreport appropriate error messages whenever probes requested by your D program are not available. Thesefeatures are orthogonal to the D programming interface version because DTrace providers do not exportinterfaces that can conflict with definitions in your D programs, which means you can only enable probesin D; you cannot define them. Also, probe names are kept in a separate namespace from other D programidentifiers.
Use the dtrace -l command, optionally adding the -v option, to explore the set of providers andprobes that are available on your Oracle Linux system. See Chapter 11, DTrace Providers for moreinformation about common providers and probes.

210


