Poster abstracts PAGE 2008 meeting Marseille, France Poster: Applications- Anti-infectives ................................................................................................ 8 caroline BAZZOLI Population pharmacokinetics of AZT and its active metabolite AZT-TP in HIV patients: joint modelling and design optimisation ................................................ 8 helena colom Population pharmacokinetics of Ganciclovir following Valganciclovir in solid organ transplant recipients infected by cytomegalovirus ...................................................... 10 ANNE DUBOIS Population analysis of plasma and intracellular pharmacokinetics of indinavir in HIV-1 infected patients with a stable antiretroviral therapy ...................................... 11 Monika Frank Nevirapine - Population pharmacokinetic model building and simulation for mothers and newborns ............................................................................................ 13 María José García Sánchez Population Pharmacokinetics of Efavirenz in HIV- infected patients: Pharmacogenetic analysis .................................................................................. 14 Sylvain Goutelle A Population Pharmacokinetic Study of Plasma and Intrapulmonary Concentrations of Rifampin ........................................................................................................... 15 Sylvain Goutelle Influence of Rifampin Pharmacokinetic Variability on Antibacterial Effect and Prevention of Resistance in Pulmonary Tuberculosis: a Simulation Study ................. 17 FLORA MUSUAMBA-TSHINANU Simultaneous Therapeutic Drug Monitoring Of Amikacin And Beta-Lactams In Intensive Care Unit Patients With Severe Sepsis Or Septic Shock Without Beta-Lactam Serum Concentration Monitoring......................................... 19 PARTHA NANDY Relationship Between a PK/PD Parameter and Therapeutic Response of Ceftobiprole in Patients with Complicate Skin and Skin Structure Infection ......................................................................................................................................... 20 Michael Neely Population Kinetics and Dynamics of Lopinavir in HIV-Infected Children.......................................................................................................................................... 21 Elisabet Nielsen Developmental Pharmacokinetics of Gentamicin in Preterm and Term Neonates: Modelling and Simulation Based on Data from a Prospective Study ........................... 23 Daniel Röshammar Population Pharmacokinetics of Efavirenz and MDR-1, CY2B6, and CYP3A5 Polymorphisms ........................................................................................................ 25 Catherine Mary Turner Sherwin Simulation and development of a netilmicin extended dosing regimen for extremely premature neonates. ....................................................................... 26 Nicolas Simon Population Pharmacokinetics of Atazanavir in HIV-infected Patients.................. 28 Joel Tarning Population pharmacokinetics of lumefantrine in pregnant women treated with co-artemether for uncomplicated falciparum malaria ............................................................ 29 Jan-Stefan van der Walt Population pharmacokinetic models for lamivudine and nevirapine to assess drug concentrations obtained during therapeutic drug monitoring ............... 31 Wei ZHAO Population Pharmacokinetics of Ganciclovir Following Oral Administration of its Prodrug Valganciclovir in Pediatric Renal Transplant Patients .................. 32 Poster: Applications- Biologicals/vaccines ..................................................................................... 34 Daren Austin Use of mechanistic models to estimate target antigen load for monoclonal antibodies ................................................................................................................... 34 Brigitte Lacroix Exposure-Response Modeling of the ACR20 Score in Rheumatoid Arthritis Patients Treated with Certolizumab Pegol. ..................................................................... 35 Brigitte Lacroix Exposure-response analysis of certolizumab pegol in Crohn’s disease population....................................................................................................................................... 36 Micha Levi Relationship Between Serum Concentration of the Interleukin-6 Receptor Inhibitor, Tocilizumab (TCZ), and Disease Activity Score (DAS28) in Patients with Rheumatoid Arthritis ..................................................................................................................... 37 Etienne Pigeolet Granulocyte Colony Stimulating Factor Pharmacokinetics After Single and Repeated Administration of Several Doses. ................................................................ 38 1
caroline BAZZOLI Population pharmacokinetics of AZT and its active metabolite AZT-TP in HIV patients: joint modelling and design optimisation ................................................ 8 helena colom Population pharmacokinetics of Ganciclovir following Valganciclovir in solid organ transplant recipients infected by cytomegalovirus...................................................... 10 ANNE DUBOIS Population analysis of plasma and intracellular pharmacokinetics of indinavir in HIV-1 infected patients with a stable antiretroviral therapy ...................................... 11 Monika Frank Nevirapine - Population pharmacokinetic model building and simulation for mothers and newborns............................................................................................ 13 María José García Sánchez Population Pharmacokinetics of Efavirenz in HIV-infected patients: Pharmacogenetic analysis.................................................................................. 14 Sylvain Goutelle A Population Pharmacokinetic Study of Plasma and Intrapulmonary Concentrations of Rifampin ........................................................................................................... 15 Sylvain Goutelle Influence of Rifampin Pharmacokinetic Variability on Antibacterial Effect and Prevention of Resistance in Pulmonary Tuberculosis: a Simulation Study ................. 17 FLORA MUSUAMBA-TSHINANU Simultaneous Therapeutic Drug Monitoring Of Amikacin And Beta-Lactams In Intensive Care Unit Patients With Severe Sepsis Or Septic Shock Without Beta-Lactam Serum Concentration Monitoring......................................... 19 PARTHA NANDY Relationship Between a PK/PD Parameter and Therapeutic Response of Ceftobiprole in Patients with Complicate Skin and Skin Structure Infection ......................................................................................................................................... 20 Michael Neely Population Kinetics and Dynamics of Lopinavir in HIV-Infected Children.......................................................................................................................................... 21 Elisabet Nielsen Developmental Pharmacokinetics of Gentamicin in Preterm and Term Neonates: Modelling and Simulation Based on Data from a Prospective Study........................... 23 Daniel Röshammar Population Pharmacokinetics of Efavirenz and MDR-1, CY2B6, and CYP3A5 Polymorphisms ........................................................................................................ 25 Catherine Mary Turner Sherwin Simulation and development of a netilmicin extended dosing regimen for extremely premature neonates. ....................................................................... 26 Nicolas Simon Population Pharmacokinetics of Atazanavir in HIV-infected Patients.................. 28 Joel Tarning Population pharmacokinetics of lumefantrine in pregnant women treated with co-artemether for uncomplicated falciparum malaria............................................................ 29 Jan-Stefan van der Walt Population pharmacokinetic models for lamivudine and nevirapine to assess drug concentrations obtained during therapeutic drug monitoring ............... 31 Wei ZHAO Population Pharmacokinetics of Ganciclovir Following Oral Administration of its Prodrug Valganciclovir in Pediatric Renal Transplant Patients .................. 32
Poster: Applications- Biologicals/vaccines..................................................................................... 34 Daren Austin Use of mechanistic models to estimate target antigen load for monoclonal antibodies ................................................................................................................... 34 Brigitte Lacroix Exposure-Response Modeling of the ACR20 Score in Rheumatoid Arthritis Patients Treated with Certolizumab Pegol. ..................................................................... 35 Brigitte Lacroix Exposure-response analysis of certolizumab pegol in Crohn’s disease population....................................................................................................................................... 36 Micha Levi Relationship Between Serum Concentration of the Interleukin-6 Receptor Inhibitor, Tocilizumab (TCZ), and Disease Activity Score (DAS28) in Patients with Rheumatoid Arthritis ..................................................................................................................... 37 Etienne Pigeolet Granulocyte Colony Stimulating Factor Pharmacokinetics After Single and Repeated Administration of Several Doses. ................................................................ 38
1
David Ternant Development of anti-infliximab antibodies increases infliximab clearance in inflammatory bowel diseases..................................................................................... 39 Justin Wilkins Bioequivalence, bootstrapping and case-deletion diagnostics in a biologic: a model-based analysis of the effect of formulation differences in a monoclonal antibody...................................................................................................................... 40
Poster: Applications- CNS............................................................................................................... 42 Aliénor Bergès Using VT (total volume of distribution from PET) in estimating the PK-Receptor Occupancy relationship in the absence of reference regions. .................................. 42 Chao Chen Population modeling of the relationship between ropinirole systemic exposure and efficacy in Parkinson’s disease ................................................................................ 44 Rik de Greef Modeling and Simulation to Integrate Efficacy and Safety Data Following Full Development: a Case Study in Schizophrenia and Bipolar Disorder ................... 45 Geraldine Ferron PK and PK/PD modeling of CB1 blocker antagonism of THC induced CNS and Heart Rate effect ............................................................................................... 46 Sophie Gisbert Analysing Raw Count data from an In Vitro Target Occupancy Assay to Select Doses for Human Safety/Tolerability Trial..................................................................... 47 Dymphy Huntjens PK/PD modeling of apomorphine-induced behaviour in macaques ................ 48 Brigitte Lacroix Population Pharmacokinetics of Brivaracetam in Patients with Partial Epilepsy.......................................................................................................................................... 49 Bart Laurijssens Model-Based Analysis of a Longitudinal Binary Response as the Primary Analysis for a Phase II Study in Migraine Prophylaxis. .................................................. 50 Otilia Lillin-de Vries A population analysis on the effects of the CYP2D6 deficiency on pharmacokinetics and exposure of esmirtazapine in healthy volunteers. ................................. 52 IGOR LOCATELLI Population Pharmacokinetics of Risperidone in Patients with Acute Schizophrenia ...................................................................................................................... 53 Guangli Ma Pool Model versus Agonist-Antagonist Interaction Model for the Remoxipride Effect on Prolactin.................................................................................................... 55 Sarah McLeay Scaling propofol doses for the obese: is lean body weight the answer?................ 56 Raymond Miller Exposure-Response Analysis of Longitudinal Adverse Event Data................... 58 Gianluca Nucci A sparse sample PK & PKPD approach to estimate the time course of antipsychotic-induced D2 occupancy ............................................................................................ 59 Elba Romero Extended Link Model to Describe the Impact of Chronic Antiepileptic Therapy on the Effects of Neuromuscular Blocking Agents. ........................................................ 61 Monica Simeoni Modelling beta amyloid system: sensitivity analysis at steady state and in dynamic conditions. ............................................................................................................ 62 Armel Stockis Levetiracetam exposure-response analysis in children with partial onset seizures........................................................................................................................................... 63 Katarina Vucicevic Estimation of Relative Bioavailability of Controlled-Release Carbamazepine Tablets Based on Routine TDM Data .................................................................. 64 Stefano Zamuner Mixed Effects Markov Models for Modelling Sleep in Insomniac Patients Treated with Placebo in a 28 Days Trial: Emphasis on the Break Points Selection......................................................................................................................................... 65
Poster: Applications- Coagulation.................................................................................................. 67 Xavier Delavenne Assessment of pharmacokinetic variability of fondaparinux in 809 patients treated after major orthopedic surgery: the POP-A-RIX study ........................................ 67
Poster: Applications- CVS............................................................................................................... 68 Massimiliano Germani Nonparametric Modeling and Population Approach to the Individualized Heart Rate Correction of the QT Interval .............................................................. 68 Ihab Girgis Bayesian Modeling of QT Measurements: Focus on Baseline QTc .......................... 70 Carlos Hoyo-Vadillo Pharmacokinetics model for Nifedipine administered to Healthy Volunteers. ..................................................................................................................................... 71
2
Kevin Krudys Bridging Cardiovascular Risk from Clinical Trials to Real Life Population ...................................................................................................................................... 73
Poster: Applications- Endocrine..................................................................................................... 74 Paolo Denti Comparison of Different Population Analysis Approaches to the IVGTT Glucose Minimal Model ................................................................................................................ 74 Silke Dittberner BI 1356 (proposed trade name ONDERO) pharmacokinetics and DPP-4 inhibition: Development of a target mediated PKPD model in type 2 diabetic patients ........................................................................................................................................... 76 Silke Dittberner Target mediated drug disposition model for the DPP-4 inhibitor BI1356 (proposed trade name ONDERO): Is the structure identifiable? ...................................... 77 Maria Garrido Simultaneous population pharmacodynamic modelling of the growth hormone and insulin-like growth factor-I effects after deep subcutaneous administration of Lanreotide Autogel® in acromegalic patients. Application of Nonparametric estimation method in NONMEM.......................................................................... 78 Cyrus Ghobadi Pharmacokinetics of oral single-dose clomiphene citrate (CC) in polycystic ovary patient with anovulatory infertility..................................................................... 80 Tae Han Alteration of glucose and insulin regulatory networks for the treatment of type 2 diabetes mellitus.................................................................................................................. 82 Nick Holford Delayed response to hypoglycaemic agents and effect on progression of type 2 diabetes................................................................................................................................ 83 Petra Jauslin Identification of the Mechanism of Action of a Glucokinase Activator from OGTT Data in Type 2 Diabetics Using an Integrated Glucose-Insulin Model..................... 85 Teun Post Disease System for osteoporosis: relating bone mineral density with measures of bone formation and resorption based on bone biology.............................................. 86 Rujia Xie Model-Based Drug Development (MBDD) of Pegylated Growth Hormone (PEG-hGH) in the Treatment of Adult Growth Hormone Deficient (AGHD) .............................. 88 Rujia Xie Relationship between the Dose of Recombinant Human Growth Hormone (rhGH) and Insulin Growth Factor-1 (IGF-1) in Adult Patients with Growth Hormone Deficiency (AGHD)....................................................................................................................... 90
Poster: Applications- Oncology ...................................................................................................... 91 René Bruno Modeling and simulation to assess the use of change in tumor size as primary endpoint in Phase II studies in oncology.......................................................................... 91 Francesca Del Bene Evaluating the Influence of Different Sources of Variability in the PK/PD Tumor Growth Inhibition (TGI) Model............................................................................. 93 Nicolas Frances Modeling of longitudinal tumor size data in clinical oncology studies of drugs in combination ................................................................................................................. 94 Lena Friberg Scaling the Time-Course of Myelosuppression from Rats to Patients with a Semi-Physiological Model .................................................................................................. 96 Maria Garrido Biopharmaceutic and pharmacodynamic characterization of the in vitro anti-proliferative effect of new delivery systems of Cisplatin....................................................... 98 Emma Hansson The Shape of the Myelosuppression Time-course is Related to the Probability of Developing Neutropenic Fever in Patients with Docetaxel-induced Grade IV Neutropenia.................................................................................................................... 99 Emma Hansson Comparison of Inter-Occasion and Inter-Individual Variability in Chemotherapy- Induced Myelosuppression................................................................................. 100 Ron Keizer Population PK-PD modeling of E7820 and α2-integrin expression on platelets in patients with solid tumors and lymphomas ............................................................... 102 stijn Koolen Population pharmacokinetics of intravenously and orally administered docetaxel with or without co-administration of ritonavir in patients with advanced cancer ........................................................................................................................................... 104 Katharina Küster Matuzumab – Evaluation of the Population Pharmacokinetic Model and Analyses of the Covariate Impact on the Pharmacokinetic Profile....................................... 106
3
Andreas Lindauer Population Pharmacokinetics of High-dose Carboplatin ............................... 107 Antonin Schmitt External validation of a model based on cystatin C to predict carboplatin clearance.................................................................................................................... 109 Elena Soto A semi-mechanistic population pharmacokinetic/pharmacodynamic model for neutropenia following therapy with the new PLK-1 inhibitor BI 2536 and its application in clinical development ............................................................................................. 111 Kellie Turner Reduced Folate Carrier Single Nucleotide Polymorphism Associated with Methotrexate Clearance in Breast Cancer Patients.............................................................. 112
Poster: Applications- Other topics ............................................................................................... 113 Corina Becker Whole-Body Physiologically-based Pharmacokinetic (WB-PBPK) Population Modelling to Simulate the Influence of Weight and Age on the Pharmacokinetics (PK) of a combined Oral Contraceptive Containing Drospirenone (DRSP) and Ethinylestradiol (EE) ............................................................................................... 113 Misba Beerahee Clinical Trial Simulation to Estimate the Sample Size for Investigation of the Impact of a Drug A on the Pharmacokinetics of Methotrexate, a common co-medication used in Rheumatoid Arthritis (RA) ....................................................... 115 Pascal Chanu Decisive support of Modeling & Simulation for getting drug approval in the context of safety concern on the drug class ........................................................................... 116 Chao Chen Population PK/PD modelling of functional receptor occupancy in a first-time-in human study..................................................................................................................... 118 Emmanuelle Comets Modelling is seldom used to describe pharmacokinetics in phase I clinical trials................................................................................................................................. 119 Mike Dunlavey Simplified programming of population model user interfaces ........................... 120 Yumi Emoto Evaluation of Population PK/PD for Osteoporosis during a Vitamin D3 (1,25(OH)2D3) Derivative Therapy ............................................................................................ 121 Samuel Fanta Population Pharmacokinetics of Cyclosporine in Paediatric Renal Transplant Recipients................................................................................................................... 122 Dymphy Huntjens Receptor-mediated pharmacokinetic modeling of a novel anti-epileptic drug in healthy volunteers ............................................................................................. 123 Daniel Jonker The pharmacokinetics of the once-daily human glucagon-like peptide-1 analogue, liraglutide, across 5 trials in healthy subjects and type 2 diabetics after single and multiple dosing...................................................................................................................... 124 Catherijne Knibbe Predictive Value of Allometric Scaling for Estimation of Propofol Clearance in Neonates, Infants and Adolescents ......................................................................... 125 Elke Krekels Development AND External validation of a model for Glucuronidation in children below 3 years of age using morphine as a model drug; towards a novel dosing paradigm....................................................................................................................................... 127 Glynn Morrish Using Body Composition Metrics to Predict Exposure Between Japanese and Caucasian Populations ........................................................................................... 129 FLORA MUSUAMBA-TSHINANU Limited sampling formulas and bayesian estimation for mycophenolic acid 12 hours Area Under the concentration-time Curve prediction in Stable renal transplant recipients co-medicated with cyclosporine or sirolimus....................................................................................................................................... 130 Rogier Press Optimizing Calcineurin Inhibitor Exposure In De Novo Kidney Transplant Recipients................................................................................................................... 133 Jean Smeets A Mechanism-based Pharmacokinetic Model Describing the Interaction Between Sugammadex and Rocuronium in Patients with Normal and Impaired Renal Function ....................................................................................................................................... 134 Tamara van Steeg Assessment of the use of complex baseline models in preclinical safety screening: Application of the van der Pol oscillator model to describe heart rate effects in rats ................................................................................................................................ 135
4
Johan Wallin Population pharmacokinetics of tacrolimus in paediatric bone marrow transplant recipients ..................................................................................................................... 137 Susan Willavize Using M&S to Shorten the Repeating Cycle of the Early Drug Development Process: A Case Study........................................................................................... 139 Susan Willavize Dose Selection for Combination Drug Products ............................................... 140
Poster: Methodology- Algorithms ................................................................................................ 141 Julie ANTIC Some Stochastic Algorithms For The Smooth Non Parametric (SNP) Estimator ...................................................................................................................................... 141 julie bertrand Properties of different tests to detect the effect of a genetic covariate on pharmacokinetic parameters using the SAEM algorithm for several designs ............................. 143 Vivek Dua Automatic Selection of Optimal Configuration of Artificial Neural Networks ...................................................................................................................................... 145 Clare Gaynor A Differential Equations Approach to In Vitro – In Vivo Correlation Modelling in NONMEM.............................................................................................................. 146 Leonid Gibiansky Application of Identifiability Analysis Algorithm to Population PK of the Drug with Target-Mediated Drug Disposition................................................................... 148 Leonid Gibiansky Approximations of the Target-Mediated Drug Disposition Model and Identifiability of Model Parameters ...................................................................................... 150 Leonid Gibiansky Parameter Estimates of Population Models: Comparison of Nonmem Versions and Estimation Methods ............................................................................... 152 Rich Haney Accelerating the Rate of Adoption of New Pharmacometrics Platforms Using Formal Tools for Model Interconversion .......................................................................... 153 Søren Klim Linear Mixed Effects models based on Stochastic Differential Equations in R................................................................................................................................................... 155 François MERCIER Simulation and evaluation of bivariate Beta distribution for interval response variables ........................................................................................................... 156 Benjamin Ribba Monolix benefits from external modules to manage complex ODE: Illustration with a population analysis of Irinotecan and its metabolites..................................... 157
Poster: Methodology- Design ........................................................................................................ 158 Massimo Cella Randomisation to exposure in early paediatric trials: an analysis on the influence of the dose on the heterogeneity in the response to abacavir. ...................................... 158 Marylore Chenel Optimal design of QTc interval measurements for circadian rhythm determination ............................................................................................................................... 159 Marion Dehez Optimal window design of blood pressure time measurements in hypertensive dippers and non-dippers using ABPM: Application of the compound D-optimality approach...................................................................................................................... 161 Phey Yen Han Informative Study Designs to Identify True Parameter-Covariate Relationships................................................................................................................................ 163 Tracy Higgins Simulation and Design Considerations for Noninferiority Trials in Phase II......................................................................................................................................... 165 Hyung Ki Kim The Effect of Study Design on Pharmacokinetics in Patients with Impaired Renal Function.............................................................................................................. 167 Rocio Lledo Impact of study design for characterising PKPD covariance and nonlinearity in exposure-dichotomous response relationships .................................................... 168 Rocio Lledo Randomised dose controlled trials or concentration controlled trials when learning about drugs with narrow therapeutic index?.................................................................. 170 Mark Lovern Leveraging complicated PK/PD models for the development of a Bayesian adaptive Dose-ranging design. ..................................................................................... 171 Mark Lovern Development of a Bayesian Adaptive Sampling Time strategy for PK studies with constrained number of samples to ensure accurate estimates.................................. 172
5
Guy MENO-TETANG The Use of Clinical Trial Simulation to investigate Bias in Crossover Studies with a Short Washout Period and no Placebo Arm: Application to Neuropathic Pain.......................................................................................................................... 173 Joakim Nyberg Dose and sample time optimization of drug candidate screening experiments .................................................................................................................................. 174 Joakim Nyberg Application of Optimal Design for Disease Progression Studies....................... 176 Kayode Ogungbenro An Effective approach for Obtaining Optimal Sampling Windows for Population Pharmacokinetic Experiments ............................................................. 178 Italo Poggesi Evaluation of direct population PKPD models for truncated concentration-response curves ..................................................................................................... 179 Alberto Russu Dose escalation studies: a comparison between NONMEM and a novel Bayesian tool................................................................................................................................ 181 David Salinger Mean Squared Error as Criterion for Sampling Schedule Optimization for Individual Dose Targeting in IV Busulfan ............................................................................. 182 Hanna Silber Improvement of the intravenous glucose tolerance test using optimal experimental design. .................................................................................................................... 184 Stefano Zamuner Adaptive Optimal Design in PET Occupancy Studies .................................... 185
Poster: Methodology- Model evaluation ...................................................................................... 187 Robert Bies A comparison of a genetic algorithm based automated search algorithm to standard stepwise approach for population pharmacokinetics using NONMEM........................ 187 Carlos Fernandez-Teruel Simulations of bioequivalence trials using physiological-pharmacokinetic in single dose and steady state scenarios. Which scenarios are refusable? ..................................................................................................................................... 188 Laura Iavarone A Population PK model to evaluate variability in oral absorption using gamma scintigraphy ..................................................................................................................... 189 Robert Leary A Nonparametric Analogue to POSTHOC Estimates for Exploratory Data Analysis ............................................................................................................................... 191 Gianluca Nucci Modelling and Simulation of Ketoconazole inhibition when co-administration time is not sufficient: role of CYP3A function recovery..................................... 192
Poster: Methodology- Other topics .............................................................................................. 193 Paul Baverel Covariate Model Building Method for Nonparametric Estimation Method in NONMEM VI: Application to Simulated Data.......................................................... 193 Martin Boucher A Bayesian Meta-Analysis of Longitudinal Data in Placebo Controlled Studies with Naproxen............................................................................................... 194 Marylore Chenel How to show average bioequivalence of concentrations in a test sample with a reference population pharmacokinetic model? ..................................................... 196 Cian Costello A Time Scaling Approach to Develop an In Vitro-In Vivo Correlation (IVIVC) Model Using a Convolution-Based Technique ............................................................. 198 Ekaterina Gibiansky Indirect Response Models with Positive Feedback: Equations, Properties, and Possible Applications.......................................................................................... 200 Andreas Velsing Groth Alternative parameterisations of saturable (Emax) models allowing for nesting of non-saturable models.............................................................................. 202 Emilie HENIN Patient compliance estimated from pharmacokinetic sample: application to Imatinib ................................................................................................................. 203 Matt Hutmacher Implications for animal-human scaling of the parallel elimination profile PK model.......................................................................................................................... 205 Ibrahim Ince Tailor-made drug treatment for children: creation of an infrastructure for data-sharing and population PK-PD modeling ............................................................................ 206 Ron Keizer A simple infrastructure and graphical user interface (GUI) for distributed NONMEM analysis on standard network environments ............................................................. 207 Charlotte Kloft Launch of the Graduate Research Training (GRT) Program 'Pharmacometrics & Computational Disease Modelling' in Germany ........................................ 208
6
Ricardo Nalda-Molina Pharmacokinetic and Pharmacodynamic Model for Drug Induced Transient Transaminitis.................................................................................................. 210 Carmen Navarro Estimating the complete AUC and its standard error in sparse sampling designs. ......................................................................................................................... 211 Klas Petersson Transforming parts of a differential equations system to difference equations as a method for run-time savings in NONMEM VI .................................................... 212 Angelica Quartino Comparison Between using Continuous and Categorical Toxicity Data for Estimation with a Model for Continuous Data .............................................................. 214 Tarjinder Sahota The use of population PKPD models over the NOAEL approach in the estimation of safe drug exposure levels in animals................................................................ 216 Radojka Savic A novel bootstrap method for obtaining uncertainty measurement around the nonparametric distribution ......................................................................................... 217 Nabil Semmar Independent-model diagnostics for a priori identification and interpretation of outliers from a full pharmacokinetic database: correspondence analysis, Mahalanobis distance and Andrews curves .................................................................. 219 Xu Xu Exposure-Response Analysis of Adverse Events in Clinical Trials Using Zero-Inflated Poisson Modeling With NONMEM®............................................................................ 221
Poster: Methodology- PBPK......................................................................................................... 223 Viera Lukacova PBPK modeling of metoprolol and its metabolites ........................................... 223 Italo Poggesi Evaluation of a basic PBPK model in preclinical species for which tissue compositions are unknown........................................................................................................... 224
Software demonstration ................................................................................................................ 225 Jason Chittenden Phoenix platform, WinNonlin, Trial Simulator, WinNonlin AutoPilot, and PKS (a PK/PD data repository) ........................................................................... 225 Colm Farrell Hands-On Demonstration of PDx-Pop® v3.0; Tools for Expediting Population Analysis ..................................................................................................................... 226 Andrew Hooker Xpose and Perl Speaks NONMEM (PsN)......................................................... 227 Andrew Hooker PopED................................................................................................................ 228 Carlos Hoyo-Vadillo Four Programs for Writing and Running Nonmem Scripts. ..................... 229 Masoud Jamei Simcyp Simulator - a comprehensive platform and database for mechanistic modelling and simulation of oral drug absorption, tissue distribution, metabolism and elimination in healthy and disease populations using in vitro knowledge .................................................................................................................................... 230 Roger Jelliffe The USC*PACK software for nonparametric adaptive grid (NPAG) population PK/PD modeling, and the MM-USCPACK clinical software for individualized drug regimens....................................................................................................... 232 Marc Lavielle Analysing population PK/PD data with MONOLIX 2.4...................................... 233 Viera Lukacova GastroPlus.......................................................................................................... 235 Richard Pugh Mango Solutions................................................................................................... 236 Saik Urien RfN, R for Nonmem: A graphical interface for Nonmem outputs ............................ 237 Wolfgang Weiss Hands-On Demonstrations of the Physiology-Based Pharmacokinetic Software, PK-Sim® ..................................................................................................................... 238
7
Poster: Applications- Anti-infectives
caroline BAZZOLI Population pharmacokinetics of AZT and its active metabolite AZT-TP in HIV patients: joint modelling and design optimisation
C. Bazzoli (1), S. Retout (1, 2), E. Rey (3), H. Benech (4), J.M. Tréluyer (3), D. Salmon (5), X. Duval (1, 6, 7), F. Mentré (1, 2) and the COPHAR2- ANRS 111 study group
(1) INSERM, U738, Paris, France; Université Paris 7, Paris, France; (2) AP-HP, Hôpital Bichat, Paris, France; (3) AP-HP, Hôpital Cochin, Département de pharmacologie clinique – EA3620, Paris, France; (4) CEA, Service de Pharmacologie et d'Immunologie, DSV/DRM, Gif sur Yvette,
France; (5) Université Paris 5, AP-HP, Hôpital Cochin, Service de Médecine Interne, Paris, France; (6) AP-HP, Hôpital Bichat, Service des Maladies Infectieuses B, Paris, France; (7) CIC
007, Hôpital Bichat, Paris, France
Objectives: To determine a joint pharmacokinetic (PK) population model of azidothymidine (AZT) and its active metabolite AZT-TP in HIV infected patients and to optimise several designs for further joint population PK analysis of AZT/AZT-TP.
Methods: In the COPHAR2 - ANRS 111 trial, 75 naïve HIV patients received orally 300 mg twice daily of AZT, as part of their tritherapy treatment. Four blood samples per patient were taken after two weeks of treatment to measure the concentration at steady state at 1, 3, 6 and 12 (trough) hours. Concentrations of AZT, quantified by HPLC, were measured in 73 patients. AZT-TP concentrations were measured in 62 patients using a direct LC/MS/MS, a costly method performed in a specific laboratory in France. Using the SAEM algorithm implemented in the MONOLIX software version 2.4, which can handle data under the LOQ [1, 2], a population PK model was developed in order to, for the first time, simultaneously describe the PK of AZT and AZT-TP. Based upon this model, we first evaluate the design used in COPHAR 2 assuming 50 subjects, called the empirical design. We then explored D-optimal population designs for further joint population AZT/AZT-TP analysis using the Federov-Wynn algorithm implemented in PFIM 3.0 [3]. To keep the same constraints as for the empirical design, we first optimise population designs with only four sampling times common to both measures with a set of 12 admissible sampling times at 0.5, 1, 1.5, 2, 3, 4, 5, 6, 7, 8, 10, 12 hours. Due to the different PK profiles between the plasma and intracellular concentration, we also optimize other population designs with different interval of admissible times for AZT and AZT-TP and with different constraints regarding the number of samples per patient.
Results: A one compartment model with first order absorption and elimination best described AZT concentration [4], with an additional compartment describing the metabolism of the drug to AZT-TP with first order elimination. Optimal design, with quite similar constraints to the design used in the trial has a better efficiency. More general optimisation show that optimal designs allow as precise parameter estimates as the empirical design but with less samples per patient.
Conclusions: A joint model was found to describe adequately AZT and AZT-TP concentrations and was used to estimate population PK parameters of AZT-TP. We optimised population designs with lower number of AZT-TP samples involving thus a more reasonable cost.
References: [1] Samson A, Lavielle M, Mentré F. Extension of the SAEM algorithm to left-censored data in nonlinear mixed-effects model: application to HIV dynamics model. Computational Statistics and
8
Data Analysis 2006; 51:1562-1574. [2] www.monolix.org [3] www.pfim.biostat.fr [4] Panhard X, Legrand M, Taburet A.M., Diquet B, Goujard C, Mentré F and the COPHAR 1-ANRS 102 study group. Population pharmacokinetics analysis of lamivudine, stavudine and zidovudine in controlled HIV-infected patients on HAART. European Journal of Clinical Pharmacology 2007; 63:1019-1029.
1Pharmacy and Pharmaceutical Technology Department. School of Pharmacy, University of Barcelona. Spain. 2Nefrology Service, Hospital Universitario de Bellvitge, Barcelona. Spain. 3Pharmacy and Pharmaceutical Technology Department. School of Pharmacy, University of
Pamplona, Spain.
Objectives: Cytomegalovirus (CMV) is a leading cause of disease in immunocompromised subjects, such as solid organ transplant recipients. Valganciclovir (VGC), an ester prodrug of ganciclovir, was developed to offer an alternative to long-term intravenous (iv) and low oral (po) bioavailability of ganciclovir (GCV). The aim of this study was to establish the population pharmacokinetics of GCV after iv GCV followed by po VGC as treatment of CMV infection in solid organ transplant (SOT) recipients, and explore the influence of patient covariates on drug disposition.
Methods: : 20 SOT patients (kidney (n=11), liver (n=4) and heart n=5) were recruited for this study. Demographic and biochemical data were recorded. 5 mg/kg/12 h of GCV for 5 days as a 1-hour iv infusion, followed by po VGC doses (900 mg/12 h), for 15 days, were administered. In both cases doses were adjusted by estimated creatinine clearance (CRCL). Blood samples were collected at steady-state over 12 h post-dose. A population pharmacokinetic (PK) analysis was performed using NONMEM VI. The final population model was validated through bootstrapping (n=200) by means of PsN-Toolkit (1).
Results: The PK of GCV after VGC, was best described by a two compartment open model with 1st order absorption. Interindividual variability (IIV) was included in total plasma clearance CL (41%), central distribution volume V1 (46%), absorption rate constant KA (69%) and bioavailability F (25%). Residual error was a combined error model (additive: 0.46 mg/L; proportional: 14.4%) with IIV (34%). The FOCE estimation method was used with interaction. CRCL and body weight (WGT) normalised by mean values described part of IIV in CL. The final population PK parameters were: CL=7.58*(CRCL/56.3)*(WGT/66.8); V1=31.8 L; distribution volume of the peripheral compartment V2=32.3 L; intercompartmental clearance CLD1=10.2 L/h; F=0.83; KA=0.90 h-1; and absorption lag time, LT=0.38 h. Mean values from the bootstrap analysis were close to the parameter estimate from the original data set.
Conclusions: A population PK model for GCV, after GCV iv/VGC po, has been developed. It incorporates measure of renal function and body weigt to predict total drug clearance. Validation of this model with external patients should be performed in order to assess the suitability of further VGC therapeutic drug monitoring.
References: [1] Lindbom L et al. Comput Methods Programs Biomed 1999;58:51-64.
10
Poster: Applications- Anti-infectives
ANNE DUBOIS Population analysis of plasma and intracellular pharmacokinetics of indinavir in HIV-1 infected patients with a stable antiretroviral therapy
Dubois A (1), Duval X (1,2), Peytavin G (2), Taburet AM (3), Goujard C (3), Mentré F (1,2) and the Cophar1-ANRS 102 Trial Group
(1) INSERM, U738, Paris, France; University Denis Diderot, Paris, France. (2) AP-HP, Bichat University Hospital, Paris, France. (3) AP-HP, Bicêtre University Hospital, Paris, France.
Objectives: Indinavir is a HIV protease inhibitor whom activity is intracellular. However, only few studies with measurements of intracellular indinavir concentrations have been performed [1, 2, 3]. The objective of the present study was to characterize the intracellular pharmacokinetics (PK) of indinavir in connection with its plasma PK in HIV infected patients with a stable antiretroviral therapy.
Methods: Data came from Cophar1-ANRS 102 Trial [4]. Patients were required to have unchanged antiretroviral treatment for 6 months with a sustained virological response defined by plasma HIV RNA level <200 copies/mL for at least 4 months. Plasma concentrations were measured at 5 different sampling times (one before indinavir administration and four at fixed times after) from 42 patients who received different dosages of indinavir either alone or with a booster dose of ritonavir (13 patients). Among the 42 patients, 8 had also measurements of intracellular concentrations at 4 of the sampling times. Plasma alone and then plasma with intracellular data were modelled in all patients using a population approach. No model for joint analysis of plasma and intracellular concentrations of protease inhibitors has been published and we tested several models. Population Parameters were estimated using the SAEM algorithm [5] in monolix v.2.1 [6].
Results: A two-compartment model with first order absorption with a lag time and first-order elimination best described indinavir plasma PK. The best joint model had the same model for plasma concentrations and intracellular concentrations were proportional to plasma concentrations. It should be recalled that concentrations were measured at steady state. For plasma PK, the lag time Tlag was 0.38 h (44.5% inter-individual variability, IIV), the absorption rate constant ka was 2.05 h-
1 (72% IIV), the apparent volume of distribution V/F was 62.3 L and the apparent clearance Cl/F was 45.4 Lh-1 (17.1% IIV) for patients treated with indinavir alone. The administration of indinavir plus ritonavir decreased Cl/F by 49%. Proportionality coefficient between plasma and intracellular concentrations δ was 1.84 d.l. (15.8% IIV).
Conclusions: A joint proportional model was found to describe adequately plasma and intracellular concentrations of indinavir at steady state. This is the first model of plasma and intracellular PK of indinavir in patients.
References: [1] Hennessy M, Clarke S, Spiers JP, Mulcahy F, Kellher D, Meadon E, Maher B, Bergin C, Khoo S, Tjia J, Hoggard P, Back D, Barry M. Intracellular indinavir pharmacokinetics in HIV-infected patients: comparison with plasma pharmacokinetics. Antivir Ther. 2003; 8: 191-198. [2] Nascimbeni M, Lamotte C, Peytavin G, Farinotti R, Clavel F. Kinetics of antiviral activity and intracellular pharmacokinetics of HIV 1 protease inhibitors in tissue culture. Antimicrob Agents Chemother. 2000; 43: 2629-2634.
11
[3] Ford J, Khoo SH, Back DJ. The intracellular pharmacology of antiretroviral protease inhibitors. Antimicrob Agents Chemother. 2004; 54: 982-990. [4] Goujard C, Legrand M, Panhard X, Diquet B, Duval X, Peytavin G, Vincent I, Katlama C, Leport C, Bonnet B, Salmon-Céron D, Mentré F, Taburet AM, the COPHAR1-ANRS 102 Study Group. High variability of indinavir and nelfinavir pharmacokinetics in HIV-infected patients with a sustained virological response on highly active antiretroviral therapy. Clin Pharmacokinet. 2005; 44: 1267-1278. [5] Kuhn E, Lavielle M. Maximum likelihood estimation in nonlinear mixed effects model, Comput Stat Data Anal. 2005; 49:1020-1038. [6] www.monolix.org
12
Poster: Applications- Anti-infectives
Monika Frank Nevirapine - Population pharmacokinetic model building and simulation for mothers and newborns
M. Frank (1), A. Kunz (2), G. Harms (2), C. Kloft (1) (1) Martin-Luther-Universitaet Halle-Wittenberg, Dept. Clinical Pharmacy, Halle, Germany; (2)
Institute of Tropical Medicine, Charité – University Medicine Berlin, Germany.
Objectives: Nevirapine (NVP), a non-nucleoside reverse transcriptase inhibitor, is used as single-dose prophylaxis (mother: 200 mg tablet during labor, newborn: 2 mg/kg syrup within 3 d after birth) to reduce the risk of HIV intrapartum transmission in resource-limited areas. A population pharmacokinetic (PK) model was to be developed describing the sparse data situation in different matrices from Ugandan mothers and children as well as to assess the maintenance period of NVP concentrations in different individuals.
Methods: For model development 62 mothers (113 plasma, 95 breast milk samples) and 62 newborns (113 plasma samples) were available. Population PK analyses for mother and child data were separately performed using the nonlinear-mixed-effect modelling approach implemented in NONMEMTM (ADVAN6, TOL5; FOCE INTERACTION estimation method). The PK models were used for simulating entire concentration-time profiles (NONMEMTM) for different percentiles (P0.05-0.95) of the individual PK parameter distributions.
Results: An integrated 2 compartment PK model was developed for the combined mother plasma and breast milk data. Due to sparse data, absorption rate constant K12 was fixed to 1.66 h-1 [1]. V/F was estimated to be 104.3 L and CL/F to be 1.45 L/h resulting in a long half-life of 50.3 h. Inter-compartmental clearance was high, being 122 L/h. Inter-individual variability (IIV) was implemented in CL (29% CV). A PK model for newborns was developed with K12 set to 1.66 h-1 [1]. Different input routes from mothers to newborns were combined with an estimated ‘bioavailability’ (F’) of 14% and a plasma/placenta-plasma/breast milk transfer rate constant of 4.5 h-1. V2/F and CL/F were estimated to be 22.7 L and 265 mL/h, respectively, and resulted in a half-life of 59.4 h. IIV was implemented for F’ (20% CV), V2/F (46% CV) and CL/F (42% CV). Simulated concentration-time profiles revealed a long-term exposure for mothers and newborns with NVP above IC90 (= 16 ng/mL) for 10-24 d and 10-27 d (P0.05-P0.95), respectively.
Conclusion: A population PK model for mother plasma/breast milk was successfully developed and a first model proposed for child plasma data: To comprehensively describe the different input routes further investigations are ongoing. Based on the final PK models further simulations will be performed to assess dosing regimens for newborns.
References: [1] Kappelhoff BS, van Leth F, MacGregor TR, et al. Nevirapine and efavirenz pharmacokinetics and covariate analysis in the 2NN study. Antivir. Ther., 10: 145-155 (2005).
13
Poster: Applications- Anti-infectives
María José García Sánchez Population Pharmacokinetics of Efavirenz in HIV-infected patients: Pharmacogenetic analysis
García MJ, Santos Buelga D, Cabrera S, Fernandez de Gatta MM, Domínguez-Gil (1) Department of Pharmacy & Pharmaceutical Technology, University of Salamanca, Salamanca,
Spain; (2) Pharmacy Service, University Hospital of Salamanca, Salamanca, Spain
Objectives: Efavirenz (EFV), a non-nucleoside reverse transcriptase inhibitor, is often used in highly active antiretroviral therapy for the management of both treatment-naïve and treatment-experienced patients. The metabolism of EFV is mediated by CYP2B6 and CYP3A4 isoenzymes. The polymorphism exhibited by these isoenzymes as well as the proteins involved in drug transport may partly explain the pharmacokinetic inter-patient variability. The present study analyzes the influence of genetic polymorphism of CYP2B6 and CYP3A4 isoenzymes, and MDR-1 gene (codifying the P-glycoprotein transporter) on the EFV pharmacokinetics in HIV-infected patients.
Methods: The analysis was conducted in a total of 375 EFV concentrations from 131 HIV-infected subjects from the outpatient unit of the University Hospital of Salamanca, Spain, treated with EFV at the dose of 600 mg/day. EFV concentrations were assessed quantitatively by HPLC with UV detection. So far only 31 study participants were genotyped with PHARMAchip® DNAchip (PROGENIKA BIOPHARMA, Derio, Spain) which permits the analysis of 91 genetic polymorphisms from 33 genes, including CYP2B6, CYP3A4 and MDR-1 genes. The population analysis was performed using the non-linear mixed effects modeling approach implemented in NONMEM. To data adjustment, a one-compartment model with first-order absorption was assumed and FOCE estimation was used throughout. In addition to genetic characteristics, other covariates analyzed were patient age, weight, sex and body mass index (BMI).
Results: For the CYP2B6 (G516T), 9 patients were heterozygotes (GT) and 6 patients were homozygotes for the mutant allele (TT). With respect the CYP3A4 (*1/B), four patients showed polymorphism, being 3 heterozygotes (*1B) and 1 homozygote for the mutant allele (*B/B). Finally regarding MDR1 (C3435T), 16 patients were heterozygotes (CT) and 6 patients were homozygotes for the mutant allele (TT).The inclusion in the model of GT, TT and MDR1 polymorphisms and consideration of BMI for patients who showed low body mass (BMI<25) reduce both CL inter-subject and residual variabilities more than 30% from the basic to final model. Patients showing GT and TT polymorphisms exhibited around of 30 % and 75% lower EFV clearance, respectively, while heterozygote patients for MDR1 showed CL increases around of 20% compared to patients without these polymorphisms. These results were similar when the analysis was performed in the full population and also when only the genotyped patients were considered.
Conclusions: These preliminary results indicate that single o double alterations in CYP2B6 alleles, as well as double alterations in MDR-1 alleles and low BMI, influence EFV clearance and emphasize the need for dose individualization according these variables to avoid inadequate treatment response to EFV.
14
Poster: Applications- Anti-infectives
Sylvain Goutelle A Population Pharmacokinetic Study of Plasma and Intrapulmonary Concentrations of Rifampin
S. Goutelle (1,2,3), L. Bourguignon (1,2), P.H. Maire (1,2), M. Van Guilder (3), R.W. Jelliffe (3), J. E. Conte Jr (4)
(1) Hospices Civils de Lyon, Hôpital A. Charial, ADCAPT - Service Pharmaceutique, Francheville, France ; (2) Université Lyon 1, UMR CNRS 5558, Villeurbanne, France ; (3) Laboratory of Applied Pharmacokinetics, USC School of Medicine, Los Angeles, USA ; (4) Department of
Epidemiology and Biostatistics, Infectious Disease Research Group, University of California San Francisco and (5) American Health Sciences, San Francisco, USA
Objectives: In pulmonary tuberculosis (TB), Mycobacterium tuberculosis (MTB) is both extracellular and intracellular. Rifampin (RIF) is probably the most important drug in TB treatment since it is active against bacteria in both locations, but little is known about the pulmonary pharmacokinetics-pharmacodynamics (PK-PD) of RIF. The objective of this study was to explore the pulmonary PK of RIF, using a population modeling approach.
Methods: The population PK analysis was carried out using NPAG in MM-USCPACK software. Data included concentrations of RIF in plasma, epithelial lining fluid (ELF), and alveolar cells (AC) that were reported in a previous study [1]. Forty subjects, without tuberculosis, received RIF 600 mg orally once daily for five days. RIF concentrations were determined in plasma at 2h and 4h and in ELF and AC by bronchoalveolar lavage (BAL) at 4h after the last dose. All concentrations were modelled simultaneously. Individual predicted concentrations were computed using Bayesian posterior parameter estimates. Goodness of fit was assessed by regression over the predicted-observed concentrations plots and coefficient of correlation. Bias (mean weighted error) and precision (bias-adjusted mean weighted squared error) were used to assess predictive performance.
Results: Six patients from the original group were discarded in this analysis. It is noteworthy that five of those six patients had AIDS. They seemed to have a much delayed absorption. Thirty-four patients were included in the final PK analysis. A three compartment model with first order processes for all transfers best fitted the data. Scatterplots of PK parameters versus available covariates showed no evident relationship. Graphical analysis of Bayesian posterior estimated and measured data showed coefficient of correlation values of 0.94, 0.99 and 0.99 for plasma, ELF, and AC levels, respectively. Bias values (mg/L) were -0.174, 0.183 and -0.038, while precision values (mg/L)2 were 1.818, 0.248 and 0.035 for RIF concentrations in plasma, ELF and AC, respectively. Large variability was found in pulmonary diffusion parameter values.
Conclusions: A compartmental model was created that adequately described the plasma, ELF and pulmonary intracellular PK of RIF. As ELF and AC levels are thought to reflect the antibacterial activity of drugs against MTB [2], this model can serve as benchmark for future PK-PD studies with RIF. A specific study is indicated to explore possible delayed absorbers.
References: [1] Conte JE, Golden JA, Kipps JE, Lin ET, Zurlinden E. Effect of sex and AIDS status on the plasma and intrapulmonary pharmacokinetics of rifampicin. Clin Pharmacokinet 2004;43(6):395-404.
15
[2] Kiem S, Schentag JJ. Interpretation of antibiotic concentration ratios measured in epithelial lining fluid. Antimicrob Agents Chemother 2008;52(1):24-36.
16
Poster: Applications- Anti-infectives
Sylvain Goutelle Influence of Rifampin Pharmacokinetic Variability on Antibacterial Effect and Prevention of Resistance in Pulmonary Tuberculosis: a
Simulation Study
S. Goutelle (1,2,3), L. Bourguignon (1,2), P.H. Maire (1,2), M. Van Guilder (3), R.W. Jelliffe (3), J.E. Conte Jr (4,5)
(1) Hospices Civils de Lyon, Hôpital A. Charial, ADCAPT - Service Pharmaceutique, Francheville, France ; (2) Université Lyon 1, UMR CNRS 5558, Villeurbanne, France ; (3) Laboratory of Applied Pharmacokinetics, USC School of Medicine, Los Angeles, USA ; (4) Department of
Epidemiology and Biostatistics, Infectious Disease Research Group, University of California San Francisco and (5) American Health Sciences, San Francisco, USA
Objectives: The pharmacokinetic-pharmacodynamic (PK-PD) relationships of rifampin (RIF) are a key issue in tuberculosis (TB) treatment. Both Mycobacterium tuberculosis (MTB) killing and prevention of drug resistance are related to RIF concentrations [1,2]. Our work examined the pulmonary PK-PD variability of RIF in adult subjects, using a simulation approach.
Methods: A Monte Carlo simulation was done using Matlab® (n = 10,000 subjects). A three compartment PK model was used to calculate RIF concentrations in plasma, epithelial lining fluid (ELF) and alveolar cells (AC). The simulation used the nonparametric distribution grid of RIF PK parameters estimated from a clinical dataset using the NPAG algorithm. Each NPAG support point was used as a mean vector, in accordance with its probability. Then, the random assignment process assumed a normal bounded distribution for each parameter. The covariance matrix of PK parameter obtained from NPAG was put around each support point. The ratio of the maximum concentration (Cmax, in mg.L-1) to the minimum inhibitory concentration (MIC, in mg.L-1) and the ratio of the area under the time-concentration curve (AUC0-24h, in mg.h.L-1) to the MIC were computed, for various MIC values, after one day and after ten days of oral RIF 600 mg/day for each subject. The results were compared with published targets: Cmax/MIC > 175 for the prevention of resistance (PR) [2] and AUC0-24h /MIC > 271 (ELF) or > 665 (AC) for the killing effect (K) [1].
Results: On the first day, mean (±SD) values for Cmax were 1.57 (±1.61) in ELF and 4.91 (±5.91) in AC. For AUC0-24h, mean values were 12.64 (±20.39) in ELF and 48.16 (±91.58) in AC. When the MIC was set at 0.01, the percent values of target attainment were 31.2% and 67.1% for PR in ELF and AC, and 64.9% and 67.1% for K in ELF and AC, respectively. For both effects, in each compartment, the percent values of target attainment decreased to less than 50% when the MIC was set at 0.025, and were less than 25% when the MIC was set at 0.1. On the tenth day, target attainment values were only slightly better. Concentration decrease due to RIF auto-induction was not considered in the simulation.
Conclusions: With a standard adult dose of 600 mg/day, concentrations of RIF in ELF and AC are too low in most patients to prevent resistance and to insure a significant antibacterial effect, even against MTB with low MIC values. This shows the need to evaluate higher doses of RIF to treat patients with TB.
pharmacodynamics of rifampin in an aerosol infection model of tuberculosis. Antimicrob Agents Chemother 2003;47(7):2118-24. [2] Gumbo T, Louie A, Deziel MR, Liu W, Parsons LM, Salfinger M, et al. Concentration-dependent Mycobacterium tuberculosis killing and prevention of resistance by rifampin. Antimicrob Agents Chemother 2007;51(11):3781-8.
18
Poster: Applications- Anti-infectives
FLORA MUSUAMBA-TSHINANU Simultaneous Therapeutic Drug Monitoring Of Amikacin And Beta-Lactams In Intensive Care Unit Patients With Severe Sepsis
Or Septic Shock Without Beta-Lactam Serum Concentration Monitoring
F.T. Musuamba(1), I. Delattre(1), P.F. Laterre(3), J. Cumps(4), F. Jacobs(5), R.K. Verbeeck(2 )and P. Wallemacq(1)
(1)Department of Clinical Biochemistry, (2)Department of Pharmacokinetics, (3)Department of Biostatistics, Université Catholique de Louvain, Brussels, Belgium; (3)Department of Intensive
Care, St-Luc Hospital, Brussels, Belgium; (5)Department of Infectious Diseases, Erasme Hospital, Brussels; Belgium
Background: Associations of aminoglycosides and β-lactams are the most used treatment in intensive care unit (ICU) patients with severe sepsis or septic shock. These antibiotics dosage regimens take rarely into account pharmacokinetic (PK) variability and disease-induced alterations that may result in inadequate concentrations. Moreover, these antibiotics, except aminoglycosides, are not routinely adjusted by therapeutic drug monitoring (TDM).
The aim of the study was to develop a population pharmacokinetic-pharmacodynamic (PPK/PD) model able to predict the exposure and outcome of 4 Amikacin (AMK)- β-lactam co-medications in order to optimize their dosage regimens.
Methods: 74 ICU critically septic patients were included. All received a first dose of AMK combined with piperacillin/tazobactam, ceftazidime, cefepime or meropenem. The five antibiotic PK parameters were estimated using WinNonlin® software. A PPK/PD analysis was performed using NONMEM software. AMK PK parameters, demographic and routine biochemistry data were used as covariables to predict the β-lactam PK. In a second time, the treatment failure was predicted from the co-medication exposure and patients' characteristics.
Results: Four two-compartments models were built in order to predict Amikacin β-lactam PK parameters (volume of distribution, clearance, elimination half-live and area under the curve). For each β-lactam PK parameter, the corresponding AMK parameter was retained as covariable in the final PK model. Co-medication exposure was well correlated with treatment failure.
Conclusions: The four ß-lactam and AMK exposure have been predicted from AMK TDM in ICU patients with severe sepsis or septic shock. An efficacy-based-TDM can be routinely done for the four ß-lactams without their serum concentration monitoring.
19
Poster: Applications- Anti-infectives
PARTHA NANDY Relationship Between a PK/PD Parameter and Therapeutic Response of Ceftobiprole in Patients with Complicate Skin and Skin Structure
Infection
H Kimko, B Murthy, RS Strauss, S Xu, P Bagchi, P Nandy, K Bush, GJ Noel Johnson & Johnson Pharmaceutical R&D, LLC
Objectives: Ceftobiprole is an investigational cephalosporin with activity against Gram-negative and Gram-positive pathogens, including methicillin-resistant staphylococci. Two phase 3 studies have been conducted in patients with complicated skin and skin structure infection (cSSSI). The purpose of this analysis was to evaluate the relationship between % time above MIC (%T>MIC) and clinical and microbiologic responses in patients with cSSSI.
Methods: The dataset from the 312 patients in the microbiological Intent-To-Treat analysis with measured ceftobiprole concentrations and the baseline MIC values was used. The individual pharmacokinetic (PK) profiles were obtained from a population PK model to estimate individual %T>MIC. Pearson's chi2 test was used to test the independence of 2 variables: %T>MIC targets (>=30% or >=50%) and therapeutic responses (i.e., clinical cure/failure). The relationship was also investigated by logistic regression analyses using continuous %T>MIC by infection type and pathogen type.
Results: For the subjects with a %T>MIC below 30%, the clinical failure rate approached 32% (7 of 22 subjects), compared with the subjects with greater than 30% T>MIC, whose failure rate approximated 9% (27 of 290 subjects). There was a strong association (P < 0.005) between achieving the >=30% or >=50% T>MIC targets and the probability of achieving clinical success. The continuous variable, %T>MIC, demonstrated a positive trend on the probability of clinical success for both infection type and pathogen type.
Conclusions: There was a strong association between achieving the >=30% or >=50% T>MIC targets and the probability of achieving clinical or microbiological success with ceftobiprole. The logistic regression showed that the probability of therapeutic success increased with increasing %T>MIC.
20
Poster: Applications- Anti-infectives
Michael Neely Population Kinetics and Dynamics of Lopinavir in HIV-Infected Children
M. Neely (1), J. van den Anker (2), S. Soldin (2), K. Williams (2), A. Baghdassarian (2), N. Rakhmanina (2)
(1) Laboratory of Applied Pharmacokinetics, University of Southern California, Los Angeles; (2) Children's National Medical Center, Washington DC
Objectives: To develop a population pharmacokinetic (PK) and pharmacodynamic (PD) model of lopinavir (LPV) in HIV-infected children.
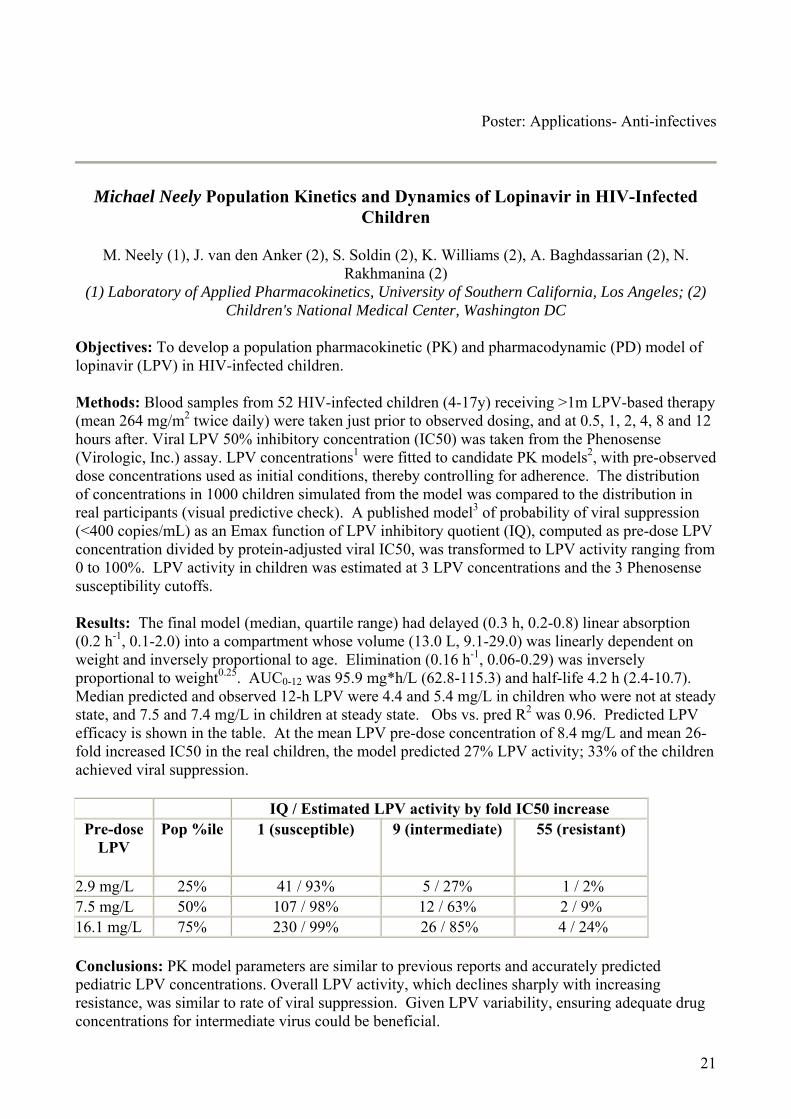
Methods: Blood samples from 52 HIV-infected children (4-17y) receiving >1m LPV-based therapy (mean 264 mg/m2 twice daily) were taken just prior to observed dosing, and at 0.5, 1, 2, 4, 8 and 12 hours after. Viral LPV 50% inhibitory concentration (IC50) was taken from the Phenosense (Virologic, Inc.) assay. LPV concentrations1 were fitted to candidate PK models2, with pre-observed dose concentrations used as initial conditions, thereby controlling for adherence. The distribution of concentrations in 1000 children simulated from the model was compared to the distribution in real participants (visual predictive check). A published model3 of probability of viral suppression (<400 copies/mL) as an Emax function of LPV inhibitory quotient (IQ), computed as pre-dose LPV concentration divided by protein-adjusted viral IC50, was transformed to LPV activity ranging from 0 to 100%. LPV activity in children was estimated at 3 LPV concentrations and the 3 Phenosense susceptibility cutoffs.
Results: The final model (median, quartile range) had delayed (0.3 h, 0.2-0.8) linear absorption (0.2 h-1, 0.1-2.0) into a compartment whose volume (13.0 L, 9.1-29.0) was linearly dependent on weight and inversely proportional to age. Elimination (0.16 h-1, 0.06-0.29) was inversely proportional to weight0.25. AUC0-12 was 95.9 mg*h/L (62.8-115.3) and half-life 4.2 h (2.4-10.7). Median predicted and observed 12-h LPV were 4.4 and 5.4 mg/L in children who were not at steady state, and 7.5 and 7.4 mg/L in children at steady state. Obs vs. pred R2 was 0.96. Predicted LPV efficacy is shown in the table. At the mean LPV pre-dose concentration of 8.4 mg/L and mean 26-fold increased IC50 in the real children, the model predicted 27% LPV activity; 33% of the children achieved viral suppression.
IQ / Estimated LPV activity by fold IC50 increase Pre-dose
Conclusions: PK model parameters are similar to previous reports and accurately predicted pediatric LPV concentrations. Overall LPV activity, which declines sharply with increasing resistance, was similar to rate of viral suppression. Given LPV variability, ensuring adequate drug concentrations for intermediate virus could be beneficial.
21
References: [1] Volosov A, Alexander C, Ting L et al. Simple rapid method for quantification of antiretrovirals by liquid chromatography-tandem mass-spectrometry. Clin Biochem. 2002; 35(2):99-103. [2] USCPACK Software for Parametric and Non-Parametric Population Modeling. Available by licence from the Laboratory of Applied Pharmacokinetics and the University of Southern California, http://www.lapk.org/. 2008. [3] Hsu A, Isaacson J, Brun S et al. Pharmacokinetic-pharmacodynamic analysis of lopinavir-ritonavir in combination with efavirenz and two nucleoside reverse transcriptase inhibitors in extensively pretreated human immunodeficiency virus-infected patients. Antimicrob Agents Chemother. 2003; 47(1):350-359.
Elisabet Nielsen Developmental Pharmacokinetics of Gentamicin in Preterm and Term Neonates: Modelling and Simulation Based on Data from a Prospective Study
Elisabet I Nielsen (1,2), Marie Sandström (1,3), Per Hartvig (2,4), Uwe Ewald (5), Lena E Friberg (1)
(1) Department of Pharmaceutical Biosciences, Uppsala University, Sweden; (2) Hospital Pharmacy, University Hospital, Uppsala, Sweden; (3) AstraZeneca, R&D, Mölndal, Sweden; (4) Department of Pharmacology and Pharmacotherapy, University of Copenhagen, Denmark; (5)
Department of Neonatology, University Children’s Hospital, Uppsala, Sweden
Objectives: Knowledge and use of predictive covariates could lead to faster attainment of therapeutic gentamicin levels and reduce the need of concentration monitoring. The objectives of this study were (1) to characterize the population pharmacokinetics of gentamicin in preterm and term newborn infants and to identify predictive covariates and (2) to perform simulations to evaluate the effectiveness of current as well as alternative dosing guidelines.
Methods: A total of 894 serum gentamicin samples from 61 newborn infants (gestational age, GA: 23-42 weeks, postnatal age, PNA: 0-45 days) were collected in a prospective study performed in the NICU, University Children's hospital, Uppsala, Sweden. An interim analysis of this study has been presented earlier [1]. Predictive performance was evaluated using an independent, external dataset [2]. Simulations from the final model were performed to evaluate the performance of three dosing regimens (4 mg/kg τ=24 h, 4 mg/kg τ=36 h and 5 mg/kg τ=48 h) in achieving targeted peak and trough levels in preterm and term neonates during gentamicin treatment in the first postnatal week.
Results: The gentamicin concentration-time profile was described using a 3-compartment model with body weight included as the primary covariate according to an allometric power model. Gentamicin clearance was found to increase with GA and PNA (included in a nonlinear fashion). GA was also identified to have a significant influence on central volume of distribution. The external dataset was well predicted by the developed model. The simulations showed that a substantial number of neonates with GA<30 weeks (32 and 60% at PNA=1 and PNA=7, respectively) reached potentially toxic trough concentrations (>2 mg/L) when administered 4 mg/kg once daily. The same dose also produced a peak concentration (1h post infusion) <6 mg/L after the initial dose in 12% of these neonates. For the other investigated dosing regimens, a high degree (>90%) of target fulfilment was achieved.
Conclusions: Body weight and age (GA and PNA) were found to be major factors contributing to inter-individual variability in gentamicin clearance in neonates. Based on simulations from the developed model, the majority of the preterm neonates do not reach targeted peak and trough gentamicin levels after a standard dosage regimen of 4 mg/kg given once daily, suggesting a need for higher loading doses and a prolonged dosing interval in this patient population.
References: [1] Nielsen EI., Ewald U., Friberg LE. Population Pharmacokinetics of Gentamicin in Preterm and Term Newborn Infants. PAGE 15 (2006) Abstr 1034 [www.page-meeting.org/?abstract=1034] [2] Thomson AH, Way S, Bryson SM, McGovern EM., Kelman AW., Whiting B. Population pharmacokinetics of gentamicin in neonates. Dev Pharmacol Ther 1988;11 (3): 173-9.
23
24
Poster: Applications- Anti-infectives
Daniel Röshammar Population Pharmacokinetics of Efavirenz and MDR-1, CY2B6, and CYP3A5 Polymorphisms
Jackson K. Mukonzo (1), Paul Waako (1), Daniel Röshammar (3), Maria Andersson (2), Jan-Olov Svensson (2), Jasper Ogwal-Okeng (1), Lars L Gustafsson (2), Eleni Aklillu (2)
(1) Department of Pharmacology & Therapeutics, Makerere University, Kampala Uganda; (2) Department of Clinical Pharmacology, Karolinska Institute, Stockholm, Sweden; (3) Department of
Pharmacology, Sahlgrenska Academy, University of Gothenburg, Göteborg, Sweden
Objectives: Efavirenz, an antiretroviral drug metabolized by polymorphic enzymes, exhibits between-subject pharmacokinetic variability causing varied clinical response. Lower and higher plasma concentration among HIV patients' results into virologic failure and central nervous system related toxicities, respectively. Factors for efavirenz pharmacokinetic variability ranging from sex to ethnicity are poorly understood. We examined the effect of genetic polymorphism in CYP2B6, CYP3A5 and MDR-1 on the efavirenz population pharmacokinetics among Ugandans.
Methods: A total of 402 efavirenz concentrations from 121 healthy volunteers were determined by HPLC. Study participants were genotyped for 26 single nucleotide polymorphisms in CYP2B6 (n =7), CYP3A5 (n =5) and MDR1 (n =14) genes by mini-sequencing and PCR-RFLP. To explore the influence of covariates on the efavirenz pharmacokinetics, the data was analyzed using a non-linear mixed effects modeling approach in NONMEM.
Results: The pharmacokinetics of efavirenz were described by a two-compartment model with zero- followed by first-order absorption. The inclusion of CYP2B6 (516G>T, *11) polymorphisms in the model explained 11%, and 3 % of the between-subject variability (CV %) in efavirenz clearance and 'poor metabolisers' were observed to have 22 and 19% lower clearance than 'extensive metabolisers', respectively. Sex as a covariate reduced unexplained between-subject variability in the peripheral volume of distribution from 41 to 24%, while MDR-1 (rs exon 29) explained 10% of the variability in oral efavirenz bioavailability which was 20% higher in mutant subjects. The peripheral volume of distribution was two-fold higher in females compared to males.
Conclusions: The results indicate that CYP2B6 (516G>T, *11), as well as MDR-1 (rs exon 29) polymorphisms and sex influence efavirenz pharmacokinetics. Presence of MDR-1 at absorptive and secretory sites explains its polymorphic effect on efavirenz bioavailability. The big peripheral volume of distribution in females could be due to a high body fat content in female subjects.
25
Poster: Applications- Anti-infectives
Catherine Mary Turner Sherwin Simulation and development of a netilmicin extended dosing regimen for extremely premature neonates.
C.M.T. Sherwin (1, 2), N.J. Medlicott (2), R. Broadbent (1), D.M. Reith (1). (1) Department of Women’s and Child Health, Dunedin School of Medicine, University of Otago,
Dunedin, New Zealand; (2) School of Pharmacy, University of Otago, Dunedin, New Zealand.
Objectives: To develop an optimal extended dosing regimen for netilmicin in neonates.
Methods: A retrospective chart review was performed for all neonates admitted to the neonatal unit at Dunedin Hospital between 1 February 1999 to 27 July 2003 who were treated with netilmicin. The study included 97 neonates aged from two days up to an age of 28 days, corrected for gestational age (GA) at birth. Neonates with suspected sepsis who were > 48 h of age were treated with netilmicin. Netilmicin was discontinued after 48 h unless neonates were confirmed septic or remained clinically unwell. Patients received a loading dose of 4 mg/kg netilmicin by intravenous (IV) infusion over 30 min. Loading doses ≥ 5 mg in total, were followed with a 1 mL saline flush. Maintenance doses were given by IV bolus over 3-5 min at 2.5 mg/kg/dose according to the patient's current weight (CWT). The dosing interval was determined by postmenstrual age (PMA) and postnatal age (PNA). Netilmicin plasma concentrations (peak and trough) were determined at the third dose after initiation of treatment or after a change in dose or dosing interval. Trough samples were taken immediately prior to the next dose and were considered to indicate a lesser risk of toxicity if they were less than 2 mg/L. Peak concentrations were taken 60 min after commencement of the IV bolus. A total of 361 netilmicin therapeutic concentrations were collected, an average of three samples per patient. All data analyses were performed using NONMEM (version.5). A mixed effects one-compartment, first order elimination model was developed to fit the dataset. The pharmacokinetic (PK) model was used to simulate various dosing regimens using a nonparametric dataset that comprised of covariate distribution values for CWT and PMA from 719 individual neonates. PMA ranged from 24.7-44.1 (weeks) and CWT 0.45-4.43 (kg) within the dataset. MATLAB (student version 7.1) was used to perform simulations for each proposed dosing regimen. Consistent with other neonatal dosing regimens PMA was split into groups based on renal maturation. The model simulated the administration of two doses via IV infusion at duration of 0.5 h. For this simulation, the criteria were achievement of maximum peak plasma concentration (Cmax) and area under the curve over 24 h (AUC24) on day one and day two, 5-12 mg/L and 50-300 mg/L h respectively.
Results: The principle factors influencing netilmicin clearance (CL) were PMA and CWT, and the principal determinant of volume of distribution (V) was CWT. The final covariate model was CL = 0.192 · (CWT/2)1.35 · (PMA/40)1.03, V=1.5 · (CWT/2)0.3. Simulation was assessed by determining the percentage of success against specific criteria. The primary evaluation of treatment success was based on achieving Cmax within the stated boundaries. The independent variables used in the simulation included number of patients (n = 1000), dose interval (24-48 h) and dose given (3-8 mg). Currently recommended dosing regimens indicate a dose of 4 mg/kg in neonates > 34 weeks. The dosing regimen in the present study based on overall achievement of treatment success (Cmax and AUC24 for days 1 and 2), proposed a higher dose (7 mg/kg) for neonates PMA ≥ 34 weeks. The optimal dosing was 5 mg/kg 36 hourly, 5 mg/kg 24 hourly, 6 mg/kg 24 hourly and 7 mg/kg 24 hourly for neonates ≤27, 28 to 30, 31 to 33, and ≥34 weeks PMA respectively.
26
Conclusions: Individualisation of netilmicin dosing in neonates requires adjustment of dose by body weight, and dosing interval by both postmenstrual age and current weight. Overall, the simulated netilmicin dosing regimen suggested realistic recommendations. However, the simulated dosing regimen appears to be very well suited for extremely premature neonates.
27
Poster: Applications- Anti-infectives
Nicolas Simon Population Pharmacokinetics of Atazanavir in HIV-infected Patients
C Solas (1), MC Gagnieu (2), I Ravaux (3), MP Drogoul (4), A Lafeuillade (5), S Mokhtari (6), B Lacarelle (1) and N Simon (1).
(1) Fédération de Pharmacologie, Hôpital Timone, Marseille, France, (2) Laboratoire de Pharmacologie, Hôpital Edouard Herriot, Lyon, France, (3) Service de maladies infectieuses,
Hôpital Conception, Marseille, France, (4) CISIH, Hôpital Sainte-Marguerite, Marseille, France, (5) Service de maladies infectieuses, Hôpital Chalucet, Toulon, France, (6) Service de maladies
infectieuses, Hôpital Nord, Marseille, France
Objectives: The aim of the study was to determine the main pharmacokinetic (PK) parameters of ATV in real life using a population PK approach in HIV infected patients treated with the once daily association ATV/ritonavir.
Methods: Observational study in patients treated with the once-daily regimen ATV associated to 100 mg of ritonavir. Blood samples were drawn at steady state, at various time ranging from 1 to 26 hours post dose. ATV plasma concentrations were determined by a HPLC method. ATV population PK analysis was performed using a non linear mixed-effects model (NONMEM version 6).
Results: One hundred and eighty seven patients with a median age of 41 years were included during the follow-up period. The ATV doses prescribed were 300 mg (n=169), 400 mg (n=12), 200 mg (n=1) and 150 mg (n=5). ATV population PK was described using a one-compartment model with first order absorption. Mean PK parameters estimations (inter-subject variability, %) were as follow: oral clearance (CL) = 7.63 L/h (34), volume of distribution (V) = 80.8 L (37) and constant of absorption (KA) = 1.05 h-1 (156). The introduction of a lag time significantly improved the fit. The random residual variability was 522 ng/ml (standard error= 156). The mean estimated half-life (T-half) was 7.5 hours.
Conclusion: Estimated T-half of ATV in 187 HIV-infected patients in the context of real life was comparable to that previously reported of 8.8 h on a larger population (n=214) and 8.6 h in a small study involving 10 HIV-infected patients. We observed a wide interpatient variability in the ATV clearance, volume of distribution and constant of absorption. Because of its once-daily administration, the ATV Ctrough samples may not always be collected accurately, particularly in patients taking ATV in the evening. This model may be useful, using Bayesian method, to predict ATV Ctrough from plasma samples collected anytime during the dosing interval.
28
Poster: Applications- Anti-infectives
Joel Tarning Population pharmacokinetics of lumefantrine in pregnant women treated with co-artemether for uncomplicated falciparum malaria
R. McGready (1,2,3), J. Tarning (2), N. Lindegardh (2,3), E.A. Ashley (1,2,3), M. Pimanpanarak (1), B. Kamanikom (2), A. Annerberg (2), P. Singhasivanon (2), N.J. White (2,3), F. Nosten (1,2,3)
(1) Shoklo Malaria Research Unit, Mae Sot, Thailand; (2) Mahidol-Oxford Tropical Medicine Research Unit, Bangkok, Thailand; (3) Centre for Vaccinology and Tropical Medicine, Churchill
Hospital, Oxford, UK.
Objectives: The fixed combination of artemether and lumefantrine (co-artemether) is today the most widely used co-formulated artemisinin-based antimalarial combination therapy manufactured to GMP standards. Pregnancy was recently shown to be associated with reduced plasma concentrations of both artemether and lumefantrine in a detailed pharmacokinetic study of thirteen pregnant women with falciparum malaria [1]. The main objective of this study was to determine the population pharmacokinetic properties of lumefantrine in pregnant women with uncomplicated multi-drug resistant falciparum malaria in Thailand.
Methods: Pregnant women (n=103) with falciparum malaria in the 2nd and 3rd trimester of pregnancy were enrolled to receive artemether-lumefantrine (80-480 mg) BID for three days. All patients provided five finger prick plasma samples for drug quantification, randomly distributed over 14 days. Concentration-time profiles of lumefantrine were modeled with nonlinear mixed-effects population modeling using NONMEM.
Results: Lumefantrine population pharmacokinetics was well described by a two-compartment model with first order absorption and elimination. Absorption lag-time significantly improved the model fit. Several covariates, such as BMI, body-weight, age, estimated gestational age (EGA), influenced the pharmacokinetics when modeled individually. The final model could be reduced to include inter-individual variability on CL/F, Vc/F and Ka with linear covariate relationships between EGA and Vc/F and Q/F. Higher day seven concentrations (mean [range] ng/mL) were observed in this study (483 [134-1454]) compared to non-pregnant adults (350 [204-869]) and previously reported in pregnant patients (384 [62-835]) [1,2]. Mean day seven concentrations were lower but not statistically different in recrudescent patients compared with cured in the present study; 399 (164-551) and 513 (138-1454), respectively.
Conclusions: Day seven concentrations of lumefantrine have been shown to correlate well with total drug exposure and efficacy in large clinical studies [3]. The unusual low cure rate observed in this study can not be explained by lower total drug exposure (day seven concentrations). However, this study uses capillary plasma compared to previous results based on venous sampling. The highly variable pharmacokinetic properties of lumefantrine require further studies to establish a pharmacokinetic-pharmacodynamic relationship in pregnant women.
References: [1] McGready R, Stepniewska K, Lindegardh N, Ashley EA, La Y, Singhasivanon P, White NJ, Nosten F. The pharmacokinetics of artemether and lumefantrine in pregnant women with uncomplicated falciparum malaria. Eur J Clin Pharmacol. 2006 Dec;62(12):1021-31. [2] Ashley EA, Stepniewska K, Lindegårdh N, McGready R, Annerberg A, Hutagalung R,
29
Singtoroj T, Hla G, Brockman A, Proux S, Wilahphaingern J, Singhasivanon P, White NJ, Nosten F. Pharmacokinetic study of artemether-lumefantrine given once daily for the treatment of uncomplicated multidrug-resistant falciparum malaria. Trop Med Int Health. 2007 Feb;12(2):201-8. [3] White NJ, van Vugt M, Ezzet F. Clinical pharmacokinetics and pharmacodynamics and pharmacodynamics of artemether-lumefantrine. Clin Pharmacokinet. 1999 Aug;37(2):105-25.
30
Poster: Applications- Anti-infectives
Jan-Stefan van der Walt Population pharmacokinetic models for lamivudine and nevirapine to assess drug concentrations obtained during therapeutic drug
monitoring
Jan-Stefan van der Walt (1), Phumla Sinxadi (1), Karen Cohen (1), Helen McIlleron (1), Gary Maartens (1). Mats O Karlsson (2)
(1) Division of Clinical Pharmacology, University of Cape Town, Cape Town, South Africa (2) Division of Pharmacokinetics and Drug Therapy, Uppsala University, Uppsala, Sweden
Background and aims: Nucleoside reverse transcriptase inhibitors (NRTIs), the backbone of combined antiretroviral therapy (cART) in resource-limited countries, are not considered candidates for routine antiretroviral therapeutic drug monitoring (TDM). We are investigating lamivudine (3TC) and nevirapine (NVP) TDM as additional adherence tools. Routine sampling at antiretroviral (ARV)-outpatient clinic is seldom pre-dose/trough samples. We developed population pharmacokinetic models of 3TC and NVP to assess drug concentrations obtained during TDM to measure adherence.
Methods: The initial 3TC and NVP models were developed using rich healthy volunteer (HV) 3TC data (n=25, 15 samples per HV) and rich patient NVP data (N=25, 9 samples per patient). Sparse 3TC and NVP data were obtained from blood samples collected during oral glucose tolerance tests in HIV-infected patients on cART (N=128 3TC, N=48 NVP). Rich and sparse data were analyzed separately, simultaneously (combined) and using rich data as prior information for sparse data analysis (prior using the TNPRI functionality in NONMEM VI).
Results: One-compartment models with first-order absorption and elimination, and an absorption lag time best described the 3TC and NVP log-transformed concentration-time data. NVP sparse patient data were inadequate to reliably estimate population parameters. However, there were no marked differences in parameters between rich and sparse patient data and a combined analysis of sparse and rich data (CL/F = 2.52 L/h [4.7% RSE]; V/F 115 L [14%]; ka 3.21 /h [41%]) or an analysis of sparse data with prior from rich data (CL/F = 2.52 L/h [4.56% RSE]; V/F 104 L [8.8%]; ka 2.69 /h [35%]) gave similar population parameter estimates. For 3TC, higher CL/F and ka in HV than patients were indicated in both the combined analysis and when using the prior functionality. Once this was accounted for, the different analyses provided similar patient parameter estimates: combined analysis (CL/F = 14.6 L/h [4.2%]; V/F 89 L [5.7%]; ka 1.81 /h [8.9%]), prior (CL/F = 14.3 L/h [2.5%]; V/F 86 L [2.5%]; ka 1.80 /h [0.2%]).
Conclusions: Population pharmacokinetic models for 3TC and NVP were developed from rich and sparse data. Combined analyses and sequential rich-sparse analyses using the prior functionality led to the same model decisions and very similar parameter estimates.
31
Poster: Applications- Anti-infectives
Wei ZHAO Population Pharmacokinetics of Ganciclovir Following Oral Administration of its Prodrug Valganciclovir in Pediatric Renal Transplant
Patients
Zhao W (1), Baudouin V (2), Zhang D (1) and Jacqz-Aigrain E (1) 1.Department of Pediatric Pharmacology and Pharmacogenetics, Hospital Robert Debré, Paris,
France 2. Department of Nephrology, Hospital Robert Debré, Paris, France.
Introduction: Valganciclovir, the ester of ganciclovir and L-valine, is a prodrug of ganciclovir with improved oral absorption. It is well absorbed from the gastrointestinal tract and rapidly hydrolyzed in the intestinal wall and liver to ganciclovir that is eliminated via renal excretion. Population pharmacokinetic studies of valganciclovir in adults renal transplant patients have showed a large inter-individual variability in pharmacokinetic parameters[1]. But there is no pharmacokinetic data in pediatric renal transplant patients. Therefore, valganciclovir is administered in pediatric patients without data validating the dosage associated with similar drug exposure to that observed in adults in the different pediatric age groups.
Objective: The aims of the study were to develop a pharmacokinetic model for valganciclovir in pediatric renal transplant recipients, to identify covariates that explain variability and to evaluate dosing regiment in children.
Patients and Methods: Twenty- two pediatric renal transplant recipients which consisted of 11 males and 11 females, with a mean (± standard deviation [SD]) age of 10±5 years (range, 3 to 17 years) and a mean (± SD) weight of 34±19 kg (range, 12 to 76 kg) were included in the study between 2003 and 2007. All the children at risk of CMV disease received the prophylactic therapy with valganciclovir for 3 months. In the case of positive CMV antigenemia, the patients received preemptive therapy with an initial course of IV ganciclovir infusion over 1h at a dose of 5mg/kg every 12 hours for 15 days, followed by valganciclovir at a dose of 15mg/kg twice daily for 3 months. The dose adjustment was based on through blood level (C0) of ganciclovir with the target > 0.5μg•h/mL.
The pharmacokinetics of valgancilovir were described with plasma level from twenty-two patients using nonlinear mixed - effects modeling (NONMEM) software. The first order (FO) method was used initially followed by the first order conditional estimation (FOCE) method to improve the estimation of pharmacokinetic parameters and their variability. The selection of covariates used a forward and backward selection processes. The final model was validated by the methods of Bootstrap and Visual Predictive Check. Using the final model, different dosing regiments were tested with NONMEM to find one suitable in pediatric patients. For each dosing scenario, 1000 replications were performed. AUC0-24 values were generated for each simulated patient. The entire procedure was performed in an automated fashion using Wings for NONMEM. The Visual Predictive Check were processed by R for NONMEM (v.20070911)
Results: A total of 164 ganaciclovir concentrations (28 Pk profiles) were available for population modeling and were best described with a 2-compartement model with a lag-time. Inter-individual and residual variability were best described by exponential model. Inter-individual variability was then estimated for CL, V2 and KA.
32
The popPK analysis identified creatinine clearance and bodyweight as individual factors influencing the apparent apparent clearance. , a nonlinear relationship between CL and CLCREA and a linear relationship between CL and bodyweight significantly improved the model, with the equation: CL =θ1× (CLCREA/median) θ2+θ3× (WT/median)
The final estimates of PK parameters ( CL apparent systemic clearance, V2 apparent central volume of distribution, V3 apparent peripheral volume of distribution, Q inter-tissue clearance, Ka absorption rate constant, lag-time), were CL= 8.04*(CLCREA/89)**2.93+3.62*(WT/28) L/h, V2= 5.2 L, V3=30.7 L, Q=3.97 L/h, Ka=0.369 h-1 , and lag-time=0.743 h.
Routine diagnostic individual residuals versus individual model-predicted values were symmetrically distributed and were mostly within about 1 unit of the null ordinate, indicating a good fit of the model to the data. Plots of individual weighted residuals versus time were distributed symmetrically in a band with no obvious trend and were mostly within approximately 3 unit of the null ordinate, indicating that no time-related factor affected the data and that no subject's data contributed to any marked deviation from the model.
The mean parameters estimates resulting from the bootstrap procedure very closely agreed with the respective values from the final population model different from the estimates previously obtained with the original dataset, indicating that the estimates for the population pharmacokinetic parameters in the final model were accurate and that the model was stable. (87% successful run, 1000 bootstrap)
The visual predictive check show that approximately 90% of the data of ganciclovir fit well within the 5th - 95th percentiles ( Exact Binomial Test, 9.2 % out of limits observed, the 95% confidence interval [5.24 , 14.7] ) and were symmetrically distributed around the median (Pearson's Chi-squared test, p = 0.1492)
Based on the results of simulation, for a typical patient (bodyweight 28 kg and creatinine clearance 89 mL/min), valganciclovir 500mg once daily can achieve a similar AUC 43 ± 10.6μg•h/mL. Then, we divided the patients into two groups. Group 1, the value of creatinine clearance is between 70 and 90 mL/min; Group2, between 90 and 120 mL/min. Each patient is stimulated 1000 times using the NONMEM. We found that in group 1, the dosing of 400 mg once daily can achieve the AUC 47 ± 14.4μg•h/mL and in group 2, the dosing of 700mg once daily can achieve the AUC43 ± 15.3μg•h/mL. We observed the dosing in second group is 1.8-fold higher than that in first group in order ensure the similar AUC. The correlation coefficient between dose-normalized AUC and creatinine clearance is 0.709.These results indicated that in the pediatric patients, the creatinine clearance is much more correlated with the clearance of valganciclovir, compared to the adult patients.
Conclusions: A population PK model for valgancilclovir in pediatric renal transplant patients has been developed. The simulations suggest that in patients with creatinine clearance 70-90 mL/min and 90-120 mL/min, respective dosing regiment were 400mg once daily and 700 mg once daily, which can achieve the similar referenced AUC in adults. (46.3 ± 15.2μg•h/mL, 900mg once daily)[1].
References: [1] Wiltshire H. et al. Valganciclovir Solid Organ Transplant Study Group. Pharmacokinetic profile of ganciclovir after its oral administration and from its prodrug valganciclovir, in solid organ transplant recipients. Clin Pharmacokinet; 2005; 44(5):495-507.
33
Poster: Applications- Biologicals/vaccines
Daren Austin Use of mechanistic models to estimate target antigen load for monoclonal antibodies
Objectives: Monoclonal antibodies to cell surface targets are characterised by target-mediated non-linear clearance that is saturable at high molar ratios with subsequent linear pharmacokinetics and constant clearance with increasing dose. For targets such as the endothelial growth factor receptor (EGFR), target mediated clearance is the predominant clearance pathway at clinical doses. These nonlinear kinetic characteristics are clearly demonstrated for cetuximab (ErbituxTM) at clinical doses of 50 mg/m2, with a saturating value of 20 mL/h/m2[1] We propose, a model-based understanding of the binding kinetics, receptor turnover and pharmacokinetics of a potential candidate antibody, and show how the observed pharmacokinetics can be used to differentiate potential candidate antibodies and estimate the magnitude of the target antigen pool.
Methods: we constructed a reaction-kinetic, Pharmacokinetic/Pharmacodynamic (PK/PD) model of antibody binding to a pool of EGFR with published receptor turnover rates. The model was validated using cetuximab pharmacokinetic data and extrapolated to the potential candidate molecules of interest.
Results: The model correctly predicted the published cetuximab kinetics (without model fitting) with a target EGFR load of 2-4 mcg/mL and highly non-linear pharmacokinetic profiles. Linear pharmacokinetics at doses 10-fold lower than clinical cetuximab doses would require a much higher target specificity with an antigen load of at least least 24-5 times smaller then cetuximab.
Conclusions: The model can be used where target mediated clearance of proteins is observed to infer Proof of Pharmacology (binding), target turnover, and target load. Extention to a population-based model is possible, where the expected variability in target expression is likely to be the key driver and often known.
References: [1] Fracasso et al. Clin Cancer Res 2007; 13(3) 986-93
34
Poster: Applications- Biologicals/vaccines
Brigitte Lacroix Exposure-Response Modeling of the ACR20 Score in Rheumatoid Arthritis Patients Treated with Certolizumab Pegol.
Brigitte Lacroix(1,2), Mark Lovern(1), Armel Stockis(1), Maria Laura Sargentini-Maier(1), Mats O. Karlsson(2) and Lena E. Friberg(2)
(1) Pharmacometrics, Global Exploratory Development, UCB Pharma SA, Belgium; (2)Division of Pharmacokinetics & Drug Therapy, Department of Pharmaceutical Biosciences, Uppsala
University, Sweden
Objectives: This analysis aimed to describe the exposure-response relationship of certolizumab pegol (CZP) in patients with rheumatoid arthritis, using the changes in the ACR20 clinical score (American College of Rheumatology 20% improvement criteria) as a response variable.
Methods: The ACR20 data from 1747 patients treated with CZP and 633 patients treated with placebo (from one Phase II and four phase III clinical trials) were used for non-linear mixed effects modeling using NONMEM VI. Placebo or CZP at doses ranging from 50 to 800 mg was administered subcutaneously every 2 or 4 weeks, with or without concomitant administration of methotrexate, for 8 to 48 weeks. At each visit, the ACR20 scores (responder/non-responder) and drop out events were coded in 3 categories. The probabilities of the transitions between these 3 different states were modeled using logit functions. The drug effect was introduced as various functions of the plasma concentration. The model was used to predict the clinical outcome following various treatment regimens in a variety of patient sub-populations.
Results: The best model combined Emax functions on the logit scale to describe the increase of the probability of becoming a responder and the decrease of the probability of becoming a non-responder as a function of the average plasma concentration between successive doses (Cavg). The population value of EC50, i.e. the Cavg leading to half the maximum probability of becoming a responder and half the minimum probability of becoming a non-responder was estimated at 16.8 mg/mL (95%CI: 10.2-23.4). Simulations from the final exposure-response model, in fully compliant patients, predicted similar response probabilities for 200 mg every 2 weeks and 400 mg every 4 weeks dosing schedules (response rate of 0.71 versus 0.69). Loading doses of 400 mg at weeks 0, 2 and 4 were predicted to increase the response rate at week 12 (0.64 versus 0.55) but not at week 22 (0.71 versus 0.68).
Conclusions: A significant exposure-response relationship was demonstrated for CZP in rheumatoid arthritis. The simulations support dosing regimens of 200 every other week or 400 every 4 weeks. Loading doses of 400 mg on weeks 0, 2 and 4 were predicted to result in a faster onset of action that is still perceivable on week 12 whereas no difference persisted on week 22.
35
Poster: Applications- Biologicals/vaccines
Brigitte Lacroix Exposure-response analysis of certolizumab pegol in Crohn’s disease population
Maria C. Kjellsson(1), Kristin E. Karlsson(1), Andrew Hooker(1), Brigitte Lacroix(2), Maria Laura Sargentini-Maier(2), Armel Stockis(2), Mats O. Karlsson(1)
(1)Div. of Pharmacokinetics & Drug Therapy, Dept. of Pharmaceutical Biosciences, Uppsala University, Uppsala, Sweden; (2)Pharmacometrics, Global Exploratory Development, UCB
Pharma S.A., Braine-l’Alleud, Belgium
Objectives: The objectives of this population analysis were to: 1) characterize the placebo and drug effect of certolizumab pegol (CZP) in the Crohn's disease (CD) population using data pooled from 3 clinical trials, 2) investigate the presence of exposure-response in different subsets of the data, 3) simulate new study designs using the population model.
Methods: The CDAI (Crohn's Disease Activity Index) data from 1597 subjects were used for non-linear mixed effects modeling using NONMEM (FOCE INTER estimation method). Modeling was based on data from a dose-ranging trial (study 1) and two confirmatory trials (studies 2 and 3). Placebo or CZP was administered subcutaneously at doses of 100 mg (only study 1), 200 mg (only study 1), and 400 mg (all studies) every 4 weeks, with a 400 mg induction dose at week 0, 2, 4 (only studies 2 and 3), for a duration of 8 weeks (Study 1) or 24 weeks (Studies 2 and 3).
Results: An infusion-like model varying with time and an Emax model varying with individual predicted concentrations from the PK model of certolizumab were used for describing the placebo effect and drug effect of CZP, respectively. Two populations were identified: a drug-sensitive population and a non-drug sensitive population. The maximum effect of CZP was fixed to zero for the non-drug sensitive population and the proportion of drug-sensitive subjects was estimated. Differences between the studies were found in baseline CDAI, maximum placebo effect and proportion of drug-sensitive subjects. These parameters were all estimated to lower values for study 2, intermediate for study 1 and higher for study 3. Exposure-response was shown for a number of different subsets of the data, models and measurements of exposure. Individual predicted concentrations from the PK model of certolizumab were shown to be the best measurement of exposure in the majority of the subsets of data. Model evaluation showed that the results of study 2 were more difficult to recreate even though study differences were taken into consideration. The difference between the simulated data and the observed data of study 2 could be due to ignoring study differences in the variance parameters, which was not investigated. Simulations of alternative study designs were made showing limited difference in moving readout to week 4 instead of week 6 and no relevant gain in starting the study with a loading dose of 800 mg.
Conclusions: Exposure-response was robustly shown under a variety of settings for all three studies.
36
Poster: Applications- Biologicals/vaccines
Micha Levi Relationship Between Serum Concentration of the Interleukin-6 Receptor Inhibitor, Tocilizumab (TCZ), and Disease Activity Score (DAS28) in
Patients with Rheumatoid Arthritis
Micha Levi (1), Nicolas Frey (2) , Susan Grange (2), Thasia Woodworth (3) (1) Roche, Nutley, NJ, USA; (2) Roche, Basel, Switzerland, (3) Roche, Hertfordshire, UK
Objective: To describe the relationship between tocilizumab concentration and the clinical endpoint (DAS28). A secondary objective was to investigate potential effects of the demographic, the disease- and treatment related covariates on parameters of the PK/PD model.
Methods: Data were pooled from, two randomized, double-blind, placebo-controlled, phase 3 trials in adults with moderate-to-severe active RA, who received TCZ 4 or 8 mg/kg via IV infusion every 4 weeks for 24 weeks or placebo, in combination with DMARDs. A population PK/PD model was developed using these studies to describe the time course of DAS28 with TCZ treatment, a third study, was used for external validation. The impact of demographic and disease-related covariates on parameters of the PK/PD model was assessed.
Results: In total, 1703 RA patients with available PK and DAS28 values were used for model development and 443 were used for external validation. An indirect response model with an inhibitory effect on DAS28 'production' rate by TCZ serum concentrations following a sigmoid Emax relationship, accurately described the magnitude and time course of DAS28 reduction. At baseline, DAS28 was 6.8. The TCZ serum concentration that induced 50% of the Emax was 3.72 mg/ml (slightly higher than the mean trough concentration with 4 mg/kg), with high (170%) inter-patient variability. Emax was 72.5%, corresponding to a maximum 5-point DAS reduction. DMARD background therapy represented only a small fraction of the total effect on DAS28 observed for the two TCZ doses (estimated 0.8-point DAS reduction from baseline). None of the covariates had a clinical impact on the relationship between TCZ exposure and DAS28 time course.
Simulations to reproduce the estimated between-patient variability, showed that TCZ 8 mg/kg versus 4 mg/kg was associated with higher proportions of patients with DAS28 remission (35% vs 21%) and good EULAR response (53% vs 35%).
Conclusions: In this analysis, the relationship between TCZ serum concentration levels and DAS28 were characterized reasonably well by using an indirect response model with sgimoidal Emax inhibitory effect of TCZ on DAS28 ‘production' rate. Demographic and disease-related covariates had no effect on parameters of the PK/PD model, suggesting that subpopulations of patients with RA may not require TCZ dose adjustment. The concentrations corresponding to 8 mg/kg were more effective in reducing RA disease activity (DAS28) than those corresponding to 4 mg/kg.
37
Poster: Applications- Biologicals/vaccines
Etienne Pigeolet Granulocyte Colony Stimulating Factor Pharmacokinetics After Single and Repeated Administration of Several Doses.
E. Pigeolet (1), F. Luedicke (2), S. Balser (2), G. Pinault (1) and P. Lowe (1) (1) Novartis Pharma AG; (2) Sandoz Biopharmaceutical Development
Objectives: Granulocyte Colony Stimulating Factor (G-CSF) pharmacokinetics have a non linear dose and time dependent behavior, with its observed concentration-time profile markedly decreasing after repeated administration of the same dose. The non linearity has been attributed to the target mediated drug disposition and the increasing number of receptors located on the stimulated cells [1]. The aim of the modeling analysis was to better understand and quantify the dose and time dependent non linearity of G-CSF pharmacokinetics.
Methods: We evaluated about 3000 plasma concentration-time records from rich sampling profiles of 112 healthy male and female volunteers. G-CSF was administered as repeated s.c. daily administration for one week of 2.5, 5 and 10 ug/kg doses and single i.v. dose (5 ug/kg). Pharmacodynamic data (blood neutrophil count) were available for the same time frame. Bayesian pharmacokinetic parameter estimates were obtained from simultaneous individual profile fits using NONMEM V.
Results: The structural model was a 2 compartment model with zero order absorption and an additional elimination rate constant from the peripheral volume of distribution (k20). Clearance, central and peripheral volume of distribution were increasing with time in a saturable way. A massive increase with time in the peripheral volume was observed from zero to about 14 L at steady state, whilst the central volume of distribution increased from about 2.5 to about 6 L. This is consistent with the large G-CSF induced increase of neutrophils and neutrophil precursors in the bone marrow as well as the release of neutrophils into the circulation. Clearance increased both with time and dose and k20 also increased with dose. It can be hypothesized that these changes are linked to an increased irreversible uptake of G-CSF due to the large number of G-CSF receptor positive cells after repeated administration. The bioavailability (F) was decreasing and the rate of distribution to peripheral tissues (Q) was increasing with decreasing doses. These changes are to be related to the saturable capture of G-CSF by its receptor.
Conclusions: The simultaneous modeling of i.v., s.c., single and repeated administration of several doses of G-CSF allowed to confirm and understand that its pharmacodynamics have a major impact on its pharmacokinetics.
References: [1] Kuwabara, T.; Kobayashi, S. and Sugiyama, Y. Pharmacokinetics and Pharmacodynamics of a recombinant human Granulocyte Colony Stimulating Factor. Drug Metabolism Reviews, 28 (4), 625-658, 1996.
38
Poster: Applications- Biologicals/vaccines
David Ternant Development of anti-infliximab antibodies increases infliximab clearance in inflammatory bowel diseases
D Ternant, A Aubourg, C Magdelaine-Beuzelin, D Degenne, H Watier, L Picon and G Paintaud. Faculty of medicine, Université François Rabelais, Tours, France
Objectives: Infliximab, an anti-TNF-α monoclonal antibody, has profoundly modified the treatment of several inflammatory diseases. The objective of this study was to assess the influence of antibodies directed towards infliximab (ATI) on infliximab pharmacokinetics.
Methods: Thirty-three chronic inflammatory bowel disease patients in whom infliximab concentration and ATI were monitored on a routine basis, using ELISA techniques, were included. Infliximab pharmacokinetics was analyzed using a population two-compartment pharmacokinetic model. Influence of sex, weight, age, disease, concomitant immunosuppressive treatment and ATI on the parameters was investigated.
Results: In 5 out of 33 patients, ATI were detected at least once during their follow-up. Mean systemic clearance of infliximab with and without ATI was 0.012 and 0.032 L/h, respectively (p < 0.001). Mean distribution half-life (t½-α) with and without ATI was 4.3 and 2.5 days, respectively (p = 0.015). Mean elimination half-life (t½-β) with and without ATI was 12.4 and 18.8 days, respectively (p = 0.002). In 2 patients, an increase in dose led to a decrease in infliximab clearance, suggesting that the influence of ATI may be neutralized by dose adjustment.
Conclusions: These results describe for the first time the quantitative influence of ATI on infliximab clearance. The monitoring of ATI may help to understand failures of infliximab treatment and may guide dose adjustment.
39
Poster: Applications- Biologicals/vaccines
Justin Wilkins Bioequivalence, bootstrapping and case-deletion diagnostics in a biologic: a model-based analysis of the effect of formulation differences in a
Objectives: The primary objective of this work was to ascertain, through an integrated PK/PD model-based approach, whether the pharmacokinetics of a monoclonal antibody in development and the pharmacodynamic responses of free and total IgE to this drug were similar for three different formulations - a reference formulation (A), and two alternatives (B and C). Difficulties in obtaining estimates of model parameter precision necessitated the use of resampling-based diagnostics.
Methods: Two studies employing an open-label, randomized, two-parallel-group, single subcutaneous injection design were used in the analysis, providing a total of 74 subjects with formulation A (study 1), 89 on formulation B (79 in study 1 and 10 in study 2), and 29 on formulation C (study 2). A previously-published instantaneous equilibrium drug-ligand binding and turnover population model [1] was adapted in NONMEM VI to allow estimation of the effects of formulation and study on key model parameters relative to formulation A, in a proportional manner such that an effect of zero would deliver an estimated parameter value of unity - allowing intutive estimation of the relative bioequivalence of formulations B and C for each parameter. Case-deletion diagnostics and bootstrapping were used at key decision points in model-building to detect influential outlying individuals, to provide accurate estimates of parameter confidence intervals, and to gauge model robustness.
Results: The core model parameter estimates were well-estimated and consistent with those obtained previously. The bootstrapping and case-deletion diagnostic procedures identified a significant study effect on the volumes of distribution of IgG, IgE and receptor-ligand complex, as well as absorption rate and binding constant. For formulation B, all ratio parameters were close to unity, with bootstrap-derived 90% confidence intervals within the range 0.80-1.25. With formulation C, the confidence intervals were outside the acceptance range of 0.80-1.25, such that bioequivalence with formulation A could not be shown.
Discussion: The model-based approach was effective in showing bioequivalence between the formulations A and B, but the low number of patients treated with formulation B in study 2 were not sufficient to allow successful bridging, clearly shown by the wide confidence intervals on the ratio parameters for formulation C. Case-deletion diagnostics and bootstrapping identified significant differences, previously undetected, in volume- and binding-related parameter estimates between studies, which produced a significant change in in the overall results of the modeling exercise when properly accounted for.
Conclusions: A model-based approach to showing bioavailability through parameter similarity was shown to be effective given sufficient appropriate data. Bootstrapping and case-deletion diagnostics were pivotal in highlighting previously-unidentified study differences, justifying the significant amounts of time required for their use.
40
References: [1] Hayashi N, Tsukamoto Y, Sallas WM, Lowe PJ. A mechanism-based binding model for the population pharmacokinetics and pharmacodynamics of omalizumab. Brit J Clin Pharmacol 2006;63: 548-561.
41
Poster: Applications- CNS
Aliénor Bergès Using VT (total volume of distribution from PET) in estimating the PK-Receptor Occupancy relationship in the absence of reference regions.
Alienor Berges(1), Stefano Zamuner(2), Bart Laurijssens(1), Roger Gunn(3), Vincent Cunningham(3), Chao Chen(1)
Introduction: In a PET (Positron Emission Tomography) study, receptor occupancy (RO) data can be obtained from the fractional decrease in the volume of distribution of the specifically bound radioligand (VS) [1]. This VS can be derived from VT (total volume of distribution) when VND (non-displaceable radioligand) can be measured directly from a region of reference or estimated by linear regression using volume of distribution at baseline (VT0) and after drug administration (VT) [2].
Objective: We propose to estimate the PK/RO relationship with a population approach using VT values, instead of the derived RO. In general, this approach allows estimating inter-subject variability on both VT0 and the VND and uses a more appropriate residual error model. This method was applied in a PET study and was compared to the more conventional approach of performing the modelling directly with RO estimates.
Methods: PET data was obtained from an ongoing neuroreceptor drug occupancy study. Measurements were performed at baseline, at tmax and 24h post dose. A range of doses were tested in order to characterise the exposure-occupancy relationship. The following equation based on the Emax model [2] was used to describe VT:
where i is a subject, j is a brain region, and EC50i, VT0ij, VNDi are parameters that were estimated using a population approach including all the brain regions. Receptor Occupancy was calculated as 100%*CPi/(EC50i+CPi) For comparison, an Emax model was applied to the derived RO values. In this case, different residual error models were tested (proportional, additive and a model derived from the propagation of the error applied to VT observations). Results were assessed in terms of the accuracy of the parameter estimates and using simulation-based diagnostics.
Results: The point estimates of EC50 were similar between the different methods and well estimated (SEM <40%). The inter-individual variability on the EC50 could only be estimated fitting either VT values or RO values using the error propagation model. From the VPC, the proportional and additive error models appeared to inflate the overall variability.
Conclusions: The model using VT values provided additional information on VT0 and VND, as well as robust estimates of the EC50, inter-subject and residual variability. A population modelling approach is able to successfully characterize the PK-RO relationship in PET studies where the total distribution volume is the outcome measure of interest and no reference region exists.
References: [1] Lammertsma et al. JCBFM 11:545-556, 1991. [2] Lassen et al. JCBFM 15:152-65, 1995.
42
43
Poster: Applications- CNS
Chao Chen Population modeling of the relationship between ropinirole systemic exposure and efficacy in Parkinson’s disease
Debra Tompson, Ruth Oliver-Willwong, Chao Chen GlaxoSmithKline, Harlow, UK
Objective: Ropinirole is a nonergoline dopamine D2 agonist used for the treatment of Parkinson's disease. The objective of this work was to explore the relationship between systemic exposure to ropinirole and the primary efficacy endpoints from two phase III studies.
Methods: In Study 1, efficacy of ropinirole 24 hour prolonged release (PR) was compared with immediate release (IR tid) at the same daily dose. The treatment phase was 36 weeks including a 12-week titration followed by three eight-week maintenance periods (IR-IR-PR, IR-PR-PR, PR-IR-IR, or PR-PR-IR). In Study 2, patients whose symptoms were not adequately controlled by L-DOPA were randomized to ropinirole PR or placebo for 24 weeks. Doses were individually titrated up to 24 mg/day. Sparse PK samples were collected in both studies. A one-compartment model with 1st-order absorption and 1st-order elimination was built using Phase II data. Dosing was via two depot compartments, for IR and PR respectively. The sparse data from the Phase III trials were added and parameters re-estimated. Logistic regression was conducted using NONMEM for the probability of a patient being a responder (>/= 30% reduction in UPDRS total motor score in Study 1 or >/=20% reduction in awake time spent "off" in Study 2) as a linear or hyperbolic function of AUC(0-24)ss derived from individual clearance prediction.
Results: The relationship between the probability of a patient being a UPDRS responder and AUC(0-24,ss) values was best described by a linear function. The logistic regression showed a flat probability of response (between 0.6 and 0.8) over the approximate five-fold exposure range and the relationship was comparable for both IR and PR. The relationship between the probability of a patient being an awake time "off" responder and AUC(0-24,ss) was also best described by a linear function. The probability of a response increased from 0.4 for placebo to ~0.9 at the high end of exposure range. Both the baseline and slope were reasonably well estimated (%RSE ~60% and ~25%, respectively).
Conclusions: Both analyses were limited to data at near top of response range. Although newly diagnosed patients receiving ropinirole monotherapy are unlikely to benefit further from higher doses, more advanced patients receiving the drug in combination with L-DOPA can achieve greater efficacy with higher doses.
44
Poster: Applications- CNS
Rik de Greef Modeling and Simulation to Integrate Efficacy and Safety Data Following Full Development: a Case Study in Schizophrenia and Bipolar Disorder
Rik de Greef (1), Lena E. Friberg (2), Sunny Chapel (3), Matthew M. Hutmacher (3), Marita Prohn (1), Alan Maloney (4), Thomas Kerbusch (1), Mats O. Karlsson (2), Carl C. Peck (5)
(1) Clinical Pharmacology and Kinetics, Organon, a part of Schering-Plough Corporation, Oss, The Netherlands; (2) Department of Pharmaceutical Biosciences, Uppsala University, Uppsala, Sweden; (3) Ann Arbor Pharmacometrics Group, Ann Arbor, MI, USA; (4) Exprimo, Mechelen,
Belgium; (5) NDA partners LLC, Washington, DC, USA.
Objectives: While modeling and simulation is an excellent tool to quantitatively inform decision making in early clinical development phases, there have been few reports of its use to summarize all relevant data at the end of a compound's full development. We present an example of such application following Phase 3 development of asenapine, a novel psychopharmacologic agent for the treatment of schizophrenia and bipolar disorder.
Methods: A population pharmacokinetic model was developed based on intensively sampled data from 11 clinical trials with asenapine in healthy volunteers or patients. The model was applied to obtain individual pharmacokinetic parameter estimates for use in PK-PD, based on sparse sampled PK data from the efficacy trials. Population PK-PD models were developed to characterize the time course of efficacy of asenapine on PANSS total, including drop-out, (schizophrenia indication) and Y-MRS (bipolar indication). Safety parameters included in PK-PD evaluations were QTc prolongation and extrapyramidal symptoms (EPS), as rated through the Simpson-Angus rating scale (SARS) and based on reported adverse events.
Results: The model describing the time course of PANSS total showed a significant exposure response relationship for asenapine [1]. Combined with a model for drop-out, simulations were used to demonstrate consistency between the apparently mixed clinical trial results. Despite limited data on doses below 10 mg BID, the PK-PD model for Y-MRS time course quantified an exposure response relationship, enabling prediction of relative efficacy at lower doses. The limited effect of asenapine on QTc prolongation, indicated by the PK-PD analysis of the thorough QTc trial, was confirmed by a predictive check on ECG data from Phase 3. Exploratory analyses of the time course of SARS could not identify an exposure response relationship. Also, a model describing the probability of EPS-related adverse events did not detect a clear dose response trend for asenapine; individual plasma exposure was no better predictor for EPS than dose. Simulations from the four models quantified the exposure response of asenapine and associated uncertainty on the different efficacy and safety parameters, enabling an integrated assessment of benefit-risk.
Conclusions: Modeling and simulation provided an integrated quantification of the benefit-risk for asenapine, indicating a good balance for the proposed 5 - 10 mg BID dose range.
References: [1] LE Friberg et al., Modeling and Simulation of the Asenapine Exposure-Response and Drop-Out in Acute Schizophrenia. PAGE 17 (2008) Abstr 1283 [www.page-meeting.org/?abstract=1283]
45
Poster: Applications- CNS
Geraldine Ferron PK and PK/PD modeling of CB1 blocker antagonism of THC induced CNS and Heart Rate effect
G. Ferron (a), L. Klumpers (b), Joop van Gerven(b), and C. Roy (a) (a) Sanofi-Aventis and (b) Centre for Human Drug Research
Objectives: The purpose of this study was to develop a pharmacokinetic / pharmacodynamic (PK/PD) model for the characterization of the inhibition of CNS and heart rate effects of delta9-tetrahydrocannabinol (THC) by surinabant, a selective cannabinoid receptor type 1 (CB1) blocker, in healthy male subjects.
Methods: This is a double blind, placebo-controlled, randomised, six-treatment, four-period six-sequence incomplete balanced cross-over study. Thirty healthy young male occasional cannabis users (< 1/week) were included. Single oral dose of surinabant (5, 20 or 60 mg) or placebo was administered followed 1.5 hours later by four increasing doses of THC (2, 4, 6 and 6 mg) inhaled at 1 h intervals. PD measurements were: body sway, "alertness"factor from Bond and Lader visual analogue scales (VAS), item "feeling high", and composite factors "internal perception" and "external perception" from Bowdle VAS, and heart rate. THC and surinabant PK were obtained in each period. An integrated population PK/PD model was initially built describing the effect of THC on the PD end-points and, in a second step, the antagonism of these effects by surinabant. NONMEM V (Globomax, LLC, Hanover, MD) was used for the analysis.
Results: A two-compartment model with intra-individual variability on the absorption and linear elimination adequately described THC PK. A two-compartment model with first order absorption and elimination and a lag-time was used for CB1 blocker PK. The PK/PD model describing THC effect on PD measures was comprised of an effect compartment, an Emax or linear model and intra-individual variability on baseline PD. CB1 antagonism effect was included using a competitive binding equation.
Conclusions: The PK/PD model adequately described the time-course of PK and PD effects of THC and the antagonism of these PD effects by the CB1 blocker. This model could be of value to differentiate CB1 blockers and possibly get further knowledge into CB1 receptor physiopathology .
46
Poster: Applications- CNS
Sophie Gisbert Analysing Raw Count data from an In Vitro Target Occupancy Assay to Select Doses for Human Safety/Tolerability Trial
S.Gisbert, B. Laurijssens, C. Chen GlaxoSmithKline, UK
Introduction: Compound A is being developed to treat chronic pain in conditions such as osteoarthritis. As concentration effect relationship obtained in the rat PK/PD model was not clear, it was decided to use human in vitro target occupancy as a biomarker to predict the human pharmacology of this compound.
Objective: The objective of this work was to help selecting doses for the initial human safety/tolerability trial using human in vitro target occupancy data.
Methods: - An in vitro competition radioligand binding assay was used to investigate the target occupancy of compound A on its target and repeated in 5 experiments. - The raw count data were analysed using NONMEM. A sigmoidal model was applied to link concentrations to radioactivity taking into account the non specific binding. Inter-experiment variability was associated to the non specific binding. - Subsequently simulations of the relationship between dose and target occupancy were performed in Berkeley Madonna software. - The PK parameters were provided by estimates from a human microdose study and absorption characteristics predictions using Gastroplus software.
Results: - Parameters of the relationship between concentrations and raw radioactivity, Ki and gamma, were estimated with high precision and the model fitted the data well. - IC50 was estimated from Ki using Cheng-Prusoff equation. - For the simulations an inter-subject variability in the IC50 of 30% was used to reflect potential variability in the transport of the compound to the target site. - Since compound A is an antagonist minimum effect was predicted at 0.3 mg (20% target occupancy) and the pharmacological dose was predicted to be above 50 mg ( >98% target occupancy).
Conclusion: Analysis of raw count data from a human in vitro Target Occupancy Assay allowed predicting the range of pharmacological doses for initial Human Safety/Tolerability Trials.
47
Poster: Applications- CNS
Dymphy Huntjens PK/PD modeling of apomorphine-induced behaviour in macaques
Dymphy Huntjens (1), Indra Aerts (1), Xavier Langlois (1), An Vermeulen (1) (1) Johnson & Johnson Pharmaceutical Research & Development; Beerse, Belgium
Objectives: The development of a PK/PD model for the anti-psychotic potential of a novel dopamine agonist JNJ37822681 and risperidone (RIS) in the apomorphine-treated macaque model of psychosis. Comparison between efficacy and safety measures was evaluated as risk-benefit ratio.
Methods: RIS and JNJ37822681 were investigated at four different doses including placebo in a cross-over design in 8 macaques. Motor unrest, and stereotypy and arousal were evaluated as efficacy endpoints, whereas sedation was evaluated as safety endpoint on a 7-point rating scale. PK models were developed using sparse data from the cross-over study and dense exposure profiles from a satellite group of animals. Risperidone exposure was analyzed as the sum of parent and metabolite concentration. Data analysis was performed using NONMEM.
Results & Conclusions: A two compartment model with zero followed by first order absorption best described the PK of JNJ37822681. A one compartment model with first order absorption and lagtime best described the PK of RIS. Inter-individual variability was estimated on the absorption for both compounds. No inter-occasion variability could be detected. Posthoc estimates were used as input for the PKPD model. Data were analysed on a binary scale first as high variability in response and limited subjects were available. A logistic regression model (linear logit model) was used to characterize the relationship between drug exposure and the binary effectiveness and safety outcome. Model evaluation was investigated using simulations. Model evaluation for the logistic regression analysis is ongoing and results will be presented.
48
Poster: Applications- CNS
Brigitte Lacroix Population Pharmacokinetics of Brivaracetam in Patients with Partial Epilepsy
Brigitte Lacroix(1), Philipp von Rosenstiel(2), Maria Laura Sargentini-Maier(1) (1)Pharmacometrics, Global Exploratory Development, UCB Pharma SA, Braine-l’Alleud,
Belgium; (2)UCB Inc, Smyrna, GA, USA
Objectives: To model the population pharmacokinetics of brivaracetam (BRV), a novel antiepileptic drug (AED) in development, in refractory patients with partial epilepsy, in order to identify potential demographic and drug interaction covariates.
Methods: Adult patients with refractory partial-onset seizures received adjunctive BRV BID during 7 to 10 weeks in 2 double-blind, placebo-controlled, parallel-group, dose-ranging studies. The dose levels were 5, 20, 50 mg/day and 50, 150 mg/day in 2 intakes. 2 plasma samples per visit were obtained on 2 to 4 occasions between weeks 3 and 10. BRV concentration-time data were modeled using nonlinear mixed-effect modeling (NONMEM). Bodyweight was included in the base model as an allometric factor of clearance (CL/F) and distribution volume (V/F). Age, gender, race, concomitant AEDs and creatinine clearance (CLcr) were examined as possible covariates to explain inter-individual variability in pharmacokinetic parameters of BRV.
Results: 1150 concentration-time records were available in 254 patients (50% male; 60% caucasian) receiving 1 or 2 concomitant AEDs (39 neutral, 98 inducer, 77 inhibitor, and 40 mixed inhibitor/inducer). The mean (range) for weight, age and CLcr was 70 (24-129) kg, 34 (16-65) years and 122 (39-253) mL/min. BRV plasma concentrations were adequately described by a one-compartment model, with low residual variability (20.0% CV). Age, gender, race and CLcr did not influence the pharmacokinetic parameters of BRV. The population mean for V/F was 0.51 L/kg. Concomitant intake of inducer AEDs was a significant covariate for CL/F, resulting in a reduction of inter-individual variability (IIV) from 31% to 24%. The population mean of CL/F was estimated to be 3.63 L/h in absence and 5.15 L/h in presence of inducer AEDs. This effect was predicted to decrease the steady-state AUC of BRV by ~30%. This moderate exposure reduction is likely to be of little clinical relevance, because a dose-response analysis of phase II trial data showed that concomitant inducer AEDs did not influence BRV's efficacy.
Conclusions: Most of the inter-individual variability in BRV pharmacokinetics, in an ethnically diverse population of patients, was accounted for by differences in bodyweight and concomitant use of inducer AEDs. Since the identified covariates had a modest influence on pharmacokinetic parameters, BRV is deemed to have a highly predictable exposure in individual subjects. Results suggest that no dose adjustment is required.
49
Poster: Applications- CNS
Bart Laurijssens Model-Based Analysis of a Longitudinal Binary Response as the Primary Analysis for a Phase II Study in Migraine Prophylaxis.
Objectives: The objective was to design and evaluate a phase II proof of concept/dose-response study in Migraine Prophylaxis, exploiting the characteristics of the primary endpoint optimally and taking into account cost, time efficiency, as well as limiting unnecessary patient exposure to the drug.
Methods: The primary endpoint, Migraine Headache Day (MHD), was longitudinal in nature: 1 month of run-in to establish a baseline was followed by 3 months of treatment, and binary: For each patient, every day was either an event or a non-event day. A model describing the placebo time course and drug effect was constructed using literature and in-house historical data. The model had 3 components: 1) a constant and common baseline (base) for the probability of an event at a given day prior to treatment, 2) a fractional change in the probability of an event at a given day, expressed as 1-exp(-k*time), which described the expected probability of an event over the 12-week treatment period, and 3) 2 parameters which described the modification of the change in probability over time due to placebo treatment effect (plac) or active treatment effect (plac+drug).
Model : R = base + (1 - exp(-k*time)) *(plac + drug) and P(event) = InvLogit (R)
The study was set up in two parts. Part 1 investigated two active doses and placebo. Following an interim analysis the trial could be stopped for futility or continue in Part 2 a) to study the full dose response or b) to investigate one or two doses further (extending the samples size) in case initial assumptions had been violated. The model was used in clinical trial simulations to explore the behaviour of the proposed two-stage design, addressing both type I and II error rates. The Part 1 doses were selected based on human pharmacology, safety and tolerability. The null hypothesis assumed no treatment difference between either active treatment and placebo. A sequence of log-likelihood ratio tests was applied to assess the probability for the alternative hypotheses of a relevant treatment effect.
Results: The model-based analysis allowed for a reduction of the sample size for each treatment arm by almost 50 percent, compared to a more conventional end-of-treatment pairwise comparison. The trial design, given the assumptions, was robust: The power to detect the desired effect was 95% and the risk of not stopping trial if the true drug effect was zero was 1.3%. No statistically significant drug effect was observed for either dose in Part 1 of the study. Although the variance on treatment and the size of the placebo response were larger than assumed, the power was still sufficient to exclude the effect size of interest as a likely outcome. Further exploratory analysis suggested a potential drug effect in a subgroup of patients, and therefore in Part 2 one active dose and placebo were studied in this subgroup. Part 2 was powered for a smaller effect size using adjusted assumptions. No statistically significant drug effect was observed in Part 2 of the study. The model could adequately describe the data in both Parts. No Part 1 data was used in the analysis of Part 2.
50
Conclusions: The model-based analysis allowed for a much smaller sample size, and an intuitive outcome: the probability of a MHD. The two-stage design allowed for a proof of concept before committing to a full dose-response within one study, and the possibility to re-adjust our assumptions after Part 1 if necessary. With hindsight, this trial could have been stopped for futility after Part 1 if the historical data was investigated more extensively and if Part 1 was powered for the ultimate (smaller) effect size of interest.
51
Poster: Applications- CNS
Otilia Lillin-de Vries A population analysis on the effects of the CYP2D6 deficiency on pharmacokinetics and exposure of esmirtazapine in healthy volunteers.
O. Lillin-de Vries, T. Kerbusch, P-J. de Kam, N. Ivgy-May, R. Bursi Organon, a part of Schering – Plough Corporation
Objectives: Esmirtazepine is a novel agent under development for insomnia. This is a pooled population analysis of the PK of esmirtazapine using data from three HV studies. The effect of CYP2D6 polymorphism was evaluated [1].
Methods: A 2-compartments 1st-order absorption model (NONMEM VI) was fitted to PK data of 17 postmenopausal women receiving SD and MD of esmirtazapine 1.5 mg, 7.5 mg and 18 mg (4-period cross-over), 78 adult HV (45 - 65 years) receiving 18 mg SD and 18 mg titrated up to 54 mg MD (parallel groups) and 20 adult HV receiving 4.5 mg SD esmirtazapine with or without paroxetine for inhibition of CYP2D6 (coded as genedose).
Results: 104 HV contributed to 2910 esmirtazapine samples. The dataset contained 24 poor metabolizers (PM, both alleles deficient by either genotype (4 subjects) or phenotype (20 subjects)), 34 intermediate metabolizers (IM, one allele deficient), 64 extensive metabolizers (EM, two working alleles) and 2 ultra-rapid metabolizers (UM, three working alleles). The data for all 4 genotypes were combined in a linear relationship. Oral clearance for male EM was 94.2 L/h, Vc was 60.4 L, Q was 71.9 L/h, Vp was 1120 L, Ka was 0.33 h-1 and lag time was 0.5 h. Of the covariates evaluated (CYP2D6, sex, body weight and study), CYP2D6 and sex had a statistically significant influence on esmirtazapine PK. Oral CL increased with 13.1 L/h per functional CYP2D6 allele, regardless of gender. Oral CL in women was 77.8 L/h. The rel. bioF for PM and IM was estimated 25% higher than for EM and UM (fixed to 1). No significant difference could be detected between EM and UM, nor between IM and PM. The rel. bioF was characterized by modest IIV (Rel Std. Err. 24.1%). Model performance was adequate with a residual variability of 11.8 % and robust as indicated by bootstrapping.
Conclusions: A pooled population PK model successfully described the data of 3 phase 1 trials. CYP2D6 polymorphism (PM exposure 2-fold higher than EM) and sex (CL 17% lower in women) were identified as relevant covariates. This model provides a sound basis to explore the exposure-response relationship with efficacy data obtained in phase 3.
References: [1] J. Brockmöller et al, Clin. Pharm. And Therapeutics 81: 699-707 (2007)
52
Poster: Applications- CNS
IGOR LOCATELLI Population Pharmacokinetics of Risperidone in Patients with Acute Schizophrenia
I. Locatelli(1), M. Kastelic(2), J. Koprivsek(3), B. Kores-Plesnicar(3), A. Mrhar(1), V. Dolzan(2), I. Grabnar(1)
(1)Chair of Biopharmaceutics and Pharmacokinetics, Faculty of Pharmacy, University of Ljubljana, Slovenia; (2)Institute of Biochemistry, Faculty of Medicine, University of Ljubljana, Slovenia; (3)Department of Psychiatry, University Clinical Centre Maribor, Maribor, Slovenia
Objectives: Atypical antipsychotic risperidone (RISP) undergoes extensive CYP2D6 and CYP3A4 catalyzed hydroxylation to active 9-hydroxyrisperidone enantiomers (9OH-RISP) [1]. Large interindividual variability in formation rate of 9OH-RISP was observed [2], however, stereoselectivity of this metabolic reaction has not been investigated in vivo. In this study population pharmacokinetic model of RISP metabolism to 9OH-RISP enantiomers was developed to evaluate the influence of CYP2D6 genetic polymorphism on RISP first-pass metabolism (Fp) and formation clearances of the 9OH-RISP enantiomers.
Methods: Hospitalized patients in acute phase of schizophrenia treatment with risperidone tablets were included in the study. Two blood samples approximating trough and peak RISP concentrations were drawn on day 8 of the treatment. Plasma concentrations of RISP and 9OH-RISP enantiomers were determined using validated HPLC method with electrochemical detection. The patients were CYP2D6 genotyped. NONMEM was used for the pharmacokinetic analysis. The model consisted of three compartments, one for each of the investigated compounds. Additionally, depot compartment, Fp metabolism to 9OH-RISP, and interconversion of 9OH-RISP enantiomers were included. The model was expressed in terms of appropriate differential equations using ADVAN6. FOCEI was used for parameter estimation.
Results: 50 patients contributed to 296 concentration data. Inclusion of 9OH-RISP interconversion clearance (Qm = 25 L/h) in the model resulted in significant decrease of objective function value (p<0.001). Formation of (-)-9OH-RISP from RISP was found negligible, while formation clearance of (+)-9OH-RISP (CLf+) was estimated at 17 L/h. Interindividual variability of this parameter was large (CV = 90%) and was reduced to 55%, when CYP2D6 genotype was included as covariate. The patients with two non-functional CYP2D6 alleles have 11.8 fold lower CLf+ compared to the patients with wild type CYP2D6 alleles. Volume of distribution was set equal for all three compounds and was estimated at 1.7 L/kg. Plasma clearance of 9OH-RISP was set equal for both enantiomers and was 7.4 L/h.
Conclusions: This model demonstrates that in vivo formation of 9OH-RISP from RISP is stereoselective. The main metabolite of RISP is (+) 9OH-RISP. This formation is largely dependent on CYP2D6 activity. (-)-9OH-RISP is mainly formed from the (+) enantiomer.
References: [1] Yasui-Furukori N, Hidestrand M, Spina E, et al. Different enantioselective 9-hydroxylation of risperidone by the two human CYP2D6 and CYP3A4 enzymes. Drug Metab Dispos, 2001; 29: 1263-8. [2] Vermeulen A, Piotrovsky V, and Ludwig EA. Population pharmacokinetics of risperidone and
53
9-hydroxyrisperidone in patients with acute episodes associated with bipolar I disorder. J Pharmacokinet Pharmacodyn, 2007; 34: 183-206.
54
Poster: Applications- CNS
Guangli Ma Pool Model versus Agonist-Antagonist Interaction Model for the Remoxipride Effect on Prolactin
Guangli Ma, Lena E. Friberg, Mats O. Karlsson Division of Pharmacokinetics and Drug Therapy, Department of Pharmaceutical Biosciences,
Uppsala University, Uppsala, Sweden
Objectives: The pool model [1] has previously been shown to be inferior to an agonist-antagonist interaction (AAI) model [2, 3] to describe prolactin response following administration of two antipsychotic drugs [3]. This study aimed to compare the pool model and the agonist-antagonist interaction (AAI) model to describe prolactin concentrations after administration of the antipsychotic drug remoxipride, i.e. the data the pool model was originally developed from.
Methods: The remoxipride and prolactin concentration data were from 8 healthy male volunteers [1]. There were 5 study occasions and on each occasion two 0.5 h infusions of remoxipride were administered. The intervals between the first dose and the second dose on the 5 occasions were 2, 8, 12, 24 and 48 hours. Five models were compared in NONMEM and by visual predictive checks; (1) the original pool model [1], (2) a pool model with enforced mass balance, (3) a pool model with enforced mass balance and a circadian rhythm function for prolactin release, (4) the AAI model [2], and (5) the AAI model with circadian rhythm [3].
Results: The AAI model had 85 units lower OFV than the pool model with mass balance, while the pool model had 1 less THETA and 1 less ETA than the AAI model. Addition of a circadian sub-model improved both the pool model and the AAI model. A VPC revealed that the circadian pool model failed to adequately predict the prolactin profile after remoxipride administration. The pharmacodynamic parameters estimated by the circadian AAI model were in line with previous studies and current understanding about prolactin. The prolactin rhythm predicted by the circadian AAI model was close to reports in the literature.
Conclusions: As previously observed for other antipsychotic drugs [3], the circadian AAI model was superior to the other investigated models in describing the prolactin response after remoxipride administration. The AAI model appears to work well across drugs and for a range of different types of administration schedules.
References: [1] Movin Osswald, G. and M. Hammarlund Udenaes. J Pharmacol Exp Ther; 1995; 274: 921-7. [2] Bagli, M., et al. J Pharmacol Exp Ther; 1999; 291: 547-54. [3] Friberg, L.E., et al. PAGE 15 (2006) Abstr 940 [www.page-meeting.org/?abstract=940].
55
Poster: Applications- CNS
Sarah McLeay Scaling propofol doses for the obese: is lean body weight the answer?
Sarah McLeay, Glynn Morrish, Carl Kirkpatrick & Bruce Green University of Queensland, Australia
Objectives: Longer awakening times have been observed in obese compared to normal-weight patients when propofol is dosed on total body weight (TBW), as per label recommendations. This could be explained by a non-linear relationship between TBW and clearance (CL) as previously demonstrated [1]. Lean body weight (LBW) has been shown to increase non-linearly with TBW and linearly with drug clearance [2]. This body size metric may therefore be more appropriate than TBW for propofol dose selection. The objectives of this study were to evaluate the substitution of a non-linear covariate model for propofol clearance [1] with a linear LBW covariate model and examine the effects of different propofol dosing regimens on awakening times of obese patients.
Methods: One-hundred “true” datasets with 198 subjects each, 7 optimal time-points per subject and weight stratified into 3 groups of 40-60kg, 60-80kg, and 80-100kg, were simulated from a prior population PK model [1], in which clearance was defined as CL=86.4L.h-1*((TBW/70)0.75) – 2.7*(age-60). Age, weight, and height for each subject were simulated from a covariate distribution model constructed from a medical patient dataset (n = 999). PK parameters were re-estimated with both the original model and a reduced LBW model in which LBW replaced covariates on clearance as the single covariate on CL: CL=θ*(LBW/55). The predictive performance of the LBW model was evaluated by calculating the mean error (ME) and root mean square error (RMSE) of individual PK estimates from the “true” simulated values. These values were compared to the ME and RMSE of the original model. A visual predictive check (VPC) of the LBW model was also performed in which concentration-time data from a “true” simulated dataset was overlaid with the 10th, 50th and 90th percentiles of 1000 simulated datasets from the LBW model. The LBW model was used to simulate PK profiles for 4000 male subjects (180cm, 30yrs) in 4 weight categories: 70, 100, 130, and 160kg, with a dosing regimen of (a) a 2mg/kg bolus dose followed by a 1h, 6mg/kg/h infusion based on TBW, and (b) a 2.5mg/kg bolus and 1h, 7.6mg/kg/h infusion based on LBW (equivalent to recommended dose per kg TBW for a 70kg subject). A prior PD model for probability of awakening [3] with an EC50 = 1.07ug/ml was used to determine the post-infusion median probability of awakening over time for each weight group.
Results: Re-estimation of individual CL values using the full multivariate and LBW model yielded a ME of -3.94L/h vs -5.03L/h, and RMSE of 8.25L/h vs 8.99L/h, respectively. ME and RMSE of the other PK parameter estimates were also comparable. Between subject variability (as %CV) for each of the parameters was within 10% of the simulation values for both models, with random unexplained variability within 2%. The VPC confirmed that the LBW model was able to describe the “true” data, with ~80% of the “true” data falling within the 10th and 90th prediction intervals at each time point. Dosing on TBW resulted in an increased probability of longer time to awakening in the larger weight groups, with the median probability of a subject still being asleep at 30min post-infusion being 68% for 160kg vs. 28% for 70kg. When dosed on LBW, there was no difference between groups (Pasleep(30min) = 30% for all groups).
Conclusions: The LBW covariate model has similar predictive properties to a multivariate covariate model that describes a non-linear increase in CL with TBW. This LBW model may
56
explain the observed differences in patient times to awakening when dosing is based on TBW. As such, we propose that LBW rather than TBW is the most appropriate body size descriptor to dose propofol in the obese population. Observational data from both normal-weight and obese subjects will be collected to support these findings and a prospective clinical trial completed in order to develop a safer dosing regimen for obese patients.
References: [1] Schuttler, J. & Ihmsen, H. (2000). Population pharmacokinetics of propofol: a multicenter study. Anesthesiology 92(3): 727-38 [2] Han, P.Y, Duffull, S.B., Kirkpatrick C.M. & Green B. (2007). Dosing in obesity: a simple solution to a big problem. Clin Pharmacol Ther 82(5):505-8 [3] Shafer, A., Doze, V.A., Shafer, S.L. & White, P.F. (1988). Pharmacokinetics and pharmacodynamics of propofol infusions during general anesthesia. Anesthesiology 69(3): 348-56
57
Poster: Applications- CNS
Raymond Miller Exposure-Response Analysis of Longitudinal Adverse Event Data.
Kaori Ito*, Matt Hutmacher#, Jing Liu, Ruolun Qiu, Bill Frame, Raymond Miller Pfizer Global Research and Development (Groton, CT, USA) and A2PG (Ann Arbor, MI, USA)
Objectives: To describe the pregabalin-exposure and dizziness (adverse event) relationship in patients treated for Generalized Anxiety Disorder (GAD).
Methods: A model was developed for the incidence of dizziness (adverse event) and for the conditional severity of dizziness in patients that have at least one incidence over the duration of the study. Dizziness was recorded on a four point categorical scale (0=none, 1=mild, 2=moderate, 3=severe) for 6 clinical studies in patients with GAD. The unconditional dizziness severity was obtained by calculating the joint probability of the incidence and severity of dizziness. The incidence component was modeled using a nonlinear logistic regression model. The conditional severity component was modeled as an ordered categorical variable with proportional odds. The exposure response relationship was evaluated as a linear or Emax relationship. To describe the time-course of severity, time-dependent effects (placebo and tolerance) were also included. A Markov element was introduced to account for the correlation between adjacent observations. To evaluate the predictive properties of the model, a posterior predictive check was performed. One hundred data sets were simulated from the final conditional severity model with and without the Markov element and the number of transitions between each possible transition were calculated.
Results: The dataset prepared for the 6 studies consisted of 47218 observations collected in 1630 patients. For the incidence model, a sigmoid Emax model best describes the dose-dizziness response relationship. For conditional severity, the model that best described the data was an Emax model with a placebo time-course response and a component that allows for an exponential attenuation of the dizziness severity. The numbers of observed transitions for all combinations of dizziness severity were contained within the predictive check distributions from the Markov model, while the number of transitions were markedly overestimated or underestimated without the Markov element.
Conclusions: The probability of experiencing dizziness during any day increases with pregabalin daily dose. The predicted mean incidence of dizziness was around 35 % at a daily dose of 200 mg/day or greater, which was at least 2 fold higher compared to those at daily doses <150 mg/day. The most frequently reported severity was mild to moderate. The risk of mild or moderate dizziness increases up to 25 % within 1 week, but declines to around 7 % over 3 to 4 weeks. The proportional odds model including a time course of appearance and disappearance of adverse event could adequately describe the time-course of probability of dizziness. Incorporating a transition model including Markov elements improved the model fit and greatly improved the predictability of the time-course of probability of dizziness.
58
Poster: Applications- CNS
Gianluca Nucci A sparse sample PK & PKPD approach to estimate the time course of antipsychotic-induced D2 occupancy
Gianluca Nucci (1), Ana M. Catafau (2), María M. Penengo (3), Santiago Bullich (3), Emilio Merlo-Pich (2) and Roberto Gomeni (1)
Background: Blockade of dopamine D2 receptors (D2RO) is a common feature of all antipsychotics (AP) and is a predictor of clinical response and of side effects of AP [1-3]. However, the degree of D2RO associated with efficacy, the relationships with AP plasma concentration (CP), the influence of the scanning time and the D2RO profile over time required for symptom control are still poorly understood.
Objectives: A sparse-sample design and Pop PK and PKPD modelling approach were used: (a) to define the relationship between CP and striatal D2RO measured by SPECT in stabilized schizophrenic patients on risperidone (r), olanzapine (o), clozapine (c) and quetiapine (q) (PK-D2RO relationship), (b) to evaluate the time-course of the D2RO profile, and (c) to compare the profiles of D2RO and CP over time for these four AP.
Methods: A total of 46 patients with diagnosis of schizophrenia and responding to monotherapy with the four AP were included. Each treatment group was subdivided in four subgroups of n = 2-3 and allocated to undergo the SPECT scan at one time point during the interdose interval, defined based on the known PK for each AP. Blood samples were drawn during SPECT scanning for AP PK measurement. Each patient received only one tracer injection and was scanned once due to dosimetry limitations. A non-linear mixed effects modelling was applied to the population data to estimate the average time-course. Then an empirical Bayesian approach was used to estimate the individual PK, and the individual D2RO time course.
Results: Pop-PK modelling was undertaken using non-linear mixed-effect modelling as implemented in NONMEM VI to assess population PK of the four AP tested. Empirical Bayesian methods were used to estimate individual PK parameters using as a prior the information reported in the literature on each AP [4-7]. PK/D2RO modelling was best described by a direct link model between CP and D2RO (Emax model). PK and D2RO profiles over time were compared. Using the PK-PD model parameters, simulated D2RO curves were generated for representative doses of each AP.
Conclusions: A wide range of both observed CP and D2RO were obtained at therapeutic doses of r, o, c and q in stabilized patients. Our results suggest that clinical response to APs may be maintained with D2RO values below 65% SPECT. The relationship between PK and striatal D2RO was adequately described by a PK-D2RO Emax model. D2RO patterns over time differ between AP, being stabilized and dissociated from PK for r and o, variable and PK-associated for q and somewhat intermediate for c. These results were considered for the interpretation of D2RO measurements and design / optimization of new AP trials.
References: [1] Nordstrom et al., Central D2-Dopamine Receptor Occupancy in Relation to Antipsychotic Drug
59
Effects: A Double-Blind PET Study of Schizophrenic Patients. Biol. Psychiatry; 33:227-235, 1993 [2] Kapur et al. Relationship between dopamine D(2) occupancy, clinical response, and side effects: a double-blind PET study of first-episode schizophrenia. Am J Psychiatry 157: 514-520, 2000 [3] Agid et al., Striatal Vs Extrastriatal Dopamine D2 Receptors in Antipsychotic Response: A Double-Blind PET Study in Schizophrenia. Neuropsychopharmacology. 32, 1209-1215, 2007 [4] Kimko et al. Prediction of the outcome of a phase 3 clinical trial of an antischizophrenic agent (quetiapine fumarate) by simulation with a population pharmacokinetic and pharmacodynamic model. Clin Pharmacol Ther 68: 568-577, 2000. [5] Callaghan J T, et al. Olanzapine Pharmacokinetic and pharmacodynamic profile. Clin Pharmacokinet 37: 177-193, 1999 [6] Huang M L, et al. Pharmacokinetics of the novel antipsychotic agent risperidone and the prolactin response in healthy subjects. Clin Pharmacol Ther 54: 257-268, 1993 [7] Jerling M, et al. Population pharmacokinetics of clozapine evaluated with the nonparametric maximum likelihood method. Br J Clin Pharmacol 44: 447-453, 1997
60
Poster: Applications- CNS
Elba Romero Extended Link Model to Describe the Impact of Chronic Antiepileptic Therapy on the Effects of Neuromuscular Blocking Agents.
Elba Romero E1, Juan Fernández-Candil2, Pedro L. Gambús2, Ricardo Valero2, Enrique Carrero2, Lorea Bueno1, Neus Fábregas2, Iñaki F. Trocóniz1
1Department of Pharmacy and Pharmaceutical Technology, University of Navarra, Spain; 2,Department of Anesthesiology, Hospital Clinic, Barcelona, Spain.
Objectives: Antiepileptic drugs decrease the intensity of the effect of most neuromuscular blocking agents (NMBA). Wright et al., 2004,[1] found that CL and C50 of vecuronium were increased in those patients receiving chronic phenytoin therapy (CPT). Fernández-Candil et al., 2008,[2] found, for the less potent drug rocuronium, a similar increase in CL in patients under CPT, however the estimate of C50 remained unchanged with respect to the group of subjects in absence of CPT. The aim of this work was to propose a mechanism-based model to conciliate the discrepancies found in C50 between vecuronium and rocuronium in patients under CPT. The estimates of C50 for vecuronium[1], and rocuronium[2] show that vecuronium is a much more potent drug (95 vs 836 ng·mL-1). It might be possible that the effect of more potent drugs are more sensitive to changes in the total concentration of receptors in the biophase (Rtot).
Methods: The twitch height response vs time profiles were simulated for vecuronium and rocuronium using the published population PK parameters corresponding to CPT patients and the PD parameters of the non CPT patients,[1,2] for five different Rtot values: 0.28 (control)[3] 0.42, 0.56, 0.7, and 0.84 mM. The Pharmacodynamic (PD) model used through simulations was an extension of the Link model,[4] in which it is not assumed that the concentration of drug bound to the receptors is negligible.[3]
Results: The effect vs time curves in the case of vecuronium are displaced to the right as in the case of an increase in C50, however for the case of rocuronium the profiles are independent of Rtot in the range studied.
Conclusions: The results suggest that CPT has an effect at the PD level, which will be reflected as increase in the empirical PD parameter C50 mainly in the case of highly potent NMBA drugs.
References: [1] Wright et al. Anesthesiol 2004; 100: 626-33 [2] Fernández-Candil et al. Eur J Clin Pharmacol (in press) [3] De Haes et al. Anesth Analg. 2002; 95: 588-96 [4] Sheiner et al. Clin Pharmacol Ther 1979; 25: 358-71
61
Poster: Applications- CNS
Monica Simeoni Modelling beta amyloid system: sensitivity analysis at steady state and in dynamic conditions.
M. Simeoni(1), C. Chen(1), P. Dua(2), R.E. Oliver-Willwong (1), D. J. Austin(1) (1)Clinical Pharmacology Modelling and Simulation, GSK, Greenford/Harlow, UK, (2)
Neurosciences CEDD, GSK, Harlow, UK
Objectives: Alzheimer disease (AD) is the most common form of senile dementia. Amyloid beta peptide in the brain is a hallmark of this pathology and is related with cognitive decline, neurotoxicity and the formation of neurofibrillary tangles. A growing number of drugs are being tested in order to reduce the amyloid burden via different mechanisms and/or sites of action. The inaccessibility of direct measurement in the brain constitutes a limitation for the optimal design of the clinical studies. We propose a compartmental model that can be used to anticipate the profile of the peptide in the different sites (periphery and central nervous system). We then consider the effects of different mechanisms of action on the various peptide exchange rates via simulation analysis for novel drugs of interest.
Methods and Results: This is a methodology work. A compartmental model was used to represent the brain, plasma and CSF amyloid pools. Given the absence of a precise knowledge of all the rates of exchange in any one animal species, we studied the impact of the unknown rates on the system at steady-state. We then applied the various novel drug mechanisms in the model to look at the predicted steady-state efficacy.
Conclusions: Assuming that amyloid beta fluxes are linear, we predict a number of preferential pathways for reduction of the amyloid beta in the brain. Moreover, some exchange rates in the system can have a significant impact on the efficacy of the drug action. The true biological system may present additional nonlinearities that need further investigation and will be included in the mathematical model.
62
Poster: Applications- CNS
Armel Stockis Levetiracetam exposure-response analysis in children with partial onset seizures
E. Snoeck (1), R. Schoemaker (1), A. Stockis (2), C. Otoul (2), M.L. Sargentini-Maier (2) (1) Exprimo NV, Mechelen, Belgium; (2) Pharmacometrics Department, UCB Pharma SA, Braine-
l’Alleud, Belgium
Objectives : To compare the performance of several seizure count-based exposure-response models for levetiracetam in children with epilepsy and to undertake simulations to provide a rationale for an optimal dosing scheme.
Methods : Exposure-response analysis was carried out using data from a randomized, double-blind placebo controlled, add-on efficacy trial of levetiracetam in children (4-16 years) with partial onset seizures. The trial consisted of an 8-week prospective baseline followed by two 2-week fixed dose up-titration periods, an evaluation period of 10 weeks at 60 mg/kg/day or at the maximum tolerated dose, and a 6-week withdrawal period. Modeling of daily seizures was performed by nonlinear mixed effects modeling in NONMEM VI with the Laplace estimation method. Several statistical models were compared: Poisson, negative binomial, with or without zero-inflation, and with or without Markov elements. A Mixture procedure was used to separate subjects exhibiting reduced or increased seizure frequency from baseline. The drug effect was modeled in improving subjects as an Emax function of dose or AUCs (individual posterior estimates derived from a population pharmacokinetics model).
Results : The zero-inflated negative binomial model including Markov elements was found superior to all other models. In particular, the OFV dropped by >17000 units compared to the base Poisson model. Using individual AUCs instead of doses did not yield any significant improvement. The baseline seizure frequency was 0.64/day when the previous day was seizure-free and 1.06/day when one or more seizures occurred on the previous day. The improving sub-populations amounted to 78% and 52% of the levetiracetam and placebo groups, respectively. The population ED50 was 287 mg/day. Simulations by bootstrapping (using the observed body weights) showed that most of the drug effect was reached at 20 mg/kg/day and that the clinical response in the range of 20-60 mg/kg/day in children was fairly similar to that of 1000-3000 mg/day in adults. Simulations predicted that levetiracetam 60 mg/kg/day is likely to result in a reduction in seizure frequency of at least 55% in half of the improving subjects.
Conclusions: The zero-inflated negative binomial model with Markov elements has superior features for describing daily seizure count data. The daily levetiracetam dose of 20-60 mg/kg is suggested to be optimal in adjunctive therapy of children with refractory partial onset seizures.
63
Poster: Applications- CNS
Katarina Vucicevic Estimation of Relative Bioavailability of Controlled-Release Carbamazepine Tablets Based on Routine TDM Data
K. Vucicevic(1), B. Miljkovic(1), M. Pokrajac (1), I. Grabnar(2) (1) Department of Pharmacokinetics, Faculty of Pharmacy, University of Belgrade, Serbia; (2)
Faculty of Pharmacy, University of Ljubljana, Slovenia
Objectives: Controlled-release (CR) formulation of carbamazepine (CBZ) tablets, in contrast to immediate-release (IR) form, show lower peak-trough fluctuation of CBZ concentration which leads to less adverse effects, and allow more convenient twice-daily dosing regimen. The aim of the study was to investigate relative bioavailability (FR) of CR relative to IR CBZ tablets.
Methods: In total 379 epileptic outpatients' data were retrospectively collected from routine therapeutic drug monitoring. CBZ was administered 2-4 times per day in the form of 200 mg IR (Karbamazepin; Galenika, Serbia, or Karbapin; Hemofarm, Serbia) or 400 mg CR tablets (Tegretol CR400; Novartis Pharma, Switzerland). Patients were on stable dosage regimen for at least 14 days, either on mono or polytherapy, and 1-2 concentrations per patient were available [1]. PK analysis was performed by a population modeling approach using NONMEM (Version V, level 1.1, GloboMax LLC, USA) and Visual-NM (Version V, R.D.P.P., France) assuming one-compartmental model with first-order absorption and elimination. The FOCE method was used. Based on literature data absorption rate constants were fixed at 0.224 h-1 and 0.077 h-1 for IR and CR formulations, respectively [2]. Validation of the final model was performed.
Results: Model building set included 124 (47 %), while model validation set included 25 (54 %) of patients taking CR CBZ tablets. Interindividual variability of CBZ apparent clearance (CL/F) was best described by exponential error model, while additive error model most adequately characterized residual variability in CBZ concentrations. Inclusion of CBZ formulation significantly improved model (ΔOBJ was decreased by 25.029 compared to base model), and reduced unexplained interindividual variability. In the backward elimination step the influence CBZ formulation on FR was removed (ΔOBJ was 2.171 compared to full model). The interindividual coefficient of variability for CBZ CL/F was 36.5 (31.6-40.7) %, whereas the residual variability was 1.18 (0.98-1.36) mg/mL in the final model. Model validation indicated little bias, good precision and acceptable predictive performance.
Conclusions: In the present study, no difference in bioavailable fraction between CR and IR formulations was observed (FR = 1). The results from the study with sparse data are in compliance with the results in a previously reported data-rich study with well-timed blood samples during the absorption phase.
References: [1] Carlsson KC, Hoem NO, Glauser T, et al. Development of a population pharmacokinetic model for carbamazepine based on sparse therapeutic monitoring data from pediatric patients with epilepsy. Clin Ther. 2005;27:618-626. [2] USP DI Volume I: Drug Information for the Health Care Professional, 24th ed. Greenwood Village, Co: Thomson Micromedex; 2004:709-716.
64
Poster: Applications- CNS
Stefano Zamuner Mixed Effects Markov Models for Modelling Sleep in Insomniac Patients Treated with Placebo in a 28 Days Trial: Emphasis on the Break Points
Selection
Bizzotto R (1), Zamuner S (2), Nucci G (2), Cobelli C (1), Gomeni R (2) (1) Department of Information Engineering, University of Padova, Padova, Italy; (2) Clinical
Objectives: A Mixed Effect Markov Model has been proposed in order to characterize the time course of sleep stage transitions in patients with insomnia over a 2 days treatment [1]. The aim of this work was 1) to characterize the time course of the sleep stages transitions in insomniac patients randomized to placebo in a 28 days trial and 2) to evaluate the impact, and hence optimize the selection, of the time intervals in which the night is divided to allow the transition probabilities identification.
Methods: Data were obtained from a placebo-controlled, parallel study with 116 patients affected by primary insomnia. PSG recordings were available at screening and for 3 sessions of two consecutive nights during the trial. The probability of transitioning from a sleep stage to another was modelled in each session for the placebo group. Transition probabilities between sleep stages were modelled as Markov processes using a population approach implemented with NONMEM VI. To identify the Markov models the night-time needs to be divided into different intervals selecting few break points for which population values and inter-individual variability can be estimated. Transition probabilities between break points were derived applying linear interpolation. In [1], Karlsson et al. proposed to fix the break points so that: (1) they are almost equidistant in time and (2) intervals between break points contain an approximately equal amount of data. With our dataset these criteria were not simultaneously met; therefore we analyzed how the number and placement of break points selection impacts the estimation of transition probabilities during the night. Performance was evaluated through visual inspection of model fitting, Akaike information criterion and accuracy estimation (RMSE).
Results: Break points selection with equally spaced intervals in the night period provided convergence of the estimation only when very few intervals were considered (3 to 4). When allowing intervals to contain the same amount of data (i.e. to be equi-informative), the number of break points could be markedly increased (up to 10). Such modification of the model resulted in a better fit, as proved by the Akaike information criterion and the RMSE results; in addition, a more granular description of the time course of transition probabilities was obtained. The optimized model was applied to assess the time course of transition probabilities under placebo treatment for chronic dosing.
Conclusions: The distribution of breakpoints influences the results of the Mixed Effect Markov modelling of the sleep stage transitions time course. The choice of break points according to an even distribution of available information results in accurate and more dynamic descriptions of transition probabilities between sleep stages. The definition of a criterion to choose the optimal number of break points is in progress.
65
References: [1] Karlsson M O et al. A pharmacodynamic Markov mixed-effect model for the effect of temazepam on sleep. Clin Pharmacol Ther 2000; 68(2):175-88
66
Poster: Applications- Coagulation
Xavier Delavenne Assessment of pharmacokinetic variability of fondaparinux in 809 patients treated after major orthopedic surgery: the POP-A-RIX study
Delavenne X (1), Laporte S (1,2), Deygas B (1,2), Baylot D (3), Zufferey P (4), Barré J (5), Nguyen P (6), Borg JY (7), Charret F (8) and Mismetti P (1), for the GETHCAM investigators
(1) Dept. of Clinical Pharmacology ; EA 3065 ; University Hospital . (2) Inserm, CIE3, University Hospital of Saint-Etienne, France.(3) Clinique Mutualiste de Saint-Etienne, France.(4) Dept. of Anesthesiology and Intensive Care ; EA3065 ; University Hospital of Saint-Etienne, France.(5) Dept. of Anesthesiology, Robert Debré hospital, Reims, France.(6) Central Lab. of Hematology,
Robert Debré hospital, Reims, France.(7) Hemostasis Unit, University Hospital of Rouen, France.(8) Clinique des Cévennes, Annonay, Franceof Saint-Etienne, France.
Objectives: Fondaparinux is a synthetic antithrombotic agent with specific anti–factor Xa activity. Despite a favorable benefit risk ratio in average, fondaparinux as other antithrombotics increase the risk of hemorrhage. One of the objectives of this study is to characterize pharmacokinetic of this drug according to patient characteristics using a population model, which may help to predict the risk of hemorrhage in specific populations.
Methods: Prophylactic dosage (2.5 mg once a day) of fondaparinux was administrated during at least 5 days. One to four samples were collected throughout the duration treatment. Plasma concentrations were assayed by enzymatic anti-Xa activity method. Population pharmacokinetic parameters and inter-individual variability were estimated on a random splitting of the dataset in the 2/3 of patients using NONMEM VI software. A covariate analysis was performed to explain a part of inter-individual variability of parameters. Model validation was based on visual predictive check and remaining 1/3 of patients as the test set.
Results: A total of 809 patients were included in the study, 566 in the training set and 243 in the validation set. A two-compartment model with first order absorption best fitted the plasma concentrations. Covariate analysis showed that creatinine clearance (CrCl) and sex were associated with an increased value of clearance (CL) (p<0.001). In addition, significant correlation was identified with body weight and central volume of distribution (V2) (p<0.001). For a typical woman (ClCr = 67 ml/min, body weight = 70 kg), the population (CL) was estimated to 0.24 L/h and V2 to 8.03 L, with inter-patient variabilities equal to 65% and 56% respectively. The Cl decreases from 0.24 L/h to 0.19 L/h in the typical woman would present with a CrCl equal to 50 ml/min. Coefficient of variation and standard deviation of the residual error were 12.7% and 0.04 mg/L, respectively. The visual predictive check evaluation confirmed that the full model was a good description of data. Finally, the external validation step showed an improvement in the predictive performance of the full model compared to the model without covariates.
Conclusions: It is the first pharmacokinetic developed of fondaparinux in a large population of patients after major orthopedic surgery. CrCl, body weight and sex were identified as explaining a part of inter-individual variabilities but the need for a therapeutic drug monitoring is questionable without more clinical investigation. To answer to this question, PK parameters will then be included in a multivariable analysis to assess their correlation with the risk of hemorrhage.
67
Poster: Applications- CVS
Massimiliano Germani Nonparametric Modeling and Population Approach to the Individualized Heart Rate Correction of the QT Interval
M. Germani (1), A. Russu (2), G. Greco (2), G. De Nicolao (2), F. Del Bene (1), F. Fiorentini (1), C. Arrigoni (1), M. Rocchetti (1)
(1) Pharmacokinetics & Modeling, Accelera - Nerviano Medical Sciences, Italy; (2) Dipartimento di Informatica e Sistemistica, Università di Pavia, Italy
Objectives: The QT interval is a measure of the time between the start of the Q wave and the end of the T wave in the heart's electrical cycle. Drug-induced ventricular arrhythmia associated with QT prolongation is a well-recognized form of drug toxicity. For this reason, the effect on the QT interval of compounds under development is evaluated in preclinical species.
The QT interval is dependent on the heart rate (the faster the heart rate, the shorter the QT interval) and has to be adjusted to aid interpretation. Existing correction formulas, such as Bazett's, Fridericia's, linear model, power model, and others, rely on the assumption of a parametric model, whose parameters are usually estimated from population data. Herein, a more flexible model-free nonparametric approach describing the dependence of the QT interval on the RR one is evaluated and a population modeling approach for individualized correction formulas is investigated.
Methods: The different approaches were compared using QT-RR data obtained in dogs from 24-h ambulatory electrocardiograms, for a total of 6108 QT-RR pairs. For scarcely sampled subjects, a population modeling approach was investigated. Differently from Piotrovsky [4], where a power model is used, a linear model in the logRR-logQT scale was assumed for each subject. Estimation of the model-free nonparametric correction formula was carried out according to an Empirical Bayes approach.
Results: The nonparametric approach provides a flexible method to perform QT correction. In particular, its performance, in terms of crossvalidatory RMSE, is superior to all the parametric formulas considered for both pooled and individualized correction. The study demonstrated and quantified also the definite advantage of individualized QT correction (over 30% in terms of RMSE). The population approach provides robust individual correction formulas also when few samples per subject are available.
Conclusions: This confirms that the individualized approach should be pursued whenever possible as suggested by the International Conference on Harmonization (ICH) [1], as well as in [2]-[4]. If a reference population is available, the individual correction formula of a new subject can be computed in closed form, thus easing the incorporation of the population approach within the standard data processing flow.
References: [1] Int Conf on Harmonization (ICH). The clinical evaluation of QT/QTc interval prolongation and proarrhythmic potential for non-antiarrhythmic drugs. Preliminary Concept Paper Draft 4. FDA Web site. [2] Desai M et al. Variability of heart rate correction methods for the QT interval. Br J Clin Pharmacol. 2003; 55:511-517. [3] Malik M. Problems of heart rate correction in assessment of drug-induced QT interval
68
prolongation. J Cardiovasc Electrophysiol. 2001; 12:411-420. [4] Piotrovsky VK et al. Cardiovascular safety data analysis via mixed-effects modelling. 9th PAGE Meeting, Salamanca, Spain, June 2000.
69
Poster: Applications- CVS
Ihab Girgis Bayesian Modeling of QT Measurements: Focus on Baseline QTc
Ihab G. Girgis, Jeremy Hing, Partha Nandy, Filip De Ridder, and Surya Mohanty Johnson & Johnson Pharmaceutical Research & Development
Detecting drug-induced effect on cardiac repolarization or QT interval is a closely monitored safety element in drug development and more recently, it is thoroughly scrutinized in regulatory submissions. Length of the QT intervals can be influenced by a number of covariates, such as, heart rate (HR), RR interval (RR= 60/HR), gender, and natural circadian rhythm. There are other unknown factors that influence this interval, making it highly variable across population making the analysis of such data more difficult . In order to evaluate the effect of drug on QT interval, accurate modeling of drug-free baseline QT becomes an important first step; the changes to this baseline model after the administration of investigational drug will reflect the effect of the investigational drug on the QT/QTc interval. This work focuses on modeling of baseline QT data using a hierarchical Bayesian approach. The QT-RR relationship will be explored using various models and performance of the models will be evaluated in comparison to well-known correlation methods (Bazett, Fridericia, Framingham, Hodge and individual correction). Finally, diverse nonlinear functions, ranging from a simple cosine function to multi-harmonics Fourier series will be used to describe the circadian rhythm effect. The present work will propose a framework for modeling baseline QT data.
70
Poster: Applications- CVS
Carlos Hoyo-Vadillo Pharmacokinetics model for Nifedipine administered to Healthy Volunteers.
C. Hoyo-Vadillo(1), H. González(2), E. Romero(2) and J. Pérez Urízar(3) (1)Cinvestav, Mexico; (2)University of Guadalajara, Mexico; (3)University of San Luis Potosí,
Mexico
Objectives: Nifedipine pharmacokinetics a great variability on clearance due to genetic polymorphisms and food-drug interaction. In Mexicans [1] the clearance is significantly lower than in Caucasian populations. The purpose of this study was to fit a pharmacokinetic population model for a population of young healthy volunteers.
Results: Eighty six healthy young volunteers of both genders participated. After signing consent they received the 10 mg gelatin capsule of Bayer nifedipine. Ten blood samples were taken from cubital vein. Nifedipine was analyzed with a validated hplc method. Nonmem version 6 was used with ADVAN4 TRANS1.
The $PK section was tested with combinations for exponential etas. Best fit was achieved with:
$ERROR was: Y=F*EXP(ERR(1)). Xpose2 was used to analyze the goodness of fit. Best model had an objective function of 5931.334. Mean values and standard deviation (SD) were:
Mean SD Cl 56.2 3.7 Ka 6.35 0.91 k23 0.481 0.126 k32 0.266 0.054 V 128.0 21.4 Epsilon 0.124
Conclusions: Nifedipine pharmacokinetics showed greater variability in absorption besides a tlag parameter was clear for most subjects it did not improve the fit, and so was not included. No covariables were included at this time.
71
References: [1] Hoyo-Vadillo C, Castaneda-Hernandez G, Herrera JE, Vidal-Garate J, Salazar LA, Moreno-Ramos A, Chavez F, Tena I, Hong E. 1989. Pharmacokinetics of oral nifedipine: relevance of the distribution phase. J Clin Pharmacol 29(3):251-6.
72
Poster: Applications- CVS
Kevin Krudys Bridging Cardiovascular Risk from Clinical Trials to Real Life Population
Anne Chain (1), Meindert Danhof (1), Oscar E Della-Pasqua (1, 3), Kevin M Krudys (3), Miriam CJM Sturkenboom (2)
(1)Division of Pharmacology, Leiden/Amsterdam Center for Drug Research, Leiden University, The Netherlands, (2) Department of Medical Informatics and Epidemiology & Biostatistics, (2) Erasmus
University Medical Center, The Netherlands (3)(3) GlaxoSmithKline, Clinical Pharmacology/Modelling and Simulation, United Kingdom
Recently, there has been increasing concerns in the rising number of proarrhythmia cases due to drug-induced QT prolongation. This has become the second most common cause for market drug withdrawal. Many efforts have already been made towards harmonizing the technical requirements in the clinical evaluation of QT/QTc prolongation and pro-arrhythmic potential for non-antiarrhythmic drugs. Apart from conducting adequate clinical evaluation, much more effort should also be put into explaining discrepancies between clinical research and real life observational data from epidemiological studies. The first step to determine how to predict real life observations from clinical trials of patient population is to identify and resolve patient parameters that have not been taken into consideration in the clinical trial.
To resolve this missing link it will be assumed that overall change in QT in a real life population, QTc(RLP) = QTc (Drug Effect) + QTc(Other Factors). QTc(Drug effect) is obtained from the traditional thorough QT studies in clinical trials and is the focus of many recent recommendations. This study, however, will concentrate on quantifying and explaining discrepancies between QT effects in clinical trials and real life by determining other factors, QTc(other factors), that are also contributing towards the overall change in QT in real life.
To determine QTc(other factors), a prospective cohort study will be performed in patients who started the use of SotalolTM as indicated in the IPCI general practice research database and the Rotterdam cohort of elderly. The set of patients will be analysed as a whole as well as in subgroups; subgroup I will contain patients with the same inclusion and exclusion criteria as a Phase II/III clinical trial, the remaining patients will belong to subgroup II. The risks of QT prolongation and sudden death will be calculated in groups I, II and I+II. Within each group it will be determined which covariates have the highest impact on the risk of QT prolongation or sudden cardiac death, SCD.
By analysing the real life data we aim to identify clinical parameters that are important for predicting the effects of a drug in its ‘usage environment' on the risk of QT prolongation. It is envisioned that the results from this study can eventually be incorporated into a predictive QT/QTc PK/PD model.
73
Poster: Applications- Endocrine
Paolo Denti Comparison of Different Population Analysis Approaches to the IVGTT Glucose Minimal Model
Paolo Denti (1), Alessandra Bertoldo (1), Paolo Vicini (2) and Claudio Cobelli (1) (1) Department of Information Engineering, University of Padova, Italy; (2) Resource Facility for Population Kinetics, Department of Bioengineering, University of Washington, Seattle, WA, USA
Objectives: Assessment of the performance of several different population approaches to the estimation of population parameters of the intravenous glucose tolerance test (IVGTT) glucose minimal model.
Methods: The population analysis was performed using SPK [1] on a dataset of 204 healthy subjects (mean age 56 yrs, range 18-87; mean BMI 27 kg/m2, range 20-35) who underwent a full sampling schedule insulin-modified IVGTT (240 min, 21 samples). The IVGTT glucose minimal model [2] was used for identification as follows. First the individual parameters were identified with the individual modeling program SAAM II [3] by using weighted least squares (WLS), or when necessary, maximum a posteriori (MAP) estimation. Secondly, a statistical analysis of the results provided population information. This "supervised Standard Two-Stage" approach, provided the results considered as reference (REF) for further comparisons. We still expect this method to yield overestimates of between-subject variation (BSV) [4]. Subsequently, estimates of fixed and random effects were obtained with the following population methods: Iterative Two-Stage (ITS), Global Two-Stage (GTS) [5], First-Order (FO), FO Conditional Estimation (FOCE) and Laplacian (LAP) [6, 7]. The population parameter distribution was assumed lognormal, BSV was modeled with a full covariance matrix, proportional error structure was assumed and the scale parameter for the residual unknown variability (RUV) was optimized by all algorithms along with the other fixed effects.
Results: Interestingly, FO fails to obtain reasonable estimates: it provides very low values for the mean of SI and very large estimates for the variability of SI and P2. The results yielded by all the other methods, in particular for population means, are very consistent, even if some discrepancies are detected with respect to REF. All approaches detect smaller population variability than REF. The most affected parameters are SG (~18% vs. 28%) and P2 (~50% vs. 67%). This phenomenon is more evident with LAP (11% vs. 28% for SG, 46% vs. 67% for P2) and affects much less SI and VOL (the apparent glucose volume of distribution). Only the SI variability provided by ITS and GTS is slightly smaller than REF (~64% vs. 70%). The off-diagonal terms of the population covariance matrix are estimated with low precision, as indicated by large confidence intervals. The largest correlations, however, detected between SI-P2 and SG-VOL, are well estimated by all methods. The values for the other elements of the matrix are in general very unreliable. Estimated RUV is for all methods bigger (~4%) than the CV normally assumed for glucose concentration, ~2%. As a general trend the two-stage methods tend to yield a slightly smaller value (~3.7%) as opposed to NLMEMs (~4.3%).
Conclusion: These results will form the starting point for a comprehensive evaluation of population analysis methods in the context of an information-rich protocol like the IVGTT. This includes testing various block structures for the population covariance matrix, and investigating the effect of starting values on the performance of NLMEMs, in particular shrinkage of individual random effects towards the mean. In addition, in order to further inspect the quality of
74
the results provided by the different approaches, we plan to run true likelihood profiling calculations via Monte Carlo integration [8]. Moreover, further study is required to understand the reasons underlying the failure of FO. In doing this, an approach with the use of simulated datasets will be undertaken and different settings for RUV structure probed.
References: [1] System for Population Kinetics, University of Washington, Seattle, WA, http://spk.rfpk.washington.edu/ [2] Bergman, R. N., Ider, Y. Z., Bowden, C. R. & Cobelli, C. (1979). Quantitative estimation of insulin sensitivity. Am J Physiol, 236, E667-77. [3] Barrett PH, Bell BM, Cobelli C, Golde H, Schumitzky A, Vicini P, Foster DM. (1998) SAAM II: Simulation, Analysis, and Modeling Software for tracer and pharmacokinetic studies. Metabolism 47: 484-92. University of Washington, Seattle, WA, http://depts.washington.edu/saam2 [4] Davidian, M. and Giltinan, D.M. (1995). Nonlinear Models for Repeated Measurement Data. Chapman and Hall. [5] Steimer, J. L., Mallet, A., Golmard, J. L. & Boisvieux, J.F. (1984). Alternative approaches to estimation of population pharmacokinetic parameters: comparison with the nonlinear mixed-effect model.. Drug Metab Rev, 15, 265-92. [6] Beal, S. L. & Sheiner, L.B. (1982). Estimating population kinetics. Crit Rev Biomed Eng, 8, 195-222. [7] Bell B.M. (2001). Approximating the marginal likelihood estimate for models with random parameters. Appl. Mathem. Comput., 119: 57-75. [8] Vicini P, Bell BM, Burke JV, Salinger DH and the RFPK (2008). Assessing Nonlinear Mixed Effects Model Parameter Estimates via Profiling of the True Likelihood. Abstracts of the ACOP Meeting, http://www.mosaicnj.com/acop/pdfs/Abstract_Vicini.pdf
Silke Dittberner BI 1356 (proposed trade name ONDERO) pharmacokinetics and DPP-4 inhibition: Development of a target mediated PKPD model in type 2 diabetic
patients
S. Dittberner (1), V. Duval (2), A. Staab (2), U. Graefe-Mody (2), U. Jaehde (1) (1) Dept. Clinical Pharmacy, Institute of Pharmacy, Rheinische Friedrich-Wilhelms-Universität Bonn, Bonn, Germany; (2) Boehringer Ingelheim Pharma GmbH & Co. KG, Biberach a.d.R.,
Germany
Objectives: BI 1356 is a novel, highly selective and long acting DPP-4 inhibitor under development for type 2 diabetes mellitus (T2DM). BI 1356 exhibits non-linear pharmacokinetics (PK) due to saturable binding to plasma and tissue DPP-4. The aim of the analysis was to characterize the relationship between PK and DPP-4 activity (normalized to pre-dose DPP-4 activity) in T2DM patients by means of a physiologically plausible population pharmacokinetic/pharmacodynamic (PKPD) model.
Methods: PK and DPP-4 inhibition data from 2 placebo-controlled, multiple oral dose, parallel group studies that included 124 T2DM patients (96 on BI 1356 treatment) were used for the analysis. In study 1, doses of 1, 2.5, 5 and 10 mg of BI 1356 were administered once daily as a powder in the bottle formulation for 12 days. In study 2, doses of 2.5, 5 and 10 mg of BI 1356 tablets were taken once daily for 28 days. The modelling was performed using the FOCE INTERACTION estimation method implemented in NONMEM V.
Results: The non-linear PK in patients was best described by a two compartment model that took concentration-dependent binding to DPP-4 in the central and peripheral compartment into account. The amount of binding sites was allowed to be different in the central and peripheral compartment, whereas the affinity was assumed to be identical. Inter-patient variability was established for the parameters F1, KA and for the concentration of central binding sites and intra-patient variability was accounted for on F1. The plasma DPP-4 activity was linearly correlated with the estimated DPP-4 occupancy in plasma. The concentration of central binding sites estimated by the model correlated well with the pre-dose DPP-4 activity raw data, supporting the hypothesis that these binding sites reflected the actual plasma DPP-4 concentration.
Conclusions: A PKPD model for a novel DPP-4 inhibitor was developed that integrated both non-linear PK and DPP-4 inhibition data from T2DM patients. The model was based on the assumption of target protein (DPP-4) binding in both plasma and peripheral tissue. The occupancy of DPP-4 in plasma was successfully used to relate PK to DPP-4 inhibition in plasma. Thus based on physiological knowledge, this model allows informative simulations and will serve as a basis for covariate analyses.
76
Poster: Applications- Endocrine
Silke Dittberner Target mediated drug disposition model for the DPP-4 inhibitor BI1356 (proposed trade name ONDERO): Is the structure identifiable?
S. Dittberner (1), V. Duval (2), A. Staab (2), U. Jaehde (1) (1) Dept. Clinical Pharmacy, Institute of Pharmacy, Rheinische Friedrich-Wilhelms-Universität Bonn, Bonn, Germany; (2) Boehringer Ingelheim Pharma GmbH & Co. KG, Biberach a.d.R.,
Germany
Objectives: BI 1356 is a DPP-4 inhibitor with non-linear pharmacokinetics (PK) due to saturable binding to plasma and tissue DPP-4. A PK model taking both binding sites into account was developed to analyse 2 multiple oral dose studies in patients (1, 2.5, 5 and 10 mg BI 1356 q.d.). The aim was to test whether both binding sites were identifiable using the given study designs and the total plasma concentration.
Methods: Three methods were used to investigate the identifiability of both saturable binding sites. First, their influences on the PK profiles were evaluated by simulating PK profiles with varying amounts of binding sites and by log-likelihood profiling of the parameters reflecting the amount of central and peripheral binding sites. Secondly, the PK data was simulated based on 2 scenarios: binding in only the central compartment (S1) or binding in both central and peripheral compartment (S2) for the given study design. Each dataset was then re-estimated assuming either binding only in the central compartment (M1) or in both compartments (M2). The objective function was used to compare models. Finally, the Fisher information matrix (FIM) for the given model and study design was determined with WinPOPT and used to calculate the relative standard errors (RSE) of the parameter estimates.
Results: The first test showed that changes in the concentration of central binding sites (BMAX) affected the PK profiles of all dose groups. In contrast, changes in the amount of peripheral binding partners (AMAX2) affected the 1 mg dose group predominantly. The log-likelihood profiles showed BMAX to be estimated more precisely than AMAX2. In the second test, the re-estimations for S1 showed that for 69 out of 70 simulated datasets M2 was not superior to M1. In contrast, the re-estimations for S2 showed that in 100% of the simulated datasets M2 was superior to M1. Hence the correct model was chosen for both scenarios. In the third test, the RSE of the parameter estimates determined by FIM were 4 % for BMAX and 26 % for AMAX2. Omitting the 1 mg dose group resulted in an increased RSE for AMAX2.
Conclusions: The identifiability of a PK model that takes binding of the DPP-4 inhibitor BI 1356 to its target in plasma and tissue into account was investigated using different tests. All tests supported the identifiability of the structure using the available clinical data.
77
Poster: Applications- Endocrine
Maria Garrido Simultaneous population pharmacodynamic modelling of the growth hormone and insulin-like growth factor-I effects after deep subcutaneous
administration of Lanreotide Autogel® in acromegalic patients. Application of Nonparametric estimation method in NONMEM
María J. Garrido1, Josep-María Cendrós2, Joaquim Ramis2, Concepción Peraire2, Rosendo Obach2, Iñaki F. Trocóniz1
1, Pharmacy and Pharmaceutical Technology; School of Pharmacy; University of Navarra; Pamplona; 2, Drug Metabolism, Pharmacokinetic and Immunology Department; Ipsen Pharma
S.A; Sant Feliu de Llobregat; Barcelona ; Spain
Background: Acromegaly arises from excessive growth hormone (GH) production, which stimulates abnormally high secretion of insulin-like growth factor (IGF-I). Synthetic somatostatin analogues (SSA) inhibit GH and subsequently IGF-I secretion. However a quantitative description of the relationship between the changes in IGF-I levels as a function of SSA-induced GH decrease is not available.
Objectives: To develop a population pharmacodynamic model describing the relationship between serum levels of the SSA lanreotide Autogel® (lan ATG) and its effects on GH and IGF-I in acromegalic patients.
Methods: A phase II multicentre, randomised study was conducted in 108 patients who may or may not have been previously treated with SSAs. Patients received placebo or lan ATG at doses of 60, 90, or 120 mg once every four weeks by deep subcutaneous injection. This 52-week study had four phases: (i) washout (weeks -12 to 0) for previously treated patients, (ii) double-blind, placebo controlled (weeks 0 to 4): single dose of lan ATG or placebo, (iii) single-blind, fixed-dose (weeks 4 to 20): four injections of lan ATG, and (iv) open-label dose titration of lan ATG (weeks 20 to 52). Lanreotide (Cmin) levels, GH, and IGF-I in serum were measured simultaneously at pre-treatment and weeks 4, 13, 16, and 52. GH levels were described as a function of the observed Cmin, and IGF-I levels were modelled as a function of the predicted GH, using the population approach with NONMEM VI and NONPARAMETRIC option.
Results: No evidence of hysteresis loops between Cmin, GH, and IGF-I were found in the data. The GH vs Cmin relationship was described with an inhibitory sigmoidal EMAX model, and the IGF-I vs GH relationship was modelled with an EMAX model. Despite the fact that the goodness of fit plots and visual predicted checks suggested that the model was adequate, further model validation based on posterior predicted checks [(PPC) (using the percentage of patients with normalized levels of the two hormones as main descriptor of the data] revealed clear bias. Results from the PPC were greatly improved when the final population model was re-run using the NONPARAMETRIC method and simulations were performed accordingly. Results from model-based simulations provided a simulated percentage of patients with normalized levels of GH, IGF-I, and both hormones of 66, 51, and 40 %, respectively after 16 weeks of treatment with lan ATG 120 mg, which were consistent with clinical observations.
Conclusion: A pharmacodynamic model that can describe simultaneously the reduction of GH and IGF-I levels after lan ATG administration was constructed. Model evaluation confirms (i) the
78
existence of non-symmetric ETA distributions that could be handled properly, and (ii) the efficacy of lan ATG on GH and provides a tool to handle the related changes in IGF-I.
79
Poster: Applications- Endocrine
Cyrus Ghobadi Pharmacokinetics of oral single-dose clomiphene citrate (CC) in polycystic ovary patient with anovulatory infertility
C. Ghobadi (1, 4), N. Mir-Hosseini (2), M.R. Shiran (3), W.L. Ledger (4), M.S Lennard (1), A. Rostami-Hodjegan (1).
(1) Academic Unit of Clinical Pharmacology, University of Sheffield, UK; (2) Dept. of Pharmacology, Babol Medical University, Babol, Iran; (3) Department of Physiology &
Pharmacology, School of Medicine, Mazandaran University of Medical Sciences, Sari, Iran; (4) Academic Unit of Reproductive and Developmental Medicine, University of Sheffield, Sheffeild,
UK.
Objectives: Clomiphene citrate (CC) is the first line of treatment for induction of ovulation in anovulatory infertile women with polycystic ovary syndrome (PCOS)1. After over 45 years of therapeutic use the information on pharmacokinetics (PK) of CC is very limited2 and there is no information on PK in PCOS. CC is available as a racemic mixture of two isomers, Zu- and En-CC in the ratio of 38 and 62%, respectively. The primary objective of the present study was to characterize the PK of Zu- and En-CC in patients with PCOS following the oral administration of a single 50 mg CC tablet. Secondary objective was to assess the covariates determining PK.
Methods: Nine patients were recruited after giving informed consent and studies for 21 days from the first day of menstrual cycle. Plasma concentrations of Zu- and En-CC were measured from the second day of the cycle (day 1 of dosing). Noncompartmental analysis was used to determine the PK parameter values and the effects of TBW, ideal body weight (IBW), and %IBW were investigated as potential covariates. Data on concentration-time profiles of CC isomers in healthy individuals were extracted from the only available literature report and PK parameters for both isomers were calculated using these data to compare with values obtained in PCOS patients in this study.
Results: The apparent volume of distribution (Vd/F), oral clearance (CLpo/F) and the half-life (t1/2) were 2.3 ± 0.7×10³ L, 22 ± 7 L/h, 129 ± 17 h and 5 ± 4.2×10³ L, 723 ± 670, 5±1 for Zu- and En-CC respectively. None of the PK parameters for Zu- or En-CC obtained from PCOS patients in this study were significantly different from those obtained in healthy volunteers. Obesity had statistically significant effects on V/F and CL/F of Zu-CC (p<0.03) but not En-CC.
Conclusions: We have characterized the PK of CC isomers in PCOS anovular patients for the first time. Both isomers appeared to have similar PK to those obtained in healthy individuals. The previous study on PK of CC only focused on the average values and no report was given on the magnitude of inter-individual variability. Current report showed a substantial inter-subject variability in PK parameters. Obesity was investigated as one of the covariates for PK. The distribution and clearance of Zu-CC was different in obese patients and the increase in V/F appeared to be related to TBW indicting an equal increase in the distribution of the drug into adipose and other body tissues. Obesity also increased the absolute value Zu-CC clearance however there was no evidence of change in Zu-CC hepatic biotransformation since the CL/F after correction for TBW was not significantly different between obese and non-obese patients.
80
References: [1] Hum Reprod. Jun 1995;10:1549-1553. [2] Fertil Steril. Sep 1986;46:392-396. [3] Fertil Steril. May 2004;81:1187-1193. [4] Curr Opin Endocrinol Diabetes Obes. Dec 2007;14:482-487. [5] Maturitas. Jul 20 2006;54:363-371. [6] Arch Gynecol Obstet. Dec 2004;270:205-210. [7] Clin Pharm. Sep 1987;6:706-714.
81
Poster: Applications- Endocrine
Tae Han Alteration of glucose and insulin regulatory networks for the treatment of type 2 diabetes mellitus
Tae H. Han1, Elizabeth M. Migoya1, Lata Maganti1, Rebecca Baillie2, Paul Brazhnik2, and James R. Bosley, Jr.2
1 Merck & Co Inc 2 Rosa Pharmaceuticals
A quantitative framework for the (patho)physiological mechanisms and pathways that underlie type 2 diabetes mellitus (T2D) was needed in order to characterize the pharmacological and toxicological attributes of single or multiple compound/target pairs. The objective of this work was to develop an integrated pharmacokinetic and (patho)physiological based model that links relevant information from in vitro experiments, evaluations in non-clinical studies, and results from clinical studies. In particular, a network of interactions that represents key attributes of T2D was generated and relevant parameter values were identified from literature and non-clinical assessments. Virtual patients based on the disease state of the patients enrolled in Phase I studies were created with the goal of assessing the performance of altered glucose metabolism in late-stage clinical studies through trial simulation. In conclusion, this model may serve as a basis to identify the impact of altered pharmacokinetics and the pharmacokinetic/pharmacodynamic relationship to identify target populations for therapy and for lead optimization.
82
Poster: Applications- Endocrine
Nick Holford Delayed response to hypoglycaemic agents and effect on progression of type 2 diabetes
Nick Holford (1), Jenny Chien (2), Vikram Sinha (2), David Manner (2), Michael Heathman (2), Jeanne Geiser (2)
(1) Dept of Pharmacology & Clinical Pharmacology, University of Auckland, Auckland, New Zealand; (2) Lilly Research Laboratories, Indianapolis, USA
Objectives: The modeling of time course of glucose and insulin changes during prolonged treatment with oral hypoglycaemic drugs has to consider disease progression mechanisms as well as drug action. De Winter et al. (1) proposed a mechanism-based model for changes in beta cell function and insulin potency during treatment with gliclazide (GLZ), metformin (MET) and pioglitazone (PIO). We have extended this model using up to 2 years of glucose and insulin observations from placebo, GLZ, MET and PIO treated patients.
Methods: The steady state solution to the modified HOMA (2) model for glucose-insulin regulation was used to describe glucose and insulin responses to changes in beta cell function (BF) and insulin potency (IP). The time course of BF and IP was described by an exponential decrease. Offset effects of GLZ, MET and PIO on BF and IP were estimated with an effect compartment model for the delay in onset of drug action. Slope effects on BF and IP progression were estimated assuming an immediate effect of each treatment. Parameter estimation used NONMEM VI level 1.3.
Results: Overall, baseline BF was 28% and baseline IP was 23% of HOMA values in normal subjects. BF decreased with a half-life ~ 17.6 years and IP ~ 6.2 years. All 3 drugs assumed both actions on offset and slope change for BF and IP. Offset effects on BF were delayed with effect half-lives of 3 (GLZ), 6 (MET) and 14 (PIO) weeks. Offset effect half lives for IP were 0.1 (GLZ), 21 (MET) and 14 (PIO) weeks. In comparison to PIO, GLZ and MET had marked effects on increasing loss of BF progression (at least 2 fold) (3). The 3 treatments had similar effects on IP progression.
Conclusions: Commonly used oral hypoglycaemic drugs have a slow onset of action explained by increasing beta cell function and enhancing insulin potency. There are marked differences in the speed of action with GLZ being most rapid. This model adequately described the time course of insulin and glucose for these treatments. In addition, the model distinguishes effects of these three drugs on BF and IP and changes in BF and IP. While additional work with this model is needed, disease progression models advance our understanding of progression of diabetes and the effects of pharmaceutical intervention.
References: [1] de Winter W, DeJongh J, Post T, Ploeger B, Urquhart R, Moules I, et al. A mechanism-based disease progression model for comparison of long-term effects of pioglitazone, metformin and gliclazide on disease processes underlying Type 2 Diabetes Mellitus. J Pharmacokinet Pharmacodyn. 2006;33(3):313-43. [2] Matthews DR, Hosker JP, Rudenski AS, Naylor BA, Treacher DF, Turner RC. Homeostasis model assessment: insulin resistance and beta-cell function from fasting plasma glucose and insulin concentrations in man. Diabetologia. 1985;28(7):412-9.
83
[3] Tan MH, Baksi, A, Krahulec B, Kubalski P, Stankiewicz A, Urquhart R, Edwards G and Johns D for the GLAL Study Group. Comparison of Pioglitazone and Gliclazide in Sustaining Glycemic Control Over 2 Years in Patients With Type 2 Diabetes. DiabetesCare. 2005;28(3):544-550.
84
Poster: Applications- Endocrine
Petra Jauslin Identification of the Mechanism of Action of a Glucokinase Activator from OGTT Data in Type 2 Diabetics Using an Integrated Glucose-Insulin Model
P. M. Jauslin (1,2), M. O. Karlsson (1), N. Frey (2) (1) Division of Pharmacokinetics and Drug Therapy, Department of Pharmaceutical Biosciences,
University of Uppsala, Sweden; (2) Department of Biomathematics, Modeling and Simulation Group, F. Hoffmann-La Roche Inc., Basel, Switzerland
Objectives: To demonstrate the ability of a previously developed integrated glucose-insulin model to identify the correct dual mechanism of action of a glucokinase activator (GKA) and to estimate the drug's antidiabetic effects based on oral glucose tolerance test (OGTT) data in type 2 diabetics.
Methods: The data were obtained from a three-period cross-over study in type 2 diabetic patients. Each patient received placebo and 2 different doses (25 mg and 100 mg) of the study drug. The drug was administered in fasting state. Two hours later, an OGTT was performed. A kinetic-pharmacodynamic (K-PD) approach was chosen to describe the pharmacodynamic effect of the study drug in a dose-response-time model. Based on the integrated glucose-insulin model for OGTTs in type 2 diabetics developed by Jauslin et al [1], model parameters that were likely to be affected by the action of a antidiabetic drugs were identified: insulin secretion, glucose production, the insulin effect on glucose elimination and insulin-independent glucose elimination. Drug effects at the different sites of action were first tested one by one and then in combination.
Results: The integrated glucose-insulin model was able to identify the correct dual mechanism of action of a GKA: targeting the drug effect on insulin secretion and glucose output resulted in a significantly better model fit than any other combination of effect sites. The model was also able to quantify the effect of both GKA doses on the patients' glucose and insulin concentration-time profiles.
Conclusions: These promising results prove the ability of this mechanism-based glucose-insulin model to identify a compound's mechanism of action and to describe its effects on glucose and insulin time courses. However, the approach requires further validation by application to other compounds with different mechanisms of action. The model might find its main application in the earlier stages of drug development, particularly by gaining information on drug exposure-response relationships from glucose challenges.
References: [1] Jauslin P, Silber HE, Frey N, Gieschke R, Simonsson US, Jorga K, Karlsson MO. An integrated glucose-insulin model to describe oral glucose tolerance test data in type 2 diabetics. J Clin Pharmacol. 2007;47:1244-55.
85
Poster: Applications- Endocrine
Teun Post Disease System for osteoporosis: relating bone mineral density with measures of bone formation and resorption based on bone biology
Teun Post(1), Rik de Greef(1), Thomas Kerbusch(1), Lambertus Peletier(2), Meindert Danhof(3) 1) Clinical Pharmacology and Kinetics, Organon, a part of Schering-Plough Corporation, Oss, The
Netherlands, 2) Mathematical Institute, Leiden, The Netherlands, 3) Division of Pharmacology, LACDR, Leiden University, Leiden, The Netherlands
Objectives: Bone remodeling is regulated by a coupled action of osteoclastic and osteoblastic cells, which remove and form bone, respectively. In osteoporosis resorption exceeds formation leading to a net decrease in bone density. Upon antiresorptive and anabolic treatment the changes in resorption and formation occur sequentially resulting in a time-window of effect leading to an increased bone density. Bone Turnover Markers (BTM) and Bone Mineral Density (BMD) present information on this system at different time-scales. The objective was to develop a disease system based on bone biology that incorporates markers of both bone formation and resorption aiming to characterize the time-window of effect that is correlated to the increase in BMD in healthy postmenopausal women.
Methods: Data were from 767 healthy women within 1-4 yr after menopause, treated for 2 yr with 0.3, 0.625, 1.25, or 2.5 mg tibolone daily or placebo (1). All subjects took supplemental calcium (500 mg daily). Bone formation was reflected by measures of osteocalcin and bone-specific alkaline phosphatase (BSAP) and urinary N-terminal (NTx) collagen telopeptide reflected bone resorption. BMD of the lumbar spine (L1-L4) and total hip were measured by dual-energy x-ray absorptiometry.
The conceptual framework of bone biology based on the Basic Multicellular Unit (BMU) as presented by Lemaire et al (2) was used to reflect the coupled osteoclastic-osteoblastic action during treatment. The bone turnover markers were related to their system-specific site and the dynamics in the system were subsequently translated into effects observed on BMD. This pharmacodynamic platform model was developed using a non-linear mixed effects approach in NONMEM VI.
Results: The platform model comprehensively describes the dynamics of the markers representing bone resorption as well as bone formation during treatment, thereby characterizing and quantifying the related time-window of effect driving the increase in BMD. As a result, the model also adequately described the dynamics in lumbar spine and total hip BMD.
Conclusions: A disease system has been developed that provides a basis for the integrated description of short- and long-term markers based on bone biology. This may allow the comparison and prediction of various treatment effects on a common platform model. Furthermore, it enables the inclusion and integration of information presented by different markers at various levels and time-scales of the biological system.
References: [1] J.C. Gallagher et al. J Clin Endocrinol Metab 86 (2001) 4717-4726 [2] V. Lemaire et al. J Theor Biol 229 (2004) 293-309
86
This research was performed within the framework of project D2-104 of the Dutch Top Institute Pharma.
87
Poster: Applications- Endocrine
Rujia Xie Model-Based Drug Development (MBDD) of Pegylated Growth Hormone (PEG-hGH) in the Treatment of Adult Growth Hormone Deficient (AGHD)
Rujia Xie (1), Tracy Higgins (1), Jaap Mandema (2) (1)Pfizer, Sandwich, United Kingdom; (2)Quantitative Solutions Inc. CA, USA
Objectives: This presentation reviews the major MBDD activities and their influence on the early development of PEG-hGH and the inception of an expedited late development strategy.
Methods: There were three key influential MBDD activities undertaken in the early development of PEG-hGH.
A model-based literature meta-analysis (MBLMA) was conducted across the extensive prior literature available on the treatment of AGHD with recombinant human growth hormone (rhGH) (Genotropin). Summary level data was available on 135 trials (354 unique treatment arms) presenting 6395 patients and patient level data was available on 3 trials. The dose response relationships for the biomarker insulin growth factor-1 (IGF-1) [1] and outcome measures of body composition were characterised.
A semi-mechanistic PK/IGF-1 model to describe IGF-1 vs. time profiles after administration of PEG-hGH was developed [2], applied and updated across Phase 1 (56 males) and Phase 2a (7 males) The data were analysed by a nonlinear mixed effects modelling approach.
The computer added trial design (CATD) was performed to assist Phase 2a/b study designs using PK/IGF-1 model including variability and parameter uncertainty.
Results: The MBLMA approach allowed the relationship between IGF-1 and body composition for rhGH to be fully quantified. This result supported the rationale to use IGF-1 as a biomarker for early development and provided the confidence to select Phase 3 dose(s) based on the Phase 2 IGF-1 response; saving a dose body composition Phase 2 study. Females were less sensitive than males and this relationship was well quantified for all endpoints.
The equivalent clinical efficacious doses for PEG-hGH to rhGH were predicted based on simulated IGF-1 response. This approach was used to optimise the dose regimen for PEG-hGH and supported the early investment in the dose strength for Phase 3.
Clinical trial simulation (CTS) was undertaken to simulate IGF-1 response for various scenarios to select the optimal study design (doses and sample size) for PEG-hGH Phase 2a and 2b trials using the PK/IGF-1 models developed from phase 1 and Phase 2, respectively. Gender difference obtained from MBLMA was incorporated into the CTS under the assumption of similar gender effect on both drugs. The sample size (especially for placebo group), duration and arms for Phase 2b study were significantly reduced.
Conclusions: The application of MBDD has supported the efficient and cost-effective clinical drug development of PEG-hGH. The established quantitative linkage between IGF-1 and body composition has the potential to improve routine clinical practice with rhGH.
88
References: [1] Relationship between the Dose of Recombinant Human Growth Hormone (rhGH) and Insulin Growth Factor-1 (IGF-1) in Adult Patients with Growth Hormone Deficiency (AGHD). Poster for PAGE, Marseille, 2008. [2] Population Pharmacokinetic/Pharmacodynamic Analysis for Pegylated Recombinant Human Growth Hormone (PHA-794428) in Male Healthy Volunteers. Abstract for Endocrine Society Meeting, Boston June 24-27, 2006.
89
Poster: Applications- Endocrine
Rujia Xie Relationship between the Dose of Recombinant Human Growth Hormone (rhGH) and Insulin Growth Factor-1 (IGF-1) in Adult Patients with Growth
Hormone Deficiency (AGHD)
Rujia Xie (1) and Jaap Mandema (2) (1) Pfizer, Sandwich, UK; (2) Quantitative Solutions Inc. CA, USA
Objectives: The purpose of this meta-analysis was to characterise the relationship between rhGH dose, time, patient characteristics and IGF-1 in AGHD patients.
Methods: All uncontrolled and controlled trials that reported a change from baseline in IGF-1 in AGHD patients with at least one week of rhGH treatment were included in the database. Three trials with patient level data were included to obtain more information on the relationship between covariates and IGF-1 response. A nonlinear mixed effects regression method was utilized to analyse the data containing a total of 118 trials with 225 unique treatment arms representing 4298 patients. Additive trial and residual variability were estimated and the latter was weighted by sample size. A compound symmetry correlation was assumed between the IGF-1 observations within one arm of a trial to account for the repeated measurements over time. A log transformation was used to stabilize the variance across the response range.
Results: The dose response data for IGF-1 was well described by an Emax model. There was no significant effect of time on Emax indicating that the onset of effect is fast and stable after 1 week of treatment. The maximum response (Emax) was 365 ng/ml. The dose reaching half the Emax (ED50) was found to be significantly dependent on: baseline IGF-1, gender, body weight, and dose titration. Female subjects were less sensitive to treatment needing a 1.7-fold higher dose to get a certain IGF-1 response than males (typical male ED50=9.5mg/kg/day vs. female 16.5 mg/kg/day). For every 10 ng/ml increase in baseline IGF-1, the ED50 decreased by about 5%. This model was better than a model for the % change from baseline. The ED50 was significantly smaller in subjects with a higher baseline weight. The relationship indicated that across the weight range the patients required about the same total (non weight adjusted) dose to get a certain IGF-1 response. This suggests that body weight adjusted dosing is not necessary. The dose required to normalize IGF-1 (to 180 ng/ml) is 0.23 [0.21 to 0.27] mg/day in a typical male with adult onset GHD and 0.40 [0.35 to 0.45] mg/day in a typical female.
Conclusions: This meta-analysis provided a broad overview and understanding of the IGF-1 dose response relationship and the impact of key covariates.
90
Poster: Applications- Oncology
René Bruno Modeling and simulation to assess the use of change in tumor size as primary endpoint in Phase II studies in oncology
L. Claret (1), V. Andre (2), D. de Alwis (2), R. Bruno (1) (1) Pharsight Corp., Mountain View, USA, (2) Eli Lilly and Co, Erl Wood, UK
Objectives: To develop a model for progression-free-survival (PFS) in 2nd line NSCLC and assess the potential gain in efficiency in using change in tumor size (CTS) at first assessment (6-8 weeks) as opposed to PFS as a primary endpoint in Phase II studies of new oncology treatments using a simulation approach.
Methods: A model for PFS as a function of CTS and other prognostic factors was developed using data from the docetaxel arm (ECOG 0, 1 patients, n=240) of a Phase III study of docetaxel vs. pemetrexed in 2nd line NSCLC patients [1]. CTS was highly predictive of PFS (p<0.0001). The model was assessed using a visual predictive check. A randomized Phase II study of a new investigational treatment vs. docetaxel was simulated under various scenarios for the efficacy of the investigational treatment: from 0 to 100% increase in PFS over docetaxel (3.29 months). The PFS model was used to assess the CTS required to achieve the desired efficacy goals in term of PFS. Multiple replicates of study design scenario were simulated and study performance (% successful trials) was assessed to compare design and endpoints. A Log rank test was used to compare PFS and a t-test was used on the log ratio of tumor size at 1st assessment to baseline size [2].
Results: The power of a 120-patient randomized Phase II (2:1 randomization) was 60% based on PFS (40% increase i.e. 2.1 months) and 100% based on CTS. In all simulated scenarios, CTS was always more efficient than PFS (greater power with less patients). This gain in efficiency can be explained by the fact that CTS is based on continuous variable actual treatment effect on tumor size whereas PFS focuses on the time to progression and time to death, which is an indirect measure of treatment effect on tumor size. The use of CTS as the primary endpoint would allow to use randomized trials with smaller sample size and/or to detect smaller differences in PFS (e.g. the power to show a 1.3 month increase in PFS would be 93% using CTS vs. 34.2% using PFS).
Conclusions: There is a pressing need to improve Phase II clinical trial design in oncology in the hope to decrease the high failure rate in Phase III. The use of CTS as the primary endpoint in randomized Phase II studies as recently proposed by Karrison et al. [3] coupled with simulation models offer a powerful alternative to more traditional endpoints. A disease-specific survival model [4] can also be used to make inference on expected survival of the investigational treatment and to support go-no go decisions and Phase III study design [5].
References: [1] Hanna N., Shepherd F.A., Fossella F.V. et al. Randomized phase III trial of pemetrexed versus docetaxel in patients with non-small-cell lung cancer previously treated with chemotherapy. J Clin Oncol, 22, 1589-1597, 2004. [2] Lavin P.T. An alternative model for the evaluation of antitumor activity. Cancer Clin Trial. 4, 451-457, 1981. [3] Karrison T.G., Maitland M.L., Stadler W.M. and Ratain M.J. J Natl Cancer Inst, 99, 1455-1461, 2007. [4] Wang Y. et al, FDA Clin. Pharmacol. FDA Meeting of the Advisory Committee meeting,
91
Rockville, March 18, 2008. http://www.fda.gov/ohrms/dockets/ac/cder08.html#PharmScience. [5] Bruno R. and Claret L. On the use and value of drug-independent survival models to support clinical drug development in oncology. FDA Meeting of the Clinical Pharmacology Advisory Committee, Rockville, March 18, 2008
Francesca Del Bene Evaluating the Influence of Different Sources of Variability in the PK/PD Tumor Growth Inhibition (TGI) Model
F. Del Bene (1), M. Germani (1), F. Fiorentini (1), G. De Nicolao (2), P. Magni (2), M. Rocchetti (1)
(1) Pharmacokinetics & Modeling, Accelera - Nerviano Medical Sciences, Italy; (2) Dipartimento di Informatica e Sistemistica, Università di Pavia, Italy
Objectives: Generally, the estimate of the in vivo effect of anticancer compounds is based on the evaluation of the changes in the average tumor growth profiles in treated versus untreated group of 8-10 animals. We recently developed a simple and effective pharmacokinetic-pharmacodynamic model linking the plasma concentrations of anticancer compounds to the effect on the tumour growth [1]. The model has been successfully applied to many different drugs and cell lines, showing also a good predictivity of the expected activity of the tested compounds in the clinics [2]. Essentially, the model describes the system as the interaction of three major processes: the unperturbed tumor growth in untreated animals (representing the biological system), the action of the drug on the tumor growth (representing the pharmacological part of the system) and the pharmacokinetics (PK) of the tested compound. The aim of this communication is to explore and discuss the different sources of variability affecting the response of the system in terms of PD data.
Methods: Different sets of experimental data were considered. For each tested compound the inter-animal variability of the PK and the tumor growth PD parameters was estimated through the variance-covariance matrix of parameters derived from individual fittings. The influence of these different sources of variability was investigated analysing series of simulated tumor growth profiles and comparing them with the observed individual data.
Results and Conclusions: The Monte Carlo simulations based on the PK/PD model, through its parameters, allowed to identify and assess the contribution of the different processes to the overall behavior of the system. The simulated tumor growth profiles in treated animals indicate the biological process (represented by the parameters modeling unperturbed tumor growth) as the major factor influencing the variability of the system response. These analyses are expected to prove particularly useful for the subsequent development of a comprehensive population approach.
References: [1] Simeoni M, Magni P, Cammia C, De Nicolao G, Croci V, Pesenti E, Germani M, Poggesi I, Rocchetti M. Predictive pharmacokinetic-pharmacodynamic modeling of tumor growth kinetics in xenograft models after administrations of anticancer agents. Cancer Research. 2004, 64: 1094-1101. [2] Rocchetti M, Simeoni M, Pesenti E, De Nicolao G, Poggesi I. Predicting the active doses in humans from animal studies: a novel approach in oncology. European Journal of Cancer, 43, 1862,1868, 2007.
93
Poster: Applications- Oncology
Nicolas Frances Modeling of longitudinal tumor size data in clinical oncology studies of drugs in combination
N. Frances (1), L. Claret (2), F. Schaedeli Stark (3), R. Bruno (2), A. Iliadis (1) (1) School of Pharmacy, Université de la Méditerranée, Marseille, France (2) Pharsight Corp.,
Mountain View, USA (3) Hoffman-La Roche, Basel, Switzerland
Objectives: The analysis of tumor size measurements, obtained in clinical studies involving combination chemotherapy, remains an open modeling problem. We used retrospective clinical data in metastatic breast cancer in order to investigate whether the contribution to the anti-tumor effect of each compound in a combination setting can be estimated 1) from combination data with or without single agent data, and 2) from datasets with a limited number of patients.
Methods: Data concerning tumor size measurements and treatments characteristics were available for docetaxel (D, n=223), capecitabine (C, n=168) [1, 2] given as single agents and their combination (D+C, n=222) [3]. The developed model is an extension of already presented disturbed growth models [4, 5] and it is based on the following hypotheses: 1) Tumor growth is exponential or Gompertz; 2) K-PD model describes administration protocols; 3) Resistance is materialized by exponential decline of cell-kill rate; 4) Drugs are combined either in a linear, or Emax, or Weibull model involving a drug interaction term. Population analyses were performed using NONMEM Version 6 within a MATLAB environment. The models were validated using posterior predictive checks.
Results: In the developed models, over-parameterization was the most frequent problem. K-PD models involve only one parameter expressing the dynamics of drug amounts in the cell-kill rate formulation. This parameter was obtained for D and C from the single agent studies and was fixed in the analysis using the combination data only. When using the combination data only, the contribution of each drug to the anti-tumor effect was accurately estimated and the estimates were consistent with those obtained using single-agent data. The effect of the 2 drugs was found to be additive with no drug interaction term. Situation #2 is still under investigation.
Conclusions: Using combination data, the tumor size dynamic model parameters were successfully estimated. Further investigations are in progress for assessing the minimum required extent and type of clinical data for evaluating drug combinations in oncology. This model will be part of a modeling framework to simulate expected clinical response of new compounds and to support end-of-phase II decisions and design of phase III studies [6].
References: [1] Blum JL, Jones SE, Buzdar AU, et al: Multicenter Phase II Study of Capecitabine in Paclitaxel-Refractory Metastatic Breast Cancer. J Clin Oncol 17: 485-493, 1999. [2] Blum JL, Dieras V, Mucci Lo Russo P, et al: Multicenter, phase II study of capecitabine in taxane-pretreated metastatic breast carcinoma patients, Cancer 92:1759-1768, 2001. [3] O'Shaughnessy J, Miles D, Vukelja S et al. Superior survival with capecitabine plus docetaxel combination therapy in anthracycline-pretreated patients with advanced breast cancer: Phase III trial results. J Clin Oncol 12: 2812-2823, 2002. [4] Iliadis A, Barbolosi D: Optimizing drug regimens in cancer chemotherapy by an efficacy-
94
toxicity mathematical model. Comput Biomed Res 33:211-226, 2000. [5] Claret L, Girard P, Zuideveld KP, et al: A longitudinal model for tumor size measurements in clinical oncology studies. PAGE 15 (abstract 1004), 2006a [www.page-meeting.org/?abstract=1004]. [6] Claret L, Girard P, O'Shaughnessy J et al: Model-based predictions of expected anti-tumor response and survival in phase III studies based on phase II data of an investigational agent. Proc. Am Soc Clin Oncol, 24, 307s (abstract 6025), 2006b.
95
Poster: Applications- Oncology
Lena Friberg Scaling the Time-Course of Myelosuppression from Rats to Patients with a Semi-Physiological Model
Lena E. Friberg* (1), Marie Sandström (1,2), Mats O. Karlsson (1) (1) Department of Pharmaceutical Biosciences, Uppsala University, Uppsala, Sweden
Objectives: We have earlier developed a model for chemotherapy-induced myelosuppression based on patient data that shows similar system-related parameters across drugs but the drug-related parameter estimates, related to drug potency, differed as expected [1]. The aim of the present study was to explore if drug-related parameter estimates are of comparable magnitudes in rats and patients. If similarities exist, it would be possible to early in development predict the full time-course of myelosuppression in patients based on rat PK and myelosuppression data, human PK predictions and previously determined system-related parameters in patients.
Methods: White blood cell counts (WBC) were determined in rats after administration of 5-fluoruracil (5-FU), epirubicin, cyclophosphamide (CP), docetaxel, paclitaxel or etoposide. Individual or typical population PK parameters were used to predict the drug concentration-time profile in each rat. The myelosuppression model [1] was applied to all data simultaneously, allowing only the drug-related parameter Slope to differ between drugs. Information on species differences in protein binding and in CFU-GM assay sensitivity [2] were taken from the literature. The analysis was performed using FOCE in NONMEM VI. Time-courses in patients were predicted based on patient PK models, typical system-related parameters [1] and rat Slope estimates.
Results: The myelosuppression model fit the rat data adequately although the fit improved when the drugs affected all cell types. The maturation time was approximately half of the estimate in patients while the feedback parameter was of similar magnitude. The relative difference in Slope estimates for rats and patients [1,3,4] based on total drug concentrations ranged between 28% to 7-fold for the 6 drugs. For 5-FU and CP the differences clearly reduced when correcting for species differences in IC90 ratios in the CFU-GM assay. For etoposide the 10-fold species difference in protein binding was important to consider. Following correction, the relative differences in Slope values were ≤ 50% for all drugs.
Conclusions: The estimated drug-related parameters in rats could successfully be used to predict the time-course of myelosuppression in patients. Accounting for species differences in protein binding and in vitro sensitivity improved the predictions. This scaling approach may also be promising early in development to predict combination therapies and schedule dependence of myelosuppression.
References: [1] Friberg LE, Henningsson A, Maas H, Nguyen L and Karlsson MO (2002) Model of chemotherapy-induced myelosuppression with parameter consistency across drugs. J Clin Oncol 20:4713-4721. [2] Pessina A, Albella B, Bueren J, Brantom P, Casati S, Gribaldo L, Croera C, Gagliardi G, Foti P, Parchment R, Parent-Massin D, Sibiril Y and Van Den Heuvel R (2001) Prevalidation of a model for predicting acute neutropenia by colony forming unit granulocyte/macrophage (CFU-GM) assay. Toxicol In Vitro 15:729-740
96
[3] Sandstrom M, Lindman H, Nygren P, Johansson M, Bergh J and Karlsson MO (2006) Population analysis of the pharmacokinetics and the haematological toxicity of the fluorouracil-epirubicin-cyclophosphamide regimen in breast cancer patients. Cancer Chemother Pharmacol 58:143-156. [4] Sandstrom M, Lindman H, Nygren P, Lidbrink E, Bergh J and Karlsson MO (2005) Model describing the relationship between pharmacokinetics and hematologic toxicity of the epirubicin-docetaxel regimen in breast cancer patients. J Clin Oncol 23:413-421
97
Poster: Applications- Oncology
Maria Garrido Biopharmaceutic and pharmacodynamic characterization of the in vitro anti-proliferative effect of new delivery systems of Cisplatin
María J Garrido1, Helena Colom2, Juan Espinola1, Daniel Moreno1, Sara Zalba1, Conchita Tros1, Iñaki F. Trocóniz1
: 1, Pharmacy and Pharmaceutical Technology, University of Navarra; Pamplona; 2, Pharmacy and Pharmaceutical Technology, University of Barcelona. Spain.
Background: Despite cisplatin has been used for more than two decades in the treatment of cancer, resistance development and side effects represent serious limitations that are still not solved. New cisplatin controlled delivery systems (CDS) have shown a significant improvement of its therapeutic index, although their characterization has been in general very empirical.
Aim: To characterize the in vitro antiproliferative effect of new cisplatin CDS by a semi-mechanistic biopharmaceutic/pharmacodynamic model, on colon cancer cell lines.
Methods: In vitro release profiles obtained during thirty five days for each of the new CDS [PLGA; poly(D, L-Lactide-co-glycolide)] microparticles of 9 µm Ø (MP), and nanoparticles of 200 and 500 nm Ø, respectively (NPs)][1] were described using the empirical model proposed by Duvvuri et al (2006),[2] characterizing drug-diffusion and drug-release for degradation of the polymeric matrix. All Cytotoxicity data available consisting on the number of survival cells after a continuous exposure from 0 to 144 hours at five different concentrations of free or encapsulated cisplatin were modelled simultaneously using the Gomperzt framework incorporating the drug release model selected previously. All the analyses were performed using the population approach with NONMEM version VI.
Results: The rate of drug-release during the diffusion process associated with a shorter time duration to release the 50% of entrapped drug was greater for the smallest particles. Two mechanisms of drug action could be quantitatively identified, the first inhibiting the rate of cell proliferation and the second eliciting an irreversible cell lost through the activation of an apoptotic signalling pathway.
Conclusion: The drug-effect model selected and its model parameter estimates were independent from the types of CDS, supporting its semi-mechanistic properties, and making it a suitable tool to explore in silico, alternative in vitro and in vivo scenarios to continue research in optimizing the controlled delivery of cisplatin.
References: [1] Moreno et al. Eur J Pharm Biopharm 68 :503-12 (2008). [2] Duvvuri S et al. Pharm Res 23: 215-23 (2006).
98
Poster: Applications- Oncology
Emma Hansson The Shape of the Myelosuppression Time-course is Related to the Probability of Developing Neutropenic Fever in Patients with Docetaxel-induced
Grade IV Neutropenia
Emma K. Hansson, Lena E. Friberg Department of Pharmaceutical Biosciences, Division of Pharmacokinetics and Drug Therapy,
Uppsala University, Uppsala Sweden
Objectives: Chemotherapy-induced neutropenic episodes are associated with the risk of developing the life-threatening condition febrile neutropenia (FN), defined as fever ≥ 38.3 °C in combination with grade IV neutropenia, i.e. neutrophil count < 0.5 x 10⁹/L. The aim of the present study was to describe the time-course of myelosuppression in patients treated with docetaxel and to investigate if the probability of developing FN in patients with grade IV neutropenia is random or dependent on the shape of the predicted myelosuppression time-course and on other proposed risk factors [1].
Methods: Neutrophil counts (n=517) from 140 of totally 244 breast cancer patients (FN =26 episodes) with observed grade IV neutropenia during the first course of docetaxel treatment (100 mg/m2) were included in the analysis [2]. Concentration-time profiles of docetaxel were predicted using typical population PK parameters [3]. A semi-physiological myelosuppression model [4] was fitted to the neutrophil observations using the LAPLACE method in NONMEM VI. The neutrophil data were Box-Cox transformed with a factor 0.2 to obtain symmetrically distributed residuals around zero. The half life of neutrophils was fixed to 7 hours. The myelosuppression model parameters (baseline neutrophil count, mean transit time (MTT) and drug effect parameter EC50), myelosuppression descriptors (nadir and duration of grade IV neutropenia) and proposed risk factors [1] (age, performance status, haemoglobin (Hb) and liver function) were explored to be related to the FN data by logistic regression.
Results: The myelosuppression model could well characterize the neutrophil-time course following docetaxel treatment and resulted in similar system-related parameter estimates as previously observed [1]. A sigmoidal Emax model described the data better than a linear drug effect relationship. The myelosuppression model parameters EC50 and MTT were both significantly related to the probability of developing FN where low values indicate increased risk. None of the evaluated risk factors or myelosuppression descriptors was found significant.
Conclusions: The probability to develop FN is dependent on the myelosuppression time-course. Patients with high drug sensitivity and a fast neutrophil decline have a higher probability to develop FN compared with other patients who experience grade IV neutropenia.
References: [1] Aapro MS., et al., European J Cancer; 42:2433-2453, 2006. [2] O'shaughenssy J et al., J Clin Oncol; 20:2812-2822, 2002. [3] Bruno R., et al., J Pharmacokinet Biopharm; 24:153-72, 1996. [4] Friberg LE., et al., J Clin Oncol; 20:4713-21, 2002.
99
Poster: Applications- Oncology
Emma Hansson Comparison of Inter-Occasion and Inter-Individual Variability in Chemotherapy- Induced Myelosuppression
Emma K. Hansson(1), Johan Wallin(1), Marie Sandström(1,2), Mats O. Karlsson(1), Lena E. Friberg(1)
(1)Department of Pharmaceutical Biosciences, Division of Pharmacokinetics and Drug Therapy, Uppsala University, Uppsala Sweden; (2)AstraZeneca R&D, Södertälje, Sweden
Objectives: A semi-physiological model of chemotherapy-induced myelosuppression has previously been developed and applied to several different anticancer drugs. Consistency in system-related parameter estimates and inter-individual variability (IIV) have been reported across drug [1]. A requirement for the model to be a useful tool for individual dose adjustments based on neutrophil counts [2, 3] is relatively low variability between treatment courses (IOV) in relation to IIV. The aim of this study was to evaluate and compare magnitudes of IOV and IIV in myelosuppression model parameters across six different data sets.
Methods: Neutrophil counts from several treatment courses were available following therapy with paclitaxel, epirubicin + docetaxel, 5-fluorouracil + epirubicin + cyclophoshamide, topotecan, etoposide and docetaxel. One occasion was defined as one course. The PK were described using individual [4, 5, 6, 7, 8] or population [9] PK parameters. IOV in PK was not available. The semi-physiological myelosuppression model [1] was fitted to the neutrophil observations using the FOCE method in NONMEM VI. The subroutine PRIOR was used to estimate separate drug effect parameters (Slope) for the co-administered drugs. The data were Box-Cox transformed with a factor 0.2 to obtain symmetrically distributed residuals around zero and the half life of neutrophils was fixed to 7 hours. IOV in baseline neutrophil count (Base), mean transit time (MTT) and Slope were evaluated for statistical significance (P < 0.001).
Results: IOV in MTT was significant for all the investigated datasets except for topotecan and ranged from 8-16 % (CV). For etoposide and docetaxel IOV in Slope was also found significant with an estimated CV of 40 and 19 %, respectively. For topotecan IOV in Slope and Base (CV of 29 and15%, respectively) was significant. The estimated overall IOV were clearly lower than IIV in all cases. By inclusion of IOV the residual errors decreased on average by 10 %.
Conclusions: For all six investigated datasets of chemotherapy-induced myelosuppression, the overall IOV was estimated to be lower than the overall IIV. The limited IOV in relation to IIV in the myelosuppression model parameters indicate that the semi-physiological model has potential as a tool for individual dose adjustment based on neutrophil counts for which a tool is under development [2].
References: [1] Friberg LE., et al., J Clin Oncol; 20:4713-21, 2002. [2] Wallin J., et al., PAGE 15 (2006) Abstr 966 [www.page-meeting.org/?abstract=966]. [3] Wallin J., et al., PAGE 15 (2007) Abstr 1169 [www.page-meeting.org/?abstract=1169]. [4] Henningsson A., et al., Eur J Cancer; 39:1105-1114, 2003. [5] Sandström M., et al., J Clin Oncol; 23:413-21, 2005. [6] Sandström M., et al., J Clin Oncol; 58:143-56, 2006.
100
[7] Toffoli G., et al., J Clin Pharmacol; 52:511-519, 2001. [8] Legér F., et al., British J Cancer 90:343-347, 2004. [9] Bruno R., et al., J Pharmacokinet Biopharm; 24:153-72, 1996.
101
Poster: Applications- Oncology
Ron Keizer Population PK-PD modeling of E7820 and α2-integrin expression on platelets in patients with solid tumors and lymphomas
(1) Department of Pharmacy & Pharmacology, the Netherlands Cancer Institute / Slotervaart Hospital, Amsterdam, the Netherlands; (2) Eisai Limited, London, United Kingdom; (3) Division of
Clinical Pharmacoloy, Department of Medical Oncology, The Netherlands Cancer Institute, Amsterdam, the Netherlands; (4) Division of Drug Toxicology, Section of Biomedical Analysis, Department of Pharmaceutical Sciences, Faculty of Science, Utrecht University, Utrecht, The
Netherlands.
Introduction: The novel angiogenesis inhibitor E7820 was evaluated in a phase I dose escalation study in patients with malignant solid tumors or lymphomas, the clinical results of which have been reported previously.[1] Its anti-angiogenetic effects are exerted mainly by inhibition of the mRNA expression of α2-integrin. E7820 was administered daily for 28 days, followed by a washout period of 7 days prior to starting subsequent cycles. It is hypothesized that α2-integrin expression on platelets may be a biomarker for tumor growth inhibition in response to treatment with E7820.[2] The aim of this study was to develop a population PK-PD model for E7820 and its effect on α2-integrin platelet levels.
Methods: 1421 E7820 plasma samples were available from 37 patients, while 462 α2-integrin level measurements at 209 unique timepoints were available from 29 patients, collected from up to 9 treatment cycles. The population analysis was performed in NONMEM VI. First, a PK model was built and evaluated. Subsequently, effects of E7820 concentration on α2-integrin levels were modeled using an indirect response model with inhibition of input rate. Both linear and Emax-models for the concentration-effect relationship were tested. It was assessed if incorporation of delays in onset of PD response to drug exposure, or development of tolerance could be shown. By simulation from the developed model, several dosing strategies were evaluated for their effect on integrin expression levels.
Results: The final PK model was a one compartment model with linear elimination from the central compartment, while absorption was modeled using a turnover model. Final population parameter estimates were (RSE): clearance (CL/F) = 6.22 L/hr (13 %), volume of distribution (V/F) = 66.0 L (11%), mean transition time to the absorption compartment = 0.636 hours (7 %) and 3 transition compartments. Significant drug effects were observed, using either linear or Emax models. A sigmoid Emax model fitted the data best, with parameters estimates (RSE): Emax = 0.80 (20 %), IC50 = 755 ng/mL (8 %), and baseline integrin expression on platelets = 9060 molecules of equivalent soluble fluorochrome (9 %). Incorporation of transition compartments to model delays in drug-effect did not improve the model, nor did a model that incorporated development of tolerance to E7820. Marked differences in PD response (decrease of integrin expression levels) were observed for different simulated dosing regimens. Increasing dose frequency to bid or tid at the MTD level of 100 mg, shows small increases in PD response. When dosed at 50 mg, median PD response was <20% compared with dosing at MTD.
102
Conclusions: A population PK-PD model was developed describing the disposition of E7820 and the effects of exposure on expression of α2-integrin on platelets. This model was subsequently used for evaluation of different dosing strategies. For α2-integrin levels on platelets to serve as a biomarker for tumor growth inhibition in humans, the relationship between α2-levels on platelets, tumor growth and disease progression should be assessed further.
References: [1] Mita M. et al, 2006 ASCO Ann Meeting Proc I, vol 24, no 18S [2] Semba T. et al. Clin Cancer Res, Feb 2004, vol 10, p1430-1438
103
Poster: Applications- Oncology
stijn Koolen Population pharmacokinetics of intravenously and orally administered docetaxel with or without co-administration of ritonavir in patients with advanced
[1] Department of Pharmacy and Pharmacology, The Netherlands Cancer Institute / Slotervaart Hospital. [2] Division of Clinical Pharmacology, Department of Medical Oncology, The
Netherlands Cancer Institute. [3]Division of Drug Toxicology, Section of Biomedical Analysis, Department of Pharmaceutical Sciences, Faculty of Science, Utrecht University, Utrecht, The
Netherlands.
Objectives: Docetaxel has a low oral bioavailability due to affinity for P-glycoprotein and cytochrome P450 (CYP) 3A4 enzymes. Inhibition of CYP3A4 by ritonavir (RTV) results in boosted apparent oral bioavailability of more than 100%. The aim of this study was to evaluate the influence of RTV on the absorption, elimination of docetaxel and to assess the influence of the formulation vehicle, polysorbate80, on the disposition of docetaxel.
Methods: Data from two clinical studies (36 patients) were available and consisted of concentration time data of intravenously and orally administered docetaxel with or without co-administration of RTV. Plasma concentrations of both RTV and docetaxel were extensively monitored during the first 48 hours. Population modeling was performed using NONMEM. Starting point of the model development was a well described 3-compartment model for intravenous (iv) docetaxel [1,2]. The iv model was fitted to the data. Secondly, the oral data with or without co-administration of RTV were incorporated into the model. This was performed in a semi-physiological manner. The PK parameters of RTV of each individual were calculated using a previously developed PK model of RTV[3]. RTV was assumed to deactivate the enzyme involved in docetaxel clearance in a reversible and concentration dependent manner. The adequacy of the final model was evaluated with several graphical and numerical methods including a visual predictive check.
Results: Thirty-six patients were included in the two studies, and pharmacokinetic data were assessed from 72 treatment courses. The fraction absorbed increased from 14 to 29% (for RTV co-administration). The inhibition and re-activation of CYP3A4 by RTV occurred instantaneously and was best described by an equilibrium constant (Keq) of 0.12 mL/µg. The parameter estimates for the distribution volume of the central compartment differed significantly for iv (9.7L +/- 1L) and orally (74.7L +/- 17.6L) administered docetaxel which is probably caused by the formulation vehicle, polysorbate 80, a strong micelle forming agent. It was investigated whether a time-dependent increase in distribution volume could be identified, however this could not be established.
Conclusions: A pharmacokinetic model was successfully developed that described both the pharmacokinetics of orally and intravenously administered docetaxel in combination with RTV. The relatively small volume of distribution of iv administered docetaxel shows that polysorbate result in a decreased distribution to tissue.
104
It was shown that the high apparent bioavailability of docetaxel in combination with RTV could mainly be explained by strong inhibition of docetaxel elimination and for a small part by an increased fraction absorbed. The developed model will be used to establish optimal combination regimens and will be extended with PD data.
References: [1] Bruno, R. et al., J Pharmacokinet Biopharm 24, 153-172(1996). [2] Launay-Iliadis, M.C. et al., Cancer Chemother Pharmacol 37, 47-54 (1995). [3] Kappelhoff, B.S. et al., Br. J. Clin. Pharmacol. 59, 174-82 (2005)
105
Poster: Applications- Oncology
Katharina Küster Matuzumab – Evaluation of the Population Pharmacokinetic Model and Analyses of the Covariate Impact on the Pharmacokinetic Profile
K. Kuester(1,3), A. Kovar(2), C. Lüpfert(2), B. Brockhaus(2), C. Kloft(1,3) (1)Freie Universitaet Berlin, Dept Clinical Pharmacy, Berlin, Germany; (2)Merck KGaA, Dept Human Pharmacology, Darmstadt, Germany; (3)Martin-Luther-Universitaet Halle-Wittenberg,
Dept Clinical Pharmacy, Halle, Germany
Objectives: Matuzumab is a humanised monoclonal antibody of the immunoglobulin subclass IgG1 which targets the epidermal growth factor receptor (EGFR). A previously developed population pharmacokinetic (PK) model was to be evaluated and the impact of the covariate relation was to be analysed.
Methods: The developed model from 1256 serum concentrations (90 patients) had been analysed using the software program NONMEM (ADVAN6, TRANS1, TOL5 and the FOCE INTERACTION estimation method). For internal evaluation the bootstrap method, visual predictive checks (VPC: for single dosing and for multiple dosing, separately for each of the eleven dosing regimens) and case deletion diagnostics (CDD, deletion of either 10% of the study subjects [ID] or of 1 ID and reestimation of the parameters with the reduced datasets) were performed.
Results: The developed two compartment model, including a linear and a nonlinear elimination pathway, interindividual and interoccasion (IOV) variabilities and a covariate relation, showed its ability to accurately estimate all model parameters by the bootstrap method. The calculated bootstrap means, bias and relative bias (-3.9% and +4.7%) were obtained from 200 successful bootstrap runs. In the VPCs, the 90% prediction interval included most of the actual observed concentrations and the calculated medians were in accordance to the original data. CDD showed an influence of 1 ID on the IOV (without this ID the IOV value decreased by 17%). Closer examination revealed that the influence was due to 1 observation from this ID (neglecting this observation led to a reduction of 19% of the IOV). The influence of the covariate relation fat-free mass (FFM) on the linear clearance was analysed by simulation of all IDs receiving 1200 mg weekly. Observed and simulated interindividual variability in steady-state concentrations was reduced by a proposed adapted dosing regimen on a basis of mg per fat-free mass kg. The regimen comprised the original dosing (e.g. 1200 mg weekly) for the first 4 weeks followed by an adapted weekly dosing (based on the fractional covariate influence on total clearance) with 50% of the original amount (e.g. 600 mg) plus a proportionally adapted amount (e.g. 11.4 mg/kg FFM).
Conclusion: The population pharmacokinetic model for matuzumab has successfully been evaluated by different methods. The variability in simulated steady-state concentrations could be reduced by an adapted dosing regimen.
106
Poster: Applications- Oncology
Andreas Lindauer Population Pharmacokinetics of High-dose Carboplatin
Andreas Lindauer (1), Christiane Eickhoff (2), Charlotte Kloft (3,4), Ulrich Jaehde (1) (1) Dept. of Clinical Pharmacy, University of Bonn, Germany; (2) Center for Drug Information and Pharmacy Practice, Federal Union of German Associations of Pharmacists, Germany; (3) Dept. of
Clinical Pharmacy, University of Berlin, Germany, (4) Dept. of Clinical Pharmacy, University Halle-Wittenberg, Germany
Objectives: Carboplatin is widely used in the treatment of several malignancies. While for conventional dosing (approx. 400 mg/m²) several strategies have been reported to individualise carboplatin dose based on renal function measurements (e.g. creatinine clearance), such approaches in high-dose regimens are rare.[1-4] On a heterogeneous dataset with patients from five different studies, including 13 paediatric patients (age < 11 years), we performed a population pharmacokinetic analysis to investigate the influence of patient-specific factors on the pharmacokinetics of carboplatin.
Methods: Carboplatin was administered by intravenous infusions of varying duration (1 h, 24 h and 96 h). Daily doses ranged between 300 mg/m² to 2000 mg/m², median: 500 mg/m². A total of 1109 concentrations of ultrafilterable platinum from 69 patients were measured (5 to 81 observations/patient). Of 9 patients more than one chemotherapy cycle was included in the analysis. The following patient characteristics were available: age, body weight (BW), height (HGT), body surface area, serum creatinine, creatinine clearance (CLCR), sex, and co-medication with amifostine. A two-compartment model was fit to the data using NONMEM VI. Covariate selection was completed in two steps. First, generalized additive modeling and tree based modeling were applied to the base model as well as to 200 bootstrap replicates of the base model. Covariates that were considered important in the first step were tested within NONMEM by the backward deletion strategy.
Results: Intercycle variability for carboplatin clearance (CL) and central volume of distribution (V1) were estimated to be 19 and 14%, respectively. The following covariates were included in the final model: creatinine clearance on CL, infusion duration (DUR) on CL, HGT on CL and intercompartment clearance (Q), age on Q, BW on V1. Population parameter variability for CL was reduced from 50% in the base model to 21% in the final model. Carboplatin clearance in this population can therefore be calculated as follows: CL(L/h)=6.59 x (CLCR/103.1)0.57 x (HGT/176)1.43 x (1+DUR) , with DUR = 0 for a 1 h infusion; 0.224 for a 24 h infusion; 0.319 for a 96 h infusion.
Conclusions: Creatinine clearance, infusion duration and height were found to be important predictors of carboplatin clearance in our dataset. For dosing strategies aiming at a certain target AUC, precise estimation of patient's clearance is vital. The formula we provide could improve individual dosing for patients receiving high-dose carboplatin.
References: [1] Calvert AH, Newell DR, Gumbrell LA, O'Reilly S, Burnell M, Boxall FE et al. J Clin Oncol 1989; 7(11):1748-1756. [2] Chatelut E, Canal P, Brunner V, Chevreau C, Pujol A, Boneu A et al. J Natl Cancer Inst 1995;
107
87(8):573-580. [3] Joerger M, Huitema ADR, Richel DJ, Dittrich C, Pavlidis N, Briasoulis E et al. Clin Cancer Res 2007; 13(21):6410-6418. [4] Kloft C, Siegert W, Jaehde U. Br J Cancer 2003; 89(5):787-794.
108
Poster: Applications- Oncology
Antonin Schmitt External validation of a model based on cystatin C to predict carboplatin clearance
A. Schmitt(1), L. Gladieff(1), A. Lansiaux(2), C. Bobin-Dubigeon(3), M.C. Etienne(4), F. Pinguet(5), F. Serre-Debeauvais(6), A. Floquet(7), C. le Guellec(8), M. Boisdron-Celle(9), E. Billaud(10), N. Penel(2), M. Campone(3), R. Largillier(4), M. Fabbro(5), M. Mousseau(6), N.
Houede(7), P. Bougnoux(8), O. Capitain(9), J. Medioni(10), E. Chatelut(1). (1) Institut Claudius Regaud (Toulouse), (2) Centre Oscar Lambret (Lille), (3) Centre René Gauducheau (Nantes), (4) Centre Antoine Lacassagne (Nice), (5) Centre Val d’Aurelle Paul
Lamarque (Montpellier), (6) Centre Hospitalo-Universitaire de Grenoble, (7) Institut Bergonié (Bordeaux), (8) Centre Hospitalier Régional Universitaire de Tours, (9) Centre Paul Papin
(Angers), (10) Hopital Européen Georges Pompidou (Paris).
Objectives: The individual dosing of drugs that are mainly eliminated unchanged in the urine is made possible by assessing renal function. Carboplatin is one of the drugs for which elimination is most dependent on glomerular filtration rate (GFR). The formulas actually used for individual carboplatin dosing are all based on serum creatinine (SCr) as the unique biological covariate (together with demographical and morphological covariates) [1, 2]. Thomas et al. [3] recently proposed a formula including plasma cystatin C level (CysC), an other endogenous marker of GFR. A clinical trial was conducted in 12 centers, to identify pharmacodynamics covariates of toxicity. A first ancillary study was performed to assess the Thomas formula for prediction of carboplatin clearance (CL).
Methods: The patients were receiving 1 hour-infusion of carboplatin as part of established protocols. Samplings were done 5 min before the end of infusion, 1, and 4 hours after the end of infusion. A population pharmacokinetic analysis was performed using the nonlinear mixed effect modelling NONMEM program and FOCE estimation method. Data from 260 patients were used to evaluate Thomas formula, which takes into account SCr, CysC, body weight (BW), age and sex.
Results: In a first time, individual POSTHOC CL were compared to values predicted by the Thomas equation. The Mean Percentage Error (MPE) was 1% with [-25%; +37%] as 5th-95th percentiles, and the Mean Absolute Percentage Error (MAPE) was 14%. In a second time, a covariate analysis was performed. The best covariate equation was: CL(mL/min){vs. previous value of Thomas formula} = 105,5{110}*(SCr/75)-0,332{-0.512}*(CysC/1,00)-0,473{-0.327}
*(BW/65)0,616{0.474}*(age/56)-0,178{-0.387}*0,864{0.854}sex, with SCr in µmol/L, CysC in mg/L, BW in kg, age in years, and sex = 0 for male. Deletion of each covariate was associated with a significant increase of the objective function value (p<0.005). Finally, the model was validated by both a visual predictive check and bootstrapping with simulation on the external validation dataset.
Conclusions: External validation is the highest degree of validation for PK model. The Thomas formula has been validated at a multi-center level. These results confirm definitively the benefit of cystatin C as a marker of renal elimination of drugs. However, it should be used with other morphological and demographical covariates. Serum creatinine and cystatin C are not completely redundant marker of GFR.
109
References: [1] Calvert, A.H., et al., Carboplatin dosage: prospective evaluation of a simple formula based on renal function. J Clin Oncol, 1989. 7(11): 1748-56. [2] Chatelut, E., et al., Prediction of carboplatin clearance from standard morphological and biological patient characteristics. J Natl Cancer Inst, 1995. 87(8): 573-80. [3] Thomas, F., et al., Cystatin C as a new covariate to predict renal elimination of drugs: application to carboplatin. Clin Pharmacokinet, 2005. 44(12): 1305-16.
110
Poster: Applications- Oncology
Elena Soto A semi-mechanistic population pharmacokinetic/pharmacodynamic model for neutropenia following therapy with the new PLK-1 inhibitor BI 2536 and
its application in clinical development
Elena Soto(1), Alexander Staab(2), Christiane Tillmann(2), Dirk Trommeshauser(2), Holger Fritsch(2), Gerd Munzert(2) and Iñaki F. Trocóniz(1)
(1)Department of Pharmacy and Pharmaceutical Technology, School of Pharmacy, University of Navarra, Pamplona 31080, Spain; (2)Boehringer Ingelheim Pharma GmbH & Co. KG, Biberach,
Germany
Background & Objectives: BI 2536 represents the first in a class of small molecules targeting and blocking activation of Polo-like kinase 1 currently under early clinical development in oncology. The first objective of this analysis was to describe the pharmacokinetic (PK) properties of BI 2536 in humans and to correlate the PK with the neutropenic effects of BI 2536 observed in cancer patients using a semi-mechanistic modeling approach. The second objective was to use the model for simulations to support clinical development of BI 2536.
Methods: BI 2536 was administered as intravenous infusion over 60 minutes in the dose range from 25 to 250 mg. Three different administration schedules were explored: (i) day 1, (ii) days 1, 2 and 3 or (iii) days 1 and 8 within a three week treatment cycle. Plasma concentrations of BI 2536 in plasma and absolute neutrophil cell counts obtained during the first treatment cycle from 104 patients with advanced solid tumours were analyzed using the population approach with NONMEM VI. Simulations were performed to address among other aspects the impact of the tested administration schedules on the neutropenic effects of BI 2536 assuming a large patient population and the possibility to reduce the cycle duration from three to two weeks with administration at day 1.
Results: A three compartment model described the disposition of BI 2536 in plasma. BI 2536 showed a linear PK behaviour over the dose range studied. The neutropenic effects were described by a semi-mechanistic model resembling proliferation, maturation, degradation, homeostatic, and drug action processes. The administration schedules of a single 60 minutes infusion of 200 mg at day 1, or 100 mg at days 1 and 8 as well as 60 mg at days 1, 2 & 3 elicit an acceptable risk of neutropenia, with percentage of patients showing neutropenia grade 4 at all or for more than 7 consecutive days of less than 22 and 7%, respectively. In addition it could be shown that for the day 1 administration scheme the cycle duration could be reduced to 14 days without a relevant increase in the percentage of patients developing a grade 4 neutropenia.
Conclusions: A semi-mechanistic population PK-neutropenic response model for BI 2536 was successfully developed. The model was used for various simulations and was a very helpful tool to support further clinical development.
111
Poster: Applications- Oncology
Kellie Turner Reduced Folate Carrier Single Nucleotide Polymorphism Associated with Methotrexate Clearance in Breast Cancer Patients
P.K. Turner (1), M. Cole (1), A. Petain (2), M.A. Batey (1), S.L. Beare (1), É. Chatelut (2), A.V. Boddy (1)
P.K. Turner (1), M. Cole (1), A. Petain (2), M.A. Batey (1), S.L. Beare (1), É. Chatelut (2), A.V. Boddy (1)
Objective: Previously we have developed a population pharmacokinetic (PK) model for methotrexate (MTX) in breast cancer patients [1]. This model included covariates such as renal function (i.e., glomerular filtration rate, GFR) and body size. Reduced folate carrier (RFC) is a ubiquitously expressed transmembrane protein that transports both folates and MTX into cells. SNP's in genes involved in MTX PK such as reduced folate carrier (RFC) may also be significant covariates in population PK models. The aim of the present study was to identify SNP's that explain interindividual variation in MTX PK.
Methods: DNA was isolated from tumour blocks. SNP's in drug metabolizing enzymes important in MTX PK were genotyped using TaqMan genotyping assays. We used nonlinear mixed effects modelling software (NONMEM version VI) to refine the previously published MTX population PK model. A two-compartment model was fit to the MTX plasma concentration-time data. We investigated the influence of patient covariates (e.g., RFC genotype and GFR) on MTX PK parameters.
Results: The patient population consisted of 35 breast cancer patients. We identified a SNP (rs12659) in RFC with novel functional significance. The genotype frequencies were in Hardy-Weinberg equilibrium. Mean MTX clearance in patients homozygous for the G allele was significantly lower than in carriers of the A allele (126 vs. 152 mL/min, p= 0.04, Mann-Whitney U Test). The population PK model for MTX clearance was significantly improved by including RFC genotype as a covariate instead of GFR. Including both RFC genotype and GFR as covariates did not significantly improve the model over genotype alone.
Conclusion: We have demonstrated that RFC genotype is a more significant covariate in MTX clearance than GFR. These results may contribute to therapeutic individualization and optimization in a variety of cancers with an aim towards improving survival and reducing toxicity. This work is supported by Department of Health, Institut National du Cancer, and Cancer Research UK.
Reference: [1] Batey MA, Wright JG, Azzabi A, Newell DR, Lind MJ, Calvert AH, Boddy AV. Population pharmacokinetics of adjuvant cyclophosphamide, methotrexate and 5-fluorouracil (CMF). Eur J Cancer 2002, 38, 1081-1089.
112
Poster: Applications- Other topics
Corina Becker Whole-Body Physiologically-based Pharmacokinetic (WB-PBPK) Population Modelling to Simulate the Influence of Weight and Age on the
Pharmacokinetics (PK) of a combined Oral Contraceptive Containing Drospirenone (DRSP) and Ethinylestradiol (EE)
C. Becker(1), K. Coboeken(1), L. Kuepfer(1), J. Lippert(1), R. Nubbemeyer(2), H. Blode(2) (1) Bayer Technology Services GmbH, Competence Centre Systems Biology, D-51368 Leverkusen,
Objectives: Obesity has reached epidemic proportions. WHOs latest projections indicate that in 2005 approximately 1.6 billion adults were overweight.(1) The body fat fraction is an important determinant of the PK and can become the dominant factor for highly lipophilic compounds such as steroids. This study aimed to use a WB-PBPK model to investigate the influence of age and weight on the PK to be expected after administration of a fixed dose combination of EE and DRSP in a combined oral contraceptive (COC).
Methods: WB-PBPK models were built for DRSP and EE using the software PK-Sim®.(2,3) The simulated plasma concentration-time profiles were validated using observed data from 48 women.(4-6) In a second step, the PK-Pop module of PK-Sim® was used to build virtual populations of normal weight, overweight, obese and highly obese females aged 14-45 yrs using the body mass index (BMI) to discriminate between weight groups. Steady state (SS) PK parameters (AUC, Cmax, Ctrough, t1/2) and concentration time profiles of DRSP and EE were compared between the different virtual populations.
Results: The WB-PBPK model matched the experimentally measured concentration-time profiles and derived PK parameters in the validation population(4-6) comprising women with slight underweight to slight overweight very well. Age-related differences of PK parameters were not observed for DRSP and EE in women >14 yrs. Plasma AUC and Ctrough were simulated to be similar for both compounds at SS across the different BMI groups. In silico tissue distribution suggest a substantial distribution of both hormones in fat resulting in a decrease in the EE Cmax to Ctrough ratio and a decrease of Cmax and Ctrough of DRSP in the obese compared to the normal weight population. Nevertheless, a prospective post-marketing surveillance study found DRSP/EE containing COCs to be equally effective in obese and non-obese populations.(7)
Conclusions: The WB-PBPK population modelling approach provided an excellent description of the experimental data. Our analysis complements the classic population PK approach since we could mechanistically study the influence of co-factors like age or BMI. The possibility to predict tissue concentrations enables model-based PK/PD predictions for populations of interest not covered by available clinical data.
References: [1] World Health Organization (WHO) Obesity and Overweight pages http://www.who.int/topics/obesity/en/ [2] Willmann, S., Lippert, J., Sevestre, M., Solodenko, J., Fois, F., Schmitt, W. 2003 Biosilico. PK-Sim: A physiologically based pharmacokinetic ‘whole-body’ model. 1(4):121–124 [3] PK-Sim® 4.0, Software Package for physiology-based pharmacokinetic (PBPK) Modelling.
113
Bayer Technology Services, 2008 [4] Bayer Schering Pharma Clinical Study Report 8235 [5] Bayer Schering Pharma Research Report A734 [6] Bayer Schering Pharma Clinical Study Report A03328 [7] Dinger, J., Heinemann, L.A.J., Westhoff, C., Cronin, M., Schellschmidt, I. ACOG 2007 (Poster) Contraceptive efficacy of oral contraceptives in real world clinical practice: The impact of age, weight, BMI, dose, and duration of use.
114
Poster: Applications- Other topics
Misba Beerahee Clinical Trial Simulation to Estimate the Sample Size for Investigation of the Impact of a Drug A on the Pharmacokinetics of Methotrexate,
a common co-medication used in Rheumatoid Arthritis (RA)
Shuying Yang and Misba Beerahee GlaxoSmithKline, Clinical Pharmacology Modelling & Simulation, UK
Objectives: Due to the widespread background use of methotrexate (MTX) in RA patients and the observed systemic exposure related adverse events driven by MTX, there is a need to evaluate potential impact of any add-on therapy, such as Drug A, on the PK of MTX. Although risk assessment on metabolic pathways of these two drugs (MTX and Drug A) indicates unlikely drug-drug PK interaction, there is a clinical/regulatory need to evaluate any interaction before embarking in a large patient study. Therefore, we proposed to design a sub-study within a large phase IIb study to address any drug interaction liability between the two drugs thereby obviating the need to perform sequential studies. A clinical trial simulation strategy based on population PK modelling with sparse sampling schemes is used to estimate the sample size required to adequately examine the possible impact of Drug A on the PK of MTX.
Methods: Preliminary assessment indicated that any likely (if at all) effect of Drug A on the PK of MTX, would possibly be from a bioavailability standpoint. A population PK model for MTX was developed using historical in house data in RA patients. Using this model an optimal design strategy was applied to determine the optimal sampling windows within the design scope of the multi-centre phase IIb study. Clinical trial simulations based on a parallel design, in conjunction with the population PK modelling were subsequently applied to evaluate the sample size needed to assess the possible influence of Drug A on the bioavailability of MTX under the standard bioequivalence criteria.
Results: A two-compartment, first order absorption model with proportional residual error adequately described the systemic PK of MTX. With the five population PK parameters, five optimal sampling windows were selected using the optimal design softwares, PopDes and PopED. Under parallel design with equal number of subjects allocated to two arms: Drug A+ MTX and Placebo+MTX, total number of subjects in each trial ranging from 40 to 100 were studied. The steady state PK data of MTX for each subject was simulated using the population PK model. Individual simulated data for each trial were subjected to population PK analysis to estimate the relative bioavailability of MTX between the two groups using standard bioequivalence criteria. Additional explorations included estimation of power for the corresponding sample size and influence of PK variability of MTX on the sample size.
Conclusions: It is possible to apply population PK modelling, in conjunction with optimal design and clinical trial simulation to determine the sample size to explore possible drug-drug interactions. The sample sizes determined based on the method proposed are significantly less than that based on the conventional study design using non-compartmental analysis, under same assumptions.
115
Poster: Applications- Other topics
Pascal Chanu Decisive support of Modeling & Simulation for getting drug approval in the context of safety concern on the drug class
Pascal Chanu (1), Bruno Reigner (1), Nathalie Schultze (1), Ronald Gieschke (1), Nicolas Frey (1) (1) F. Hoffmann-La Roche Ltd, Basel, Switzerland
Background: Exogenous replacement of erythropoietin by the recombinant hormone, epoetin, is a well-accepted therapy for treatment of anemia in patients with chronic kidney disease (CKD). C.E.R.A, is a new erythropoietin stimulating agent (ESA). In April 2006, a Biological License Application (BLA) was submitted to the US-FDA. In 2007, due to reports of cardiovascular risks associated with high hemoglobin (Hb) levels [1,2], the FDA mandated a labeling change for all ESAs, abolishing longstanding dosing instructions based on Hb targets, specifying instead that the drugs should be administered at the lowest level that avoids transfusions and placing a 12 g/dL ceiling on achieved Hb levels. Phase III trials for C.E.R.A., developed in consultation with FDA, used a Hb target range of 11 to 13 g/dL.
Objectives: To explore, using clinical trial simulations, efficacy and safety clinical outcomes of non-tested dosing regimens and dose adjustment rules for C.E.R.A. in support of the SmPC (Summary of Products Characteristics).
Methods: A population pharmacokinetic/pharmacodynamic model [3,4,5] has been developed in NONMEM 5, using data from three Phase III studies in 400 CKD patients. Its predictive performance was assessed with visual predictive checks after implementation of the model and complex Phase III dose adjustment schemes in Trial Simulator 2.2. Exploratory trial simulations were then performed to investigate different starting doses and dose adjustment rules in accordance with latest recommendations.
Results: The model described the time courses of drug concentrations of C.E.R.A and Hb after subcutaneous and intravenous administrations in both ESA-treated and naïve patients with CKD. Its predictive performance was confirmed by showing that observed results from Phase III studies could be reproduced using simulations for two selected endpoints (Hb time course, occurrence of Hb values > 13 g/dL). Clinical trial simulations were then used to support the proposed starting dose and modified dose adjustment rules: the simulated occurrence of Hb values greater than 13 g/dL was considerably reduced while efficacy was maintained.
Conclusions: The Modeling & Simulation results were supportive to address the safety concern and provided data that were used to support the dosing instructions sections in the labels. C.E.R.A. was approved in 2007 at EMEA and FDA.
References: [1] Singh AK, Szczech L, Tang KL, Barnhart H, Sapp S, Wolfson, Reddan D. Correction of anemia with epoetin alfa in chronic kidney disease. New England Journal of Medicine, 2006; 355: 2085-98 [2] Drüeke TB, Locatelli F, Clyne N, Eckardt KU, Macdougall IC, Tsakiris D, Burger HU, Scherhag A. Normalization of hemoglobin level in patients with chronic kidney disease and anemia. New England Journal of Medicine, 2006; 355: 2071-84 [3] Uehlinger DE, Gotch FA, Sheiner LB. A pharmacodynamic model of erythropoietin therapy for
116
uremic anemia. Clinical Phramacology and Therapeutics, 1992; 51: 76-89 [4] Krzyzanski W, Ramakrishnan R, Jusko WJ. Basic pharmacodynamic models for agents that alter production of natural cells. Journal of Phramacokinetics and Biopharmaceutics, 1999; 27: 467-89 [5]Krzyzanski W, Jusko WJ, Wacholtz MC, Minton N, Cheung WK . Pharmacokinetic and pharmacodynamic modeling of recombinant human erythropoietin after multiple subcutaneous doses in healthy subjects. European Journal of Pharmaceutical Sciences, 2005; 26: 295-306
117
Poster: Applications- Other topics
Chao Chen Population PK/PD modelling of functional receptor occupancy in a first-time-in human study
C. Chen (1), A. MacDonald (1) (1) Clinical Pharmacology Modelling and Simulation, GlaxoSmithKline, Greenford, Middlesex,
United Kingdom
Objectives: To characterise the pharmacokinetic-functional receptor occupancy relationship of a novel anti-inflammatory in healthy volunteers in a single ascending dose first-time-in-human study. Receptor occupancy was estimated by reduction in ex vivo stimulation of a membrane protein marker on a specific leukocyte sub-type in whole blood. The purpose of the modelling effort was to confirm in vitro predictions from the same assay and establish the concentration-effect relationship for dose prediction in subsequent studies. In addition, we wanted to estimate the most sensitive ligand concentration in the assay for future studies with the molecules in this target class.
Methods: A randomised, single blind, placebo-controlled, cross-over single dose study was conducted in healthy subjects over the dose-range 2-1100 mg. In addition, effects of food, age and gender were studied. The population PK/PD analysis was performed using NONMEM V utilising all data obtained in the study. A two-step sequential PK/PD methodology was employed. Various compartmental pharmacokinetic models were fitted to the population data. A physiological, competitive inhibition pharmacodynamic model was fitted to the receptor occupancy data, accounting for relationship between stimulating ligand and drug concentration and effect.
Results: A two-compartment PK model including an absorption time lag, mixed first and zero order absorption, plus dose-dependent non-linear functions for bioavailability and absorption rate was required to adequately describe the data across the full dose range. The pharmacodynamic model adequately described the PD time course. The apparent KI for inhibition of protein marker expression was 69 ng/mL. Inter-occasion variability was apparent in baseline protein levels and Km for the stimulating ligand (typical value range 17-36 nM). The adequacy of the model was confirmed by steady state data. The ex-vivo receptor occupancy data concurred with the pre-clinically determined in vitro results.
Conclusion: A mechanistic PK/PD model of target receptor occupancy of a novel anti-inflammatory was developed from data obtained in healthy volunteers in a first-time-in-human study. The model has been successfully used for simulating subsequent phase I clinical study scenarios. In vitro pharmacodynamic data from different patient populations can be incorporated into the model to estimate patient-healthy subject PK/PD differences a priori. In addition, the identification of the most sensitive ligand concentration led to an appreciable simplification of the assay.
118
Poster: Applications- Other topics
Emmanuelle Comets Modelling is seldom used to describe pharmacokinetics in phase I clinical trials
Emmanuelle Comets (1), Sarah Zohar (2,3) (1) Inserm, U738, Paris, France; Université Paris 7, Faculté de Médecine, Paris, France; (2)
Inserm CIC 9504, Centre d'Investigations Cliniques, Hôpital Saint-Louis, Paris, France; (3)Inserm U717, Département de Biostatistique et Informatique Médicale, Hôpital Saint-Louis, Paris, France
Objectives: During the drug development process, phase I trials are the first occasion to study the pharmacokinetics (PK) of a drug. They are performed in healthy volunteers, or patients in oncology, and are designed to determine a safe and acceptable dose for the later phases of clinical trials. We performed a bibliographic survey to investigate the way PK is described and reported in phase I clinical trials.
Methods: We performed a MEDLINE search to retrieve the list of papers published between 2005 and 2006 and reporting phase I clinical trials with a PK study. We read a third of these papers, randomly selected, using a spreadsheet to record general information concerning the study, and specific information regarding the PK.
Results: Nearly all the papers in our review concerned cancer studies, although this was not a requirement in the search. Consistent with the selection process, 8 out of 10 papers explicitely stated PK as an objective of the study. The methods section usually included a description of the PK (83%), but 12% of the papers provided no information concerning the methods used for the PK, and in 6% the description was only partial. The analysis method was usually basic, and modelling was used only in about 15% of the studies. Observed concentrations and area under the curves were the PK variables most often reported.
The results of the PK study were frequently reported in a separate paragraph of the results section, and only around 15% of the studies related the PK findings to other results from the study, such as toxicity or efficacy. In addition, important information such as the number of patients included in the PK study was often not reported explicitely.
Conclusions:Concerns about the decreasing cost-effectiveness in the drug development process prompted the regulatory authorities to recently recommend a better integration of all available information, including in particular PK. In our review we found that this information was often either missing or incomplete, which hinders that objective. We suggest several improvements to the design and the reporting of methods and results for these studies, to ensure all relevant information has been included. PK findings should also be integrated in the broader perspective of drug development, including for instance the modelling of their relationship with toxicity and/or efficacy, even in early phase I stages.
119
Poster: Applications- Other topics
Mike Dunlavey Simplified programming of population model user interfaces
Mike Dunlavey Pharsight Corp.
Objectives: Simplify the programming of user interfaces for Pop PK/PD modeling.
Methods: A differential execution algorithm allows a "painting" paradigm (called Dynamic Dialogs) as an alternative to event-based programming.
Results: Volume of source code for simple user interfaces is reduced by an order of magnitude. Complex, structurally varying user interfaces can be much more easily programmed than by other methods.
Conclusions: Dynamic dialogs are the basis for a number of user interfaces, as in the TS drug model editor, and in the new WinNonlin drug model editor.
References: [1] Dunlavey, M.: Differential Evaluation: A Cache-Based Technique for Incremental Update of Graphical Displays of Structures, Software Practice and Experience 23 871--893 (1993) [2] Dunlavey, M.: Lightweight Coding of Structurally Varying Dialogs, DSV-IS 2008 [3] Dunlavey, M.: Project DynDlgDemo, http://sourceforge.net (2007)
120
Poster: Applications- Other topics
Yumi Emoto Evaluation of Population PK/PD for Osteoporosis during a Vitamin D3 (1,25(OH)2D3) Derivative Therapy
Yumi Emoto, Satofumi Iida, Hidenobu Aso, Haruki Kinoshita Dept. of Clinical Pharmacology, Chugai Clinical Research Center, Tokyo, Japan
Objectives: The purpose of this analysis was to characterize the relationship between pharmacokinetics (PK, concentration of Vitamin D3 (1,25(OH)2D3) derivative) and pharmacodynamics (PD, Lumbar Bone Mineral Density; BMD) in the treatment of osteoporosis with a vitamin D3 (1,25(OH)2D3) derivative.
Methods: Data from four clinical studies were used in this analysis: 1) An open-label cross-over study in 12 healthy volunteers at 1 ug; 2) An open-label daily oral administration study in 24 healthy volunteers at a dosage of 0.1, 0.25, 0.5 and 1 ug; 3) An open-label daily administration, 24 week study in 106 patients with osteoporosis (dosage of 0.25, 0.5, 0.75 and 1 ug); and 4) A double-blind placebo control daily administration 48 week study in 158 patients with osteoporosis at 0.75 ug. In total, 1397 plasma samples from 300 subjects were obtained for PK analysis from all four studies and 680 BMD data from 264 patients were obtained for PD analysis from two clinical studies where osteoporosis patients were enrolled. The plasma drug concentrations were determined by LC/MS/MS and BMD data were measured by dual-energy-X-ray absorptiometry (DXA) to assess PD. This population PK/PD model analysis was performed by sequential methods using NONMEM VI.
Results: The final PK/PD model consists of a one compartment model with first order absorption and a turnover PD model in which the plasma drug concentration inhibits bone loss (Kout). A linear disease progression model including the initial value of endogenous vitamin D3 as a covariate best described the BMD decrease profile. The PK/PD model was validated both by a visual predictive check and by a numerical predictive check. Additionally, the PK/PD model was explained biologically by dose-dependent suppression of the bone loss markers (tDPD, CTx, NTx) and the linear disease progression model was confirmed by analysis using placebo data.
Conclusions: A PK/PD model has been developed which shows linear disease progression during 48 weeks treatment with a vitamin D3 (1,25(OH)2D3) derivative. The model is likely to be useful for predicting the percentage change in BMD after administration of a vitamin D3 (1,25(OH)2D3) derivative.
References: [1] Matsumoto T, et al. A new active vitamin D, ED-71, increases bone mass in osteoporotic patients under vitamin D supplementation: a randomized, double-blind, placebo-controlled clinical trial. J Clin Endocrinol Metab (2005) 90(9):5031-6.
121
Poster: Applications- Other topics
Samuel Fanta Population Pharmacokinetics of Cyclosporine in Paediatric Renal Transplant Recipients
S. Fanta(1), S. Jönsson(2), M.O. Karlsson(3), C. Holmberg(4), K. Hoppu(1), J.T. Backman(1) (1) Department of Clinical Pharmacology, Helsinki University Central Hospital, Helsinki, Finland;
(2) Medical Products Agency, Uppsala, Sweden; (3) Department of Pharmaceutical Biosciences, Division of Pharmacokinetics and Drug Therapy, Uppsala University, Uppsala, Sweden; (4)
Paediatric Nephrology and Transplantation, Hospital for Children and Adolescents, Helsinki, Finland
Objectives: Cyclosporine is a drug with a narrow therapeutic index and large interindividual variability in pharmacokinetics. Therefore, after renal transplantation, the individual dose is established by monitoring the cyclosporine exposure, mainly by trough (C0) based monitoring. This study aimed to characterize the effects of demographic and clinical covariates on cyclosporine pharmacokinetics in renal transplanted children in order to improve the possibilities of individualization of cyclosporine dosing.
Methods: Pharmacokinetic modelling was performed in NONMEM using a dataset comprising 162 renal transplanted children (age: 0.36-20.2 years). Before transplantation, cyclosporine was given i.v. (3 mg/kg) and p.o. (10 mg/kg) on separate occasions followed by blood sampling for 24 h. After transplantation, cyclosporine was given i.v. immediately after transplantation and p.o. thereafter, with individually adjusted doses. Blood sampling was carried out at trough (C0) and occasionally also two hours after dosing (C2). The follow-up time after transplantation was 0-16.2 years.
Results: A three-compartment model with first order absorption best described the pharmacokinetics of cyclosporine. The typical value of clearance (for a typical 13 kg patient) was 5.8 L/h, the volume of distribution at steady state was 26 L, and the oral bioavailability (F) before transplantation was 0.31. The F changed with time after transplantation. This effect was modelled as a Bateman function. For the average patient, the maximal F was 0.55 and was reached one month after transplantation. Afterwards the F decreased to reach the pretransplantatation value of 0.31 in one year after transplantation. In addition, the patients who were dosed twice daily had constantly a 24% higher F than patients who were dosed thrice daily. With increasing body weight and serum creatinine, cyclosporine clearance (CL) and volume (V) parameters increased. With increasing plasma cholesterol and haematocrit, CL and V parameters decreased. The interoccasion variability was estimated to be about the same size as the interindividual variability for both CL (13% vs. 11%, CV%) and F (0.07 vs. 0.06, SD).
Conclusions: The bioavailability of cyclosporine changes dramatically in the first year after transplantation. The high interoccasion variability in pharmacokinetics makes individualization of cyclosporine dosing difficult and is likely to reduce the value of sparsely occurring therapeutic drug monitoring.
122
Poster: Applications- Other topics
Dymphy Huntjens Receptor-mediated pharmacokinetic modeling of a novel anti-epileptic drug in healthy volunteers
Dymphy Huntjens (1), Kevin Shalayda (2), An Vermeulen (1) (1) Johnson & Johnson Pharmaceutical Research & Development; Beerse, Belgium, (2) Johnson &
Johnson Pharmaceutical Research & Development; Raritan, NJ, USA
Objectives: The development of a pharmacokinetic model for a novel anti-epileptic compound JNJ26990990 that exhibits target-mediated drug disposition (TMDD) in plasma and red blood cells.
Methods: The population PK analysis of JNJ26990990 plasma and red blood cell concentrations on rich data from a phase I multiple ascending dose study in 30 healthy volunteers. Several compartmental population pharmacokinetic models were explored using nonlinear mixed effects modelling (NONMEM). A set of ordinary differential equations was used to describe the system. Age, race, body weight were incorporated in the models to test as potential covariates. A next step was the comparison of the ODE model with a model described by a set of stochastic differential equations (SDE). Moreover it was investigated whether SDE could identify a TMDD model compared to a general n-compartmental model. Model evaluation was examined using goodness of fit plots, relative error measurements, and visual predictive checks.
Results & Conclusions: A pharmacokinetic model with receptor association (Kon) and dissociation (Koff) best described the non-linear drug disposition in red blood cells and plasma. The value of the Kd is close to reported estimates of receptor affinity in vitro confirming the validity of the mechanism-based PK model. Model evaluation for the SDE analysis is ongoing and results will be presented.
123
Poster: Applications- Other topics
Daniel Jonker The pharmacokinetics of the once-daily human glucagon-like peptide-1 analogue, liraglutide, across 5 trials in healthy subjects and type 2
diabetics after single and multiple dosing
Estelle Watson, Daniël M. Jonker, Steen H. Ingwersen Biomodelling Department, Novo Nordisk, DK-2880 Bagsværd, Denmark
Objectives: The aim of this study was to investigate the pharmacokinetics (PK) of liraglutide in healthy subjects and in type 2 diabetic patients after a single dose and multiple dosing.
Methods: A population PK model was developed using NONMEM in a stepwise fashion, initially based on a single trial in healthy volunteers (HV). Data from 3 trials in type 2 diabetic (T2D) subjects receiving each a single subcutaneous (sc) dose was then added to the analysis set and the model re-evaluated. Finally, the PK model based on these four intensively sampled trials was applied to a fifth, sparsely sampled phase 2 trial in T2D subjects that were dosed once daily.
Results: The PK of liraglutide in HV was adequately described using a one compartment model with first order elimination and sequential zero-and first-order absorption. The absorption of liraglutide following sc administration was slow, with peak concentrations occurring at 9-12 hours post-dosing. The elimination half-life of liraglutide was estimated to be 13 h, which is longer than the half-life observed after intravenous administration (8.1 h), indicating that slow absorption contributes to the prolonged exposure to liraglutide. In T2D subjects, essentially the same exposure profile was estimated after single sc doses, except for a slightly higher peak concentration due to a difference in absorption kinetics. On the analysis set with single dose data in HV and T2D, V/F was estimated to be 0.16 L/kg (rSE 43%, BSV 47%), and CL/F 0.013 L/hr kg-1 (rSE 4.8%, BSV 37%).The exposure observed after multiple sc doses with sparse sampling did not allow independent estimation of the full PK model, but the data was consistent with simulations based on single dose data.
Conclusions: Liraglutide has a similar exposure in healthy volunteers and type 2 diabetics that is consistent with a once daily dosing regimen. Slow absorption kinetics contributes to the prolonged exposure profile.
124
Poster: Applications- Other topics
Catherijne Knibbe Predictive Value of Allometric Scaling for Estimation of Propofol Clearance in Neonates, Infants and Adolescents
Mariska Y.M. Peeters(1), Karel Allegaert(2), Heleen Blussé van Oud-Alblas(3,4), Massimo Cella(5), Dick Tibboel(4), Meindert Danhof(5), Catherijne A.J. Knibbe(1,4,5)
(1)Department of Clinical Pharmacy, St. Antonius Hospital, Nieuwegein, the Netherlands; (2)Neonatal Intensive Care Unit, University Hospitals, Leuven, Belgium; (3)Department of
Anesthesiology, Erasmus MC-Sophia Children’s Hospital, Rotterdam, the Netherlands; (4)Department of Pediatric Surgery, Erasmus MC-Sophia Children’s Hospital, Rotterdam, the Netherlands; (5)Leiden/Amsterdam Center for Drug Research, Leiden University, Leiden, the
Netherlands
Objectives: For propofol, allometric scaling has been applied successfully for between species (rat-humans) and within-human (children and adults) extrapolations, yielding an allometric scaling factor of 0.78 for clearance [1], which is not significantly different from the 0.75 factor for clearance reported in the literature. In the current study, the predictive value of this allometric equation for estimation of propofol clearance was evaluated in (preterm) neonates, infants and adolescents.
Methods: The predictive value of the allometric equation [1] was evaluated using the following datasets. 1.) 25 (pre)term neonates (2930 (range 680-4030) g, PMA 38 (27-43) weeks, PNA 8 (1-25) days) admitted to the Neonatal Intensive Care Unit who received 3 mg/kg propofol just before removal of the chest tube [2], and 2.) 22 nonventilated infants (aged 10 months (3.8-17.3 months), 8.9 kg (4.8-12.5)), admitted to the Pediatric Intensive Care Unit following craniofacial surgery, who received propofol (2-4 mg·kg-1·h-1) during a median of 12,5 (6.0-18.1) hours [3], and 3.) 14 adolescents (aged 14.7 (9.8-20.1) yrs and 51 (36.6-82) kg), who were anaesthesized with propofol-remifentanil during 6.8 (3.3-7.7) hours. The median percent error of the predictions was calculated according to the equation %error = ((Cli - Clallometric)*100)/ Cli, in which CLi is the individual predicted propofol clearance value based on population pharmacokinetic models of neonates, infants and adolescents, and Clallometric is the predicted propofol clearance value using the allometric equation [1].
Results: The allometric equation systematically overpredicted individual propofol clearances in neonates with a median percent error of -288 (-8466-50)% and systematically underpredicted individual propofol clearances in infants (median percent error of 43 (26-64)%). In adolescents the model performed adequately (median percent error -16 (-46-15)%).
Conclusions: Because of systematic overprediction of propofol clearance in neonates and systematic underprediction in infants, allometric scaling using a fixed factor of 0.75 can not be used for the prediction of clearance in neonates and infants. While allometric scaling has been successfully applied between different species and between adults and adolescents, new approaches are required for young infants and (preterm) neonates.
References: [1] Knibbe CA et al. Br J Clin Pharmacol. 2005 Jun;59(6):705-11
125
[2] Allegaert K. et al. Br J Anaesth. 2007 Dec;99(6):864-70 [3] Peeters MY et al. Anesthesiology. 2006 Mar;104(3):466-74
126
Poster: Applications- Other topics
Elke Krekels Development AND External validation of a model for Glucuronidation in children below 3 years of age using morphine as a model drug; towards a novel
dosing paradigm.
Elke H.J. Krekels1,2, Gijs W.E. Santen1, John N. van den Anker2,3, Joost de Jongh1,4, Evelyne M. Jacqz-Aigrain5, Caroline D. van der Marel2,6, Richard A. van Lingen7, Anne M. Lynn8, Monique
van Dijk2, Sinno Simons2, Meindert Danhof1, Dick Tibboel2, Catherijne A.J. Knibbe1,2,9 1. Division of Pharmacology, Leiden/Amsterdam Center for Drug Research, Leiden, The
Netherlands; 2. Department of Pediatric Surgery, Erasmus MC-Sophia Children’s Hospital, Rotterdam, The Netherlands; 3. Division of Pediatric Clinical Pharmacology, Children's National
Medical Center, Washington, DC, USA; 4. LAP&P consultants, Leiden, The Netherlands; 5. Department of Pediatric Pharmacology and Pharmacogenetics, Hopital Robert Debre, Paris,
France; 6. Department of Anesthesiology, Erasmus MC, Rotterdam, The Netherlands; 7. Princess Amalia Department of Pediatrics, Division of Neonatology, Isala Clinics, Zwolle, The Netherlands;
8. University of Washington School of Medicine, Childrens’s Hospital and Regional Medical Center, Seattle, WA, USA 9. Department of Clinical Pharmacy, St. Antonius Hospital, Nieuwegein,
The Netherlands
Objectives: In pediatrics, drugs are often dosed in mg/kg, regularly requiring higher or lower dosages per kg with increasing age. To derive rational dosing schemes we developed a population PK model that described the influence of age on glucuronidation capacity by the UGT2B7 enzyme in newborns, including preterms, and infants younger than 3 years using morphine and its two major metabolites as a model drug. The model was validated both internally and externally.
Methods: Based on a meta-analysis of sparse data, a population pharmacokinetic model was developed using NONMEM. The data included 2159 concentrations of morphine and its glucuronides from 248 infants weighing 500 g to 18 kg receiving intravenous morphine as a bolus dose or continuous infusion [1,2]. Using the NPDE method as proposed by Brendel et al. [3] the model was validated both internally and externally to various datasets.
Results: Formation clearances of morphine to its glucuronides and elimination clearances of the glucuronides were adequately described using an allometric equation based on bodyweight, with an estimated exponential scaling factor of approximately 1.5. A postnatal age of less than 10 days was identified as an additional covariate for formation clearance to the glucuronides. Distribution volumes scaled linearly with bodyweight. The internal and external validation procedure demonstrated that morphine and its metabolite concentrations in the individual patient can be predicted based on dosing regimen, postnatal age and bodyweight alone, thereby proving that the model can be used for simulations and the development of new dosing regimens.
Conclusions: The validated model shows that a loading dose in μg/kg and a maintenance dose expressed in μg/kg1.5/ h-1, with a 50% maintenance dose reduction in newborns younger than 10 days, results in a narrow range of morphine and metabolite serum concentrations throughout the studied age-range. Once the target concentrations across this age-range have been determined, this model can be used to establish final dosing recommendations. Additionally, future cross-validation studies have to reveal whether the results from this study can be extrapolated to other drugs metabolized by the same enzyme.
127
References: [1] Van Dijk et al. PAIN 98(3); 305-313 (2002) [2] Simons et al. JAMA 298(18); 2419-2427 (2003) [3] Brendel et al. Pharm. Res. 23(9); 2036-2049 (2006)
128
Poster: Applications- Other topics
Glynn Morrish Using Body Composition Metrics to Predict Exposure Between Japanese and Caucasian Populations
G. Morrish(1), C.Kirkpatrick(1), N. Byrne(2), H. Kinoshita(3) & B. Green(1) (1) School of Pharmacy, University of Queensland, Brisbane, Australia; (2) Institute of Health and Biomedical Innovation, Queensland University of Technology, Brisbane, Australia; (3) Department
of Clinical Pharmacology, Chugai Pharmaceutical Co. Ltd, Tokyo, Japan
Objectives: The Japanese Regulatory Authority require bridging studies for NCE’s to ensure exposure in this population is similar to Caucasians. We believe exposure in different races might be highly predictable if body composition is considered, and have a mechanistic basis to purport the use of lean bodyweight (LBW) for this purpose [1]. The aims of this study were to evaluate the predictive performance of our LBW model [2] in an external Caucasian and Japanese population, and to then evaluate how well LBW predicts clearance (CL) across Japanese and Caucasian populations.
Methods: Predicted LBW using the model of Janmahasatian et al [2] was compared to "true" LBW (measured by DEXA) in 189 Caucasian and 139 Japanese females. The predictive performance of Janmahasatian’s LBW was evaluated using the mean error (ME) and root mean square error (RMSE), as measures of bias and precision. A population pharmacokinetic analysis of "Drug A" (hepatically metabolized anti-cancer agent) after twice daily oral administration to 24 Caucasian and 20 Japanese females was performed using NONMEM VI. Data from intensive plasma sampling on days 1 and 14 were available totaling 498 concentrations. Body composition metrics such as total body weight (WT), body surface area (BSA) and LBW were investigated as covariates for CL.
Results: Evaluation of LBW yielded a ME 0.81 kg and RMSE of 3.86 kg in the Caucasian population and ME of -0.24 kg and RMSE 2.16 kg in the Japanese population. Preliminary pharmacokinetic analysis indicates a 1 compartment first-order elimination model with a transit compartment absorption system best describes the pharmacokinetics of Drug A. Between subject and between occasion variability were included on all parameters. Incorporation of WT or LBW as covariates on CL resulted in an improved model fit (p<0.05), with LBW being preferred over WT.
Conclusions: The semi-mechanistic LBW model [2] shows good predictive performance when evaluated prospectively in female Caucasian and Japanese populations. Preliminary pharmacokinetic results show LBW is the preferred covariate for CL when data from Caucasians and Japanese are fitted simultaneously, suggesting the incorporation of LBW as a covariate for CL in analysis of Caucasian pharmacokinetic data may allow for better prediction of drug exposure in the Japanese compared to body weight alone.
References: [1] Han, P., et al., Dosing in obesity: a simple solution to a big problem; Clin Pharmacol Ther. 2007; 82(5): 505-8 [2] Janmahasatian S., et al., Quantification of Lean Bodyweight; Clin Pharmacokinet. 2005; 44(10): 1051-1065.
129
Poster: Applications- Other topics
FLORA MUSUAMBA-TSHINANU Limited sampling formulas and bayesian estimation for mycophenolic acid 12 hours Area Under the concentration-time
Curve prediction in Stable renal transplant recipients co-medicated with cyclosporine or sirolimus
F T Musuamba (1), J L Bosmans(2), J J Senessael (3), J Cumps (1), P Wallemacq (4) and R K Verbeeck (1)
(1)School of Pharmacy, Catholic University of Louvain, Brussels, Belgium, (2) Department of Nephrology and Hypertension, University Hospital, University of Antwerp, Edegem, Belgium, (3) Renal Unit, Academic Hospital, Free University of Brussels, Brussels, Belgium, (4) Laboratory of
Clinical Biochemistry, University Hospital St. Luc, Catholic University of Louvain, Brussels, Belgium.
Background: Mycophenolate mofetil (MMF), the prodrug of mycophenolic acid (MPA), is an immunosuppressive agent used in combination with corticosteroids, calcineurin inhibitors or sirolimus for the prevention of acute rejection after solid organ transplantation. Mycphenolic acid glucuronide (MPAG), the major metabolite of MPA is subject to enterohepatic recycling. Controversy remains about the interaction between MMF and other immunosuppressive drugs. To date, MPA pharmacokinetic (PK) analysis of stable transplant recipients treated with sirolimus as co-meditation has only been reported on two clinical trials including 12 and 11 patients.
MPA area under the MPA plasma concentration-time profile during one dosing interval (AUC0-12), rather than trough concentrations is being considered as the best exposure marker. To estimate an individual patient's AUC0-12 without measuring the full MPA plasma concentration-time profile two different methods can be used. The limited sampling formulas (LSF) based on multiple linear regression models using a small number of blood samples, preferably obtained in the early post-dose period, to predict the full AUC0-12. This approach requires strict adherence to the time of blood sample collection. Maximum a priori (MAP) Bayesian estimation of AUC0-12 for each individual patient is also based on a limited number of plasma concentration measurements in the early post-dose period and is more flexible in blood sample timing, but in addition requires population pharmacokinetic data being available for the drug .
The objectives of the present study were
to identify and model the effect of demographic and routine biochemistry factors and of the immunosuppressive co-drugs on MPA PK variability by using nonlinear mixed-effect modelling techniques,
to predict MPA AUC0-12 by using multiple linear regression models (limited sampling formula) and MAP Bayesian estimation methods ,
to assess the robustness of various previously reported limited sampling strategies 3 (LSS) by testing them on our patient sample.
Methods:
Data from 40 stable adult renal allograft recipients, transplanted in one of two Belgian university hospitals (Free University of Brussels and University of Antwerp) were included in this study. All
130
patients received mycophenolate mofetil (MMF) (0.75 g b.i.d.), cyclosporine and steroids, all per os, during the initial post transplantation period. At 7.4 ± 1.4 months, cyclosporine was replaced by sirolimus while continuing MMF (0.75 g b.i.d.) and steroid treatment. Full pharmacokinetic profiles for MMF during one dosing interval were determined on three different occasions: A) the day before switching from cyclosporine to sirolimus at 7.4 ± 1.4 months (N=40), B) at 60 days after the switch (N=39 ), and C) at 270 days after the switch (N=37 ).
AUC0-12 was estimated by using the linear trapezoidal method (Noncompartmental Analysis, WinNonlin® version 5.01, Pharsight, Mountainview CA, USA).
Nonlinear mixed effects modelling was performed by using NONMEM Version VI and VNM a Windows®-based interface to NONMEM containing graphical and statistical tools. The sample (N=40) was randomly split in two groups: 1) a model building subgroup comprising 27 patients, and 2) a validation subgroup of the remaining 13 patients which was also used for Bayesian estimation. The first-order conditional estimation (FOCE) approach with interaction between parameters was used throughout the entire modelling process. Between- and within-patient variability was modelled with exponential error models. The difference between observed serum concentrations and the corresponding model-predicted serum concentrations was estimated with a mixed error model. Various models were tested:They were first fitted to MPA plasma concentrations and in a second time to MPAand MPAG plasma concentrations. Bayesian estimation on the validation group by the NONMEM "posthoc" subroutine was performed by using the final model based on different combinations of 3 MPA concentration-time points sampled within 2 hours following MMF dosing.
Limited sampling formulas were developed to predict MPA AUC0-12 by using various combinations of three MPA serum concentrations determined during the 2-hour interval following MMF dosing. Multiple linear regression analyses were performed using JMPTM software to correlate predicted MPA AUC0-12 values with MPA AUC0-12 values calculated by using the full pharmacokinetic profiles . Repeated cross-validation was used to evaluate each LSS as described by Pawinski 1.
Predicted AUC0-12 from each model was compared to the observed AUC0-12 by linear regression to evaluate the strength of the relationship between the AUC0-12 values predicted by the various LSS and the observed AUC0-12 values. Predictive performance of the various LSS and agreement between predicted and observed AUC0-12 were assessed as described by Sheiner and Beal 2.
Results:
The data were best fitted by a five-compartment model fitting MPA and MPAG plasma concentrations and was significantly improved by introduction of a rate constant describing transfer from the fourth to the first compartment and describing the enterohepatic cycle. Glomerular filtration rate as described by Nankivell significantly influenced the MPAG elimination constant whereas hepatic transaminases significantly influenced the transfer rate constant from the MPA central to the MPAG central compartment. Weight was significantly correlated to MPA central compartment volume of distribution.
AUC0-12 was best predicted by MAP using different combinations of patients samples within the 2-hours following MMF intake. The best LSF involved samples drawn 0.66, 1.25 and 3 hours after drug intake.
None of the previously published models acceptably fitted our data
Conclusions:
131
-These are the first results on population pharmacokinetic analysis of MPA/MPAG in patients co-medicated with sirolimus. - These results show that there is still a large inter-individual and inter-occasion variability in MPA pharmacokinetics and thus, a need of TDM long term (15 months) after transplantation. - LSS using Bayesian estimation were better performing than those using MLR due in part to the fact that the population model used are more physiological and take into account the large variability in absorption and the enterohepatic recycling.
References: [1] Sheiner, L.B. & Beal, S.L. Some suggestions for measuring predictive performance. J. Pharmacokinet. Biopharm. 9, 503-512 (1981). [2] Pawinski, T. et al. Limited sampling strategy for the estimation of mycophenolic acid area under the curve in adult renal transplant patients treated with concomitant tacrolimus. Clin. Chem. 48, 1497-1504 (2002). [3] Staatz, C.E. and Tett S.E. Clinical Pharmacokinetics and Pharmacodynamics of Mycophenolate in solid organ transplant recipients. Clin. Pharmacokinet. 46 (1) 13-58 (2007).
132
Poster: Applications- Other topics
Rogier Press Optimizing Calcineurin Inhibitor Exposure In De Novo Kidney Transplant Recipients
Rogier R. Press Leiden University Medical Center
Objectives: The calcineurin inhibitors (CNI), tacrolimus (TRL) and ciclosporin A (CsA), display acute and chronic toxicity. Their use in the early post transplant period is shifting towards minimization in order to limit toxicity. The balance between efficacy and toxicity of these drugs is reflected by their (blood)exposure which varies considerably among individuals. Insight in the sources of variability in pharmacokinetics (PK) can be used for individualization of CNI therapy in kidney transplant recipients and thus tailor immunosuppressive therapy. Therefore, this study aimed at a combined analysis of a series of genetic and non-genetic factors that may explain intra-and interindividual variability in PK.
Methods: PK data were obtained from de novo kidney transplant patients (n=64) receiving either once or twice daily CsA or TRL with a follow up of one year. PK was sampled up to 12 hours after drug administration and on multiple occasions (10 per patient). The population PK analyses were performed with Non-Linear-Mixed-Effects-Modelling and were directed towards determination of the effects of the following genetic and non-genetic factors on CNI PK: hematocrit, serum albumin concentration, prednisolone dose, once or twice daily dosing, demographic factors and genetic factors such as polymorphisms in ABCB1 (T3435C,G2677T,C1236T,T-129C)), CYP3A5(*3 and *6), CYP3A4*1B and the nuclear factor Pregnane-X-Receptor (PXR)(C-25385T,A-24381C,G-24113A,A+252G,A+7635G).
Results: Two significant covariates were identified for CsA explaining 8% of the observed variability in CsA apparent clearance (decreasing from 25% to 17%) of which bodyweight was the most important one. Clearance increased with 0.1 L/h/per kg bodyweight relative to the clearance of a typical subject (range 8 to 25 L/h) within the bodyweight range (49 to 119 kg). A prednisolone dose greater than 20 mg increased CsA clearance with 23%. The TRL analysis revealed three significant factors of which CYP3A5 was the most important and explained 11% of the variability in TRL clearance. TRL clearance was 3.7±0.7L/h versus 5.9±1.1L/h for the genotypes CYP3A5*3/*3 and CYP3A5*1/*3 respectively. The second most important factor was a polymorphism in PXR7635, which explained 3.5% of the variability in clearance: TRL clearance was 3.5±0.7L/h in the PXR CT/TT phenotype versus 4.9±1.0L/h in the CC phenotype. Finally, a concomitant dose of prednisolone greater than 10 mg increased TRL apparent clearance by 17%. TRL exposure in terms of apparent clearance did not correlate with bodyweight.
Conclusions: The results of the present study indicate that the CsA dose depends on bodyweight, whereas the initial TRL dose for immunosuppression in adult kidney transplant recipients should be based on genotype rather than on bodyweight. Patients with the CYP3A5*1/*3 genotype need a 1.6 times higher initial TRL dose compared to CYP3A5*3/*3 carriers to reach target exposure.
133
Poster: Applications- Other topics
Jean Smeets A Mechanism-based Pharmacokinetic Model Describing the Interaction Between Sugammadex and Rocuronium in Patients with Normal and
Impaired Renal Function
J. Smeets(1), B. Ploeger(1), A. Strougo(1), L. Liefaard(1), T. Kerbusch(2) (1)LAP&P Consultants BV, Leiden, The Netherlands; (2)N.V. Organon, a part of Schering-Plough
Corporation, Oss, The Netherlands
Objectives: Sugammadex is a novel neuromuscular block reversal agent that acts by encapsulating steroidal neuromuscular blocking agents, specifically rocuronium. Complex formation causes an increase of total (bound plus free) plasma concentrations of rocuronium. Reduction of free rocuronium causes redistribution of rocuronium to the plasma. Furthermore, the clearance of total rocuronium is decreased because sugammadex and the complex are primarily renally excreted at a slower rate than free rocuronium, which is also hepatically excreted. These processes were modelled based on phase I, II, and III clinical data using population pharmacokinetic (PK) analysis with NONMEM.
Methods: Firstly, the PK of rocuronium alone was modelled based upon 238 subjects from seven trials, including patients with severly impaired renal function. Secondly, the PK interaction between rocuronium and sugammadex was modelled based upon 147 patients with normal and severely impaired renal function, from three trials, who received 0.1-8.0 mg/kg sugammadex at various time points after rocuronium. The model was validated using internal and external data sets.
Results: A three-compartment model was developed for rocuronium. The PK interaction was further described by three compartments for free sugammadex and three compartments for the complex. Complex formation occurs in the central compartment and is described by association and dissociation rate constants K1 and K2, which are related to the in-vitro association constant of the complex as Ka=K1/K2. The PK parameters of sugammadex and the complex were estimated simultaneously based on plasma concentrations of sugammadex and rocuronium. Clearance of free rocuronium and sugammadex were 44 and 90% lower in severely renally impaired patients than in normal patients.
Conclusion: The presented model could accurately describe the observed PK of rocuronium and sugammadex in a series of clinical trials, confirming the mechanism of PK interaction.
134
Poster: Applications- Other topics
Tamara van Steeg Assessment of the use of complex baseline models in preclinical safety screening: Application of the van der Pol oscillator model to describe heart
rate effects in rats
Tamara van Steeg, Ashley Strougo, Bart Ploeger and Piet Hein van der Graaf LAP&P Consultants
Objectives: Many physiological variables (e.g. heart rate, body temperature) are subject to chronobiological (e.g. circadian) rhythms in both humans and animals. From a pharmacokinetic-pharmacodynamic (PKPD) modelling perspective, correct description of circadian rhythms is critical to avoid biased or imprecise results in the quantification of drug effect. Over the years, several baseline models, both simple and complex, have been proposed for the description of the circadian cycles. Recently, a novel negative feedback PKPD model (based on the van der Poll oscillator) incorporating external light-dark conditions was reported for the description of the asymmetric circadian rhythm in both heart rate and body temperature in rats [1,2]. The aim of the current study was to evaluate the practical utility of the van der Poll oscillator model in safety pharmacology using heart rate data obtained for a new drug candidate (PF-X).
Methods: All PK and PD experiments were performed in male rats. Heart rate was monitored continuously using telemetry and was used as the pharmacodynamic endpoint. The rats were randomly assigned to four treatment groups (3 active, 1 vehicle). The PK and PD of PF-X were quantified using non-linear mixed-effects modeling as implemented in NONMEM software version V, level 1.1. All data were analysed simultaneously, since precise estimation of the pharmacokinetic parameters was not possible using the sparse PK data alone. The PK and PD were described by a two-compartment model and a simple linear, direct effect model, respectively. The circadian cycle was incorporated by means of a descriptive or the van der Pol oscillator model (complex baseline model). The descriptive baseline model contained a simple switch function to define the hours at which the light was turned on (8:00 AM) or off (8:00 PM).
Results: During the activity period (dark) baseline heart rate was estimated to be 52 bpm higher than during the resting period (light). The PKPD model including the descriptive baseline model resulted in an adequate and precise estimation of both PK and PD parameters. Nearly all model runs using the complex baseline model terminated due to rounding errors. The parameters of the van der Pol oscillator (alpha & beta) varied greatly between the single model fits. Overall, the results indicated overparametrisation of the PKPD model including the complex baseline model. This overparametrisation was confirmed by the fact that precise PD parameter estimates were only obtained if the population PK parameters were fixed (to the values obtained with the descriptive baseline PKPD model). Comparison of the parameter estimates for both models showed that the drug effect (slope) was not significantly different. In addition, the description of the heart rate profiles by the complex model was comparable to the description by the simple model.
Conclusions: The objective of this study was to evaluate the practical utility of the van der Pol PKPD model for routine use in safety pharmacology testing in preclinical drug development. Although the van der Pol model clearly has some attractive features compared to simpler models and can better describe some complex circadian cycles, at least in this case study with PF-X we found that its utility was limited in practice. Typically, in safety pharmacology, rich PD data in
135
individual animals is often associated with sparse PK profiles and a simultaneous, population-based, fit of PK and PD data is often required to obtain adequate estimates of exposures profiles. Therefore, a parsimonious approach based on a simpler PD model may be required, since complex baseline models may interfere with the identification of both the pharmacokinetics and pharmacodynamics of the drug under investigations and eventually weaken the conclusions that can be drawn. A possible solution would be adjusting the approach such that the PK parameters are obtained first using the simple baseline model and, thereafter, the complex baseline model is used to describe the profiles.
References: [1] Sällström et al., 2005, J Pharmacokinet Pharmacodyn. 32(5-6):835-59 [2] Visser et al., 2006, J Pharmacol Exp Ther. 317(1):209-19
136
Poster: Applications- Other topics
Johan Wallin Population pharmacokinetics of tacrolimus in paediatric bone marrow transplant recipients
Johan E Wallin (1), Lena E Friberg (1), Christine E Staatz (2) (1)Division of Pharmacokinetics and Drug Therapy, Biomedical Centre, Uppsala University,
Uppsala, Sweden (2) School of Pharmacy, University of Queensland, Brisbane, Australia.
Objectives: Tacrolimus is emerging as a valuable immunosuppressant option in the prevention of graft-versus-host disease (GVHD) following allogeneic bone marrow transplantation (BMT). Little data is available on the pharmacokinetics of tacrolimus in paediatric BMT recipients, with only one previous investigation involving 7 subjects [1]. The aim of this study was to evaluate the population pharmacokinetics of tacrolimus in paediatric BMT recipients in the first year post-transplant and to identify factors that may explain pharmacokinetic variability.
Methods: Data were collected retrospectively from the medical records of 22 children transplanted between 1997 and 2007 at Queen Silvia’s Children’s Hospital in Gothenburg, Sweden. Population pharmacokinetic analysis was performed using NONMEM version 6 [2]. Maximum likelihood estimates were sought for tacrolimus clearance (CL), volume of distribution (V) and bioavailability (F). V and CL was allometrically scaled to lean body weight. A previously suggested model with a time-dependent increase in tacrolimus apparent clearance (CL/F) [3,4] was compared to a simpler one- or two- compartment model. A step-wise covariate search with a significance criteria of p<0.01 was performed [5]. Covariates screened for influence on the pharmacokinetic parameters were liver function tests (AST, ALT, GGT, ALP), bilirubin, albumin, creatinine clearance, sex, age and post-operative day.
Results: All subjects received tacrolimus initially as a continuous intravenous infusion at 0.03 mg/kg/day, starting approximately two days before transplantation. Patients were converted to oral tacrolimus therapy two to three weeks after transplantation, with an initial oral dose approximately four times the intravenous dose, divided into twice daily administration. A one-compartment model with first order absorption and elimination was considered optimal for modelling the data. Under the final base model mean CL was 0.140 L/h/kg0.75, V was 12.7 L/kg and F was 13%. Inter-individual variability in CL, V and F was 60%, 70% and 54% respectively. Covariate analysis suggested tacrolimus CL positively correlated with creatinine clearance and GGT. Tacrolimus F decrease with time post-transplant.
Conclusions: Tacrolimus CL was similar to that estimated in adult BMT recipients when scaled to 75kg/170cm [6], 3.56 L/h compared to 5.22 L/h in adults. F was notably lower, approximately half of the 28% reported in adults [6]. This may be attributed to the use of a paediatric formulation in this study. Decreasing F with time post-transplant found in this study might be explained by the occurrence of chronic GVHD in these patients over time. Pharmacokinetic parameters obtained in this study may assist physicians in making individualized dosage decisions with regards to tacrolimus in paediatric BMT recipients.
References: [1] Mehta P, Beltz S, Kedar A, et al. Bone Marrow Transplantation 1999; 24: 1323-1327. [2] Beal SL, Sheiner LB. NONMEM users guide (NONMEM project group, University of
137
California, San Fransisco, CA, 1992) [3] Antignac M, Barrou B, Farinotti R, et al. Br J Clin Pharmacol 2007; 64: 750-757. [4] Antignac M, Hulot JS, Boleslawski E, et al. Eur J Clin Pharmacol 2005; 61: 409-416. [5] Lindbom L, Pihlgren P, Jonsson EN. Comput Methods Programs Biomed 2005; 79: 241-57. [6] Jacobson P, Ng J, Ratanatharathorn V, et al. Bone Marrow Transplant 2001; 28: 753-758.
138
Poster: Applications- Other topics
Susan Willavize Using M&S to Shorten the Repeating Cycle of the Early Drug Development Process: A Case Study
Susan Willavize(1) , Ruolun Qiu (1), Marc Gastonguay (2) (1) Pfizer, Inc. (2) Metrum Research Group LLC
Objectives: A case study illustrates use of in silico methods (modeling and simulation (M&S)) to augment or replace in vivo study data and to aid the decision making process in early drug development. Several technical decisions, which proved key to the timely and successful implementation of M&S in this case study, are discussed.
Methods: A population PK-PD model was fitted to data at two dose levels from a Phase 1 study in normal volunteers. The model was validated by comparing the observed mean response to data simulated from the parameter estimates and their uncertainty. Validation for the PK-PD model was also obtained by computing a summary function (pd-AUC) for the simulated data and comparing to observed mean pd-AUC values. The model was then used to extrapolate to doses up to seven fold higher. The relationship between predicted exposure and predicted pd-AUC was plotted and considered in comparison with toxicology limits. Percentiles of the simulated data at the extrapolated doses provided an assessment of the probability of technical success; i.e., the probability that the drug can meet target effect levels on average.
Results: A composite indirect response model fitted the multiple dose data well and provided pd-AUC values that agreed well with observed values. Exposure levels at the toxicology limit have a less than 1 % probability of meeting the PD target on average. To attain an 80% probability of technical success, exposures 2-3 fold higher than the toxicology level would be needed. These doses are more than 3 fold higher than the highest dose previously studied in the clinic under multiple dosing. Among the technical decisions critical to the timely application of M&S to this drug development experience were: 1.) dialog with the development team concerning the hypothesized mechanism of action of the drug and concerning the metric of interest for decision making, and 2.) focus on the probability of technical success rather than the probability of trial success.
Conclusions: Based on PK-PD modeling and uncertainty around the parameter estimates, exposure levels needed to reach PD target are 2-3 fold higher than animal toxicology limits. Doses substantially higher than those previously used would be needed to obtain PD endpoint target with high probability (80% or above). Quantitative information influenced the early decision not to progress further development of the drug candidate under examination.
139
Poster: Applications- Other topics
Susan Willavize Dose Selection for Combination Drug Products
Susan Willavize Pfizer, Inc
Objectives: Patients can benefit from combination drugs which improve efficacy or reduce dose. Regulatory guidances require demonstration of safety and efficacy and the superiority of the combination to either of the two drugs alone at the same doses. A graphical procedure can aid us in interpreting the dose response model and help us to choose dose combinations that can meet the goals of both patients and regulators. The findings of the new procedure are compared to traditional methods of assessing the value of a drug combination.
Methods: The scope of this work covers fixed-dose combinations of two drugs, where both are effective alone, where effect is measured by one continuous end-point with no PK interaction. Given a suitable response surface function, the gain surface can be defined as the difference between the response at any dose combination and the maximum response for each drug alone at the same doses. A graphical procedure combining the response surface and the gain surface is illustrated using data from published studies (combinations of simvastatin/ezetimibe and atorvastatin/gemcabene) [1, 2] or simulated data. The findings of empirical synergy assessment (Loewe additivity and Bliss independence [3]) are compared to the results of the new graphical method.
Results: Response surface methods can provide a description of the 3-D surface and allow for interpolation and prediction of favorable dose combinations. Using the dose response surface and the gain surface together, we can find dose combinations that allow for improvements in efficacy or reduction in dose and for which there is a high expected gain. The findings of empirical synergy assessment, however, may be in conflict with the new graphical procedure.
Conclusions: Dose selection for combination drug products is best done with a good prior understanding of the dose-response patterns and mechanisms of action of the component drugs. Response surface methods and mechanistic modeling methods can be used to describe the dose-response surface. A graphical procedure which combines the response surface and the gain surface can aid in the choice of doses which show potential for improvement in efficacy or potential for dose reduction. Lack of empirical synergy does not imply lack of improvement in efficacy or lack of potential for dose reduction.
References: [1] Herman D et al. 2005 "Strategies to Improve Model-based Decision-making During Clinical Development" PAGE Meeting, Pampaloma, Spain [2] Mandema JW, et al. 2005. "Model-Based Development of Gemcabene, a New Lipid-Altering Agent". The AAPS Journal. 7(3): E513-E522 [3] Greco WR, et al. 1995 "The Search For Synergy: A Critical Review From A Response Surface Perspective" Pharmacol. Rev. 47: 331-385.
140
Poster: Methodology- Algorithms
Julie ANTIC Some Stochastic Algorithms For The Smooth Non Parametric (SNP) Estimator
Julie Antic (1,2), Céline M. Laffont (1), Didier Concordet (2). (1) Servier Research Group, Courbevoie, France ; (2) UMR181 Physiopathologie et Toxicologie
Expérimentales, INRA, ENVT, Toulouse, France.
Background: In population analyses, standard parametric methods assume the normality of the random effects (ETAs), even if this may be unrealistic (especially in phase II/III studies where the population may be very heterogeneous). Non parametric (NP) estimators are of interest, since they do not assume the normality of ETAs. Several discrete NP estimators have been proposed: NPML, NPEM, and recently the NP method in NONMEM ([1]). These NP estimators have several drawbacks. In particular, they are difficult to interpret because they are discrete although the true distribution of ETAs is generally continuous. The smooth NP (SNP) estimator proposed by Davidian and Gallant [2] is more attractive: it is continuous and has well established statistical properties. However, its use is limited by a complex computation: the likelihood is not explicit and thus difficult to maximize.
Objective: Find an efficient algorithm to make an easy computation of the SNP estimator.
Methods: Here, 4 stochastic algorithms are studied: a stochastic gradient algorithm [3], a stochastic Newton-Raphson algorithm [4], a new perturbed stochastic gradient algorithm, and a new particle algorithm. Convergence of each algorithm is investigated. Practical performances are illustrated on simulated data obtained with the phenobarbital model [5].
Results: The stochastic gradient algorithm and the stochastic Newton-Raphson algorithm are not very satisfactory because they sometimes converge to a maximum that is not global. The usual procedure to cope with this problem is the multistart procedure: several optimizations are performed with different initial estimates. This procedure ensures convergence to the global maximum if there are a lot of initial estimates, but is expensive in terms of computation time. We show that a new perturbed gradient algorithm converges to the global maximum of the likelihood. However, its convergence rate is slow and thus, it is not competitive with the multistart procedure. The particle algorithm, which makes a more clever use of initial estimates, appears promising.
Conclusion: The use of the SNP estimator is made easier thanks to the development of specific stochastic algorithms. Standard stochastic algorithms such as SAEM could not be applied given the complexity of the SNP model. Deterministic algorithms based on numerical approximation of the likelihood could have been used. However, they are computationally expensive and/or inaccurate in case of numerous random effects.
References: [1] Antic J., Chafaï D., Laffont C.M., Concordet D. Evaluation of Non Parametric Methods for Population PK/PD. PAGE meeting 16, 2007, abstract 1181 [www.page-meeting.org/?abstract=1181]. [2] Davidian M. and Gallant A.R., The nonlinear mixed effect model with a smooth random density. Biometrika, 1993, 80, 475-488. [3] Younes, L. Parameter estimation for imperfectly observed Gibbsian fields. Probab. Theory and
141
Related Fields, 1989, 82, 625-645. [4] Gu M.G., Kong F.H. A stochastic approximation algorithm with Markov chain Monte-Carlo method for incomplete data estimation problems. Proceedings of the National Academy of Sciences of the USA, 1998, 13, 7270-7274. [5] Grasela T.H., Donn S.M. Neonatal population pharmacokinetics of phenobarbital derived from routine clinical data. Developmental Pharmacology and Therapeutics, 1985, 8: 6, 374-383.
142
Poster: Methodology- Algorithms
julie bertrand Properties of different tests to detect the effect of a genetic covariate on pharmacokinetic parameters using the SAEM algorithm for several designs
Julie Bertrand, Emmanuelle Comets, France Mentré INSERM, U738; Université Paris 7, Paris, France
Objectives: To compare through a simulation study the statistical properties of three different tests used for selection of a genetic covariate for analyses with nonlinear mixed effects models. Different designs are studied in order to address the cases of asymptotic conditions (high number of subjects) or of sparse data.
Methods: We use the stochastic EM algorithm (SAEM) implemented in MONOLIX 2.1 [1] in the assessment of three methods to test for a gene effect: i) an ANOVA to test the difference between the empirical Bayes estimates of the fixed effects parameters among the genetic groups, ii) a global Wald test to assess whether fixed effects estimates for the genetic effect are significant, and iii) a likelihood ratio test (LRT) between models with and without the genetic covariate.
The simulation setting is inspired from a real case study [2]. We consider a one compartment model at steady-state with first order absorption and elimination and a genetic effect on the drug bioavailability through the parameter V/F.
We investigate several designs (N=number of subjects, n=number of samples/subject): i) N=40/n=4 similar to the original study, ii) N=80/n=2 sorted in 4 groups, optimized using PFIM software [3] which reflects sparse conditions, iii) a mixed design: N=20/n=4 plus N=80/n=1 that are only trough concentrations, and iv) N=200/n=4 to reach asymptotic conditions. The first three designs (all leading to a total of 160 observations) are simulated 1000 times under both the null and the alternative hypotheses to assess the type I error and the power of the three methods. We compute the shrinkage as well as the empirical relative standard errors (RSE) and consider the information criterion and the RSE predicted by PFIM.
Results: ANOVA has a correct type I error estimate across designs. Wald test and LRT show a slight but significant inflation of the type I error on the original design (small number of patients) and the mixed design (high shrinkage). This increase is corrected under asymptotic conditions (N=200/n=4). For each design, the corrected power is analogous for the three tests. Among the three designs with a total of 160 observations, the design N=80/n=2 provided both the best power and the lowest RSE on V/F.
Conclusions: This work underlines that inference on genetic effect does not necessarily require a conventional design with extensive sampling. Further studies are required to provide recommendations on which test to use according to the design.
References: [1] Lavielle, M. MONOLIX (MOdèles NOn LInéaires à effets miXtes), Orsay, MONOLIX Group (2005). www.monolix.org. [2] Mentré, F. et al. Prospective trial to evaluate how therapeutic drug monitoring of protease inhibitors increases virologic success and tolerance of HAART (COPHAR2 - ANRS 111 trial). 12th
Conference on Retroviruses and Opportunistic Infections Boston, USA (2005). [3] Retout, S., Mentré, F. Optimisation of individual and population designs using Splus. J. Pharmacokinet. Pharmacodyn. 30, 417-443 (2003). www.pfim.biostat.fr.
During this work, Julie Bertrand was supported by a grant from Servier Research Group, France.
Vivek Dua Automatic Selection of Optimal Configuration of Artificial Neural Networks
Vivek Dua University College London
Objectives: A novel mixed-integer nonlinear programming (MINLP) based mathematical formulation for artificial neural network (ANN) analysis which minimises the complexity of the configuration of the network is presented.
Methods: Traditionally, the configuration of the ANN, which comprises of the number of hidden layers, number of nodes in the hidden layers and the interconnections between the nodes, is fixed and then an optimisation problem is solved to minimise the error between the observed data and model predictions. A reduction in the number of hidden layers and nodes can result in an increase in the error whereas increasing the number of hidden layers and nodes can lead to over-fitting or over-learning [3]. A reduction in the number of interconnections can reduce the degeneracy in the input-output relationships and may also provide some insight into the behaviour of the model. The configuration is iteratively changed until an acceptable error is obtained. Automatic selection of the optimal configuration can be mathematically formulated by introducing 0-1 binary variables to represent existence or not of a layer, node or interconnection. This results in an MINLP where the objective is to minimise the complexity of the network subject to equality constraints, representing the transformations across the network, and inequality constraints, such as, an upper bound on the error [1]. The solution of this problem is given by an optimal network configuration which meets the error criteria as well as any other constraints included in the formulation.
Results: This methodology was applied to a kinetic and dynamic dataset available in open literature for a CNS compound [2]. A good comparison between the observed and predicted data was obtained.
Conclusions: Redundant nodes, layers and interconnections are eliminated and a compact representation of the input-output correlations is obtained.
References: [1] Dua, V. (2006) Optimal configuration of artificial neural networks, Proc. of 16th ESCAPE and 9th Int Symp on PSE, W. Marquardt and C. Pantelides (Eds), p.1599-1604, Elsevier, Amsterdam. [2] Gabrielsson, J. and Weiner, D. (2000) Pharmacokinetic and pharmacodynamic data analysis: concepts & applications, 3rd ed., Taylor and Francis, p829. [3] Gobburu, J.V.S. and Chen, E.P. (1996) J. Pharm Sci, 85, 505-510.
145
Poster: Methodology- Algorithms
Clare Gaynor A Differential Equations Approach to In Vitro – In Vivo Correlation Modelling in NONMEM
Clare Gaynor (1), Adrian Dunne (1) and John Davis (2) (1) UCD School of Mathematical Sciences, University College Dublin, Belfield, Dublin 4
Background: The main applications of In Vitro – In Vivo Correlation (IVIVC) models are to reduce the number of human studies required in drug development, to act as a surrogate for human bioequivalence studies and in setting dissolution specifications. As a result, considerable effort goes into their development and “the ability to predict, accurately and precicely, expected bioavailability characteristics for an ER [extended release] product from dissolution profile characteristics is a long sought after goal” [1]. Many methods of developing IVIVC models have been proposed. Previous research has highlighted a number of statistical concerns with a group of methods based on deconvolution [2] and has shown that a convolution method based on that of O’Hara et al [3] produces superior results [4]. Implementation of this convolution-based method involves the production of a user-written subroutine for the NONMEM [5] software package, a task that can be time consuming and complex. As a result, this methodology, despite its advantages over the deconvolution-based approach, is not in widespread use.
Methods: An approach based on systems of differential equations, has been proposed [6] It has been shown [7] that the convolution based and differential equation based models can be mathematically equivalent. Software which implements a differential equation based approach has been developed. This method utilises existing NONMEM libraries and is an accurate method of modelling which is far more straightforward for users to implement.
Results and Conclusions: This research shows that, when the system being modelled is linear, the use of differential equations will produce results that are practically identical to those obtained from the convolution method. Both the convolution and deconvolution based methods assume that the system being modelled is linear but, in practice, this is not always the case. Our work to date has shown that the convolution-based method is superior, but when presented with nonlinear data even this approach will fail. The use of a differential equation based model could also allow for the possibility of accurately modelling non-linear systems and further investigation is being carried out into the case where the drug is eliminated by a nonlinear, saturable process.
References: [1] Food and Drug Administration (1997) Guidance for Industry: Extended Release Oral Dosage Forms: Development, Evaluation, and Application of In vitro/In vivo Correlations. [2] Dunne A., Gaynor C. and Davis J. (2005) Deconvolution Based Approach for Level A In vivo-In Vitro Correlation Modelling: Statistical Considerations. Clinical Research and Regulatory Affairs, 22, 1-14. [3] O’Hara T., Hayes S., Davis J., Devane J., Smart T. and Dunne A. (2001) In vivo-In Vitro Correlation (IVIVC) Modeling Incorporating a Convolution Step. Journal of Pharmacokinetics and Pharmacodynamics, 28, 277-298. [4] Gaynor, C., Dunne, A. and Davis, J. A Comparison of the Prediction Accuracy of Two IVIVC
146
Modelling Techniques. Journal of Pharmaceutical Sciences, Published Online: 7 Nov 2007 [5] S.L. Beal and L. B. Sheiner. NONMEM User’s Guides, NONMEM Project Group, University of California, San Francisco, 1992. [6] Buchwald, P. (2003) Direct, differential-equation-based in-vitro-in-vivo correlation (IVIVC) method. Journal of Pharmacy and Pharmacology, 55: 495-504. [7] Dunne, A. (2007) Approaches to developing IVIVC models, Ch 5. In Chilukuri, Sunkara and Young (Eds), Pharmaceutical Product Development: In Vitro – In vivo Correlation. Taylor and Francis, New York
147
Poster: Methodology- Algorithms
Leonid Gibiansky Application of Identifiability Analysis Algorithm to Population PK of the Drug with Target-Mediated Drug Disposition
Leonid Gibiansky (1), Tarundeep Kakkar (2), Peiming Ma (2) (1) QuantPharm LLC, North Potomac, MD, US; (2) Amgen Inc., Thousand Oaks, CA, US
Background: The pharmacokinetic model for drugs exhibiting target-mediated disposition (TMDD) was suggested in [1]. Several simpler approximations of the TMDD model were proposed in [2,3]. The Quasi-Equilibrium (QE) [2] and the Quasi-Steady-State (QSS) [3] approximations apply when the drug-target-complex system rapidly reaches equilibrium and steady-state, respectively. The Michaelis-Menten (MM) [3] approximation applies when concentrations of the free drug significantly exceed concentrations of the target and/or target occupancy is very high [3]. In cases when one of the approximations provides a good description of the data, the more complicated models are over-parameterized especially when only the free or total (but not both) drug concentration measurements are available. An algorithm to test identifiability of the TMDD model parameters for a particular data set and to choose a correct (non-over-parameterized) approximation was suggested in [3].
Objectives: To test the proposed Identifiability Analysis Algorithm on an example dataset simulated from a TMDD model based on clinical data.
Methods: The simulated dataset included 150 densely sampled patients who received IV or SC doses ranging from 200 to 7000 units. Study design, sampling scheme, and the parameters of the TMDD model used for simulations were chosen to reflect the actual clinical data (with re-scaled parameters). Only free drug concentration was measured. First, the Identifiability Analysis Algorithm was implemented as following. The TMDD model was fitted to the data, and the obtained parameter estimates were used to simulate the concentration-time profiles for the TMDD and corresponding QE, QSS and MM models. The results of the simulations were used to identify: i) the simplest model equivalent to the TMDD model; ii) the identifiable combination of the TMDD model parameters; iii) the dosing regimens and the concentration levels that can be described by the MM model. Then, the QE/QSS and MM models were directly fitted to the data. The individual and population predictions of these models were compared with the predictions of the TMDD model. Precision of the parameter estimates was investigated using the bootstrap procedure. Conclusions of the Identifiability Analysis were compared with the results of the direct investigation of the TMDD, QE/QSS and MM models.
Results: Based on the TMDD model parameter estimates, QE, QSS and MM approximations were shown to be identical to the full TMDD model for all dosing regimens of interest. When fitted independently to the same data, all models provided nearly identical population and individual predictions. The TMDD and QE/QSS model parameters were strongly correlated. Significant correlation was observed even for the MM model parameters (VMAX and KM).
Conclusions: For the investigated dataset, the TMDD model parameters cannot be determined based on the available data. The MM approximation provides an adequate description of the data. No improvement can be obtained using more complicated QE and QSS approximations, or the
148
TMDD model. Identifiability Analysis Algorithm allows selection of the parsimonious model that describes the available data.
References: [1] Mager DE, Jusko WJ. General pharmacokinetic model for drugs exhibiting target-mediated drug disposition. J. Pharmacokinetic and Pharmacodynamic 28: 507-532 (2001). [2] Mager DE, Krzyzanski W. Quasi-equilibrium pharmacokinetic model for drugs exhibiting target-mediated drug disposition. Pharmaceutical Research, Vol. 22 (10) 1589-1596 (2005). [3] Gibiansky L, Gibiansky E, Kakkar T, Ma P, Approximations of the Target-Mediated Drug Disposition Model and Identifiability of Model Parameters. PAGE 17 (2008) Abstr 1269 [www.page-meeting.org/?abstract=1269]
149
Poster: Methodology- Algorithms
Leonid Gibiansky Approximations of the Target-Mediated Drug Disposition Model and Identifiability of Model Parameters
Leonid Gibiansky (1), Ekaterina Gibiansky (2),Tarundeep Kakkar (3), Peiming Ma(3) (1) QuantPharm LLC, North Potomac, MD, US; (2) ICON Development Solutions, Ellicott City,
MD, US; (3) Amgen Inc., Thousand Oaks, CA, US
Objectives: To suggest simpler forms of the model [1] that describes pharmacokinetics of the drugs with target-mediated disposition (TMDD); to derive relationships between parameters of the full and simpler models; to investigate range of applicability of these simpler models; to propose an algorithm for determining the identifiability of the models for drugs with TMDD.
Methods: Two approximations of the TMDD model were derived. The Quasi-Steady-State (QSS) model was obtained similarly to the Quasi-Equilibrium (QE) model [2] with the assumption of quasi-equilibrium of the free drug, target and complex replaced by the assumption of quasi-stationarity of these entities. The QSS and QE equations are identical but dissociation constant KD=KOFF/KON is replaced (for the QSS model) by the quasi-stationarity constant KSS=(KOFF+KINT)/KON. Further simplification was obtained assuming that the free drug concentration significantly exceeds the concentration of the target and that internalization (or complex degradation) constant KINT is sufficiently large. Then, the TMDD model degenerates to the model with Michaelis-Menten (MM) elimination. MM parameters can be expressed as VMAX=RTotal KINT and Km=(KOFF+KINT)/KON where RTotal is the total concentration of the target.
Results: The following algorithm is proposed for modeling of drugs with TMDD and investigation of identifiability of model parameters: (1) Fit the TMDD model and estimate the model parameters; (2) For dosing conditions typical for the analysis dataset simulate concentration-time profiles for all models (TMDD and corresponding QE, QSS and MM) using parameters obtained in Step 1. Then the following rules would result: (1) The simplest model that is equivalent to the TMDD model should be used; (2) If any simpler models provide predictions identical or similar to the predictions of the TMDD model, then the parameters of the TMDD model are not uniquely defined, and the obtained parameter estimates are not reliable. Only parameter combinations specified by the simplest of the equivalent models can be considered reliable. (3) If precise estimates of the TMDD model parameters are needed, more data should be collected in the range of concentrations and for dosing regimens where the simpler approximations (QE, QSS or MM) deviate from the TMDD model; (4) Even if the TMDD model deviates from the simpler model for some concentration ranges and some dosing regimens, the simpler model can be used if this model predictions are equivalent to the predictions of the TMDD model for the therapeutic range of doses and/or concentrations. If the TMDD model cannot provide any parameter estimates, the algorithm may start from the fit of the QE/QSS model. QE/QSS parameter estimates can then be used to derive the simpler MM model and to develop the full TMDD model using partial knowledge of the TMDD parameters obtained from the QE/QSS fit.
Simulation examples indicate that the QSS model is preferable to the QE model when internalization rate significantly exceeds dissociation rate. The MM approximation is sufficient when the drug concentration significantly exceeds receptor concentrations or when the target occupancy is very high.
150
Conclusion: The QSS model is a good approximation of the TMDD model when internalization rate of the complex significantly exceeds dissociation rate. The MM approximation provides adequate PK description when free drug concentrations significantly exceed concentrations of the target or when the target occupancy is very high. The proposed algorithm for determining the identifiability of the TMDD model may provide justification for use of the simpler approximations, avoiding use of incorrect parameter estimates of over-parameterized TMDD models while simultaneously saving time and resources required for the population analysis of drugs with the target-mediated disposition.
References: [1] Mager DE, Jusko WJ. General pharmacokinetic model for drugs exhibiting target-mediated drug disposition. J. Pharmacokinetic and Pharmacodynamic 28: 507-532 (2001). [2] Mager DE, Krzyzanski W. Quasi-equilibrium pharmacokinetic model for drugs exhibiting target-mediated drug disposition. Pharmaceutical Research, Vol. 22 (10) 1589-1596 (2005).
151
Poster: Methodology- Algorithms
Leonid Gibiansky Parameter Estimates of Population Models: Comparison of Nonmem Versions and Estimation Methods
Leonid Gibiansky QuantPharm LLC, North Potomac, Maryland, US
Objectives: To investigate performance of estimation methods with the specific objective to compare: (i) NM V versus NM VI; (ii) FO versus FOI; (iii) FOI versus FOCEI; (iv) FOCEI versus LNUMI; (v) models implemented in the original versus log-transformed variables.
Methods: The following models were investigated: 5 PK-PD EMAX or linear; 4 PK with dense sampling; 6 PK with sparse sampling. Data set and true parameter values reflected the real data but dependent variable was simulated. Each PK model was presented in both original and log-transformed variables. Simulated data were fit using Nonmem V (FO, FOCE, FOCEI, LNUM, LNON) and Nonmem VI (FO, FOI, FOCE, FOCEI, LNUM, LNUMI, LNON) estimation methods. Results were compared between methods and with the true parameter values. Windows XP with g77 FORTRAN compiler was used for all model runs.
Results: (i) NM V and VI delivered very similar results with the exception of one problem that revealed a bug in the NM VI code. After the bug was fixed, discrepancy disappeared. For converged models, OF were nearly identical except 2 LNON models where NM VI OF was lower by 6 and 8 points, respectively. NM V run times for FO, FOCE, FOCEI and LNON methods was on average, 20-50% longer than NM VI run times, while the run times of NM V and NM VI for LNUM were, on average, comparable. FOCE methods were about 10 times slower that FO and 2 times quicker than L; (ii) FO and FOI parameter estimates were similar for all problems with residual error CV < 40%; (iii) FOCEI was superior to FOI; (iv) FOCEI and LNUMI were similar in all but one cases where one of the parameters was more precisely estimated using LNUMI; (v) models in the original variables with INTER option performed similarly to models in log-transformed variables. For models with residual variability exceeding 40%, INTER option or log-transformation was necessary to obtain unbiased estimates of inter- and intra-subject variability.
Conclusion: For converged models, NM V and NM VI parameter estimates and OF values were very similar. Models with exponential residual error presented in the log-transformed variables performed similar to the ones fitted in original variables with INTER option. For problems with residual variability exceeding 40%, use of INTER option or log-transformation was necessary to obtain unbiased estimates of inter- and intra-subject variability. FOCEI performed superior to FOI and similar to LNUMI. For the examples considered in this work, FOCEI proved itself as the method of choice for population modelling of continuous data.
152
Poster: Methodology- Algorithms
Rich Haney Accelerating the Rate of Adoption of New Pharmacometrics Platforms Using Formal Tools for Model Interconversion
Rich Haney Cellular Statistics, LLC
Objectives: The FDA can accelerate the rate of approval of new drugs by accelerating the rate of adoption in industry of new pharmacometrics platforms. In support of that overall effort, we have written tools that convert NMTRAN models to and from forms that can be used by the new platforms. Doing this can allow the FDA and industry to test the new platforms using the very large numbers of existing models now in NMTRAN, WinNonlin, and other forms.
Methods: Practical Methods: We use PERL and Maple to convert NMTRAN, WinBUGS, Monolix, and WinNonlin models to algebraic, language-independent forms that make extensive use of polynomials and differential polynomials[1,2] We then use PERL to convert these back to language-specific representations. We store all intermediate and final results of translations ( as well as all results of NONMEM, Monolix and other runs) in a MySQL database. We use C# and web-based methods to let users browse and edit models easily. Formal Methods: Various fixed effects and NLME approaches can sometimes be “embedded” within one another in simple ways; they can also be related in ways that are more complex. We characterize such relationships using algebraic methods. In this context, pairs of translations (such as from NMTRAN to WinBUGS and back) define (a.) "back-and-forth" or "up-and-down" operators in model theory, (b.) monads in universal algebra, and (c.) pairs of adjunctions in category theory. We consider ourselves successful when we can pass our various practical tests but still obey about 10-15 “nitpicking” algebraic rules inherent to our algebraic perspective as a whole.
Results: So far we have tried to convert 250 models back and forth among NONMEM, WinBUGS, Monolix, and other forms. Of these, 63 pairs of translations work well in practice and can be characterized nicely formally. Another 95 work “informally”. 92 do not work yet. ( We hope to about 400 completely working by June.) Many of our models involve categorical data models. For these, use of toric polynomials[1,2,3,4] as the intermediate representations when translating between NONMEM and WinBUGS works well, but we should add that we may have been able to do this step just as well using a simpler approach. We converted WinBUGS and other models to annotated, “regularized” NMTRAN forms. These conform to various rules (e.g., variables can only be on left-hand sides of equations once.) We could not handle Monolix "For" lops, NMTRAN "DO WHILE" statements, pure FORTRAN code, and other NONMEM features and options.
Conclusion: The overall approach, whether formal or informal (or done by ourselves or others ) will accelerate the adoption of new pharmacometrics platforms in the future.[5,6]
References: [1] Seth Sullivant, 2006, "Statistical Models are Algebraic Varieties", www.math.harvard.edu/~seths/lecture1.pdf [2] Lior Pachter and Stumfels, "Algebraic Statistics for Computational Biology", 2005
153
[3] Fabio Rapallo, "Toric statistical models: parametric and binomial representations", AISM (2007) 59:727–740 [4] Rich Haney, "Toric models for categorical data in Pop PK/PD: Are They Useful or Not"?", to be posted summer 2008 at site of www.cellularStatistics.com [5] Our belief is that our approaches will be complementary ( formally speaking, "adjoint") to those of language-based approaches, e.g., Mike Dunlavey's PML language[5] and future standards by the NLMEc. See, for example, Mike Dunlavey, "Next generation Modeling Language", PAGE 16 (2007) Abstr 1076 [www.page-meeting.org/?abstract=1076] [6]For a summary of some of own ( formal ) approaches overall, please see http://openservices.sourceforge.net/
Søren Klim Linear Mixed Effects models based on Stochastic Differential Equations in R
Soren Klim, Stig Mortensen and Henrik Madsen Technical University of Denmark
Objectives: In the master thesis [1] and article [2] a framework for handling Non-Linear Mixed Effects models based on Stochastic Differential Equations (SDEs) were presented. The framework was built in Matlab which is a commercial product. In order to make the framework wider available an R-Package was developed.
Methods: The R-package PSM [3] contains methods for simulation, estimation and smoothing of LME-models based on SDEs. The models are restricted to additive error but using a log-transform this limitation can be extended to proportional error. The package for now restricted to linear models. The estimation procedure is maximum likelihood based with a FOCE approximation. The intra-individual models are handled through the linear Kalman filter in order to incorporate the stochastic differential equations. The use of SDEs enables the separation of observation noise and system noise in the data which is a powerful modelling property as explained in [4]. The models can include dosing and multidimensional observations. Furthermore the time consuming parts of the code has been moved to Fortran in order to make computational time smaller.
Results: A package able of handling LME-models based on SDEs is now available in R. This will enable an easier way to get started with stochastic differential equations. As all R-Packages, PSM is a free and easy to install in R. The capabilities of working with model simulation, estimation and smoothing in R makes it possible to load and handle data, work with the modelling and plot the results in the same program.
Conclusion: The R-package PSM is a option for all users to get started with SDEs without having to buy programs or learn how to implement the Kalman filter by hand.
References: [1] S. Klim and S. Mortensen. DTU-IMM, Master Project 2006 [2] S. Mortensen et al. Journal of PK/PD. 2007 Oct; 34(5):623-42 [3] S. Klim and S. Mortensen - http://www.imm.dtu.dk/psm [4] R. Overgaard et al. Journal of PK/PD. 2005 Feb;32(1):85-107
François MERCIER Simulation and evaluation of bivariate Beta distribution for interval response variables
Francois Mercier, Amy Racine Novartis Pharma AG
Objectives: In certain clinical trials, the response variable is restricted into an interval (e.g. visual analogue scale VAS). This response may be measured repeatedly during the trial. A natural distribution for such a variable is a multivariate Beta distribution. For clinical trial simulations, it is therefore necessary to generate data from such a distribution in order to perform inference/predictions.
Methods: We assume a clinical trial in which a response variable Y, characterized by an interval distribution, is evaluated at both early (Y1) and late (Y2) stages. The clinical trial may have been designed in such a way that at the occasion of an interim analysis, one wants to predict Y2 based on the available Y1 data for decision making (e.g. futility or success of the trial). With such a possibly skewed distribution of interval data, it is not recommended to use e.g. a truncated bivariate normal distribution for simulation, but rather a bivBe (bivariate Beta) distribution. Generation of univariate Beta-distributed random variable is straightforward, but generating pairs of correlated Beta-distributed random variables is more complex since there is no natural multivariate extension of univariate Beta distribution (Johnson and Kotz [1]). It is proposed to use a Dirichlet distribution to simulate outcomes from a bivBe distribution. The Dirichlet distribution can be generated via a set of four independent Gamma distributions. Various methods are also presented for the evaluation of the response (to treatment) at the interim analysis.
Results: The data generation is implemented in SAS or R, whereas the evaluation and prediction of data generated from a bivBe distribution has been implementation in WinBUGS.
References: [1] Johnson N.L., Kotz S. 1976. Distributions in statistics: Continuous multivariate distributions. Wiley, New York.
156
Poster: Methodology- Algorithms
Benjamin Ribba Monolix benefits from external modules to manage complex ODE: Illustration with a population analysis of Irinotecan and its metabolites.
B. Ribba, K. Chatel, M. Tod, P. Girard, G. Freyer, B. Tranchand Université de Lyon, Lyon, F-69003, France; Université Lyon 1, Ciblage Thérapeutique en
Oncologie (EA3738), Faculté de Médecine Lyon-Sud, Oullins, F-69921, France.
Objectives: The wish to develop integrative mathematical models to better monitor anti-cancer drugs pharmacokinetic (PK), efficacy and toxicity requires the extension of population approaches to deal with complex ordinary differential equation (ODE) models that become difficult to identify with classical population PK softwares.
Methods: To illustrate this methodological issue, PK data of Irinotecan (CPT-11) and three of its metabolites, 7-ethyl-10-Hydroxycamptothecin (SN38), 7-ethyl-10-Hydroxycamptothecin glucuronide (SN38G), and 7-ethyl-10-[4-N-(acid5-aminopentanoïque)-1-piperidino]-carbonyloxycamptothécine (APC), coming from 162 patients enrolled in pediatric phase I and phase II clinical trials representing 5345 observations (33 observations on average per patients; 45 per patient enrolled in the phase I and 21 per patient enrolled in the phase II; 9.3 observations in average for CP11, 7.1 for SN38, 7.7 for SN38G and 8.9 for APC) were analyzed. The full model was characterized by starting from Irinotecan concentration data only (step 0) and plugging successively SN38 (step 1), SN38G (step 2), and finally APC (step 3). Monolix 2.3.1 with the use of CVODE Software Package [1] was compared to NONMEM ADVAN7, ADVAN6 (Runge-Kutta Verner order 5 and 6), ADVAN8 (ADAMS), and ADVAN9 (Livermore solver /ODEPACK).
Results: Monolix 2.3.1 using external C++ modules allowed us to characterize efficiently the different structural models. CPT-11 and SN-38 data (step 1) have been fitted by a linear model with four compartments; successive step (CPT-11, SN-38 and SN-38G) resulted in a five compartment model while the full model (step 3) was constituted by seven compartments. Model was validated based on goodness of fit. Computational times were ranging from 13 (step 1) to 33 minutes (step 3). Using the same “sequential” procedure, data analysis was much more difficult to handle with NONMEM VI. As an example, step 1 lasted for 19 minutes with ADVAN7/FO. More detailed comparison is ongoing.
Conclusions: Monolix coupled with the external C++ modules constitutes a relevant tool to develop physiologically-based PK/PD models. Hopefully, the full PK model of Irinotecan will provide a rational identification of covariates and will be informative on the role of its metabolites.
References: [1] Cohen, S.D., and A.C. Hindmarsh. CVODE, a Stiff/Nonstiff ODE Solver in C. Computers in Physics, 10, 2, pp. 138-143, March/April 1996.
157
Poster: Methodology- Design
Massimo Cella Randomisation to exposure in early paediatric trials: an analysis on the influence of the dose on the heterogeneity in the response to abacavir.
Massimo Cella(1), Meindert Danhof(1), Oscar Della Pasqua(1,2) (1)Division of Pharmacology, LACDR, Leiden University, Leiden, The Netherlands, (2)Clinical
Pharmacology & Discovery Medicine, GlaxoSmithKline, Greenford, UK
Introduction: The efficacy of a pharmacological treatment is usually described by a function that relates the effect with the dose of the drug that has been administered. However, plasma concentration or exposure (e.g., AUC) are known to be better descriptors of the pharmacological effect. Neverthless, efficacy evaluation in clinical trials still imposes the use of the same dose to all the patients involved, leading to large variability in drug concentration and exposure. This variability increases even further when one considers the response to treatment, which yields misleading information about efficacy, toxicity and variability itself. This issue is particularly important in paediatric pharmacology, where differences in response may occur and no clear relationship between dose and exposure is assessed before the start of the trials.
Objectives: To assess whether an adaptive design in early clinical trials based on "variable dosing - controlled exposure" can provide better dosing recommendations compared to the standard fixed dose approach.
Methods: Using Trial Simulator v. 2.0, two paediatric studies (n=60) have been simulated for abacavir. In the first study, plasma concentrations following a 600 mg abacavir administration were taken at standard sampling times. The data were fitted with a one compartment model that included the effect of weight on clearance and volume of distribution (NONMEM v.6). In the second study, an adaptive design was used in which patients were randomised to exposure, with a target of 6.02 mg*h/L (efficacious exposure in adults). Patients were administered with the starting dose of 600 mg. Plasma concentrations were modelled and clearance and systemic exposure estimated (AUC). Based on these results, the dosage strength for the remaining duration of treatment was recalculated to achieve target exposure. Final parameters estimates and dosing recommendations were compared between the 2 approaches.
Results and conclusions: Preliminary results show that adaptive randomisation can be used to optimise dosing regimens in early paediatric research. This approach increases the probability of demonstrating efficacy (i.e., study power) as compared to dose-controlled trials. Furthermore, it contributes to further understanding of the role of dose on the total heterogeneity in clinical response.
158
Poster: Methodology- Design
Marylore Chenel Optimal design of QTc interval measurements for circadian rhythm determination
Marylore Chenel(1), Laetitia Canini(1), Kayode Ogungbenro(2) and Emmanuelle Foos-Gilbert(1) (1). Institut de Recherches Internationales Servier, France. 2. CAPkR, School of Pharmacy,
University of Manchester, United Kingdom
Introduction: Several classes of non-antiarrhythmic drugs induce lengthening of the QT interval. QT interval length is considered as a biomarker of ventricular tachiarrhythmia (Torsade de pointe). Regulatory agencies require QT/QTc studies to evaluate cardiac safety of non anti-arrhythmic drugs (1). The QT and RR intervals, as well as the QTc interval, are known to vary during the day (circadian rhythm) (2). Badly designed studies can miss this rhythmicity and the within-day variations can lead to a wrong conclusion concerning the cardiotoxic effect of the tested drug. It is thus important to reveal this phenomenon. As the number of electrocardiogram (ECG) is often limited, determining the minimum number and the location of QT measurement by an optimal design approach could be useful to take into account circadian QTc's variations in population pharmacokinetics/pharmacodynamics (PK/PD) analyses.
Objectives: Our aim was to determine the optimal ECG's record times to assess the best estimations of model parameters describing the QTc circadian rhythm.
Methods: QTc data coming from two phase I studies including a total of 160 healthy volunteers under placebo were used to build the population model for the QTc baseline. ECGs were recorded during 24h with an average 10 records per period and per subject. Estimation of the population parameters characterizing the QTc baseline was performed using NONMEM V with the FOCE-I method. Once, the population model was built and validated with an external study by visual predictive checks, ECG's record times were optimized by D-optimal design approach in PopDes version 3.0. The design domain consisted in times between 6 and 24h o'clock in order to save a sleep period. Only one group of 100 subjects was considered. The maximization procedure was based on a local exact design optimization performed using the modified Fedorov exchange algorithm (3) in PopDes version 3.0. At last, the optimal design was evaluated by simulations and estimations with NONMEM V.
Results: The circadian QTc rhythm was modeled as a mesor and a sum of three cosine terms (one amplitude and one lag-time per cosine term), representing three periods of 24, 12 and 6 h. Thus, the population model consisted of 7 fixed-effect parameters with inter-individual variability parameters and a proportional residual error model. The lag-time of the second cosine term was fixed to zero in the model. According to the coefficients of variation of the standard error (CVSEs) given by the population Fisher information matrix, the best design (i.e. with a minimum number of records) was obtained with 7 optimal record times. With this optimal design, CVSEs of fixed-effect parameters were all less than 20% except for the amplitude of the second cosine term, which was equal to 27%. At last, simulations and re-estimation with NONMEM showed that this design was able to correctly estimate fixed-effect parameters of this placebo QTc model.
Conclusions: A design with 7 ECG's records allows to well describe the circadian QTc rhythm taking into account clinical constraints. This optimized protocol could be applied in regular QTc
159
studies in order to well estimate circadian QTc rhythm when data are analyzed by population PK/PD modeling and therefore correctly assessed the potential cardiotoxic effect of evaluated drug.
References: [1] International Conference on Harmonisation; guidance on E14 Clinical Evaluation of QT/QTc Interval Prolongation and Proarrhythmic Potential for Non-Antiarrhythmic Drugs; availability. Notice. Fed Regist. 70.202 (2005): 61134-35. [2] Piotrovsky, V. "Pharmacokinetic-pharmacodynamic modeling in the data analysis and interpretation of drug-induced QT/QTc prolongation." AAPS J 7.3 (2005): E609-E624.
160
Poster: Methodology- Design
Marion Dehez Optimal window design of blood pressure time measurements in hypertensive dippers and non-dippers using ABPM: Application of the compound
D-optimality approach.
Marion Dehez (1), Kayode Ogungbenro (2), Emmanuelle Foos-Gilbert(3), Stéphanie Ragot (1) and Marylore Chenel (3)
(1) CIC Inserm 802, CHU La milétrie 86021 Poitiers ;(2) Centre for Applied Pharmacokinetic Research, University of Manchester, United Kingdom ; (3) Institut de Recherches Internationales
Servier, France.
Objectives: Ambulatory Blood Pressure Monitoring (ABPM) is a non invasive method whose both diagnostic value and prognostic significance have been recognized for many years. The ABPM allowed to distinguish two populations regarding their 24-h BP profiles: the dippers, who experience at night at least a 10% decrease of daytime BP values, and the non-dippers, who have a BP decrease at night less than 10% of daytime values. Their respective BP rhythm has been described by a population modeling approach (1). In clinical trials, ABPM when performed on 24-hour provide about 100 readings. Readings have to meet strong quality criteria and 75% of the recordings have to be present over the 24 h period in order to calculate means and standard deviations. Those which do not meet the quality criteria are rejected resulting in an important loss of information.
Our objective was to show that ABPM analysis by population approach with an optimal window design allows to take benefit of the total information collected during clinical trials and to reduce the number of records needed. Hence, the minimum number and the optimal measurement time windows for 24-h BP cycle model parameter estimation in dippers and non-dippers were determined.
Methods: Models previously developed (1) describing 24-h SBP (Systolic Blood Pressure) variations in dippers and non-dippers were used to determine fixed optimal measurement times (step1) and then optimal windows (step2). This was done simultaneously in dippers and non-dippers using the compound D-optimality approach (3). This approach allows to optimize measurement times for population parameter estimation in a population made of 2 sub-populations (i.e. 2 models). Each model consisted in 7 fixed-effect parameters with interindividual variability and an additive residual error model. The design domain consisted in times over 24 h without any constraints and there was only one group with 100 subjects. The maximization procedure was based on a local exact design optimization performed using the modified Fedorov exchange algorithm (2). Then, optimal time windows were determined using the approach described by Graham and Aarons (4).
For both populations 1000 simulations and estimations were performed using NONMEM to evaluate optimal fixed time designs as well as optimal sampling windows designs.
Results: The best design without duplicated times and a satisfactory level of accuracy for parameter estimation (less than 20% for fixed effect parameters) was with 8 measurement times. The best compromise between a satisfactory level of efficiency and windows wide enough was with 95% level of efficiency giving 3 h-time windows. Optimal windows were: [0:35-2:35 am], [3-5 am], [6-8
161
am], [9:15-11:15 am], [0:35-2:35 pm], [3:20-5:20 pm], [6:30-8:30 pm] and [9:30-11:30 pm]. Design evaluations showed that the coefficient of variation of standard error (CVSE) for all parameters computed from the population Fisher information matrix were in agreement with those computed empirically from simulations and estimations.
Conclusion: The compound D-optimality approach was particularly adapted to our concern of joint determination of optimal measurement times in 2 sub-populations. Eight optimal 3 h-time windows were found satisfying to estimate model parameters in both dippers and non-dippers.
Thus, the analyse of ABPM by population approach with an optimal design would allow to avoid an important loss of information and the number of records needed to interpret the baseline ABPM during clinical trials could be dramatically reduced. Quality criteria for ABPM during clinical trials should be re-evaluated if data are analysed by population approach.
References: [1] Dehez Marion, Chenel Marylore, Jochemsen Roeline, Ragot Stéphanie. Population modeling approach of blood pressure circadian variations using ambulatory monitoring in dippers and non-dippers. PAGE 15 (2006) Abstr 989 [www.page-meeting.org/?abstract=989]. [2] Ogungbenro Kayode, Graham Gordon, Gueorguieva Ivelina, Aarons Leon. The use of a modified Fedorov exchange algorithm to optimize sampling times for population pharmacokinetic experiments. Comput Methods Programs Biomed. 2005; 80(2):115-25. [3] Atkinson AC, Bogacka B. Compound D- and D-s-optimum designs for determining the order of a chemical reaction. Technometrics. 1997; 39: 347-56. [4] Graham Gordon, Aarons Leon. Optimal blood sampling time windows for parameter estimation in population pharmacokinetic experiments. Statistics in Medicine. 2006; 25: 4004-19.
162
Poster: Methodology- Design
Phey Yen Han Informative Study Designs to Identify True Parameter-Covariate Relationships
Phey Yen Han, Carl MJ Kirkpatrick, Bruce Green School of Pharmacy, University of Queensland, Brisbane, Australia
Introduction: Covariate selection is an important component of population pharmacokinetic-pharmacodynamic model building that helps quantify part of the between subject variability (BSV) in model parameter estimates. Current research has primarily focused on varying experimental design using techniques such as D-optimality or simulation to ensure parameters can be estimated with good precision. We are unaware of research that has sought to enrich the probability of true covariate selection by varying the study design.
The objective of this study was to examine how study design impacts upon the probability of choosing the true covariate from two competing covariate models, using lean body weight (LBW) [1] and total body weight (WT) as an example.
Methods: A 1-compartment, first order input, first order elimination model with proportional residual unexplained variability (RUV) and BSV on clearance (CL) and volume (V) was used to simulate concentrations following a single 1mg/kg (of WT) dose of enoxaparin [2]. CL included the covariate LBW [3] and V included the covariate WT, both in a linear fashion. Demographic datasets were generated using 6 covariate distribution models under 2 different study designs. The first covariate distribution model included subjects who fell within a WT range of 50-80kg. For design A, demographics were simulated by sampling from a normal distribution within the specified WT range (e.g. 50-80kg). For design B, demographics were also simulated from the same covariate distribution model, but WT was stratified into 3 discrete groups of equal range and size, i.e. one-third of subjects were in each stratum of 50-60, 60.1-70, and 70.1-80kg. This was repeated for the 5 other covariate distribution models with WT ranges of 50-90, 50-100, 50-110, 50-120, and 50-130kg.
A dataset that comprised of 99 subjects, each with 12 sampling times, was simulated 1000 times under the 12 experimental designs. Two competing covariate models were fitted to the simulated data. The ‘True Model' was parameterised with LBW on CL [3] and was identical to the simulation model. The ‘False Model' had WT as the covariate on CL. The differences in objective function values (empirical ΔOBJ = OBJTrue - OBJFalse) between the 2 competing models were computed and the probability of LBW being preferred was given by the ratio of the number of negative ΔOBJ values to the number of runs.
Additional scenarios with differing magnitudes of random effects, sparse sampling (3 sampling times), and a larger sample size (600 subjects) were explored. The predictive performance of the models under different study designs was also assessed by performing a visual predictive check (VPC) on individual WT strata (50-77, 77.1-104, 104.1-130kg), as well as across the full WT range (50-130kg).
Results: Extension of the WT range under design A did not generate a proportional increase in the number of subjects at the tail ends of the WT distribution. On the contrary, design B provided more
163
subjects at the extremes of the WT distribution, thus producing a greater increase in mean WT and LBW as larger-sized individuals were recruited into the trial, and lower values of mean WT and LBW at the narrower WT ranges. This implied that when stratification was employed, a greater number of larger- and smaller-sized subjects were recruited.
When WT was simulated from design A, the probability of LBW being preferred over WT decreased as larger-sized subjects were recruited into the trial, from 0.501 for 50-80kg to 0.408 for 50-130kg. The ability of design A to identify the ‘True Model' was further confounded when the sample size was increased to 600 subjects, with a probability of 0.509 for 50-80kg and 0.355 for 50-130kg. In contrast, under design B, the probability of LBW being preferred was always greater and increased as larger-sized subjects were included, from 0.855 for 50-80kg to 0.945 for 50-130kg. This probability was greatly improved when the sample size was increased, with values consistently above 0.994, demonstrating a high power to discriminate between the true and false covariates when stratification of WT was included in the study design.
The VPC for the ‘True Model' demonstrated good model fitting for each individual stratum, as well as for the full WT range. In contrast, the ‘False Model' fitted the data well at 50-77kg, but as the WTs of the recruited subjects increased, the predictive distribution of the model deviated from the ‘observed data', producing an overestimation of CL in the larger-sized subjects. These deficiencies were not apparent when the VPC was performed on the full WT range.
Conclusions: An informative covariate study design does not simply include a wide covariate range. The covariate distribution also has to be taken into account, since it contributes towards the informativeness of the data, and the ability to identify true parameter-covariate relationships. Incorporation of stratification into study designs and simulation-based diagnostics can potentially aid in the identification of relevant covariates and evaluation of model adequacy.
References: [1] Janmahasatian S, Duffull SB, Ash S, Ward LC, Byrne NM, Green B. Quantification of Lean Bodyweight. Clin Pharmacokinet. 2005;44:1051-65. [2] Retout S, Mentré F, Bruno R. Fisher Information Matrix for Non-Linear Mixed-Effects Models: Evaluation and Application for Optimal Design of Enoxaparin Population Pharmacokinetics. Statist Med. 2002;21:2623-39. [3] Han PY, Duffull SB, Kirkpatrick CMJ, Green B. Dosing in Obesity: A Simple Solution to a Big Problem. Clin Pharmacol Ther. 2007;82:505-8.
164
Poster: Methodology- Design
Tracy Higgins Simulation and Design Considerations for Noninferiority Trials in Phase II
Tracy Higgins, Meg Bennetts, Patrick J Johnson. Pfizer, Inc. UK
Objectives: Increasingly noninferiority designs are being used for Phase II trials to compare new drugs to standard treatment (i.e. a well proven standard therapy which has been shown to be superior to placebo, and has an established, predictable and quantifiable effect). It is often of interest to know early in the drug development process whether the new drug is equi-efficacious to standard treatment. In particular where the benefits of the new drug may be a better safety profile or an improved administration schedule. The large sample sizes required for noninferiority trials means they can be more costly and take longer to run, so it is important that the design is optimised to keep the impact on costs and timelines to a minimum. This poster outlines simulation methodology used to optimise trial design for a Phase II PoC study where the primary objective is to assess noninferiority against the standard treatment, and the secondary objective is to define the dose-response of the new drug in patients.
Methods: The noninferiority margin defines the largest difference that is clinically acceptable between treatments for those treatments to be regarded as clinically equivalent. Setting the margin is critical to the design and is based on the range of possible true differences between test drug and active control (from uncertainty in the mean response and the trial design). Noninferiority is usually assessed through confidence interval estimation with regard to this margin. In the example shown PK/PD models are available for both the new drug and the standard treatment and are used for simulation. The primary endpoint is FEV1 and the noninferiority margin is defined as -100 mL (a combination of the true mean difference and acceptable variability in the mean response based on the trial design). All data shown in the example presented are simulated data.
Technical success: Simulations were performed across a wide range of doses (incorporating parameter uncertainty from the PK/PD model but otherwise assuming an infinite number of subjects for each dose) and the distribution of the dose response presented graphically with the simulated response of the control treatment. For each replicate the equi-efficacious dose for the new drug was calculated and the distribution of equi-efficacious doses summarised across replicates.
Dose selection and optimisation: After establishing the possible dosing strength options, doses were selected using a modified version of PFIM 1.2 [3] and a D-optimal iterative process that incorporates the influence of model uncertainty [4]. The optimal design solutions were verified using classical trial simulations.
Trial success: The lower confidence interval of the difference between new drug and standard for each dose level was compared to the noninferiority margin (-100 mL) for each simulated trial. To calculate the probability of success and being correct the noninferiority margin was defined differently for technical success (probability correct) to eliminate the variability due to trial design. Operating characteristics were calculated for technical success noninferiority margins of -30 mL, -40 mL and -50 mL and the results compared.
165
Impact of dose-response approach: Each of the simulated trials was analysed using a dose-response approach to calculate the SE of the mean response of the new drug and using a pairwise comparison approach for each dose level separately, to assess the relative efficiency of the two methods. These comparisons were performed for the parallel group design and for the crossover design.
Interim Analysis:Simulations were performed incorporating an interim analysis to select a dose to carry forward to the second part of the trial for assessment of noninferiority with the control treatment.
Results: Not available yet
Conclusions: Not available yet
References: [1] Cornel P: Equivalence and noninferiority trials - are they viable alternatives for registration of new drugs? (III). Curr Control Trials Cardiovasc 2004, 5:8 (17 August 2004). [2] Snapinn SM: Noninferiority Trials. Curr Control Trials Cardiovasc 2000, 1:19-21. [3] Retout, S. & Mentré, F. Optimisation of individual and population designs using Splus. Journal of Pharmacokinetics and Pharmacodynamics, 2003, 30(6): 417-443. [4] Johnson, P., Dai, H., Neelakantan, S. & Tensfeldt, T. Optimal dose & sample-size selection for dose-response studies. PAGE 16 (2007) Abstr 1127 [www.page-meeting.org/?abstract=1127]
166
Poster: Methodology- Design
Hyung Ki Kim The Effect of Study Design on Pharmacokinetics in Patients with Impaired Renal Function
HK. Kim(1), SB Duffull, (1,2), B. Green(1) (1) School of Pharmacy, University of Queensland, Brisbane, Queensland, Australia (2) School of
Pharmacy, University of Otago, Dunedin, New Zealand
Objectives: To ensure the effect of renal function on drug exposure is precisely quantified, FDA guidance recommends that studies recruit approximately equal subject numbers with normal renal function and mild, moderate and severe renal impairment. However, in population PK analyses it is common to pool data from various studies, resulting in an over-representation of subjects with normal renal function. The purpose of this simulation based experiment was to explore how varying the design, with respect to subject numbers in the different renal function groups, impacts upon the precision of PK parameter estimation.
Methods: A 1-compartment, first order input, first order elimination model was used to simulate concentrations following a single 1mg/kg dose of a drug. Clearance (CL) was defined as a composite of renal CL (0.7 L/hr) and non-renal CL (0.3 L/hr). During the simulation, subjects were stratified into the 4 renal function groups where normal renal function, mild, moderate and severe renal impairment were classified as creatinine clearances of ≥80, 50-79.9, 30-49.9 and <30 mL/min respectively. 1000 trials with 100 subjects per trial were simulated under five different designs. Design A included 25 subjects in each of the 4 renal function groups. Designs B, C, D and E included 33-33-33-0, 50-50-0-0, 100-0-0-0 and 76-8-8-8 subjects in each renal function group respectively. Both intensive and sparse samplings were evaluated for each design, as well as differing magnitudes of random effects. PK parameters were re-estimated and compared across the designs. The percentage of times that the PK estimate was within 10% of the true value was computed for each design.
Results: For dense sampling the median (SE) estimates of renal CL in designs A, B, C, D and E were 0.68(0.06), 0.67(0.08), 0.62(0.12), 0.53(0.17) and 0.68(0.06) respectively. For design A, the estimate of renal CL was within 10% of the true value on 71.6% of occasions. This percentage decreased to 57.8, 37.9 and 19.7% under designs B, C and D respectively. The percentage was 71.8% in design E.
Conclusions: Design, A which had equal numbers of subjects in the different renal function groups resulted in the lowest standard errors together with the design that pooled a renal impairment study with subjects that had predominantly normal renal function (Design E). Excluding subjects with severe renal impairment in pooled population PK analysis does not give a reliable estimate of the renal effect on CL.
167
Poster: Methodology- Design
Rocio Lledo Impact of study design for characterising PKPD covariance and nonlinearity in exposure-dichotomous response relationships
Rocío Lledó-García, Stefanie Hennig, Mats O. Karlsson Department of Pharmaceutical Biosciences, Uppsala University, Uppsala, Sweden
Objectives: Characterisation of exposure-response for therapies where the clinical endpoint is a bivariate outcome generally involves two assumptions: (i) the random effect determining the dose-exposure relation is not related to any parameter of the exposure-response relation, and (ii) the drug effect is linear on the logit scale[1-3]. This study aims at assessing the assumptions for randomised dose controlled trials (DCT) and concentration controlled trials (CCT) with a particular focus on drugs with narrow therapeutic index.
Methods: A simulation-based study was performed using NONMEM VI, considering a hypothetical immunosuppressant agent with rejection as main efficacy endpoint. The PK-model was described by a one-compartment model at steady state and the pharmacodynamic relationship with a logistic model. Different scenarios were simulated and analysed: three designs were compared, a DCT and two CCTs (a target equivalent (TCCT) and a variability equivalent (VCCT)). For each design two target levels (low and high dose (DCT) or exposure (CCT)) were considered. In the different scenarios, the exposure-response relationship was described by: a) linear logistic regression model with (-/+) covariance between clearance (CL) and the baseline or slope parameter (“PKPD covariance”); b) nonlinear exposure-response relationship described by a power function, with different grades of nonlinearity expressed by the power parameter value (2, 3, 4). In the latter case, the CCTs were targeting for 3 levels of exposure instead of two, due to the lack of information to estimate the power parameter in the relationship, otherwise.
Results: In regards to precision and bias in parameter estimates: DCT and VCCT were superior for a (+) and (-) PKPD covariance between CL and baseline, respectively. When the PKPD covariance existed between CL and slope, the VCCT design was the more precise regardless of the sign of the correlation. The VCCT and TCCT showed highest power to detect the correlation in all cases. To characterise a nonlinearity in exposure-response, DCT was more precise and less biased in the parameter estimates as well as showing higher power. However, the VCCT was almost as precise. To achieve a >90% power to detect either a PKPD covariance or nonlinearity, studies involving >500 patients would be required.
Conclusions: For drugs with narrow therapeutic index a VCCT or DCT design would be the most informative to describe the exposure-response relationship when there is a PKPD covariance in the parameters, whereas a DCT seems to be more informative when describing nonlinear relationships between exposure and response. However, it appears that typical studies of this type would not have enough power to reliably detect such relationships regardless of design.
References: [1] Hale, M.D., et al., The pharmacokinetic-pharmacodynamic relationship for mycophenolate mofetil in renal transplantation. Clin Pharmacol Ther, 1998. 64(6): p. 672-83. [2] Yassen, A., et al., Pharmacokinetic-pharmacodynamic modeling of the effectiveness and safety of buprenorphine and fentanyl in rats. Pharm Res, 2008. 25(1): p. 183-93.
168
[3] Green, B. and S.B. Duffull, Development of a dosing strategy for enoxaparin in obese patients. Br J Clin Pharmacol, 2003. 56(1): p. 96-103.
169
Poster: Methodology- Design
Rocio Lledo Randomised dose controlled trials or concentration controlled trials when learning about drugs with narrow therapeutic index?
Rocío Lledó-García, Stefanie Hennig, Mats O. Karlsson Department of Pharmaceutical Biosciences, Uppsala University, Uppsala, Sweden
Objectives: Over the last two decades many comparisons between randomised dose controlled trials (DCT) and concentration controlled trials (CCT) have been made [1-3]. Interestingly, none of these has focused on the relative merits of CCT versus DCT for drugs with narrow therapeutic index, when considering the pharmacokinetic (PK) information in the exposure-response analysis for the DCT. This study aims at making such a comparison, for a more informative decision making assessing the possible gains and pitfalls of the trial designs.
Methods: A simulation-based study was performed using NONMEM VI and PsN, considering a hypothetical immunosuppressant agent with two clinical endpoints (rejections and infections). The PK-model was described by a one-compartment model at steady state and the pharmacodynamic relationship with two independent regression logistic models. Different scenarios were simulated and analysed: three designs were compared, a DCT and two CCT’s (a target equivalent (TCCT) and a variability equivalent (VCCT)). For each design two target levels (low and high dose (DCT) or exposure (CCT)) were considered. Different sizes of study and four different ranges of target levels were explored (both levels below or above the optimal exposure, both levels close on one side to the optimal exposure and one target level on either side of the optimal exposure). Considering the outcomes from the different scenarios the relative benefits of performing TDM versus a fixed dose regimen was assessed.
Results: The DCT showed to be superior over the CCT’s in all the following respects: (i) precision and bias in parameter estimates, (ii) precision and bias in the estimate of optimal exposure, (iii) bias in prediction of the therapeutic benefit at estimated optimal exposure, and (iv) bias in prediction of the therapeutic benefit of dose individualization over fixed dosing. This superiority was evident across all study sizes and target ranges explored.
Conclusions: A DCT design is a more informative design when describing the exposure-response relationship for drugs with narrow therapeutic index. It will improve information gained on the optimal dose and consequently improve prediction of the expectations of adverse events in the target population. The DCT thus can reach the same parameter precision with a lower number of subjects and with fewer adverse events in the dose-finding study.
References: [1] Sanathanan, L.P. and C.C. Peck, The randomized concentration-controlled trial: an evaluation of its sample size efficiency. Control Clin Trials, 1991. 12(6): p. 780-94. [2] Endrenyi, L. and J. Zha, Comparative efficiencies of randomized concentration- and dose-controlled clinical trials. Clin Pharmacol Ther, 1994. 56(3): p. 331-8. [3] Karlsson, K.E., et al., Randomized exposure-controlled trials; impact of randomization and analysis strategies. Br J Clin Pharmacol, 2007. 64(3): p. 266-77.
170
Poster: Methodology- Design
Mark Lovern Leveraging complicated PK/PD models for the development of a Bayesian adaptive Dose-ranging design.
B. Boulanger, A. Jullion and M. Lovern Pharmacometrics, UCB Pharma, Belgium
Background: When designing a Dose-ranging study, a common approach is to envisage the use of a Bayesian dose adaptive design, where the dose will progressively be adapted as patients are enrolled, to optimize a specific efficacy end-point and the confidence on the dose that gives the minimal required efficacy. Frequently, adaptive trial designs have been based upon simulations from assumption-rich, simplistic models relating dose to one or more efficacy end-points to optimally select the rules of adaptation, such as allocation and stopping rules. Our objective is to show how to leverage a sophisticated PK/PD model, relating dose to exposure (PK) and exposure to response (PD), including covariate effects. In so doing, we hope to obviate the limitations inherent in empirical dose-response models and allow greater flexibility in exploring alternative trial design scenarios.
Methods: The method envisaged here can be decomposed into two steps. First, using Pharsight Trial Simulator (TS2), we simulate thousands of "virtual" patients, at a wide range of doses, relying on the PK/PD model. Those "virtual" patients are stored into a database. By changing the parameters of the PD component of the model, various scenarios, from no efficacy to high efficacy as a function of dose are envisaged. Second, a cohort-based adaptive design is established where 20 patients in each cohort were allocated to placebo and up to four doses. Patients are allocated in order to minimize the variance of the smallest dose that gives an expected proportion of 80% of patients with an efficacy score improved by at least 50% at 2 weeks. To relate the efficacy end-points to the Dose, a Bayesian Normal Dynamic Linear Model (NDLM) model, implemented in Winbugs, is considered. The adaptive design is then intensively simulated by drawing, with replacement, virtual patients within the data base created by TS2.
Conclusions: The proposed approach is found meaningful and relevant, in comparison with the traditional approach based on empirical models that relate dose to efficacy response, because it integrates all the richness and uncertainty up to the present stage of development. This alleviates the need to make strong assumptions for the model that relates dose and response. In addition, as far as PK/PD models enable the use of appropriate covariates, it's even possible to investigate and optimize the population of interest to be included into an adaptive study.
171
Poster: Methodology- Design
Mark Lovern Development of a Bayesian Adaptive Sampling Time strategy for PK studies with constrained number of samples to ensure accurate estimates.
B. Boulanger (1), A. Jullion (1), J. Jaeger (2), M. Lovern (1) and C. Otoul (1) (1) Pharmacometrics, UCB Pharma, Belgium. (2) Université de Strasbourg.
Background: When designing a PK study in which both the typical pharmacokinetic behavior and between-subject variability of the compound are poorly-understood, the search of Bayesian optimal design suggests using large numbers of sampling times and patients to ensure credible estimation of model parameters. When, for ethical reasons, the number of samples per patient and the number of patients is constrained (ie small children), then finding an optimal sampling strategy may be problematic. Our objective was to develop a robust methodology for optimizing each patient's sample times based upon the PK information available from preceding subjects, and thereby simultaneously maximize the accuracy of parameter estimates and minimize the number of samples. The approach we employed was the Bayesian Adaptive Sampling Times (BAST) strategy, for which it was assumed that the functional form of the model was known with perfect certainty.
Methods: The method envisaged here can be decomposed into several steps as classically encountered in adaptive designs. First, priors on the parameters are established based on previous data or information. Based on these priors, an optimal design for non-linear mixed effect models is determined, using Pfim. Second, after collection of concentration values on a patient or a cohort of patients, a Bayesian PK model (Winbugs) is fitted to the data using the model and the priors elicited previously. Third, the posteriors from the Bayesian fit are then used as prior for finding the optimal design for the next patient of cohort. This process is iterated each time a patient is recruited and continues until confidence on parameter estimates is deemed satisfactory.
Results: This approach was found to be very efficient for estimating the parameters of a pharmacokinetic model. When the guesses about the priors are wrong or very uninformative, then the BAST provides significantly more accurate estimates of the parameters than those derived from a fixed design based upon the same (wrong) assumptions. When the guess is correct, then the BAST doesn't impact the original optimal plan and estimates are as accurate as the fixed design without loss of power. The BAST method also appears to converge rapidly to the optimal sampling schedule.
Conclusion: The BAST approach is found to be an easy and efficient way to obtain reliable estimates of PK parameters under uncertainty and sampling restrictions.
172
Poster: Methodology- Design
Guy MENO-TETANG The Use of Clinical Trial Simulation to investigate Bias in Crossover Studies with a Short Washout Period and no Placebo Arm: Application
to Neuropathic Pain
G. Meno-tetang, A. Berges, S. Yang, and C. Chen GlaxosmithKline, Greenford, UK
Objectives: Clinical trials in neuropathic pain are often run in parallel designs. The placebo response following administration of drugs such as gabapentin is now well characterized. This knowledge may be used to characterize the intrinsic response for doses not previously investigated. Although this correction with historical placebo data may be appealing when a parallel design is considered, a significant level of bias may be introduced in the case of a double blind 2-period crossover design. The placebo response of each patient in the second period may be influenced by the pain reduction perceived at the end of the first period. The objective of this work was to evaluate the level of bias that may be introduced in the comparison of the intrinsic effect of two doses in a study using a crossover design using historical placebo data obtained in the same indication and the same drug.
Methods: A parallel (reference) and a crossover trial with a short washout period were simulated with a low and a high dose. A pharmacokinetic-pharmacodynamic (PK/PD) model relating pain relief1 was used. The pain response in the first period of the crossover was deemed equivalent to that of a parallel design for the same dose level. However, drug response in the second period of the crossover was a function of the overall response (Placebo + drug) at the end of the first period, the level of patient expectation (number of points reduction in a visual analogue scale, VAS), and an arbitrary psychological factor.
Results: The results of the simulations show that in neuropathic trials using a crossover design, the placebo response in period two may be different from that of period one. If patients thought they were assigned to the low dose in the first period, they will experience a greater placebo response in the second period. Therefore, their expectations for the second part of the study will be raised. On the other hand, the placebo response in period 2 may be less important for subjects in the sequence: High Dose-to-Low Dose. The likelihood of seeing a difference between the two periods will be greater when the difference between the two dose sizes is large and when the level set for clinically significant response is smaller or equal to 2 points on a VAS. These simulations provide an approach to quantify the level of bias that may be introduced when data from a crossover study are corrected with historical placebo data obtained from a parallel design.
Conclusions: Given the subjective nature of the response to drugs in neuropathic pain, the placebo response may have a significant contribution to the overall response. Using historical placebo data from a parallel design may introduce a bias in the analysis of data from a crossover design even for the same drug and the same indication.
References: [1] P Lockwood et al. Pharmaceutical Research, Vol. 20, No. 11, November 2003
173
Poster: Methodology- Design
Joakim Nyberg Dose and sample time optimization of drug candidate screening experiments
Joakim Nyberg, Erik Sjögren, Hans Lennernäs, Andrew Hooker Department of Pharmaceutical Biosciences, Uppsala University, Uppsala, Sweden
Objectives: The estimation of the metabolic stability, i.e. the metabolic clearance, is of importance to decide if a new molecular entity will be suitable as a new drug. The current "standard" method assumes a mono-exponential decay model of the clearance. This can be a good approximation for most drug candidates but some drugs have a non-linear elimination and therefore a Michaelis-Menten model is more suitable.
To increase the efficiency in various stages in drug development, optimal experimental design has been used [1]. This approach has mostly been used to optimize sample times but it is also possible to optimize other design variables [2]. Further, when optimizing more than one continuous design variable, the simultaneous optimization approach should be considered [3].
The aim of this exercise is to determine a more optimal dose and sampling scheme that could be used for estimating the metabolic clearance for drug candidates with linear or non-linear elimination.
Methods: An analytic solution to a one compartment PK model with nonlinear elimination was used [4]. For the design to be optimal over numerous drug candidates, a modified ED-optimal design with penalty was performed in PopED v2 [5]. Briefly, the ED parameters' prior was a multivariate nonparametric distribution of 76 Vmax and Km values collected from SIMCYP [6]. The penalty function was formulated to normalize the influence of each set of parameter values in the prior on the optimal design. The design for a new drug candidate comprised 15 elementary designs (groups) with one sample and one dose for each elementary design. The samples were limited to 0-40 min and the doses were limited to 0-100uM. An upper and a lower LOQ for the concentrations where set to 0.1uM and 100uM respectively. A proportional residual variability was assumed fixed to 7.5%.
Results: Expected CV's for the modified ED-design with penalty gave, in all cases, at least a 60% improvement in expected model parameter CVs. If a standard ED-design was used the most informative parameter values tended to over influence the design, resulting in design deficiencies compared to the standard design for some types of drug candidates.
Conclusions: A method for improving the estimation of metabolic clearance for new drug candidates has been implemented. Further this method assumes a more accurate model. However, the choice of the penalty function is important to make the design robust for new candidates.
References: [1] Mentré, F., A. Mallet, and D. Baccar, Optimal design in random-effects regression models. Biometrika, 1997. 84(2): p. 429-442. [2] Foracchia, M., et al., POPED, a software for optimal experiment design in population kinetics. Comput Methods Programs Biomed, 2004. 74(1): p. 29-46.
174
[3] Nyberg, J., M.O. Karlsson, and A. Hooker, Sequential versus simultaneous optimal experimental design on dose and sample times. PAGE 16 (2007) Abstr 1160 [http://www.page-meeting.org/?abstract=1160]. [4] Beal, S.L., Computation of the explicit solution to the Michaelis-Menten equation. J Pharmacokinet Biopharm, 1983. 11(6): p. 641-57. [5] PopED, version 2.07 (2008) http://poped.sf.net/. [6] Proctor, N.J., G.T. Tucker, and A. Rostami-Hodjegan, Predicting drug clearance from recombinantly expressed CYPs: intersystem extrapolation factors. Xenobiotica, 2004. 34(2): p. 151-78.
Joakim Nyberg Application of Optimal Design for Disease Progression Studies
Stefanie Hennig1, Sebastian Ueckert1,2, Joakim Nyberg1, Andrew Hooker1, Mats O. Karlsson1 1.Department of Pharmaceutical Biosciences, Uppsala University, Sweden. 2. DFG Research
Center MATHEON and Freie Universitaet Berlin, Germany
Objectives: Disease progression (DP) studies are performed to obtain information on the effect of drugs for the long term prognosis on a disease. There were two aims of this study: firstly to demonstrate the application of optimal design to optimizing period lengths (delayed start, treatment, wash-out) for DP studies, secondly to characterize drug effects across different mechanisms and magnitudes for model discrimination by using uncertainty on parameter values and the expectation of the determinant (ED) for optimization.
Methods: Three drug effects (protective (P), symptomatic (S) and protective+symptomatic (PS)) were used in combination with a linear natural history model. ED-optimality was performed using PopED v.2 to optimize start and stop time of the treatment during the study. One general study design was chosen for all experiments, which had a total study length of 12 time units and 13 evenly spread fixed observations times. However, study designs without wash-out periods, with more or less samples or observation times were tested, as well as simultaneous optimization[1] on period lengths and sampling times. ED-optimality with a uniform distribution around effect parameters was employed to obtain the power to differentiate between different effects within this distribution by evaluating the 95% parameter estimate confidence ellipses. Furthermore, simulation (n=1000) and re-estimations were performed using NONMEM VI. RMSE and ME were calculated to evaluate the performance of the uniform ED-design on parameter estimations for 9 particular effect combinations.
Results: For the P model an optimal start time was found at time 0 and the stop time at time 5.95; for a drug with S effect the start was at 2.48 time units and the stop at 8.24 and for a drug with a PS effect the optimal start was at 0.32 and the stop at 5.61. An efficiency loss of 10-40% on average per parameter was found if no observations were taken during the wash-out period. Simultaneous optimization on sampling times and treatment period improved the efficiency of the designs by 35-50%. Additionally, the relative merits of extending the study length compared to increasing the number of samples per individual can be shown.
The designs optimized for a uniform distribution of effects showed good performance in comparison with designs optimal for a specific effect. However confidence regions spanning large parts of the parameter range made differentiating between some close effects impossible. The RMSE for 92% of the fixed effect parameters was under 20% for the 9 tested effect combinations.
Conclusions: We believe that the results shown in this study illustrate how DP study designs can benefit from formal optimal design analysis. Additionally we can illustrate how ED-optimality can be used to optimize for a wide range of effects.
Reference: [1] Nyberg J, Karlsson MO, Hooker A. Sequential versus simultaneous optimal experimental design
176
on dose and sample times. PAGE 16 (2007) Abstract 1160 [http://www.page-meeting.org/?abstract=1160].
177
Poster: Methodology- Design
Kayode Ogungbenro An Effective approach for Obtaining Optimal Sampling Windows for Population Pharmacokinetic Experiments
Kayode Ogungbenro1 and Leon Aarons2 1Centre for Applied Pharmacokinetic Research, 2School of Pharmacy and Pharmaceutical
Sciences, The University of Manchester, Oxford Road, Manchester, M13 9PL, United Kingdom
Objectives: To describe a new approach for optimising sampling windows lengths for population pharmacokinetic experiments. The approach should be applicable to both continuous and exact population designs and the sampling windows obtained should achieve two objectives: the joint efficiency of the sampling windows design should attain the specified level and the sampling windows should also reflect the sensitivities of the plasma concentration-time profile to the parameters.
Methods: Sampling windows were obtained using a three stage approach. At the first stage, a fixed D-optimal sampling design was obtained. At the second stage, conditional sampling windows were obtained around the fixed D-optimal time points using the quadratic loss function by allowing the sampling windows design to result in a specified loss of efficiency when compared to the fixed D-optimal time points. At the final stage, the sampling windows design was evaluated and the lengths modified by equal percentage until the desired efficiency levels is attained. This approach was applied to an example and the results compared with two existing methods: Graham and Aarons [1] and Duffull et al [2] approaches. Simulations were also conducted.
Results: The results obtained from simulations showed that the sampling windows obtained with this approach are comparable to fixed D-optimal time points in terms of bias and precision with which the parameters are estimated. The results also showed that the approach produced narrower window where the plasma concentration-time profile is more sensitive to parameters and wider window where there is less sensitivity.
Conclusions: Sampling windows offers flexibility in terms of sampling times and still provides data that are informative and a new effective approach has been described.
References: [1] Graham G, Aarons L. Optimal blood sampling time windows for parameter estimation in population pharmacokinetic experiments. Statistics in Medicine, 2006; 25: 4004-4019. [2] Duffull SB, Mentré F, Aarons L. Optimal design of a population pharmacodynamic experiment for ivabradine. Pharmaceutical Research, 2001; 18: 83-89.
178
Poster: Methodology- Design
Italo Poggesi Evaluation of direct population PKPD models for truncated concentration-response curves
D. Perizzolo, S. Zamuner, R. Gomeni, I. Poggesi GlaxoSmithKline, CPK, Modelling & Simulation, Verona, Italy.
Introduction: There are examples where the concentration-response curves cannot be easily characterized using a pharmacologically relevant Emax model (e.g. impossibility to achieve sufficiently high exposures, high variability, etc.). In such cases, linear or truncated Emax models can be used [1]. A single dose crossover study with 20 subjects treated with two different drugs and placebo was considered. Plasma levels of the two compounds and a marker of pharmacological activity, with limited evidence of achievement of maximal response, were measured throughout the experiment.
Objectives:
1. To compare linear, full and truncated Emax models for the PK-PD analysis of the two compounds.
2. To evaluate the models behaviour using simulated dataset. 3. To evaluate the parameters precision improvement using optimal design approaches and to
qualify the study design enabling to identify the parameters of Emax models, providing guidance for future experiments.
Methods: PK-PD models were fitted to the data using NONMEM VI. The evaluation of the objective function and standard goodness of fit diagnostics were used for model discrimination. NONMEM was also used for providing simulation-based diagnostics. Design optimization was performed to define the optimal allocation of the PD observations using POPED [2].
Results: The adoption of full and truncated Emax models had no significant advantages compared with the simpler linear model, which was however able to demonstrate a significant difference in potency between the two compounds. Despite the optimization of the trial design was able to improve the CV% of parameters by 20-25%, it was impossible to correctly identify the more complex structural models with the adopted sample size. Scenario analysis indicated that, in the conditions adopted in the study, a substantial increase of the number of subjects (n>100) was required for this aim.
Conclusions: In cases in which the shape of the concentration-response curves cannot be properly characterized using a pharmacologically relevant Emax model, resorting to simpler models (e.g., linear) allows a better identification of the model parameters, making possible to compare the potency of different compounds. In this specific case, the limited dynamic range of the pharmacodynamic endpoint and its high variability, possibly coupled with the pharmacokinetic characteristics of the compounds (long terminal half-life), can explain why the linear model was the preferred option.
References: [1] Schoemaker RC van Gerven JMA Cohen AF. Estimating potency for the Emax-model without
179
attaining maximal effects J Pharmacokin Biopharm, 1998, 26, 581-93 [2] Foracchia, M., Hooker, A., Vicini, P. and Ruggeri, A., POPED, a software for optimal experiment design in population kinetics. Comput Methods Programs Biomed, 2004. 74(1): p. 29-46.
180
Poster: Methodology- Design
Alberto Russu Dose escalation studies: a comparison between NONMEM and a novel Bayesian tool
A. Russu (1), G. De Nicolao (1), I. Poggesi (2), M. Neve (2), L. Iavarone (2), R. Gomeni (2) (1) Dipartimento di Informatica e Sistemistica, Università di Pavia, Italy; (2) GlaxoSmithKline,
CPK Modelling & Simulation, Verona, Italy
Objectives: Evaluate modeling approaches and decision making criteria in dose escalating Phase I studies. In these studies, subjects receive increasing dose levels and, at each escalation, decision is made on whether next doses are to be administered based on some safety/tolerability constraints. In recent years, there has been a growing interest in Bayesian methods applied to such experimental settings [1, 2]. A comparison was therefore carried out between a NONMEM estimation procedure and two Bayesian approaches implemented within the R/WinBUGS environment. The different approaches were compared in terms of parameter estimates, predictive performance on new and existing subjects, and reliability of prediction limits.
Methods: Ten phase I dose escalation studies and 20 simulated datasets were analyzed. The dose-response relationship was modeled as a linear model using log-transformed doses and exposure metrics. In NONMEM VI (FOCE interaction method), additive intersubject variability and residual error were used. The two Bayesian methods, namely Empirical Bayes (EB) and MCMC were implemented within a user-friendly software tool based on R and WinBUGS. Estimated parameters, predictive root mean square error (RMSE) and % data within 90% prediction limits were used as comparison criteria.
Results: In all cases, it was found that all the considered methods provided comparable values of parameter estimates and predictive RMSE. However, the prediction limits provided by NONMEM turned out to be overly optimistic. Bayesian procedures provided either realistic or only slightly conservative intervals.
Conclusions: Satisfactory estimates and reliable prediction intervals, suitable for individual risk assessment, were obtained using both Bayesian approaches. The advantage of using the suboptimal EB scheme is two-fold: it helps finding relevant hyperparameter regions and allows a reciprocal cross-check with MCMC. NONMEM, though providing realistic point estimates, tends to systematically underestimate prediction intervals, possibly due to neglecting fixed effects uncertainty. Moreover, individual confidence intervals are not easily obtained in a rigorous way. Both aspects may impact on the quality of risk assessment during dose-escalation.
References: [1] Whitehead, J., Zhou, Y., Patterson, S., Webber, D. and Francis, S. (2001). Easy-to-implement Bayesian methods for dose escalation studies in healthy volunteers. Biostatistics 2, 47-61 [2] D.A. Berry, P.Müller, A.P. Grieve, M. Smith, T.Parke, R. Blazek, N. Mitchard, M. Krams. Adaptive Bayesian designs for dose-ranging drug trials. in C.Gatsonis, R.E. Kass, B. Carlin, A. Carriquiry, A. Gelman, I. Verdinelli, M. West (eds.), Case Studies in Bayesian Statistics V. New York: Springer-Verlag; 2001: 99-181
181
Poster: Methodology- Design
David Salinger Mean Squared Error as Criterion for Sampling Schedule Optimization for Individual Dose Targeting in IV Busulfan
David H. Salinger (1), Jeannine S. McCune (2), David K. Blough (2), Paolo Vicini (1) (1) Department of Bioengineering and (2) Department of Pharmacy; University of Washington,
Seattle, WA, USA
Objectives: Pharmacokinetics-based dose targeting of daily IV busulfan is routinely performed to achieve a narrow plasma exposure of busulfan to lower toxicity while maximizing efficacy in hematopoietic cell transplant (HCT) recipients. Dose targeting is performed using maximum a posteriori (MAP) estimation informed on pharmacokinetic sampling conducted following a standard initial dose and subject to population pharmacokinetic prior. Current sampling schedules require inpatient admission, which is expensive. Our objectives were (1) to employ a simulation approach to determine the optimal outpatient sampling schedule for dose adjustment; (2) to employ simulation to compare this new sampling schedule to the current standard of care (inpatient sampling at 3, 3.25, 4.5, 6, and 8 hr post infusion initiation); and (3) to evaluate the mean squared error (MSE) [1] (a measure of estimate bias and precision) as compared to D-optimality (a measure of precision only)[2] as a criterion for sampling schedule optimization for MAP estimation. To accomplish this, we examined an aggressively reduced sampling schedule (a single time point, instead of 6), since the difference between criteria is expected to be minimal for rich data. As it is well known, MAP estimation for determining an individual's PK causes "shrinkage" of the individual's (true but unknown) PK parameters towards the population mean. We propose to treat this shrinkage as if it were individual estimator bias, hence the use of MSE as optimization criterion.
Methods: To create a daily IV busulfan sampling schedule feasible in the outpatient clinic, we sought to determine six optimal blood sampling times between 0.25 hr and 6 hr post infusion initiation. Three of the six sampling times were fixed at 3 hr (end of infusion), 3.25 hr (as a backup), and 6 hr (latest feasible time), because these sampling times were deemed critical based on previous clinical experience of daily IV busulfan targeting. Sampling times were restricted to 0.25 hr increments. No repetition of sampling times was allowed.
To employ MSE as optimization criterion, it is necessary to use a simulation approach (to capture the shrinkage as estimation bias). We simulated 1000 subjects from our population model of IV busulfan kinetics. Each subject was then simulated with 15 instantiations of the (additive and proportional) error. All subject's parameters were then re-estimated for each error instantiation on every potential time grid (of 6 sampling times). The MSE[1] for a model parameter is computed as the mean prediction error squared plus the prediction error variance. Scaled MSE (MSE divided by the true parameter value squared) was computed for each parameter and averaged for each individual on each potential time grid. The figure of merit was the mean (over all 1000 subjects) MSE evaluated on each potential sampling time grid. A similar approach was undertaken to compare the new outpatient sampling schedule to the inpatient standard of care sampling schedule.
Results: For rich sampling (6 data points, times 3, 3.25 and 6 fixed) and for a simple model the difference between the MSE and D-optimal schedule was, as expected, not large. The best schedule by MSE was sampling at 2, 2.75, 3, 3.25, 5.75, and 6 hrs. The best schedule by D-optimality was
182
sampling at 1.75, 2, 3, 3.25, 5.75, and 6 hrs. Of the 1330 potential schedules, both the D-optimal and MSE-optimal schedules were amongst the top 20 in terms of opposing criteria. This was not unexpected, due to the rich sampling schedules.
In Objective 2, the MSE-optimal schedule (outpatient sampling at 2, 2.75, 3, 3.25, 5.75, and 6 hrs) with parameter prior resulted in an RMSE of 6.35% in a simulation of 1000 synthetic subjects, each with 15 replicates (error instantiations). By comparison, the standard of care schedule (inpatient sampling at 3, 3.25, 4.5, 6, and 8 hrs) without parameter prior resulted in an RMSE of 8.63%. Thus, we conclude that outpatient sampling is feasible.
In Objective 3, we employed single time point MAP estimation to highlight differences between the optimality criteria. The D-optimal schedule had its optimal sample at T=1.9 hr and the MSE-optimal schedule at T=1.6 hr. Bias and precision (as prediction error variance) are two components of MSE. The precision-optimal schedule coincided with the D-optimal schedule (as expected). The bias-optimal schedule had its optimal sample at T=1.3 hr.
Conclusions: For richly sampled data, the difference between the MSE and D-optimal schedule should not be expected to be large. For sparsely sampled data, the MSE criterion may provide a useful approach to achieve optimal scheduling for individual MAP estimation for the purpose of individual dose adjustment.
References: [1] Sheiner LB and Beal SL (1981) Some suggestions for measuring predictive performance. J. Pharmacokinetics and Biopharmaceutics 9:4:503-512 [2] Monteleone JPR and Duffull SB. (2003) Choice of best design. In Kimko HC and Duffull SB Eds. Simulation for designing clinical trials. Taylor and Francis Group, NY, New York.
183
Poster: Methodology- Design
Hanna Silber Improvement of the intravenous glucose tolerance test using optimal experimental design.
Hanna E Silber, Joakim Nyberg, Andrew Hooker, Mats O Karlsson Department of Pharmaceutical Biosciences, Division of Pharmacokinetics and Drug Therapy,
Uppsala University, Uppsala, Sweden
Background: Intravenous glucose provocations are very informative for studying the glucose-insulin system. The standard IVGTT design contains approximately 30 blood samples of glucose, insulin and labeled glucose during 4 hours following an intravenous bolus dose of glucose. In the insulin modified IVGTT, a 5-minute insulin infusion is given at 20 minutes. Optimal experimental design can be used to increase the efficiency of clinical trials by optimizing the sampling schedule or other design parameters, e.g. dose. When optimal experimental design is used together with population techniques for data analysis we expect the over all trial design to be improved and more efficient with respect to precision of parameter estimates. The objective of this study was to evaluate the possibilities of an improved study design of the insulin modified IVGTT in type 2 diabetic patients.
Methods: A previously developed model for glucose and insulin regulation in healthy volunteers and type 2 diabetic patients was implemented in the optimal design software PopED 2.0 [1,2]. In order to decrease run times the number of samples was reduced from 30 to 10. The following aspects of the study design of the insulin modified IVGTT were evaluated; (1) glucose dose, (2) insulin infusion, (3) combination of (1) and (2), (4) sampling times, (5) exclusion of labeled glucose. Constraints were incorporated to avoid prolonged hyper- and/or hypoglycemia. Efficiency was calculated as a measure of the improvement with an optimal design compared to the basic design. The efficiency also corresponds to the reduction in number of subjects that need to be included when an optimal design is used.
Results: The results show that the design of the insulin modified IVGTT can be substantially improved by the use of an optimized design compared to the standard design. The predicted uncertainty of parameter estimates was low in all tested cases, despite the reduction in the number of samples/subject. As an example, the efficiency of the IVGTT could be increased by 304% by a 5-fold increase of the insulin dose, corresponding to a possibility to reduce the number of subjects included in a study to 1/3.
Conclusions: We conclude that substantial improvement can be made to the design of the insulin modified IVGTT. Also when the number of samples is reduced parameters are predicted to be estimated with a high certainty. This illustrates how complex provocation experiments can be improved by sequential modeling and optimal design.
References: [1] Silber H E, Jauslin P M, Frey N, Gieschke R, Simonsson U S H, and Karlsson M O. An integrated model for glucose and insulin regulation in healthy volunteers and type 2 diabetic patients following intravenous glucose provocations. J Clin Pharmacol 2007; 47: 1159-71. [2] PopED, version 2.07 (2008) http://poped.sf.net/.
Stefano Zamuner Adaptive Optimal Design in PET Occupancy Studies
Stefano Zamuner (1), Vincenzo L. Di Iorio (1), Joakim Nyberg (2), Roger N. Gunn (3), Vincent J. Cunningham (3), Andrew Hooker (2) and Roberto Gomeni (1)
(1) GlaxoSmithKline, Clinical Pharmacokinetics/Modeling&Simulation, Verona, Italy. 2Div. of Pharmacokinetics and Drug Therapy, Dept. of Pharmaceutical Biosciences, Uppsala University,
Sweden. (3) GlaxoSmithKline, Clinical Imaging Centre, Hammersmith, UK.
Background: To increase the efficiency of trials in drug development, optimal experimental design has been used to successfully optimize dose allocation and sampling schedule [1,2]. Adaptive optimal design has recently been proposed as a method to improve the assessment of receptor occupancy time-courses in PET experiments [3]. In this work we have further developed this concept, to include the optimisation of dose and also improve the adaptation/optimization algorithm. In addition, a kon-koff model using the binding potential (BP) estimates from PET studies [4] has been applied to account for baseline inter-subject variability in these experiments.
Aim: To investigate advantages of adaptive optimal designs vs. traditional designs with fixed or educated selection of PET scan allocations, when optimizing over both sampling schedule and dose.
Methods: Adaptive optimization was performed on the following PK-BP model (kon=0.088 hrs-1 and koff=0.221 hrs-1, BP0=3, inter-subject variability=30%, proportional error model):
dBP/dt=koff·BP0 - (Cp·kon+koff)·BP
A total of 12 subjects were considered with 5 possible doses (1.5, 3, 4, 6 and 8mg) and designs with 3, 4, and 6 adaptive steps were investigated. At each adaptive step, parameter estimates from the previous cohorts were determined and used to determine designs for the next cohort. The BP time-courses from these designs (empirical dummy using Tmax and trough, educated and optimal) were then simulated under the true model. Optimization was performed on scanning times only and scanning times and doses using a D-optimality criterion as implemented in the PopED software [2,5]. Information about previous cohorts were included in the optimal design program as a prior to the fisher information matrix.
Results: A clear improvement in terms of bias (SME), precision (CV) and accuracy (RMSE) of the population estimates (Kon and koff) was found when comparing dummy vs. educated vs. optimal. Unbiased mean estimates were found for the optimal designs; a great improvement in accuracy was found when comparing optimal vs. dummy designs (25-30 fold) and still a significant improvement was found when comparing optimal vs. educated designs (2-3 fold). No clear advantages were found when optimizing both time and dose. The number of adaptive steps was less influential on design performance than the method of designing the next step. No improvement was obtained for inter-subject variability estimates when comparing optimal vs. non optimal designs.
Discussion: Our results indicate that adaptive optimal design of PET occupancy studies provides more information on the PK-Occupancy relationship. In this work, doses were initially selected at high, medium and low occupancy levels based on previous knowledge of the system.
185
Consequently, optimization of dose was not found to influence the results. In experiments where initial dose selection is misleading it is expected that dose optimization will have a greater impact.
References: [1] Mentré, F., Mallet, A. and Baccar, D., Optimal design in random-effects regression models. Biometrika, 1997. 84(2): p. 429-442. [2] Foracchia, M., Hooker, A., Vicini, P. and Ruggeri, A., POPED, a software for optimal experiment design in population kinetics. Comput Methods Programs Biomed, 2004. 74(1): p. 29-46. [3] Petrone, M., Zamuner, S., Di Iorio, V., Gunn, R., Laruelle, M., Gomeni, R. Model-based sequential human PET study design for Optimal PK/RO assessment. PAGE 16 (2007) Abstr. 1183 [www.page-meeting.org/?abstract=1183] [4] Mintun MA, Raichle ME, Kilbourn MR, Wooten GF, Welch MJ. A quantitative model for the in vivo assessment of drug binding sites with positron emission tomography. Ann Neurol, 1984. 15(3): p. 217-27. [5] Nyberg, J., Karlsson, MO, Hooker, A., Sequential versus simultaneous optimal experimental design on dose and sample times. PAGE 16 (2007) Abstr 1160 [www.page-meeting.org/?abstract=1160]
186
Poster: Methodology- Model evaluation
Robert Bies A comparison of a genetic algorithm based automated search algorithm to standard stepwise approach for population pharmacokinetics using NONMEM.
Robert R. Bies, Jeff A. Florian, Bruce G Pollock, Kristin L Bigos, Marci Chew, Yuyan Jin, Yan Feng, Kim C Coley, Lon Schneider, Matt Muldoon, Steven Manuck, Mark E. Sale.
University of Pittsburgh (RRB, JAF, YJ, MM, SM, KCC), CAMH (BGP, RRB), NIMH (KB), Pfizer (MC), BMS (YF), USC (LS), Next Level Solutions (MES).
Objectives: To compare, using the Akaike Information Criteria (AIC), final population PK models selected using an automated search algorithm versus a standard stepwise approach.
Methods: Five population PK analyses were available for this comparison comprising the PK of citalopram, perphenazine, olanzapine, quetiapine, and risperidone. All five available analyses were repeated using the automated approach. All analyses were performed blindly (i.e. the analyst was not aware of the outcome of the original analysis). The automated search algorithm search space was limited in scope to those elements that were evaluated using the standard stepwise approach. In all cases except one (risperidone), this included evaluating a one versus two compartment PK model structure, the form of the inter-individual variability (exponential, proportional, additive), the form of the residual error (additive, proportional, combined), the presence of covariate relationships, the mathematical structure of these covariate relationships and multiple sets of initial estimates. In the case of risperidone, a mixture model option was included in the search space for the automated method, as one was assessed during the stepwise search. The models were all tested using NONMEM VI using the genetic algorithm (Bies 2006) and the FOCE Inter estimation option.
Results: 5/5 models had lower AIC values (p=0.03125) as selected by the genetic algorithm approach versus the stepwise approach. The geometric and arithmetic means of this reduction were 217.7 and 465.8 with a range of 5 to 1017 points.
Conclusions: In this test set of population PK examples, the genetic algorithm based automated search was consistently able to find models with lower AIC values than the stepwise approach.
References: [1] Bies RR, Muldoon MF, Pollock BG, Manuck S, Smith G, Sale ME. A genetic algorithm-based, hybrid machine learning approach to model selection. J Pharmacokinet Pharmacodyn. 2006 Apr;33(2):195-221. Epub 2006 Mar 28.
187
Poster: Methodology- Model evaluation
Carlos Fernandez-Teruel Simulations of bioequivalence trials using physiological-pharmacokinetic in single dose and steady state scenarios. Which scenarios are
refusable?
Fernandez-Teruel Carlos (1), Gonzalez-Alvarez Isabel (2), Navarro-Fontestad Carmen (2), Garcia-Arieta Alfredo (3), Bermejo-Sanz Marival (2), Casabo-Alos Vicente (2).
(1) Intervalence Biokinetics, Spain. (2) Department of Pharmacy and Pharmaceutics, Faculty of Pharmacy, University of Valencia, Spain. (3) Pharmacokinetics service. Spanish Agency for
Medicines and Heath Care Products
Objectives: The aim of this work is to continue the studies about bioequivalence (BE). In last studies, simulations about drugs undergoing saturable and non saturable metabolic clearance were assessed. Now the purpose is to evaluate scenarios for drugs class I to IV based on BCS at single dose and in steady state (SS).
Methods: The studies were simulated using NONMEM. In the model, a semi-physiological model was developed, including dissolution compartment, operative absorption time and hepatic first-pass effect with saturable and non-saturable metabolism. Parent drug and metabolite were simulated for both reference and test until the steady state was reached. Afterward AUC and Cmax within a dose interval were calculated to assess the ratios between reference and test.
To simulate the test and reference formulations, different scenarios were performed by varying the values of dissolution constant in lumen, absorption rate, solubility of parent drug, saturation of hepatic metabolism or combinations of all. In these scenarios variability between subjects was not included, as the achievement was establishing the most sensitive variable (parent, parent SS, metabolite and metabolite SS) in each scenario using AUC and Cmax ratios.
Results: Results of all simulations will be presented as percentage of success for the metabolite and the parent drug, classifying the drugs in classes from I to IV.
Conclusions: This work illustrates the differences between single dose and steady state concerning the AUC and Cmax ratios, Showing the parent drug at single dose or in steady state depending on the case are the most sensible variables.
188
Poster: Methodology- Model evaluation
Laura Iavarone A Population PK model to evaluate variability in oral absorption using gamma scintigraphy
L. Iavarone(1), G. Ghibellini(2), S. Carson(2), A. Parr(3), E. Sandefer (4),G. Nucci (1), R. Gomeni(1),
Objectives: GSKX is a compound in development for CNS disorders showing high PK variability when orally administered in fasted conditions. This could be related to a variety of factors as gastric emptying patterns or formulation performance1. In phase I, variability was successfully limited by food. A study in human volunteers was carried out to assess the relationship(s) between GSKX absorption and gastric emptying time for a solution (fasted) and a tablet formulation (fasted and fed) in order to guide in the formulation development process. Gamma scintigraphy was used to evaluate formulation performance by visualizing the disintegration process and by measuring the gastric emptying time in relation to the use of food or of different formulations. A population PK modelling was developed to assess the relationship(s) between gastric emptying profiles (by gamma scintigraphy) and GSKX plasma disposition after administration of a solution or a tablet formulation in fasted and fed states.
Methods: A GI-transit-absorption kinetics model was developed using sequential compartmentimental approach to account for the stomach and the jejunum2. GI transit process from the stomach to the jejunum was described by a rate-limited process:
Ka=Rate_Max*Timeh/( Timeh+ T50h)
where Rate_Max is the fastest transit rate, T50 is the time at which rate is the 50% maximum rate and h is the sigmoidicity factor. The disposition PK model connected to this GI absorption model was a three compartment model with first order elimination rate constant from the central compartment.
Results: The transit of radioactivity from the stomach to the jejunum was found to be formulation and food dependent. When a solution was administered, T50 was estimated to be minimum and the equation describing Ka simplified to Ka=Rate_Max, whereas when a tablet was administered T50 was estimated to be higher in fed than in fasted conditions.
Conclusions: Absorption of GSKX resulted to be controlled substantially by the residence time in the stomach. Fed conditions generally decreased the rate of transit from the stomach into the jejunum. Simulations of plasma PK time-course associated with different GI-transit-absorption patterns were performed to support optimal formulation development.
References: [1] Kilian K. et al, Comparison of the Rates of Disintegration, Gastric Emptying, and Drug Absorption Following Administration of a New and a Conventional Paracetamol Formulation, Using Gamma Scintigraphy, Pharm. Res., 20, 1668-1673, 2003
189
[2] Honghui Z., Pharmacokinetic Strategies in Deciphering Atypical Drug Absorption Profiles, J. Clin. Pharmacol. 43 211-227, 2003
190
Poster: Methodology- Model evaluation
Robert Leary A Nonparametric Analogue to POSTHOC Estimates for Exploratory Data Analysis
Robert H. Leary and Jason Chittenden Pharsight Corporation
The use of FO or FOCE posthoc eta values for exploratory data analysis of possible covariate relationships and correlations (e.g., regressing post hoc estimates of a clearance or volume of distribution against weight or against other posthocs) is a commonly used approach. However, as shown in [1], shrinkage effects may hide or distort an actual dependence or correlation, possibly rendering such analyses ineffective or even misleading. Recently NONMEM VI has added a relatively simple nonparametric capability in which the discrete nonparametric maximum likelihood (ML) distribution is approximated by a discrete distribution with support points fixed at the posthoc estimates from a preliminary parametric FO or FOCE analysis, with likelihood optimization only over the associated probabilities on the support points. Due to shrinkage, the supports may be badly placed relative to the supports in a nonparametric ML distribution that has also been optimized with respect to support point positions. Here we investigate the use of the mean of the individual nonparametric posterior distributions as a nonparametric analogue to parametric posthocs in exploratory data analysis. Examples are shown based on simple simulations to illustrate the resiliency of this mean to shrinkage effects, as well as the advantage of using the fully optimized nonparametric distribution.
Reference: [1] R. M. Savic and M. O. Karlsson, Importance of Shrinkage in Empirical Bayes Estimates for Diagnostics and Estimation: Problems and Solutions, PAGE 2007, abstract 1087.
191
Poster: Methodology- Model evaluation
Gianluca Nucci Modelling and Simulation of Ketoconazole inhibition when co-administration time is not sufficient: role of CYP3A function recovery
Introduction: In this study ketoconazole (keto), a potent CYP3A inhibitor, was co-administered with GSK drug X (X) to assess the extent of interaction as well as the relevance of CYP3A (3A) on X metabolism. Given the prolonged elimination of X (t1/2 ~ 40-60 hours), the study was amended part-way to increase the duration of keto dosing so that two groups with different keto durations were examined (200 mg BID from day -4 to day 4 in group 1 and from day -4 to day 10 in group 2). Given the maximum recommended duration of keto dosing, it was not possible to fully assess the extent of inhibition with standard methods, especially considering that the decline of X plasma concentration was markedly different after stopping keto administration, returning back to the non-inhibited values. This lead to the paradoxical observation of higher AUClast ratios than AUCinf ratios.
Objectives: The objective of this study was to model keto-X interaction data to estimate the extent of the full metabolic inhibition and to simulate X profile with different keto regimens.
Methods: Methods: A two-compartment model with first-order absorption and lag-time was used for X . It was fitted to the non-inhibited state data of 36 healthy volunteers (20 in group 1 and 16 in group 2) using NONMEM VI. Individual covariate used to refine the model estimates were age, weight and sex. The inhibition phase was then introduced using the time of keto co-administration as covariate. Different keto inhibition structures were employed and the best one (based on GOF considerations) was retained.
Results: The best base model retained a correlation between inter-individual variability in CL and central distribution volume. In the best inhibition model keto was found to both decrease CL and increase first pass of X. As expected, subjects with higher baseline clearance had higher inhibition (modelled as a correlation between non-inhibited CL and extent of inhibition). The time course of 3A recovery was introduced as an exponential function of time after stopping keto.
Conclusions: The model provided good fit of the observed data and enabled to assess individual and population inhibition results. Therefore, using simulations, it was possible to evaluate the full extent of 3A involvement in drug X metabolism as well as the influence of different durations of keto co-administration.
192
Poster: Methodology- Other topics
Paul Baverel Covariate Model Building Method for Nonparametric Estimation Method in NONMEM VI: Application to Simulated Data
Paul G Baverel, Radojka M Savic, Mats O Karlsson Department of Pharmaceutical Biosciences, Uppsala University, Sweden
Objective: To develop a method for covariate model building suitable for the nonparametric estimation implemented in the software NONMEM VI [1].
Methods: The method is based on the calculation of joint density parameter distributions for each individual from the population joint density distribution and the individual data. For each parameter, the marginal, individual, probability is used as the main weighting factor in a generalized additive model (GAM), implemented in the software R. The relative performance of the new method at detecting true covariate relationships was evaluated in comparison with parametric GAM analysis. A 1-compartment IV bolus model was used to simulate 10 datasets of 100 individuals following a rich sampling design. Ten different covariates were simulated of which 7 were continuous (4 with underlying log-normal distribution, one with underlying normal distribution and 2 following a uniform distribution) and 3 were binomial. Relationships between CL and a continuous covariate as well as V and a categorical covariate were included in the simulations. Re-estimation with the reduced model was then conducted for each set of data using either FOCE or FOCE-NONP method. For the parametric method, GAM analyses based on empirical Bayes estimates were performed. For the nonparametric method, a Perl script was used to automate and output the individual contributions (iOFV) from which the individual joint density parameter distributions were derived. Additional weighting by the parametric SEs of EBEs and individual variances of individual nonparametric distributions were also explored.
Results: Overall, preliminary results suggest that the new method for nonparametric estimation performed similarly to parametric GAM with respect to selecting true covariate relationships when applied to rich simulated data.
Conclusions: A covariate model building technique intended for the nonparametric method in NONMEM VI is proposed. When applied to rich simulated data sets, the performance of the nonparametric method in the stepwise search process performed similarly as the regular parametric GAM method.
References: [1] Savic RM, Kjellsson M, Karlsson MO. Evaluation of the nonparametric estimation method in NONMEM VI beta PAGE 15 (2006) Abstr 937 [www.page-meeting.org/?abstract=937]
193
Poster: Methodology- Other topics
Martin Boucher A Bayesian Meta-Analysis of Longitudinal Data in Placebo Controlled Studies with Naproxen
Martin Boucher Pfizer Global Research and Development, Sandwich, UK
Objectives: Understanding the response characteristics of a comparator will typically involve looking at external literature and any relevant previous studies run in-house. Often a suitable variance measure will be taken from a paper and put into a sample size formula. Less common however is a quantitative modelling approach to capture dose response, time course and other characteristics of these comparators.
On a simplistic level one can either adopt a ‘Classical' or ‘Bayesian' approach to carry out such a meta analysis. The former has tended to be the approach of choice but the tools to carry out Bayesian meta-modelling are readily available and there are a growing number of papers in the literature where such approaches have been taken.
A Bayesian approach has many advantages over a Classical one [1]. These advantages include the ability to subjectively weight the evidence according to relevance and the ability to make direct probabilistic statements about measurements of interest from the resulting posterior distribution(s).
The aim here is to model a pain questionnaire endpoint for comparator drug naproxen and placebo from internal and external summary data using a Bayesian Evidence Synthesis approach. The resulting posterior distributions will allow direct probabilistic statements about parameters of interest such as the difference in effect between placebo and naproxen at different time points as well as making predictions for future studies.
Methods: A Bayesian random effects non-linear hierarchical model was fitted to WOMAC pain score summary data across 15 osteoarthritis studies, ten of which were internal studies and 5 from a systematic literature search. All studies were placebo controlled with naproxen 500mg bid also investigated. The Emax model was designed to capture the relationship between WOMAC pain score versus time post start of dosing, allowing for different model parameters as appropriate for naproxen and placebo.
The resulting posterior distributions were used to look at the probability that a baseline adjusted naproxen versus placebo difference is greater than several pre-defined deltas of interest. Different forms of residual error were assessed, baseline was included as a covariate and between study variability was examined across the model parameters.
Results: Work ongoing.
Conclusions: Work ongoing.
References: [1] Sutton AJ, Abrams EJ. Bayesian methods in meta-analysis and evidence synthesis. Statistical Methods in Medical Research. 2001; 10 :277-303.
194
195
Poster: Methodology- Other topics
Marylore Chenel How to show average bioequivalence of concentrations in a test sample with a reference population pharmacokinetic model?
Marylore Chenel(1), Karl Brendel(1), Emmanuelle Foos-Gilbert(1), Céline M. Laffont(1) and France Mentré(2)
1. Institut de Recherches Internationales Servier, France, (2) INSERM U738 - Université Paris 7, France
Introduction: The case considered here is when a pharmacokinetic (PK) study is performed in a special population (i.e. a specific ethnic group, a high risk population such as renally or hepatically impaired subjects, ...) without a control group. The purpose is to show average bioequivalence of the PK in this specific population to the PK in the reference population using all previous knowledge summarized with a population PK model. Such an approach is an alternative to the classical analyses based on parallel group trials.
Objectives: The objective of the present work was to propose statistical methods to show the absence of difference in PK (average bioequivalence) between the sample obtained from a special population and the reference population PK model. These statistical methods can be applied either to standard PK parameters (AUC and Cmax) or to the whole PK profile. The latter approach is sometimes more relevant.
Methods: The following methods were investigated, using simulations with the reference model: (i) a method based on non-compartmental analysis (NCA) to study standard PK parameters (for rich sampling studies), and (ii) a method based on an extension of visual predictive checks (VPC) for mean concentrations to study the whole PK profile (in rich or sparse sampling studies).
Let's define MR as the reference population PK model already developed, and T the investigated trial in the special population. For both methods, PK parameters or PK profile, the first step is to define the reference means under MR for the parameters or for the concentrations, using the population model. This was done through simulation of K individuals using MR with the design of T, with K being large enough (here, K=1000). For the equivalence limits, the usual values, 0.80 and 1.25, were used for both AUC and Cmax, and by homogeneity, similar limits were used for the whole PK profile.
For the method based on PK parameters, AUC and Cmax were computed by NCA for each subject of T and each of the K simulated individuals using the sampling times of T. Reference mean mR was computed as the exponential of the sample mean of log parameters from the K simulated individuals. For T, sample mean and standard deviation of individual log(AUC) and log(Cmax) were computed. The 90% confidence intervals (CI) for the geometric mean parameters were then derived taking the exponent of the limits of the 90% CI on the log parameters. For each PK parameter, average bioequivalence between T and MR was shown if the 90% CI for the geometric mean parameters on T was included in [mR ´0.8; mR ´1.25].
For the method based on the PK profile, a similar approach was used. At each scheduled time, the reference mean concentration was computed as the exponential of the sample mean of log concentrations from the K simulated individuals. For T, sample mean and standard deviation of
196
individual log concentrations were computed at each scheduled time, and the 90% CI for the geometric mean concentration was derived. In case of average bioequivalence between T and MR, it was expected that the 90% CI of the observed geometric means on T lied within the reference geometric mean times 0.8 and times 1.25. This can be illustrated nicely on a graph of concentrations versus time.
To illustrate those methods, a two-compartment population PK model that had been developed for a compound in development, SX [1], was used as MR. Two datasets were simulated (Nsubjects =100 and nobservations/subject = 16): the first one (Ttrue) was simulated with the parameters values estimated in MR and the other one (Tfalse) was simulated using the same model but with a bioavailability parameter multiplied by 1.5. To perform these methods on PK parameters and on PK profile, K=1000 individuals were simulated.
Results: The proposed methods were successfully illustrated in both simulated trials. As expected, the 90% CI of the mean of each PK parameter, AUC and Cmax, lied within the equivalence limit computed with MR with Ttrue, and were outside with Tfalse. Moreover, the 90% CI for means of the concentrations lied within the equivalence limit with Ttrue, and were outside the 90% equivalence interval with Tfalse.
Conclusions: An approach was proposed here to assess average bioequivalence using simulation of the PK profile from the reference model. Indeed, studying the whole PK profile may be more relevant than summarizing PK into two PK parameters, AUC and Cmax. Furthermore this approach based on the PK profile can be used in sparse as well as in rich sampling studies whereas the approach based on PK parameters, as presented here using NCA, is limited to rich sampling studies. The approach on parameters could be extended to sparse sampling situation but necessitates to model the data of T. Finally, the use of a reference PK model is advantageous as there is no need to include a control group in the study matching the tested sample in terms of subject's characteristics, which may not be representative of the reference population.
References: [1] Roy P, Lemenuel-Diot A. and Chenel M. Is it possible to perform equivalent simulations with NONMEM and TS2? PAGE 15 (2006) Abstr 1002 [www.page-meeting.org/abstract=1002]
197
Poster: Methodology- Other topics
Cian Costello A Time Scaling Approach to Develop an In Vitro-In Vivo Correlation (IVIVC) Model Using a Convolution-Based Technique
Cian Costello (1), Stefaan Rossenu (2), An Vermeulen (2), Adriaan Cleton (2), Adrian Dunne (1) (1)UCD School of Mathematical Sciences, University College Dublin, Belfield, Dublin 4, Ireland.
(2)Clinical Pharmacology, Advanced PK/PD Modelling and Simulation, J&J Pharmaceutical Research and Development, a Division of Janssen Pharmaceutica N.V., Turnhoutseweg 30, B-2340
Beerse, Belgium.
Objectives: In vitro-in vivo correlation (IVIVC) models prove very useful during drug formulation development, in support of dissolution specification setting and for bio waiver applications following post approval changes. Our aim in this study was to develop a population IVIVC model for drug formulations for which in vitro drug dissolution occurs over a much shorter time scale than the in vivo drug dissolution.
Methods: It is common practice to fit an IVIVC model to deconvoluted data rather than to the raw plasma drug concentration-time data because the deconvoluted data are believed to reflect the dissolution of the drug in vivo. However, the deconvolution step and the associated methodology pose some statistical concerns.1 This has motivated the development of a convolution-based population approach, which addresses the aforementioned statistical issues.2 Recent studies confirm that this approach is superior to the deconvolution method.3 Due to the disparity of the in vitro and in vivo time scales for some drugs, traditional methods of finding an IVIVC model may be unsuccessful. It is suggested that a time scaling approach be applied in order to establish an IVIVC model. We applied this methodology for a drug with these characteristics. The data were longitudinal in nature with considerable between subject variation present in the in vivo data. Using the NONMEM package, a nonlinear mixed effects model was fitted to the data with a time-scale model linking the in vitro and in vivo components.
Results: The population IVIVC model was successfully fitted. The goodness of fit of the model was assessed by comparing predicted with observed in vivo plasma concentration-time profiles. The model predicted AUC and Cmax were compared with the data based values and show differences of at most 11.6% and 8.5% for AUC and Cmax respectively. These values satisfy the FDA validation criteria for both internal and external predictability.4
Conclusions: Our study demonstrates that when attempting to fit an IVIVC model to data with a significant disparity between the in vitro and in vivo dissolution time scales, a time scaling approach can be useful. Applying a time scaling approach in conjunction with the convolution based methodology demonstrates the versatility of the methodology, and the fact that the model predictions met the FDA validation criteria is evidence that these types of model are capable of producing accurate predictions, which is always of prime importance.
References: [1] Dunne A, Gaynor C, Davis J. (2005) Deconvolution Based Approach for Level A In Vivo-In Vitro Correlation Modelling: Statistical Considerations. Clinical Research and Regulatory Affairs 22:1-14. [2] O'Hara T, Hayes S, Davis J, Devane J, Smart T, Dunne A. (2001) In Vivo-In Vitro Correlation
198
(IVIVC) Modelling Incorporating a Convolution Step. Journal of Pharmacokinetics and Pharmacodynamics 28:277-298. [3] Gaynor C, Dunne A, Davis J. (2008) A Comparison of the Prediction Accuracy of Two IVIVC Modelling Techniques. Journal of Pharmaceutical Sciences in press. Published online in Wiley InterScience DOI 10.1002/jps.21220. [4] Food and Drug Administration. (1997) Guidance for Industry: Extended Release Oral Dosage Forms: Development, Evaluation and Application of In Vitro/In Vivo Correlations.
199
Poster: Methodology- Other topics
Ekaterina Gibiansky Indirect Response Models with Positive Feedback: Equations, Properties, and Possible Applications
Ekaterina Gibiansky (1), Leonid Gibiansky (2) ICON Development Solutions, Ellicott City, Maryland, USA; (2) QuantPharm LLC, North
Potomac, Maryland, USA
Background: Flare-ups, a characteristic feature of a number of autoimmune diseases is sudden worsening of the disease with a very slow resolution of symptoms. Triggers of the flares, when known, are usually external challenges of short duration (infection, stress, exposure to allergen, skin trauma, etc). Similarly, there are instances when short treatment interventions produce long-lasting effects. Known mechanistic pharmacodynamic (PD) models postulate that the system returns to the baseline state soon after the intervention is stopped. These models cannot describe flare-ups or long lasting effects of short treatments.
Objectives: To propose a new type of PD models for description of systems (biomarkers) with non-unique steady-state or quasi-steady-state solutions, and to suggest possible applications of these models.
Methods: The following indirect response model with positive feedback introduced through the transit compartment (A2) is proposed for the biomarker (A1):
dA1/dt=KIN-KOUTA1+KFB (f2(C)A2-f1(C)A1) and
dA2/dt=KTR (A1-A2).
Here KFB and KTR are the feedback and transit compartment rate constants; f1 and f2 are non-negative functions of the intervention level C (e.g. drug concentration) such that f1(0)=f2(0)=1.
In this system, production (Ksyn) and elimination rate (Kdeg) of the biomarker are represented by
Ksyn= KIN+KFB f2(C)A2 and Kdeg= KOUT+KFB f1(C).
Similarly to the indirect response models [1], four types of intervention were investigated: stimulation of production or elimination (f2 or f1 increases with C) and inhibition of production or elimination (f2 or f1 decreases with C). An investigation started with the limiting case KIN=KOUT=0, and was then extended to more general models. Stimulation of elimination (e.g. short drug treatment) was studied in details. All the other cases were similar.
Results: In the limiting case of KIN=KOUT=0 and in the absence of the external intervention (C=0), the system has infinite number of steady-state solutions. When disturbed by stimulation of elimination (f1(C)>1), the biomarker level decreases, then increases, and stabilizes at a new steady-state level. This level is lower than the initial state, but higher than the minimum level achieved following the intervention. When KIN and KOUT are not zero, the biomarker follows a similar pattern. However, instead of the new steady-state level, it reaches the quasi-steady state that slowly
200
returns the system back to the initial state. Inhibition of elimination reverses the pattern. Stimulation and inhibition of the biomarker production result in qualitatively similar patterns.
Conclusions: A new type of indirect response models with positive feedback allows the description of the systems where short-term interventions (treatments or triggers of the disease) lead to long-term effects and slow return to the pre-intervention state. The proposed models are physiologically meaningful in the context of autoimmune diseases, where breakdown of control mechanisms leads to chronic inflammation in response to activation of the immune system.
References: [1] Dayneka NL, Garg V, Jusko WJ. Comparison of four basic models of indirect pharmacodynamic responses. J Pharmacokinet Biopharm. 1993 Aug;21(4):457-78.
201
Poster: Methodology- Other topics
Andreas Velsing Groth Alternative parameterisations of saturable (Emax) models allowing for nesting of non-saturable models
Andreas V. Groth (1) (1) Novo Nordisk A/S, Denmark
Objectives: It is often the case that non-saturable (linear) and saturable (Emax) models are fitted separately to experimental data, using parameters that are not directly comparable between the two types of model. Comparisons between the two may be facilitated if one type is nested within the other as a special case.
Methods: For the simple Emax model (Hill coefficient n=1), the parameterisation of Schoemaker et al. [1] is modified to introduce the parameter a = EC50
-1, and the parameters Emax and EC50 are eliminated. It is then exploited that while no parameter can go to infinity, as in an Emax model would be required for both parameters Emax and EC50 in order to fit non-saturating data, a parameter can go to zero which, for the parameter a, creates a linear model nested within a simple Emax model. The concept is extended to Hill coefficients different from 1, in which case the above transforms into a power function model nested within a Hill Emax model. An example is given by fitting to an experimental data set with a moderate degree of saturation - a data set of a type where distinctions between traditionally estimated linear and Emax models may not be very clear.
Results: The following parameterisation encompassing both Emax models with any positive Hill coefficient, linear models and power function models, is proposed:
E=ER * Cn / CRn * (1+(aCR)n) / (1+(aC)n)
CR and ER denote a reference concentration-effect pair within the range of the experimental data. Either one of these values are chosen, the other one is estimated. Thus, the model parameters to be estimated are the Hill coefficient n, the "curvature" parameter a (corresponding to EC50
-1), and either CR or ER. For the simpler special cases of n=1 and/or a=0, the expression is correspondingly simpler.
References: [1] Schoemaker RC et al., Journal of Pharmacokinetics and Biopharmaceutics, 26 (5), 1 (1998) [2] Bachman WJ, Gillespie WR, Clin. Pharmacol. Ther. 63, 199 (1998)
202
Poster: Methodology- Other topics
Emilie HENIN Patient compliance estimated from pharmacokinetic sample: application to Imatinib
Emilie Hénin (1), Véronique Trillet-Lenoir (1,2), Brigitte Tranchand (1,3), Michel Tod (1), Pascal Girard (1)
(1) Université de Lyon, Lyon, F-69003, France ; Université Lyon 1, EA3738, CTO, Faculté de Médecine Lyon-Sud, Oullins, F-69600, France ; (2) Service d’Oncologie Médicale, Centre
Hospitalier Lyon-Sud, Hospices Civils de Lyon, F-69310, Pierre-Bénite, France ; (3) Centre Léon Bérard, Lyon, F-69008, France.
Objectives: In a previous study [1], we developed a methodology allowing the estimation of patient compliance through the immediate sequence of doses preceding the dosing interval where a blood PK sample has been taken. We assumed that the correct amount of drug was taken at nominal times. The method has been evaluated in silico with the Capecitabine/FBAL example (t½ = 3 hours) and indicated that compliance to dose given up to 5 t½ in the past could be evaluated. We considered the ratio of the plasma half-life (t½) and the interdose interval (τ) as a characteristic for our method performance. In the case of Capecitabine/FBAL, this ratio equals to 0.25 and we expect, for a greater ratio, a good estimation for more than 2 takings. The objective of present work is to evaluate further this methodology on another anticancer oral drug, Imatinib (ratio t½ / τ = 0.625), which has a greater ratio than capecitabine's metabolite.
Methods: The idea is to estimate compliance according to a single PK concentration value measured on one dosing interval at steady state and sparse samples taken after first dose. A population PK model, including estimation of all fixed and random effects estimated on a prior dataset is also needed. The sparse samples taken after first dose are combined with the population model to provide the individual POSTHOC PK parameter estimates. From those Bayesian estimates, individual PK profiles are simulated according to various dose taking scenarios and compared to the steady state nominal PK concentration. In order to be able to estimate compliance using those limited data, several assumptions were to be made, that could be released later on: (i) times of all drug intakes are supposed to be known exactly; (ii) prescribed doses are assumed to be taken or not ("all-or-nothing" approach); (iii) only the previous n doses to a PK observation can be assessed, n being dependant on the half-life of the drug and our method sensitivity; (iv) there is no inter-occasion variability; (v) individual PK profiles can be derived from POSTHOC parameters estimated using sparse data sampled after 1st dose. In order to decide which dose among the n previous doses taken before the SS PK sample, 2n different compliance scenarios of dose taken/not taken have to be considered. The observed concentration value assumed to be taken at SS is compared to the concentration distribution predicted from each compliance profile. The compliance profile was chosen as the one minimising the Euclidean distance between the observed PK and the predicted ones simulated without residual errors.
In silico evaluation - the Imatinib example: Widmer et al.[2] proposed a population PK model of Imatinib (t½ = 15 hours). Imatinib is prescribed with an administration every 24 hours. One thousand PK parameter sets were randomly drown according to their population distribution and Imatinib concentrations following several compliance patterns were simulated considering the last 4 doses as taken or not leading to 16 compliance patterns. We have also considered different sampling
203
times and compared the performance. The best estimation of compliance was obtained with SS PK sample taken 5 hours after last dosing time. In this case, compliance of 91.8% patients was well estimated for immediate last dose taken, 69.9% on the last 2 takings, 44.4% on the last 3 takings and 24.4% on the last 4 takings. In addition, non-compliance appeared to be better estimated than good compliance profile.
Conclusion: In the Capecitabine/FBAL application (ratio t½ / τ = 0.25), we were able to estimate correctly adherence of the past 2 last takings. In the Imatinib application, the ratio t½ / τ is not large enough to characterise correctly the adherence of the third taking in the past. However our results on Imatinib seem more reliable since patients are prescribed 1 pill per time (while capecitabine patients are asked to take up to 7 pills per administration); the "all-or-nothing" assumption is in this case reasonable. Nevertheless the PK method is not informative enough and should be associated to electronic monitoring devices which record the actual time of system openings.
References: [1] Henin E, Trillet-Lenoir V, Colomban O, Tod M, Girard P. Estimation of patient compliance from pharmacokinetic samples. Abstracts of the Annual Meeting of the Population Approach Group in Europe : PAGE 16-Abstr 1193, 2007 [2] Widmer N, Decosterd LA, Csajka C, Leyvraz S, Duchosal MA, Rosselet A, Rochat B, Eap CB, Henry H, Biollaz J, Buclin T.Population pharmacokinetics of imatinib and the role of alpha-acid glycoprotein. Br J Clin Pharmacol 62: 97-112, 2006
204
Poster: Methodology- Other topics
Matt Hutmacher Implications for animal-human scaling of the parallel elimination profile PK model
Matthew M Hutmacher (1), Roberta Bursi (2), Sunny Chapel (1), Thomas Kerbusch (2) (1) Ann Arbor Pharmacometrics Group, Ann Arbor, MI, USA; (2) Clinical Pharmacology and
Kinetics, Organon, a part of Schering-Plough Corporation, Oss, The Netherlands.
Objectives: Translation and scaling of pharmacokinetic-pharmacodynamic (PK-PD) models is performed routinely throughout early drug development to aide in dose selection in first-in-human and proof of mechanism/concept studies. The intent is to predict concentrations at the effect site and their effect in humans from PK-PD animal information. Effect site concentrations are often immeasurable in humans, e.g. the brain for CNS compounds. When human effect site data are unobtainable, assumptions are necessary to predict these concentrations. The animal PK model can inform these assumptions. Equilibration between the effect site and central compartments might suggest scaling based on the central compartment. If the central and effect site compartments have dissimilar profiles, then the effect site concentration might be considered. If the concentration profiles are not in equilibration, but have parallel elimination rates (the central-effect site rate constants are inestimable - likely due to the study design), a parallel elimination profile (PEP) PK model can be utilized. This work introduces the issues associated with scaling the PEP model for prediction.
Methods: The PEP model is derived analytically for IV dosing. The model is also described graphically through simulations, and is motivated through fits to plasma, CSF, and brain concentrations from an animal study.
Results: Fits indicate the PEP model to be a parsimonious, adequate description of the animal data. However, the PEP analytical result indicates that the VES estimate is related to the (immeasurable) central-effect site rate constant, and is thus a biased (inaccurate) volume estimate - essentially VES is an apparent volume.
Conclusion: Experimental designs can fail to support PK rate constant estimation. The PEP model can reduce the number of parameters facilitating model convergence, but yields biased (apparent) effect site volume estimates. Predicted human effect site concentrations from scaling the PEP to inform dose selection for human proof of concept/mechanism studies are biased as a result. Other information or pharmacological considerations might be necessary to improve the accuracy of the prediction to ensure suitable decision making.
205
Poster: Methodology- Other topics
Ibrahim Ince Tailor-made drug treatment for children: creation of an infrastructure for data-sharing and population PK-PD modeling
Ibrahim Ince (1,2), Saskia N. de Wildt (1,6), Dick Tibboel (1), John N. van den Anker (1,4), Daan J. Crommelin (5), Meindert Danhof (2), Catherijne A.J. Knibbe (1,2,3)
(1) ErasmusMC Sophia Children’s Hospital, Departments of Paediatric Surgery and Paediatrics, Rotterdam, The Netherlands, (2) Leiden/Amsterdam Center For Drug Research, Department of
Pharmacology, Leiden, The Netherlands, (3) St. Antonius Hospital, Department of Clinical Pharmacy, Nieuwegein, The Netherlands, (4) Children’s National Medical Center, George
Washington University, Washington, DC, USA. (5) Top Institute Pharma, Leiden, The Netherlands, (6) The Hospital for Sick Children, Division of Clinical Pharmacology and Toxicology Toronto,
Ontario
Objectives: Despite profound differences in response between children (of different ages) and adults, drugs are used in children in an empirical manner. While about 70% of the prescribed drugs are unlicensed or off-label, this has important implications for the efficacy and safety of pharmacotherapy in these vulnerable patients. When developing dosing schemes for drugs in children, non-linear mixed effects modeling (population approach) is important. It allows the usage of sparse data and implementation of co-variates, and distinguishes between drug-specific and system specific causes of variability in response, to develop evidence-based individualized dosing regimens for (classes of) drugs. Therefore, in the Netherlands, a multidisciplinary research platform for the design of individualized dosing regimens in children has been established, sponsored by the Dutch Top Institute Pharma. Partners in this platform are 4 academic institutions and 6 pharmaceutical industries.
Methods: Modeling and simulation using non-linear mixed effects modeling for the development of rational dosing schemes in children involves: 1) optimization of trial design based on preliminary data, 2) development, including internal validation of population PK-PD models using sparse data, 3) external validation of the proposed models using independent data and 4) prospective clinical evaluation of the model-based individualized dosing regimens.
Results: To date, in the platform an infrastructure for sharing anonimized data in a secure environment, restricted access to predetermined investigators, extensive data checks and strict data management rules, has been created, allowing to implement the four steps in the development of dosing schemes for children. PK-PD model development has recently started.
Conclusions: The proposed infrastructure will allow to share datasets for model building and external validation for not only PK-PD model based age-specific dosing guidelines for specific drugs, but also a general dosing paradigm for drugs with similar disposition and/or effect.
206
Poster: Methodology- Other topics
Ron Keizer A simple infrastructure and graphical user interface (GUI) for distributed NONMEM analysis on standard network environments
Ron J Keizer(1), Anthe S Zandvliet(2), Alwin DR Huitema(1) (1) the Netherlands Cancer Inistitute / Slotervaart Hospital, (2) NV Organon / Shering-Plough, Oss
the Netherlands
Introduction: To increase processing power for CPU intensive computing encountered in PK-PD modeling, several solutions for distributive computing are available, all of which require investments in hardware, software and/or personnel.[1,2] We aimed to develop an infrastructure utilizing spare CPU cycles of desktop PC's in a standard network environment, to be set up and maintained without the need for vast hardware/software knowledge. Alongside, a graphical user interface (GUI) was constructed to use the infrastructure and to assist in performing NONMEM analyses.
Methods: The infrastructure requires a shared network-drive accessible by all clients (standard desktop PCs in a network environment), and a cron service (e.g. WinCron, free software) installed on every client. NONMEM runs are compiled locally, after which the executable file is transferred to the shared network drive and a client is assigned (manually or automatically). Runs are executed under low priority, to maintain continuous processing power for the client’s owner. Run results and additional files (MSF, tables) are transferred to a shared drive or back to the original directory. A GUI (Piraña) was developed to enable cluster distribution and to facilitate NONMEM analysis on stand-alone computers. Piraña was written in Perl/Tk and uses the PsN-core library[3] and R to generate reports of run results and basic GOF-plots.
Results: The developed infrastructure has been used successfully now for over one year by up to five modelers simultaneously. The infrastructure consisted of approximately 25 clients, and supported distribution of multiple runs to PC’s with multi-core CPUs. The system was stable and time-saving in model-development and facilitated execution of CPU intensive tasks, such as bootstrapping.
Conclusions: A NONMEM cluster infrastructure was built using a standard network environment, making use of spare CPU capacity of network-clients (standard desktop PC's). The setup could be of particular interest for small modeling groups situated in hospital or academic settings. A GUI was developed to use the infrastructure while also providing some modeling and analysis tools for NONMEM.
References: [1] Pihlgren P. et al., PAGE 15 (2006) Abstr 1032 [www.page-meeting.org/?abstract=1032] [2] Lindbom L., PAGE 12 (2003) Abstr 438 [www.page-meeting.org/?abstract=438] [3] Lindbom L. et al, Comput Methods Programs Biomed. 2004 Aug;75(2):85-94
207
Poster: Methodology- Other topics
Charlotte Kloft Launch of the Graduate Research Training (GRT) Program 'Pharmacometrics & Computational Disease Modelling' in Germany
C. Kloft (1), W. Huisinga (2), H.G. Schaefer (3), P. Noertersheuser (3) (1) Martin-Luther-Universitaet Halle-Wittenberg, Dept Clinical Pharmacy, Halle, Germany; (2)
Hamilton Institute/NUIM, Ireland & MATHEON/Freie Universitaet Berlin, Germany; (3) Elected representatives from Industry Partners in Extended Steering Board of the GRT Program
Background: To a PhD student, the field of pharmacometrics & computational disease modelling (PM&CDM) is difficult to master due to its highly interdisciplinary character. It requires the understanding of the underlying biological/pharmacological mechanisms and the formal mathematical/statistical methods. As academic disciplines, PM&CDM do not fit into the traditional frame of university departmental/institutional structures. At the same time, there is a high demand for thoroughly trained young scientists with sophisticated knowledge and expertise in these fields [1, 2], ready to boost the disciplines in academia and in pharmaceutical industry. Accordingly, a novel initiative in Germany has been launched.
Initiative: The Graduate Research Training (GRT) Program Pharmacometrics & Computational Disease Modelling is a novel joint initiative in Germany between the Martin-Luther-Universitaet Halle-Wittenberg, the Freie Universitaet Berlin and the six pharmaceutical companies (Industry Partners): Boehringer Ingelheim, Abbott, Merck, Bayer Schering Pharma, Bayer Technology Services and Sanofi-Aventis. The aims of the Program are to
comprehensively train junior scientists in PM&CDM, convey method and software expertise via training modules and research projects, formally implement PM&CDM in the academic environment and promote PM&CDM within and outside academia, and bridging the gap between academia
and industry.
The 3-year Program focuses on the diverse methods at the interface of PK, PD, disease modelling, systems biology, scientific computing and mathematical modelling. In the teaching curriculum, students shall be familiarised with these methods in a series of advanced academic and industrial modules. In addition, they shall learn to identify appropriate formal methods to tackle problems in drug development and pharmacotherapy.
The Program started in spring 2008 with the first generation of graduate students being admitted. The GRT Program will continuously be monitored to ensure a successful realisation; exchange with other initiatives/colleagues and their experience is sought and highly welcomed. In summary, the new public-private-partnership initiative offers graduate students a unique and exciting opportunity to experience research in the area of drug development and optimising drug therapy jointly within academia and industry. References: [1] Holford, Karlsson, Clin Pharmacol Ther, 82:103, 2007 [2] Powell, Gobburu, Clin Pharmacol Ther, 82:97, 2007
208
209
Poster: Methodology- Other topics
Ricardo Nalda-Molina Pharmacokinetic and Pharmacodynamic Model for Drug Induced Transient Transaminitis
Ricardo Nalda-Molina, Amelia Ramon-Lopez, Belén Valenzuela, Bernardo Miguel-Lillo, Maria Jose Duart, Arturo Soto-Matos
University of Miguel Hernandez and Pharmamar S.A.
Objectives: Reversible transient elevations in transaminases have been observed after the administration of several drugs. A previously developed semimechanistic pharmacokinetic and pharmacodynamic (PKPD) model was applied to evaluate the time course of alanine aminotransferase (ALT) elevation after drug X administration following different dosing schedules [1]
Methods: The drug was administered to 475 patients as monotherapy (dose range: 1x-100x mg) as 1- or 24-h infusions on days 1, 8, and 15 every 28 days; 3- or 24-h infusions on days 1 and 15 every 28 days; 1-h infusions daily for five consecutive days every 21 days; or, 3- or 24-h infusions every 14 days. Sequential PKPD modeling was performed with covariate evaluation on model parameters. A precursor-dependent PKPD model described the temporal relationship between ALT elevation and drug concentrations. The transfer process of ALT from hepatocytes to plasma was stimulated by drug concentration through a log-linear model with a mixture model. A feedback loop on the production rate of ALT in the hepatocytes was driven by the ALT plasma concentration. Posterior predictive check on grade ≥ 3 toxicity was used as model validation technique. Simulations were undertaken to assess the influence of the dose and schedule on grade ≥ 3 toxicity.
Results: Baseline ALT is 45.7% of the upper limit of normality (ULN), and the half life of ALT is 12 days. In approximately 12.5% of subjects, the drug effect was about 10-fold higher than that estimated in the rest of the population. Model evaluation showed that the predicted incidence of grade ≥ 3 toxicity was similar to the observed values. Simulations showed that severity of ALT elevation was dose dependent, but no differences in the toxicity were found across the dosing schedule evaluated and the infusion duration.
Conclusions: A previously developed semimechanistic PKPD model manages to describe the transient transaminitis following drug X treatment, including the tolerance development.
References: [1] Fetterly GJ, et al. Semimechanistic pharmacokinetic/pharmacodynamic model for hepatoprotective effect of dexamethasone on transient transaminitis after trabectedin (ET-743) treatment. Cancer Chemother Pharmacol. 2007 Oct 9; [Epub ahead of print].
210
Poster: Methodology- Other topics
Carmen Navarro Estimating the complete AUC and its standard error in sparse sampling designs.
Navarro-Fontestad MC1, Fernández-Teruel C2, González-Álvarez I1, Bermejo M1, Casabo VG1. 1Department of Pharmaceutics and Pharmaceutical Technology. College of Pharmacy. University
of Valencia.
Objectives: The area under the curve (AUC) is a pharmacokinetic parameter widely used in toxicokinetics and bioequivalence studies in small animals, as mice and rats, as a measure of drug exposure, but depending on the experimental design the estimation may be unfeasible, principally the standard error of estimated parameter.
Method: The AUC value estimation is based on the trapezoidal rule, as was described by Yuan1. A mathematical method for AUC standard error calculation in different sampling designs has been already developed. This method assumes a mixed effect model, where the experimental concentration is estimated by adding the subject effect and the residual effect to the mean concentration. In this model, the subject effect and the residual effect have been considered proportional deviations to the mean concentrations. Then, these values are used to construct the matrix variance-covariance of concentrations. Moreover, in the present work the aim was to expand this new mathematical method for estimating the complete area under the curve (AUC), from time zero to infinite, and its standard error. Furthermore this procedure includes the extrapolation for calculating the terminal slope, the extrapolation to the initial concentration in case of intravenous administrations and the transmission of this variability to standard error of AUC.
Data were simulated using NONMEM V as one hundred groups with twenty subjects each one. From the simulated data, different sampling scenarios were used.
Results: The AUC and its standard error were estimated using the new method and the obtained values were compared between designs with true AUC value.
Conclusion: This procedure can be applied to any design for non-compartmental AUC estimation and also estimates accurately the standard error of the AUC under any circumstance.
211
Poster: Methodology- Other topics
Klas Petersson Transforming parts of a differential equations system to difference equations as a method for run-time savings in NONMEM VI
Petersson, K., Friberg, L.E., Karlsson, M.O. Div. of Pharmacokinetics and Drug Therapy, Dept of Pharmaceutical Biosciences, Faculty of
Pharmacy, Uppsala University, Sweden
Objectives: As computing power increases, model runtimes decreases given that model complexity remain the same. Increased computing power also gives us the possibility of building more complex models that more adequately describes the sometimes complex mechanisms of diseases and drug effects. Even with the modern computers of today these models may require quite substantial amount of computing time, and for a model to be widely useful long runtimes are not practical. Models with substantial runtimes are often defined as differential equations ($DES in NONMEM). In this work we aim to explore if updating parts of the functions dependent on compartment amounts in the differential equations at pre-specified intervals could shorten model runtimes without loosing model fit.
Methods: In NONMEM VI there is the possibility to update the system at non-event times using a function called MTIME. Different parts of the differential equations in nine models based on differential equations [1-7] were moved from $DES to $PK and MTIME was used to update $PK at given intervals. The intervals were increased to give as short runtimes as possible but the intervals were kept short enough to retain roughly the same fit (OFV).
Results: For five [1,4,6-7] of the nine models we were able to shorten the runtimes to a pronounced degree (59-96% reduction) while for four models it was not possible to decrease runtimes and keep a similar fit. For the prolactin model [7] which had a runtime of over one month using FOCE the runtime dropped to 24 h. The fixed effects parameter estimates for four of the models which could be expedited were within 12% from the estimates of the original model. For the last of the faster models [1] one parameter differed by 23% and one by 13%. The mean absolute error for the fixed effects parameters in the faster models were between 1.5% and 8.0% and the mean absolute errors for the variance parameters were between 1.1% and 9.9%. The difference in OFV compared to the original models ranged between -14.4 and 1.7 units.
Conclusions: Moving parts of or whole equations from differential to difference equations using MTIME can in some cases shorten runtimes substantially while model fit and parameter estimates are retained. This approach may for example be useful in covariate modeling and in exploring the random effects model (e.g. IIV, IOV and semi-parametric distributions [8]). To understand the mechanism behind when this approach is applicable needs further studies.
References: [1] Troconiz, I. F. et al Clin Pharmacol Ther 1998;64(1):106-16 [2] Friberg, L.E. et al. J Clin Oncol 2002;20(24):4713-21 [3] Hamrén, B. et al. PAGE 2006; poster [4] Lönnebo, A. et al 2007;64(2):125-32 [5] Ribbing, J. et al. [6] Silber, HE. et al. J Clin Pharmacol. 2007;47(9):1159-71.
212
[7] Friberg, L.E. et al. PAGE 2006; poster [8] Petersson, K. et al. PAGE 2007; poster
213
Poster: Methodology- Other topics
Angelica Quartino Comparison Between using Continuous and Categorical Toxicity Data for Estimation with a Model for Continuous Data
Angelica L. Quartino (1), Lena E. Friberg (1), Sharon D. Baker (2) and Mats O. Karlsson (1) (1) Division of Pharmacokinetics and Drug Therapy, Uppsala University, Uppsala, Sweden; (2)
The Sidney Kimmel Comprehensive Cancer Center, Johns Hopkins University, Baltimore, Maryland, USA
Objectives: Access to toxicity data is sometimes limited to the categorized severity of the side-effect. The aim of this project is to explore the possibilities to use categorized data to estimate parameters of a model developed for continuous data.
Methods: A semi-mechanistic model of myelosuppression [1] and a dataset not used in the development of the model [2] were used. The dataset comprised of 77 cancer patients treated with docetaxel (75, 50 or 40 mg/m2 according to liver function). Absolute neutrophil count (continuous) and grade 0 to 4 neutropenia (categorical) was recorded on day 0, 7, 14 and 21 during one cycle of treatment. Individual concentration-time profiles were generated using the published population pharmacokinetic model for unbound docetaxel. The drug-related effect in the myelosuppression model was described using a sigmoid Emax model and an additive residual error on Box-Cox scale was applied.
The data was analyzed in four ways; 1) as continuous data, 2) as categorical data where all parameters were estimated, 3) as categorical data using prior information on the population parameters for baseline neutrophil count and residual error and 4) as categorical data using individual baseline values [3] and prior information on the residual error. The model parameters were estimated with NONMEM VI and estimation method Laplace (continuous data) or Laplace LIKE (categorical data). The categorical data was predicted as interval observations using the method for integration (M3) [4] with modification. The models were compared with respect to population parameter estimation and population and individual predictions.
Results: The estimated population parameters were similar with the four different ways of analysing the data. The individual predictions of the neutrophil time profiles obtained with continuous data (model 1) and the categorical data (model 4) corresponded very well. Model 2 and 3 were not able to characterize the individual baseline values, thus observations of grad 0 neutropenia (mainly day 0 and 21) were predicted to be around the population mean. However, the models were able to capture the neutrophil profile around nadir accurately.
Conclusions: Categorical data may be used for estimation of population parameters of a model for continuous data with reasonable accuracy. The approach allows individual prediction of the neutrophil time-course even though only categorical data was used in the analysis. It also allows a combined analysis of continuous and categorical data.
References: [1] Friberg, LE et al. Model of chemotherapy-induced myelosuppression with parameter consistency across drugs. J. Clin. Oncol. 2002, 20:4713-4721 [2] Hooker, A et al. Population Pharmacokinetic Model for Docetaxel in Patients with Varying
214
Degrees of Liver Function: Incorporating Cytochrome P450 3A Activity Measurements. Clin Pharmacol Ther. 2008, Jan 8 [3] Dansirikul, C et al. Comparison of models for baseline. PAGE 15 (2006) Abstr 968 [www.page-meeting.org/?abstract=968] [4] Beal, S.L. Ways to fit a PK model with some data below the quantification limit. J Pharmacokinet Pharmacodyn, 2001. 28(5): p. 481-504.
215
Poster: Methodology- Other topics
Tarjinder Sahota The use of population PKPD models over the NOAEL approach in the estimation of safe drug exposure levels in animals
T. Sahota Leiden University
Introduction and background: In preclinical safety toxicology the No Observed Adverse Event Level (NOAEL) and the Benchmark Dose (BMD) are used to estimate thresholds for safe drug exposure in humans. The BMD method is considered an improvement over the NOAEL approach mainly due to the evaluation of the dose-response relationship. However, a modification of the current NOAEL approach may enable the characterisation of the exposure-response relationship, yielding a better predictor of drug safety and toxicology.
Objectives: In the current investigation, we demonstrate how nonlinear mixed effects modelling can be applied to toxicological data enabling a less empirical evaluation of drug effects in preclinical species. In addition, the approach offers the benefits of integrating data from multiple experiments, increasing the feasibility of obtaining mechanistic or semi-mechanistic models. In conjunction with simulation techniques, it is possible to re-parameterise risk and define threshold levels from which a safety margin can be derived for drug administration in humans.
Methods: We have simulated the pharmacokinetic and pharmacodynamic parameter distributions based on a variety of mechanisms of action for a hypothetical new compound. These were then used to perform toxicology and pharmacokinetics experiments. The data was then analysed with a traditional NOAEL approach and compared to risk estimates derived from a PKPD model using NONMEM v. 6.
Results: The level of risk corresponding to dosing animals at the NOAEL depends on the baseline incidence of the AE and experimental setting, such as dose selection. The population approach's risk-based estimates do not depend on the baseline or potency of the tested hypothetical effects.
Conclusions: The use of the NOAEL approach without taking uncertainty into account can lead to overly conservative safety threshold levels. The population approach, in contrast, enables quantification of uncertainty, as described by estimates of confidence intervals, between and within subject variability for relevant parameters.
216
Poster: Methodology- Other topics
Radojka Savic A novel bootstrap method for obtaining uncertainty measurement around the nonparametric distribution
R.M. Savic (1), P.G. Baverel (1), M.O. Karlsson Dept of Pharmaceutical Biosciences, Uppsala University, Sweden
Objectives: : Nonparametric methods are powerful tools in population analysis for detecting non-normal distributions of random effects.(1-3) However the wide application of these methods is limited for various reasons, one of them being the lack of imprecision measurement. The aim of this work is to develop a novel method for obtaining the uncertainty around the nonparametric distribution (NPD).
Methods: Original dataset (D) containing J individuals are bootstrapped with replacement n times. This creates n bootstrapped datasets (B1-n) each containing less number of unique individuals than the original number J. Bootstrap sample key, i.e. scheme of included individuals in each B is recorded. The final model is run n times with B1-n and n sets of final parameter estimates (P1-n) are obtained. Each P is used to estimate NPD using final model and D. This further results in n sets of NPD1-n. Each NPD corresponds to P1-n , but it is defined at J number of support points as D is used as the dataset for its estimation. The individual contributions, i.e. probabilities to each NPD are computed. These are summarized as table T1-n with dimensions JxJ with columns representing points of support and rows containing vectors of individual probabilities, J in total. According to the bootstrap sample key, individual probability vectors corresponding to individuals contained in B1-n are sampled from T1-n. This result in n sets of new NPD (NPDnew1-n) based exclusively on information from individuals contained in dataset B1-n but defined at J number of points of support. NPDnew1-n are used to construct 95% CI around the original NPD.
Results: The method has been successfully developed and tested using nonparametric estimation method in NONMEM VI. Being a computer intensive method, automation using Perl and PsN was necessary. A shorter version has been developed which involves obtaining individual probability vectors for original NPD only. These vectors could be bootstrapped with replacement on its own which can be further used to construct confidence intervals around NPD.
Conclusions: A novel method for uncertainty measurement around NPD is developed. The implementation of the method is available for software NONMEM; however the principle can be applied within other nonparametric software framework. The method facilitates wider use of nonparametric methods for population analyses in future.
References: [1] Bustad A, Terziivanov D, Leary R, Port R, Schumitzky A, Jelliffe R. Parametric and nonparametric population methods: their comparative performance in analysing a clinical dataset and two Monte Carlo simulation studies. Clin Pharmacokinet 2006;45(4):365-83. [2] TMallet A, Mentre F, Steimer JL, Lokiec F. Nonparametric maximum likelihood estimation for population pharmacokinetics, with application to cyclosporine. J Pharmacokinet Biopharm 1988;16(3):311-27.. [3] Savic R.M., Kjellsson M.C., Karlsson M.O. Evaluation of the nonparametric estimation method
217
in NONMEM VI beta. In; 2006; PAGE 15 (2006) Abstr 937 [www.page-meeting.org/?abstract=937]
218
Poster: Methodology- Other topics
Nabil Semmar Independent-model diagnostics for a priori identification and interpretation of outliers from a full pharmacokinetic database: correspondence
analysis, Mahalanobis distance and Andrews curves
Nabil Semmar, Saik Urien, Bernard Bruguerolle and Nicolas Simon Laboratory of Clinical Pharmacology, EA3784, Medical School of Marseilles, Marseilles, France
Objectives: This work aimed to extract outliers from a full PK dataset independently of any PK model. This provides information on the variability structure of a PK (PD) population and on its homogeneity/heterogeneity level before modelling. The usefulness of a priori outlier diagnostics was underlined by highlighting a positive link between the degree of outlier values and their predictability error given by a PK (PD) model. This can help modeller to select the most appropriate model among different candidate ones.
Methods: Outlier diagnostics concerned both the extraction of outlying PK (PD) profiles (subjects) and their outlier concentration values. Multivariate outlier diagnostics were applied and consisted in combining all the concentration-time values of a PK (PD) profile to compute a scalar from which a subject will be classified as outlier or non-outlier (1). Then, the outlier concentrations were identified in each outlying profile by computing the scalar without one concentration at once. In order to examine the outliers under different aspects, three multivariate diagnostics corresponding to three different distance metrics were applied: Andrews curves, correspondence analysis and jackknifed Mahalanobis distance, which are based on Euclidean, Chi-square and Mahalanobis distances respectively (2-4) (5-6) (7). These multivariate analyses were carried out by using Excel, ADE and JMP softwares respectively (8, 9, 10). After the application of the three detection methods, the outliers were classified by the number of times they were detected (0<= <= 3). These three multivariate diagnostics were illustrated on a full PK dataset consisting of capecitabine orally administrated (11). A posteriori, the dataset was modelled with NONMEM by using a first order absorption model. From the modeling results, normalized prediction distribution errors (NPDE) of concentrations were computed (12). Links between a posteriori and a priori results were examined by analysis of the NPDE absolute values in relation to the number of times (0<= <= 3) corresponding concentrations were identified as outlier.
Results: The outliers confirmed by the three diagnostics a priori corresponded to the most atypical concentrations because of their atypical absolute (Euclidean) and relative (Chi 2) values, and their atypical location (Mahalanobis distance) on the PK profiles: According to Andrews curves (Euclidean distance), the outlier concentrations had atypically high absolute values. They corresponded to very high absorption peaks. Correspondence analysis (Chi-2 distance) showed outlier concentrations as relatively high concentrations compared both with the concentrations at other times in the same subject, and with the concentrations at the same time in the whole population. These concentrations corresponded to early or delayed absorption peaks (at unusual times). The jackknifed Mahalanobis distance extracted outliers as concentrations linked to atypical variations, e.g. an increase rather a decrease. Such case can be represented by patient showing peak concentrations during the elimination phase of the whole population.
219
After PK modeling, a positive correlation was found between the NPDE and the number of times each concentration was detected as outlier: higher the number of detection of an outlier was a priori (0<= <=3), higher was its NPDE absolute value a posteriori.
Conclusions: The application of multivariate diagnostics for extraction of outliers from a full PK (PD) dataset provided key information on the variability of a PK (PD) population independently of any PK (PD) modelling. This variability analysis a priori was based on identification of outlier concentrations in some outlying subjects which corresponded to extreme PK (PD) states according to a certain distance metric. The use of three distance metrics (Euclidean, Chi-square and Mahalanobis) was advantageous in two ways: first, some concentrations were detected as outliers only under one or two criteria. This can help the clinicians to suitably classify and interpret outlying patients according to the outlier detection criterion (metric). Second, some outlier concentrations were confirmed by all the diagnostics and they were considered as the most significant outliers. The number of times (0<= <=3) where each concentration was detected as outlier a priori was positively correlated to its NPDE a posteriori, i.e. after the application of a PK model on the dataset. This can usefully help the modeller to select among several PK (PD) models, the most appropriate one according to its ability to fit well the most confirmed outliers.
References: [1] R. Gnanadesikan. Methods for Statistical Data Analysis of Multivariate Observations. Wiley, New York, 1977. [2] M.J. Greenacre. Theory and Applications of Correspondence Analysis. Academic, London, 1984. [3] M.J. Greenacre. Correspondence Analysis in Practice. Academic, London, 1993. [4] F. Mortier, A. and Bar-Hen, 2004. Influence and sensitivity measures in correspondence analysis. Statistics 38: 207-215 (2004). [5] D. Andrews. Plots of high-dimensional data. Biometrics 28, 125-136 (1972). [6] V. Barnett. The ordering of multivariate data (with discussion). J. R. Stat. Soc. 139: 318-354 (1976). [7] R. Swaroop and W.R. Winter. A Statistical Technique for Computer Identification of Outliers in Multivariate Data. NASA Technical Notes, D-6472 (1971). [8] Thioulouse J, Chessel D, Dolédec S, Olivier JM (1996) ADE-4: a multivariate analysis and graphical display software. Statistics and Computing 7:75-83. [9] Frye C, Freeze WS, Buckingham FK (2004) Microsoft Office Excel 2003 Programming Inside Out. Microsoft Pr, Washington. [10] SAS Institute Inc. . JMP3.2. SAS Institute, Carry, North Carolina, 1987. [11] S. Urien, K. Rezaï, and F. Lokiec. Pharmacokinetic Modelling of 5-FU Production from Capecitabine - A Population Study in 40 Adult Patients with metastatic Cancer. J. Pharmacokin. Pharmacodyn. 32: 817-833 (2005). [12] K. Brendel, E. Commets, C. Laffont, C. Laveille and F. Mentré. Metric for external Model Evaluation with an Application to the Population Pharmacokinetics of Gliclazide. Pharmaceutical Research 23: 2036-2049 (2006).
220
Poster: Methodology- Other topics
Xu Xu Exposure-Response Analysis of Adverse Events in Clinical Trials Using Zero-Inflated Poisson Modeling With NONMEM®.
Xu (Steven) Xu and Partha Nandy Global Clinical Pharmacokinetics & Clinical Pharmacology, Johnson & Johnson Pharmaceutical
Research & Development, L.L.C., Raritan, New Jersey; Titusville, New Jersey, US.
Background: Count data, typically characterized by the number of occurrences of an event during a specified time interval, often arises in clinical trials and are usually characterized and modeled by Poisson distribution. Often times, such kind of data is associated with adverse events. However, some adverse events may only be observed in a small portion of the study subjects, namely excessive zeros in the data. Exposure-response modeling of such data allows for a better understanding of the relationships between drug exposure and event rate and helps identify potential risk factors that make subjects prone to certain adverse events.
Objectives: The objectives of the analysis were (1) to model event rate of an adverse event following administration of a new investigational drug; (2) to assess the potential relationships between the occurrence of the adverse event and the extent of drug exposure; and (3) to identify potential risk factors that influence the occurrence of the adverse event.
Methods: An exposure-response model was developed using pooled data from several trials of an investigational drug (1069 patients). Since no events during the studies were observed for a large portion of subjects, zero-inflated Poisson (ZIP) regression models [1] were explored and developed using NONMEM® to characterize the zero-rich count data for the adverse event. Alternative modeling strategies, such as regular Poisson and Negative Binomial regression models (implemented in S-PLUS®) were also fitted to the data; and the results were compared to that from the ZIP model. Patient-specific measures of drug exposure were simulated based on a population PK-model of this drug. Drug exposure, demographic variables, and other relevant variables were examined on both logistic and truncated Poisson components of the ZIP model to identify potential risk factors. The ZIP model was evaluated using marginal calibration diagram [2] and used to simulate exposure-adverse event response curves and placebo effect.
Results: ZIP models adequately characterized the distribution of the adverse event, while Poisson and Negative Binomial models tended to underestimate the event rate. Drug exposure was identified as significant risk factor. An Emax model best described the relationship between the occurrence of the adverse event and drug exposure. Certain demographic variables, such as sex and body weight, were also identified as risk factors. Men were found to be less likely to have the adverse event compared to women. Body weight had a borderline effect in determining the risk of the adverse event with an incidence rate ratio of 0.98 (95% CI: 0.97 - 0.99). The simulation suggested that higher the drug exposure, the more episodes of the adverse event a subject would be expected to experience. The risk of placebo-treated subjects having multiple episodes of the adverse event was virtually insignificant. In placebo group, women reported more incidences of adverse event than men, which may suggest that women are predisposed to the adverse event compared to men.
Conclusions: Exposure-response modeling allows for exploring relationships between drug exposure and occurrence of drug-related adverse events along with identification of risk factors.
221
Zero-inflated Poisson regression can be implemented in NONMEM® and is a useful tool to model the occurrence of an adverse event, where no instance of the adverse event were reported in majority of subjects.
References: [1] Johnson NL, Kotz S, Kemp AW. Univariate Discrete Distributions, 2nd edn. Wiley: New York, 1992 [2] Czado, C., Gneiting, T., Held, L. (2007) Predictive Model Assessment for Count Data. University of Washington Department of Statistics Technical Report no. 518.
222
Poster: Methodology- PBPK
Viera Lukacova PBPK modeling of metoprolol and its metabolites
Viera Lukacova, Walter S. Woltosz, Michael B. Bolger Simulations Plus, Inc. Lancaster, C
Objectives: Develop a model describing absorption and pharmacokinetics of metoprolol and the formation and pharmacokinetics of its metabolites.
Methods: GastroPlusTM (Simulations Plus, Inc.) was used to fit the model describing absorption and pharmacokinetics of metoprolol and its metabolites. A physiologically-based pharmacokinetic (PBPK) model was used to describe the distribution and pharmacokinetics (DPK) of metoprolol along with the simultaneous DPK of its metaolites. The in vitro metabolism of metoprolol to its two major metabolites (alpha-hydroxy-metoprolol and O-demethylmetoprolol) measured in human liver microsomes [1] was used to describe metabolic clearance of metoprolol and formation of the metabolites. The renal clearance of metoprolol was estimated using glomerular filtration rate and fraction unbound in plasma. The renal clearance of the final metabolites was fitted to match the amount of radioactive metabolites secreted in urine [2].
Results: Cp-time profiles of metoprolol and the metabolites as well as urinary secretion of metoprolol and total metabolites were successfully modeled for IV and oral administration of metoprolol. The major metabolizing enzyme for metoprolol (CYP 2D6) is present in intestinal microsomes. However, our simulation shows that the contribution of gut metabolism to first pass extraction was not significant for this compound. Urinary secretion was sufficient to describe the clearance of the final metoprolol metabolites (measured as total radioactive metabolites). To describe the pharmacokinetics of one of the direct metabolites of metoprolol, alpha-hydroxy-metoprolol [3], a significant contribution from metabolic clearance had to be considered.
Conclusions: A model describing pharmacokinetics of metoprolol and its metabolites, total metabolite fraction as well as alpha-hydroxy-metoprolol alone, was optimized. The model accurately describes plasma concentration and urinary secretion of total metabolites as well as plasma concentration of alpha-hydroxy-metoprolol alone under assumption that alpha-hydroxy-metoprolol undergoes further biotransformation [4].
Italo Poggesi Evaluation of a basic PBPK model in preclinical species for which tissue compositions are unknown
Bizzotto R (1), Nucci G (2), Petrone M (2), Poggesi I (2), Cobelli C (1), Gomeni R (2) (1) Department of Information Engineering, University of Padova, Padova, Italy; (2) Clinical
Objectives: We are currently proposing a Bayesian approach for the predictions of human pharmacokinetics based on PBPK [1], in which the tissue partition process is parameterized using a tissue composition model [2]. Since the Bayesian procedure was used to fine tune a few model parameters based on in vivo preclinical pharmacokinetic data, the parameterization of the tissue composition model in all animal species is required. In dogs and monkeys no tissue composition data are reported in the literature; the present evaluation aimed therefore at evaluating the performance of the tissue composition model in these species resorting to the data available in rats, mice, rabbits and humans.
Methods: A set of 22 GSK compounds given IV to dogs was considered. Data on blood flows and tissue volumes were available from the literature. Tissue composition data were alternatively assumed equal to those reported for rats, mice, rabbits and humans. The predictive performance of the different tissue composition models was evaluated considering volumes of distribution and clearance values.
Results: The available tissue composition data provided adequate predictions of the volume of distribution at steady state in dogs, with average fold-errors of 2.2, 2.1, 2.2 and 2.3 based on the tissue data of mice, rats, humans and rabbits, respectively. The corresponding percentage of compounds predicted within 2-fold was 59, 50, 45 and 59%, respectively. This performance did not appear substantially degraded as compared to that obtained in rats with the appropriate tissue composition (average fold-error 1.8, 74% of compounds predicted within 2-fold). The performance for the systemic clearance predictions (dependent on the tissue composition model only for the blood to plasma partition) was good (fold-error 1.8-2.0) and essentially identical to that observed in rats.
Conclusions: The application of our Bayesian approach for the predictions of human pharmacokinetics based on PBPK modelling encouraged us to consider also the in vivo pharmacokinetic data obtained in dogs and monkeys. The models were reparameterized with the tissue composition data reported for other animal species. The predictive performance in dogs was comparable to that achieved with the appropriate tissue composition. The performance in monkeys is currently under evaluation and will be presented during the poster session.
References: [1] Bizzotto R, Nucci G, Poggesi I, Gomeni R. Integration of preclinical information into a PBPK approach for predicting human pharmacokinetics. PAGE 2007 [2] Poulin P & Theil FP. Prediction of Pharmacokinetics prior to In Vivo Studies. II. Generic Physiologically Based Pharmacokinetic Models of Drug Disposition. J. Pharm. Sci. 2002, 91:1358-70.
224
Software demonstration
Jason Chittenden Phoenix platform, WinNonlin, Trial Simulator, WinNonlin AutoPilot, and PKS (a PK/PD data repository)
Pharsight Pharsight
Pharsight will be presenting software demonstrations in the demonstration room at the scheduled times and by appointment. PAGE attendees will be able to have an advance look at the Phoenix platform (currently under development) upon which the next major release of WinNonlin will be built.
Phoenix: NLME, a new module for Nonlinear Mixed Effects Modeling, also to be released on the Phoenix platform, will be demonstrated on an ongoing basis.
Attendees may also be interested to see WinNonlin, Trial Simulator, WinNonlin AutoPilot, and PKS (a PK/PD data repository).
225
Software demonstration
Colm Farrell Hands-On Demonstration of PDx-Pop® v3.0; Tools for Expediting Population Analysis
ICON Development SolutionsTM ICON Development SolutionsTM
PDx-Pop 3.0 (the graphical interface software that integrates NONMEM with statistical, graphical and model evalutation tools) was shipped to all current PDx-Pop licensees during February 2008. New features available in PDx-Pop version 3.0:
1. Windows Vista compatibility. 2. Linux Version (tested on Ubuntu and Redhat). 3. Mac OS X version (tested on Tiger). 4. A new real time plotting feature has been added that can plot the objective function value as
a function of the iteration number to allow the user to monitor the progress of the run graphically.
5. A new data checkout plotting system with additional capability that can use either R or S-Plus has been added to supplement the current data checkout using Microsoft Excel.*
6. New automated plots for individual parameter estimates (QQ-plots, QQ-log plots, and histograms of parameters).
7. New automated plots for individual eta estimates (pairs plots, QQ-Plots and histograms of etas).
8. To accommodate security measures for our clients, PDx-Pop implements a new, more user-friendly licensing mechanism that does not require administrative user privileges.
9. Installation is simplified and no longer requires the long serial number.
* Integration of PDx-Pop with R (for statistics and graphics) and xpose4 was introduced in PDx-Pop version 2.2. 30 day trial versions (with all features fully functional) are available for evaluation.
226
Software demonstration
Andrew Hooker Xpose and Perl Speaks NONMEM (PsN)
Andrew C. Hooker, Pontus Pihlgren, Kajsa Harling, E. Niclas Jonsson and Mats O. Karlsson Division of Pharmacokinetics and Drug Therapy, Department of Pharmaceutical Biosciences,
Uppsala University, Uppsala, Sweden
Xpose 4 is an open-source population PK/PD model building aid for NONMEM. Xpose tries to make it easier for a modeler to use diagnostics in an intelligent manner, providing a toolkit for dataset checkout, exploration and visualization, model diagnostics, candidate covariate identification and model comparison. PsN is a toolbox for population PK/PD model building using NONMEM. It has a broad functionality ranging from parameter estimate extraction from output files, data file sub setting and resampling, to advanced computer-intensive statistical methods and NONMEM job handling in large distributed computing systems. PsN includes stand-alone tools for the end-user as well as development libraries for method developers. In the latest versions of Xpose and PsN cooperative functionality has been included to take advantage of the strong points of both programs. Through the use of both programs the end user can easily compute and display the conditional weighted residuals (CWRES) [1], and various visual predictive checks. Both Xpose and PsN are freely available at xpose.sf.net and psn.sf.net respectively.
[1]. Hooker, A.C., C.E. Staatz, and M.O. Karlsson, Conditional weighted residuals (CWRES): a model diagnostic for the FOCE method. Pharm Res, 2007. 24(12): p. 2187-97.
Joakim Nyberg, Stefanie Henning, Mats O. Karlsson and Andrew C. Hooker Division of Pharmacokinetics and Drug Therapy, Department of Pharmaceutical Biosciences,
Uppsala University, Uppsala, Sweden
PopED is a Optimal Experimental Design tool for Non-Linear Mixed Effect Models [1]. Key features of PopED include the ability to optimize over multiple possible models as well as to assume distributions about model parameter values (ED-optimal design). PopED allows the user to optimize over any design variable (sample times, dose, number of individuals, start and stop time of experiments, infusion lengths and start times, etc...) greatly enhancing the information content of experiments. PopED 2 is written in Matlab and, for Windows users, a Graphical User Interface (GUI) is available. The PopED GUI is a Windows based program written in the language C# .NET 2.0 that wraps around the script version of PopED (written in Matlab) which performs the calculations needed to get an optimal design. The purpose of the GUI is to have an easy way to build up an experiment and to optimize the design variables in that experiment. The PopED GUI provides model templates and examples that will help the user to set up their own experiments and also provides tools for interpretation of the outcome of the optimal design and ways to validate models and simulate models prior to the optimal design. All these tools are also accessible via the script version of PopED. PopED is freely available at poped.sf.net.
[1]. Foracchia, M., et al., POPED, a software for optimal experiment design in population kinetics. Comput Methods Programs Biomed, 2004. 74(1): p. 29-46.
Carlos Hoyo-Vadillo Four Programs for Writing and Running Nonmem Scripts.
C. Hoyo-Vadillo Pharmacology, Cinvestav. Mexico.
Objectives: Wings for Nonmem[1] and Perl speaks Nonmem[2] are useful libraries of scripts for running Nonmem in a way more efficient. But two programs are difficult to grasp for beginners. I propone four new programs for doing four simple tasks: 1) to construct combinations of basic $PK models. 2) To assign initial values to one of the chosen previous model and 3) Write several batch files to run in series the CTLs scripts and 4) Find the best analysis and summary the main parameters.
Methods: Quick Basic was used on a laptop running Microsoft Vista. A RUN.ctl program with an initial model was used to construct all combinations for eta error model. Then the cognate nmfe6 batch files were edited to allow a concatenated run for the 32 runxx.ctl files. Once chosen the best model, 19 initial values were assigned to each of the 5 parameters. At the end the Function Objetives for each run were imported by excel to plot them. S-Plus was used to explore the goodness of fit of selected runs. Package is available at web.mac.com/farmacogenomica.
Results: WRTEXP program was able to write the 32 combinations for *EXP(ETA(n)) for five fitting parameters in ADVAN4 TRANS1. It takes about 40 min for 80 runs. WRTEXP, PUTINIT2, MAKERUN and READFO use a few seconds to run.
Conclusions: I plan to translate the package to C and Java for interportability. New more general programs are needed to comply more general tasks, but current version is suitable as a teaching tool.
Masoud Jamei Simcyp Simulator - a comprehensive platform and database for mechanistic modelling and simulation of oral drug absorption, tissue distribution,
metabolism and elimination in healthy and disease populations using in vitro knowledge
Jamei M, Howgate E, Aarabi M, Ghobadi C Simcyp Ltd
Simcyp is a University of Sheffield spin-out company that develops algorithms along with population and drug databases for modelling and simulation (M&S) of the absorption and disposition of drugs in patients and specific subgroups of patients across different age ranges. The Simcyp models use experimental data generated routinely during pre-clinical drug discovery and development from in vitro enzyme and cellular systems as well as any relevant physico-chemical attributes of the drug and dosage forms.
The Simcyp Population-based ADME Simulator is licensed to Simcyp's Consortium member clients for use in drug discovery and development. The Consortium guides scientific development at Simcyp, ensuring that the platform and databases continue to meet, and in many cases exceed, industry needs. Simcyp maintains strong academic links and our science team conducts internationally recognised cutting-edge research and development which accelerates decision making in drug discovery and development for member pharmaceutical companies. The Simcyp science team:
provides a user friendly simulator that integrates genetic information on drug metabolising enzymes into PBPK models for the prediction of drug disposition in diverse patient populations with relevant demographic and physiological characteristics,
offers consultancy and advice on a broad spectrum of DMPK issues (including optimal study design for metabolic drug-drug interactions, data interpretation, prediction of in vivo ADME from in vitro studies, dose selection for different age groups particularly in neonates and young children, assessing the likely effects of renal impairment, cirrhosis and ethnic variations on ADME, etc)
delivers an educational program consisting of hands-on workshops and courses covering concepts and applications of in vitro - in vivo extrapolation (IVIVE) to predict drug clearance, drug-drug interactions, gut absorption handling metabolism/transport interplay, and covariates that determine drug disposition (see http://www.simcyp.com/ProductServices/Workshops/)
Currently, 9 of the top 10 pharmaceutical companies worldwide have access to Simcyp expertise through Consortium membership. Members include AstraZeneca, Biovitrum, Daiichi-Sankyo, Eli Lilly, F.Hoffman-La Roche, Lundbeck, Novartis Pharma, Nycomed, Otsuka, Pfizer, sanofi-aventis, Servier, Takeda and UCB Pharma among others. The aim of the Consortium is to help members enhance the utilisation of information from pre-clinical development in the rational selection and design of in vivo studies. Value is added to decision-making processes by collaboration with regulatory bodies (the FDA, MPA, NAM, ECVAM) and academic centres of excellence worldwide, also within the framework of the Consortium.
In the demonstration session we provide an overview of the capabilities of the Simcyp Simulator to predict drug absorption, clearance and metabolic drug-drug interactions and PBPK modelling from in vitro and physiochemical information in diverse populations including paediatric, obese, cirrhosis and renally impaired. Some details of the scientific background to Simcyp's approaches can be found in our recent publications:
- Yang JS et al. Cytochrome P450 Turnover: Regulation of Synthesis and Degradation, Methods for Determining Rates, and Implications for the Prediction of Clinical Drug Interactions. Current Drug Metabolism, (in press). -Rostami-Hodjegan A and Tucker GT. Simulation and prediction of in vivo metabolic drug clearance from in vitro data. Nature Reviews 6(2), 140-149, 2007. - Yang JS et al. Prediction of intestinal first-pass drug metabolism. Current Drug Metabolism 8(7), 676-684, 2007. - Yang JS et al. Theoretical assessment of a new experimental protocol for determining kinetic values describing mechanism (time)-based enzyme inhibition, Eur J Pharma Sci, 31(3-4), 232-241, 2007. Perrett HP et al. Disparity in holoprotein/apoprotein ratios of different standards used for immunoquantification of hepatic cytochrome P450 enzymes. Drug Metabolism & Disposition 35(10), 1733-1736, 2007. Yang JS et al. Misuse of the Well-Stirred Model of Hepatic Drug Clearance, Drug Metabolism and Disposition, 35(3), 501-502, 2007. Van LM et al. Inactivation of CYP2D6 by methylenedioxymethamphetamine in different recombinant expression systems. Eur J Pharma Sci, 32(1), 8-16, 2007.
Roger Jelliffe The USC*PACK software for nonparametric adaptive grid (NPAG) population PK/PD modeling, and the MM-USCPACK clinical software for
individualized drug regimens.
R Jelliffe, A Schumitzky, D Bayard, R Leary, M Van Guilder, M Neely, S Goutelle, and A Bustad. Laboratory of Applied Pharmacokinetics, USC Keck School of Medicine
The BigWinPops maximum likelihood nonparametric population adaptive grid (NPAG) modeling software runs in XP. The user runs the BOXES routine to make the PK/PD model. This is compiled and linked transparently. The subject data files are entered, and instructions. Routines for checking data files and for viewing results are provided. Likelihoods are exact. Behavior is statistically consistent, so studying more subjects gives estimates progressively closer to the true values. Stochastic convergence is as good as theory predicts. Parameter estimates are precise [1]. The software is available by license from the University for a nominal donation.
The MM-USCPACK clinical software [2] uses NPAG population models, currently for a 3 compartment linear system, and computes dosage regimens to hit desired targets with minimum expected weighted squared error, thus providing, for the first time, maximal precision in dosage regimens, a feature not seen with other known clinical software. Models for planning, monitoring, and adjusting therapy with aminoglycosides, vancomycin (including continuous IV vancomycin), digoxin, carbamazepine, and valproate are available.
The interactive multiple model (IMM) Bayesian fitting option [3] now allows parameter values to change if needed during the period of data analysis, and provides the most precise tracking of drugs in over 130 clinically unstable gentamicin and 130 vancomycin patients [4].
In all the software, creatinine clearance is estimated based on one or two either stable or unstable serum creatinines, age, gender, height, and weight [5].
References: [1] Bustad A, Terziivanov D, Leary R, Port R, Schumitzky A, and Jelliffe R: Parametric and Nonparametric Population Methods: Their Comparative Performance in Analysing a Clinical Data Set and Two Monte Carlo Simulation Studies. Clin. Pharmacokinet., 45: 365-383,2006. [2] Jelliffe R, Schumitzky A, Bayard D, Milman M, Van Guilder M, Wang X, Jiang F, Barbaut X, and Maire P: Model-Based, Goal-Oriented, Individualized Drug Therapy: Linkage of Population Modeling, New "Multiple Model" Dosage Design, Bayesian Feedback, and Individualized Target Goals. Clin. Pharmacokinet. 34: 57-77, 1998. [3] Bayard D, and Jelliffe R: A Bayesian Approach to Tracking Patients having Changing Pharmacokinetic Parameters. J. Pharmacokin. Pharmacodyn. 31 (1): 75-107, 2004. [4] Macdonald I, Staatz C, Jelliffe R, and Thomson A: Evaluation and Comparison of Simple Multiple Model, Richer Data Multiple Model, and Sequential Interacting Multiple Model (IMM) Bayesian Analyses of Gentamicin and Vancomycin Data Collected From Patients Undergoing Cardiothoracic Surgery. Ther. Drug Monit. 30:67-74, 2008. [5] Jelliffe R: Estimation of Creatinine Clearance in Patients with Unstable Renal Function, without a Urine Specimen. Am. J. Nephrology, 22: 3200-324, 2002.
232
Software demonstration
Marc Lavielle Analysing population PK/PD data with MONOLIX 2.4
Marc Lavielle (1), Hector Mesa (1), Kaelig Chatel (1), Julie Bertrand (2), France Mentré (2) and the Monolix group
(1) INRIA Saclay, (2) INSERM U738
MONOLIX is an open-source software using Matlab. The full Matlab version and a stand-alone version of MONOLIX can be downloaded from the MONOLIX website : http://software.monolix.org/
MONOLIX performs maximum likelihood estimation in nonlinear mixed effects models without linearization. The algorithms used in MONOLIX combine the SAEM (stochastic approximation version of EM) algorithm with MCMC (Markov Chain Monte Carlo) and a Simulated Annealing procedure. The convergence of this algorithm and its good statistical properties have been proven and published in the best statistical journals [1,2]. The algorithm is fast and efficient in practice. It converges in situations where other reference methods (NONMEM, nlme,...) do not.
A beta version of release 2.4 will be available on the MONOLIX website at the end of June 2008. This last version of MONOLIX 2 will contain many important features:
An extensive library of PK model (1, 2 and 3 cpts ; effect compartment ; bolus, infusion, oral0 and oral1 absorption ; linear and nonlinear elimination ; single dose, multiple doses and steady state)
An extensive library of PD models (immediate and turn-over response models ; disease models)
Continuous and categorical covariate models, Constant, proportional, combined and exponential error models, Modelisation of the inter-occasion variability, Use of several distributions for the individual parameters (normal, lognormal, logit, probit,
Box & Cox, ...) Model selection: information criteria (AIC, BIC) and statistical tests (LRT, Wald test) Data in NONMEM format, Goodness of fit plots (VPC, weighted residuals, NPDE, ...), Data simulation, Automatic reporting, A C++ ODEs solver package for user defined models, A first version of MLXTRAN (a NMTRAN-like interpreter)
References: [1] Delyon B, Lavielle M and Moulines E. "Convergence of a stochastic approximation version of the EM algorithm", Annals of Statistics. 27, 94- 128, 1999. [2] Kuhn E and Lavielle M. "Maximum likelihood estimation in nonlinear mixed effects model", Computational Statistics and Data Analysis. 49, 1020-1038, 2005. [3] Samson A., Lavielle M., Mentré F. "Extension of the SAEM algorithm to left-censored data in non-linear mixed-effects model: application to HIV dynamics models" Computational Statistics and Data Analysis, vol. 51, pp. 1562--1574, 2006.
[4] Lavielle M., Mentré F. "Estimation of population pharmacokinetic parameters of saquinavir in HIV patients and covariate analysis with the SAEM algorithm" Journal of Pharmacokinetics and Pharmacodynamics, vol. 34, pp. 229--49, 2007. [5] Samson A., Lavielle M., Mentré F. "The SAEM algorithm for group comparison test in longitudinal data analysis based in nonlinear mixed-effects model" Stat. in Medecine, vol. 26, pp. 4860--4875, 2007.
234
Software demonstration
Viera Lukacova GastroPlus
GastroPlus SimulationsPlus, Inc.
GastroPlusTM is the gold standard in the pharmaceutical industry for simulation of gastrointestinal absorption, pharmacokinetics, and pharmacodynamics. The program can simulate, and fit models with, any combination of oral and intravenous doses in humans and animals, including fasted and fed states for human and several laboratory animals. Version 6.0 now expands on the well-established capabilities and user-friendliness of this powerful tool.
The industry's most advanced gastrointestinal absorption simulation o Local pH effects on lipophilicity, solubility, permeability, and
dissolution/precipitation o Comprehensive formulation options for both immediate release and controlled
release dosage forms, including dissolution rates for different particle sizes o Mixed multiple doses - any combination of iv and peroral (PO) doses of arbitrary
amounts at arbitrary times o Fasted and fed states, with the ability to switch between them at any time o Degradation as a function of pH in the lumen
Pharmacokinetics options include o The industry's most advanced and user-friendly PBPK and PBPK/PD modeling
individuals or populations using NHANES and Japanese databases for Western and Asian populations
o Up to 3-compartment conventional pharmacokinetics including effects of first pass extraction, blood cell binding, and plasma protein binding.
o Metabolite tracking, including metabolites of metabolites o Saturable metabolism and transport in gut and any other tissue(s) o Virtual Trials allows estimating pharmacokinetic variations in populations specified
by ethnicity (Western or Asian), gender ratio, and age range. Pharmacodynamics options include
o Standard direct and indirect models fitted to plasma or (with PBPK) tissue concentrations
o Assessment of individual model parameters on PD effects via Parameter Sensitivity Analysis
o Virtual Trials allows estimating pharmacodynamic variations in populations specified by ethnicity (Western or Asian), gender ratio, and age range.
A variety of program output formats accommodate how your company works.
Ask for a free evaluation CD and an on-line tutorial session to help you evaluate the benefits of GastroPlus in your work.
235
Software demonstration
Richard Pugh Mango Solutions
Mango Solutions Mango Solutions
Mango Solutions provide software services to PK/PD groups working in the pharmaceutics industry. This includes training and direct consulting in technologies such as S-PLUS and R as well as the development of bespoke applications integrating key modelling and simulation software such as NONMEM and BUGS.
Examples of Mango Solutions projects include:
Targeted S-PLUS and R training courses based on familiar PK/PD data and covering tasks such as creating NONMEM input datasets, creating standard graphical reports, fitted non-linear mixed models and performing model bootstrap and simulation analyses.
Web-based NONMEM reporting solution, allowing users to compare and evaluate NONMEM models before creating target graphical/tabular reports in order to summarise a model or analysis
S/R simulation library to allow the creation and analysis of simulated clinical trails based on covariate, parameter and response assumptions. This integrated with internal grid systems in order to improve process time and allowed such features as adaptive designs and drop out modelling.
Recently, Mango Solutions has been working closely with the NLMEc group in order to create a prototype for centralised modelling and reporting based on a variety of systems (such as NONMEM, BUGS, MONOLIX, S and R). The current prototype has been well received by the consortium, and includes the following key components:
A standardised definition of a "model" which can be translated into inputs for modelling environments such as NONMEM and BUGS. This allows the central storage and versioning of models independent of modelling software to be used.
A standardised "model output" format allowing translation from software-specific outputs (eg. NONMEM or BUGS outputs). This allows the central storage of "model results" and allows users to evaluate and compare models fit in a variety of technologies.
A technical component that allows the execution of modelling and simulation software (such as those mentioned above) either locally or on a distributed environment.
Common reporting definitions, allowing users to define and execute graphical, tabular and textual reports for one or more analyses.
The NLMEc prototype and some examples of Mango Solutions' work will be available for demonstration at PAGE 2008.
236
Software demonstration
Saik Urien RfN, R for Nonmem: A graphical interface for Nonmem outputs
Saik Urien Unité de Recherche Clinique Paris Centre, Hopital Tarnier, 89 rue d’Assas, 75006 Paris, France
RfN is a set of R programs aimed to rapidly visualize the goodness-of-fit that results from a NONMEM run. RfN directly manages outputs produced by Wings for Nonmem (WfN). R is a GNU program that runs under DOS, Windows, Linux, Unix operating systems (The R Project for Statistical Computing, http://www.r-project.org/). RfN has a predefined default behaviour that may be easily customised. All of the programs require the reading of NONMEM table file(s) (i.e., files created by the $TABLE record). No extensive knowledge of the R program is needed.
The main features of RFN include
1. fast visualisation of model curve-fitting ,DV vs. PRED WRES vs. PRED etc and model curve-fitting of DV PRED (IPRED) - time courses, whole data set or ID by ID ;
2. based on simulation, visual predictive checks plus additional features like distribution statistics or confidence intervals on predicted percentile curves, and visual display of NPDE, normalised prediction distribution errors ;
3. various visual/statistical tools allowing the display of parameters/covariables distribution and correlations between them ;
4. specific programs dedicated to Wings (WfN), bootstrap statistics, randomization test, log-likelihood profiling, shrinkage ;
5. model-independent outlier diagnostics
Most of the programs allow data splitting and viewing according to categorical (co)variables present in the table items (separation of PK and PD data after the CMT item for example, etc...). The programs can be accessed via an interactive menu.
RfN is freely available via download from https://sourceforge.net/project/showfiles.php?group_id=29501&package_id=140129&release_id=538680 or from the author in case of problems.
PK-Sim® is a software tool for physiology-based pharmacokinetic whole-body modelling, especially designed for pre-clinical and clinical use in the pharmaceutical research and development environment.
The focus of the presentation will be on the two following modules included in the clinical version of the PK-Sim® software:
The PK-Sim® "Pop" module can be used for a priori testing of the pharmacokinetic variability of a drug in a virtual human population with a user-defined gender-, age-, height-, and weight distribution. This extension of the PK-Sim® standard package uses a Monte-Carlo process to create virtual individuals matching the user-defined parameters. The PK-Pop module contains a large database of relevant anthropometric and physiological parameters. A sophisticated algorithm accounts for cross-correlations in the variabilities of different physiological parameters via scaling laws and thus ensures that only reasonable representatives of living humans are created within the age range of 0 to 80 years. All variabilities are included in the model and do not have to be user-defined thus reducing the expected user-input parameters.
The PK-Sim® "Clearance Scaling" Module uses validated models to scale renal and hepatic clearance from adults to children of all ages. Integration with the population module allows for a determination of the pharmacokinetic variability expected in a young population. The approach can be used to support pediatric study design, dosing and safety strategies for PIPs and PDPs.
In this software demonstration we provide an overview of PK-Sim®'s capabilities to simulate the pharmacokinetic behavior of chemical compounds in different populations including children, adults, and elderly. Applications to the different stages of clinical development will be discussed.
An application example will be presented at the poster session: "Whole-Body Physiologically-based Pharmacokinetic (WB-PBPK) Population Modelling to Simulate the Influence of Weight and Age on the Pharmacokinetics (PK) of a combined Oral Contraceptive Containing Drospirenone (DRSP) and Ethinylestradiol (EE)"