Prepared by Marlene Bengiamin, PhD Amber Costantino, MA John Capitman, PhD Yesenia Silva, BS Hayam Megally, MPH This report was supported by a grant from the DentaQuest Foundation Oral Health Barriers for California’s San Joaquin Valley Underserved and Vulnerable Populations
Transcript
Prepared by
Marlene Bengiamin, PhD Amber Costantino, MA John Capitman, PhD
Yesenia Silva, BS Hayam Megally, MPH
This report was supported by a grant from the DentaQuest Foundation
Oral Health Barriers for California’s San Joaquin Valley Underserved and Vulnerable Populations
TABLE OF CONTENTFUNDING AND CONTRIBUTORS ................................................................................................................................................... 4
Oral Health Influence on Overall Health .................................................................................................................6
Theoretical Frames for Understanding Disparity in Oral Health ................................................................. 7
Oral Health Disparities in the Valley ......................................................................................................................... 7
Oral Health Literacy ......................................................................................................................................................... 8
RELEVANCE TO ORAL HEALTH 2020 ........................................................................................................................................10
Procedure and sampling ................................................................................................................................................ 11
Descriptive Analysis: Questions Not Included in Scales ................................................................................19
Scales Bivariate Analysis: Knowledge, Attitudes, and Needs ......................................................................19
Scales Multivariate Analysis: Knowledge, Attitudes, and Needs ................................................................21
Knowledge of Unhealthy Behavior ..........................................................................................................................21
Knowledge of Healthy Behavior ..............................................................................................................................22
Knowledge of Unhealthy and Healthy Behavior .....................................................................................25
Oral Health Needs ..................................................................................................................................................25
NEXT STEPS .....................................................................................................................................................................................26
Table 1. Survey Distribution ........................................................................................................................................................12
Table 3. Pearson’s r Correlations between Oral Health Scales ...........................................................................................................................................................................14
Table 5. Population Estimates of Educational Attainment Compared to Self-Reported Educational Attainment of Survey Participants by County .................................................................................................................................................16
Table 6. Participant insurance that covers some or all-Oral health expenses ...............................................................................................................................................................16
Table 7. Percent Insurance Coverage Type by Demographics ..................................................................................17
Table 9. Percent Identified Barrier to Oral Health ...........................................................................................................18
Table 12. Unhealthy Behaviors and Attitudes: Interaction between survey site and ethnicity-language (marginal means) ..............................................................................21
Table 13. Unhealthy Behaviors and Attitudes: Interaction between survey site and ethnicity-language (marginal means) ....................................................22
Table 14. Needs Scale: Interaction between Insurance and Ethnicity-Language ............................................23
Figure 1. Ethnicity-Language Categorization for Analysis (n = 659) .....................................................................13
Figure 2. Education Categorizations for Analysis (n = 635). .....................................................................................14
Figure 3. Insurance Categorization for Analysis (n = 532) .........................................................................................16
Figure 4. Needs Scale: Insurance and Ethnicity-Language Interaction ................................................................21
Figure 5: Unhealthy Scale: Insurance Type, Ethnicity-Language, and Survey Site Interaction ................22
Figure 6. Needs Scale: Insurance and Ethnicity-Language Interaction ...............................................................26
FUNDING AND CONTRIBUTORSThis project was funded by the DentaQuest Foundation as part of the Grassroots Engagement Initiative, which seeks to engage populations most directly impacted by oral health inequity and to lift up their needs and values. This report provides findings from 14 sites, across four counties, (Fresno, Madera, Merced and Tulare), in the San Joaquin Valley. The findings have been shared with residents and community stakeholders who provided insights and feedback on recommendations and next steps. We would like to acknowledge the contribution of many Central Valley Healthy Policy Institute staff especially Jacqueline Cortez and Amy Ybarra for their great contributions to the data collection, and Amanda Conley for editing this report.
SUGGESTED CITATION Central Valley Health Policy Institute (2017). Oral Health Barriers: Underserved and Vulnerable Populations in the San Joaquin Valley: California State University, Fresno.
ACKNOWLEDGEMENTS The Central Valley Health Policy Institute would like to extend appreciation to the residents and organizations who made this report possible. We would also like to express gratitude to the clinics, community centers and organizations that generously opened their doors for us to complete data collections.
ABSTRACTOral health is recognized as an essential part of an individual’s overall health. The aim of this project is to understand how California’s San Joaquin Valley residents think about, feel about, and experience oral health services. This report presents findings from 659 surveys measuring healthy and unhealthy oral health knowledge, oral health needs and barriers. Surveys were collected at clinic and non-clinic sites throughout the San Joaquin Valley, an area characterized by its large Latino and immigrant populations, as well as its low levels of education and high levels of poverty. The results indicate disparities by ethnicity and language, insurance coverage, and education. The most common barrier to oral health care identified by all groups was cost of oral health services, with Spanish speaking Latinos and those without
insurance being the most likely to identify this barrier. Non-Latinos with Medicaid or private insurance were most likely to identify receiving a timely appointment as a barrier to oral health care. In addition, results suggest high levels for knowledge of healthy behaviors and attitudes but less understanding, and more disparities, for knowledge of unhealthy behaviors and attitudes. In terms of knowledge of unhealthy behaviors, the advantages that we would expect to see at the clinics were not advantageous to Latino Spanish speakers and most advantageous to non-Latino English speakers. From our findings, we propose that oral health literacy is a key component to promoting oral health and preventing oral health diseases.
ORAL HEALTH FOR ALL 2020: Oral Health Barriers for California’s San Joaquin Valley Underserved and Vulnerable Populations
6
INTRODUCTION
Oral Health Influence on Overall Health
This report presents findings from an oral health survey that measured knowledge of oral health behavior and needs of an underserved population. Oral health was recently defined by the FDI World Dental Federation as multifaceted including the ability to speak, smile, smell, taste, touch, chew, swallow and convey a range of emotions through facial expressions with confidence and without pain, discomfort and disease of the craniofacial complex.1 Oral health is an integral part of overall health. The effects of oral disease on overall health are well documented.2 Oral disease has an impact on physical, psychological and social health, and often results in pain, reduced quality of life, and diminished function. In addition, associations between chronic oral infections and other health problems, including diabetes, heart disease, and adverse pregnancy outcomes have also been documented2. However, it is only recently that the link between oral health and overall health has gained traction, and a movement is emerging toward the inclusion of oral health into general health strategies. This movement was initiated by the Surgeon General’s report 2000 that referred to oral health in America as a “silent epidemic” of dental and oral diseases that burden children and adults throughout the United States.2,3 The World Health Organization (WHO) adopted this idea in 2002, when its Global Oral Health Program policy emphasized that oral health is integral and essential to general health, as well as a determining factor for quality of life. More recently, a WHO resolution called for oral health to be integrated into chronic disease prevention programs.3
Healthy People 2020 goals state that oral health is a leading health indicator. One of the main goals is to prevent and
control oral and craniofacial diseases, conditions, and injuries, and to improve access to preventive services and oral health care.4 To achieve these goals, many objectives target the oral health of both adults and children. Data derived from the Medical Expenditure Panel Survey 2007-2012 identified oral health disease and access challenges that disproportionately affect specific populations. For instance, Hispanics reported the lowest percentage of children, adolescents, and adults who visited the dentist in the past year, averaging approximately 28.6%, (except for 2011, in which the Native Hawaiian or other Pacific Islanders group reported the least percentage) compared to Whites, who reported an average of 48.5% during the same period. In addition, Mexican American adults, aged 45-74 years, reported the highest rate of moderate or severe periodontitis, 70.6%, compared to Whites who reported only 40.9%.4
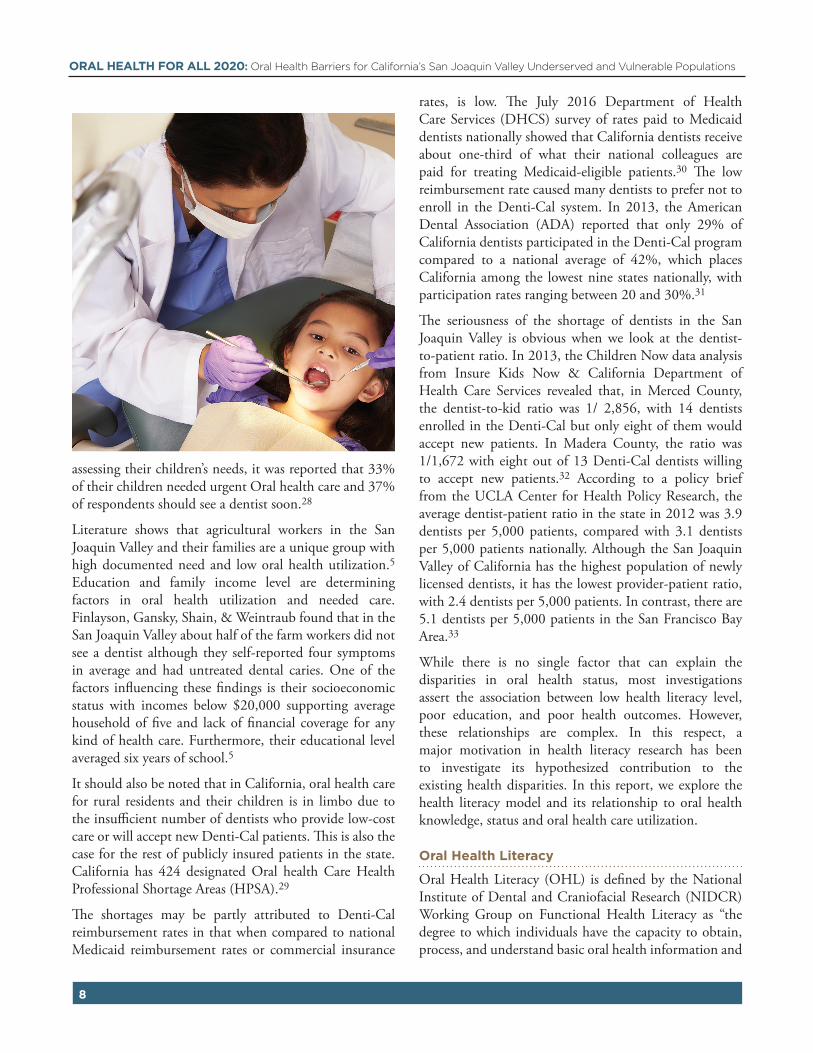
A large population of Hispanics work in agriculture and face multiple barriers to accessing health care, including oral health care.5 Findings from the National Agricultural Workers Survey (NAWS) 2013-2014 revealed that 80% of farmworkers reported they were Hispanic and 74% chose Spanish as the language in which they are most comfortable conversing.6 These workers are in a low-paying, hazardous industry that often does not provide health insurance. Consequently, they report experiencing irregular oral health care due to cost, time, transportation, and basic oral health knowledge.5 Because of this, farmworkers are an especially vulnerable group and access to routine care is complicated by the nature of their work, which is often seasonal and sometimes migratory.
A community-based participatory research examined the perceived health needs of migrant and seasonal farmworkers in northwest Lower Michigan (N =369).7 It was determined that the most commonly requested health service was oral health and the most commonly cited barrier to accessing health care was language barriers. The research also describes these barriers as an ongoing problem for the poor and underserved. Additionally the reported limited funding to oral health services programs dictates that dentists see only those experiencing severe oral health needs, with treatment limited to tooth extraction rather than restorative or preventive treatments.7
In addition to these barriers, low oral health literacy can create additional obstacle to recognizing oral disease risk as well as seeking and receiving needed oral health care.8 The 2003 National Assessment of Adult Literacy (NAAL) found that 44% of Hispanics had below basic
ORAL HEALTH FOR ALL 2020: Oral Health Barriers for California’s San Joaquin Valley Underserved and Vulnerable Populations
7
health literacy levels compared to 24% of Blacks and 9% of Whites.9 These findings are problematic given that literacy is associated with understanding the causes of disease, the importance of disease treatment, the ability to seek oral health and general health care, and the utilization of provided healthcare.10
Theoretical Frames for Understanding Disparity in Oral Health
The Aday & Andersen Healthcare Utilization Conceptual Model explains the factors that lead to the use of health services.11 According to the model, usage of health services (including inpatient care, physician visits, oral health care etc.) is determined by three dynamics: predisposing, enabling, and need factors. Predisposing factors can include demographic characteristics and socio-structural characteristics such as educational level, race and ethnicity, and health beliefs. For instance, an individual who believes that the provided health services are an effective treatment for a disease is more likely to seek care. Whereas, enabling factors are family support, access to health insurance, availability of services, and cultural/linguistic appropriateness of services. Need represents both perceived and real need for health care services.5,12
The predictive power of these variables on oral health utilization is well documented. Many studies have found that predisposing characteristics, such as race, oral health literacy level and geographic location in terms of proximity to oral health care provider, are factors associated with oral health care utilization.8,13 Studies have also documented that oral health care utilization is higher in the presence of enabling characteristics such as higher family income, having oral health or health insurance and having a regular source of oral health care.13,14,15,16,17 However, recent research on the behavioral model has demonstrated mixed results as it focuses on individual-level factors. An extensive systematic review of studies using the Healthcare Utilization Model from 1998-2011 concluded that operationalization of the model revealed that only a small common set of variables was used and that there were huge variations in the way these variables were categorized, especially as it concerns predisposing and enabling factors.
The model has been modified over time, including an enhancement that differentiates between measures of potential access—for example, whether or not a person has a usual source of care—and measures of
realized access—such as use of services and patient satisfaction.11,18 Furthermore, it has been modified to include environmental factors, health behaviors, and health outcomes. In addition, concepts of equity, efficiency, effectiveness, and health and well-being have been incorporated;19 other variables included were at the neighborhood or community level;20, 21, 22 as well as factors that are pertinent to specific vulnerable and underserved populations.23, 24
Oral Health Disparities in the Valley
Agriculture is one of the most prominent industries in California, and is a window to the oral health inequities residents of the San Joaquin Valley experience.25 In 2000, the California Institute for Rural Studies conducted its first statewide population based California Agricultural Worker Health Survey (CAWHS). The CAWHS estimated there were approximately 700,000 agricultural workers in the state, with the majority being foreign-born, Hispanic, male, married, relatively young, averaging six or less years of formal education, and who neither read nor spoke English. In this survey, more than one quarter of respondents reported oral health problems as the most common health complaint. In addition, the report documented low oral health utilization rates among respondents with nearly half reporting that they had never been to a dentist.25 It is worth mentioning that Hispanics made up more than two-thirds (67.9 %) of California’s agricultural labor force according to the California’s Agriculture Employment report in 2008.26
Many of the same population, employment and health coverage trends that shape national and statewide outcomes influence the health and healthcare of San Joaquin Valley residents. Health insurance in the United States has historically been dependent on permanent full-time employment. Agriculture, being one of the industries that employs most San Joaquin Valley residents, does not provide adequate health benefits to its workers. Due to low wages and lack of health benefits, many farm-working families find themselves seeking health care support from the Medi-Cal and Denti-Cal plans for which they qualify.27 In a study investigating predisposing, enabling, and need factors associated with children’s past year oral health utilization among Hispanic agricultural worker families in Central California, it was found that 14% of participants had no Oral health insurance. Although 71% had Medicaid, just over half (53%) reported having a regular source of Oral health care. Additionally, by
ORAL HEALTH FOR ALL 2020: Oral Health Barriers for California’s San Joaquin Valley Underserved and Vulnerable Populations
8
assessing their children’s needs, it was reported that 33% of their children needed urgent Oral health care and 37% of respondents should see a dentist soon.28
Literature shows that agricultural workers in the San Joaquin Valley and their families are a unique group with high documented need and low oral health utilization.5 Education and family income level are determining factors in oral health utilization and needed care. Finlayson, Gansky, Shain, & Weintraub found that in the San Joaquin Valley about half of the farm workers did not see a dentist although they self-reported four symptoms in average and had untreated dental caries. One of the factors influencing these findings is their socioeconomic status with incomes below $20,000 supporting average household of five and lack of financial coverage for any kind of health care. Furthermore, their educational level averaged six years of school.5
It should also be noted that in California, oral health care for rural residents and their children is in limbo due to the insufficient number of dentists who provide low-cost care or will accept new Denti-Cal patients. This is also the case for the rest of publicly insured patients in the state. California has 424 designated Oral health Care Health Professional Shortage Areas (HPSA).29
The shortages may be partly attributed to Denti-Cal reimbursement rates in that when compared to national Medicaid reimbursement rates or commercial insurance
rates, is low. The July 2016 Department of Health Care Services (DHCS) survey of rates paid to Medicaid dentists nationally showed that California dentists receive about one-third of what their national colleagues are paid for treating Medicaid-eligible patients.30 The low reimbursement rate caused many dentists to prefer not to enroll in the Denti-Cal system. In 2013, the American Dental Association (ADA) reported that only 29% of California dentists participated in the Denti-Cal program compared to a national average of 42%, which places California among the lowest nine states nationally, with participation rates ranging between 20 and 30%.31
The seriousness of the shortage of dentists in the San Joaquin Valley is obvious when we look at the dentist-to-patient ratio. In 2013, the Children Now data analysis from Insure Kids Now & California Department of Health Care Services revealed that, in Merced County, the dentist-to-kid ratio was 1/ 2,856, with 14 dentists enrolled in the Denti-Cal but only eight of them would accept new patients. In Madera County, the ratio was 1/1,672 with eight out of 13 Denti-Cal dentists willing to accept new patients.32 According to a policy brief from the UCLA Center for Health Policy Research, the average dentist-patient ratio in the state in 2012 was 3.9 dentists per 5,000 patients, compared with 3.1 dentists per 5,000 patients nationally. Although the San Joaquin Valley of California has the highest population of newly licensed dentists, it has the lowest provider-patient ratio, with 2.4 dentists per 5,000 patients. In contrast, there are 5.1 dentists per 5,000 patients in the San Francisco Bay Area.33
While there is no single factor that can explain the disparities in oral health status, most investigations assert the association between low health literacy level, poor education, and poor health outcomes. However, these relationships are complex. In this respect, a major motivation in health literacy research has been to investigate its hypothesized contribution to the existing health disparities. In this report, we explore the health literacy model and its relationship to oral health knowledge, status and oral health care utilization.
Oral Health Literacy
Oral Health Literacy (OHL) is defined by the National Institute of Dental and Craniofacial Research (NIDCR) Working Group on Functional Health Literacy as “the degree to which individuals have the capacity to obtain, process, and understand basic oral health information and
ORAL HEALTH FOR ALL 2020: Oral Health Barriers for California’s San Joaquin Valley Underserved and Vulnerable Populations
9
services needed to make appropriate health decisions”.34 Oral health literacy is identified as a key to oral health disease prevention, promoting oral health, and one of the predisposing influences to oral health care utilization.8
Zarcadoolas’ expanded model of health literacy explains that health literacy is composed of four domains: fundamental literacy, science literacy, civic literacy and cultural literacy. Fundamental literacy refers to the skills to speak, read, write and interpret numbers. Science literacy refers to the knowledge on technology and awareness of the scientific process, including the ability to comprehend technical complexity and science uncertainty and that constant change of established science is possible. Civic literacy enables citizens to become aware of public issues and to become involved in the decision-making process. It is also the knowledge of the government and media work. Lastly, cultural literacy refers to the ability to recognize and use collective beliefs, customs, worldview and social identity in order to interpret and act on health information. This touches on the skill to understand, recognize and use collective belief and social identity in the health decision process. At the same time it points to the role of the communicator in “framing health information that accommodates cultural understanding of health information”.35
According to this model, there is a need to address the four domains of literacy in order to have a congruent and clear information for an educated health choice. Moreover, the expended model of health literacy brings attention to the importance of framing health information that is adequate and accommodates communities’ characteristics including comprehension level and collective belief.35
The U.S. Department of Health and Human Services National Standards for Culturally and Linguistically
Appropriate Services (CLAS) in health care recognizes the intersection between culture and literacy. The standard states that “healthcare organizations must make available easily understood patient-related materials … in the languages of commonly encountered groups …” The standard goes on to state explicitly that in addition to being culturally responsive, these materials need also to be appropriate to the patients’ and consumers’ literacy levels. Issues of culture, language, and learning are highly interconnected. To be effective, health education must be delivered in both culturally and linguistically appropriate formats to address our highly diverse, multicultural, and multilingual population.36
The American Dental Association (ADA) asserts that, “limited oral health literacy is a barrier to prevent, diagnose and treat oral diseases effectively”. Thus, the ADA developed a strategic action plan to improve oral health literacy.37 Additionally, reports released by the US Institute of Medicine and ADA’s action plan both underpinned the importance of oral health literacy.8,37 In these reports, it was asserted that available data indicate that the public’s oral health literacy (and general health literacy) is poor.
Poor oral health literacy is strongly associated with lower oral health knowledge, lower self-reported oral health status, and fewer visits to the dentists. Currently the public has inadequate knowledge about the best ways to prevent oral diseases. For example, fluoride and dental sealants have long been proved as the most effective ways to prevent dental caries, yet the public frequently answers that teeth brushing and flossing are more effective. Additionally, although 30,000 Americans each year are diagnosed with oral cancers and nearly 8,000 die from them, the public’s knowledge about the symptoms and risk factors of oral cancers is low.8
Oral health literacy is the bridge between having knowledge and applying that knowledge to one’s oral health care behavior. Macek and his colleagues documented the conceptual knowledge of oral health among low–income adults in Baltimore.38 They used selected questions from the Baltimore Health Literacy and Oral Health Knowledge Project that utilized a comprehensive questionnaire to assess knowledge in four broad topic areas: basic oral health, management and prevention of dental caries, management and prevention of periodontal diseases, and management and prevention of oral cancer. The results showed that only 21% of respondents knew that dental plaque was composed of germs whereas the majority
ORAL HEALTH FOR ALL 2020: Oral Health Barriers for California’s San Joaquin Valley Underserved and Vulnerable Populations
10
(62%) incorrectly thought that plaque was primarily made up of food. In addition, only 29% of respondents knew that diabetes was associated with periodontitis.38 These findings are problematic because lacking knowledge of the diabetes and periodontitis interrelation may negatively affect the patient’s glycemic control.39 Additionally, the study showed that only 34% recognized that smoking cigarettes was a risk factor for periodontitis.38
The results also revealed that several of the periodontal disease knowledge questions were significantly affected by their education level. Moreover, a majority of respondents knew that sugar causes dental caries and that brushing and flossing can prevent tooth decay. This can reflect the frequency and consistency of the oral health messages delivered to the public. However, less than half of respondents identified that a toothbrush should have soft bristles, knew how often they should floss between their teeth, knew the composition of dental plaque, understood how gingivitis can be treated, knew how to identify periodontal disease, and understood the behaviors and conditions associated with periodontitis.38 These findings call for a need to provide oral health messages that clarify to the patients the fundamentals of prevention and management of oral diseases. Furthermore, these messages should take into consideration the patient’s educational and the health literacy level.
Many studies have demonstrated an association of low oral health literacy with worse oral health status and worse oral health outcomes, such as, prosthetic needs, temporomandibular disorders and periodontal problems.40, 41 An observational cohort study showed that, in a group of low-income pregnant patients, mothers with low oral health literacy level could adversely affect her and her child’s health outcomes.42 A caregiver’s low oral health literacy level is also associated with children’s worse oral health-related quality of life as well as failure to show up for oral health appointments.40,43 The public’s lack of oral health knowledge may be, in part, due to low oral health literacy and the inadequate communication skills among some health care professional themselves.8
The promotion of oral health behaviors within a community should be a priority to reduce oral health disparities through implementing culturally sensitive interventions. Those interventions should consider the behaviors, attitudes and preferences of their targeted population, and engage their population in a meaningful way.36 The use of lay Community Health Promoters (Promotoras de Salud) has proved effective for delivering
culturally-appropriate health promotion interventions in Latino communities.44,45 Promotora based interventions have been applied within the Mexican immigrant/Mexican-American community for a variety of health issues and resulted in positive health outcomes.44,45,46 In regards to oral health, the theory based Contra Caries Oral Health Education Program intervention is a promotora-led education program targeting low-income Spanish-speaking parents of children aged 1–5 years.47 Evaluation of this program showed effectiveness in improving low-income Spanishs peaking parents’ oral hygiene knowledge and the selfreported behaviors of their young children. In addition, the improvement was sustained 3 months after the end of the intervention48 and the attendance, retention, and acceptability of the program were high.47
Counseling and education are important elements in improving oral health knowledge for patients with low health literacy.49 Moreover, many researchers have affirmed that an improvement in oral health literacy is an essential component for better oral health outcomes and the elimination of oral health disparities.8,50 Assessing oral health literacy is a crucial step to creating recommendations to improve individual and population oral health at policy and practice level.
RELEVANCE TO ORAL HEALTH 2020As researchers interested in health equity, as well as health and oral health care, we are aware of the link between oral health outcomes and oral health knowledge, along with the barriers and needs of underserved populations residing in the San Joaquin Valley. There is very limited, if any, data on underserved and vulnerable population’s oral health knowledge, literacy, access and utilization in the San Joaquin Valley. Within that context, the Central Valley Health Policy Institute has joined the Grassroots initiative launched as part of the DentaQuest Foundation’s Oral Health 2020 network in 2015, which includes 20 community-based organizations in six states to emphasize oral health in existing outreach efforts, and engage community members to change the systems impacting oral health for underserved and vulnerable population. The Foundation supports major national (grass tops) initiatives and state-based programs (grass middles) that are driving change from the grassroots to the grass tops. The DentaQuest Foundation utilizes a systems-change framework to inform their strategies to achieve equitable access to knowledge, care, and community resources.
ORAL HEALTH FOR ALL 2020: Oral Health Barriers for California’s San Joaquin Valley Underserved and Vulnerable Populations
11
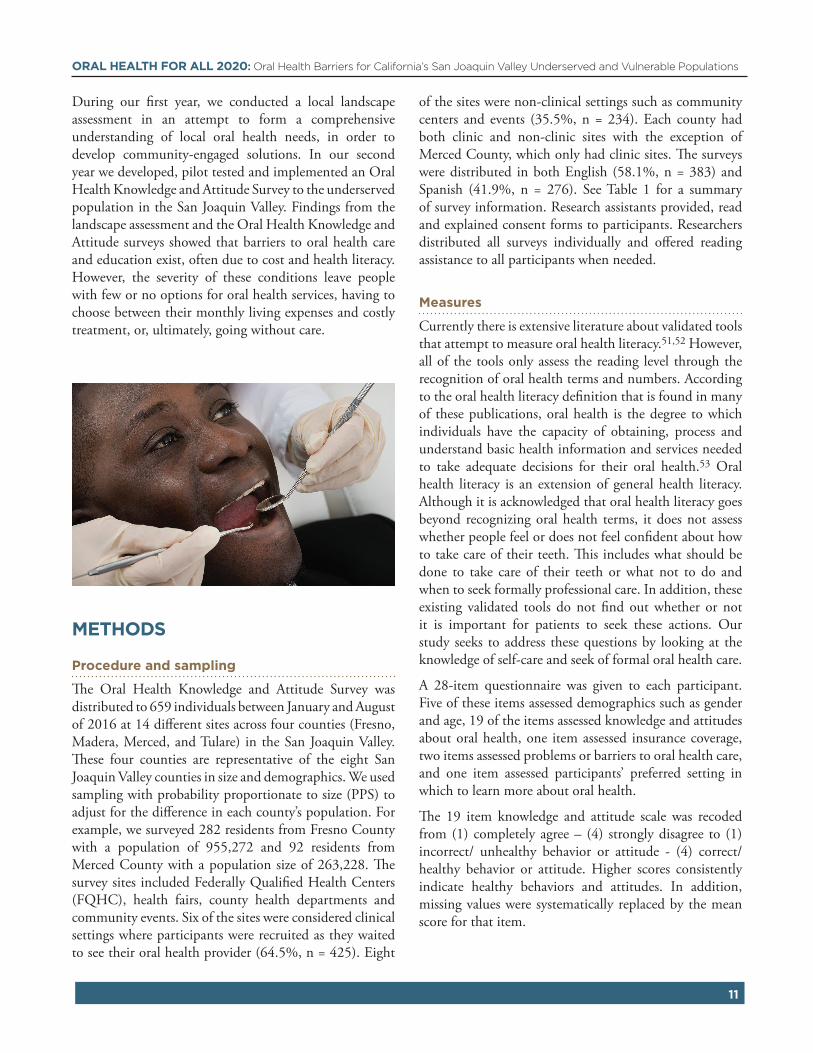
During our first year, we conducted a local landscape assessment in an attempt to form a comprehensive understanding of local oral health needs, in order to develop community-engaged solutions. In our second year we developed, pilot tested and implemented an Oral Health Knowledge and Attitude Survey to the underserved population in the San Joaquin Valley. Findings from the landscape assessment and the Oral Health Knowledge and Attitude surveys showed that barriers to oral health care and education exist, often due to cost and health literacy. However, the severity of these conditions leave people with few or no options for oral health services, having to choose between their monthly living expenses and costly treatment, or, ultimately, going without care.
METHODS
Procedure and sampling
The Oral Health Knowledge and Attitude Survey was distributed to 659 individuals between January and August of 2016 at 14 different sites across four counties (Fresno, Madera, Merced, and Tulare) in the San Joaquin Valley. These four counties are representative of the eight San Joaquin Valley counties in size and demographics. We used sampling with probability proportionate to size (PPS) to adjust for the difference in each county’s population. For example, we surveyed 282 residents from Fresno County with a population of 955,272 and 92 residents from Merced County with a population size of 263,228. The survey sites included Federally Qualified Health Centers (FQHC), health fairs, county health departments and community events. Six of the sites were considered clinical settings where participants were recruited as they waited to see their oral health provider (64.5%, n = 425). Eight
of the sites were non-clinical settings such as community centers and events (35.5%, n = 234). Each county had both clinic and non-clinic sites with the exception of Merced County, which only had clinic sites. The surveys were distributed in both English (58.1%, n = 383) and Spanish (41.9%, n = 276). See Table 1 for a summary of survey information. Research assistants provided, read and explained consent forms to participants. Researchers distributed all surveys individually and offered reading assistance to all participants when needed.
Measures
Currently there is extensive literature about validated tools that attempt to measure oral health literacy.51,52 However, all of the tools only assess the reading level through the recognition of oral health terms and numbers. According to the oral health literacy definition that is found in many of these publications, oral health is the degree to which individuals have the capacity of obtaining, process and understand basic health information and services needed to take adequate decisions for their oral health.53 Oral health literacy is an extension of general health literacy. Although it is acknowledged that oral health literacy goes beyond recognizing oral health terms, it does not assess whether people feel or does not feel confident about how to take care of their teeth. This includes what should be done to take care of their teeth or what not to do and when to seek formally professional care. In addition, these existing validated tools do not find out whether or not it is important for patients to seek these actions. Our study seeks to address these questions by looking at the knowledge of self-care and seek of formal oral health care.
A 28-item questionnaire was given to each participant. Five of these items assessed demographics such as gender and age, 19 of the items assessed knowledge and attitudes about oral health, one item assessed insurance coverage, two items assessed problems or barriers to oral health care, and one item assessed participants’ preferred setting in which to learn more about oral health.
The 19 item knowledge and attitude scale was recoded from (1) completely agree – (4) strongly disagree to (1) incorrect/ unhealthy behavior or attitude - (4) correct/ healthy behavior or attitude. Higher scores consistently indicate healthy behaviors and attitudes. In addition, missing values were systematically replaced by the mean score for that item.
ORAL HEALTH FOR ALL 2020: Oral Health Barriers for California’s San Joaquin Valley Underserved and Vulnerable Populations
12
TABLE 1. SURVEY DISTRIBUTION
INFORMATION FREQUENCY PERCENT
Survey Language
English 383 58.1%
Spanish 276 41.9%
Specific Survey Location
Altura Center* 88 13.4%
BHC Basketball 15 2.3%
Camarena Health* 94 14.3%
Cherry Avenue Auction 61 9.3%
Clinica Sierra Vista* 97 14.7%
CPHEN 6 0.9%
Hope House 13 2.0%
Livingston* 92 14.0%
MSCC Health Fair* 54 8.2%
Promotoras 77 11.7%
Residence 2 0.3%
St. Joseph 10 1.5%
WFFRC 37 5.6%
Yo Digo Si 13 2.0%
Survey County
Fresno 282 42.8%
Madera 107 16.2%
Merced 92 14.0%
Tulare 178 27.0%
Total 659
Note. * = Clinic Site
ORAL HEALTH FOR ALL 2020: Oral Health Barriers for California’s San Joaquin Valley Underserved and Vulnerable Populations
13
FIGURE 1. ETHNICITY-LANGUAGE CATEGORIZATION FOR
ANALYSIS (N = 659)
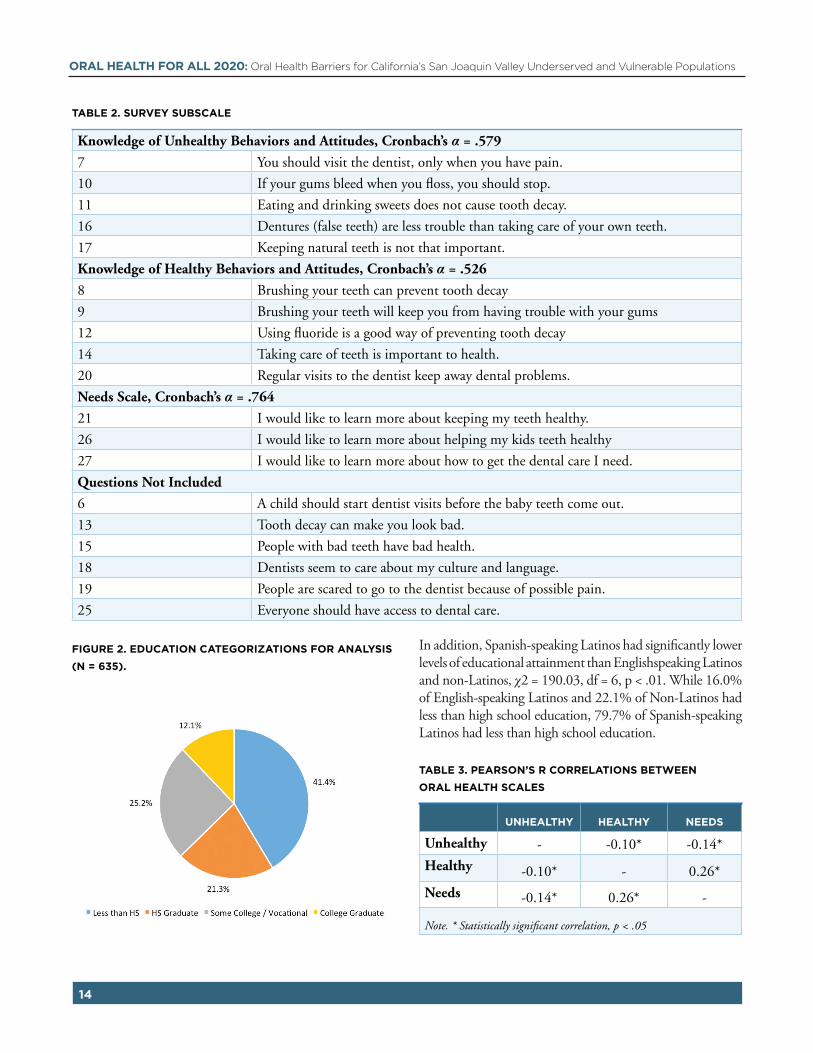
The 19-item scale was tested for reliability and overall, had a low Cronbach’s alpha of .414. Further, the reliability of the theoretical subscales of this survey were also tested and produced poor reliability. Therefore, an exploratory principal component analysis and a further reliability analysis was conducted in attempt to identify scales that are more reliable. The principal components analysis identified four possible components, two of which had a high number of items with factor loadings greater than .30. Components were further refined through testing reliability (Cronbach’s alpha) while eliminating one item at a time. Subsequently, three subscales were created; a five-item “Knowledge of Unhealthy Behaviors and Attitudes” scale (α = .579), a five-item “Knowledge of Healthy Behaviors and Attitudes” scale (α = .526), and a three-item “Learning Needs Scale” (α = .764), The remaining six questions were not included because they failed to add reliability. However, some of these questions were considered individually, as they still provide important information on their own.
Composite scores were created for all three subscales. See table 2 for survey scales and associated questions.
The insurance coverage and barriers items allowed participants to make multiple selections. Percentages for insurance coverage and barriers were calculated using the percentage of total participants rather than the percentage of total responses. Therefore, the percentages do not equal 100% and should be interpreted as “XX% of participants self-reported at least one of their insurance providers / barriers to be …”.
The scales were significantly correlated to each other, see
Table 3. These associations suggest that those who had more learning needs had less knowledge of unhealthy behavior but more knowledge of healthy behaviors. It also suggests that those who had more knowledge of unhealthy behaviors had less knowledge of healthy behaviors.
Participants
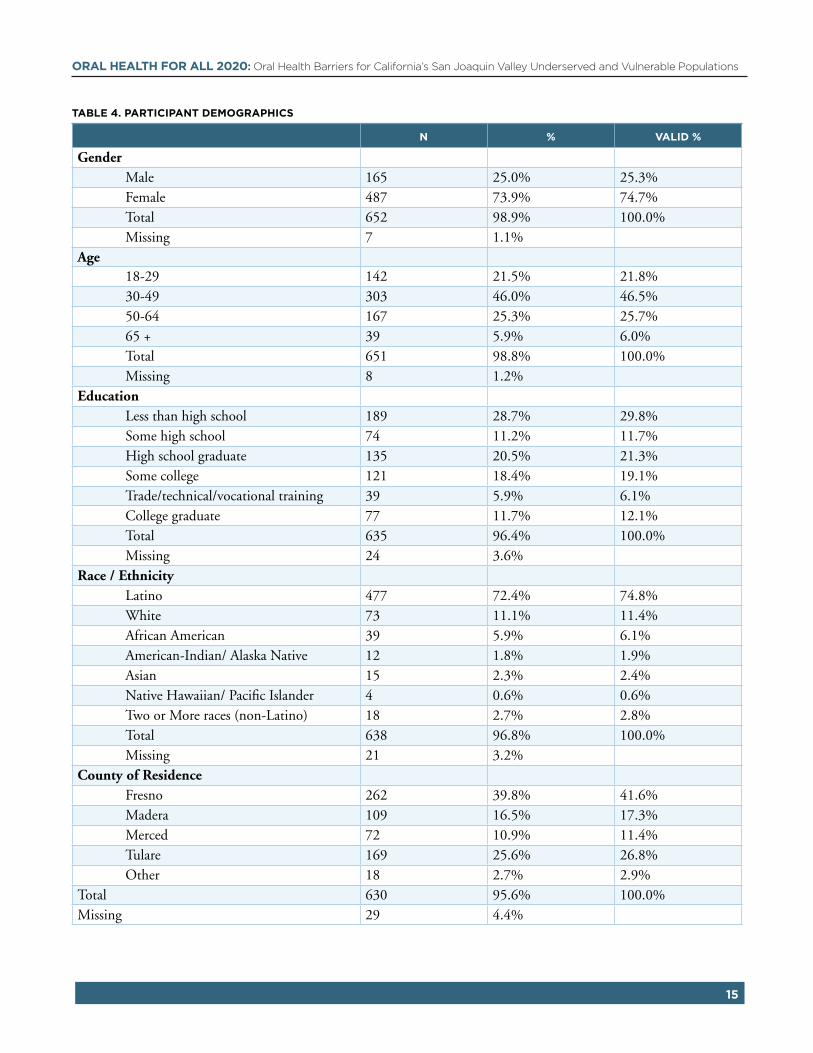
Out of the 659 participants, 25% (n = 165) were male, 73.9% were female, and the remaining 1.1% (n = 7) did not specify their gender. The majority of the participants self-identified as Latino (72.4%, n = 477) or White (11.1%, n = 73). For analysis purposes, ethnicity and language were combined and grouped as Latino’s that took the survey in Spanish (40.3%, n = 257), Latinos who took the survey in English (34.5%, n = 220), or non-Latinos (25.2%, n = 161), see Figure 1. Of the participants, 25.1% were between the ages of 18-29, 46.0% were between the age of 30-49, 25.3% were between the age of 50-64, 5.9% were 65 or older, and 1.2% failed to provide their age. Most participants were Fresno County residents (41.6%, n = 262) while very few lived outside the four survey counties (2.9%, n = 18). See Table 4 for a summary of participant demographics.
These demographics were similar across survey languages (English and Spanish) and survey settings (clinic vs non-clinic). The largest discrepancy was in education level; where those who took the survey in English or at a non-clinic location reported having higher educational attainment than those who took the survey in Spanish or at a clinic setting. Those who took the English version also tended to be younger than those who took the Spanish version.
Education
There was less, overall, educational attainment of the participants when compared to county statistics for those 18 and over, see Table 5. Educational attainment categories differed between the county statistics available through the U.S. Census Bureau and the educational attainment question categories on the survey. Therefore, categories were collapsed into less than high school, high school graduate, and any higher education in order to compare categories across U.S. Census Bureau population estimates and survey participants. For analysis purposes education was categorized as less than high school, high school graduates, some college or vocational training, and college graduate, see Figure 2.
ORAL HEALTH FOR ALL 2020: Oral Health Barriers for California’s San Joaquin Valley Underserved and Vulnerable Populations
14
TABLE 2. SURVEY SUBSCALE
Knowledge of Unhealthy Behaviors and Attitudes, Cronbach’s α = .579
7 You should visit the dentist, only when you have pain.
10 If your gums bleed when you floss, you should stop.
11 Eating and drinking sweets does not cause tooth decay.
16 Dentures (false teeth) are less trouble than taking care of your own teeth.
17 Keeping natural teeth is not that important.
Knowledge of Healthy Behaviors and Attitudes, Cronbach’s α = .526
8 Brushing your teeth can prevent tooth decay
9 Brushing your teeth will keep you from having trouble with your gums
12 Using fluoride is a good way of preventing tooth decay
14 Taking care of teeth is important to health.
20 Regular visits to the dentist keep away dental problems.
Needs Scale, Cronbach’s α = .764
21 I would like to learn more about keeping my teeth healthy.
26 I would like to learn more about helping my kids teeth healthy
27 I would like to learn more about how to get the dental care I need.
Questions Not Included
6 A child should start dentist visits before the baby teeth come out.
13 Tooth decay can make you look bad.
15 People with bad teeth have bad health.
18 Dentists seem to care about my culture and language.
19 People are scared to go to the dentist because of possible pain.
25 Everyone should have access to dental care.
FIGURE 2. EDUCATION CATEGORIZATIONS FOR ANALYSIS
(N = 635).
In addition, Spanish-speaking Latinos had significantly lower levels of educational attainment than Englishspeaking Latinos and non-Latinos, χ2 = 190.03, df = 6, p < .01. While 16.0% of English-speaking Latinos and 22.1% of Non-Latinos had less than high school education, 79.7% of Spanish-speaking Latinos had less than high school education.
TABLE 3. PEARSON’S R CORRELATIONS BETWEEN
ORAL HEALTH SCALES
UNHEALTHY HEALTHY NEEDS
Unhealthy - -0.10* -0.14*
Healthy -0.10* - 0.26*
Needs -0.14* 0.26* -
Note. * Statistically significant correlation, p < .05
ORAL HEALTH FOR ALL 2020: Oral Health Barriers for California’s San Joaquin Valley Underserved and Vulnerable Populations
15
TABLE 4. PARTICIPANT DEMOGRAPHICS
N % VALID %
Gender Male 165 25.0% 25.3% Female 487 73.9% 74.7% Total 652 98.9% 100.0% Missing 7 1.1%Age 18-29 142 21.5% 21.8% 30-49 303 46.0% 46.5% 50-64 167 25.3% 25.7% 65 + 39 5.9% 6.0% Total 651 98.8% 100.0% Missing 8 1.2%Education Less than high school 189 28.7% 29.8% Some high school 74 11.2% 11.7% High school graduate 135 20.5% 21.3% Some college 121 18.4% 19.1% Trade/technical/vocational training 39 5.9% 6.1% College graduate 77 11.7% 12.1% Total 635 96.4% 100.0% Missing 24 3.6%Race / Ethnicity Latino 477 72.4% 74.8% White 73 11.1% 11.4% African American 39 5.9% 6.1% American-Indian/ Alaska Native 12 1.8% 1.9% Asian 15 2.3% 2.4% Native Hawaiian/ Pacific Islander 4 0.6% 0.6% Two or More races (non-Latino) 18 2.7% 2.8% Total 638 96.8% 100.0% Missing 21 3.2%County of Residence Fresno 262 39.8% 41.6% Madera 109 16.5% 17.3% Merced 72 10.9% 11.4% Tulare 169 25.6% 26.8% Other 18 2.7% 2.9%Total 630 95.6% 100.0%Missing 29 4.4%
ORAL HEALTH FOR ALL 2020: Oral Health Barriers for California’s San Joaquin Valley Underserved and Vulnerable Populations
16
TABLE 5. POPULATION ESTIMATES OF EDUCATIONAL ATTAINMENT COMPARED TO SELF-REPORTED EDUCATIONAL
ATTAINMENT OF SURVEY PARTICIPANTS BY COUNTY
COUNTY
Fresno Madera Merced Tulare
Education
Pop Estimate %
Sample %
Pop Estimate %
Sample %
Pop Estimate %
Sample %
Pop Estimate %
Sample %
Less than HS Grad 21.95% 42.30% 28.60% 57.30% 22.95% 46.60% 26.40% 41.50%
HS Grad 25.25% 20.50% 27.45% 19.10% 26.90% 16.40% 29.35% 21.50%
Note. Population Estimates Source: U.S. Census Bureau, 2015 American Community Survey 5-Year Estimates
RESULTS
Insurance Coverage
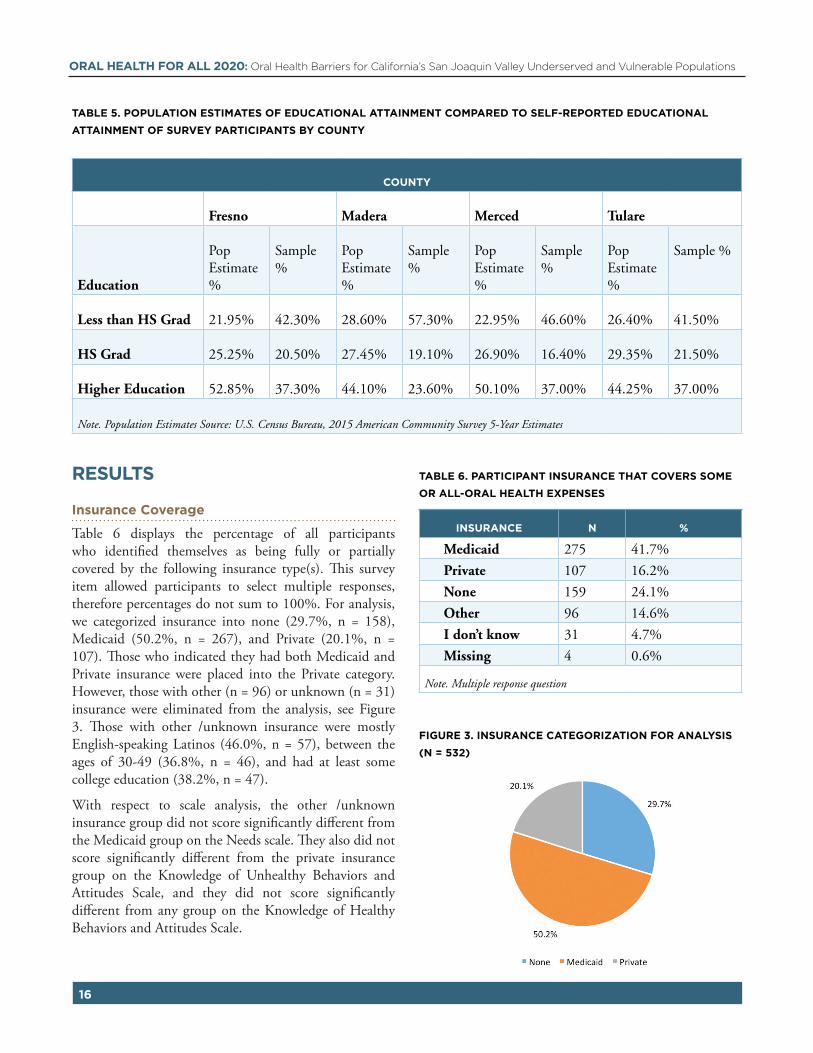
Table 6 displays the percentage of all participants who identified themselves as being fully or partially covered by the following insurance type(s). This survey item allowed participants to select multiple responses, therefore percentages do not sum to 100%. For analysis, we categorized insurance into none (29.7%, n = 158), Medicaid (50.2%, n = 267), and Private (20.1%, n = 107). Those who indicated they had both Medicaid and Private insurance were placed into the Private category. However, those with other (n = 96) or unknown (n = 31) insurance were eliminated from the analysis, see Figure 3. Those with other /unknown insurance were mostly English-speaking Latinos (46.0%, n = 57), between the ages of 30-49 (36.8%, n = 46), and had at least some college education (38.2%, n = 47).
With respect to scale analysis, the other /unknown insurance group did not score significantly different from the Medicaid group on the Needs scale. They also did not score significantly different from the private insurance group on the Knowledge of Unhealthy Behaviors and Attitudes Scale, and they did not score significantly different from any group on the Knowledge of Healthy Behaviors and Attitudes Scale.
TABLE 6. PARTICIPANT INSURANCE THAT COVERS SOME
OR ALL-ORAL HEALTH EXPENSES
INSURANCE N %
Medicaid 275 41.7%
Private 107 16.2%
None 159 24.1%
Other 96 14.6%
I don’t know 31 4.7%
Missing 4 0.6%
Note. Multiple response question
FIGURE 3. INSURANCE CATEGORIZATION FOR ANALYSIS
(N = 532)
ORAL HEALTH FOR ALL 2020: Oral Health Barriers for California’s San Joaquin Valley Underserved and Vulnerable Populations
17
Insurance type varied significantly by age, education, survey site, and ethnicity-language (respectively, χ2 = 13.36, df = 6, p < .05; χ2 = 75.86, df = 6, p < .01; χ2 = 13.77, df = 2, p < .01; χ2 = 68.56, df = 4, p < .01), see Table 7. Being in the youngest or oldest age groups, having higher levels of education, being at a non-clinic site, or being a Latino English speaker or non-Latino was associated with being privately insured. Being between 50-64 years old, having lower levels of education, being at a clinic site, and being non-Latino were associated with being on Medicaid. Being between the ages of 30-49, not being a high school graduate, being at a clinic site, and being a Latino Spanish speaker was associated with having no insurance.
Barriers
Table 8 displays the percentage of all participants who identified the following as barriers getting dental care. This survey item allowed participants to select multiple responses, therefore percentages do not sum to 100%.
Insurance type was significantly related to barriers of time,
cost, and transportation. Those who had no insurance were significantly less likely to identify “getting an appointment when you needed it” as a barrier to oral health than those who had Medicaid or private insurance, (χ2= 15.24, df = 2, p < .001). While 37.7% of those with Medicaid and 39.0% of those with private insurance identified “getting an appointment when you needed it” as a barrier, only 20.0% of those with no insurance identified the same barrier. Those who had no insurance were significantly more likely to identify cost as a barrier to oral health than those who had Medicaid or private insurance, (χ2 = 47.16, df = 2, p < .001).
While 42.4% of those with Medicaid and 43.9% of those with private insurance identified cost as a barrier, 76.7% of those with no insurance identified the same barrier. Those with Medicaid and no insurance were more likely to identify transportation as a barrier, (χ2 = 12.79, df = 2, p < .01). While 13.6% of those with Medicaid and 6.7% of those with no insurance identified transportation as a barrier, only 1.2% of those with private insurance identified the same barrier, see Table 9.
TABLE 7. PERCENT INSURANCE COVERAGE TYPE BY DEMOGRAPHICS
NONE MEDICAID PRIVATE % OF TOTAL
Gender
Male 24.70% 23.80% 29.20% 25.10%
Female 75.30% 76.20% 70.80% 74.90%
Age*
18-29 13.90% 20.70% 24.30% 19.40%
30-49 57.00% 47.10% 41.10% 48.90%
50-64 24.70% 26.80% 23.40% 25.50%
65 + 4.40% 5.40% 11.20% 6.30%
Education*
Less than HS 56.00% 50.60% 17.80% 45.30%
HS Graduate 18.00% 22.00% 17.80% 19.90%
Some College / Vocational 19.30% 20.00% 30.80% 22.10%
College Graduate 6.70% 7.50% 33.60% 12.70%
Survey Site*
non-clinic 29.70% 32.60% 50.50% 35.30%
Clinic 70.30% 67.40% 49.50% 64.70%
Ethnicity-Language*
Latino Spanish 66.00% 45.20% 17.60% 45.90%
Latino English 17.60% 29.30% 58.80% 31.70%
Non-Latino 16.30% 25.50% 23.50% 22.40%
Note. * = significant association with insurance type (p < .05)
ORAL HEALTH FOR ALL 2020: Oral Health Barriers for California’s San Joaquin Valley Underserved and Vulnerable Populations
18
Ethnicity-Language was significantly associated with barriers of time, cost, and fear. Non-Latinos who took the survey in any language were significantly more likely to identify “getting an appointment when you needed it” as a barrier to oral health than those who were Latino that took the survey in English or Spanish (χ2 = 7.32, df = 2, p = .026). While 43% of Non-Latinos that took the survey in any language identified “getting an appointment when you needed it” as a barrier, only 29.5% of Latinos that took the survey in English and 32.8% of Latinos that took the survey in Spanish identified the same barrier. Those who were Latino that took the survey in Spanish were significantly more likely to identify cost as a barrier to oral health than those who were Latino that took the survey in English or Non-Latino that took the survey in any language (χ2 = 26.44, df = 2, p < .001). While 62.8% of Latinos that took the survey in Spanish identified cost as a barrier, only 38.2% of Latinos who took the survey in English and 46.5% of Non-Latinos who took the survey in any language identified the same barrier. Those who were Latino that took the survey in English and those who were Non-Latino were more likely to identify fear as a barrier to oral health than Latinos who took the survey in Spanish (χ2 = 8.30, df = 2, p = .016). While 25.8% of Latino that took the survey in English and 21.1% of Non-Latinos identified fear as a barrier, only 14.6% of Latinos who took the survey in Spanish identified the same barrier, see Table 9.
Survey site was significantly associated with the cost barrier. Those who took the survey at a clinic site were significantly more likely to identify cost as a barrier to oral health than those who took the survey at a non-clinic site (χ2 = 11.65, df = 1, p = .001). While 41.1% of those who took the survey at a non-clinic site identified cost as a barrier, 56.0% of those who took the survey at a clinic site identified the same barrier. Otherwise, there were no significant differences in barriers of getting an appointment, transportation, handicap access, fearfulness of the dentist, and language between those who took the survey at a clinic site and those who took the survey at a non-clinic site, see Table 9.
TABLE 8. BARRIERS
BARRIER N %
Time 195 29.60%
Cost 294 44.60%
Transportation 51 7.70%
Handicap Access 19 2.90%
Fearful 115 17.50%
Language 19 2.90%
Other 59 9%
Missing (none selected) 80 12.10%
TABLE 9. PERCENT IDENTIFIED BARRIER TO ORAL HEALTH
TIME COST TRANSPORTATION HANDICAP ACCESS FEAR LANGUAGE
ORAL HEALTH FOR ALL 2020: Oral Health Barriers for California’s San Joaquin Valley Underserved and Vulnerable Populations
19
Descriptive Analysis: Questions Not Included in Scales
There were six items on the questionnaire that did not add reliability to the established subscales. However, these questions provide insight into the perceptions of oral health held by this sample. For example, most participants partially or completely agreed that children should visit the dentist before the baby teeth erupt for the first time (81.0%), that tooth decay would make you look bad (92.7%), that people with bad teeth have bad health (82.3%), and that everyone should have access to Oral health care (86.8%). Potentially negative findings were that participants partially or completely agreed that people are scared to visit the dentist because of possible pain (86.8%), and that the dentists did not seem to care about their culture or language (51.0%).
When asked about barriers to oral health, participants had the opportunity to fill in an “other” response. There were 36 total responses. Fourteen were “N/A” or closely related. The other 22 responses were evaluated for trends and common themes, see Table 10.
Scales Bivariate Analysis: Knowledge, Attitudes, and Needs
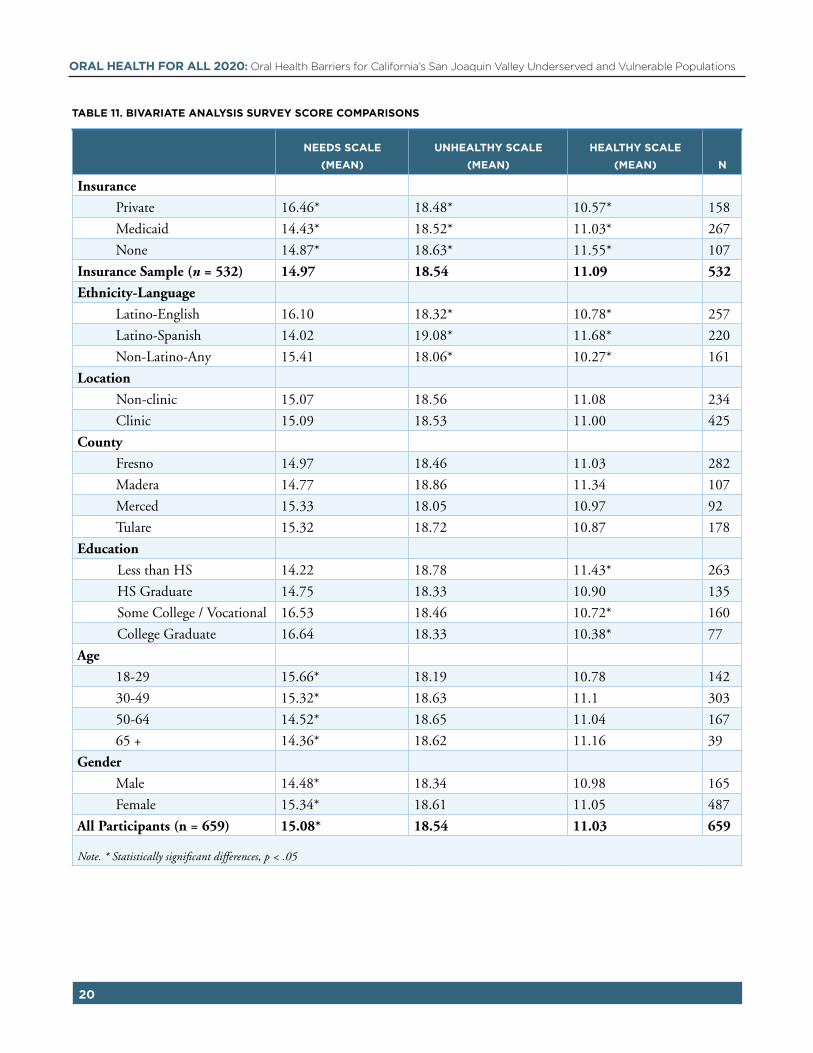
The knowledge of unhealthy behaviors and attitudes scale assessed participants knowledge of unhealthy oral health behaviors and negative attitudes such as eating and drinking sweets or only visiting the dentist if you have pain. Higher scores indicate more knowledge and healthier attitudes. Latinos who took the survey in English (M = 16.10, SD = 3.09) and Non-Latinos (M15.41, SD = 3.69) scored significantly higher on the unhealthy scale than Latinos who took the survey in Spanish (M = 14.02, SD = 3.89), F(2, 637) = 20.80, p < .001. Those who had private insurance (M = 16.46, SD = 3.01) scored significantly higher on the unhealthy
scale than those with Medicaid (M = 14.43, SD = 3.66) or no insurance (M = 14.87, SD = 4.04), F(2, 531) = 11.81, p < .001. Participants who reported their highest level of education as college graduate (M = 16.64, SD = 3.08) or some college (M = 16.53, SD = 3.21) scored significantly higher on the unhealthy scale than those who had graduated from high school (M = 14.75, SD = 3.36) and those who reported less than high school graduate (M = 14.22, SD = 3.70), F(3, 634) =20.35, p < .001. Those between the ages of 18-29 (M = 15.66, SD = 2.97) scored significantly higher on the unhealthy scale than those between the ages of 50-64 (M = 14.52, SD = 3.80), but there were no other significant differences between the remaining age groups, F(3, 634) = 3.47, p < .05. Females (M = 15.34, SD = 3.67) scored higher on the unhealthy scale than males (M = 14.48, SD = 3.51), t (650) = -2.62, p < .01. There were no significant differences on knowledge of unhealthy behaviors scores between clinic and non-clinic settings, nor between counties in which the participants took the survey see Table 11.
The knowledge of healthy behaviors and attitudes scale assessed participants knowledge of healthy oral health behaviors and positive attitudes such as brushing your teeth and seeing Oral health self-care as important to their health. Higher scores indicate more knowledge and healthier attitudes. Those who were Latino that took the survey in Spanish (M = 19.08, SD = 1.29) scored significantly higher on the healthy scale than those who reported being Latino and took the survey in English (M = 18.32, SD = 1.78) and Non-Latinos (M = 18.01, SD = 2.35), F (2, 637) = 19.24, p < .001. There were no significant differences on knowledge of unhealthy behavior scores between insurance types, clinic and non-clinic settings, educational levels, age groups, genders, or counties in which the participants took the survey, see Table 11.
TABLE 10. “OTHER” BARRIERS IDENTIFIED
THEME IDENTIFIED N EVIDENCE
Insensitive to Needs 3 "Not enough explanation of issues" "Insensitive" "They do not consider my needs"
Insurance Coverage or Cost Issues
6 "Insurance does not cover CAPS, other procedures that I want" "It's very expensive" "[My] Insurance doesn't cover everything, only emergencies"
Time 4 "Making time to go" "Work"
Access 1 "Appointments are far away"
Traumatic/Unpleasant Experiences
2 "They removed a molar without anesthesia; they tore my tooth out" "They took out teeth that I did not want them to take out"
ORAL HEALTH FOR ALL 2020: Oral Health Barriers for California’s San Joaquin Valley Underserved and Vulnerable Populations
Note. * Statistically significant differences, p < .05
ORAL HEALTH FOR ALL 2020: Oral Health Barriers for California’s San Joaquin Valley Underserved and Vulnerable Populations
21
The needs scale was a three-item scale that assess what participants want to learn more about oral health. Higher scores indicate a higher desire to learn more about oral health. Those who were Latino that took the survey in Spanish (M = 11.68, SD = .92) scored significantly higher on the needs scale than those Latinos who and took the survey in English (M = 10.78, SD = 1.98) and Non-Latinos (M = 10.27, SD = 2.38), F(2, 637) = 34.65, p < .001. Latinos who took the survey in English also reported significantly higher needs than Non-Latinos did. Those with no insurance (M = 11.55, SD = 1.29) scored significantly higher on the needs scale than those who had Medicaid (M = 11.04, SD = 1.91) or private insurance (M = 10.57, SD = 2.16), F(2, 531) = 9.65, p < .001. Participants who reported their highest level of education to be less than a high school graduate (M = 11.43, SD = 1.32) scored significantly higher on the needs scale than those who had some college (M = 10.72, SD = 2.13) and those who were college graduates (M = 10.39, SD = 2.14), F(3, 634) = 9.13, p < .001. There was no significant differences on needs scores between clinic and non-clinic settings, counties in which the participants took the survey, age groups, or genders, see Table 11.
Scales Multivariate Analysis: Knowledge, Attitudes, and Needs
Four two-way ANOVAs were conducted in attempt to evaluate the effects of ethnicity/survey language (Latino/ Spanish, Latino/English, Non-Latino/English), survey setting (clinic, non-clinic), and insurance coverage (None, Medicaid, or Private) on each of the four knowledge, attitude, and needs scales.
Normality was tested using Shapiro-Wilks Test of Normality for each group for each scale. Homogeneity of variances were tested using Levene’s Test of Equality of Error Variances. Assumptions of normality and homogeneity were violated for most groups and outcomes. Therefore, results of these tests should be interpreted with caution.
Knowledge of Unhealthy Behavior
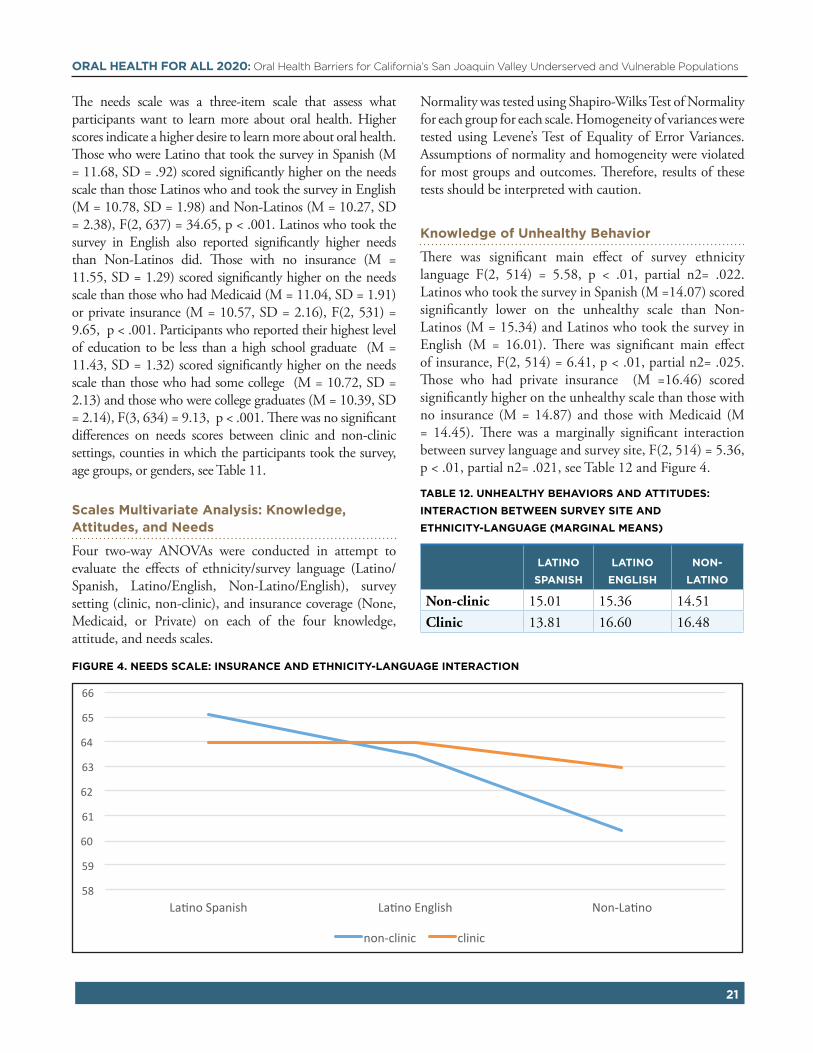
There was significant main effect of survey ethnicity language F(2, 514) = 5.58, p < .01, partial n2= .022. Latinos who took the survey in Spanish (M =14.07) scored significantly lower on the unhealthy scale than Non-Latinos (M = 15.34) and Latinos who took the survey in English (M = 16.01). There was significant main effect of insurance, F(2, 514) = 6.41, p < .01, partial n2= .025. Those who had private insurance (M =16.46) scored significantly higher on the unhealthy scale than those with no insurance (M = 14.87) and those with Medicaid (M = 14.45). There was a marginally significant interaction between survey language and survey site, F(2, 514) = 5.36, p < .01, partial n2= .021, see Table 12 and Figure 4.
TABLE 12. UNHEALTHY BEHAVIORS AND ATTITUDES:
INTERACTION BETWEEN SURVEY SITE AND
ETHNICITY-LANGUAGE (MARGINAL MEANS)
LATINO
SPANISH
LATINO
ENGLISH
NON-
LATINO
Non-clinic 15.01 15.36 14.51
Clinic 13.81 16.60 16.48
FIGURE 4. NEEDS SCALE: INSURANCE AND ETHNICITY-LANGUAGE INTERACTION
58
59
60
61
62
63
64
65
66
La-noSpanish La-noEnglish Non-La-no
non-clinic clinic
ORAL HEALTH FOR ALL 2020: Oral Health Barriers for California’s San Joaquin Valley Underserved and Vulnerable Populations
22
There was a significant interaction between language, insurance, and survey site, F(2, 514) = 2.61, p = .035, partial n2= .021. See Table 13, Figure 5.
Knowledge of Healthy Behavior
There was significant main effect of survey language F(2, 514) =, p < .001, partial n2= .046. Latinos who took the survey in Spanish (M = 19.10) scored significantly higher on the healthy scale than Latinos who took the survey in English (M = 18.30) and Non-Latinos (M = 17.84). There were no other main effects or interactions for the healthy scale.
Needs Scale
There was significant main effect of survey language F(2, 514) = 21.04, p < .001, partial n2= .078. Latinos who took the survey in Spanish (M = 11.71) scored significantly
TABLE 13.UNHEALTHY BEHAVIORS AND ATTITUDES:
INTERACTION BETWEEN SURVEY SITE AND ETHNICITY-
LANGUAGE (MARGINAL MEANS)
ETHNICITY-
LANGUAGE
INSURANCE TYPE
NONE MEDICAID PRIVATE
Latino Spanish 15.64 14.28 15.14
Latino English 13.96 15.57 16.54
Non-Latino 13.25 13.16 17.13
Latino Spanish 13.65 13.78 14
Latino English 17.33 15.1 17.35
Non-Latino 17.46 14.97 17.02
FIGURE 5: UNHEALTHY SCALE: INSURANCE TYPE, ETHNICITY-LANGUAGE, AND SURVEY SITE INTERACTION
ORAL HEALTH FOR ALL 2020: Oral Health Barriers for California’s San Joaquin Valley Underserved and Vulnerable Populations
23
higher on the needs scale than Latinos who took the survey in English (M = 10.82) and Non-Latinos (M = 10.14). The difference between Latinos who took the survey in English and Non-Latinos was also statistically significant. There was marginally significant main effect of insurance, F(2, 514) = 3.12, p = .037, partial n2= .013. Those who had private insurance (M =10.53) scored significantly lower on the needs scale than those with Medicaid (M =11.02) or no insurance (M =11.55). The difference between those who had Medicaid and those who had no insurance was also significant. There was a significant interaction between survey language and insurance type, F(4, 514) = 2.81, p = .025, partial n2= .022, see Table 14 and Figure 6.
TABLE 14. NEEDS SCALE: INTERACTION BETWEEN INSURANCE AND ETHNICITY-LANGUAGE
Latino Spanish Latino English Non-Latino
None 11.9 11 10.59
Medicaid 11.6 10.74 10.51
Private 11.53 10.92 8.96
Figure 6. Needs scale: iNsuraNce aNd ethNicity-laNguage iNteractioN
ORAL HEALTH FOR ALL 2020: Oral Health Barriers for California’s San Joaquin Valley Underserved and Vulnerable Populations
24
DISCUSSIONThe purpose of this report was to understand how underserved and vulnerable individuals throughout California’s San Joaquin Valley region experience oral health care and services. The San Joaquin Valley has been designated as medically underserved. The SJV is home to some of the state’s highest rates of poverty, pesticide use and air pollution. At the same time, it suffers from a shortage of primary care physicians and a higher prevalence of almost every disease and health threat.4,5,54,55 However, the area is rich in ethnic diversity and culture. We sought to understand and evaluate differences in oral health knowledge and experiences by demographics such as language and ethnicity as well as insurance type and survey setting.
Previous studies of agricultural workers in California show that as much as two-thirds of California’s SJV agricultural workers and their families did not have oral health insurance and virtually all of those with any oral health insurance had Medicaid (Denti-Cal).5 This is problematic because of the overwhelming lack of oral health professionals willing to accept Denti-Cal19. In turn, only about half of the agricultural farm worker families had a regular source of oral health care.5 The most commonly cited reasons for irregular oral health care are lacking time, money, transportation, and basic oral health knowledge.
Participants Characteristics
In this study, the youngest and oldest age groups, those with higher levels of education, non-clinic site participants, and Latino and Non-Latino English speaker were privately insured. In contrast, those between the age of 50-64, with lower levels of education, clinic site participants, and Non-Latinos were more likely to be publicly insured. The third group of participants were between the ages of 30-49, high school graduates, clinic site participants, Latino Spanish speakers, and were more likely to report having no insurance.
Barriers
Consistent with previous literature5, cost of oral health care services and the inability to get timely appointment were the most commonly identified barriers to oral health, with almost half (44.6%) of the participants indicating cost as a barrier. Significant differences were found between ethnicity, language, insurance type, and
survey location groups regarding how they experienced barriers to oral health. The results suggest that Latinos who took the survey in Spanish, those with no insurance, and those in the clinic setting are most worried about the cost of oral health services. Whereas insured and English speaking participants are more concerned with receiving a timely appointment. Transportation was a greater barrier for those with Medicaid than those with private or no insurance. Fear was a greater barrier for the Latinos who took the survey in English and Non-Latinos than for Latinos that took the survey in Spanish.
These disparities in barriers to oral health speaks to how these groups navigate their healthcare. For example, time was the second most indicated barrier for most respondents yet for Spanish speaking Latinos time was less of a barrier. We do not think this reflects a difference in amount of free time or treatment between groups, but rather that the lack of timely appointment is only a barrier if you are first able to afford the services or have insurance that covers the cost – a barrier that Spanish speaking Latinos disproportionately identified. This idea was supported by our findings between insurance type groups; where those with no insurance were far more likely to identify cost as a barrier and much less likely to identify getting a timely appointment as barrier. Surprisingly, and in contrast to previous studies of the Latino population7, language was not a frequently indicated barrier to oral health. This is possibly attributable to the high number of bi-lingual
ORAL HEALTH FOR ALL 2020: Oral Health Barriers for California’s San Joaquin Valley Underserved and Vulnerable Populations
25
front-line staff at FQHC’s in the San Joaquin Valley.
Qualitative analysis of other barriers identified by the participants showed that, again, cost of services was the most frequently indicated barrier. Qualitative responses also reinforced time and accessibility to services as barriers. Moreover, insensitivity to needs and traumatic experiences emerged as novel barriers to oral health care.
Scales
Knowledge of Unhealthy and Healthy Behaviors
Participants reported higher knowledge of healthy behaviors across demographics and insurance types. In other words, people tended to know what is good for their oral health and recognize positive attitudes toward oral health. Knowledge of unhealthy behaviors, on the other hand, varied significantly between demographic groups. This suggests that knowledge of unhealthy behaviors may be “privileged” knowledge and we argue that this is linked to health literacy and oral health care access. We hypothesized that those inside the clinics would have higher oral health knowledge scores, simply due to recent exposure and access to the information. However, the analysis revealed that Spanish-speaking Latinos scored lower on knowledge of unhealthy behavior when they took the survey inside the clinic than those who took the survey outside the clinic. Those who took the survey in English and had Medicaid or no insurance showed the greatest improvement in knowledge of unhealthy behavior when they took the survey inside the clinics. This supports the idea that unhealthy-behavior knowledge is linked to health literacy. We also argue that this knowledge of unhealthy behaviors is linked to access to care. Our results show that, in addition to English speakers scoring higher when inside the clinic, being privately insured was linked to higher score in almost every group when compared to those with no insurance or Medicaid. In other words, this suggests that the advantages that we would expect to see at the clinics were not advantageous to Spanish speakers and most advantageous to Non-Latinos with Medicaid or no insurance.
The knowledge of healthy behaviors and attitudes scale was much less variable with all demographic groups scoring relatively high. Overall, the standard deviation for unhealthy scale was 3.67 and for the healthy scale was 1.83. Contrary to our other findings, Latino-Spanish speakers had significantly higher scores, indicating more knowledge, than Latino-English speakers and Non-Latinos. No other
group differences were statistically significant, suggesting that this type of knowledge is not necessarily associated with access to care.
There is a link between oral health knowledge, attitudes, oral health literacy and access. Our survey suggests that our Spanish speaking community in particular is lacking the literacy skills and capacity to obtain, process, and understand the basic health information and services needed to make oral health related decisions. This is concurrent with the previous literature, which states that Hispanics have lower rates of utilization and higher rates of oral health disease and below basic health literacy levels.4,9 The San Joaquin Valley is home to many agricultural worker families, many of which are Hispanic, have low levels of education, and do not speak or write in English4. This is troubling for our community since the lack of literacy has been associated with understanding the etiology of diseases, the importance of treating disease, and knowing how to seek oral health and general health care.10
Further, researchers have identified health literacy as one of the predisposing influences to oral health care utilization.11 According to the Aday & Andersen Healthcare Utilization Model, usage of health care services can be predicted by these predisposing factors as well as enabling factors and need.8,11-17 Our finding of low levels of health literacy in the population is a problematic predisposition characteristic of our population that would predict low utilization of oral health services. On the other hand, enabling factors that would increase utilization were seemingly scarce in our population (i.e. availability of services when needed, cultural/linguistic appropriateness of services). Zarcadoolas’ Expanded model of health literacy highlights the importance of framing health information in a way that accommodates communities’ characteristics including comprehension level and collective belief.35 Therefore, in order to increase oral health knowledge and promote positive oral health attitudes we propose the construction and distribution of this oral health information in various culturally competent modalities that are not dependent on one’s level of literacy.
Oral Health Needs
Analysis showed that Latinos, particularly when they took the survey in Spanish, had higher oral health learning needs than Non-Latinos. Those who had no insurance had higher needs than those on Medicaid and those on Medicaid had higher needs than those with private insurance. There was a significant interaction between ethnicity-language and insurance type, revealing that
ORAL HEALTH FOR ALL 2020: Oral Health Barriers for California’s San Joaquin Valley Underserved and Vulnerable Populations
26
Non-Latinos with private insurance have significantly lower needs than any other group. While this finding was expected, it confirms that not only do Spanish speaking Latinos have a higher need for oral health knowledge but also their willingness and desire to learn were higher.
NEXT STEPSIn collaboration with our local partners, and state and national network we have identified a number of key action steps for local and state-level policy and program improvements such as; adult Denti-Cal coverage, improved access and cultural competence of participating providers, and increased access to oral health self-care education for all age groups). These above collaborative actions have emphasized that for grassroots level effort the meaningful inclusion and engagement of the community is essential for mobilizing action. Our goal is twofold; 1) to inform community based organizations, residents and providers of the needs and challenges of oral health access in the Valley and 2) to ignite a dialogue to address these challenges by helping residents/others understand the impacts of existing policies and provide opportunities for mobilization around these emergent policy goals. Across our collaborative planning conversations, our partners have pointed to the highly charged and dynamic nature of health policy debates in California and nationally, and thus our goals need to include preparing local individuals and groups with skills and perspectives to mobilize around both current policy priorities and emergent policy debates. As such, our goals and priorities in the coming years are as follows:
1. In an effort to highlight the persistent disparity in oral health, we will print and disseminate our “Oral Health Barriers for California’s San Joaquin Valley Underserved and Vulnerable Population” report and we will hold a press release highlighting the social and environmental system indicators that promote and sustain inequity. Through this effort, we hope to spark interest from emerging San Joaquin Valley community leaders to form multisector stakeholders who are motivated to work on oral health and form a Local/Regional Oral Health 2020 Policy Team. The Oral Health Policy Team will be designed to broaden local engagement
and focused action around key policy initiatives developed by statewide and national oral health advocacy groups. This group will be required to participate in a yearlong leadership health policy program to develop a clear understanding of health equity for underrepresented/underserved populations and how we can expand it through health in all policies strategies and health reform. Hone their ability to effectively engage others and strategically communicate about a complex, polarizing issue. Employ health equity tools to guide program development. Access research data and geographic information systems to identify groups and communities with the greatest needs for healthy interventions and inform communities and policy makers about social determinants of health and their impact on health outcomes. We will work with this group to pilot policy messages and educational materials to promote these messages. Team members will develop their individual and group capacity as spokespersons and advocates using these same materials.
2. The collaborative planning and research efforts by CVHPI and several of California’s grassroots partner organizations has emphasized the need for culturally and linguistically appropriate oral health educators. The Promotora Model has been successfully implemented in the San Joaquin Valley and other parts of the country to increase healthcare access.56 The model utilizes community members as lay health educators that can assist other members of their community to enroll in health insurance programs, to receive and understand the importance of preventive care services and establishing a usual source of care, and improve health self-efficacy. The results of this implementation showed significantly increased access to care by increasing the number of participants that had insurance coverage and a regular source of care. These roles are also emphasized in the Fresno County and other dental transformation grant county initiatives.
3. These paraprofessionals need basic education on appropriate use of oral health services, self-management practices, and advocating for individual patient access. Additionally, in
ORAL HEALTH FOR ALL 2020: Oral Health Barriers for California’s San Joaquin Valley Underserved and Vulnerable Populations
27
California, one of the key learnings from the efforts to pass and implement the Affordable Care Act has been the added value for recipients of Community Health Workers (CHW) services in receiving motivational education about how current financing and regulatory policies limit their access to needed care and the options for policy improvement. Such education when delivered by CHWs both supports individual motivation for self-care and appropriate service use and community mobilization for action.
4. Our collaboration with other Oral Health 2020 network partners revealed common barriers to oral health for the Latinos underserved population. For example, our residents’ survey showed the main barrier to oral health to be cost. This was validated by the promotores participating in the Vision Y Compromiso (VYC) survey and the Strategic Concepts in Organizing and Policy Education (SCOPE) participants. Another common barrier identified was inadequate oral health knowledge among participants and the subsequent need of proper and consistent oral health education messages. There was consensus that these messages have to be culturally and linguistically competent to best outreach minorities who suffer the most oral health disparities. To that end, VYC also shared the need for better involvement of the promotores as the Community Health Workers for the Latino population. Based on these commonalities, we have extended our collaboration to reach out and learn from other Grassroots organizations in California such as Visión y Compromiso and SCOPE to develop peer-learning strategies and evidence based solution to develop a culturally appropriate oral health model and to explore potential policy development and implementation of successful models. Based on these discussions, we will extend and deepen our collaborative planning by continuing this work. We will achieve this goal by developing a “Statewide Oral Health Grassroots Policy Messaging” Work-Group to include all California grassroots agencies working on oral health. The statewide workgroup will work to a) identify a shared policy priorities, and the associate advocacy messages and background
information associated with these b) review existing community member and CHW oral health curriculum and come to consensus on which parts of this curriculum is appropriate to adapt for our purpose. The Central Valley Health Policy Institute and the Statewide Oral Health Grassroots Policy Messaging Work-Group will collaboratively develop these materials. The CVHPI will pilot these materials with participants in the Central California Oral Health 2020 Policy Team and use learnings from the pilots to update the materials. A document including all updated policy engagement and training materials will be prepared and made available to our partners and other groups.
LIMITATIONSOur initial search indicated a lack of established measures that fit our original aim of the study – to evaluate knowledge, perceptions and attitudes toward oral health – that also fit the needs of our population. We therefore created our own questionnaire. Despite conducting a principal components analysis in attempt to detect more reliable scales in our survey, the resulting subscales still had somewhat low reliabilities. Scores on the healthy scale were all very high with low variability in scores, indicating a possible ceiling effect.
The knowledge portion of the survey was intended to test participant knowledge of oral health. However, the response scale lacked an “I don’t know” option. This would have been particularly useful for questions that our research assistants identified as difficult for the participants to answer. For example, one question asked participants to state how strongly they agreed or disagreed with the statement “Using fluoride is a good way of preventing tooth decay” but the research assistants reported that many of the survey participants did not know what fluoride was. The participants then either guessed or left the question blank, compromising the credibility of the responses.
ORAL HEALTH FOR ALL 2020: Oral Health Barriers for California’s San Joaquin Valley Underserved and Vulnerable Populations
28
REFERENCES
1. Glick, M., Williams, D. M., Kleinman, D. V., Vujicic, M., Watt, R. G., & Weyant, R. J. (2017). A new definition for oral health developed by the FDI World Dental Federation opens the door to a universal definition of oral health. American Journal of Orthodontics & Dentofacial Orthopedics, 151(2), 229-231. doi:10.1016/j.ajodo.2016.11.010
2. U.S. Department of Health and Human Services. National Institute of Dental and Craniofacial Research, National Institutes of Health. Oral Health in America: A Report of the Surgeon General. Rockville, MD: U.S. Department of Health and Human Services; 2000.
3. Glick M, Monteiro da Silva M, Seeberger GK, et al. FDI Vision 2020: shaping the future of oral health. Int Dent J. 2012;62:278-91.
4. Disparities Data Overview OH-5 by Race and Ethnicity. Retrieved May 25, 2017, from https://www.healthypeople.gov/2020/data/ disparities/summary/Chart/5026/3
5. Finlayson, T. L., Gansky, S. A., Shain, S. G., & Weintraub, J. A. (2010). Dental utilization among Hispanic adults in agricultural worker families in California’s Central Valley. Journal of Public Health Dentistry, 70(4), 292–299. http://doi.org/10.1111/j.17527325.2010.00184.x
6. Findings from the National Agricultural Workers Survey (NAWS), 2013-2014: A Demographic and Employment Profile of United States Farmworkers. https://www.doleta.gov/agworker/pdf/NAWS_Research_Report_12_Final_508_Compliant.pdf
7. Anthony, M., Williams, J., & Avery, A. (2008). Health needs of migrant and seasonal farmworkers. Journal of Community Health Nursing, 25(3), 153-160.
8. Institute of Medicine and National Research Council. Improving access to oral health care for vulnerable and underserved populations. Washington, DC: National Academic Press; 2011.
9. Kutner M, Greenberg E, Jin Y, Paulsen C. The Health Literacy of America’s Adults: Results from the 2003 National Assessment of Adult Literacy (NCES 2006-483)2006
10. Patino, Daisy. “Oral health knowledge and dental utilization among Hispanic adults in Iowa.” MS (Master of Science) thesis, University of Iowa, 2015.
11. Aday, Lu Ann; Andersen R (1974). “A framework for the study of access to medical care”. Health Serv Res. 9 (3): 208–20. PMC 1071804 . PMID 4436074.
12. Andersen, R. (1995). Revisiting the Behavioral Model and Access to Medical Care: Does it Matter? Journal of Health and Social Behavior, 36(1), 1-10.
13. Edelstein BL, Chinn CH. Update on disparities in oral health and access to dental care for America’s children. Acad Pediatr 2009; 9(6):415– 9.
14. Decker, S. L. (2011). Medicaid Payment Levels to Dentists and Access to Dental Care among Children and Adolescents. Jama, 306(2). doi:10.1001/jama.2011.956
15. Kenney, M. K., Kogan, M. D., & Crall, J. J. (2008). Parental Perceptions of Dental/Oral Health Among Children With and Without Special Health Care Needs. Ambulatory Pediatrics, 8(5), 312-320. doi:10.1016/j.ambp.2008.04.005
16. Lewis, C., and J. Stout. 2010. Toothache in U.S. children. Archives of Pediatrics and Adolescent Medicine 164(11):1059-1063.
17. Mani, Simi. “Impact of insurance coverage on dental care utilization of Iowa children.” MS (Master of Science) thesis, University of Iowa, 2015. http://ir.uiowa.edu/etd/1689.
18. Aday LA, Andersen RM. Equity of access to medical care: a conceptual and empirical overview. Med Care. 1981;19(Suppl 12):4–27.
19. Aday L, Awe W. Health services utilization models. In: Gochman DS, editor. Handbook of health behavior research, Vol. 1, Personal and social determinants. New York (NY): Plenum Press; 1997. p. 153–72.
20. Brown ER, Davidson PL, Yu H, Wyn R, Andersen RM, Becerra L, et al. Effects of community factors on access to ambulatory care for lower income adults in large urban communities. Inquiry. 2004;41:39–56.
21. Auchincloss AH, Van Nostrand JF, Ronsaville D. Access to health care for older persons in the United States: personal, structural, and neighborhood characteristics. J Aging Health. 2001;13(3):329–54.
ORAL HEALTH FOR ALL 2020: Oral Health Barriers for California’s San Joaquin Valley Underserved and Vulnerable Populations
29
22. Davidson PL, Andersen RM, Wyn R, Brown ER. A framework for evaluating safety-net and other community- level factors on access for lowincome populations. Inquiry. 2004; 41(1):21–38.
23. Gelberg L, Andersen RM, Leake BD. The behavioral model for vulnerable populations: application to medical care use and outcomes for homeless people. Health Serv Res. 2000; 34(6):1273–302.
24. Kao DT. Generational cohorts, age at arrival, and access to health services among Asian and Latino immigrant adults. J Health Care Poor Underserved. 2009;20 (2):395–414
25. Villarejo, D.; Lighthall, D.; Williams, D.; Souter, A.; Mines, R.; Bade, B.; Samuels, S.; McCurdy,SA. Suffering in Silence: A Report on the Health of California’s Agricultural Workers. The California Endowment; Woodland Hills, CA: 2000.
26. California Agriculture Employment: http://www.calmis.ca.gov/file/agric/ca-ag-profile.pdf. Accessed March 25, 2017.
27. Horton, S., & Barker, J. C. (2010). Stigmatized Biologies. Medical anthropology quarterly, 24(2), 199-219.
28. Finlayson, T. L., Gansky, S. A., Shain, S. G., & Weintraub, J. A. (2014). Dental utilization by children in Hispanic agricultural worker families in California. Journal of dental, oral and craniofacial epidemiology, 2(1-2), 15.
29. Bureau of Clinician Recruitment and Service, Health Resources and Services Administration (HRSA), U.S. Department of Health & Human Services, HRSA Data Warehouse: Designated Health Professional Shortage Areas Statistics, as of January 1, 2017.
30. Fixing Denti-Cal.| Little Hoover Commission. http://www.lhc.ca.gov/report/fixing-denti-cal. Accessed April 11, 2017.
31. Health Policy Institute. American Dental Association. 2013. “The Oral Health Care System. A State-by-State Analysis.” Page 26. Washington, D.C. http://www.ada.org/~/media/ADA/Science%20and%20Research/HPI/OralHealthCare-StateFacts/ Oral-Health-CareSystem-Full-Report.pdf
32. Children Now: https://www.childrennow.org/issue-areas/health/oral-health/denti-cal-map/
33. Pourat N and Choi MK. Trends in the Supply of Dentists in California. Los Angeles, CA: UCLA Center for Health Policy Research, 2014.
34. National Institute of Dental and Craniofacial Research, National Institute of Health, US Public Health Service, Department of Health and Human Services. The invisible barrier: literacy and its relationship with oral health. A report of a workgroup sponsored by the National Institute of Dental and Craniofacial Research, National Institute of Health, US Public Health Service, Department of Health and Human Services. J Public Health Dent. 2005; 65: 174-82.
35. Zarcadoolas, C., Pleasant, A., & Greer, D. S. (2005). Understanding health literacy: an expanded model. Health promotion international, 20(2), 195-203.
36. Institute of Medicine. Health literacy: a prescription to end confusion. Washington DC: The National Academies; 2004. https://www.nap. edu/read/10883/chapter/6#109
37. Robinson, L. A., Crabtree, M. A., Allen, N. W., Baber, G., Boseman, J. J., Briskie, D. M., ... & Gill, E. A. (2009). Health Literacy in Dentistry Action Plan 2010-2015. Chicago, IL: American Dental Association.
38. Macek, M. D., Manski, M. C., Schneiderman, M. T., Meakin, S. J., Haynes, D., Wells, W., ... & Parker, R. M. (2011). Knowledge of oral health issues among low–income Baltimore adults: a pilot study. American Dental Hygienists Association, 85(1), 49-56.
39. Lamster, I. B., & Pagan, M. (2017). Periodontal disease and the metabolic syndrome. International dental journal, 67(2), 67-77.
40. Vilella, K. D., Assunção, L. R. D. S., Junkes, M. C., Menezes, J. V. N. B. D., Fraiz, F. C., & Ferreira, F. D. M. (2016). Training and calibration of interviewers for oral health literacy using the BREALD-30 in epidemiological studies. Brazilian Oral Research, 30(1).
41. Lee, J. Y., Divaris, K., Baker, A. D., Rozier, R. G., & Vann Jr, W. F. (2012). The relationship of oral health literacy and self-efficacy with oral health status and dental neglect. American journal of public health, 102(5), 923-929.
42. Hom JM, Lee JY, Divaris K, Baker AD, Vann WF Jr. Oral health literacy and knowledge among patients who are pregnant for the first time. J Am Dent Assoc. 2012;143(9):972-80. doi:10.14219/jada.archive.2012.0322
43. Divaris K, Lee JY, Baker AD, Vann WF Jr. Caregivers’ oral health literacy and their young children’s oral health-related quality-of-life. Acta Odontol Scand. 2015;70(5): 390-7. doi:10.3109/00016357.2011.629627
ORAL HEALTH FOR ALL 2020: Oral Health Barriers for California’s San Joaquin Valley Underserved and Vulnerable Populations
30
44. A. Witmer, S.D. Seifer, L. Finocchio, J. Leslie, E.H. O’Neil Community health workers: integral members of the health care work force Am J Public Health, 8 (Pt (1)) (1995), pp. 1055–1058
45. Prezio, E. A., Cheng, D., Balasubramanian, B. A., Shuval, K., Kendzor, D. E., & Culica, D. (2013). Community Diabetes Education (CoDE) for uninsured Mexican Americans: a randomized controlled trial of a culturally tailored diabetes education and management program led by a community health worker. Diabetes research and clinical practice, 100(1), 19-28.
46. Horton LA, Parada H, Slymen DJ, Arredondo E, Ibarra L, Ayala GX. Targeting children’s dietary behaviors in a family intervention: ‘Entre familia: reflejos de salud’. Salud Publica Mex. 2013;55 Suppl 3:397–405.
47. Hoeft, K. S., Rios, S. M., Guzman, E. P., & Barker, J. C. (2015). Using community participation to assess acceptability of “Contra Caries”, a theory-based, promotora-led oral health education program for rural Latino parents: a mixed methods study. BMC oral health, 15(1), 103.
48. Hoeft, K. S., Barker, J. C., Shiboski, S., Pantoja‐Guzman, E., & Hiatt, R. A. (2016). Effectiveness evaluation of Contra Caries Oral Health Education Program for improving Spanish‐speaking parents’ preventive oral health knowledge and behaviors for their young children. Community dentistry and oral epidemiology, 44(6), 564-576.
49. Jones, M., Lee, J. Y., & Rozier, R. G. (2007). Oral health literacy among adult patients seeking dental care. The Journal of the American Dental Association, 138(9), 1199-1208.
50. Horowitz AM and Kleinman DV. “Oral health literacy: a pathway to reducing oral health disparities in Maryland”. Journal Public Health Dentistry 72 suppl1 (2012): S26-S30.
51. Dickson-Swift, V., Kenny, A., Farmer, J., Gussy, M. & Larkins, S. (2014) Measuring oral health literacy: A scoping review of existing tools. BioMedCentral Oral Health. 14(148)
52. Rustvold, S. R. (2012) Oral health knowledge, attitudes, and behaviors: Investigation of an educational intervention strategy with at-risk females. Dissertations and Theses. 612
53. Institue of Medicine. (2000). Healthy people 2010. https://www.cdc.gov/nchs/healthy_people/hp2000.htm
54. Bengiamin, Marlene I., Ph.D., John Amson Capitman, Ph.D., and Kudzai Nyandoro. Hospital Council of Northern and Central California Community Needs Assessment. Report. Central Valley Health Policy Institute Central California Center for Health and Human Services College of Health and Human Services, California State University, Fresno. 2011. Accessed May 05, 2017. www.csufresno.edu/chhs/cvhpi/ documents/2011-community-needs.pdf.
55. Capitman, John Amson, Ph.D., Emanuel Alcala, and Lauren Lessard. “San Joaquin Valley Public Health Consortium.” San Joaquin Valley Public Health Consortium. Accessed May 30, 2017. https://www.fresnostate.edu/chhs/sjvphc/index.html.
56. Capitman, John A. , Ph.D., Alicia Gonzalez, Mariana Ramirez, and Tania Pacheco. The Effectiveness of a Promotora Health Education Model for Improving Latino Health Care Access in California’s Central Valley. Report. Central Valley Health Policy Institute Central California Center for Health and Human Services College of Health and Human Services, California State University, Fresno University of California, San Francisco LaCMER. www.fresnostate.edu/chhs/cvhpi/documents/cms-final-report.pdf.
ORAL HEALTH FOR ALL 2020: Oral Health Barriers for California’s San Joaquin Valley Underserved and Vulnerable Populations