Oral Health Research: A Social Disparities Perspective Benjamin Chaffee Lisa Chung Stuart Gansky UCSF Center to Address Disparities in Children’s Oral Health Center on Social Disparities in Health Seminar Series November 5, 2014 UCSF Center to Address Disparities in Children’s Oral Health
Transcript
Oral Health Research: A Social Disparities Perspective Benjamin Chaffee Lisa Chung Stuart Gansky UCSF Center to Address Disparities in Children’s Oral Health Center on Social Disparities in Health Seminar Series November 5, 2014
UCSF Center to Address Disparities in Children’s Oral Health
2
Oral Health & Oral Health Disparities: A Global Overview
3
Oral Health & Oral Health Disparities
Oral Health is Health Medicine and Dentistry have professional boundaries The biological and social determinants of what makes us healthy or sick affect the entire body
4
Determinants of Poor Oral Health
Oral Health is Health
Tobacco Alcohol Sugar Low Fruit/Vegetable Intake Oxidative Stress Low Health Literacy Limited Access to Care Inadequate Social Support
Poverty Lack of Preventive Behaviors Stigma Bacterial/Viral Infections Genetic Predisposition Poor Parental/Family Health Physical Inactivity Limited Education/Opportunity
Determinants of Poor Oral Health
5
Oral Health: More Than Cavities
Periodontal disease Tooth loss Oral cancer Noma (cancrum oris) Oral infections Salivary dysfunction Caries: children and adults
6
Oral Health is Health
Poor general health can be reflected in the oral cavity:
Diabetes is major contributor to periodontal disease
HIV/AIDS can lead to oral infections/complications
Image credit: Dr Augustin Zerón (left); public domain files from Wikimedia Commons
7
Oral Health is Health
Oral health affects general health and quality of life: Pain and infection Nutritional intake Self-confidence and appearance Lost time from work or school
>4 million Emergency Department visits for dental conditions in US, 2008-2010. ~1% of all ED visits, $2.7 billion in charges ($760/visit) 101 deaths
Sources: Allareddy, Rampa, Lee, et al. JADA 2014; 45:331-337. http://www.washingtonpost.com/wp-dyn/content/article/2007/02/27/AR2007022702116.html
Deamonte Driver, 12-year-old boy near Washington DC, died from complications of dental infection in 2007 after his family unable to access timely dental care
Oral conditions affect nearly 60% of people worldwide:
>3.9 billion individuals
Marcenes, et al. (2013) J Dent Res 92(7):592-7 Vos, et al. (2012) Lancet 380(9859):2163-96
Pop
ulat
ion
(thou
sand
s)
9
The Global Burden of Oral Conditions
Marcenes, et al. (2013) J Dent Res 92(7):592-7 Vos, et al. (2012) Lancet 380(9859):2163-96
The Daily Telegraph (London) mapped the prevalence of tooth decay among 3-year-olds from all English local authorities that provided data. (Sept 30, 2014)
Trends in Children’s Oral Health Disparities: an Example from Brazil
modified map; original by Raphael Lorenzeto de Abreu
Canoas
BRAZIL
Canoas, Brazil State: Rio Grande do Sul
Suburb of Porto Alegre Population (2010): 324,000 31st largest GDP in Brazil 553rd by Human Development Index HDI increasing: 0.665 in 2000 0.750 in 2010
Source: Brazilian Institute of Geography and Statistics
17
Trends in Children’s Oral Health Disparities: an Example from Brazil
Reference: Kramer, Chaffee, Bertelli, et al. (2014) Int J Paediatr Dent [in press]
Two Survey Waves, Ten Years Apart:
Oral Health Canoas 2000 1487 children in 28 preschools Oral Health Canoas 2010 1306 children in 31 preschools Recorded dental health status and indicators of family socio-economic position for children age < 6 years
2000 2010 2000 2010 0
10
20
30
40
50 Caries Prevalence (%)
39.6 1.53
0
0.5
1.0
1.5
2.0 Caries Severity (dmft)
25.9 1.13
Substantial Dental Health Improvements: Canoas, Brazil (2000 to 2010)
18
19
Substantial Dental Health Improvements: Canoas, Brazil (2000 to 2010)
1st (lowest) 2nd 3rd 4th 5th (highest) HOUSEHOLD INCOME QUINTILE
20
Substantial Dental Health Improvements: Canoas, Brazil (2000 to 2010)
NOT Distributed Equally
2000
2010
Slope Index Inequality: - 0.73
Slope Index Inequality: - 0.82
21
Trends in Children’s Oral Health Disparities: an Example from Brazil
Brazilian primary health care system reorganized in 1990s and significantly expanded in 2000s “Oral health teams” were incorporated into public health centers, with emphasis on service utilization (Navarro, 2012) Major expansion in number of dentists; >100 new dental schools opened 1995-2008 (Saliba, 2009) Striking inequalities in access/utilization of dental services and in perceived treatment needs (Peres, 2013)
Reducing Oral Health Disparities CAN DO Multidisciplinary Research
UCSF Center to Address Disparities in Oral Health
Support: US DHHS NIH/NIDCR U54 DE 014251, R03 DE 018116, R21 DE 018650, R21 DE 019210, U54 DE 019285, P30 DE 020752
• International, National, California and local San Francisco data reveal oral health disparities.
• Higher caries prevalence among young children of color and low socioeconomic status families than white children and those from higher SES families.
24
• To reduce oral health disparities among children and their caregivers through research, training, and dissemination with community partners
• Focus: preventing and reducing
early childhood caries
CAN DO Mission
.
Interdisciplinary Research
• Cariology • Medical
Anthropology • Epidemiology • Biostatistics • Microbiology • Pediatric Dentistry • Public Health
Dentistry
• Health Services Research
• Clinical Trials • Linguistics • Adolescent Medicine • Nursing • Molecular Biology • Health Literacy
Multidisciplinary Research Transdisciplinary Research
Summary of Study Populations • Low-income Hispanic, Chinese, Filipino,
African-American families • Preschool children • Parents/caregivers • Pregnant women • Agricultural worker families • English language learners • Dentists, Primary medical care providers
CANDO’s Partners in California
DAVIS
San Francisco Mendota
San Ysidro SAN DIEGO
San Jose
SACRAMENTO Albany/Berkeley
Oakland
Salinas
LOS ANGELES
Conceptual Framework of Children’s Oral Health Child, family, & community influences on child oral health outcomes
Microflora
Substrate (diet)
Host & Teeth
Oral Health
Child Level Influences
Development
Use of Dental Care
Dental Insurance Biologic and
Genetic Endowments
Physical Attributes
Health Behaviors and Practices
Family Level Influences Socioeconomic Status
Social Support
Health Status of Parents
Family Composition
Family Function
Health Behaviors, Practices, and Coping Skills of Family
Social Environment
Community Level Influences
Dental Care System Characteristics
Health Care System Characteristics
Physical Environment
Culture Social Capital Physical Safety
Community Oral Health Environment
Time
Fisher-Owens et al. Pediatrics 2007 NIH/NIDCR R03DE016571
Fisher-Owens, Gansky et al. 2007
Glass Ionomer & Fluoride Varnish Trial (GIFVT) Stuart Gansky, UCSF PI; Francisco Ramos-Gomez, UCLA PI
Metagenomics (Metagene) Ling Zhan, PI
CenteringPregnancy® Oral Health Promotion Extension (CPOPE) – Lisa Chung, PI
Salt Fluoridation Feasibility Judith Barker, PI
FV REACH Peggy Walsh, PI
Mediation Model Jing Cheng, PI
Data Coordinating Center – Steve Gregorich, PI
Glass Ionomer & Fluoride Varnish Trial (GIFVT) Stuart Gansky, UCSF PI; Francisco Ramos-Gomez, UCLA PI
Metagenomics (Metagene) Ling Zhan, PI
CenteringPregnancy® Oral Health Promotion Extension (CPOPE) – Lisa Chung, PI
Glass Ionomer & Fluoride Varnish Trial (GIFVT) Stuart Gansky, UCSF PI; Francisco Ramos-Gomez, UCLA PI
Metagenomics (Metagene) Ling Zhan, PI
CenteringPregnancy® Oral Health Promotion Extension (CPOPE) – Lisa Chung, PI
FV REACH Peggy Walsh, PI
52 MDs and 298 nurses and WIC staff trained to apply FV in Contra Costa, El Dorado, Fresno, Lake, San Mateo, & Sonoma Counties
Hoeft et al. 2011
Caregiver: " I think it’s good because you don’t have to go anywhere, I mean, and especially people who don’t have transportation like that, it’s very good to just to be able to pick up the phone and be able to call and get your questions answered versus having to schedule a doctor’s appointment or go through all that. It’s not time consuming. It’s not costly and it’s just right there at your fingertips.”
RAP Hellman Fdn Scholar R03 resubmission Ann Lazar
R34 resubmission Hellman Fdn Grant RAP submission Sally Adams & Lisa Chung
K23 Liliam Pinzón
Fostering New Research Projects and Junior Faculty
SFHIP Bahar Amanzadeh
caries health disparities in California school-children:
1993-94 to 2004-05 Stuart A. Gansky, DrPH
Gloria C. Mejia, DDS, MPH, PhD Estefania Guerreros
Pamela Z. Han, BS, MPH Nancy F. Cheng, MS, MS Sally H. Adams, RN, PhD
University of California, San Francisco Center to Address Disparities in Children’s Oral Health
US DHHS/NIH/NIDCR R03 DE 018116 & NDDK R25 DK78382-04
39
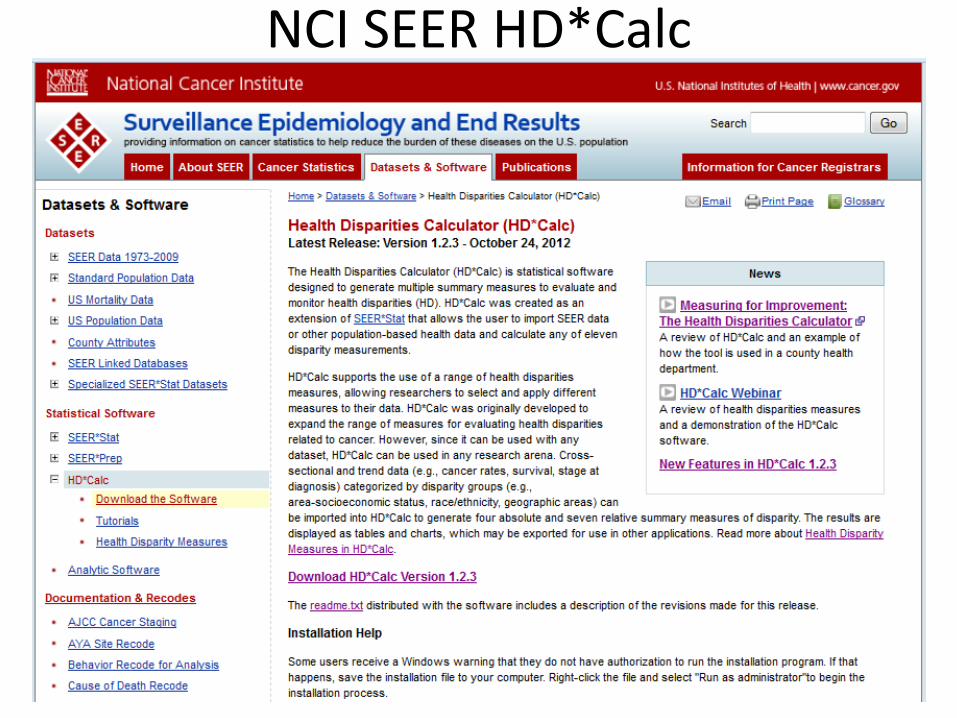
measuring health disparities • define reference group • use healthier group as reference • absolute & relative differences • report adverse health effects • compare all groups with ref • use summary measures • but also report each group • use weights if justified • consider population size • use ordered summary measures • report confidence intervals Keppel et al. 2005
US DHHS Monograph
11 guidelines
health disparity indices Absolute • Range (rate) difference (RD) • Between group variance (BGV) • Absolute concentration index (ACI) • Slope index of inequality (SII)
Relative • Range (rate) ratio (RR) • Index of disparity (ID) • Mean log deviation (MLD) • Theil index (T) • Relative concentration index (RCI) • Relative index of inequality (RII(mean)) • Kunst-Mackenbach relative index (KMI)=RII(ratio) 40
45% untreated caries Higher burden of caries and gingival disease:
Hispanic Public dental insurance No dental visit in past 6 months
Mediation analysis:
Chung LH, Gregorich SE, Armitage GC, Gonzalez-Vargas J, Adams SH. Sociodemographic disparities and behavioral factors in clinical oral health status during pregnancy. Community Dent Oral Epidemiol. 2014 Apr;42(2):151-9
Hispanic, low-income
Oral Health Status • Gingival disease • plaque • untreated caries
Dental visit in past 6 months
Direct effects
Indirect effects
% Change in Plaque Levels by Group
-60
-40
-20
0
20
40
60
80
Improved No Change Worsened
% women
Intervention
Control
p= 0.0138
% Change in Probing Depths
-80
-60
-40
-20
0
20
40
60
Improved No Change Worsened
% women
InterventionControl
p= 0.0018
% Change in # of Bleeding on Probing Sites
p= 0.0001
% Infants with MS and LB at 12 months
23.9
15.2
10.5
5.3
27.4
17.8
0
5
10
15
20
25
30
MS LB
TotalCPOP interventionControls
Conclusions
A brief education and skills- based intervention delivered by non-dental providers in prenatal care may be effective in improving women and children’s oral health.
What’s next…
Further analysis NIH R34 planning grant for U01 clinical trial RAP grant to pilot test text message
intervention during post-partum period Future directions
Expand into other group care settings CenteringParenting
Acknowledgements
CPOP CP® partners: facilitators, women, Sharon Rising NIH/National Institute of Dental and Craniofacial Research
(NIDCR) Award #R21DE019211 UCSF Center to Address Disparities in Oral Health (CAN DO)
NIH/NIDCR Award #U54 DE019285 Dental Trade Alliance Foundation
CAMBRA in Schools Elev8 partners: Native American Health Center Oakland,
United for Success Academy, UCSF School of Nursing Atlantic Philanthropies American Association for Dental Research