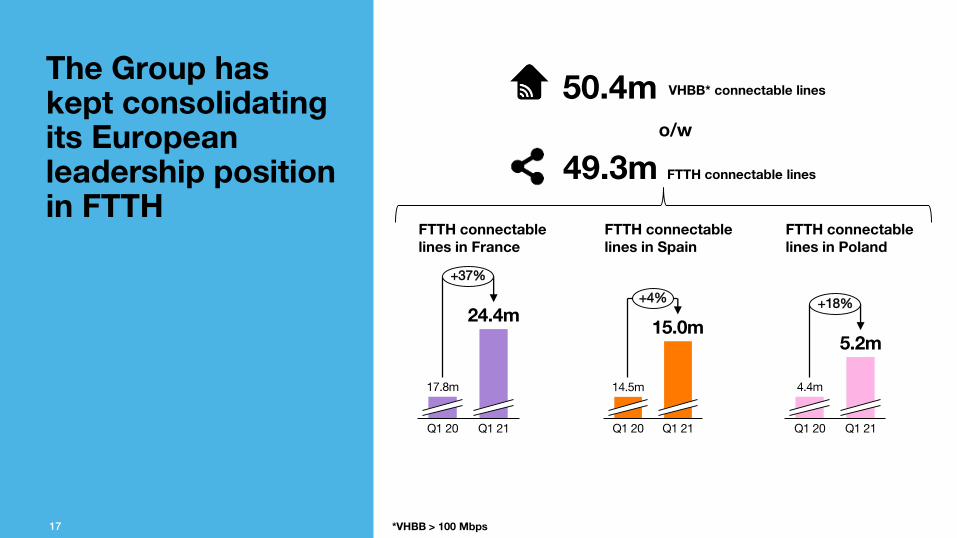
17
Orange financial results #Q1_2021 April, 22nd 2021 Ramon Fernandez Deputy CEO, Finance, Performance and Development 1

Orange financial results#Q1_2021
April, 22nd 2021
Ramon FernandezDeputy CEO, Finance, Performance and Development
1

Disclaimer
This presentation contains forward-looking statements about Orange's financial situation, results of operations and strategy.Although we believe these statements are based on reasonable assumptions, they are subject to numerous risks and uncertainties,including matters not yet known to us or not currently considered material by us, and there can be no assurance that anticipatedevents will occur or that the objectives set out will actually be achieved. More detailed information on the potential risks that couldaffect our financial results is included in the Universal Registration Document filed on 17 March 2021 with the French FinancialMarkets Authority (AMF) and in the annual report (Form 20-F) filed on 18 March 2021 with the U.S. Securities and ExchangeCommission. Forward-looking statements speak only as of the date they are made. Other than as required by law, Orange does notundertake any obligation to update them in light of new information or future developments.
2

3
Section One
Q1 2021 highlights

Q1 21 key achievements
FTTH
5GStrong appetite for 5G smartphones
Highest broadband quarter in Q1 since 2016 with+94K net adds
Europe
Enterprise
> 130m mobile customers
MEA
IT&IS revenues growth at
+6.4% yoy in Q1
France
49.3mconnectable homes
+7.1 % Highest Q1 in past 10 years
4
Driven by Cloud (+5%), Cyberdefense (+16%) & Digital & Data (+11%)
Other European countries revenue growth at
+2.2% yoy in Q1
Base
*Anytime + SOHO/SMEs Insurance customers
Commercial turnaround ongoing, despite fierce competition
Infra
Signing of FiberCopartnership with APG
Creation of Totem on track
Signing of Orange Concessions, partnership with CDC, CNP & EDF Invest
Fiber ARPU is driving growth
Growing customer base, Europe: 1.2m B2C &0.3m B2B* Africa : 0.5m
1.8m fixed BB clients +38%, yoy
FBBbase
Mobile Financial Services

5
yoy : comparison with the same period of the previous year, on a comparable basis unless otherwise specified
All Group level mentions include both telecom and banking activities. Conversely, all mentions excluding Mobile Financial Services are explicitly called “Telecom”
Q1 21 financial achievements
€ 10.3 bn
+0.5% yoy in Q1
Back to growth despite unfavourable comparable basis due to the crisis
Revenue
€ 2.6 bn
-0.3% yoy in Q1
Roaming impact: -42m€ yoy
EBITDAaL
+12.4% yoy in Q1
Increase in line with FY 21 guidance
€ 1.8 bn
eCapex
Stabilisation

6
Section Two
Business review

7
Q1 2021 FranceStrong performance on convergence & fiber
*B2C only
Solid retail services trend
Q1 21
68.6€
Q1 20
68.9€68.8€
+0.2€
DCO
excl. DCO
-58
+29
+125+87
+32
Q3 20Q1 20 Q4 20Q2 20 Q1 21
11.6%11.7%
-155 -177 -265 -283 -291
+192
Q1 20
+238
+95
Q2 20
+388+360
Q3 20 Q4 20
+385
Q1 21
+37 +61
+105 +94
Convergent ARPO growth excl. DCO
+0.2€yoy
Mobile contract customers
19.7m
Municipalities with 5G coverage **
239
BB customers12m
FTTH customers4.9m
51% FTTH
adds* are new customers
+0.1% yoy
Retail revenues excl. digital content offers (DCO)
+1.9% yoyRetail revenues excl. PSTN & DCO
BB B2C cust. on Open convergent offers
54%
*gross adds + migration** >80% of population outdoor coverage
FIXED
MOBILE
CONVERGENCE
Mobile contract net adds excl M2M in ‘000FTTH net adds in ‘000 ADSL and others BB net adds in ‘000
in €m Q1 21 Q1 20 cb yoy cb
Revenues 4,404 4,415 -0.2%
Retail services 2,688 2,692 -0.2%Convergent services* 1,154 1,137 +1.5%
Mobile only services 559 563 -0.7%
Fixed only services 975 993 -1.8%Fixed only broadband 703 678 +3.6%
Fixed only narrowband 272 315 -13.5%Wholesale 1,286 1,319 -2.5%
Equipment sales 269 252 +6.6%Other revenues 162 151 +6.9%
Quaterly churn rate

Q1 2021 EuropeSolid commercial performance. Other European Countries growing +2.2% yoy
Europe, mobile contract net adds ex-M2M (in ‘000s) Europe, Fixed Broadband net adds (in ‘000s)
*B2C only
-129
+221
+317
+64
Q2 20Q1 20 Q3 20 Q1 21Q4 20
-99
Net Adds % convergence in base
31% 33% 67% 67%
% convergence in base
Revenue evolution (in €m)
8
+32+139 +175
+126
-42 -43 -64
+96
Q3 20
-28
+62
-70
Q2 20Q1 20 Q4 20
-8
Q1 21
-10
+147
+62
FTTH Others (xDSL, Cable, Fixed LTE)
25
9
Poland Belgium Luxembourg
2,646
1Q’20
-94
Spain
-3
Romania, Slovakia, Moldova
2,583
Actual1 Q
in €m Q1 21 Q1 20 cb yoy cb
Revenues 2,583 2,646 -2.4%Retail services 1,727 1,808 -4.5%
Convergent services* 666 690 -3.6%Mobile only services 719 772 -6.9%
Fixed only services 265 274 -3.3%
IT & integration services 77 71 +7.7%
Wholesale 454 471 -3.7%
Equipment sales 368 323 +14.2%Other revenues 34 44 -22.9%
Other European Countries growing +2.2%

9
Q1 2021 SpainPositive net adds for the 3rd quarter in a row, despite fierce competition
85% Convergence as % of broadband B2C customer base
84% Fiber penetration in BB customer base
66% 4G penetration in mobile customer base
17% TV penetration in BB customer base
Positive net adds …
Convergence net adds
FBB net adds
FTTH net adds
Mobile contract net adds*
+10k
+1k
+49k
+24k
… with 4.1 points improvement in convergent churn…
… stabilizing FBB customer base while keeping on increasing fiber penetration
80%
Q1 21Q1 20
84%
4,016 4,033
+0.4%
*B2C only
in €m Q1 21 Q1 20 cb yoy cb
Revenues 1,188 1,282 -7.4%Retail services 818 910 -10.2%
Convergent services* 469 517 -9.4%
Mobile only services 231 267 -13.6%Fixed only services 116 124 -6.7%
Wholesale 215 220 -2.3%Equipment sales 155 141 +10.0%
Other revenues 1 11 -95.4%
Q1 21Q1 20
-4.1 pts
* excl. M2M
FTTH
ADSL
(k customers)

Q1 2021 Africa & Middle EastStrong performance confirmed
> 80% of revenue comes from sustainably resilient retail services Revenue cb yoy growth in %
10
36.1m 4G customers
+36% yoy
+22% Data revenue growth Q1 21
1.8m FBB customers
+38% yoy +38% FBB revenue growth Q1 21
+19% Orange Money revenue growth Q1 21
> 40% of 52m Orange Money customers are active *(active customers in millions, yoy growth in %)
>130m mobile customers
Retail services
Total MEA
7.5% 7.8% 7.9%
10.2%
8.5%9.0%
10.5%9.8%
5.1%
5.3%5.8%
7.6%
6.1%
1.3%
7.1%
Q3 19FY 18 Q1 19
6.2%
Q2 19 Q1 20
5.1%
Q4 19
4.7%
Q2 20
7.1%
Q3 20
8.3%
Q4 20 Q1 21 Q3 20Q1 20 Q2 20 Q4 20
18.6
Q1 21
19.620.1
21.9 22.0
+18%
* At least one transaction per month
in €m Q1 21 Q1 20 cb yoy cb
Revenues 1,488 1,389 +7.1%
Retail services 1,301 1,185 +9.8%Mobile only services 1,137 1,047 +8.5%Fixed only services 160 131 +21.8%
IT & integration services 4 6 -31.2%
Wholesale 153 173 -11.3%Equipment sales 24 21 +15.4%
Other revenues 9 10 -6.1%

Q1 2021 EnterpriseOngoing recovery in IT&IS revenues brings back top-line growth
11
-3.3%
-1.2%+0.4%
-15%
5%
0%
-10%
-5%
Q120
+0.8%
Q2 20
-1.7%
Q3 20 Q4 20 Q1 21
Total fixed only mobile IT&IS
IT&IS share in total revenues: 40.3%(vs. 38.1% in Q1 20)
+5% yoy
+16% yoy
Revenue evolution
FY 19 FY 20 Q1 21
37.2%
39.5%40.3%
Evolution of IT&IS in total revenues mix
*Mobile = Mobile Only Services + Equipment Sales
in €m Q1 21 Q1 20 cb yoy cb
Revenues 1,907 1,900 +0.4%Fixed only services 918 953 -3.7%
Voice 288 303 -4.9%
Data 630 650 -3.2%IT & integration services 769 723 +6.4%
Mobile* 220 223 -1.3%

12
Section Three
Guidance

Guidance 2021 confirmed
2021eAfter tax refund
allocation
EBITDAaL, yoy Around +1% Flat -
eCAPEX yoy ~ €7.3 bn € 7.6 -7.7bn
Organic Cash Flow (telecom)*
> €2.6bn > €2.2bn
Net debt / EBITDAaL(telecom)
Around 2x in the medium term Around 2x in the medium term
Dividend €0.70 €0.70
13
2021e before tax refund
allocation

14
Section Four
Q&A

15
Annexes

Convergence, the bedrock of our strategy
16
Convergent B2C customer base in million
Churn improvement with convergence in Q1**
Quarterly convergent ARPO, in €/month in Q1
Number of mobile lines per convergent offer (Q1 yoy growth)
-4pts -4pts -1pt
* Open customers only** Churn differential between convergent B2C customers and total fixed BB B2C customers*** YoY evolution calculated in local currency
5.82
Q3 20
5.84
Q1 21Q1 20 Q2 20 Q4 20
5.80 5.80
5.85
Q1 20 Q1 21
3.01
Q2 20 Q3 20 Q4 20
2.99 2.962.95 3.00
Q4 20Q2 20Q1 20 Q3 20 Q1 21
1.391.41
1.44
1.481.50
France* Spain Poland
54% 85% 66%
% of broadband B2C customer base
2.02+2.9% yoy
1.88-0.3% yoy
1.68+0% yoy
55%
85%
63%
€68.8-0.1% yoy, cb
€53.3-8.4% yoy
€24.1+4.6% yoy***
€ 1.8bnConvergent services revenues in Q1 2021
-0.4% yoy
17
The Group has kept consolidating its European leadership position in FTTH
50.4m
17 *VHBB > 100 Mbps
VHBB* connectable lines
17.8m
Q1 21Q1 20
24.4m
+37%
FTTH connectable lines in France
Q1 20
15.0m
Q1 21
14.5m
+4%
FTTH connectable lines in Spain
Q1 21Q1 20
4.4m
5.2m
+18%
FTTH connectable lines in Poland
49.3m FTTH connectable lines
o/w


