23
1 Orange Polska 1Q’18 results 26 April 2018
1
Orange Polska
1Q’18 results
26 April 2018

2
This presentation contains 'forward-looking statements' including, but not limited to, statements regarding anticipated future events and financial performance with respect to our operations. Forward-looking statements can be identified by the fact that they do not relate strictly to historical or current facts. They often include words like 'believe', 'expect', 'anticipate', 'estimated', 'project', 'plan', 'pro forma', and 'intend' or future or conditional verbs such as 'will', 'would', or 'may‘. Factors that could cause actual results to differ materially from expected results include, but are not limited to, those set forth in our Registration Statement, as filed with the Polish securities and exchange commission, the competitive environment in which we operate, changes in general economic conditions and changes in the Polish, American and/or global financial and/or capital markets. Forward-looking statements represent management’s views as of the date they are made, and we assume no obligation to update any forward-looking statements for actual events occurring after that date. You are cautioned not to place undue reliance on our forward-looking statements.
Evolution of business trends is presented under the old IAS18 accounting standard. The new accounting standard, IFRS15, has been implemented by Orange Polska prospectively i.e. no comparative figures for past years restated to IFRS15 are provided. In the opinion of the Company, such approach assures continuity of performance vis-a-vis the recently announced strategy and already known business trends.
Forward looking statement

3
Adjustments to financial data Disclosures on performance measures, including adjustments, are presented in the Note 2 to Condensed IFRS Quarterly Consolidated Financial Statements of the Orange Polska Group for the 3 months ended 31 March 2018 (available at http://orange-ir.pl/results-center/results/2018)
* relates to EU subsidies for Digital Poland Operational Programme (POPC)
1Q'18 1Q’18 1Q’17
in PLNm IFRS15 IAS18 IAS18
Revenue 2,710 2,766 2,818
0 0 0
Adjusted revenue 2,710 2,766 2,818
EBITDA 674 746 748
0 0 0
Adjusted EBITDA 674 746 748
Capital expenditures 388 388 385
0 0 0
Adjusted capital expenditures 388 388 385
Organic cash flow -155 -155 -254
– Investment grants received/paid to fixed assets suppliers* +3 +3 0
Adjusted organic cash flow -152 -152 -254

4
Contents
1. Highlights
2. Financial review
3. Conclusions
4. Q&A session

5
Highlights
Jean-François Fallacher Chief Executive Officer

6
1Q results on track with full-year plans
PLN 2.77bn revenue (IAS18),
-1.8% yoy
PLN 2.71bn (IFRS15)
PLN 388m capex
14.0% of revenue (IAS18)
PLN -152m adjusted* organic
cash flow
PLN 746m EBITDA (IAS18)
-0.3% yoy
PLN 674m (IFRS15)
27.0% EBITDA
margin (IAS18) +0.5 pp yoy
24.9% (IFRS15)
* adjusted as presented on slide #3
7
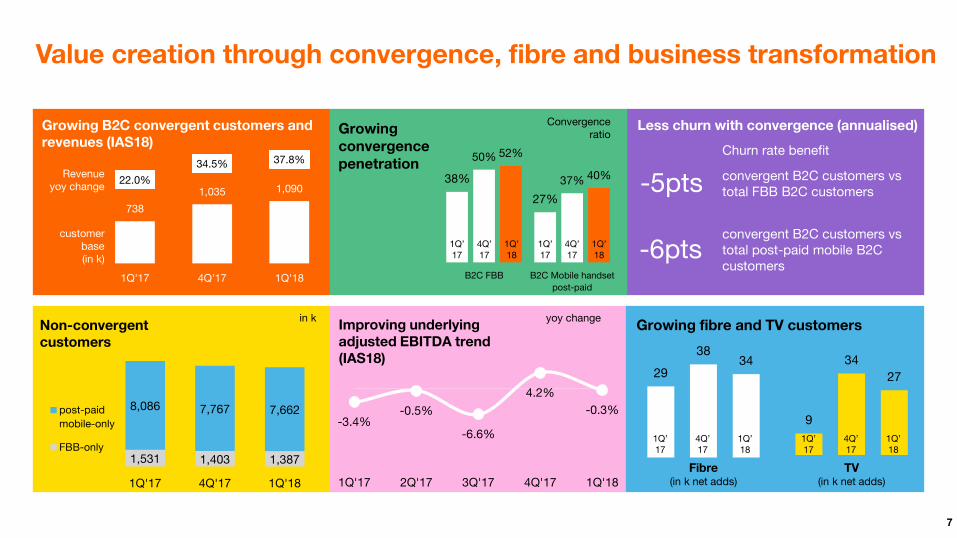
1,531 1,403 1,387
8,086 7,767 7,662
1Q'17 4Q'17 1Q'18
post-paid
mobile-only
FBB-only
Less churn with convergence (annualised)
Improving underlying adjusted EBITDA trend (IAS18)
Growing B2C convergent customers and revenues (IAS18)
customer base (in k)
Non-convergent customers
Value creation through convergence, fibre and business transformation
yoy change
Growing convergence penetration
38%
27%
50%
37%
52%
40%
B2C FBB B2C Mobile handset
post-paid
1Q’17
4Q’17
1Q’18
1Q’17
4Q’17
1Q’18
Convergence ratio
in k
9
34
27
Growing fibre and TV customers
Fibre (in k net adds)
-5pts
Churn rate benefit
-6pts
convergent B2C customers vs total FBB B2C customers
convergent B2C customers vs total post-paid mobile B2C customers
-3.4% -0.5%
-6.6%
4.2%
-0.3%
1Q'17 2Q'17 3Q'17 4Q'17 1Q'18
738
1,035 1,090 22.0%
34.5% 37.8%
1Q'17 4Q'17 1Q'18
Revenue yoy change
29
38 34
TV (in k net adds)
1Q’17
4Q’17
1Q’18
1Q’17
4Q’17
1Q’18
8
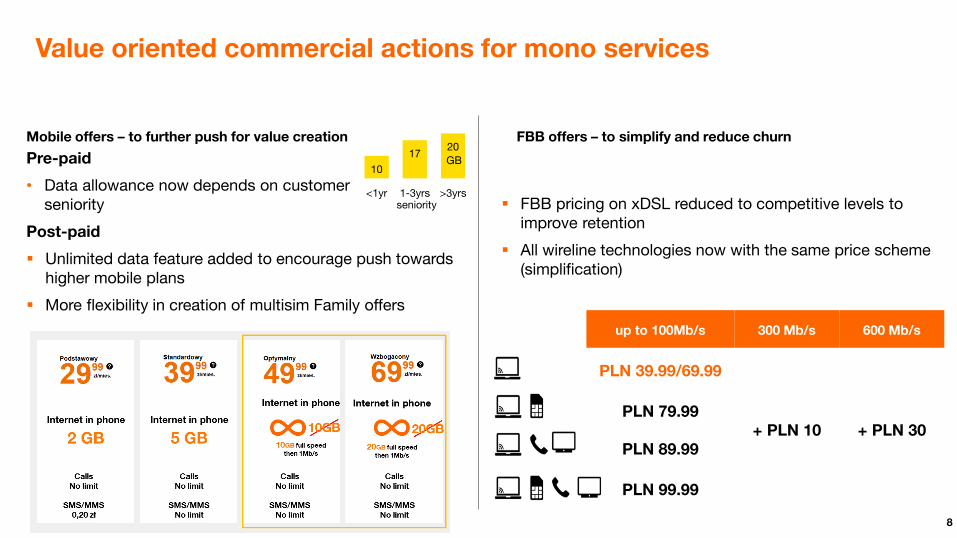
Value oriented commercial actions for mono services
Pre-paid
• Data allowance now depends on customer seniority
Post-paid
Unlimited data feature added to encourage push towards higher mobile plans
More flexibility in creation of multisim Family offers
Mobile offers – to further push for value creation FBB offers – to simplify and reduce churn
FBB pricing on xDSL reduced to competitive levels to improve retention
All wireline technologies now with the same price scheme (simplification)
up to 100Mb/s 300 Mb/s 600 Mb/s
PLN 39.99/69.99
+ PLN 10 + PLN 30 PLN 79.99
PLN 89.99
PLN 99.99
10
17 20
<1yr 1-3yrs >3yrs
GB
seniority
9
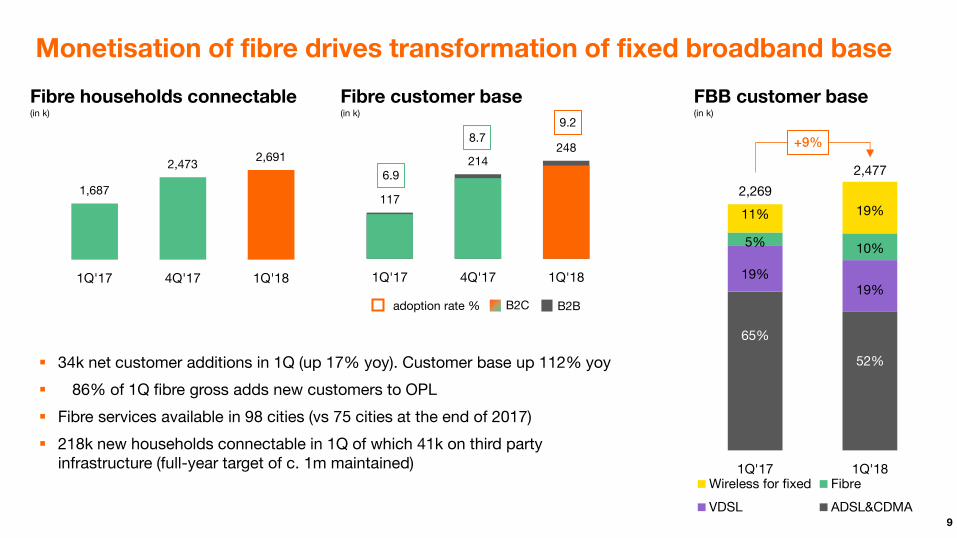
34k net customer additions in 1Q (up 17% yoy). Customer base up 112% yoy
86% of 1Q fibre gross adds new customers to OPL
Fibre services available in 98 cities (vs 75 cities at the end of 2017)
218k new households connectable in 1Q of which 41k on third party infrastructure (full-year target of c. 1m maintained)
117
214 248
1Q'17 4Q'17 1Q'18
Fibre households connectable (in k)
1,687
2,473 2,691
1Q'17 4Q'17 1Q'18
Monetisation of fibre drives transformation of fixed broadband base
Fibre customer base (in k)
adoption rate %
6.9
8.7
9.2
B2C B2B
FBB customer base (in k)
1Q'17 1Q'18Wireless for fixed Fibre
VDSL ADSL&CDMA
2,477
2,269
+9%
52%
65%
19% 19%
11% 19%
10% 5%

10
Financial review
Maciej Nowohoński Chief Financial Officer

11
1Q revenues supported by convergence and wholesale
0.5%
-2.2% -1.3%
-2.4% -1.8%
1Q'17 2Q'17 3Q'17 4Q'17 1Q'18
Revenue evolution yoy change (IAS18)
Revenue evolution breakdown in PLNm
1Q’17 (IAS18)
Narrowband only
Convergent services
B2C
Mobile & fixed BB
only service
Equipment sales
IT and integration
services
1Q’18 (IAS18)
1Q’18 (IFRS15)
IFRS15 impact
Wholesale Other revenues
-46 +88
-159
+6 +20
+67 -28
-56 2,710
2,766
2,818
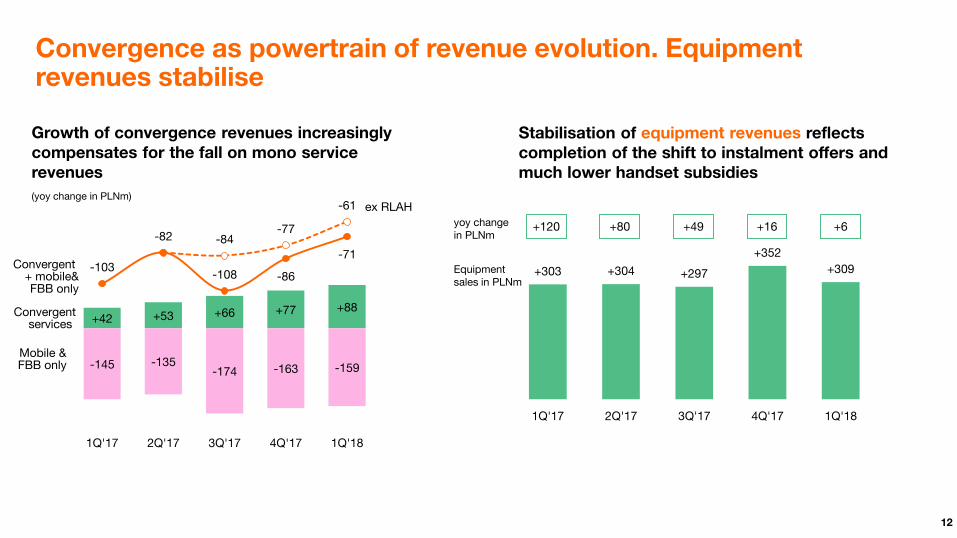
• Convergence revenues increasingly compensates fall of mono services
• Mono services decline reflects migration to convergence and churn
• Wholesale revenues supported by national roaming contract with Play
12
Convergence as powertrain of revenue evolution. Equipment revenues stabilise
+42 +53 +66 +77 +88
-145 -135 -174 -163 -159
-103
-82
-108 -86
-71
-84 -77
-61
1Q'17 2Q'17 3Q'17 4Q'17 1Q'18
Growth of convergence revenues increasingly compensates for the fall on mono service revenues
(yoy change in PLNm)
Convergent services
Mobile & FBB only
Convergent + mobile& FBB only
Stabilisation of equipment revenues reflects completion of the shift to instalment offers and much lower handset subsidies
+303 +304 +297
+352
+309
1Q'17 2Q'17 3Q'17 4Q'17 1Q'18
ex RLAH
+120 +80 +49 +16 +6
Equipment sales in PLNm
yoy change in PLNm
13
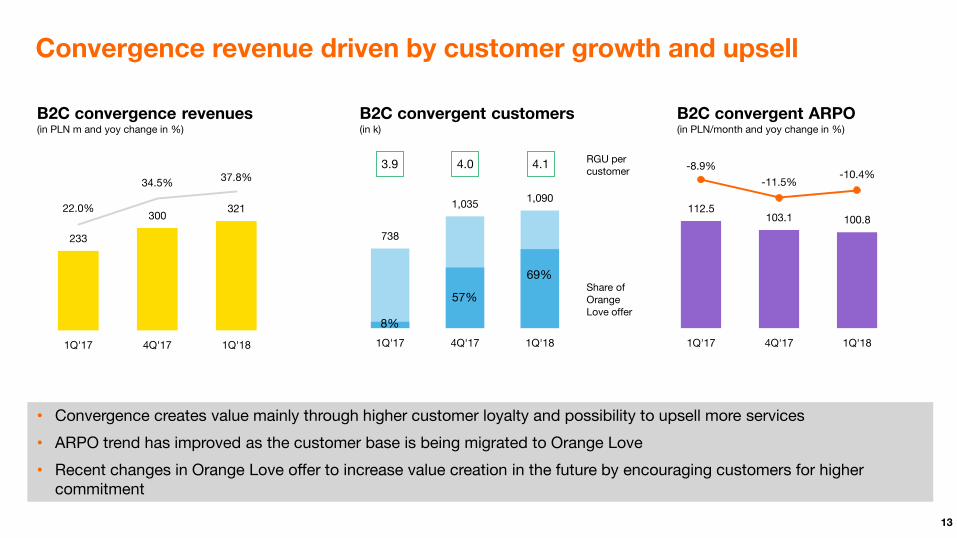
Convergence revenue driven by customer growth and upsell
B2C convergent ARPO (in PLN/month and yoy change in %)
• Convergence creates value mainly through higher customer loyalty and possibility to upsell more services
• ARPO trend has improved as the customer base is being migrated to Orange Love
• Recent changes in Orange Love offer to increase value creation in the future by encouraging customers for higher commitment
738
1,035 1,090
1Q'17 4Q'17 1Q'18
B2C convergence revenues (in PLN m and yoy change in %)
B2C convergent customers (in k)
112.5 103.1 100.8
-8.9%
-11.5% -10.4%
1Q'17 4Q'17 1Q'18
233
300 321 22.0%
34.5% 37.8%
1Q'17 4Q'17 1Q'18
8%
57%
69%
3.9 4.0 4.1 RGU per customer
Share of Orange Love offer

14
Mobile-only and broadband-only customers migrate to convergence
• Growing migration to convergence
• Value focus in tariff pricing
• Strong market competition
• Recent changes in mono offers to enable more effective retention and to increase value creation
• Mobile-only ARPO trend improves and reflects shift to multisim offers and price competition
• Fixed broadband-only ARPO improves mainly due to fibre and lower decline in B2B 32.8 30.3 29.2
-14.1% -11.4% -11.0%
1Q'17 4Q'17 1Q'18
Post-paid mobile-only retail ARPO (PLN/month and yoy % change)
yoy
5.8 4.7 4.6
8.1 7.7 7.7
1.4 2.0 2.1
1Q'17 4Q'17 1Q'18
B2C
convergent
postpaid
mobile only
prepaid
Mobile customer base (in millions)
15.3 14.4 14.4
share of post-paid
62% 67% 68%
total
FBB customer base (in k)
1,531 1,403 1,387
738 1,035 1,090
1Q'17 4Q'17 1Q'18
B2C
convergent
FBB only
2,269 2,477 2,438
total
FBB-only ARPO (in PLN/month and yoy % change)
58.0 56.6 56.6
-4.8% -4.7%
-2.4%
1Q'17 4Q'17 1Q'18
yoy

15
Direct margin:
Continued low subsidy policy resulted in much lower commercial costs
Renegotiations of wholesale rates helped to contain negative impact of RLAH
Indirect costs:
Lower labour costs reflect start of implementation of new Social Plan
Ongoing transformation of business areas (IT, Network, property expenses, general expenses)
15.8 14.7
1Q'17 1Q'18
1Q EBITDA stable year-on-year in line with full-year expectations (under IAS18)
EBITDA evolution (yoy change in PLNm)
employment down 7.0% yoy (in kFTE end of period)
1Q’17 (IAS18)
1Q’18 (IAS18)
+54 indirect costs
Legacy services
direct margin
24.9% 26.5% margin
748
674 Growth services
direct margin
746
1Q’18 (IFRS15)
IFRS15 impact
-72
27.0%
-56 direct margin
PLN -15m of RLAH impact

16
Net income reflects slightly higher net financial costs (under IAS18)
in PLNm 1Q'18 IFRS15
1Q’18 IAS18
1Q’17 IAS18
Change (IAS18)
reported EBITDA 674 746 748 -2
depreciation and amortization -641 -641 -639 -2
impairment of non-current assets
0 0 0 0
reported operating income 33 105 109 -4
net financial costs -86 -86 -71 -15
income tax 3 -11 1 -12
reported net profit/loss -50 8 39 -31
Higher net financial costs reflects strengthening of PLN to EUR in 1Q17 positively impacting discount expense (mainly related to UMTS licence)
17
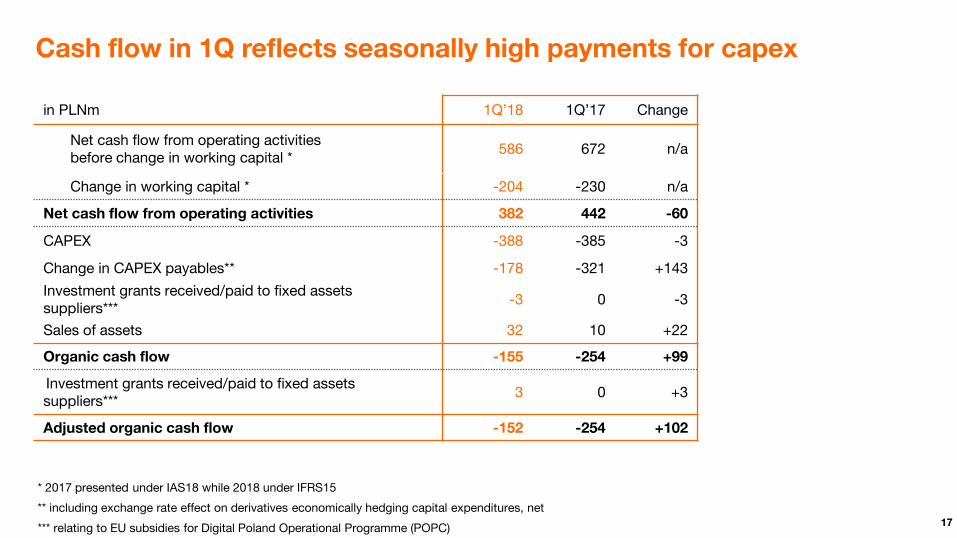
Cash flow in 1Q reflects seasonally high payments for capex
in PLNm 1Q’18 1Q’17 Change
Net cash flow from operating activities before change in working capital *
586 672 n/a
Change in working capital * -204 -230 n/a
Net cash flow from operating activities 382 442 -60
CAPEX -388 -385 -3
Change in CAPEX payables** -178 -321 +143
Investment grants received/paid to fixed assets suppliers***
-3 0 -3
Sales of assets 32 10 +22
Organic cash flow -155 -254 +99
Investment grants received/paid to fixed assets suppliers***
3 0 +3
Adjusted organic cash flow -152 -254 +102
* 2017 presented under IAS18 while 2018 under IFRS15
** including exchange rate effect on derivatives economically hedging capital expenditures, net
*** relating to EU subsidies for Digital Poland Operational Programme (POPC)

18
Conclusions
Jean-François Fallacher Chief Executive Officer
19
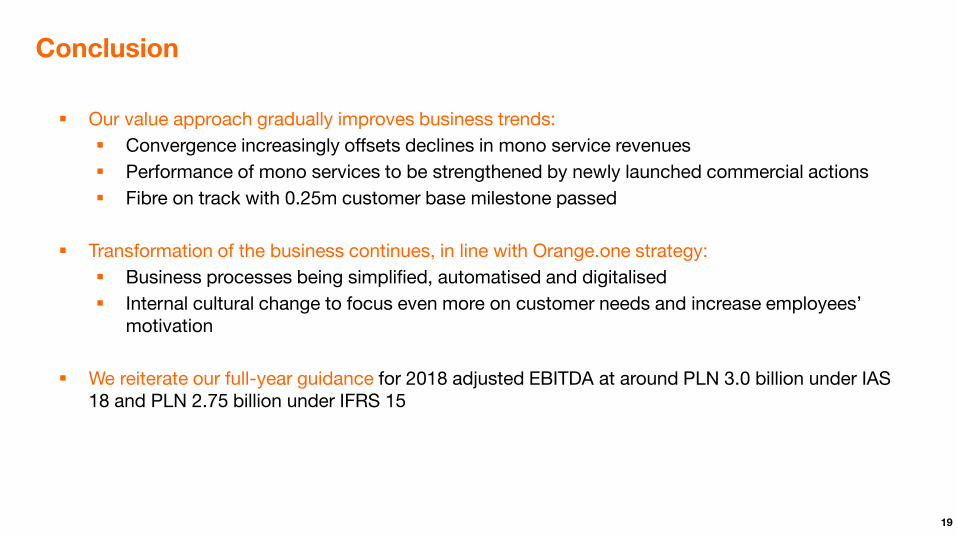
Conclusion
Our value approach gradually improves business trends:
Convergence increasingly offsets declines in mono service revenues
Performance of mono services to be strengthened by newly launched commercial actions
Fibre on track with 0.25m customer base milestone passed
Transformation of the business continues, in line with Orange.one strategy:
Business processes being simplified, automatised and digitalised
Internal cultural change to focus even more on customer needs and increase employees’ motivation
We reiterate our full-year guidance for 2018 adjusted EBITDA at around PLN 3.0 billion under IAS 18 and PLN 2.75 billion under IFRS 15

20
Q&A

21
Orange Polska published 2017 Integrated Report available at: http://orange-ir.pl/sites/default/files/ Orange_Polska_Integrated_Raport_2017.pdf

22
Glossary (1/2)
3P customer a customer who purchased a bundle of fixed broadband, TV and VoIP services
4G fourth generation of mobile technology, sometimes called LTE (Long Term Evolution)
ARPO Average Revenue per Offer
CDMA Code Division Multiple Access, second generation wireless mobile network used also as a wireless local loop for locations where cable access is not economically justified
data user a customer who used mobile data transmission in a given month
EBITDA Operating income + depreciation and amortization + impairment of goodwill + impairment of non-current assets
FBB Fixed Broadband
Fibre access network project
rollout of fixed broadband access network based on fibre technology which provides the end user with speed of above 100Mbps
FTE Full time equivalent
Fibre fixed broadband access network based on FTTH(Fibre To The Home ) /DLA (Drop Line Agnostic) technology which provides the end user with speed of above 100Mbps
GB Gigabyte
Households (HH) connectable in fibre technology
Households where broadband access service based on fibre technology can be rendered
ICT Information and Communication Technologies
23
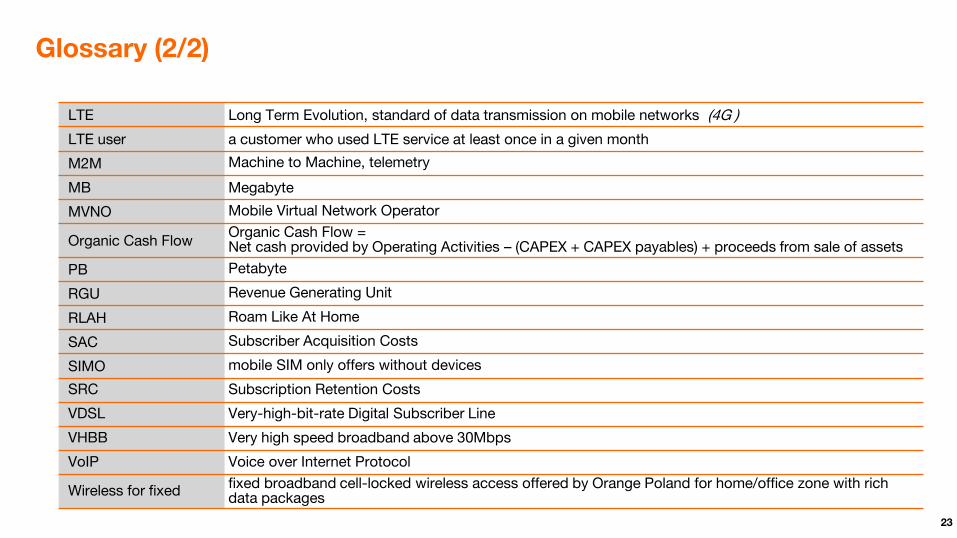
Glossary (2/2)
LTE Long Term Evolution, standard of data transmission on mobile networks (4G )
LTE user a customer who used LTE service at least once in a given month
M2M Machine to Machine, telemetry
MB Megabyte
MVNO Mobile Virtual Network Operator
Organic Cash Flow Organic Cash Flow = Net cash provided by Operating Activities – (CAPEX + CAPEX payables) + proceeds from sale of assets
PB Petabyte
RGU Revenue Generating Unit
RLAH Roam Like At Home
SAC Subscriber Acquisition Costs
SIMO mobile SIM only offers without devices
SRC Subscription Retention Costs
VDSL Very-high-bit-rate Digital Subscriber Line
VHBB Very high speed broadband above 30Mbps
VoIP Voice over Internet Protocol
Wireless for fixed fixed broadband cell-locked wireless access offered by Orange Poland for home/office zone with rich data packages


