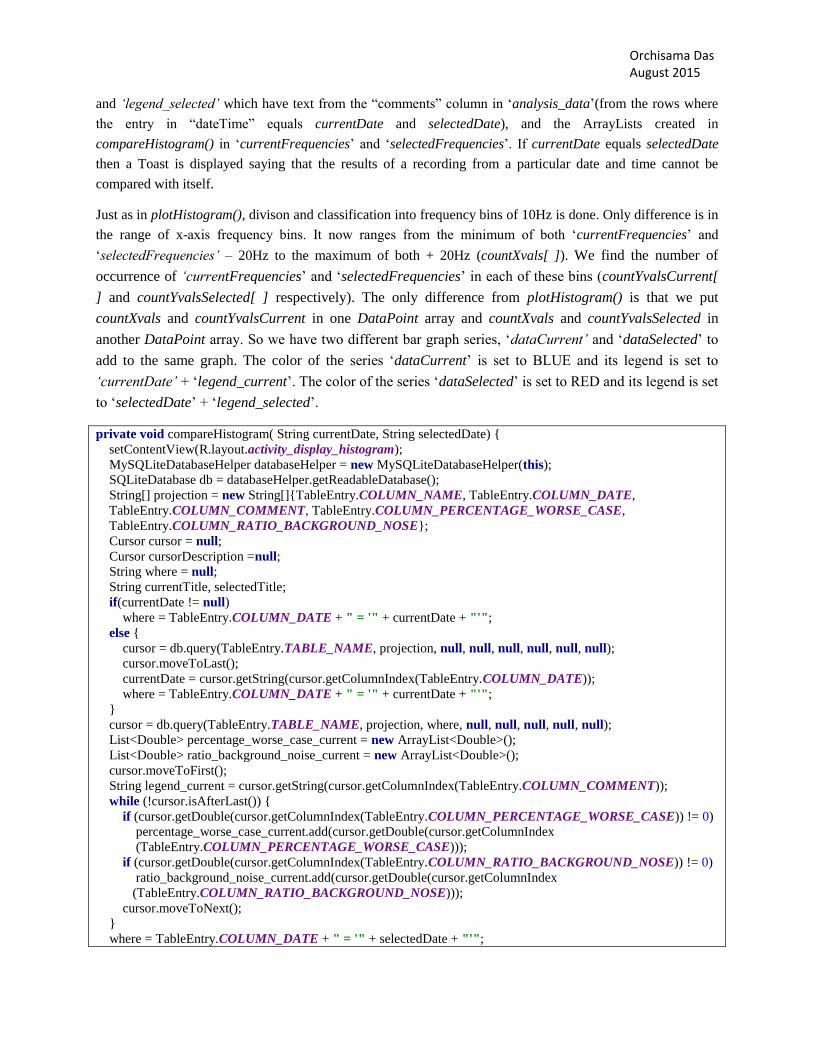
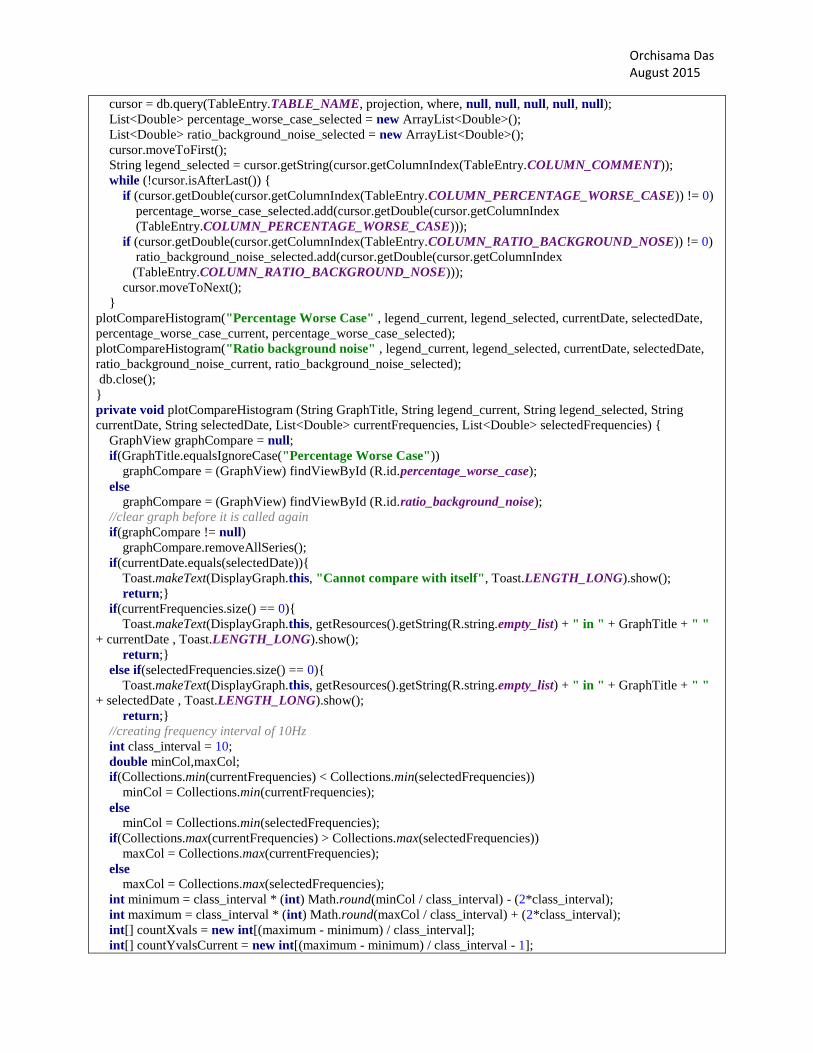
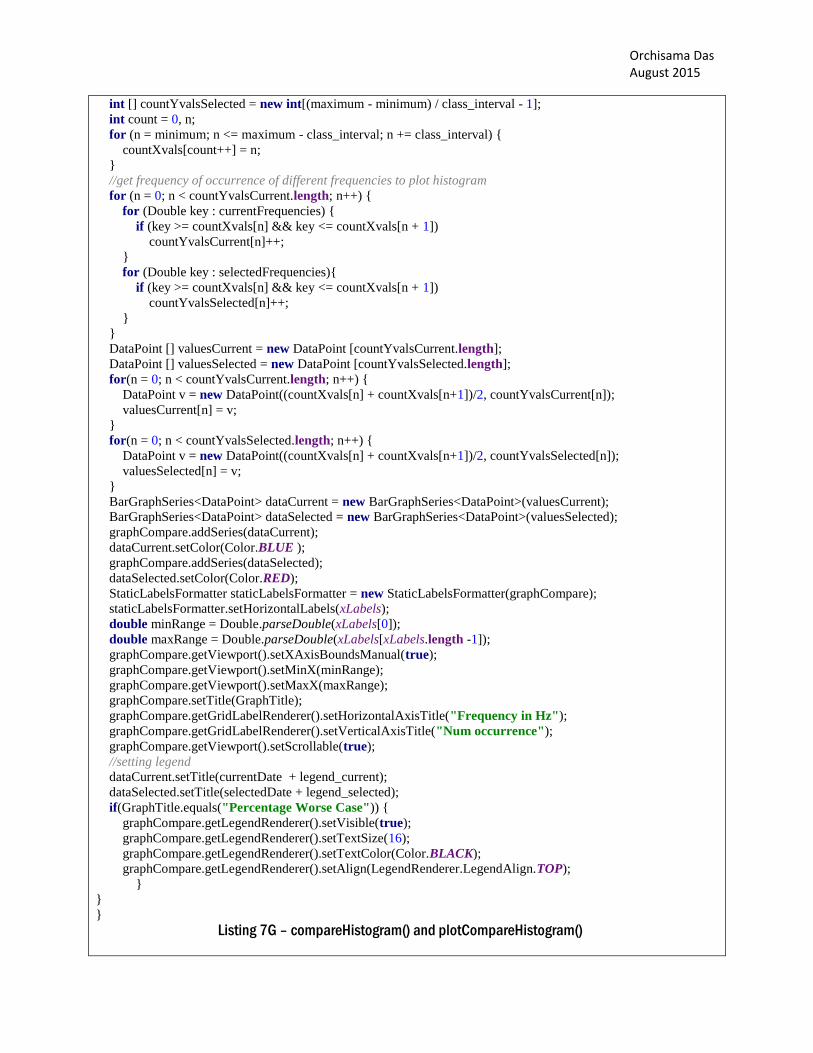
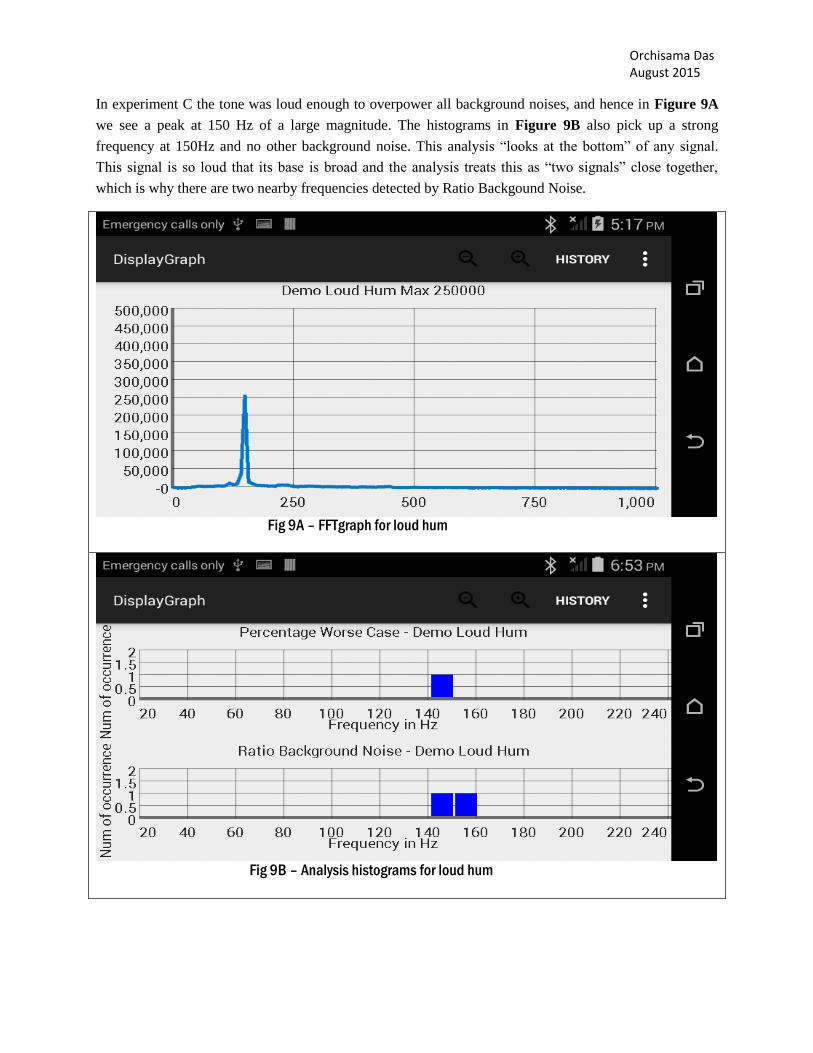
Page 1
Orchisama Das August 2015
INTERNSHIP REPORT
DEVELOPMENT OF AN ANDROID APPLICATION TO CAPTURE AND ANALYSE THE COMMUNITY NOISE
PROBLEM, THE “RANCHLANDS’ HUM”
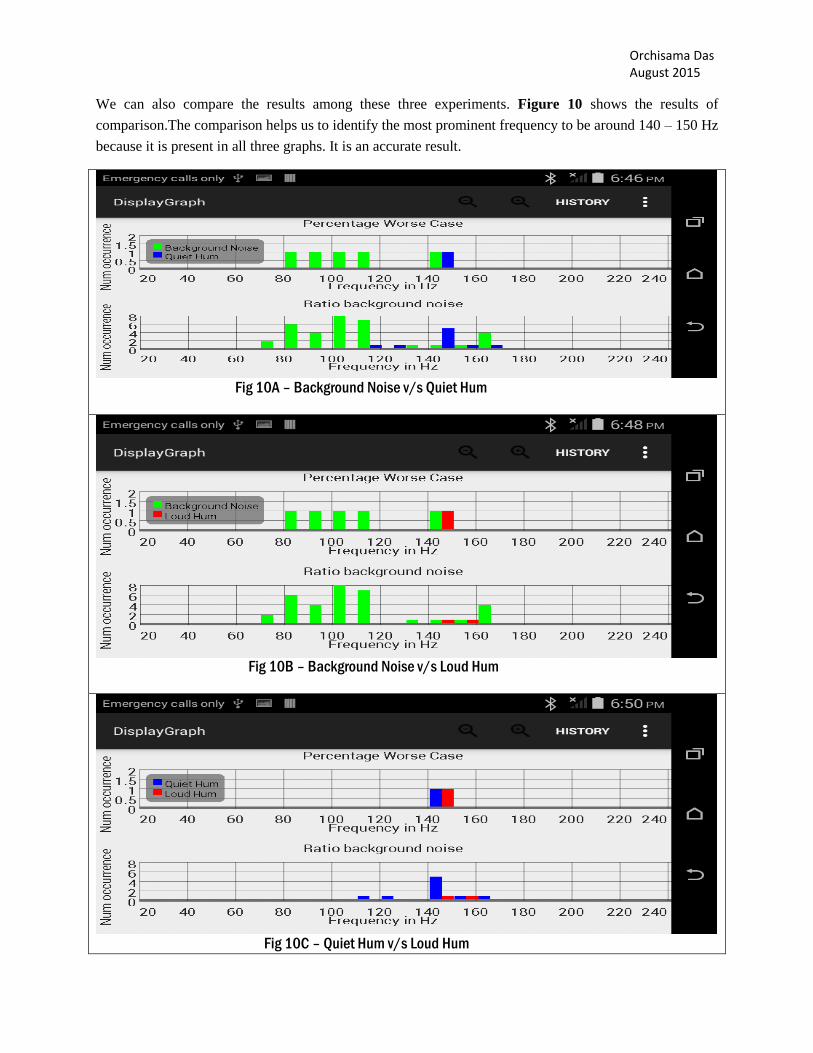
BY – ORCHISAMA DAS, RESEARCH INTERN, BACHELOR OF ENGINEERING IN INSTRUMENTATION AND ELECTRONICS, JADAVPUR UNIVERSITY,
INDIA.
SUPERVISOR – DR. MIKE SMITH, PROFESSOR, ELECTRICAL AND COMPUTER ENGINEERING, SCHULICH SCHOOL OF ENGINEERING,
UNIVERSITY OF CALGARY, CANADA.
Page 2
Orchisama Das August 2015
INTRODUCTION - WHAT IS THE HUM?
The Hum is a worldwide phenomenon associated with widespread reports of a sporadic, low frequency
noise, which is very often labelled as disturbing. It can cause sleeplessness, depression and vibro –
acoustic diseases in humans [1]. Hums have been reported in various parts of the world such as Bristol,
UK and Taos, Mexico [2]. Rarely has the source of a hum been detected. An exception was in Windsor,
Ontario where the source was traced to a steelworks on the industrial zone of Zug Island. Other possible
causes of the hum are - mechanical devices from industries, vibrations of the earth and resonance of the
piping system in our homes.
In 2008, residents in Calgary, Canada started complaining about a low frequency noise around 40Hz,
which came to be known as the ―Ranchlands‘ Hum‖. The nuisance was described by one resident as
sounding like the Gsharp note on the piano that is three octaves below Middle C, approximately 46Hz. It
could have an intensity that ranged from ‗barely audible‘ to ‗conversation stopping‘ on different
occasions. The mystery behind this Hum is still unsolved. Dr. Smith‘s team has been working on
detecting its source since 2009, assisted by an acoustics firm called Patching Associates Acoustical
Engineering Ltd.
.
WHY AN ANDROID APP?
Patching Associates was lending some very high-end, expensive industrial equipment to residents in
Calgary to allow them to record the hum. However, they only had a limited number of equipment, and
distributing them to a large number of homes in Calgary was not feasible. Developing a cell phone
application to capture this data seemed to be the cheapest and best option because everybody has access
to a smart-phone. The lowest frequency sound that can be recorded with a cell phone microphone is
questionable. Hence, we could attach external microphones into our phone‘s earphone jack to pick up low
frequency noise.
In [1], Smith et.al describe a few acoustical metrics which can be easily run on cell phones with low
computational power. It enables users to identify the key frequencies present in the Hum, which tells us
whether there are multiple sources of the Hum. A network of cell-phones can be distributed across the
community and used as a ―sound-source locator‖. Future plans also include setting up a cloud storage
online and uploading data to it from our cell phone app. Features that are currently present and that can be
added to the app in future are given in [3]. Noise cancellation using home-theater systems to generate an
opposite phase signal which will cancel out the hum on superposition is another project Dr. Smith is
working on.
Page 3
Orchisama Das August 2015
THE ‘SOUND RECORDING AND ANALYSIS’ APPLICATION
VERSION 1 FEATURES
The application was initially developed by Adrien Gaspard, Mike Smith and Nicolas Lepine. A key
feature of this application is the ability to capture and playback sound, so that the user knows that he is
not imagining the Hum, but it actually exists. They went on to do some signal processing with the
recorded signal, such as computing its Fourier Transform by doing an FFT to find out which frequencies
are present in the signal. Adrien used the GraphView library to plot the time domain and frequency
domain information of the captured sound signal. This version of the app is to be released soon. All the
code and explanation required to build this app on your cell phone is listed in five parts in Circuit Cellar
Magazine Articles [4] to be released over the months of July to November, 2015.
This version does the bare minimum to give us information about the recorded noise. However, some
desired features are missing, the most important being the ability to store data, so that one can compare
between two different recordings. The Hum frequency may be changing with time, and this feature is
absolutely necessary to track all its changing signal content. Another disadvantage of this version is that
it is slow. While dealing with GBs of recorded data, this becomes an undesirable feature. These issues are
taken care of in version 2.
VERSION 2 FEATURES
This version has been developed by myself, Dr. Smith and Adrien Gaspard. It handles the issues of speed
and storage associated with the previous version by storing all the data in a SQLite database [5]. SQLite is
the most widely deployed software library to implement databases on Android. SQLite also has the
advantage of being embedded into every Android device, meaning that no setup procedure is required. A
short tutorial on working with SQLite in android can be found in [6]. The database stores data
permanently. It will not be lost if the application is closed or if it crashes. It also makes data management
faster. The last version was slow because we were passing all the data we wanted to plot in our graphs
using an array. In this version, we just read it from the database, and the speed improves significantly.
Having our data in a database also allows us to go back and look at a recording from any day, and
compare it with other recordings. We allow the user to look at the results of any captured sound from a
list of all captured sounds, and compare it with others.
We do some more signal processing with the data. We implement the acoustical metrics defined in [1] to
identify the strongest frequencies in the signal after doing its FFT. The strongest peaks in the signal are
termed as Percentage Worse Case frequencies. These signals stand out from the background noise. Ratio
Page 4
Orchisama Das August 2015
Background Noise frequencies contains the frequencies which were overshadowed by the presence of a
higher level of background noise, say during daytime. We then plot histograms of these metrics to find
out which frequency occurs the most (likely to be the Hum frequency) using the same GraphView library.
The code for calculating the metrics, plotting histograms, and building the UI is explained in the
upcoming sections.
WORKING WITH ANDROID STUDIO
The IDE we have worked with for developing this app is Android Studio. Android Studio is the new
official IDE for Android. Version 1 was developed in Eclipse. However, the Application Programming
Interface (APIs) released in future will not be available for Eclipse. To get the latest updates, one must
switch to Android Studio.
Android Studio needs to be downloaded from https://developer.android.com/intl/ko/sdk/index.html#top .
Once the .exe file for your windows system (32 bit or 64 bit) has finished dowloading, click on it to run it.
In case you don‘t have Java Development Kit (JDK) on your computer, you will be asked to download
jdk-7u75-windows-i586.exe (win32)/ jdk-7u75-windows-x64.exe (win64) from
https://oracle.com/technetwork/java/javase/downloads/jdk7-downloads-1880260.html. Download and run
it to install the latest version of JDK. Then proceed to install Android Studio.
After installation has finished, you may be prompted to ―Start a New Android Project‖. Double click on
it, a ―configure your new project‖ window appears. You are required to give the application a name, let‘s
call it ‗Sound_Record_Analyse‘. Click on ―Next‖, a ―Target Android Devices‖ window appears. Leave
the parameters as they are by default, which is the box ―Phone and Tablet‖ checked, with a minimum
SDK of ―API 15: Android 4.0.3 (IceCreamSandwich). Click on ―Next‖ and when offered to ―Add an
activity to Mobile, select ―Blank Activity‖ and click on ―Next‖. Customize the Activity by giving the
Activity Name the name ―MainActivity‖, the layout Name ―activity_main‖, the title ―MainActivity‖ and
the Menu Resource Name ―menu_main‖. You can finally press ―Finish‖.
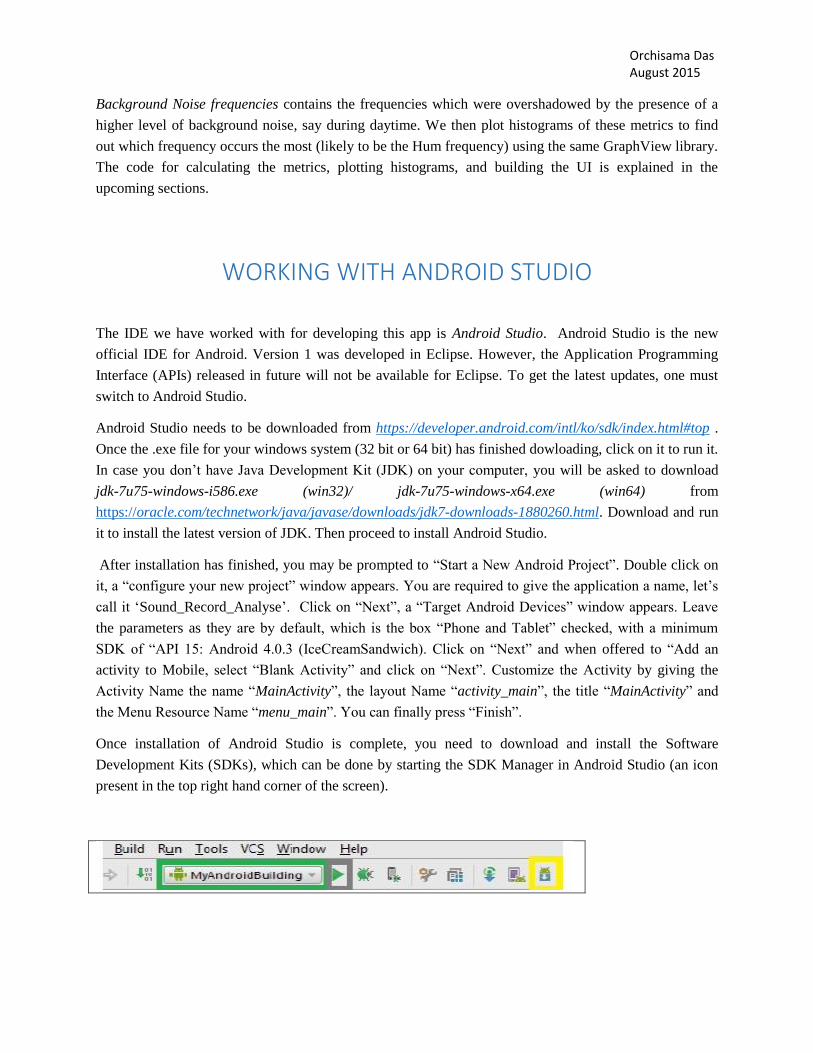
Once installation of Android Studio is complete, you need to download and install the Software
Development Kits (SDKs), which can be done by starting the SDK Manager in Android Studio (an icon
present in the top right hand corner of the screen).
Page 5
Orchisama Das August 2015
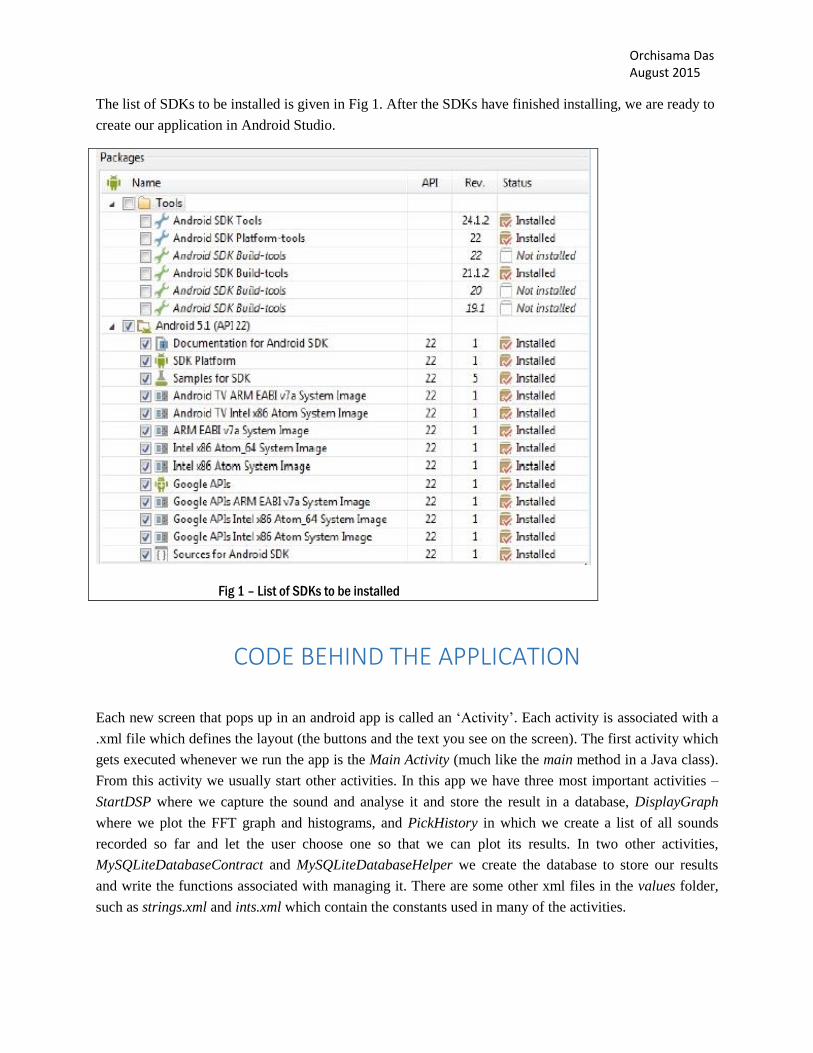
The list of SDKs to be installed is given in Fig 1. After the SDKs have finished installing, we are ready to
create our application in Android Studio.
Fig 1 – List of SDKs to be installed
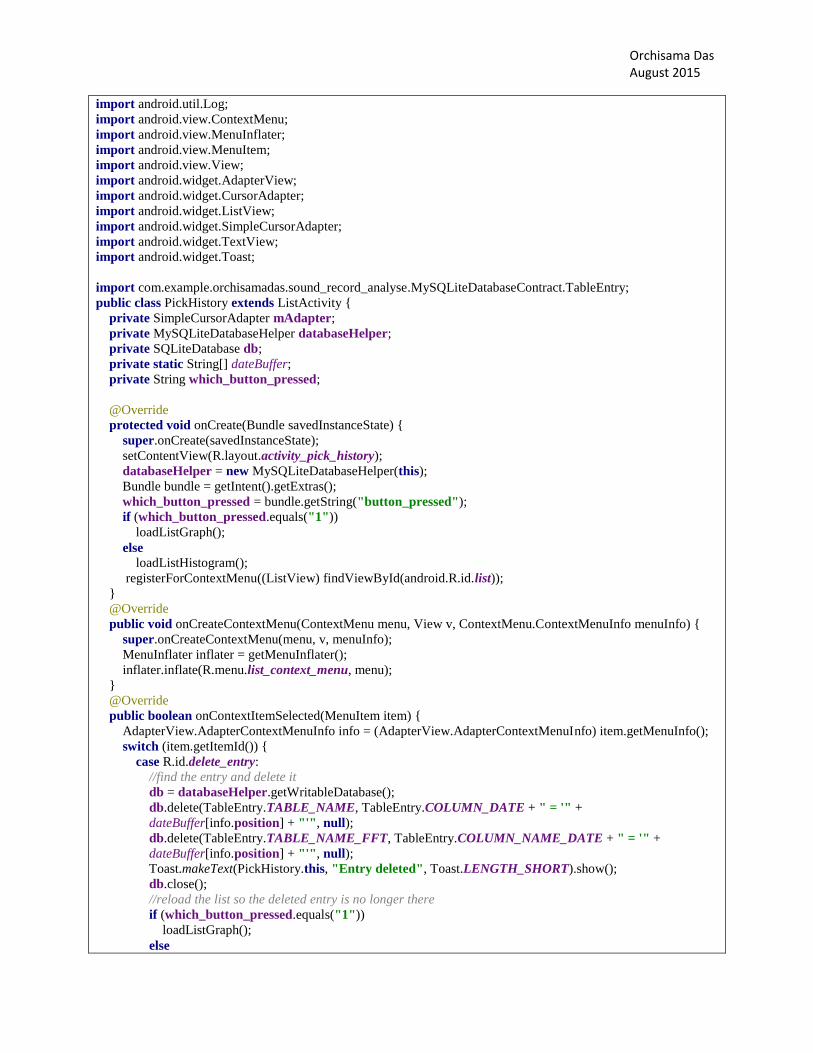
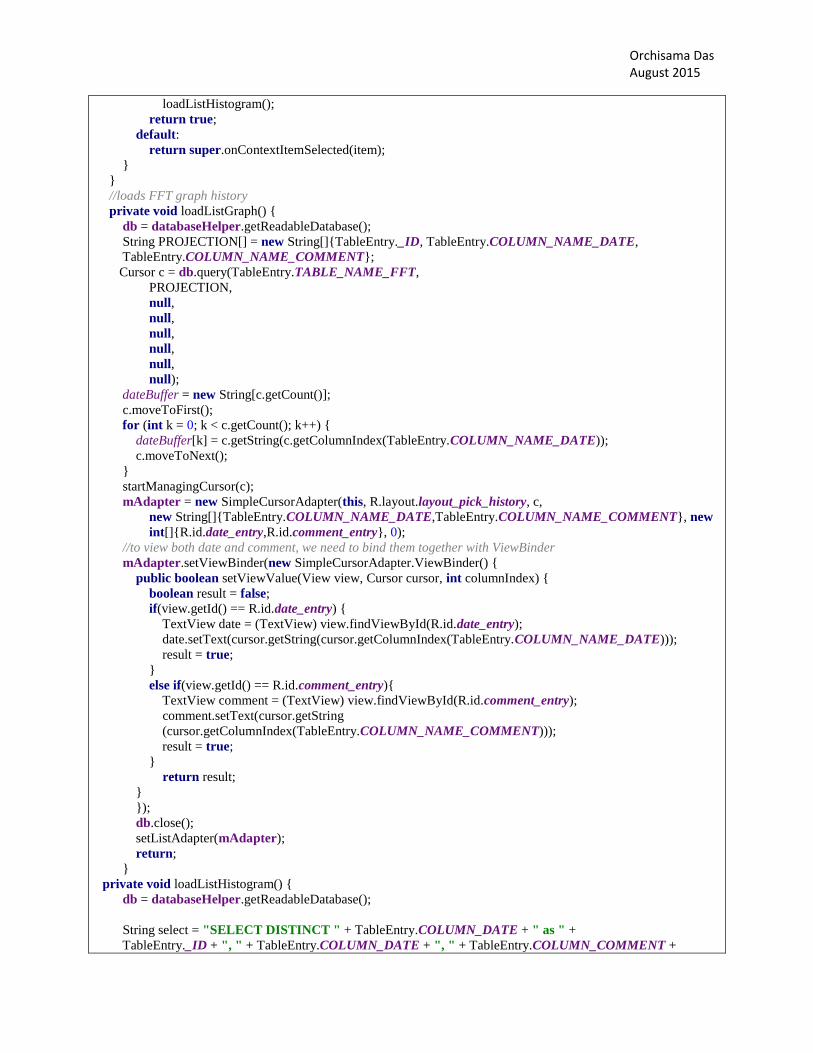
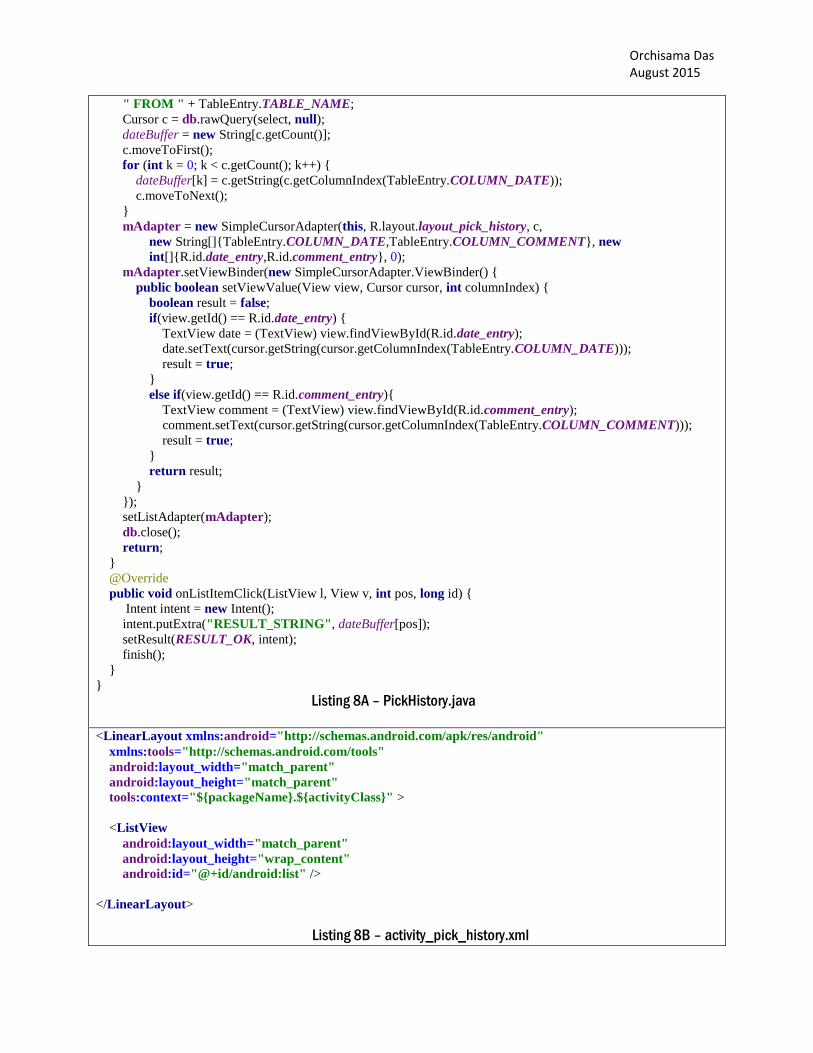
CODE BEHIND THE APPLICATION
Each new screen that pops up in an android app is called an ‗Activity‘. Each activity is associated with a
.xml file which defines the layout (the buttons and the text you see on the screen). The first activity which
gets executed whenever we run the app is the Main Activity (much like the main method in a Java class).
From this activity we usually start other activities. In this app we have three most important activities –
StartDSP where we capture the sound and analyse it and store the result in a database, DisplayGraph
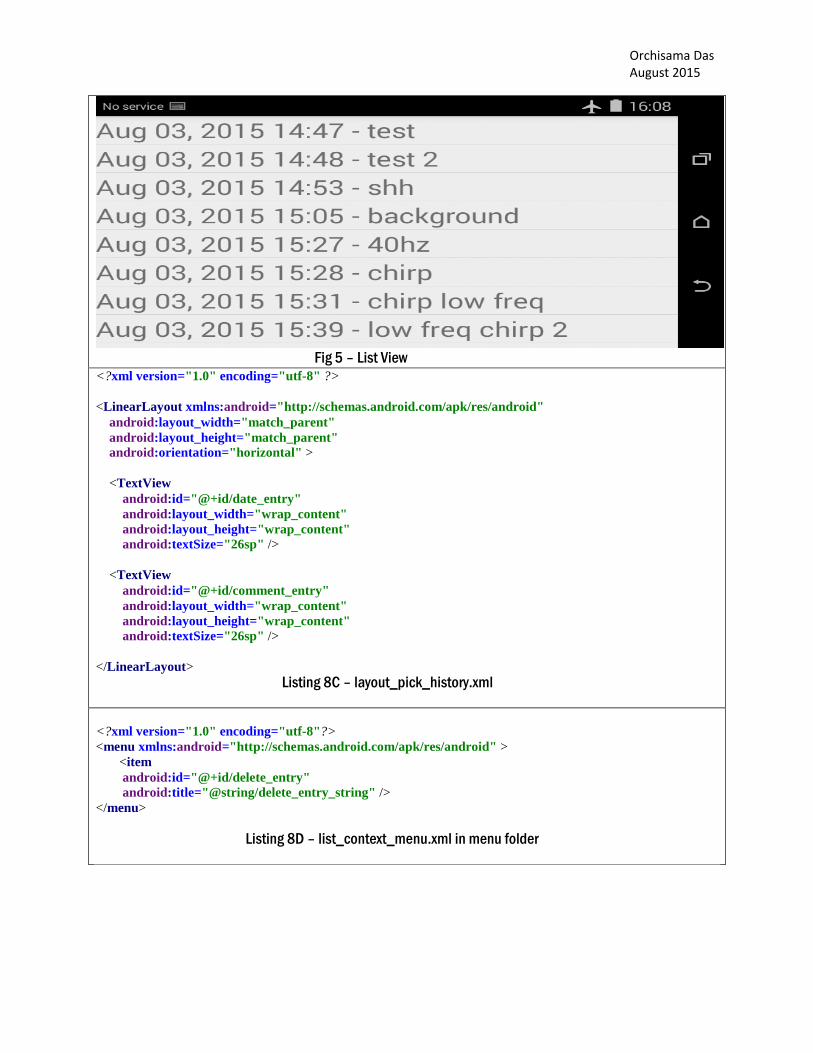
where we plot the FFT graph and histograms, and PickHistory in which we create a list of all sounds
recorded so far and let the user choose one so that we can plot its results. In two other activities,
MySQLiteDatabaseContract and MySQLiteDatabaseHelper we create the database to store our results
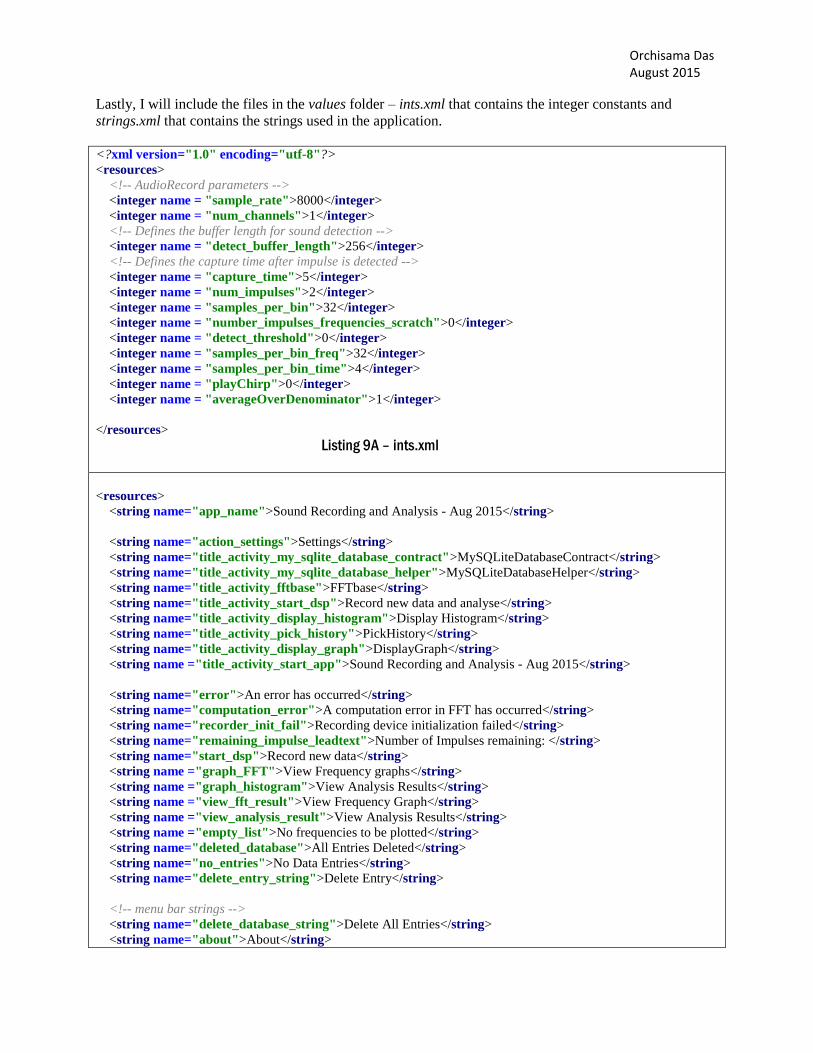
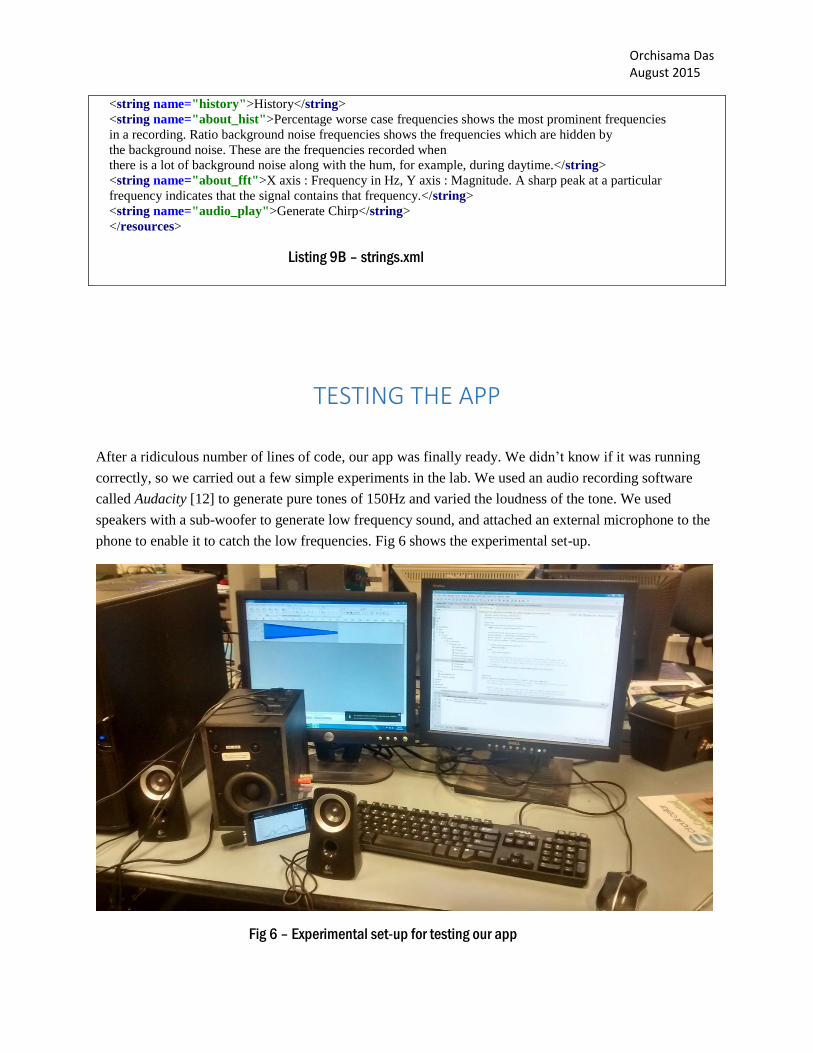
and write the functions associated with managing it. There are some other xml files in the values folder,
such as strings.xml and ints.xml which contain the constants used in many of the activities.
Page 6
Orchisama Das August 2015
GOING THROUGH ALL THE ACTIVITIES ONE BY ONE
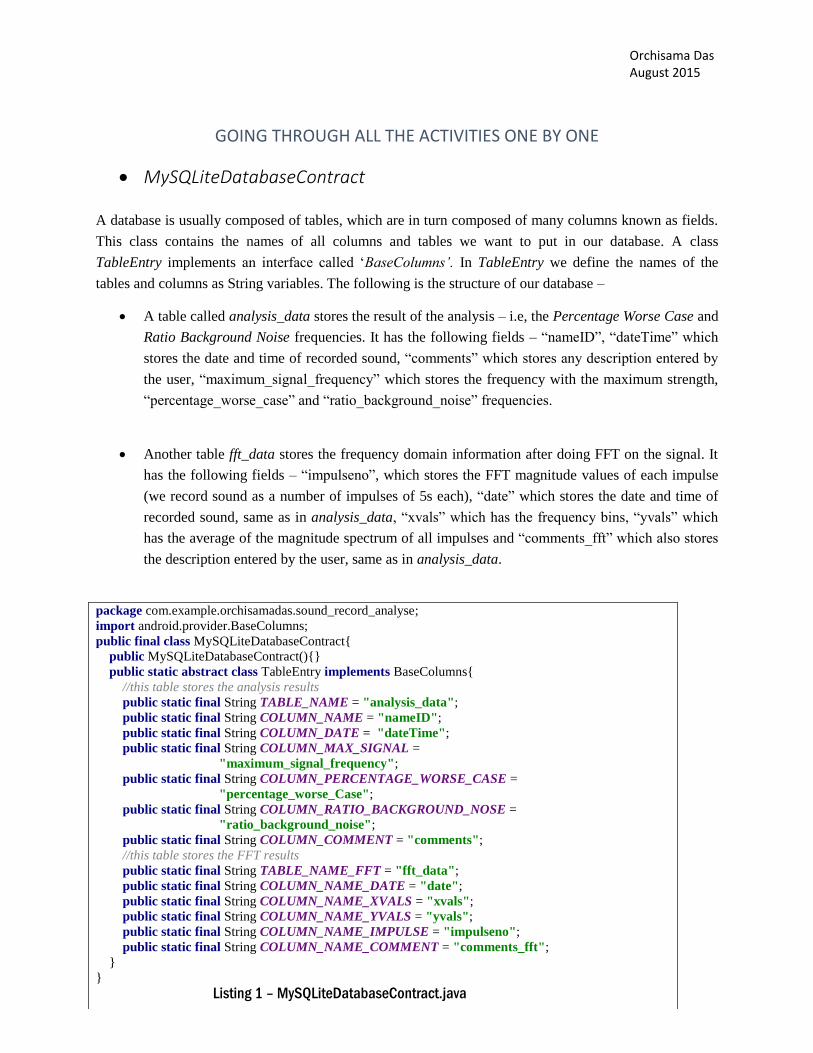
MySQLiteDatabaseContract A database is usually composed of tables, which are in turn composed of many columns known as fields.
This class contains the names of all columns and tables we want to put in our database. A class
TableEntry implements an interface called ‗BaseColumns‟. In TableEntry we define the names of the
tables and columns as String variables. The following is the structure of our database –
A table called analysis_data stores the result of the analysis – i.e, the Percentage Worse Case and
Ratio Background Noise frequencies. It has the following fields – ―nameID‖, ―dateTime‖ which
stores the date and time of recorded sound, ―comments‖ which stores any description entered by
the user, ―maximum_signal_frequency‖ which stores the frequency with the maximum strength,
―percentage_worse_case‖ and ―ratio_background_noise‖ frequencies.
Another table fft_data stores the frequency domain information after doing FFT on the signal. It
has the following fields – ―impulseno‖, which stores the FFT magnitude values of each impulse
(we record sound as a number of impulses of 5s each), ―date‖ which stores the date and time of
recorded sound, same as in analysis_data, ―xvals‖ which has the frequency bins, ―yvals‖ which
has the average of the magnitude spectrum of all impulses and ―comments_fft‖ which also stores
the description entered by the user, same as in analysis_data.
package com.example.orchisamadas.sound_record_analyse;
import android.provider.BaseColumns;
public final class MySQLiteDatabaseContract{
public MySQLiteDatabaseContract(){}
public static abstract class TableEntry implements BaseColumns{
//this table stores the analysis results
public static final String TABLE_NAME = "analysis_data";
public static final String COLUMN_NAME = "nameID";
public static final String COLUMN_DATE = "dateTime";
public static final String COLUMN_MAX_SIGNAL =
"maximum_signal_frequency";
public static final String COLUMN_PERCENTAGE_WORSE_CASE =
"percentage_worse_Case";
public static final String COLUMN_RATIO_BACKGROUND_NOSE =
"ratio_background_noise";
public static final String COLUMN_COMMENT = "comments";
//this table stores the FFT results
public static final String TABLE_NAME_FFT = "fft_data";
public static final String COLUMN_NAME_DATE = "date";
public static final String COLUMN_NAME_XVALS = "xvals";
public static final String COLUMN_NAME_YVALS = "yvals";
public static final String COLUMN_NAME_IMPULSE = "impulseno";
public static final String COLUMN_NAME_COMMENT = "comments_fft";
}
}
Listing 1 – MySQLiteDatabaseContract.java
Page 7
Orchisama Das August 2015
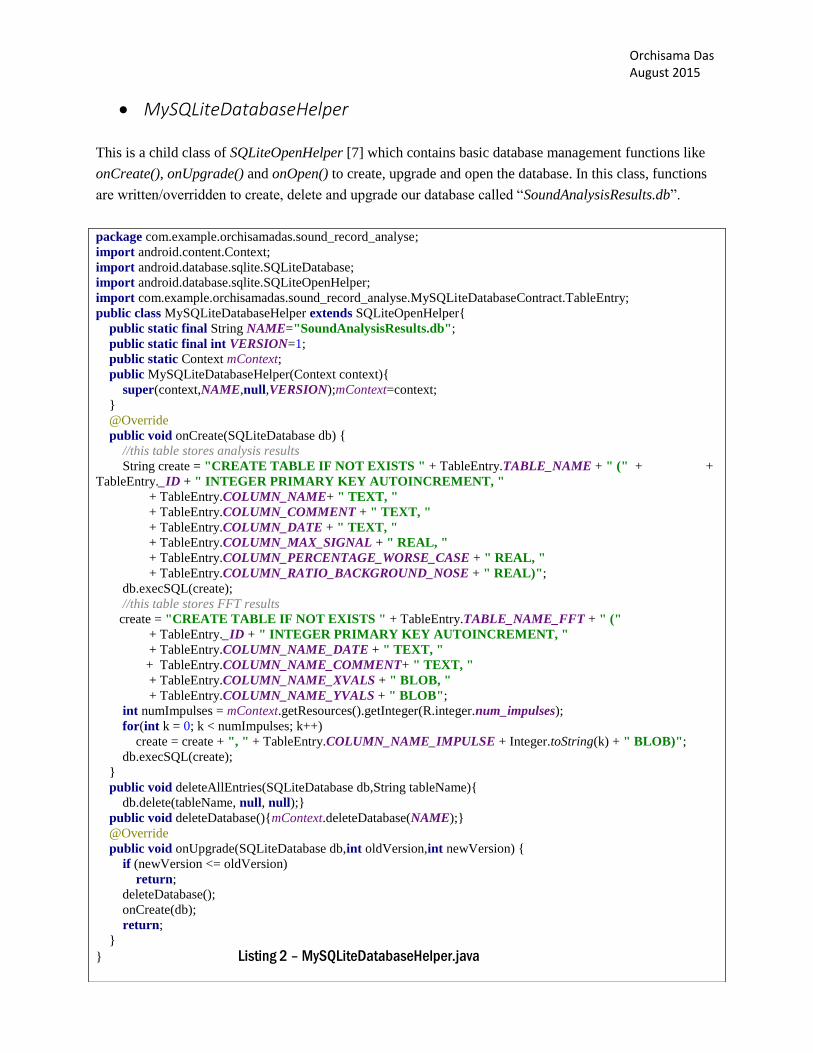
MySQLiteDatabaseHelper This is a child class of SQLiteOpenHelper [7] which contains basic database management functions like
onCreate(), onUpgrade() and onOpen() to create, upgrade and open the database. In this class, functions
are written/overridden to create, delete and upgrade our database called ―SoundAnalysisResults.db‖.
package com.example.orchisamadas.sound_record_analyse;
import android.content.Context;
import android.database.sqlite.SQLiteDatabase;
import android.database.sqlite.SQLiteOpenHelper;
import com.example.orchisamadas.sound_record_analyse.MySQLiteDatabaseContract.TableEntry;
public class MySQLiteDatabaseHelper extends SQLiteOpenHelper{
public static final String NAME="SoundAnalysisResults.db";
public static final int VERSION=1;
public static Context mContext;
public MySQLiteDatabaseHelper(Context context){
super(context,NAME,null,VERSION);mContext=context;
}
@Override
public void onCreate(SQLiteDatabase db) {
//this table stores analysis results
String create = "CREATE TABLE IF NOT EXISTS " + TableEntry.TABLE_NAME + " (" + +
TableEntry._ID + " INTEGER PRIMARY KEY AUTOINCREMENT, "
+ TableEntry.COLUMN_NAME+ " TEXT, "
+ TableEntry.COLUMN_COMMENT + " TEXT, "
+ TableEntry.COLUMN_DATE + " TEXT, "
+ TableEntry.COLUMN_MAX_SIGNAL + " REAL, "
+ TableEntry.COLUMN_PERCENTAGE_WORSE_CASE + " REAL, "
+ TableEntry.COLUMN_RATIO_BACKGROUND_NOSE + " REAL)";
db.execSQL(create);
//this table stores FFT results
create = "CREATE TABLE IF NOT EXISTS " + TableEntry.TABLE_NAME_FFT + " ("
+ TableEntry._ID + " INTEGER PRIMARY KEY AUTOINCREMENT, "
+ TableEntry.COLUMN_NAME_DATE + " TEXT, "
+ TableEntry.COLUMN_NAME_COMMENT+ " TEXT, "
+ TableEntry.COLUMN_NAME_XVALS + " BLOB, "
+ TableEntry.COLUMN_NAME_YVALS + " BLOB";
int numImpulses = mContext.getResources().getInteger(R.integer.num_impulses);
for(int k = 0; k < numImpulses; k++)
create = create + ", " + TableEntry.COLUMN_NAME_IMPULSE + Integer.toString(k) + " BLOB)";
db.execSQL(create);
}
public void deleteAllEntries(SQLiteDatabase db,String tableName){
db.delete(tableName, null, null);}
public void deleteDatabase(){mContext.deleteDatabase(NAME);}
@Override
public void onUpgrade(SQLiteDatabase db,int oldVersion,int newVersion) {
if (newVersion <= oldVersion)
return;
deleteDatabase();
onCreate(db);
return;
}
} Listing 2 – MySQLiteDatabaseHelper.java
Page 8
Orchisama Das August 2015
The onCreate() method is executed first. This creates the two tables in our database – analysis_data and
fft_data. The String ‗create‘ contains the SQL command for creating a table (if it does not previously
exist), with the given fields. TableEntry._ID has the unique row ID for each row of a column. It is auto-
incremented. As expected, the other columns are of type ‗TEXT‘ (to store strings) and ‗REAL‘ (to store
floating point numbers). Another data type ‗BLOB‘ is used to store the result for fft_data. This is because
SQLite databases cannot store arrays of double. Instead, they use Binary Large Object, BLOBs, which are
a collection of binary data stored as a single entity. As mentioned before, sound is recorded in a number
of impulses of 5s each. The FFT magnitude values of each impulse is stored in a separate column – called
impulse0, impulse1, and so on. The column ‗yvals‘ stores the average of FFT magnitude values of all the
impulses.
The other methods, deleteAllEntries() deletes a particular table of the database and deleteDatabase()
deletes the entire database itself. onUpgrade() method is called whenever the database version is
increased. We may want to do so if we want to change the structure of the database, i.e., add new tables or
columns to existing tables. It simply deletes the old database and creates a new one.
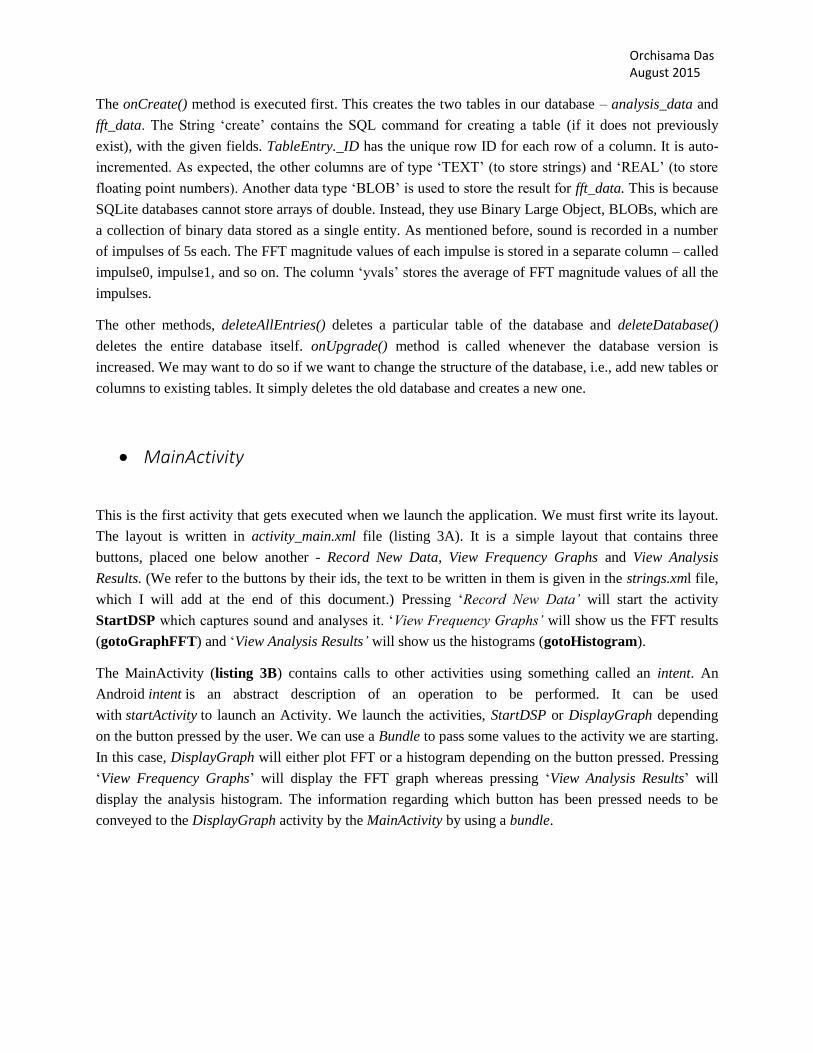
MainActivity
This is the first activity that gets executed when we launch the application. We must first write its layout.
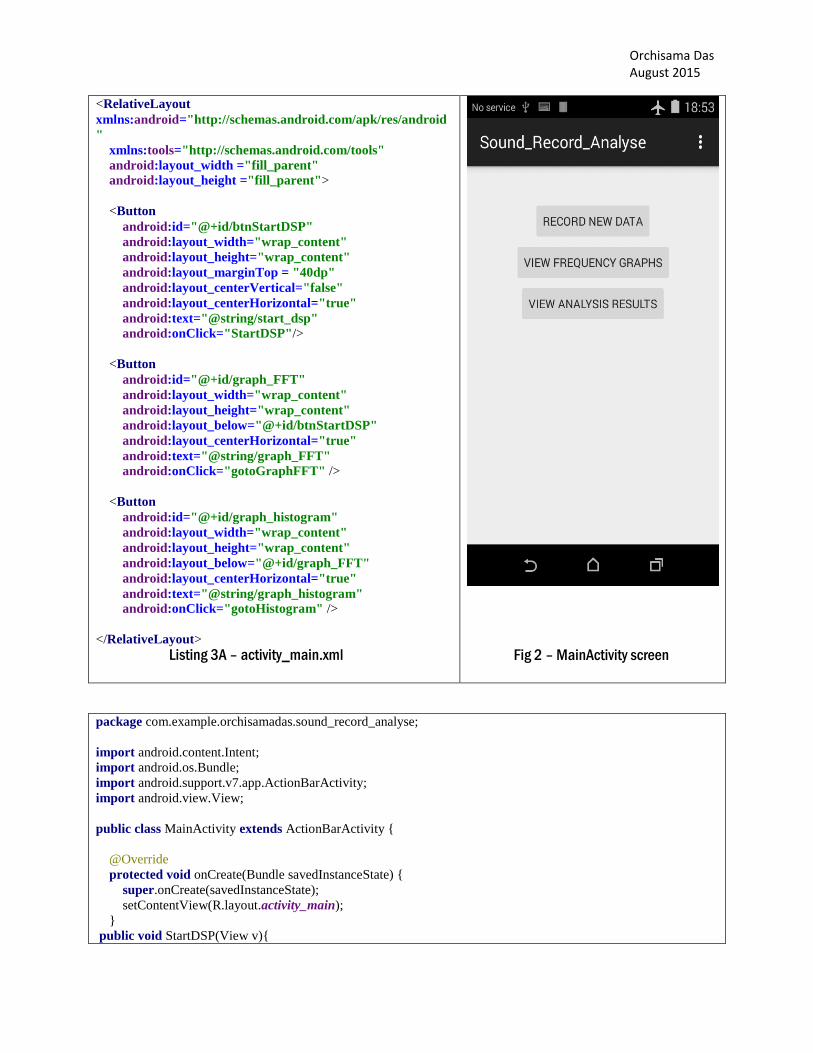
The layout is written in activity_main.xml file (listing 3A). It is a simple layout that contains three
buttons, placed one below another - Record New Data, View Frequency Graphs and View Analysis
Results. (We refer to the buttons by their ids, the text to be written in them is given in the strings.xml file,
which I will add at the end of this document.) Pressing ‗Record New Data‟ will start the activity
StartDSP which captures sound and analyses it. ‗View Frequency Graphs‟ will show us the FFT results
(gotoGraphFFT) and ‗View Analysis Results‟ will show us the histograms (gotoHistogram).
The MainActivity (listing 3B) contains calls to other activities using something called an intent. An
Android intent is an abstract description of an operation to be performed. It can be used
with startActivity to launch an Activity. We launch the activities, StartDSP or DisplayGraph depending
on the button pressed by the user. We can use a Bundle to pass some values to the activity we are starting.
In this case, DisplayGraph will either plot FFT or a histogram depending on the button pressed. Pressing
‗View Frequency Graphs‘ will display the FFT graph whereas pressing ‗View Analysis Results‘ will
display the analysis histogram. The information regarding which button has been pressed needs to be
conveyed to the DisplayGraph activity by the MainActivity by using a bundle.
Page 9
Orchisama Das August 2015
<RelativeLayout
xmlns:android="http://schemas.android.com/apk/res/android
"
xmlns:tools="http://schemas.android.com/tools"
android:layout_width ="fill_parent"
android:layout_height ="fill_parent">
<Button
android:id="@+id/btnStartDSP"
android:layout_width="wrap_content"
android:layout_height="wrap_content"
android:layout_marginTop = "40dp"
android:layout_centerVertical="false"
android:layout_centerHorizontal="true"
android:text="@string/start_dsp"
android:onClick="StartDSP"/>
<Button
android:id="@+id/graph_FFT"
android:layout_width="wrap_content"
android:layout_height="wrap_content"
android:layout_below="@+id/btnStartDSP"
android:layout_centerHorizontal="true"
android:text="@string/graph_FFT"
android:onClick="gotoGraphFFT" />
<Button
android:id="@+id/graph_histogram"
android:layout_width="wrap_content"
android:layout_height="wrap_content"
android:layout_below="@+id/graph_FFT"
android:layout_centerHorizontal="true"
android:text="@string/graph_histogram"
android:onClick="gotoHistogram" />
</RelativeLayout>
Listing 3A – activity_main.xml
Fig 2 – MainActivity screen
package com.example.orchisamadas.sound_record_analyse;
import android.content.Intent;
import android.os.Bundle;
import android.support.v7.app.ActionBarActivity;
import android.view.View;
public class MainActivity extends ActionBarActivity {
@Override
protected void onCreate(Bundle savedInstanceState) {
super.onCreate(savedInstanceState);
setContentView(R.layout.activity_main);
}
public void StartDSP(View v){
Page 10
Orchisama Das August 2015
Intent intent=new Intent(this,StartDSP.class);
startActivity(intent);
}
/*Starts the activity DisplayGraph to view previous graphs
We can either view previous FFT graphs or previous analysis histograms
depending on which button is pressed */
public void gotoGraphFFT(View v)
{
Bundle bundle = new Bundle();
bundle.putString("button_pressed", "1");
Intent intent = new Intent(this, DisplayGraph.class);
intent.putExtras(bundle);
startActivity(intent);
}
public void gotoHistogram(View v)
{
Bundle bundle = new Bundle();
bundle.putString("button_pressed", "2");
Intent intent = new Intent(this, DisplayGraph.class);
intent.putExtras(bundle);
startActivity(intent);
}
}
Listing 3B – MainActivity.java
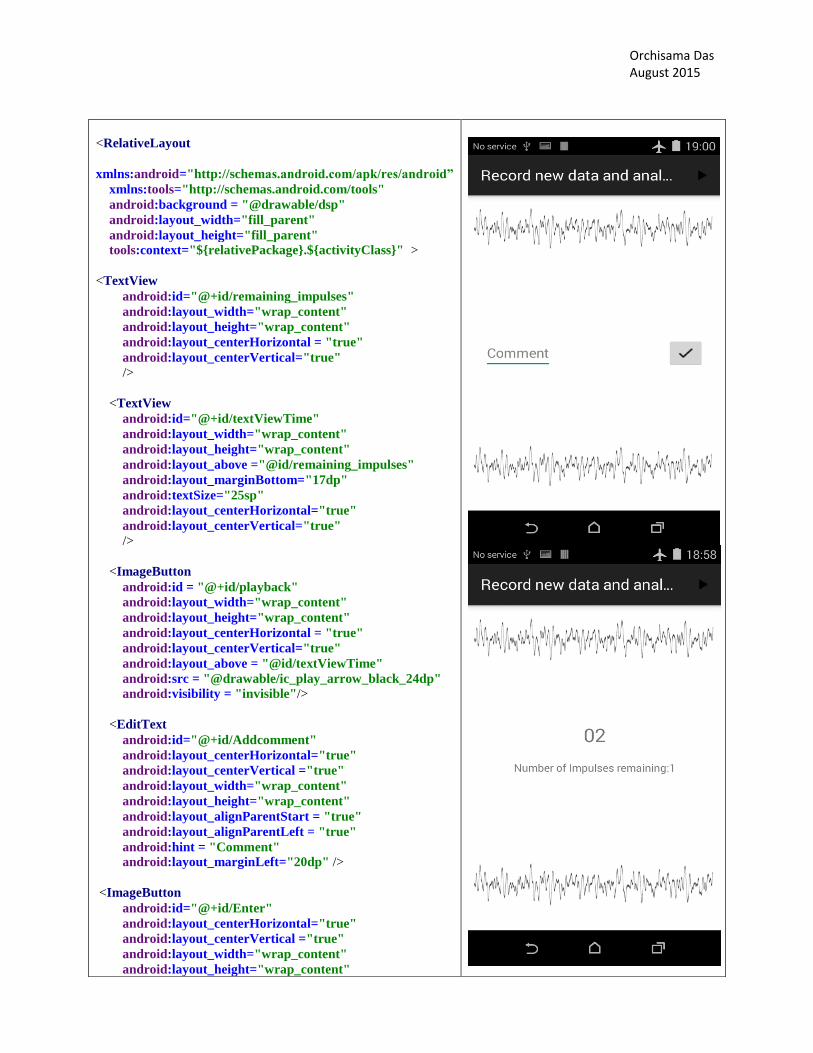
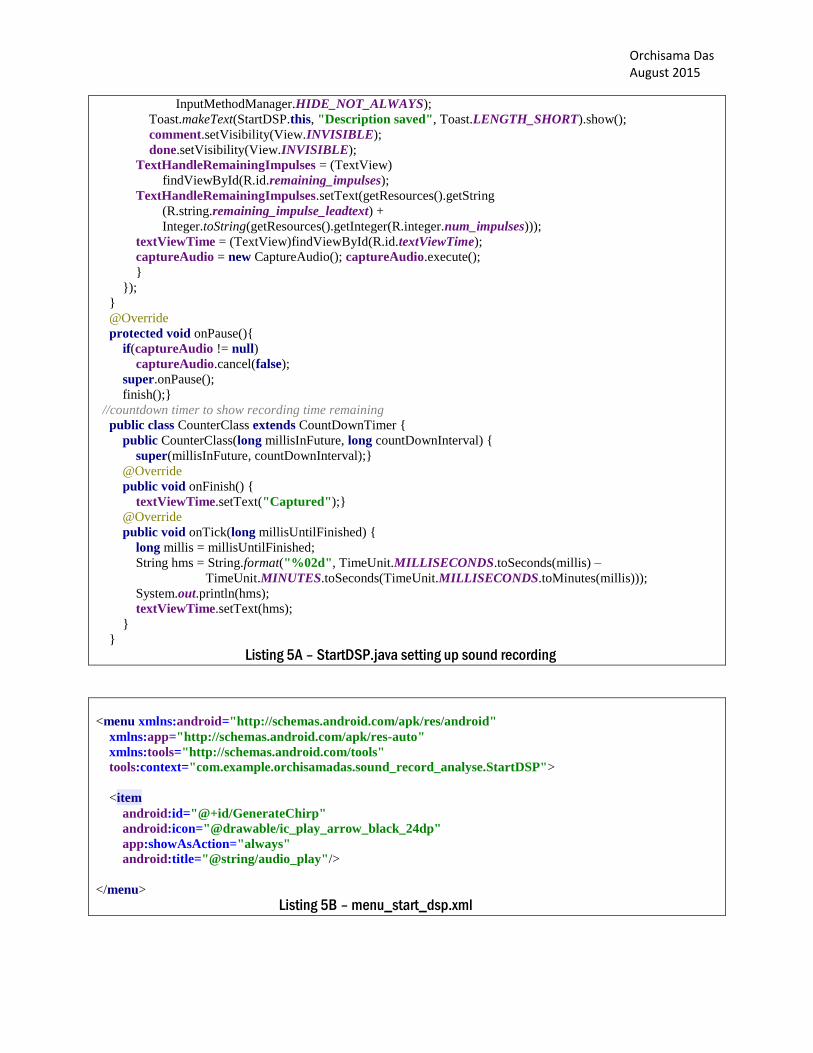
StartDSP Activity
In this activity, we capture sound and do signal processing on it – obtain the frequency spectrum by doing
an FFT [8] and then calculate the metrics described in [1]. I will first describe sound capture, followed by
the analysis method and storage in database. Listing 4 gives the layout for StartDSP activity.
In the onCreate() method, we create a media player object called ‗boo‘. It is basically a chirp that goes
from 50Hz to 1000Hz in a duration of 5s (Chirp_50_1000Hz.wav). We let the user have the option of
playing this chirp in case he wants to excite a room resonance. We must create a folder called ‗raw‘ in the
‗res‘ directory containing ‗boo.wav‘.
Next we open the database, ―SoundAnlysisResults.db‖ so that we can write data into it.
onOptionsSelectedMenu() lets us add a menu at the top right hand corner of the screen. I just want to add
a play button here so that on pressing it, the user can play ‗boo.wav‘. The layout for this menu is given in
menu_start_dsp.xml (listing 5B). The method ‗startPlaying()‘ is executed when the user when user
presses the play button on the menu. The chirp must be stored in the phone‘s memory/SD card before
playing it (create ‗MySounds‘ folder in the phone‘s storage directory from your computer and paste
Chirp_50_1000Hz.wav in it).
Page 11
Orchisama Das August 2015
<RelativeLayout
xmlns:android="http://schemas.android.com/apk/res/android”
xmlns:tools="http://schemas.android.com/tools"
android:background = "@drawable/dsp"
android:layout_width="fill_parent"
android:layout_height="fill_parent"
tools:context="${relativePackage}.${activityClass}" >
<TextView
android:id="@+id/remaining_impulses"
android:layout_width="wrap_content"
android:layout_height="wrap_content"
android:layout_centerHorizontal = "true"
android:layout_centerVertical="true"
/>
<TextView
android:id="@+id/textViewTime"
android:layout_width="wrap_content"
android:layout_height="wrap_content"
android:layout_above ="@id/remaining_impulses"
android:layout_marginBottom="17dp"
android:textSize="25sp"
android:layout_centerHorizontal="true"
android:layout_centerVertical="true"
/>
<ImageButton
android:id = "@+id/playback"
android:layout_width="wrap_content"
android:layout_height="wrap_content"
android:layout_centerHorizontal = "true"
android:layout_centerVertical="true"
android:layout_above = "@id/textViewTime"
android:src = "@drawable/ic_play_arrow_black_24dp"
android:visibility = "invisible"/>
<EditText
android:id="@+id/Addcomment"
android:layout_centerHorizontal="true"
android:layout_centerVertical ="true"
android:layout_width="wrap_content"
android:layout_height="wrap_content"
android:layout_alignParentStart = "true"
android:layout_alignParentLeft = "true"
android:hint = "Comment"
android:layout_marginLeft="20dp" />
<ImageButton
android:id="@+id/Enter"
android:layout_centerHorizontal="true"
android:layout_centerVertical ="true"
android:layout_width="wrap_content"
android:layout_height="wrap_content"
Page 12
Orchisama Das August 2015
android:layout_alignParentRight = "true"
android:layout_alignParentEnd = "true"
android:layout_marginRight="20dp"
android:src ="@drawable/ic_done_black_24dp" />
<ProgressBar
android:id="@+id/computation_progress"
style="?android:attr/progressBarStyleHorizontal"
android:layout_width="wrap_content"
android:layout_height="wrap_content"
android:layout_centerVertical ="true"
android:layout_centerHorizontal="true"
android:indeterminate="false"
android:max="100"
android:progress="0"
android:visibility="invisible"
/>
<TextView
android:id = "@+id/analysing"
android:layout_width="wrap_content"
android:layout_height="wrap_content"
android:layout_centerHorizontal="true"
android:layout_centerVertical="true"
android:layout_above = "@id/computation_progress"
android:visibility="invisible"
/>
<Button
android:id="@+id/btnDisplayGraph"
android:layout_width="wrap_content"
android:layout_height="wrap_content"
android:layout_centerVertical="true"
android:layout_centerHorizontal="true"
android:layout_below = "@id/computation_progress"
android:text="@string/view_fft_result"
android:onClick="DisplayGraph"
android:visibility="invisible"/>
<Button
android:id="@+id/btnDisplayHistogram"
android:layout_width="wrap_content"
android:layout_height="wrap_content"
android:layout_centerVertical="true"
android:layout_centerHorizontal="true"
android:layout_below = "@id/btnDisplayGraph"
android:text="@string/view_analysis_result"
android:onClick="DisplayGraph"
android:visibility="invisible"/>
</RelativeLayout>
Listing 4 – activity_start_dsp.xml
Fig 3 – StartDSP layouts
Page 13
Orchisama Das August 2015
package com.example.orchisamadas.sound_record_analyse;
import java.io.BufferedInputStream;
import java.io.BufferedOutputStream;
import java.io.DataInputStream;
import java.io.DataOutputStream;
import java.io.File;
import java.io.FileInputStream;
import java.io.FileOutputStream;
import java.io.IOException;
import java.io.InputStream;
import java.io.OutputStream;
import java.nio.ByteBuffer;
import java.util.ArrayList;
import java.util.Collections;
import java.util.Date;
import java.util.HashSet;
import java.util.List;
import java.util.Set;
import java.util.concurrent.TimeUnit;
import android.content.ContentValues;
import android.content.Context;
import android.content.Intent;
import android.database.sqlite.SQLiteDatabase;
import android.media.AudioFormat;
import android.media.AudioManager;
import android.media.AudioRecord;
import android.media.AudioTrack;
import android.media.MediaPlayer;
import android.media.MediaRecorder.AudioSource;
import android.os.AsyncTask;
import android.os.Bundle;
import android.os.CountDownTimer;
import android.os.Environment;
import android.support.v7.app.ActionBarActivity;
import android.text.format.DateFormat;
import android.util.Log;
import android.view.MenuItem;
import android.view.View;
import android.view.inputmethod.InputMethodManager;
import android.widget.Button;
import android.widget.EditText;
import android.widget.ImageButton;
import android.widget.ProgressBar;
import android.widget.TextView;
import android.widget.Toast;
import com.example.orchisamadas.sound_record_analyse.MySQLiteDatabaseContract.TableEntry;
public class StartDSP extends ActionBarActivity {
TextView TextHandleRemainingImpulses;
AudioRecord recorder;
CaptureAudio captureAudio;
TextView textViewTime;
String title;
EditText comment;
Page 14
Orchisama Das August 2015
ImageButton done;
final CounterClass timer = new CounterClass(5000, 1000);
private static final double REFSPL = 0.00002;
private MediaPlayer mPlayer = null;
private MediaPlayer mediaPlayer;
@Override
protected void onCreate(Bundle savedInstanceState) {
super.onCreate(savedInstanceState);
mediaPlayer = MediaPlayer.create(this, R.raw.boo);
setContentView(R.layout.activity_start_dsp);
MySQLiteDatabaseHelper databaseHelper = new MySQLiteDatabaseHelper(StartDSP.this);
//open or create database
SQLiteDatabase db = openOrCreateDatabase(Environment.getExternalStorageDirectory() + File.separator +
databaseHelper.NAME, MODE_PRIVATE, null);
databaseHelper.onCreate(db);
}
//play chirp when play button is pressed.
public boolean onOptionsItemSelected(MenuItem item){
//Handle presses on the action bar items
switch(item.getItemId()){
case R.id.GenerateChirp:startPlaying();
return true;
default:
return super.onOptionsItemSelected(item);
}
}
public void startPlaying(){
mPlayer=new MediaPlayer();
try{
mPlayer.setDataSource(Environment.getExternalStorageDirectory().getAbsolutePath()+
"/MySounds/Chirp_50_1000Hz.wav");
mPlayer.prepare();
mPlayer.start();
}
catch(IOException e){}
}
@Override
protected void onStart(){
super.onStart();
//allow user to enter title
comment = (EditText) findViewById(R.id.Addcomment);
done = (ImageButton) findViewById(R.id.Enter);
Toast.makeText(StartDSP.this, "Add a small description of the noise you're hearing",
Toast.LENGTH_SHORT).show();
done.setOnClickListener(new View.OnClickListener() {
@Override
public void onClick(View v) {
title = comment.getText().toString();
if(title == null)
title = " ";
//close virtual keyboard
InputMethodManager inputManager = (InputMethodManager)
getSystemService(Context.INPUT_METHOD_SERVICE);
inputManager.hideSoftInputFromWindow(getCurrentFocus().getWindowToken(),
Page 15
Orchisama Das August 2015
InputMethodManager.HIDE_NOT_ALWAYS);
Toast.makeText(StartDSP.this, "Description saved", Toast.LENGTH_SHORT).show();
comment.setVisibility(View.INVISIBLE);
done.setVisibility(View.INVISIBLE);
TextHandleRemainingImpulses = (TextView)
findViewById(R.id.remaining_impulses);
TextHandleRemainingImpulses.setText(getResources().getString
(R.string.remaining_impulse_leadtext) +
Integer.toString(getResources().getInteger(R.integer.num_impulses)));
textViewTime = (TextView)findViewById(R.id.textViewTime);
captureAudio = new CaptureAudio(); captureAudio.execute();
}
});
}
@Override
protected void onPause(){
if(captureAudio != null)
captureAudio.cancel(false);
super.onPause();
finish();}
//countdown timer to show recording time remaining
public class CounterClass extends CountDownTimer {
public CounterClass(long millisInFuture, long countDownInterval) {
super(millisInFuture, countDownInterval);}
@Override
public void onFinish() {
textViewTime.setText("Captured");}
@Override
public void onTick(long millisUntilFinished) {
long millis = millisUntilFinished;
String hms = String.format("%02d", TimeUnit.MILLISECONDS.toSeconds(millis) –
TimeUnit.MINUTES.toSeconds(TimeUnit.MILLISECONDS.toMinutes(millis)));
System.out.println(hms);
textViewTime.setText(hms);
}
}
Listing 5A – StartDSP.java setting up sound recording
<menu xmlns:android="http://schemas.android.com/apk/res/android"
xmlns:app="http://schemas.android.com/apk/res-auto"
xmlns:tools="http://schemas.android.com/tools"
tools:context="com.example.orchisamadas.sound_record_analyse.StartDSP">
<item
android:id="@+id/GenerateChirp"
android:icon="@drawable/ic_play_arrow_black_24dp"
app:showAsAction="always"
android:title="@string/audio_play"/>
</menu>
Listing 5B – menu_start_dsp.xml
Page 16
Orchisama Das August 2015
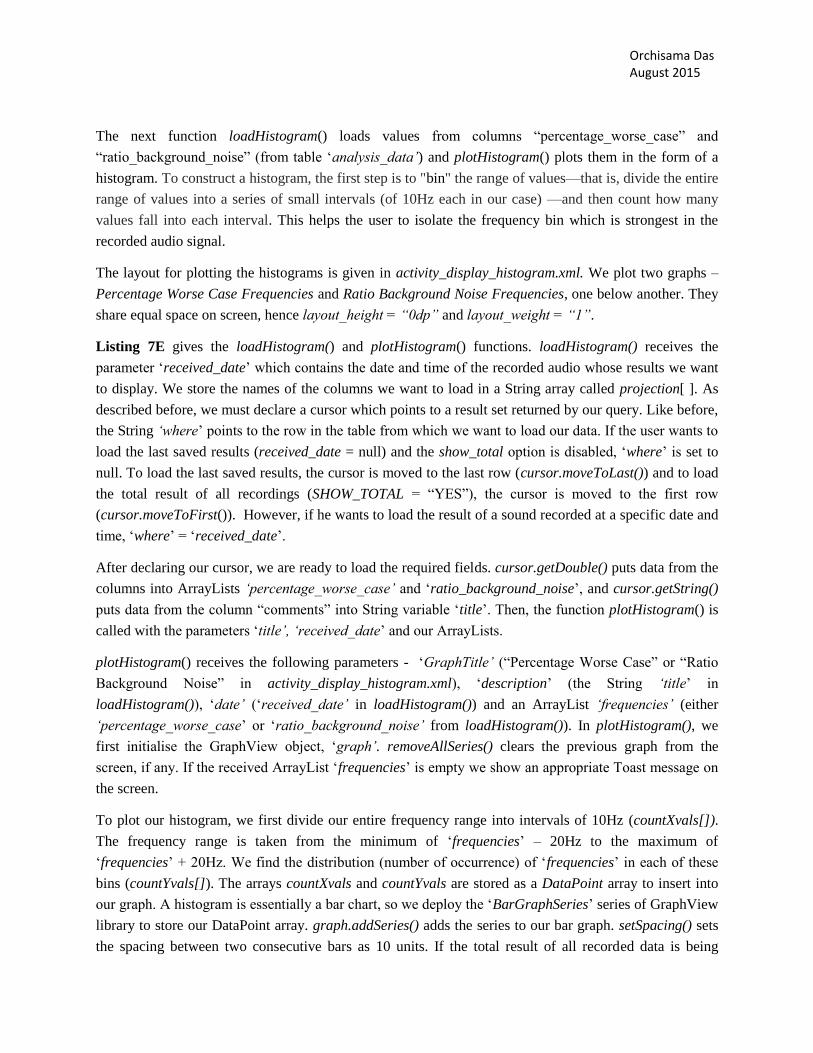
The onStart() method is executed first. We let the user input a comment about the sound he is about to
capture, which we save in a String called ‗title‘. To do so, we add an EditText widget beside a TextView
widget, as given in listing 4. Once the user finishes inserting the description, we display the information
about recording time and number of impulses remaining. We then call the CaptureAudio class (listing
5C) to start recording.
CounterClass generates a timer to countdown from 5s whenever we are recording an impulse. In the
layout file activity_start_dsp.xml (listing 4) we add a TextView widget, ‗textViewTime‘ which shows the
recording time remaining. We modify ‗textViewTime‘ in CounterClass every second to show the
countdown. On finishing recording all impluses, ‗textViewTime‘ shows the text ‗Captured‘.
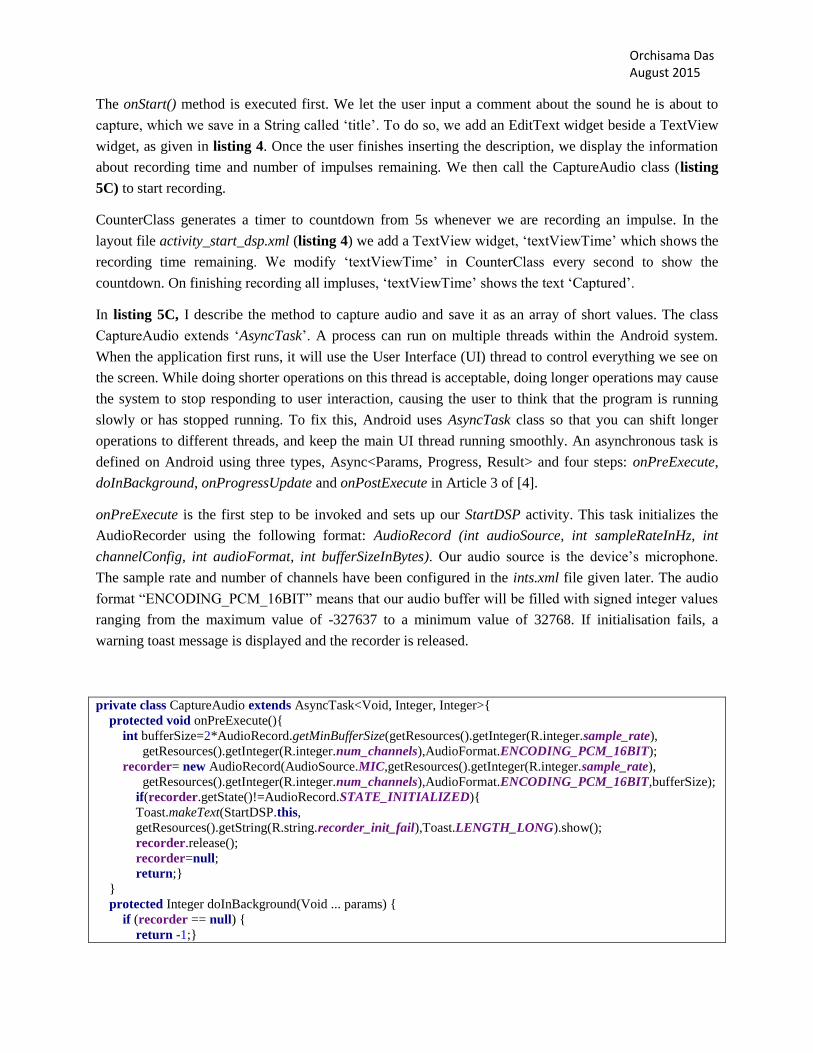
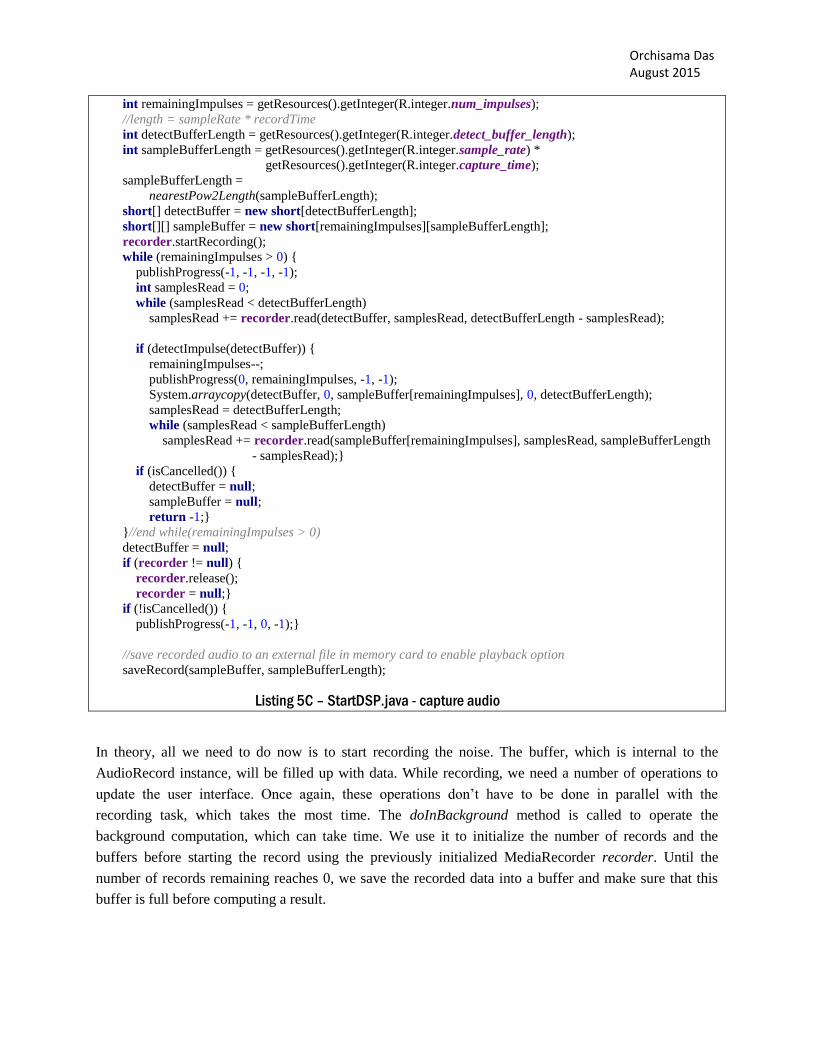
In listing 5C, I describe the method to capture audio and save it as an array of short values. The class
CaptureAudio extends ‗AsyncTask‘. A process can run on multiple threads within the Android system.
When the application first runs, it will use the User Interface (UI) thread to control everything we see on
the screen. While doing shorter operations on this thread is acceptable, doing longer operations may cause
the system to stop responding to user interaction, causing the user to think that the program is running
slowly or has stopped running. To fix this, Android uses AsyncTask class so that you can shift longer
operations to different threads, and keep the main UI thread running smoothly. An asynchronous task is
defined on Android using three types, Async<Params, Progress, Result> and four steps: onPreExecute,
doInBackground, onProgressUpdate and onPostExecute in Article 3 of [4].
onPreExecute is the first step to be invoked and sets up our StartDSP activity. This task initializes the
AudioRecorder using the following format: AudioRecord (int audioSource, int sampleRateInHz, int
channelConfig, int audioFormat, int bufferSizeInBytes). Our audio source is the device‘s microphone.
The sample rate and number of channels have been configured in the ints.xml file given later. The audio
format ―ENCODING_PCM_16BIT‖ means that our audio buffer will be filled with signed integer values
ranging from the maximum value of -327637 to a minimum value of 32768. If initialisation fails, a
warning toast message is displayed and the recorder is released.
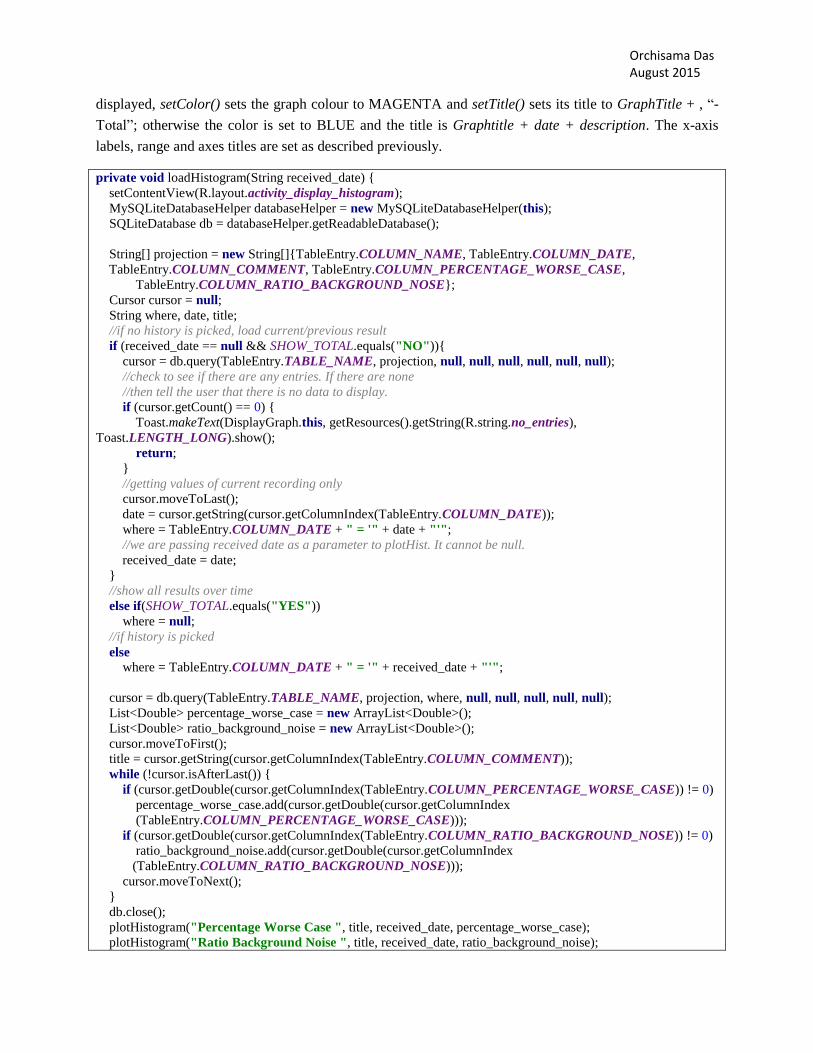
private class CaptureAudio extends AsyncTask<Void, Integer, Integer>{
protected void onPreExecute(){
int bufferSize=2*AudioRecord.getMinBufferSize(getResources().getInteger(R.integer.sample_rate),
getResources().getInteger(R.integer.num_channels),AudioFormat.ENCODING_PCM_16BIT);
recorder= new AudioRecord(AudioSource.MIC,getResources().getInteger(R.integer.sample_rate),
getResources().getInteger(R.integer.num_channels),AudioFormat.ENCODING_PCM_16BIT,bufferSize);
if(recorder.getState()!=AudioRecord.STATE_INITIALIZED){
Toast.makeText(StartDSP.this,
getResources().getString(R.string.recorder_init_fail),Toast.LENGTH_LONG).show();
recorder.release();
recorder=null;
return;}
}
protected Integer doInBackground(Void ... params) {
if (recorder == null) {
return -1;}
Page 17
Orchisama Das August 2015
int remainingImpulses = getResources().getInteger(R.integer.num_impulses);
//length = sampleRate * recordTime
int detectBufferLength = getResources().getInteger(R.integer.detect_buffer_length);
int sampleBufferLength = getResources().getInteger(R.integer.sample_rate) *
getResources().getInteger(R.integer.capture_time);
sampleBufferLength =
nearestPow2Length(sampleBufferLength);
short[] detectBuffer = new short[detectBufferLength];
short[][] sampleBuffer = new short[remainingImpulses][sampleBufferLength];
recorder.startRecording();
while (remainingImpulses > 0) {
publishProgress(-1, -1, -1, -1);
int samplesRead = 0;
while (samplesRead < detectBufferLength)
samplesRead += recorder.read(detectBuffer, samplesRead, detectBufferLength - samplesRead);
if (detectImpulse(detectBuffer)) {
remainingImpulses--;
publishProgress(0, remainingImpulses, -1, -1);
System.arraycopy(detectBuffer, 0, sampleBuffer[remainingImpulses], 0, detectBufferLength);
samplesRead = detectBufferLength;
while (samplesRead < sampleBufferLength)
samplesRead += recorder.read(sampleBuffer[remainingImpulses], samplesRead, sampleBufferLength
- samplesRead);}
if (isCancelled()) {
detectBuffer = null;
sampleBuffer = null;
return -1;}
}//end while(remainingImpulses > 0)
detectBuffer = null;
if (recorder != null) {
recorder.release();
recorder = null;}
if (!isCancelled()) {
publishProgress(-1, -1, 0, -1);}
//save recorded audio to an external file in memory card to enable playback option
saveRecord(sampleBuffer, sampleBufferLength);
Listing 5C – StartDSP.java - capture audio
In theory, all we need to do now is to start recording the noise. The buffer, which is internal to the
AudioRecord instance, will be filled up with data. While recording, we need a number of operations to
update the user interface. Once again, these operations don‘t have to be done in parallel with the
recording task, which takes the most time. The doInBackground method is called to operate the
background computation, which can take time. We use it to initialize the number of records and the
buffers before starting the record using the previously initialized MediaRecorder recorder. Until the
number of records remaining reaches 0, we save the recorded data into a buffer and make sure that this
buffer is full before computing a result.
Page 18
Orchisama Das August 2015
If an impulse above the background sound level is detected (detectImpulse) we start to collect data,
decrease the number of records remaining, update the UI thread and fill the buffer sampleBuffer with the
current data plus the data that has just been captured. An impulse is detected only if the noise level is
beyond a certain threshold. In case you want to detect all sounds, change the value of threshold in ints.xml
to 0. To save the sound that we have just captured, we call the method saveRecord (explained in listing
5F).
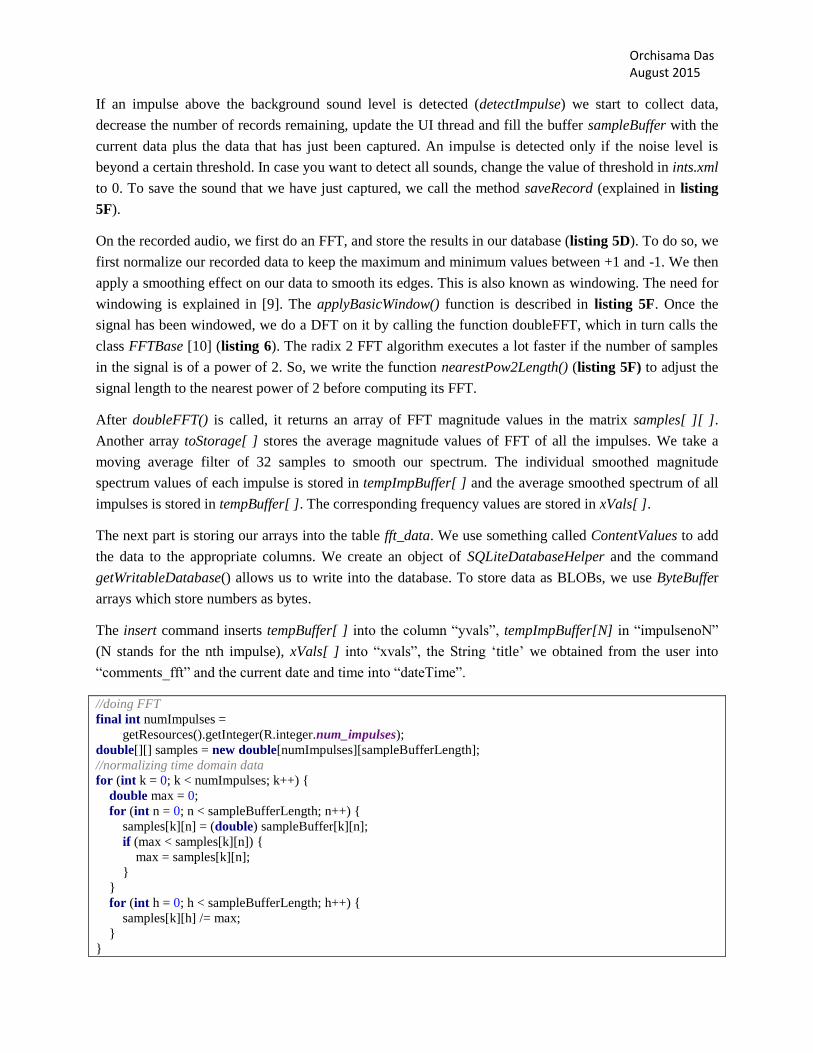
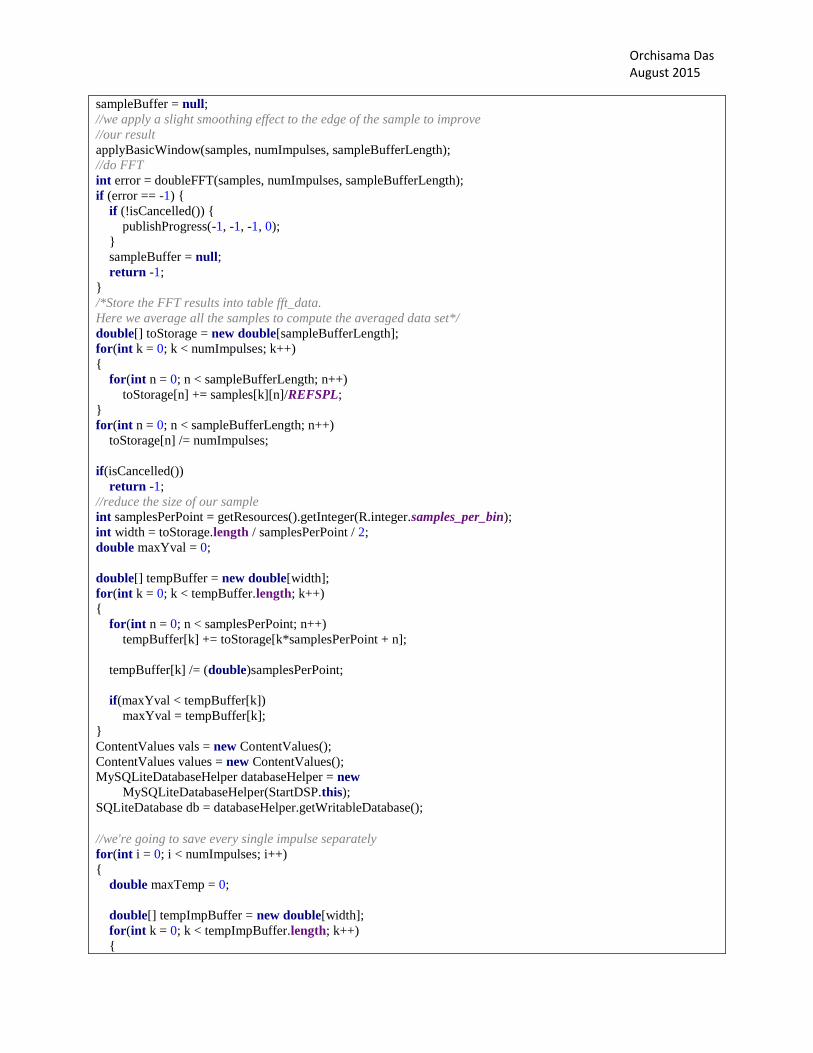
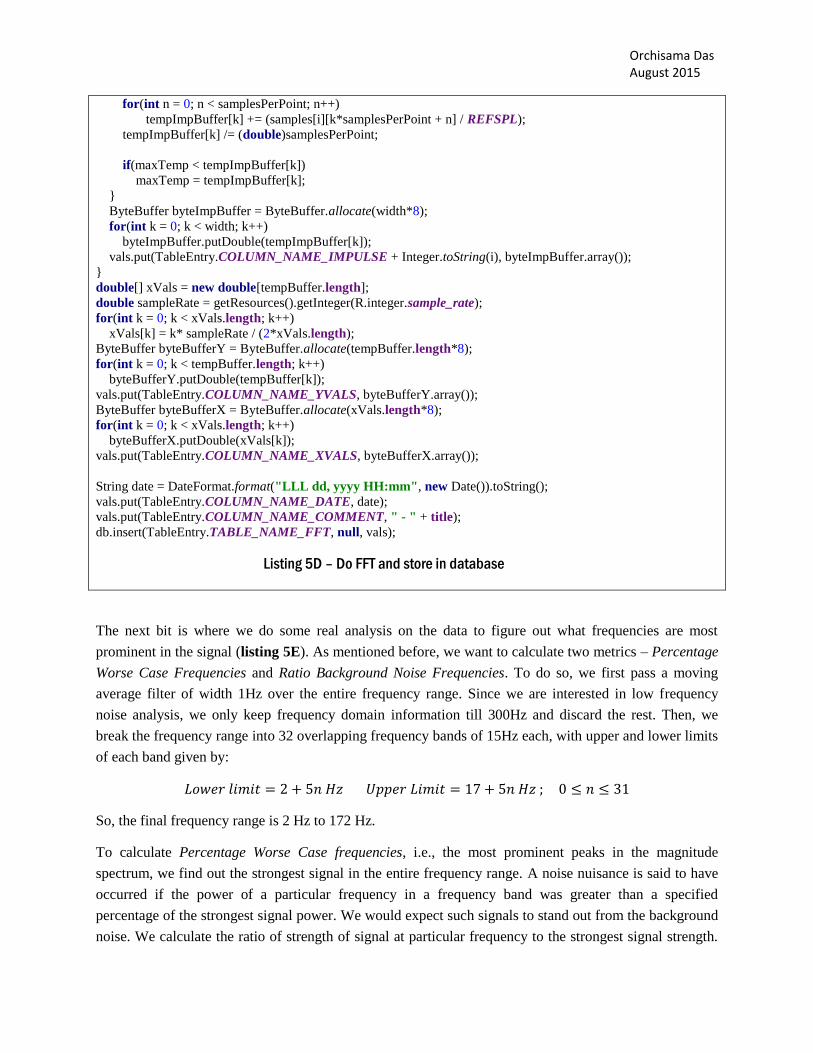
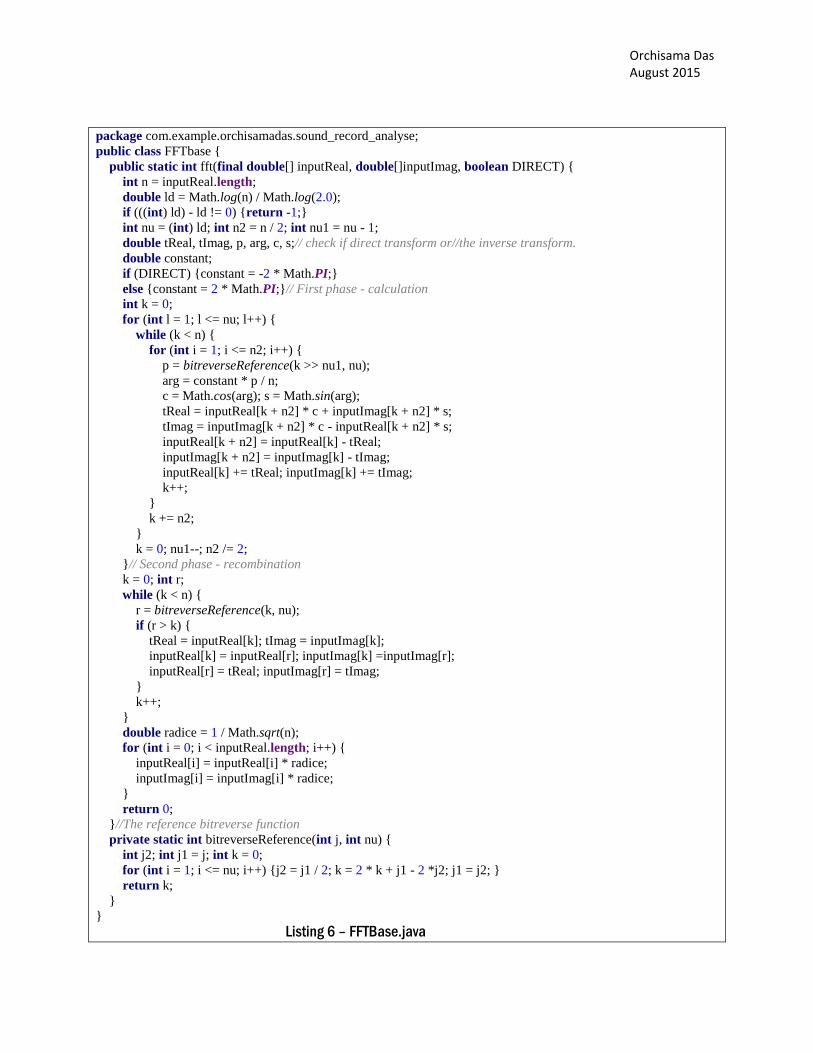
On the recorded audio, we first do an FFT, and store the results in our database (listing 5D). To do so, we
first normalize our recorded data to keep the maximum and minimum values between +1 and -1. We then
apply a smoothing effect on our data to smooth its edges. This is also known as windowing. The need for
windowing is explained in [9]. The applyBasicWindow() function is described in listing 5F. Once the
signal has been windowed, we do a DFT on it by calling the function doubleFFT, which in turn calls the
class FFTBase [10] (listing 6). The radix 2 FFT algorithm executes a lot faster if the number of samples
in the signal is of a power of 2. So, we write the function nearestPow2Length() (listing 5F) to adjust the
signal length to the nearest power of 2 before computing its FFT.
After doubleFFT() is called, it returns an array of FFT magnitude values in the matrix samples[ ][ ].
Another array toStorage[ ] stores the average magnitude values of FFT of all the impulses. We take a
moving average filter of 32 samples to smooth our spectrum. The individual smoothed magnitude
spectrum values of each impulse is stored in tempImpBuffer[ ] and the average smoothed spectrum of all
impulses is stored in tempBuffer[ ]. The corresponding frequency values are stored in xVals[ ].
The next part is storing our arrays into the table fft_data. We use something called ContentValues to add
the data to the appropriate columns. We create an object of SQLiteDatabaseHelper and the command
getWritableDatabase() allows us to write into the database. To store data as BLOBs, we use ByteBuffer
arrays which store numbers as bytes.
The insert command inserts tempBuffer[ ] into the column ―yvals‖, tempImpBuffer[N] in ―impulsenoN‖
(N stands for the nth impulse), xVals[ ] into ―xvals‖, the String ‗title‘ we obtained from the user into
―comments_fft‖ and the current date and time into ―dateTime‖.
//doing FFT
final int numImpulses =
getResources().getInteger(R.integer.num_impulses);
double[][] samples = new double[numImpulses][sampleBufferLength];
//normalizing time domain data
for (int k = 0; k < numImpulses; k++) {
double max = 0;
for (int n = 0; n < sampleBufferLength; n++) {
samples[k][n] = (double) sampleBuffer[k][n];
if (max < samples[k][n]) {
max = samples[k][n];
}
}
for (int h = 0; h < sampleBufferLength; h++) {
samples[k][h] /= max;
}
}
Page 19
Orchisama Das August 2015
sampleBuffer = null;
//we apply a slight smoothing effect to the edge of the sample to improve
//our result
applyBasicWindow(samples, numImpulses, sampleBufferLength);
//do FFT
int error = doubleFFT(samples, numImpulses, sampleBufferLength);
if (error == -1) {
if (!isCancelled()) {
publishProgress(-1, -1, -1, 0);
}
sampleBuffer = null;
return -1;
}
/*Store the FFT results into table fft_data.
Here we average all the samples to compute the averaged data set*/
double[] toStorage = new double[sampleBufferLength];
for(int k = 0; k < numImpulses; k++)
{
for(int n = 0; n < sampleBufferLength; n++)
toStorage[n] += samples[k][n]/REFSPL;
}
for(int n = 0; n < sampleBufferLength; n++)
toStorage[n] /= numImpulses;
if(isCancelled())
return -1;
//reduce the size of our sample
int samplesPerPoint = getResources().getInteger(R.integer.samples_per_bin);
int width = toStorage.length / samplesPerPoint / 2;
double maxYval = 0;
double[] tempBuffer = new double[width];
for(int k = 0; k < tempBuffer.length; k++)
{
for(int n = 0; n < samplesPerPoint; n++)
tempBuffer[k] += toStorage[k*samplesPerPoint + n];
tempBuffer[k] /= (double)samplesPerPoint;
if(maxYval < tempBuffer[k])
maxYval = tempBuffer[k];
}
ContentValues vals = new ContentValues();
ContentValues values = new ContentValues();
MySQLiteDatabaseHelper databaseHelper = new
MySQLiteDatabaseHelper(StartDSP.this);
SQLiteDatabase db = databaseHelper.getWritableDatabase();
//we're going to save every single impulse separately
for(int i = 0; i < numImpulses; i++)
{
double maxTemp = 0;
double[] tempImpBuffer = new double[width];
for(int k = 0; k < tempImpBuffer.length; k++)
{
Page 20
Orchisama Das August 2015
for(int n = 0; n < samplesPerPoint; n++)
tempImpBuffer[k] += (samples[i][k*samplesPerPoint + n] / REFSPL);
tempImpBuffer[k] /= (double)samplesPerPoint;
if(maxTemp < tempImpBuffer[k])
maxTemp = tempImpBuffer[k];
}
ByteBuffer byteImpBuffer = ByteBuffer.allocate(width*8);
for(int k = 0; k < width; k++)
byteImpBuffer.putDouble(tempImpBuffer[k]);
vals.put(TableEntry.COLUMN_NAME_IMPULSE + Integer.toString(i), byteImpBuffer.array());
}
double[] xVals = new double[tempBuffer.length];
double sampleRate = getResources().getInteger(R.integer.sample_rate);
for(int k = 0; k < xVals.length; k++)
xVals[k] = k* sampleRate / (2*xVals.length);
ByteBuffer byteBufferY = ByteBuffer.allocate(tempBuffer.length*8);
for(int k = 0; k < tempBuffer.length; k++)
byteBufferY.putDouble(tempBuffer[k]);
vals.put(TableEntry.COLUMN_NAME_YVALS, byteBufferY.array());
ByteBuffer byteBufferX = ByteBuffer.allocate(xVals.length*8);
for(int k = 0; k < xVals.length; k++)
byteBufferX.putDouble(xVals[k]);
vals.put(TableEntry.COLUMN_NAME_XVALS, byteBufferX.array());
String date = DateFormat.format("LLL dd, yyyy HH:mm", new Date()).toString();
vals.put(TableEntry.COLUMN_NAME_DATE, date);
vals.put(TableEntry.COLUMN_NAME_COMMENT, " - " + title);
db.insert(TableEntry.TABLE_NAME_FFT, null, vals);
Listing 5D – Do FFT and store in database
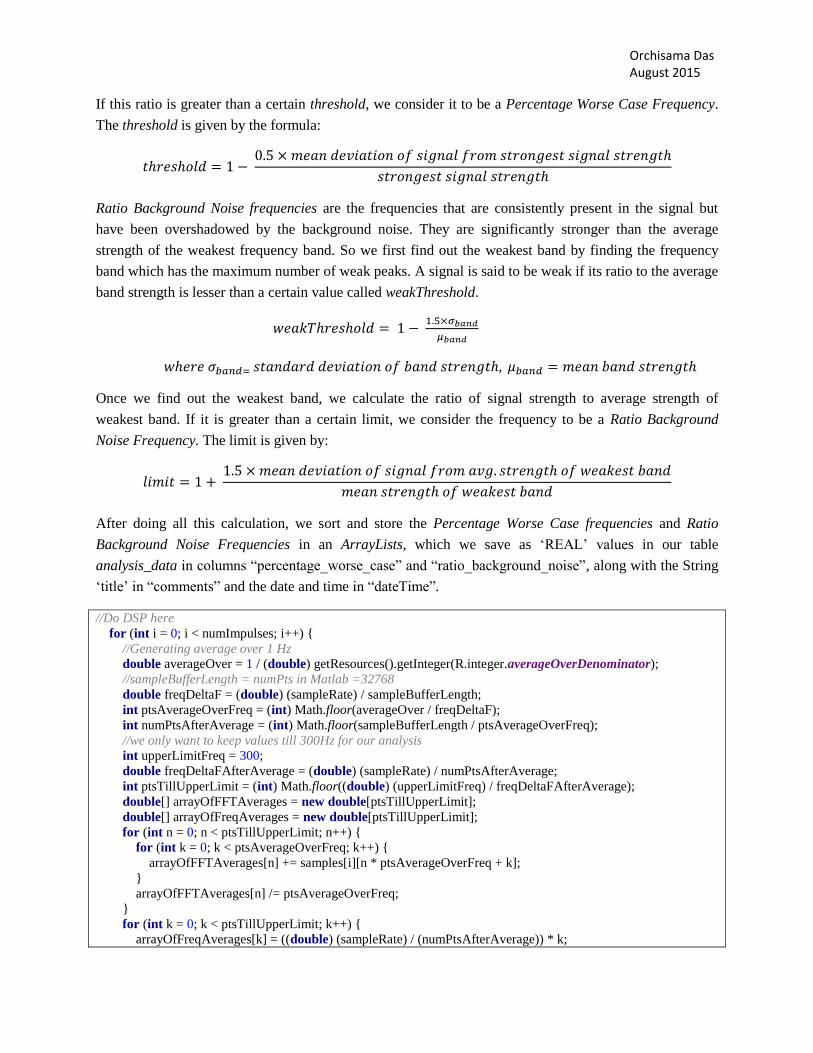
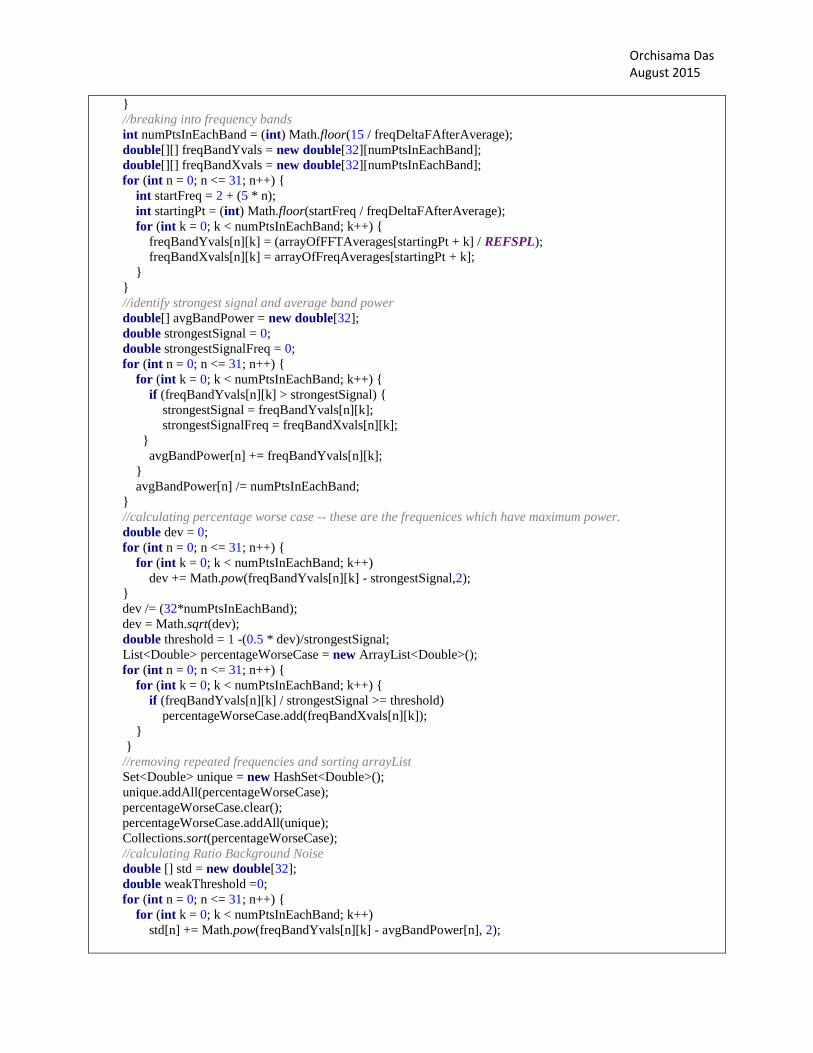
The next bit is where we do some real analysis on the data to figure out what frequencies are most
prominent in the signal (listing 5E). As mentioned before, we want to calculate two metrics – Percentage
Worse Case Frequencies and Ratio Background Noise Frequencies. To do so, we first pass a moving
average filter of width 1Hz over the entire frequency range. Since we are interested in low frequency
noise analysis, we only keep frequency domain information till 300Hz and discard the rest. Then, we
break the frequency range into 32 overlapping frequency bands of 15Hz each, with upper and lower limits
of each band given by:
So, the final frequency range is 2 Hz to 172 Hz.
To calculate Percentage Worse Case frequencies, i.e., the most prominent peaks in the magnitude
spectrum, we find out the strongest signal in the entire frequency range. A noise nuisance is said to have
occurred if the power of a particular frequency in a frequency band was greater than a specified
percentage of the strongest signal power. We would expect such signals to stand out from the background
noise. We calculate the ratio of strength of signal at particular frequency to the strongest signal strength.
Page 21
Orchisama Das August 2015
If this ratio is greater than a certain threshold, we consider it to be a Percentage Worse Case Frequency.
The threshold is given by the formula:
Ratio Background Noise frequencies are the frequencies that are consistently present in the signal but
have been overshadowed by the background noise. They are significantly stronger than the average
strength of the weakest frequency band. So we first find out the weakest band by finding the frequency
band which has the maximum number of weak peaks. A signal is said to be weak if its ratio to the average
band strength is lesser than a certain value called weakThreshold.
Once we find out the weakest band, we calculate the ratio of signal strength to average strength of
weakest band. If it is greater than a certain limit, we consider the frequency to be a Ratio Background
Noise Frequency. The limit is given by:
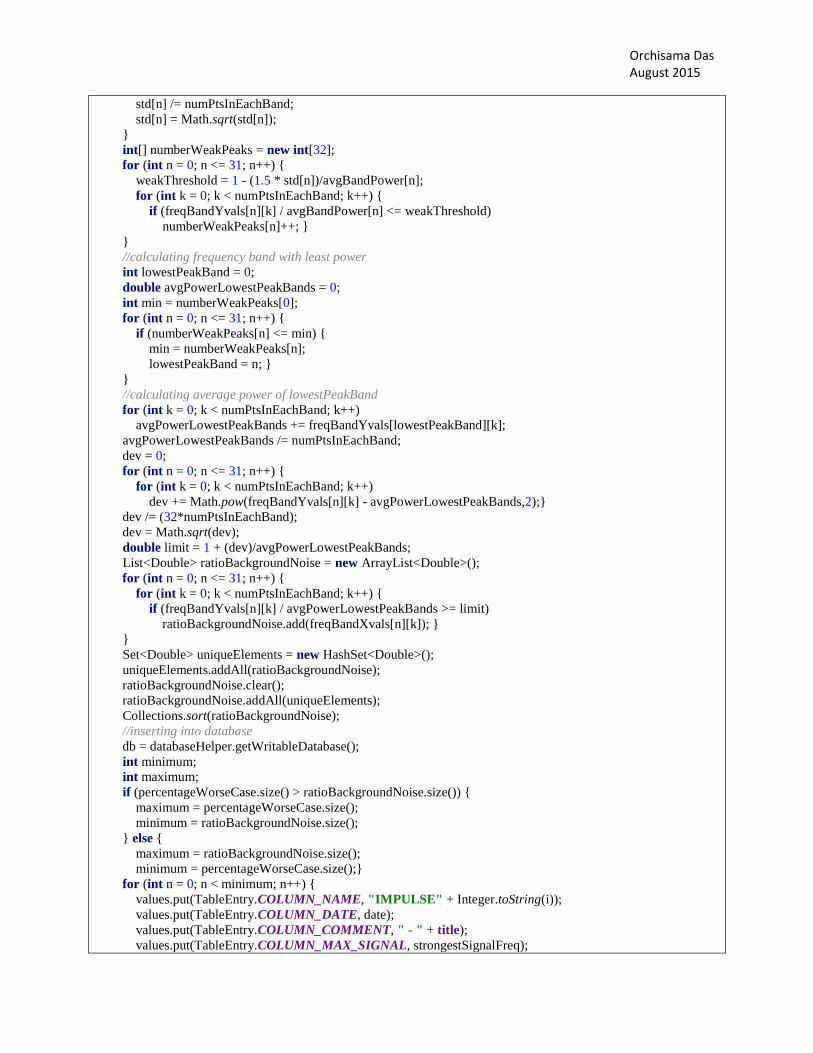
After doing all this calculation, we sort and store the Percentage Worse Case frequencies and Ratio
Background Noise Frequencies in an ArrayLists, which we save as ‗REAL‘ values in our table
analysis_data in columns ―percentage_worse_case‖ and ―ratio_background_noise‖, along with the String
‗title‘ in ―comments‖ and the date and time in ―dateTime‖.
//Do DSP here
for (int i = 0; i < numImpulses; i++) {
//Generating average over 1 Hz
double averageOver = 1 / (double) getResources().getInteger(R.integer.averageOverDenominator);
//sampleBufferLength = numPts in Matlab =32768
double freqDeltaF = (double) (sampleRate) / sampleBufferLength;
int ptsAverageOverFreq = (int) Math.floor(averageOver / freqDeltaF);
int numPtsAfterAverage = (int) Math.floor(sampleBufferLength / ptsAverageOverFreq);
//we only want to keep values till 300Hz for our analysis
int upperLimitFreq = 300;
double freqDeltaFAfterAverage = (double) (sampleRate) / numPtsAfterAverage;
int ptsTillUpperLimit = (int) Math.floor((double) (upperLimitFreq) / freqDeltaFAfterAverage);
double[] arrayOfFFTAverages = new double[ptsTillUpperLimit];
double[] arrayOfFreqAverages = new double[ptsTillUpperLimit];
for (int n = 0; n < ptsTillUpperLimit; n++) {
for (int k = 0; k < ptsAverageOverFreq; k++) {
arrayOfFFTAverages[n] += samples[i][n * ptsAverageOverFreq + k];
}
arrayOfFFTAverages[n] /= ptsAverageOverFreq;
}
for (int k = 0; k < ptsTillUpperLimit; k++) {
arrayOfFreqAverages[k] = ((double) (sampleRate) / (numPtsAfterAverage)) * k;
Page 22
Orchisama Das August 2015
}
//breaking into frequency bands
int numPtsInEachBand = (int) Math.floor(15 / freqDeltaFAfterAverage);
double[][] freqBandYvals = new double[32][numPtsInEachBand];
double[][] freqBandXvals = new double[32][numPtsInEachBand];
for (int n = 0; n <= 31; n++) {
int startFreq = 2 + (5 * n);
int startingPt = (int) Math.floor(startFreq / freqDeltaFAfterAverage);
for (int k = 0; k < numPtsInEachBand; k++) {
freqBandYvals[n][k] = (arrayOfFFTAverages[startingPt + k] / REFSPL);
freqBandXvals[n][k] = arrayOfFreqAverages[startingPt + k];
}
}
//identify strongest signal and average band power
double[] avgBandPower = new double[32];
double strongestSignal = 0;
double strongestSignalFreq = 0;
for (int n = 0; n <= 31; n++) {
for (int k = 0; k < numPtsInEachBand; k++) {
if (freqBandYvals[n][k] > strongestSignal) {
strongestSignal = freqBandYvals[n][k];
strongestSignalFreq = freqBandXvals[n][k];
}
avgBandPower[n] += freqBandYvals[n][k];
}
avgBandPower[n] /= numPtsInEachBand;
}
//calculating percentage worse case -- these are the frequenices which have maximum power.
double dev = 0;
for (int n = 0; n <= 31; n++) {
for (int k = 0; k < numPtsInEachBand; k++)
dev += Math.pow(freqBandYvals[n][k] - strongestSignal,2);
}
dev /= (32*numPtsInEachBand);
dev = Math.sqrt(dev);
double threshold = 1 -(0.5 * dev)/strongestSignal;
List<Double> percentageWorseCase = new ArrayList<Double>();
for (int n = 0; n <= 31; n++) {
for (int k = 0; k < numPtsInEachBand; k++) {
if (freqBandYvals[n][k] / strongestSignal >= threshold)
percentageWorseCase.add(freqBandXvals[n][k]);
}
}
//removing repeated frequencies and sorting arrayList
Set<Double> unique = new HashSet<Double>();
unique.addAll(percentageWorseCase);
percentageWorseCase.clear();
percentageWorseCase.addAll(unique);
Collections.sort(percentageWorseCase);
//calculating Ratio Background Noise
double [] std = new double[32];
double weakThreshold =0;
for (int n = 0; n <= 31; n++) {
for (int k = 0; k < numPtsInEachBand; k++)
std[n] += Math.pow(freqBandYvals[n][k] - avgBandPower[n], 2);
Page 23
Orchisama Das August 2015
std[n] /= numPtsInEachBand;
std[n] = Math.sqrt(std[n]);
}
int[] numberWeakPeaks = new int[32];
for (int n = 0; n <= 31; n++) {
weakThreshold = 1 - (1.5 * std[n])/avgBandPower[n];
for (int k = 0; k < numPtsInEachBand; k++) {
if (freqBandYvals[n][k] / avgBandPower[n] <= weakThreshold)
numberWeakPeaks[n]++; }
}
//calculating frequency band with least power
int lowestPeakBand = 0;
double avgPowerLowestPeakBands = 0;
int min = numberWeakPeaks[0];
for (int n = 0; n <= 31; n++) {
if (numberWeakPeaks[n] <= min) {
min = numberWeakPeaks[n];
lowestPeakBand = n; }
}
//calculating average power of lowestPeakBand
for (int k = 0; k < numPtsInEachBand; k++)
avgPowerLowestPeakBands += freqBandYvals[lowestPeakBand][k];
avgPowerLowestPeakBands /= numPtsInEachBand;
dev = 0;
for (int n = 0; n <= 31; n++) {
for (int k = 0; k < numPtsInEachBand; k++)
dev += Math.pow(freqBandYvals[n][k] - avgPowerLowestPeakBands,2);}
dev /= (32*numPtsInEachBand);
dev = Math.sqrt(dev);
double limit = 1 + (dev)/avgPowerLowestPeakBands;
List<Double> ratioBackgroundNoise = new ArrayList<Double>();
for (int n = 0; n <= 31; n++) {
for (int k = 0; k < numPtsInEachBand; k++) {
if (freqBandYvals[n][k] / avgPowerLowestPeakBands >= limit)
ratioBackgroundNoise.add(freqBandXvals[n][k]); }
}
Set<Double> uniqueElements = new HashSet<Double>();
uniqueElements.addAll(ratioBackgroundNoise);
ratioBackgroundNoise.clear();
ratioBackgroundNoise.addAll(uniqueElements);
Collections.sort(ratioBackgroundNoise);
//inserting into database
db = databaseHelper.getWritableDatabase();
int minimum;
int maximum;
if (percentageWorseCase.size() > ratioBackgroundNoise.size()) {
maximum = percentageWorseCase.size();
minimum = ratioBackgroundNoise.size();
} else {
maximum = ratioBackgroundNoise.size();
minimum = percentageWorseCase.size();}
for (int n = 0; n < minimum; n++) {
values.put(TableEntry.COLUMN_NAME, "IMPULSE" + Integer.toString(i));
values.put(TableEntry.COLUMN_DATE, date);
values.put(TableEntry.COLUMN_COMMENT, " - " + title);
values.put(TableEntry.COLUMN_MAX_SIGNAL, strongestSignalFreq);
Page 24
Orchisama Das August 2015
values.put(TableEntry.COLUMN_PERCENTAGE_WORSE_CASE, percentageWorseCase.get(n));
values.put(TableEntry.COLUMN_RATIO_BACKGROUND_NOSE, ratioBackgroundNoise.get(n));
db.insert(TableEntry.TABLE_NAME, null, values);
}
for (int n = minimum; n < maximum; n++) {
values.put(TableEntry.COLUMN_NAME, "IMPULSE" + Integer.toString(i));
values.put(TableEntry.COLUMN_DATE, date);
values.put(TableEntry.COLUMN_COMMENT, " - " +title);
values.put(TableEntry.COLUMN_MAX_SIGNAL, strongestSignalFreq);
if (maximum == ratioBackgroundNoise.size()) {
values.put(TableEntry.COLUMN_PERCENTAGE_WORSE_CASE, 0.0);
values.put(TableEntry.COLUMN_RATIO_BACKGROUND_NOSE, ratioBackgroundNoise.get(n));
} else {
values.put(TableEntry.COLUMN_PERCENTAGE_WORSE_CASE, percentageWorseCase.get(n));
values.put(TableEntry.COLUMN_RATIO_BACKGROUND_NOSE, 0.0); }
db.insert(TableEntry.TABLE_NAME, null, values);
}
int prog = (int) 100 * (i + 1) / numImpulses;
publishProgress(-1, -1, prog, -1);
}
db.close();
if (isCancelled())
return -1;
else
return 0;
}
Listing 5E – Data analysis and storage
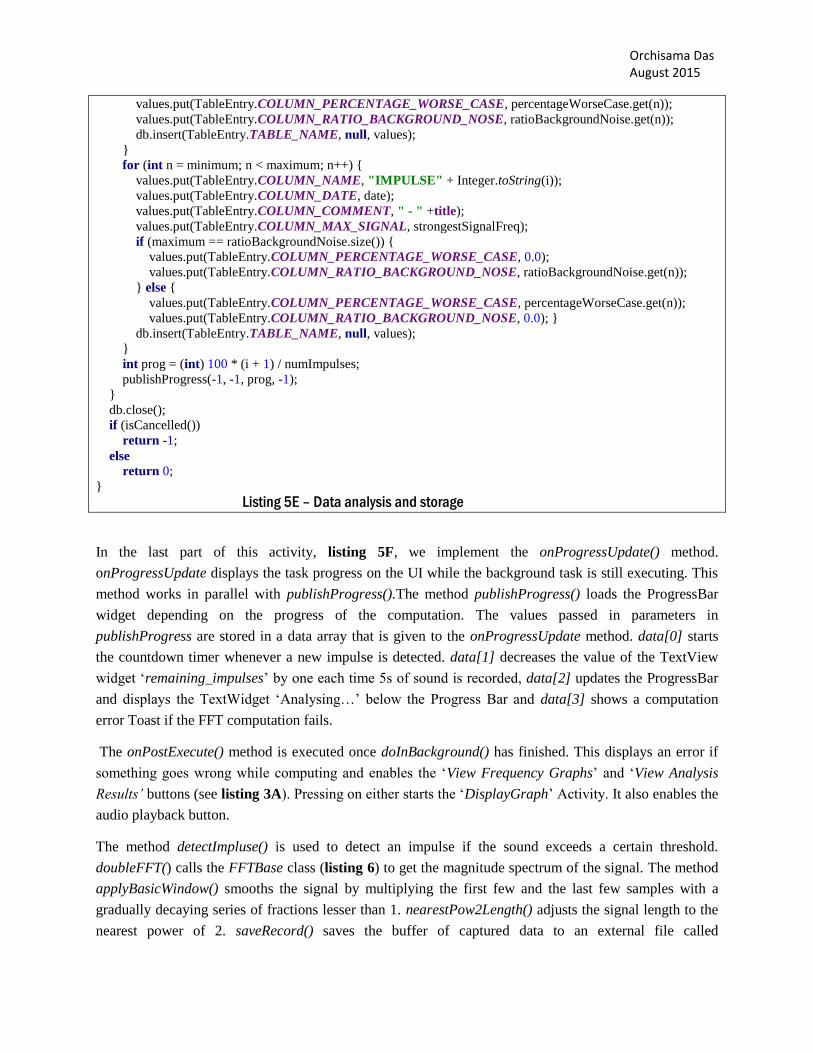
In the last part of this activity, listing 5F, we implement the onProgressUpdate() method.
onProgressUpdate displays the task progress on the UI while the background task is still executing. This
method works in parallel with publishProgress().The method publishProgress() loads the ProgressBar
widget depending on the progress of the computation. The values passed in parameters in
publishProgress are stored in a data array that is given to the onProgressUpdate method. data[0] starts
the countdown timer whenever a new impulse is detected. data[1] decreases the value of the TextView
widget ‗remaining_impulses‘ by one each time 5s of sound is recorded, data[2] updates the ProgressBar
and displays the TextWidget ‗Analysing…‘ below the Progress Bar and data[3] shows a computation
error Toast if the FFT computation fails.
The onPostExecute() method is executed once doInBackground() has finished. This displays an error if
something goes wrong while computing and enables the ‗View Frequency Graphs‘ and ‗View Analysis
Results‟ buttons (see listing 3A). Pressing on either starts the ‗DisplayGraph‘ Activity. It also enables the
audio playback button.
The method detectImpluse() is used to detect an impulse if the sound exceeds a certain threshold.
doubleFFT() calls the FFTBase class (listing 6) to get the magnitude spectrum of the signal. The method
applyBasicWindow() smooths the signal by multiplying the first few and the last few samples with a
gradually decaying series of fractions lesser than 1. nearestPow2Length() adjusts the signal length to the
nearest power of 2. saveRecord() saves the buffer of captured data to an external file called
Page 25
Orchisama Das August 2015
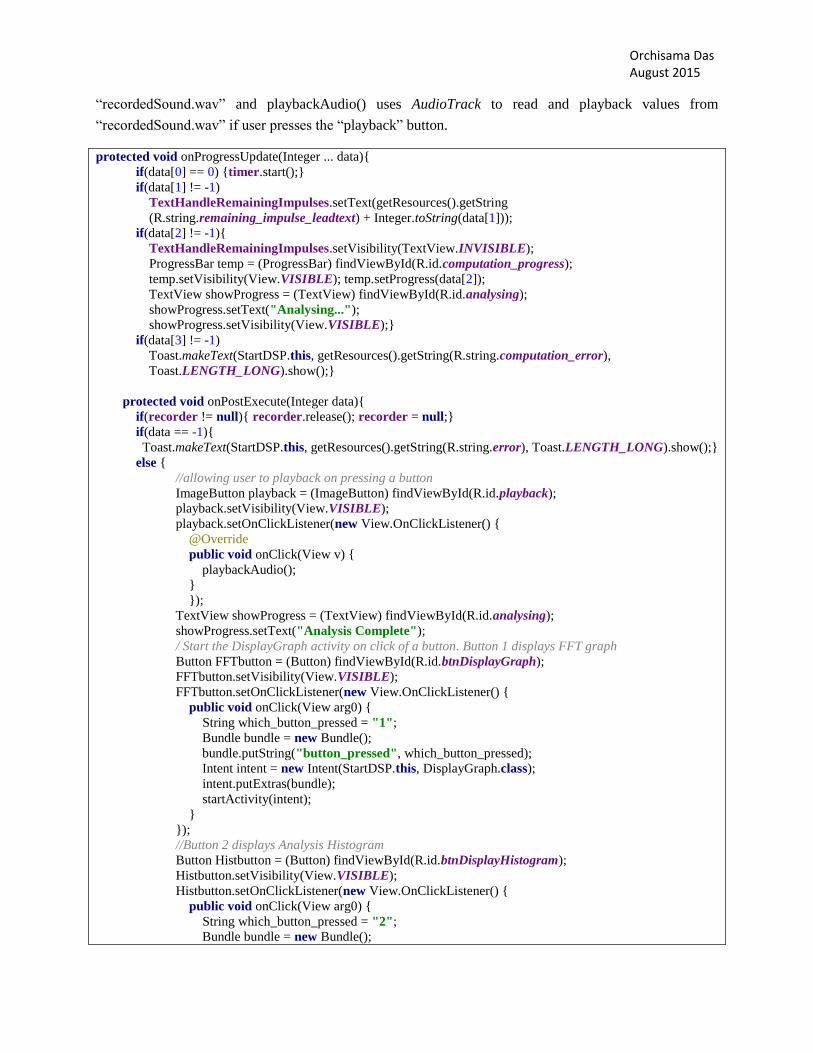
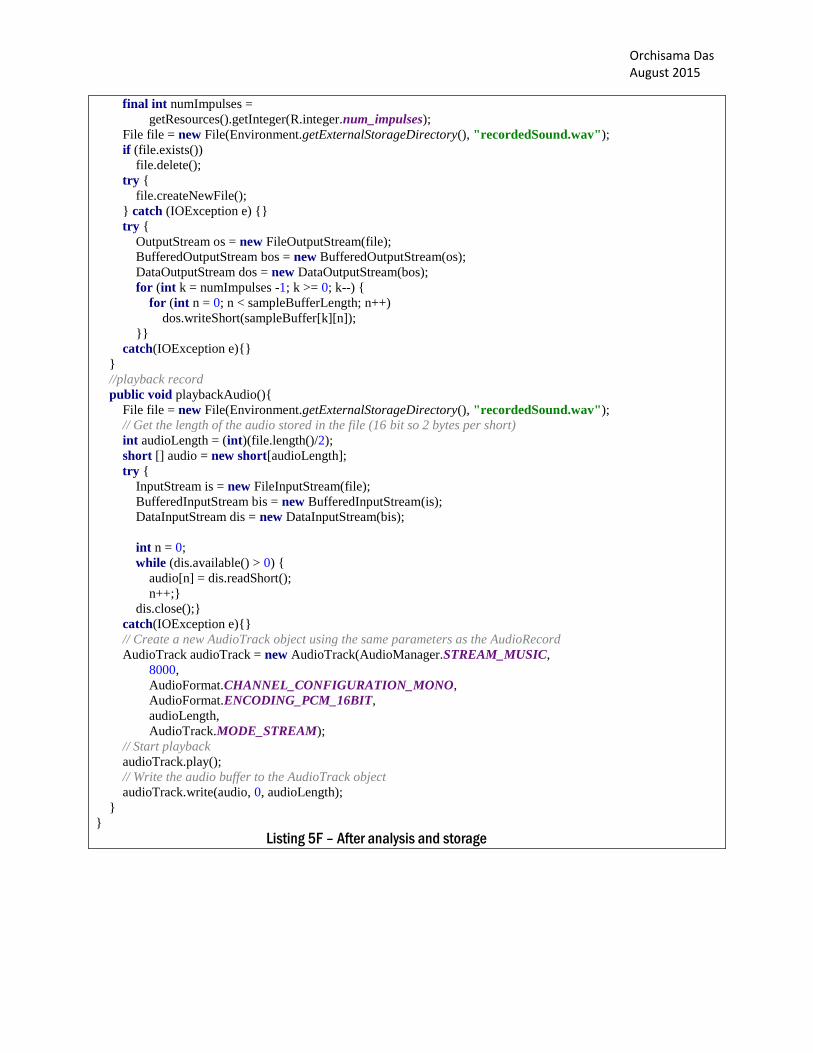
―recordedSound.wav‖ and playbackAudio() uses AudioTrack to read and playback values from
―recordedSound.wav‖ if user presses the ―playback‖ button.
protected void onProgressUpdate(Integer ... data){
if(data[0] == 0) {timer.start();}
if(data[1] != -1)
TextHandleRemainingImpulses.setText(getResources().getString
(R.string.remaining_impulse_leadtext) + Integer.toString(data[1]));
if(data[2] != -1){
TextHandleRemainingImpulses.setVisibility(TextView.INVISIBLE);
ProgressBar temp = (ProgressBar) findViewById(R.id.computation_progress);
temp.setVisibility(View.VISIBLE); temp.setProgress(data[2]);
TextView showProgress = (TextView) findViewById(R.id.analysing);
showProgress.setText("Analysing...");
showProgress.setVisibility(View.VISIBLE);}
if(data[3] != -1)
Toast.makeText(StartDSP.this, getResources().getString(R.string.computation_error),
Toast.LENGTH_LONG).show();}
protected void onPostExecute(Integer data){
if(recorder != null){ recorder.release(); recorder = null;}
if(data == -1){
Toast.makeText(StartDSP.this, getResources().getString(R.string.error), Toast.LENGTH_LONG).show();}
else {
//allowing user to playback on pressing a button
ImageButton playback = (ImageButton) findViewById(R.id.playback);
playback.setVisibility(View.VISIBLE);
playback.setOnClickListener(new View.OnClickListener() {
@Override
public void onClick(View v) {
playbackAudio();
}
});
TextView showProgress = (TextView) findViewById(R.id.analysing);
showProgress.setText("Analysis Complete");
/ Start the DisplayGraph activity on click of a button. Button 1 displays FFT graph
Button FFTbutton = (Button) findViewById(R.id.btnDisplayGraph);
FFTbutton.setVisibility(View.VISIBLE);
FFTbutton.setOnClickListener(new View.OnClickListener() {
public void onClick(View arg0) {
String which_button_pressed = "1";
Bundle bundle = new Bundle();
bundle.putString("button_pressed", which_button_pressed);
Intent intent = new Intent(StartDSP.this, DisplayGraph.class);
intent.putExtras(bundle);
startActivity(intent);
}
});
//Button 2 displays Analysis Histogram
Button Histbutton = (Button) findViewById(R.id.btnDisplayHistogram);
Histbutton.setVisibility(View.VISIBLE);
Histbutton.setOnClickListener(new View.OnClickListener() {
public void onClick(View arg0) {
String which_button_pressed = "2";
Bundle bundle = new Bundle();
Page 26
Orchisama Das August 2015
bundle.putString("button_pressed", which_button_pressed);
Intent intent = new Intent(StartDSP.this, DisplayGraph.class);
intent.putExtras(bundle);
startActivity(intent);
}
});
return;
}}
protected void onCancelled(){
if(recorder != null){recorder.release();recorder = null;}}
protected boolean detectImpulse(short[] samples){
int threshold = getResources().getInteger(R.integer.detect_threshold);
for(int k = 0; k < samples.length; k++){
if(samples[k] >= threshold){return true;}}
return false;
}
protected int doubleFFT(double[][] samples, int numImpulses, int sampleSize){
double[] real = new double[sampleSize]; double[] imag = new double[sampleSize];
for(int k = 0; k < numImpulses; k++){
System.arraycopy(samples[k], 0, real, 0, sampleSize);
for(int n = 0; n < sampleSize; n++)
imag[n] = 0; int error = FFTbase.fft(real, imag, true);
if(error == -1) {return -1;}
for(int n = 0; n < sampleSize; n++)
samples[k][n] = Math.sqrt(real[n]*real[n] + imag[n]*imag[n]);
if(isCancelled()) {return -1;}
}
return 0;}}
protected void applyBasicWindow(double[][] samples, int numImpulses, int sampleLength)
{
for(int k = 0; k < numImpulses; k++)
{
samples[k][0] *= 0.0625;
samples[k][1] *= 0.125;
samples[k][2] *= 0.25;
samples[k][3] *= 0.5;
samples[k][4] *= 0.75;
samples[k][5] *= 0.875;
samples[k][6] *= 0.9375;
samples[k][sampleLength - 7] *= 0.9375;
samples[k][sampleLength - 6] *= 0.875;
samples[k][sampleLength - 5] *= 0.75;
samples[k][sampleLength - 4] *= 0.5;
samples[k][sampleLength - 3] *= 0.25;
samples[k][sampleLength - 2] *= 0.125;
samples[k][sampleLength - 1] *= 0.0625;
}
return;
}
public static int nearestPow2Length(int length){
int temp = (int) (Math.log(length) / Math.log(2.0) + 0.5);length = 1;
for(int n = 1; n <= temp; n++) {length = length * 2;}
return length;}
//save recorded data in an external file to enable user to playback
public void saveRecord(short sampleBuffer[][], int sampleBufferLength){
Page 27
Orchisama Das August 2015
final int numImpulses =
getResources().getInteger(R.integer.num_impulses);
File file = new File(Environment.getExternalStorageDirectory(), "recordedSound.wav");
if (file.exists())
file.delete();
try {
file.createNewFile();
} catch (IOException e) {}
try {
OutputStream os = new FileOutputStream(file);
BufferedOutputStream bos = new BufferedOutputStream(os);
DataOutputStream dos = new DataOutputStream(bos);
for (int k = numImpulses -1; k >= 0; k--) {
for (int n = 0; n < sampleBufferLength; n++)
dos.writeShort(sampleBuffer[k][n]);
}}
catch(IOException e){}
}
//playback record
public void playbackAudio(){
File file = new File(Environment.getExternalStorageDirectory(), "recordedSound.wav");
// Get the length of the audio stored in the file (16 bit so 2 bytes per short)
int audioLength = (int)(file.length()/2);
short [] audio = new short[audioLength];
try {
InputStream is = new FileInputStream(file);
BufferedInputStream bis = new BufferedInputStream(is);
DataInputStream dis = new DataInputStream(bis);
int n = 0;
while (dis.available() > 0) {
audio[n] = dis.readShort();
n++;}
dis.close();}
catch(IOException e){}
// Create a new AudioTrack object using the same parameters as the AudioRecord
AudioTrack audioTrack = new AudioTrack(AudioManager.STREAM_MUSIC,
8000,
AudioFormat.CHANNEL_CONFIGURATION_MONO,
AudioFormat.ENCODING_PCM_16BIT,
audioLength,
AudioTrack.MODE_STREAM);
// Start playback
audioTrack.play();
// Write the audio buffer to the AudioTrack object
audioTrack.write(audio, 0, audioLength);
}
}
Listing 5F – After analysis and storage
Page 28
Orchisama Das August 2015
package com.example.orchisamadas.sound_record_analyse;
public class FFTbase {
public static int fft(final double[] inputReal, double[]inputImag, boolean DIRECT) {
int n = inputReal.length;
double ld = Math.log(n) / Math.log(2.0);
if (((int) ld) - ld != 0) {return -1;}
int nu = (int) ld; int n2 = n / 2; int nu1 = nu - 1;
double tReal, tImag, p, arg, c, s;// check if direct transform or//the inverse transform.
double constant;
if (DIRECT) {constant = -2 * Math.PI;}
else {constant = 2 * Math.PI;}// First phase - calculation
int k = 0;
for (int l = 1; l <= nu; l++) {
while (k < n) {
for (int i = 1; i <= n2; i++) {
p = bitreverseReference(k >> nu1, nu);
arg = constant * p / n;
c = Math.cos(arg); s = Math.sin(arg);
tReal = inputReal[k + n2] * c + inputImag[k + n2] * s;
tImag = inputImag[k + n2] * c - inputReal[k + n2] * s;
inputReal[k + n2] = inputReal[k] - tReal;
inputImag[k + n2] = inputImag[k] - tImag;
inputReal[k] += tReal; inputImag[k] += tImag;
k++;
}
k += n2;
}
k = 0; nu1--; n2 /= 2;
}// Second phase - recombination
k = 0; int r;
while (k < n) {
r = bitreverseReference(k, nu);
if (r > k) {
tReal = inputReal[k]; tImag = inputImag[k];
inputReal[k] = inputReal[r]; inputImag[k] =inputImag[r];
inputReal[r] = tReal; inputImag[r] = tImag;
}
k++;
}
double radice = 1 / Math.sqrt(n);
for (int i = 0; i < inputReal.length; i++) {
inputReal[i] = inputReal[i] * radice;
inputImag[i] = inputImag[i] * radice;
}
return 0;
}//The reference bitreverse function
private static int bitreverseReference(int j, int nu) {
int j2; int j1 = j; int k = 0;
for (int i = 1; i <= nu; i++) {j2 = j1 / 2; k = 2 * k + j1 - 2 *j2; j1 = j2; }
return k;
}
}
Listing 6 – FFTBase.java
Page 29
Orchisama Das August 2015
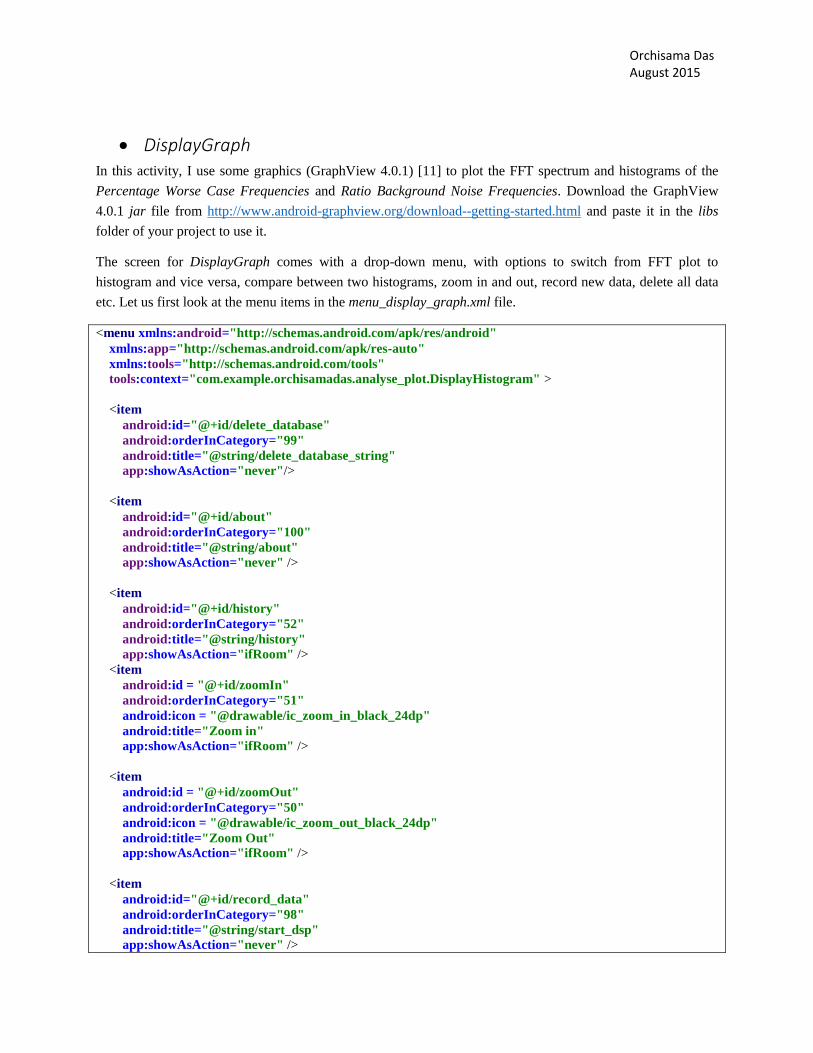
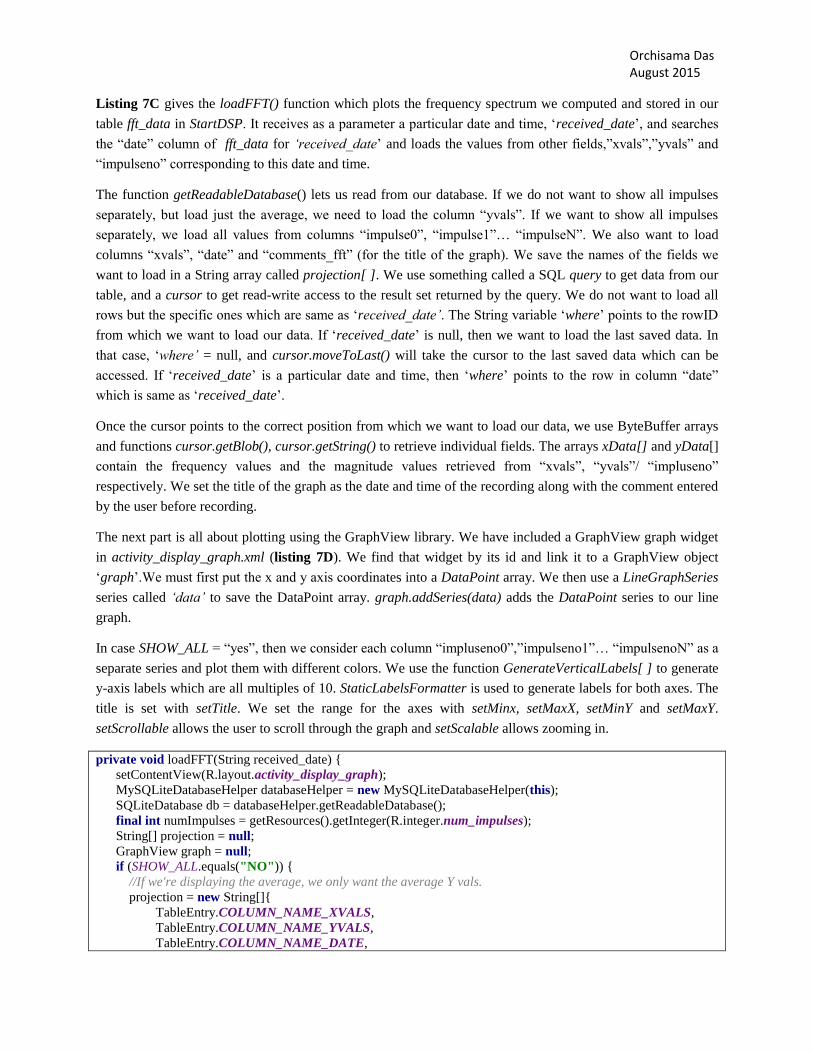
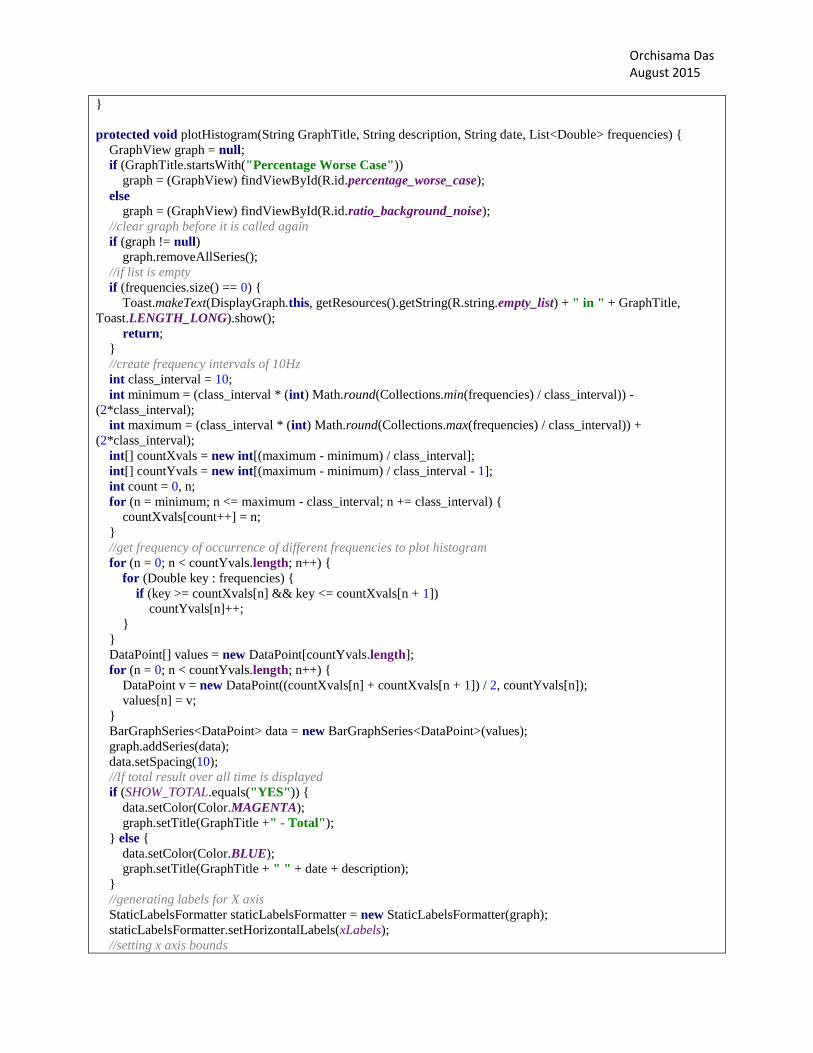
DisplayGraph In this activity, I use some graphics (GraphView 4.0.1) [11] to plot the FFT spectrum and histograms of the
Percentage Worse Case Frequencies and Ratio Background Noise Frequencies. Download the GraphView
4.0.1 jar file from http://www.android-graphview.org/download--getting-started.html and paste it in the libs
folder of your project to use it.
The screen for DisplayGraph comes with a drop-down menu, with options to switch from FFT plot to
histogram and vice versa, compare between two histograms, zoom in and out, record new data, delete all data
etc. Let us first look at the menu items in the menu_display_graph.xml file.
<menu xmlns:android="http://schemas.android.com/apk/res/android"
xmlns:app="http://schemas.android.com/apk/res-auto"
xmlns:tools="http://schemas.android.com/tools"
tools:context="com.example.orchisamadas.analyse_plot.DisplayHistogram" >
<item
android:id="@+id/delete_database"
android:orderInCategory="99"
android:title="@string/delete_database_string"
app:showAsAction="never"/>
<item
android:id="@+id/about"
android:orderInCategory="100"
android:title="@string/about"
app:showAsAction="never" />
<item
android:id="@+id/history"
android:orderInCategory="52"
android:title="@string/history"
app:showAsAction="ifRoom" />
<item
android:id = "@+id/zoomIn"
android:orderInCategory="51"
android:icon = "@drawable/ic_zoom_in_black_24dp"
android:title="Zoom in"
app:showAsAction="ifRoom" />
<item
android:id = "@+id/zoomOut"
android:orderInCategory="50"
android:icon = "@drawable/ic_zoom_out_black_24dp"
android:title="Zoom Out"
app:showAsAction="ifRoom" />
<item
android:id="@+id/record_data"
android:orderInCategory="98"
android:title="@string/start_dsp"
app:showAsAction="never" />
Page 30
Orchisama Das August 2015
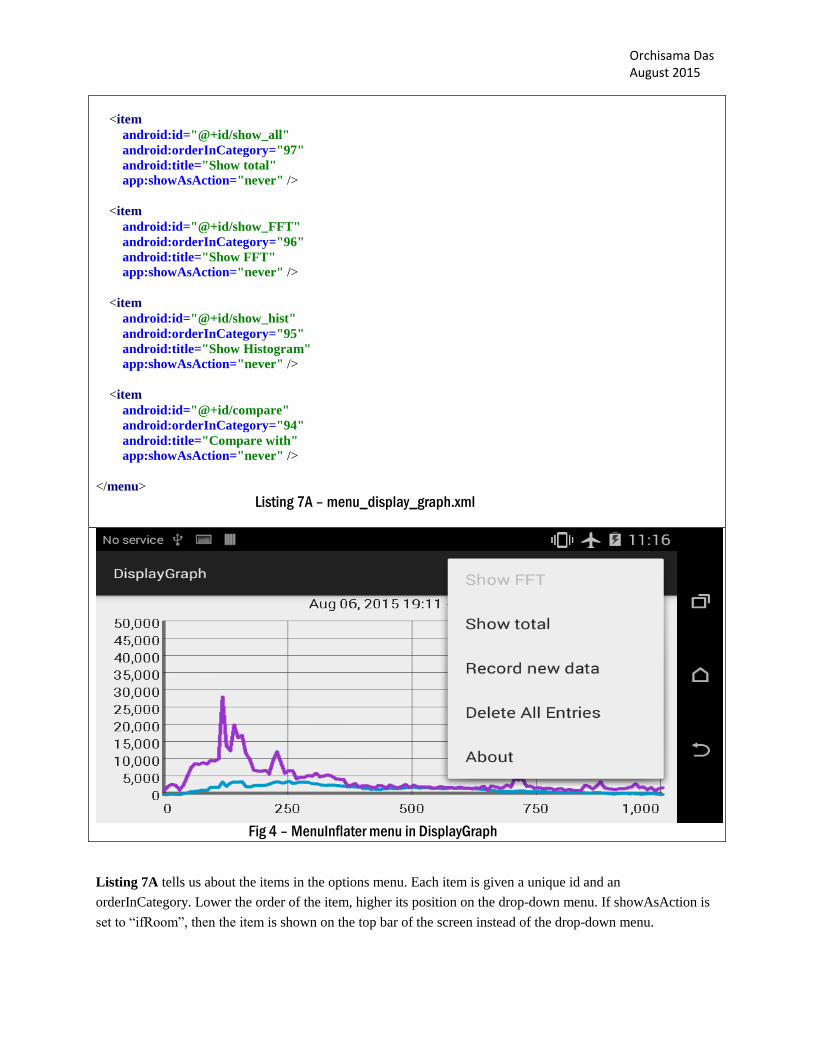
<item
android:id="@+id/show_all"
android:orderInCategory="97"
android:title="Show total"
app:showAsAction="never" />
<item
android:id="@+id/show_FFT"
android:orderInCategory="96"
android:title="Show FFT"
app:showAsAction="never" />
<item
android:id="@+id/show_hist"
android:orderInCategory="95"
android:title="Show Histogram"
app:showAsAction="never" />
<item
android:id="@+id/compare"
android:orderInCategory="94"
android:title="Compare with"
app:showAsAction="never" />
</menu>
Listing 7A – menu_display_graph.xml
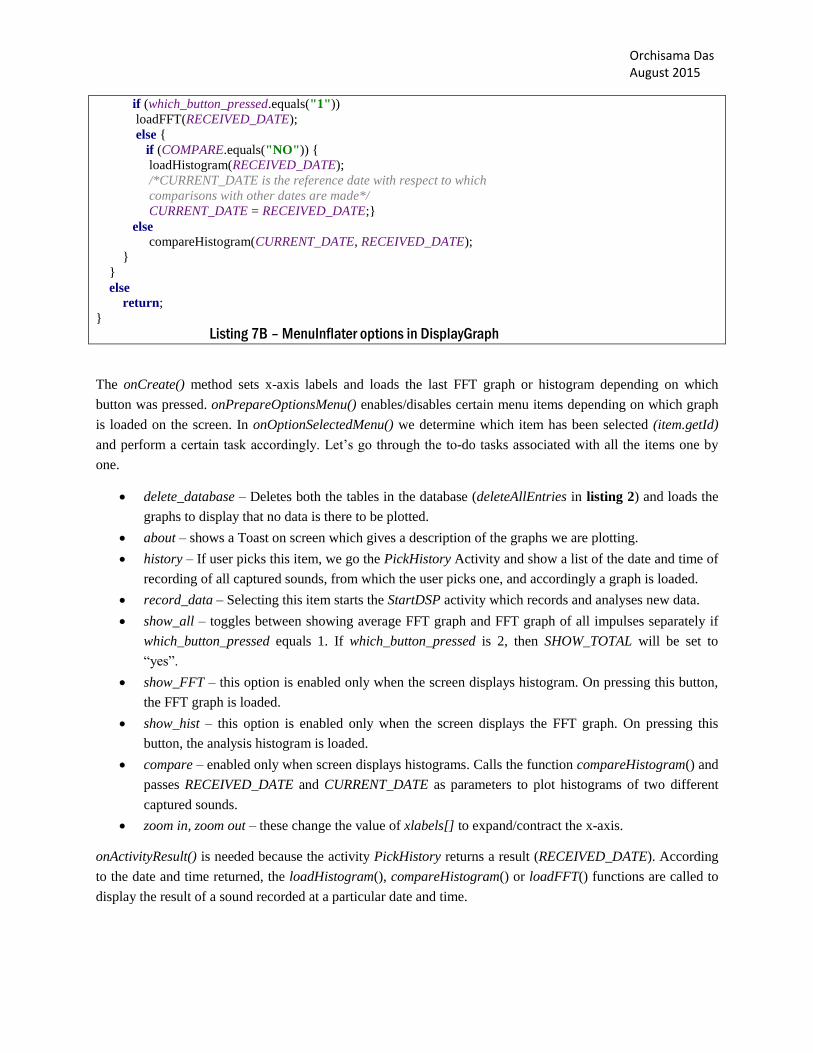
Fig 4 – MenuInflater menu in DisplayGraph
Listing 7A tells us about the items in the options menu. Each item is given a unique id and an
orderInCategory. Lower the order of the item, higher its position on the drop-down menu. If showAsAction is
set to ―ifRoom‖, then the item is shown on the top bar of the screen instead of the drop-down menu.
Page 31
Orchisama Das August 2015
Listing 7B describes what action is to be performed when one of the items in the menu is selected. Before that,
we declare some global variables used throughout the activity.
As mentioned before, we can compare results of two different recordings or see the result of any recording
based on the date and time at which it was recorded. We give the user a list of the date and time of recording of
all captured sounds along with their comments in the PickHistory Activity (explained later) and allow them to
choose one. We can look up the table in our database according to the date-time selected by the user, and get
values for all the other fields.
CURRENT_DATE is initialised to null by default because we want to show the result of the last captured
audio in case no date is picked by the user. When the user wants to compare between two captured sounds, or
wants to display the result of an old captured sound, the PickHistory Activity is called which returns the date
and time picked by the user in RECEIVED_DATE. request = 1 means that we always request a result from the
PickHistory Activity. which_button_pressed determines which plot to load – FFT graph or the histogram. If
SHOW_ALL is ―yes‖ then all the impulses are shown separately in the FFT graph; if ―no‖ then their average is
shown. If SHOW_TOTAL is ―yes‖, Percentage Worse Case frequencies and Ratio Background Noise
frequencies of all the recorded audio so far are plotted in the histogram. COMPARE determines whether
comparison of two different captured sounds is to be done or not. xLabels[] is the array of x-axis labels for our
graphs.
package com.example.orchisamadas.sound_record_analyse;
import java.nio.ByteBuffer;
import java.util.ArrayList;
import java.util.Collections;
import java.util.List;
import com.example.orchisamadas.sound_record_analyse.
MySQLiteDatabaseContract.TableEntry;
import android.content.Intent;
import android.database.Cursor;
import android.database.sqlite.SQLiteDatabase;
import android.graphics.Color;
import android.os.Bundle;
import android.support.v7.app.ActionBarActivity;
import android.util.Log;
import android.view.Menu;
import android.view.MenuItem;
import android.widget.Toast;
import com.jjoe64.graphview.GraphView;
import com.jjoe64.graphview.LegendRenderer;
import com.jjoe64.graphview.helper.StaticLabelsFormatter;
import com.jjoe64.graphview.series.BarGraphSeries;
import com.jjoe64.graphview.series.DataPoint;
import com.jjoe64.graphview.series.LineGraphSeries;
public class DisplayGraph extends ActionBarActivity {
//if received date is null, current/previous graph is loaded
public static String RECEIVED_DATE = null;
public static String CURRENT_DATE =null;
public static String which_button_pressed = null;
public static final int request = 1;
//Shows results of all recordings
Page 32
Orchisama Das August 2015
public static String SHOW_ALL = "NO";
public static String SHOW_TOTAL = "NO";
public static String COMPARE = "NO";
//setting x axis labels to allow zoom in and out in histograms
public static String [] xLabels = new String [12];
@Override
protected void onCreate(Bundle savedInstanceState) {
super.onCreate(savedInstanceState);
//default xaxis labels
for(int n = 0;n < xLabels.length;n++)
xLabels[n] = Integer.toString(20 + (20*n));
//RECEIVED_DATE should always point to last recorded/current data unless History is selected
RECEIVED_DATE = null;
Bundle bundle = getIntent().getExtras();
which_button_pressed = bundle.getString("button_pressed");
if (which_button_pressed.equals("1"))
loadFFT(RECEIVED_DATE);
else if (which_button_pressed.equals("2"))
loadHistogram(RECEIVED_DATE);
}
//Options menu start
@Override
public boolean onCreateOptionsMenu(Menu menu) {
// Inflate the menu; this adds items to the action bar if it is present.
getMenuInflater().inflate(R.menu.menu_display_graph, menu);
return true;
}
//disabling compare and Show FFT options for FFT graph. Disabling Show Histogram option for
//Histogram graph. Enabling Show Histogram and Show FFT options for compare Histogram graph.
@Override
public boolean onPrepareOptionsMenu (Menu menu) {
if (which_button_pressed.equals("1")) {
menu.findItem(R.id.compare).setEnabled(false);
menu.findItem(R.id.show_hist).setEnabled(true);
menu.findItem(R.id.show_FFT).setEnabled(false);
}
else {
if (COMPARE.equals("YES"))
menu.findItem(R.id.show_hist).setEnabled(true);
else
menu.findItem(R.id.show_hist).setEnabled(false);
menu.findItem(R.id.compare).setEnabled(true);
menu.findItem(R.id.show_FFT).setEnabled(true);
}
return true;
}
@Override
public boolean onOptionsItemSelected(MenuItem item) {
int id = item.getItemId();
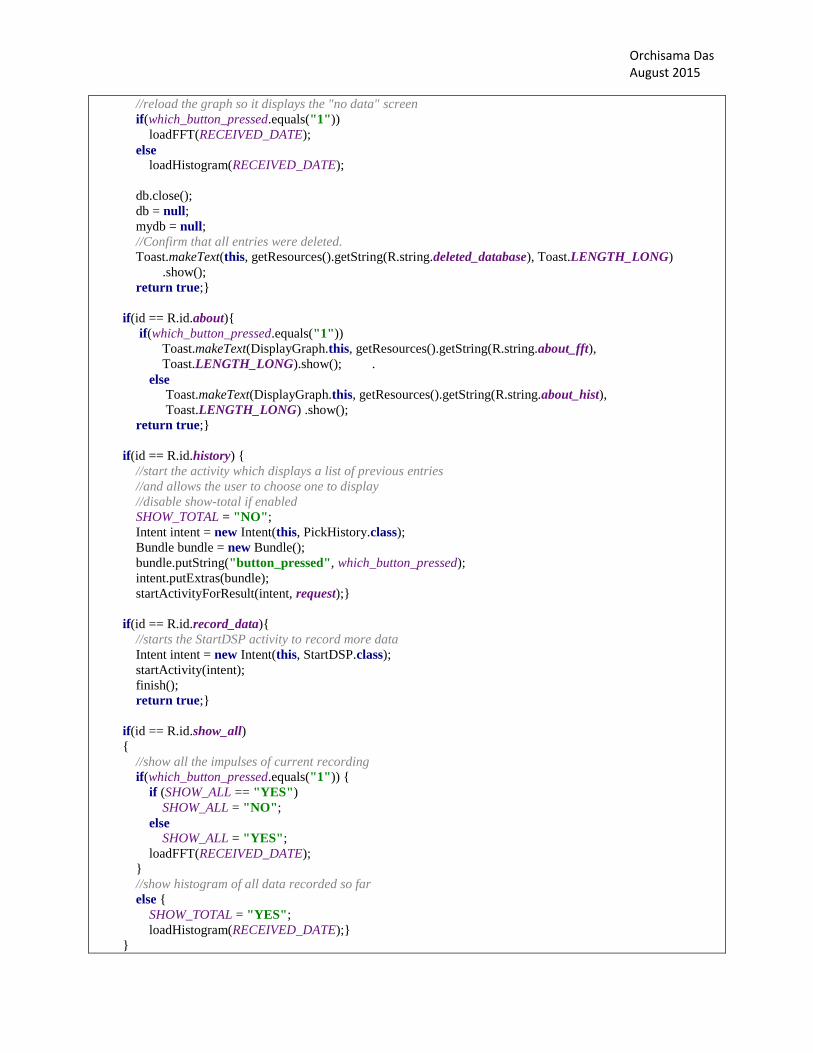
if (id == R.id.delete_database) {
//delete all entries
MySQLiteDatabaseHelper mydb = new MySQLiteDatabaseHelper(this);
SQLiteDatabase db = mydb.getWritableDatabase();
mydb.deleteAllEntries(db, TableEntry.TABLE_NAME_FFT);
mydb.deleteAllEntries(db, TableEntry.TABLE_NAME);
Page 33
Orchisama Das August 2015
//reload the graph so it displays the "no data" screen
if(which_button_pressed.equals("1"))
loadFFT(RECEIVED_DATE);
else
loadHistogram(RECEIVED_DATE);
db.close();
db = null;
mydb = null;
//Confirm that all entries were deleted.
Toast.makeText(this, getResources().getString(R.string.deleted_database), Toast.LENGTH_LONG)
.show();
return true;}
if(id == R.id.about){
if(which_button_pressed.equals("1"))
Toast.makeText(DisplayGraph.this, getResources().getString(R.string.about_fft),
Toast.LENGTH_LONG).show(); .
else Toast.makeText(DisplayGraph.this, getResources().getString(R.string.about_hist),
Toast.LENGTH_LONG) .show();
return true;}
if(id == R.id.history) {
//start the activity which displays a list of previous entries
//and allows the user to choose one to display
//disable show-total if enabled
SHOW_TOTAL = "NO";
Intent intent = new Intent(this, PickHistory.class);
Bundle bundle = new Bundle();
bundle.putString("button_pressed", which_button_pressed);
intent.putExtras(bundle);
startActivityForResult(intent, request);}
if(id == R.id.record_data){
//starts the StartDSP activity to record more data
Intent intent = new Intent(this, StartDSP.class);
startActivity(intent);
finish();
return true;}
if(id == R.id.show_all)
{
//show all the impulses of current recording
if(which_button_pressed.equals("1")) {
if (SHOW_ALL == "YES")
SHOW_ALL = "NO";
else
SHOW_ALL = "YES";
loadFFT(RECEIVED_DATE);
}
//show histogram of all data recorded so far
else {
SHOW_TOTAL = "YES";
loadHistogram(RECEIVED_DATE);}
}
Page 34
Orchisama Das August 2015
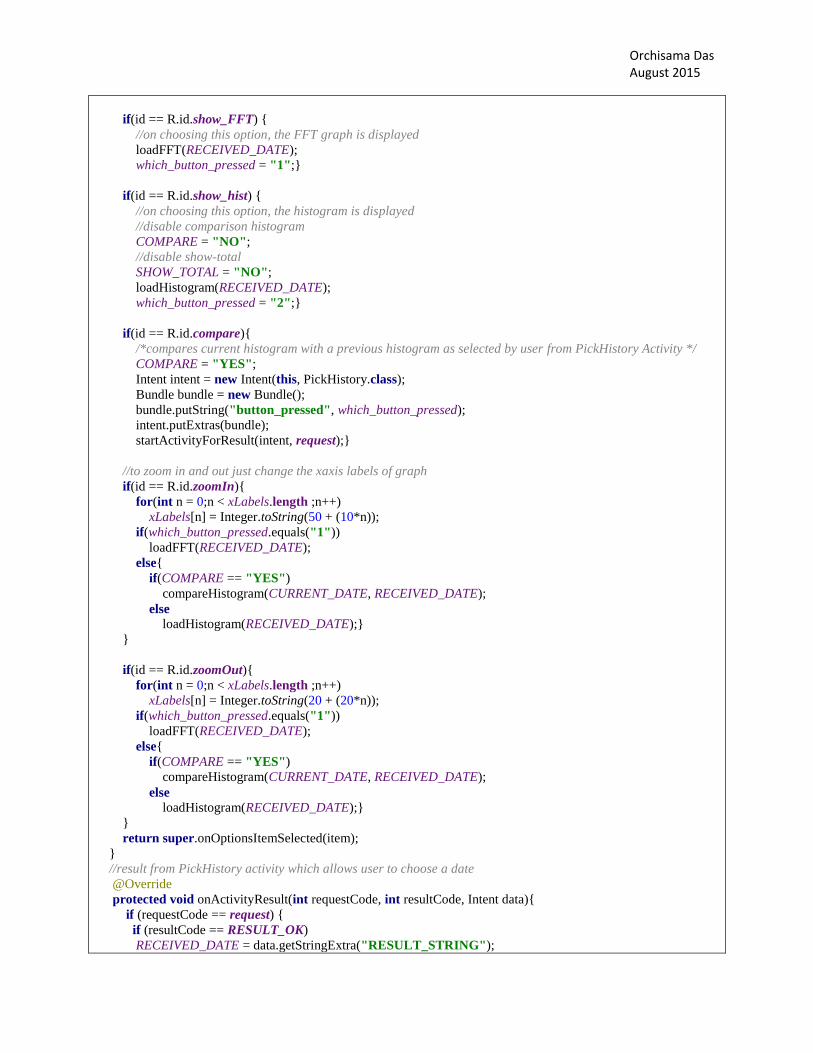
if(id == R.id.show_FFT) {
//on choosing this option, the FFT graph is displayed
loadFFT(RECEIVED_DATE);
which_button_pressed = "1";}
if(id == R.id.show_hist) {
//on choosing this option, the histogram is displayed
//disable comparison histogram
COMPARE = "NO";
//disable show-total
SHOW_TOTAL = "NO";
loadHistogram(RECEIVED_DATE);
which_button_pressed = "2";}
if(id == R.id.compare){
/*compares current histogram with a previous histogram as selected by user from PickHistory Activity */
COMPARE = "YES";
Intent intent = new Intent(this, PickHistory.class);
Bundle bundle = new Bundle();
bundle.putString("button_pressed", which_button_pressed);
intent.putExtras(bundle);
startActivityForResult(intent, request);}
//to zoom in and out just change the xaxis labels of graph
if(id == R.id.zoomIn){
for(int n = 0;n < xLabels.length ;n++)
xLabels[n] = Integer.toString(50 + (10*n));
if(which_button_pressed.equals("1"))
loadFFT(RECEIVED_DATE);
else{
if(COMPARE == "YES")
compareHistogram(CURRENT_DATE, RECEIVED_DATE);
else
loadHistogram(RECEIVED_DATE);}
}
if(id == R.id.zoomOut){
for(int n = 0;n < xLabels.length ;n++)
xLabels[n] = Integer.toString(20 + (20*n));
if(which_button_pressed.equals("1"))
loadFFT(RECEIVED_DATE);
else{
if(COMPARE == "YES")
compareHistogram(CURRENT_DATE, RECEIVED_DATE);
else
loadHistogram(RECEIVED_DATE);}
}
return super.onOptionsItemSelected(item);
}
//result from PickHistory activity which allows user to choose a date
@Override
protected void onActivityResult(int requestCode, int resultCode, Intent data){
if (requestCode == request) {
if (resultCode == RESULT_OK)
RECEIVED_DATE = data.getStringExtra("RESULT_STRING");
Page 35
Orchisama Das August 2015
if (which_button_pressed.equals("1"))
loadFFT(RECEIVED_DATE);
else {
if (COMPARE.equals("NO")) {
loadHistogram(RECEIVED_DATE);
/*CURRENT_DATE is the reference date with respect to which
comparisons with other dates are made*/
CURRENT_DATE = RECEIVED_DATE;}
else compareHistogram(CURRENT_DATE, RECEIVED_DATE);
}
}
else
return;
}
Listing 7B – MenuInflater options in DisplayGraph
The onCreate() method sets x-axis labels and loads the last FFT graph or histogram depending on which
button was pressed. onPrepareOptionsMenu() enables/disables certain menu items depending on which graph
is loaded on the screen. In onOptionSelectedMenu() we determine which item has been selected (item.getId)
and perform a certain task accordingly. Let‘s go through the to-do tasks associated with all the items one by
one.
delete_database – Deletes both the tables in the database (deleteAllEntries in listing 2) and loads the
graphs to display that no data is there to be plotted.
about – shows a Toast on screen which gives a description of the graphs we are plotting.
history – If user picks this item, we go the PickHistory Activity and show a list of the date and time of
recording of all captured sounds, from which the user picks one, and accordingly a graph is loaded.
record_data – Selecting this item starts the StartDSP activity which records and analyses new data.
show_all – toggles between showing average FFT graph and FFT graph of all impulses separately if
which_button_pressed equals 1. If which_button_pressed is 2, then SHOW_TOTAL will be set to
―yes‖.
show_FFT – this option is enabled only when the screen displays histogram. On pressing this button,
the FFT graph is loaded.
show_hist – this option is enabled only when the screen displays the FFT graph. On pressing this
button, the analysis histogram is loaded.
compare – enabled only when screen displays histograms. Calls the function compareHistogram() and
passes RECEIVED_DATE and CURRENT_DATE as parameters to plot histograms of two different
captured sounds.
zoom in, zoom out – these change the value of xlabels[] to expand/contract the x-axis.
onActivityResult() is needed because the activity PickHistory returns a result (RECEIVED_DATE). According
to the date and time returned, the loadHistogram(), compareHistogram() or loadFFT() functions are called to
display the result of a sound recorded at a particular date and time.
Page 36
Orchisama Das August 2015
Listing 7C gives the loadFFT() function which plots the frequency spectrum we computed and stored in our
table fft_data in StartDSP. It receives as a parameter a particular date and time, ‗received_date‘, and searches
the ―date‖ column of fft_data for „received_date‘ and loads the values from other fields,‖xvals‖,‖yvals‖ and
―impulseno‖ corresponding to this date and time.
The function getReadableDatabase() lets us read from our database. If we do not want to show all impulses
separately, but load just the average, we need to load the column ―yvals‖. If we want to show all impulses
separately, we load all values from columns ―impulse0‖, ―impulse1‖… ―impulseN‖. We also want to load
columns ―xvals‖, ―date‖ and ―comments_fft‖ (for the title of the graph). We save the names of the fields we
want to load in a String array called projection[ ]. We use something called a SQL query to get data from our
table, and a cursor to get read-write access to the result set returned by the query. We do not want to load all
rows but the specific ones which are same as ‗received_date‟. The String variable ‗where‘ points to the rowID
from which we want to load our data. If ‗received_date‘ is null, then we want to load the last saved data. In
that case, ‗where‟ = null, and cursor.moveToLast() will take the cursor to the last saved data which can be
accessed. If ‗received_date‘ is a particular date and time, then ‗where‘ points to the row in column ―date‖
which is same as ‗received_date‘.
Once the cursor points to the correct position from which we want to load our data, we use ByteBuffer arrays
and functions cursor.getBlob(), cursor.getString() to retrieve individual fields. The arrays xData[] and yData[]
contain the frequency values and the magnitude values retrieved from ―xvals‖, ―yvals‖/ ―impluseno‖
respectively. We set the title of the graph as the date and time of the recording along with the comment entered
by the user before recording.
The next part is all about plotting using the GraphView library. We have included a GraphView graph widget
in activity_display_graph.xml (listing 7D). We find that widget by its id and link it to a GraphView object
‗graph‘.We must first put the x and y axis coordinates into a DataPoint array. We then use a LineGraphSeries
series called „data‟ to save the DataPoint array. graph.addSeries(data) adds the DataPoint series to our line
graph.
In case SHOW_ALL = ―yes‖, then we consider each column ―impluseno0‖,‖impulseno1‖… ―impulsenoN‖ as a
separate series and plot them with different colors. We use the function GenerateVerticalLabels[ ] to generate
y-axis labels which are all multiples of 10. StaticLabelsFormatter is used to generate labels for both axes. The
title is set with setTitle. We set the range for the axes with setMinx, setMaxX, setMinY and setMaxY.
setScrollable allows the user to scroll through the graph and setScalable allows zooming in.
private void loadFFT(String received_date) {
setContentView(R.layout.activity_display_graph);
MySQLiteDatabaseHelper databaseHelper = new MySQLiteDatabaseHelper(this);
SQLiteDatabase db = databaseHelper.getReadableDatabase();
final int numImpulses = getResources().getInteger(R.integer.num_impulses);
String[] projection = null;
GraphView graph = null;
if (SHOW_ALL.equals("NO")) {
//If we're displaying the average, we only want the average Y vals.
projection = new String[]{
TableEntry.COLUMN_NAME_XVALS,
TableEntry.COLUMN_NAME_YVALS,
TableEntry.COLUMN_NAME_DATE,
Page 37
Orchisama Das August 2015
TableEntry.COLUMN_NAME_COMMENT};
}
else {
//If we're displaying all impulses, we need to load all the impulses.
projection = new String[3 + numImpulses];
for (int k = 0; k < numImpulses; k++)
projection[k] = TableEntry.COLUMN_NAME_IMPULSE + Integer.toString(k);
projection[numImpulses] = TableEntry.COLUMN_NAME_XVALS;
projection[numImpulses + 1] = TableEntry.COLUMN_NAME_DATE;
projection[numImpulses + 2] = TableEntry.COLUMN_NAME_COMMENT;
}
Cursor c = null;
//handle the case where we want to load a specific data set. we do this
//using the given received_date.
if (received_date != null) {
final String where = TableEntry.COLUMN_NAME_DATE + " = '" + received_date + "'";
c = db.query(TableEntry.TABLE_NAME_FFT,
projection,
where,
null,
null,
null,
null,
null);
}
//handle the case where we want to load the latest data
//or where our previous code fails for some reason
if (received_date == null || c.getCount() == 0) {
c = db.query(TableEntry.TABLE_NAME_FFT,
projection,
null,
null,
null,
null,
null,
null);
}
if (c.getCount() == 0) {
Toast.makeText(DisplayGraph.this, getResources().getString(R.string.no_entries),
Toast.LENGTH_LONG).show();
return;
}
//find the length of the BLOB
int numBytes = getResources().getInteger(R.integer.sample_rate) *
getResources().getInteger(R.integer.capture_time);
//check to make sure that the sampled length buffer is a power of two
numBytes = StartDSP.nearestPow2Length(numBytes);
numBytes = numBytes * 4 / getResources().getInteger(R.integer.samples_per_bin);
byte[] tempByte = new byte[numBytes];
double[] xData = new double[numBytes / 8];
double[] yData = new double[numBytes / 8];
/*I'm using an array for the min and max values so that it can be passed between
* functions without losing data. */
int[] minmax = new int[2];
int min = Integer.MAX_VALUE, max = Integer.MIN_VALUE;
//get the latest data set based on our search criteria
Page 38
Orchisama Das August 2015
c.moveToLast();
tempByte = c.getBlob(c.getColumnIndex(TableEntry.COLUMN_NAME_XVALS));
ByteBuffer byteBuffer = ByteBuffer.allocate(tempByte.length);
byteBuffer.put(tempByte);
byteBuffer.rewind();
for (int k = 0; k < xData.length; k++)
xData[k] = byteBuffer.getDouble();
String title = c.getString(c.getColumnIndex(TableEntry.COLUMN_NAME_DATE)) +
c.getString(c.getColumnIndex(TableEntry.COLUMN_NAME_COMMENT));
graph = (GraphView) findViewById(R.id.FFTgraph);
if (SHOW_ALL.equals("NO")) {
//grab the average blob, and convert it back into it's original form (double)
tempByte = c.getBlob(c.getColumnIndex(TableEntry.COLUMN_NAME_YVALS));
byteBuffer.clear();
byteBuffer.rewind();
byteBuffer.put(tempByte);
byteBuffer.rewind();
for (int k = 0; k < yData.length; k++) {
yData[k] = byteBuffer.getDouble();
if(minmax[1] < yData[k])
minmax[1] = (int) Math.ceil(yData[k]);
if(minmax[0] > yData[k])
minmax[0] = (int) Math.floor(yData[k]);
}
//add the dataset to the graph
DataPoint[] values = new DataPoint[yData.length];
for (int n = 0; n < yData.length; n++) {
DataPoint v = new DataPoint(xData[n], yData[n]);
values[n] = v;
}
LineGraphSeries<DataPoint> data = new LineGraphSeries<DataPoint>(values);
graph.addSeries(data);
min = (int) minmax[0];
max = (int) minmax[1];
}
else {
//we load each set of data separately
for (int i = 0; i < numImpulses; i++) {
//grab the associated impulse blob and convert it back into doubles
tempByte = c.getBlob(c.getColumnIndex(TableEntry.COLUMN_NAME_IMPULSE +
Integer.toString(i)));
byteBuffer.clear();
byteBuffer.rewind();
byteBuffer.put(tempByte);
byteBuffer.rewind();
for (int k = 0; k < yData.length; k++) {
yData[k] = byteBuffer.getDouble();
if (minmax[1] < yData[k])
minmax[1] = (int) Math.ceil(yData[k]);
if (minmax[0] > yData[k])
minmax[0] = (int) Math.floor(yData[k]);
}
//add the impulse data to the series
DataPoint[] values = new DataPoint[yData.length];
for (int n = 0; n < yData.length; n++) {
DataPoint v = new DataPoint(xData[n], yData[n]);
Page 39
Orchisama Das August 2015
values[n] = v;
}
LineGraphSeries<DataPoint> data = new LineGraphSeries<DataPoint>(values);
graph.addSeries(data);
if (min > minmax[0])
min = (int) minmax[0];
if (max < minmax[1])
max = (int) minmax[1];
int color = 0;
/* The colors are in the form of ALPHA RED GREEN BLUE, meaning the first
* byte is the alpha value (opacity or see-through-ness and in this
* case is always 0xff), the second byte is red and so forth.*/
switch (i) {
case -1:
color = Color.BLUE; break;
case 0:
color = 0xff0099cc; break;
case 1:
color = 0xff9933cc; break;
case 2:
color = 0xff669900; break;
case 3:
color = 0xffff8800; break;
case 4:
color = 0xffcc0000; break ;
case 5:
color = 0xff33b5e5; break;
case 6:
color = 0xffaa66cc; break;
case 7:
color = 0xff99cc00; break;
case 8:
color = 0xffffbb33; break;
case 9:
color = 0xff4444; break;
default:
color = Color.BLUE; break;
}
data.setColor(color);
}
}
db.close();
db = null;
minmax[0] = min;
minmax[1] = max;
//set up graph so it displays the way we want
StaticLabelsFormatter staticLabelsFormatter = new StaticLabelsFormatter(graph);
staticLabelsFormatter.setVerticalLabels(GenerateVerticalLabels(minmax));
staticLabelsFormatter.setHorizontalLabels(null);
graph.setTitle(title);
graph.getViewport().setScrollable(true);
graph.getViewport().setScalable(true);
graph.getViewport().setMinY(minmax[0]);
graph.getViewport().setMaxY(minmax[1]);
graph.getViewport().setMinX(0);
graph.getViewport().setMaxX(1000);
Page 40
Orchisama Das August 2015
graph.getGridLabelRenderer().setVerticalAxisTitle(null);
}
private String[] GenerateVerticalLabels(int[] minmax)
{
//we need to truncate the last digit so everything is a nice multiple of 10
if(minmax[0] >= 0){
minmax[0] = minmax[0] / 10;
minmax[0] = minmax[0] * 10;}
else{ minmax[0] = minmax[0] / 10;
minmax[0] = (minmax[0] - 1) * 10;}
if(minmax[1] >= 0){
minmax[1] = minmax[1] / 10;
minmax[1] = (minmax[1] + 1) * 10;}
else{ minmax[1] = minmax[1] / 10;
minmax[1] = minmax[1] * 10;}
int numIntervals = 0;
int stride = 0;
if( (minmax[1] - minmax[0]) <= 100){
numIntervals = (minmax[1] - minmax[0]) / 10 + 1;
stride = 10;}
else{ numIntervals = 11;
stride = (minmax[1] - minmax[0]) / 10;
//make stride a multiple of 5
stride = stride / 5;
stride = (stride + 1) * 5;
//max must therefore be slightly larger than before
minmax[1] = minmax[0] + stride * (numIntervals - 1);
}
String[] labels = new String[numIntervals];
for(int k =0; k < numIntervals; k++)
labels[k] = Integer.toString(minmax[0] + (numIntervals - k - 1) * stride);
return labels;
}
Listing 7C - loadFFT() in DisplayGraph
<?xml version="1.0" encoding="utf-8"?>
<LinearLayout xmlns:tools="http://schemas.android.com/tools"
xmlns:android="http://schemas.android.com/apk/res/android"
android:layout_width="fill_parent"
android:layout_height="fill_parent"
android:screenOrientation="landscape"
tools:context="${relativePackage}.${activityClass}">
<android:com.jjoe64.graphview.GraphView
android:layout_width="wrap_content"
android:layout_height="wrap_content"
android:id="@+id/FFTgraph"
xmlns:android="http://schemas.android.com/apk/res/android" />
</LinearLayout>
Listing 7D – activity_display_graph.xml
Page 41
Orchisama Das August 2015
The next function loadHistogram() loads values from columns ―percentage_worse_case‖ and
―ratio_background_noise‖ (from table ‗analysis_data‟) and plotHistogram() plots them in the form of a
histogram. To construct a histogram, the first step is to "bin" the range of values—that is, divide the entire
range of values into a series of small intervals (of 10Hz each in our case) —and then count how many
values fall into each interval. This helps the user to isolate the frequency bin which is strongest in the
recorded audio signal.
The layout for plotting the histograms is given in activity_display_histogram.xml. We plot two graphs –
Percentage Worse Case Frequencies and Ratio Background Noise Frequencies, one below another. They
share equal space on screen, hence layout_height = “0dp” and layout_weight = “1”.
Listing 7E gives the loadHistogram() and plotHistogram() functions. loadHistogram() receives the
parameter ‗received_date‘ which contains the date and time of the recorded audio whose results we want
to display. We store the names of the columns we want to load in a String array called projection[ ]. As
described before, we must declare a cursor which points to a result set returned by our query. Like before,
the String „where‘ points to the row in the table from which we want to load our data. If the user wants to
load the last saved results (received_date = null) and the show_total option is disabled, ‗where‘ is set to
null. To load the last saved results, the cursor is moved to the last row (cursor.moveToLast()) and to load
the total result of all recordings (SHOW_TOTAL = ―YES‖), the cursor is moved to the first row
(cursor.moveToFirst()). However, if he wants to load the result of a sound recorded at a specific date and
time, ‗where‘ = ‗received_date‘.
After declaring our cursor, we are ready to load the required fields. cursor.getDouble() puts data from the
columns into ArrayLists „percentage_worse_case‟ and ‗ratio_background_noise‘, and cursor.getString()
puts data from the column ―comments‖ into String variable ‗title‘. Then, the function plotHistogram() is
called with the parameters ‗title‟, „received_date‘ and our ArrayLists.
plotHistogram() receives the following parameters - ‗GraphTitle‟ (―Percentage Worse Case‖ or ―Ratio
Background Noise‖ in activity_display_histogram.xml), ‗description‘ (the String „title‘ in
loadHistogram()), ‗date‟ (‗received_date‟ in loadHistogram()) and an ArrayList „frequencies‟ (either
„percentage_worse_case‘ or ‗ratio_background_noise‟ from loadHistogram()). In plotHistogram(), we
first initialise the GraphView object, ‗graph‟. removeAllSeries() clears the previous graph from the
screen, if any. If the received ArrayList ‗frequencies‘ is empty we show an appropriate Toast message on
the screen.
To plot our histogram, we first divide our entire frequency range into intervals of 10Hz (countXvals[]).
The frequency range is taken from the minimum of ‗frequencies‘ – 20Hz to the maximum of
‗frequencies‘ + 20Hz. We find the distribution (number of occurrence) of ‗frequencies‘ in each of these
bins (countYvals[]). The arrays countXvals and countYvals are stored as a DataPoint array to insert into
our graph. A histogram is essentially a bar chart, so we deploy the ‗BarGraphSeries‘ series of GraphView
library to store our DataPoint array. graph.addSeries() adds the series to our bar graph. setSpacing() sets
the spacing between two consecutive bars as 10 units. If the total result of all recorded data is being
Page 42
Orchisama Das August 2015
displayed, setColor() sets the graph colour to MAGENTA and setTitle() sets its title to GraphTitle + , ―-
Total‖; otherwise the color is set to BLUE and the title is Graphtitle + date + description. The x-axis
labels, range and axes titles are set as described previously.
private void loadHistogram(String received_date) {
setContentView(R.layout.activity_display_histogram);
MySQLiteDatabaseHelper databaseHelper = new MySQLiteDatabaseHelper(this);
SQLiteDatabase db = databaseHelper.getReadableDatabase();
String[] projection = new String[]{TableEntry.COLUMN_NAME, TableEntry.COLUMN_DATE,
TableEntry.COLUMN_COMMENT, TableEntry.COLUMN_PERCENTAGE_WORSE_CASE,
TableEntry.COLUMN_RATIO_BACKGROUND_NOSE};
Cursor cursor = null;
String where, date, title;
//if no history is picked, load current/previous result
if (received_date == null && SHOW_TOTAL.equals("NO")){
cursor = db.query(TableEntry.TABLE_NAME, projection, null, null, null, null, null, null);
//check to see if there are any entries. If there are none
//then tell the user that there is no data to display.
if (cursor.getCount() == 0) {
Toast.makeText(DisplayGraph.this, getResources().getString(R.string.no_entries),
Toast.LENGTH_LONG).show();
return;
}
//getting values of current recording only
cursor.moveToLast();
date = cursor.getString(cursor.getColumnIndex(TableEntry.COLUMN_DATE));
where = TableEntry.COLUMN_DATE + " = '" + date + "'";
//we are passing received date as a parameter to plotHist. It cannot be null.
received_date = date;
}
//show all results over time
else if(SHOW_TOTAL.equals("YES"))
where = null;
//if history is picked
else
where = TableEntry.COLUMN_DATE + " = '" + received_date + "'";
cursor = db.query(TableEntry.TABLE_NAME, projection, where, null, null, null, null, null);
List<Double> percentage_worse_case = new ArrayList<Double>();
List<Double> ratio_background_noise = new ArrayList<Double>();
cursor.moveToFirst();
title = cursor.getString(cursor.getColumnIndex(TableEntry.COLUMN_COMMENT));
while (!cursor.isAfterLast()) {
if (cursor.getDouble(cursor.getColumnIndex(TableEntry.COLUMN_PERCENTAGE_WORSE_CASE)) != 0)
percentage_worse_case.add(cursor.getDouble(cursor.getColumnIndex
(TableEntry.COLUMN_PERCENTAGE_WORSE_CASE)));
if (cursor.getDouble(cursor.getColumnIndex(TableEntry.COLUMN_RATIO_BACKGROUND_NOSE)) != 0)
ratio_background_noise.add(cursor.getDouble(cursor.getColumnIndex
(TableEntry.COLUMN_RATIO_BACKGROUND_NOSE)));
cursor.moveToNext();
}
db.close();
plotHistogram("Percentage Worse Case ", title, received_date, percentage_worse_case);
plotHistogram("Ratio Background Noise ", title, received_date, ratio_background_noise);
Page 43
Orchisama Das August 2015
}
protected void plotHistogram(String GraphTitle, String description, String date, List<Double> frequencies) {
GraphView graph = null;
if (GraphTitle.startsWith("Percentage Worse Case"))
graph = (GraphView) findViewById(R.id.percentage_worse_case);
else
graph = (GraphView) findViewById(R.id.ratio_background_noise);
//clear graph before it is called again
if (graph != null)
graph.removeAllSeries();
//if list is empty
if (frequencies.size() == 0) {
Toast.makeText(DisplayGraph.this, getResources().getString(R.string.empty_list) + " in " + GraphTitle,
Toast.LENGTH_LONG).show();
return;
}
//create frequency intervals of 10Hz
int class_interval = 10;
int minimum = (class_interval * (int) Math.round(Collections.min(frequencies) / class_interval)) -
(2*class_interval);
int maximum = (class_interval * (int) Math.round(Collections.max(frequencies) / class_interval)) +
(2*class_interval);
int[] countXvals = new int[(maximum - minimum) / class_interval];
int[] countYvals = new int[(maximum - minimum) / class_interval - 1];
int count = 0, n;
for (n = minimum; n <= maximum - class_interval; n += class_interval) {
countXvals[count++] = n;
}
//get frequency of occurrence of different frequencies to plot histogram
for (n = 0; n < countYvals.length; n++) {
for (Double key : frequencies) {
if (key >= countXvals[n] && key <= countXvals[n + 1])
countYvals[n]++;
}
}
DataPoint[] values = new DataPoint[countYvals.length];
for (n = 0; n < countYvals.length; n++) {
DataPoint v = new DataPoint((countXvals[n] + countXvals[n + 1]) / 2, countYvals[n]);
values[n] = v;
}
BarGraphSeries<DataPoint> data = new BarGraphSeries<DataPoint>(values);
graph.addSeries(data);
data.setSpacing(10);
//If total result over all time is displayed
if (SHOW_TOTAL.equals("YES")) {
data.setColor(Color.MAGENTA);
graph.setTitle(GraphTitle +" - Total");
} else {
data.setColor(Color.BLUE);
graph.setTitle(GraphTitle + " " + date + description);
}
//generating labels for X axis
StaticLabelsFormatter staticLabelsFormatter = new StaticLabelsFormatter(graph);
staticLabelsFormatter.setHorizontalLabels(xLabels);
//setting x axis bounds
Page 44
Orchisama Das August 2015
graph.getViewport().setXAxisBoundsManual(true);
double minRange = Double.parseDouble(xLabels[0]);
double maxRange = Double.parseDouble(xLabels[xLabels.length -1]);
graph.getViewport().setMinX(minRange);
graph.getViewport().setMaxX(maxRange);
graph.getGridLabelRenderer().setHorizontalAxisTitle("Frequency in Hz");
graph.getGridLabelRenderer().setVerticalAxisTitle("Num of occurrence");
graph.getViewport().setScrollable(true);
}
Listing 7E – loadHistogram() and plotHistogram() <?xml version="1.0" encoding="utf-8"?>
<LinearLayout xmlns:android="http://schemas.android.com/apk/res/android"
xmlns:app="http://schemas.android.com/apk/res-auto"
xmlns:tools="http://schemas.android.com/tools"
android:layout_width="fill_parent"
android:layout_height="fill_parent"
android:orientation="vertical"
tools:context="${relativePackage}.${activityClass}">
<android:com.jjoe64.graphview.GraphView
android:layout_width="wrap_content"
android:layout_height="0dp"
android:layout_weight ="1"
android:id="@+id/percentage_worse_case"
xmlns:android="http://schemas.android.com/apk/res/android" />
<android:com.jjoe64.graphview.GraphView
android:layout_width="wrap_content"
android:layout_height="0dp"
android:layout_weight ="1"
android:id="@+id/ratio_background_noise"
xmlns:android="http://schemas.android.com/apk/res/android"/>
</LinearLayout>
Listing 7F – activity_display_histogram.xml
The last part of this activity is used to compare results of two different captured sounds. compareHistogram()
loads the results of the two captured sounds that are to be compared. plotCompareHistogram() plots the results
of the comparison. These are very similar to the loadHistogram() and plotHistogram() functions and I will
only be describing the differences between the two.
compareHistogram() receives as parameters two date and time values – ‗currentDate‟ and ‗selectedDate‘. The
fields read from the table are the same as in loadHistogram(). It loads from the table two sets of values, one
corresponding to ‗currentDate‘ and another corresponding to ‗selectedDate‘ in different ArrayLists –
‗percentage_worse_case_current‟, „percentage_worse_case_selected‟ and „ratio_background_noise_current‟,
„ratio_background_noise_selected‟.
plotCompareHistogram() receives the parameters – GraphTitle (―Percentage Worse Case‖ or ―Ratio
Background Noise‖ in activity_display_histogram.xml), ‗currentDate‘ and „selectedDate‟, „legend_current‘
Page 45
Orchisama Das August 2015
and „legend_selected‟ which have text from the ―comments‖ column in ‗analysis_data‘(from the rows where
the entry in ―dateTime‖ equals currentDate and selectedDate), and the ArrayLists created in
compareHistogram() in ‗currentFrequencies‘ and ‗selectedFrequencies‘. If currentDate equals selectedDate
then a Toast is displayed saying that the results of a recording from a particular date and time cannot be
compared with itself.
Just as in plotHistogram(), divison and classification into frequency bins of 10Hz is done. Only difference is in
the range of x-axis frequency bins. It now ranges from the minimum of both ‗currentFrequencies‘ and
‗selectedFrequencies‟ – 20Hz to the maximum of both + 20Hz (countXvals[ ]). We find the number of
occurrence of „currentFrequencies‘ and ‗selectedFrequencies‘ in each of these bins (countYvalsCurrent[
] and countYvalsSelected[ ] respectively). The only difference from plotHistogram() is that we put
countXvals and countYvalsCurrent in one DataPoint array and countXvals and countYvalsSelected in
another DataPoint array. So we have two different bar graph series, ‗dataCurrent‟ and ‗dataSelected‘ to
add to the same graph. The color of the series ‗dataCurrent‘ is set to BLUE and its legend is set to
„currentDate‟ + ‗legend_current‘. The color of the series ‗dataSelected‘ is set to RED and its legend is set
to ‗selectedDate‘ + ‗legend_selected‘.
private void compareHistogram( String currentDate, String selectedDate) {
setContentView(R.layout.activity_display_histogram);
MySQLiteDatabaseHelper databaseHelper = new MySQLiteDatabaseHelper(this);
SQLiteDatabase db = databaseHelper.getReadableDatabase();
String[] projection = new String[]{TableEntry.COLUMN_NAME, TableEntry.COLUMN_DATE,
TableEntry.COLUMN_COMMENT, TableEntry.COLUMN_PERCENTAGE_WORSE_CASE,
TableEntry.COLUMN_RATIO_BACKGROUND_NOSE};
Cursor cursor = null;
Cursor cursorDescription =null;
String where = null;
String currentTitle, selectedTitle;
if(currentDate != null)
where = TableEntry.COLUMN_DATE + " = '" + currentDate + "'";
else {
cursor = db.query(TableEntry.TABLE_NAME, projection, null, null, null, null, null, null);
cursor.moveToLast();
currentDate = cursor.getString(cursor.getColumnIndex(TableEntry.COLUMN_DATE));
where = TableEntry.COLUMN_DATE + " = '" + currentDate + "'";
}
cursor = db.query(TableEntry.TABLE_NAME, projection, where, null, null, null, null, null);
List<Double> percentage_worse_case_current = new ArrayList<Double>();
List<Double> ratio_background_noise_current = new ArrayList<Double>();
cursor.moveToFirst();
String legend_current = cursor.getString(cursor.getColumnIndex(TableEntry.COLUMN_COMMENT));
while (!cursor.isAfterLast()) {
if (cursor.getDouble(cursor.getColumnIndex(TableEntry.COLUMN_PERCENTAGE_WORSE_CASE)) != 0)
percentage_worse_case_current.add(cursor.getDouble(cursor.getColumnIndex
(TableEntry.COLUMN_PERCENTAGE_WORSE_CASE)));
if (cursor.getDouble(cursor.getColumnIndex(TableEntry.COLUMN_RATIO_BACKGROUND_NOSE)) != 0)
ratio_background_noise_current.add(cursor.getDouble(cursor.getColumnIndex
(TableEntry.COLUMN_RATIO_BACKGROUND_NOSE)));
cursor.moveToNext();
}
where = TableEntry.COLUMN_DATE + " = '" + selectedDate + "'";
Page 46
Orchisama Das August 2015
cursor = db.query(TableEntry.TABLE_NAME, projection, where, null, null, null, null, null);
List<Double> percentage_worse_case_selected = new ArrayList<Double>();
List<Double> ratio_background_noise_selected = new ArrayList<Double>();
cursor.moveToFirst();
String legend_selected = cursor.getString(cursor.getColumnIndex(TableEntry.COLUMN_COMMENT));
while (!cursor.isAfterLast()) {
if (cursor.getDouble(cursor.getColumnIndex(TableEntry.COLUMN_PERCENTAGE_WORSE_CASE)) != 0)
percentage_worse_case_selected.add(cursor.getDouble(cursor.getColumnIndex
(TableEntry.COLUMN_PERCENTAGE_WORSE_CASE)));
if (cursor.getDouble(cursor.getColumnIndex(TableEntry.COLUMN_RATIO_BACKGROUND_NOSE)) != 0)
ratio_background_noise_selected.add(cursor.getDouble(cursor.getColumnIndex
(TableEntry.COLUMN_RATIO_BACKGROUND_NOSE)));
cursor.moveToNext();
}
plotCompareHistogram("Percentage Worse Case" , legend_current, legend_selected, currentDate, selectedDate,
percentage_worse_case_current, percentage_worse_case_selected);
plotCompareHistogram("Ratio background noise" , legend_current, legend_selected, currentDate, selectedDate,
ratio_background_noise_current, ratio_background_noise_selected);
db.close();
}
private void plotCompareHistogram (String GraphTitle, String legend_current, String legend_selected, String
currentDate, String selectedDate, List<Double> currentFrequencies, List<Double> selectedFrequencies) {
GraphView graphCompare = null;
if(GraphTitle.equalsIgnoreCase("Percentage Worse Case"))
graphCompare = (GraphView) findViewById (R.id.percentage_worse_case);
else
graphCompare = (GraphView) findViewById (R.id.ratio_background_noise);
//clear graph before it is called again
if(graphCompare != null)
graphCompare.removeAllSeries();
if(currentDate.equals(selectedDate)){
Toast.makeText(DisplayGraph.this, "Cannot compare with itself", Toast.LENGTH_LONG).show();
return;}
if(currentFrequencies.size() == 0){
Toast.makeText(DisplayGraph.this, getResources().getString(R.string.empty_list) + " in " + GraphTitle + " "
+ currentDate , Toast.LENGTH_LONG).show();
return;}
else if(selectedFrequencies.size() == 0){
Toast.makeText(DisplayGraph.this, getResources().getString(R.string.empty_list) + " in " + GraphTitle + " "
+ selectedDate , Toast.LENGTH_LONG).show();
return;}
//creating frequency interval of 10Hz
int class_interval = 10;
double minCol,maxCol;
if(Collections.min(currentFrequencies) < Collections.min(selectedFrequencies))
minCol = Collections.min(currentFrequencies);
else
minCol = Collections.min(selectedFrequencies);
if(Collections.max(currentFrequencies) > Collections.max(selectedFrequencies))
maxCol = Collections.max(currentFrequencies);
else
maxCol = Collections.max(selectedFrequencies);
int minimum = class_interval * (int) Math.round(minCol / class_interval) - (2*class_interval);
int maximum = class_interval * (int) Math.round(maxCol / class_interval) + (2*class_interval);
int[] countXvals = new int[(maximum - minimum) / class_interval];
int[] countYvalsCurrent = new int[(maximum - minimum) / class_interval - 1];
Page 47
Orchisama Das August 2015
int [] countYvalsSelected = new int[(maximum - minimum) / class_interval - 1];
int count = 0, n;
for (n = minimum; n <= maximum - class_interval; n += class_interval) {
countXvals[count++] = n;
}
//get frequency of occurrence of different frequencies to plot histogram
for (n = 0; n < countYvalsCurrent.length; n++) {
for (Double key : currentFrequencies) {
if (key >= countXvals[n] && key <= countXvals[n + 1])
countYvalsCurrent[n]++;
}
for (Double key : selectedFrequencies){
if (key >= countXvals[n] && key <= countXvals[n + 1])
countYvalsSelected[n]++;
}
}
DataPoint [] valuesCurrent = new DataPoint [countYvalsCurrent.length];
DataPoint [] valuesSelected = new DataPoint [countYvalsSelected.length];
for(n = 0; n < countYvalsCurrent.length; n++) {
DataPoint v = new DataPoint((countXvals[n] + countXvals[n+1])/2, countYvalsCurrent[n]);
valuesCurrent[n] = v;
}
for(n = 0; n < countYvalsSelected.length; n++) {
DataPoint v = new DataPoint((countXvals[n] + countXvals[n+1])/2, countYvalsSelected[n]);
valuesSelected[n] = v;
}
BarGraphSeries<DataPoint> dataCurrent = new BarGraphSeries<DataPoint>(valuesCurrent);
BarGraphSeries<DataPoint> dataSelected = new BarGraphSeries<DataPoint>(valuesSelected);
graphCompare.addSeries(dataCurrent);
dataCurrent.setColor(Color.BLUE );
graphCompare.addSeries(dataSelected);
dataSelected.setColor(Color.RED);
StaticLabelsFormatter staticLabelsFormatter = new StaticLabelsFormatter(graphCompare);
staticLabelsFormatter.setHorizontalLabels(xLabels);
double minRange = Double.parseDouble(xLabels[0]);
double maxRange = Double.parseDouble(xLabels[xLabels.length -1]);
graphCompare.getViewport().setXAxisBoundsManual(true);
graphCompare.getViewport().setMinX(minRange);
graphCompare.getViewport().setMaxX(maxRange);
graphCompare.setTitle(GraphTitle);
graphCompare.getGridLabelRenderer().setHorizontalAxisTitle("Frequency in Hz");
graphCompare.getGridLabelRenderer().setVerticalAxisTitle("Num occurrence");
graphCompare.getViewport().setScrollable(true);
//setting legend
dataCurrent.setTitle(currentDate + legend_current);
dataSelected.setTitle(selectedDate + legend_selected);
if(GraphTitle.equals("Percentage Worse Case")) {
graphCompare.getLegendRenderer().setVisible(true);
graphCompare.getLegendRenderer().setTextSize(16);
graphCompare.getLegendRenderer().setTextColor(Color.BLACK);
graphCompare.getLegendRenderer().setAlign(LegendRenderer.LegendAlign.TOP);
}
}
}
Listing 7G – compareHistogram() and plotCompareHistogram()
Page 48
Orchisama Das August 2015
PickHistory
This is the last activity of this application. It displays a list with the date and time of all the sounds
captured by our app along with the comments entered by the user. On pressing any item on the list, it
returns the selected date and time to the DisplayGraph activity which calls it. A ListActivity displays a list
of items by binding to a data source such as an array or Cursor. This is ideal to be implemented with a
database table.
The onCreate() method sets up the activity. registerForContextMenu registers this ViewGroup for use
with the context menu. This means that all views which are part of the ListView group (ie. all items in the
list) are attached to the context menu, and on a long click will cause the context menu to appear. The
context menu contains one option for deleting the entry.
onCreateContextMenu( ) is called when the context menu is created (when the user makes a long click).
The menu inflater sets up the menu view according to list_context_menu.xml (listing 8D).
AdapterContextMenuInfo contains information on everything in the list. onContextItemSelected() decides
what to do with the menu item that was selected. We only include one option for ‗delete_entry‘ in the
menu, which deletes the date and time information picked by the user from the database tables.
Next we write two methods, loadListGraph() and loadListHistogram() to load all the unique date and
time rows from the columns ―date‖ and ―dateTime‖ in tables „fft_data‘ and ‗analysis_data‟ respectively
onto the ListView. We use a cursor to access the columns containing date-time information and the
comments entered by the user. We fill an array dateBuffer[ ] with the identities of all the table entries,i.e.,
all the unique date-time Strings from the table.
We bind the ListActivity‘s ListView object to data using a class that implements the ListAdapter
interface. We use the standard list adapter SimpleCursorAdapter for Cursor query results. Essentially, all
the dates get turned into textViews defined by "date_entry" and all comments into textViews defined by
―comment_entry‖ in layout_pick_history.xml (listing 8C) and then are sent to the list view. A
SimpleCursorAdapter is programmed to view only one field from a table. Here, we want to view the
comment beside the date-time. We need the bind the two together with a ViewBinder. setListAdapter
provides the cursor for the list view.
onListItemClick() decides what to do once an item in the list has been clicked. We need to return the the
date and time selected by the user (dateBuffer[pos]) to the activity which started PickHistory. setResult
sets what the onActivityResult resultCode will be when the current activity terminates and goes back to
the previous activity.In this case it is the date and time of the item clicked on in the list.
package com.example.orchisamadas.sound_record_analyse;
import android.app.ListActivity;
import android.content.Intent;
import android.database.Cursor;
import android.database.CursorJoiner;
import android.database.MergeCursor;
import android.database.sqlite.SQLiteDatabase;
import android.os.Bundle;
Page 49
Orchisama Das August 2015
import android.util.Log;
import android.view.ContextMenu;
import android.view.MenuInflater;
import android.view.MenuItem;
import android.view.View;
import android.widget.AdapterView;
import android.widget.CursorAdapter;
import android.widget.ListView;
import android.widget.SimpleCursorAdapter;
import android.widget.TextView;
import android.widget.Toast;
import com.example.orchisamadas.sound_record_analyse.MySQLiteDatabaseContract.TableEntry;
public class PickHistory extends ListActivity {
private SimpleCursorAdapter mAdapter;
private MySQLiteDatabaseHelper databaseHelper;
private SQLiteDatabase db;
private static String[] dateBuffer;
private String which_button_pressed;
@Override
protected void onCreate(Bundle savedInstanceState) {
super.onCreate(savedInstanceState);
setContentView(R.layout.activity_pick_history);
databaseHelper = new MySQLiteDatabaseHelper(this);
Bundle bundle = getIntent().getExtras();
which_button_pressed = bundle.getString("button_pressed");
if (which_button_pressed.equals("1"))
loadListGraph();
else
loadListHistogram();
registerForContextMenu((ListView) findViewById(android.R.id.list));
}
@Override
public void onCreateContextMenu(ContextMenu menu, View v, ContextMenu.ContextMenuInfo menuInfo) {
super.onCreateContextMenu(menu, v, menuInfo);
MenuInflater inflater = getMenuInflater();
inflater.inflate(R.menu.list_context_menu, menu);
}
@Override
public boolean onContextItemSelected(MenuItem item) {
AdapterView.AdapterContextMenuInfo info = (AdapterView.AdapterContextMenuInfo) item.getMenuInfo();
switch (item.getItemId()) {
case R.id.delete_entry:
//find the entry and delete it
db = databaseHelper.getWritableDatabase();
db.delete(TableEntry.TABLE_NAME, TableEntry.COLUMN_DATE + " = '" +
dateBuffer[info.position] + "'", null);
db.delete(TableEntry.TABLE_NAME_FFT, TableEntry.COLUMN_NAME_DATE + " = '" +
dateBuffer[info.position] + "'", null);
Toast.makeText(PickHistory.this, "Entry deleted", Toast.LENGTH_SHORT).show();
db.close();
//reload the list so the deleted entry is no longer there
if (which_button_pressed.equals("1"))
loadListGraph();
else
Page 50
Orchisama Das August 2015
loadListHistogram();
return true;
default:
return super.onContextItemSelected(item);
}
}
//loads FFT graph history
private void loadListGraph() {
db = databaseHelper.getReadableDatabase();
String PROJECTION[] = new String[]{TableEntry._ID, TableEntry.COLUMN_NAME_DATE,
TableEntry.COLUMN_NAME_COMMENT};
Cursor c = db.query(TableEntry.TABLE_NAME_FFT,
PROJECTION,
null,
null,
null,
null,
null,
null);
dateBuffer = new String[c.getCount()];
c.moveToFirst();
for (int k = 0; k < c.getCount(); k++) {
dateBuffer[k] = c.getString(c.getColumnIndex(TableEntry.COLUMN_NAME_DATE));
c.moveToNext();
}
startManagingCursor(c);
mAdapter = new SimpleCursorAdapter(this, R.layout.layout_pick_history, c,
new String[]{TableEntry.COLUMN_NAME_DATE,TableEntry.COLUMN_NAME_COMMENT}, new
int[]{R.id.date_entry,R.id.comment_entry}, 0);
//to view both date and comment, we need to bind them together with ViewBinder
mAdapter.setViewBinder(new SimpleCursorAdapter.ViewBinder() {
public boolean setViewValue(View view, Cursor cursor, int columnIndex) {
boolean result = false;
if(view.getId() == R.id.date_entry) {
TextView date = (TextView) view.findViewById(R.id.date_entry);
date.setText(cursor.getString(cursor.getColumnIndex(TableEntry.COLUMN_NAME_DATE)));
result = true;
}
else if(view.getId() == R.id.comment_entry){
TextView comment = (TextView) view.findViewById(R.id.comment_entry);
comment.setText(cursor.getString
(cursor.getColumnIndex(TableEntry.COLUMN_NAME_COMMENT)));
result = true;
}
return result;
}
});
db.close();
setListAdapter(mAdapter);
return;
}
private void loadListHistogram() {
db = databaseHelper.getReadableDatabase();
String select = "SELECT DISTINCT " + TableEntry.COLUMN_DATE + " as " +
TableEntry._ID + ", " + TableEntry.COLUMN_DATE + ", " + TableEntry.COLUMN_COMMENT +
Page 51
Orchisama Das August 2015
" FROM " + TableEntry.TABLE_NAME;
Cursor c = db.rawQuery(select, null);
dateBuffer = new String[c.getCount()];
c.moveToFirst();
for (int k = 0; k < c.getCount(); k++) {
dateBuffer[k] = c.getString(c.getColumnIndex(TableEntry.COLUMN_DATE));
c.moveToNext();
}
mAdapter = new SimpleCursorAdapter(this, R.layout.layout_pick_history, c,
new String[]{TableEntry.COLUMN_DATE,TableEntry.COLUMN_COMMENT}, new
int[]{R.id.date_entry,R.id.comment_entry}, 0);
mAdapter.setViewBinder(new SimpleCursorAdapter.ViewBinder() {
public boolean setViewValue(View view, Cursor cursor, int columnIndex) {
boolean result = false;
if(view.getId() == R.id.date_entry) {
TextView date = (TextView) view.findViewById(R.id.date_entry);
date.setText(cursor.getString(cursor.getColumnIndex(TableEntry.COLUMN_DATE)));
result = true;
}
else if(view.getId() == R.id.comment_entry){
TextView comment = (TextView) view.findViewById(R.id.comment_entry);
comment.setText(cursor.getString(cursor.getColumnIndex(TableEntry.COLUMN_COMMENT)));
result = true;
}
return result;
}
});
setListAdapter(mAdapter);
db.close();
return;
}
@Override
public void onListItemClick(ListView l, View v, int pos, long id) {
Intent intent = new Intent();
intent.putExtra("RESULT_STRING", dateBuffer[pos]);
setResult(RESULT_OK, intent);
finish();
}
}
Listing 8A – PickHistory.java
<LinearLayout xmlns:android="http://schemas.android.com/apk/res/android"
xmlns:tools="http://schemas.android.com/tools"
android:layout_width="match_parent"
android:layout_height="match_parent"
tools:context="${packageName}.${activityClass}" >
<ListView
android:layout_width="match_parent"
android:layout_height="wrap_content"
android:id="@+id/android:list" />
</LinearLayout>
Listing 8B – activity_pick_history.xml
Page 52
Orchisama Das August 2015
Fig 5 – List View <?xml version="1.0" encoding="utf-8" ?>
<LinearLayout xmlns:android="http://schemas.android.com/apk/res/android"
android:layout_width="match_parent"
android:layout_height="match_parent"
android:orientation="horizontal" >
<TextView
android:id="@+id/date_entry"
android:layout_width="wrap_content"
android:layout_height="wrap_content"
android:textSize="26sp" />
<TextView
android:id="@+id/comment_entry"
android:layout_width="wrap_content"
android:layout_height="wrap_content"
android:textSize="26sp" />
</LinearLayout>
Listing 8C – layout_pick_history.xml
<?xml version="1.0" encoding="utf-8"?>
<menu xmlns:android="http://schemas.android.com/apk/res/android" >
<item
android:id="@+id/delete_entry"
android:title="@string/delete_entry_string" />
</menu>
Listing 8D – list_context_menu.xml in menu folder
Page 53
Orchisama Das August 2015
Lastly, I will include the files in the values folder – ints.xml that contains the integer constants and
strings.xml that contains the strings used in the application.
<?xml version="1.0" encoding="utf-8"?>
<resources>
<!-- AudioRecord parameters -->
<integer name = "sample_rate">8000</integer>
<integer name = "num_channels">1</integer>
<!-- Defines the buffer length for sound detection -->
<integer name = "detect_buffer_length">256</integer>
<!-- Defines the capture time after impulse is detected -->
<integer name = "capture_time">5</integer>
<integer name = "num_impulses">2</integer>
<integer name = "samples_per_bin">32</integer>
<integer name = "number_impulses_frequencies_scratch">0</integer>
<integer name = "detect_threshold">0</integer>
<integer name = "samples_per_bin_freq">32</integer>
<integer name = "samples_per_bin_time">4</integer>
<integer name = "playChirp">0</integer>
<integer name = "averageOverDenominator">1</integer>
</resources>
Listing 9A – ints.xml
<resources>
<string name="app_name">Sound Recording and Analysis - Aug 2015</string>
<string name="action_settings">Settings</string>
<string name="title_activity_my_sqlite_database_contract">MySQLiteDatabaseContract</string>
<string name="title_activity_my_sqlite_database_helper">MySQLiteDatabaseHelper</string>
<string name="title_activity_fftbase">FFTbase</string>
<string name="title_activity_start_dsp">Record new data and analyse</string>
<string name="title_activity_display_histogram">Display Histogram</string>
<string name="title_activity_pick_history">PickHistory</string>
<string name="title_activity_display_graph">DisplayGraph</string>
<string name ="title_activity_start_app">Sound Recording and Analysis - Aug 2015</string>
<string name="error">An error has occurred</string>
<string name="computation_error">A computation error in FFT has occurred</string>
<string name="recorder_init_fail">Recording device initialization failed</string>
<string name="remaining_impulse_leadtext">Number of Impulses remaining: </string>
<string name="start_dsp">Record new data</string>
<string name ="graph_FFT">View Frequency graphs</string>
<string name ="graph_histogram">View Analysis Results</string>
<string name ="view_fft_result">View Frequency Graph</string>
<string name ="view_analysis_result">View Analysis Results</string>
<string name ="empty_list">No frequencies to be plotted</string>
<string name="deleted_database">All Entries Deleted</string>
<string name="no_entries">No Data Entries</string>
<string name="delete_entry_string">Delete Entry</string>
<!-- menu bar strings -->
<string name="delete_database_string">Delete All Entries</string>
<string name="about">About</string>
Page 54
Orchisama Das August 2015
<string name="history">History</string>
<string name="about_hist">Percentage worse case frequencies shows the most prominent frequencies
in a recording. Ratio background noise frequencies shows the frequencies which are hidden by
the background noise. These are the frequencies recorded when
there is a lot of background noise along with the hum, for example, during daytime.</string>
<string name="about_fft">X axis : Frequency in Hz, Y axis : Magnitude. A sharp peak at a particular
frequency indicates that the signal contains that frequency.</string>
<string name="audio_play">Generate Chirp</string>
</resources>
Listing 9B – strings.xml
TESTING THE APP
After a ridiculous number of lines of code, our app was finally ready. We didn‘t know if it was running
correctly, so we carried out a few simple experiments in the lab. We used an audio recording software
called Audacity [12] to generate pure tones of 150Hz and varied the loudness of the tone. We used
speakers with a sub-woofer to generate low frequency sound, and attached an external microphone to the
phone to enable it to catch the low frequencies. Fig 6 shows the experimental set-up.
Fig 6 – Experimental set-up for testing our app
Page 55
Orchisama Das August 2015
When we kept the tone at a minimum loudness (Exp A), barely audible, all we captured was room
background noise coming from computer fans and air conditioning. On increasing the volume, our app
picked up the tone as well as the background noise (Exp B). This is probably the scenario during daytime
when there is a lot of background noise along with the hum. At maximum loudness, our app picked up
only the tone (Exp C). This is the case during night when the disturbances are least and the hum itself is
loudest.
Figure 7 shows the results for experiment A when the tone was softest and all the app captured was
background noise.There is no prominent frequency but multiple weak peaks in the frequency band that is
also reflected in the analysis histograms.
Fig 7A – FFT graph for background noise
Fig 7B – Analysis Histograms for background noise
Page 56
Orchisama Das August 2015
Figure 8 shows the results of experiment B where the app picked up both the tone and the background
noise. The magnitude spectrum shows a spike at 150 Hz and a few other peaks cause due to background
noise from computer and air conditioning fans. Percentage worse case looks for the strongest peak at
150Hz. Ratio background noise also looks for other weaker peaks caused due to background noise.
Fig 8A – FFT graph for quiet hum
Fig 8B – Analysis Histograms for quiet hum
Page 57
Orchisama Das August 2015
In experiment C the tone was loud enough to overpower all background noises, and hence in Figure 9A
we see a peak at 150 Hz of a large magnitude. The histograms in Figure 9B also pick up a strong
frequency at 150Hz and no other background noise. This analysis ―looks at the bottom‖ of any signal.
This signal is so loud that its base is broad and the analysis treats this as ―two signals‖ close together,
which is why there are two nearby frequencies detected by Ratio Backgound Noise.
Fig 9A – FFTgraph for loud hum
Fig 9B – Analysis histograms for loud hum
Page 58
Orchisama Das August 2015
We can also compare the results among these three experiments. Figure 10 shows the results of
comparison.The comparison helps us to identify the most prominent frequency to be around 140 – 150 Hz
because it is present in all three graphs. It is an accurate result.
Fig 10A – Background Noise v/s Quiet Hum
Fig 10B – Background Noise v/s Loud Hum
Fig 10C – Quiet Hum v/s Loud Hum
Page 59
Orchisama Das August 2015
FUTURE PROSPECTS
The Android application is part of a much larger research project to analyse the Hum. It‘s in its early
stages of development and a lot more features are yet to be added to it. The next step is to enable
recording over an entire weekend, where the phone continuously records for 15 seconds, sleeps for 10
mins and records again. This will help us gather the tremendous amount of data we need without hanging
the phone. Calibration of graph axes labels are needed, along with GPS data to detect location. Uploading
to a secured cloud on the internet to analyse noise recorded by all users is a future goal.
To combat the hum, research is being done on using a home theater system to generate an anti Hum-
signal to generate silence in a room [13]. To detect its source, a network of cell phones can be used as a
―sound-source locator‖.
ACKNOWLEGDEMENT
The work I have done would not have been possible without the constant guidance of Dr. Smith.
He guided me from the word ‗go‘, told me about the features he wanted in the app and the
algorithms he wanted to implement. My interactions with him have definitely been the best part
of this internship.
All I learnt about android programming was from the articles written by Adrien Gaspard for the
Circuit Cellar magazine. I emailed Adrien regularly with my doubts in the beginning when I was
learning, and he would always help me out. His help has been invaluable.
Nicolas Lepine wrote some neat codes working with SQLite, some of which I have used in this
application. Lastly, Mitacs Globalink deserves a mention for putting me in Dr Smith‘s lab in the
first place, and for initiating all the media attention this project has received.
REFERENCES
1. Characterization of the “Ranchlands‟ Hum”; a Calgary community noise nuisance – Smith,
Marasco, Epstein, Gupta, Nayak, Patching, Scott in NOISE-CON 2013, Denver, Colorado.
2. https://en.wikipedia.org/wiki/The_Hum - About The Hum on Wikipedia
Page 60
Orchisama Das August 2015
3. http://people.ucalgary.ca/~thehum/ - Webpage on the Hum developed by Dr.Smith
4. CC Articles 1 – 5.
5. https://www.sqlite.org/ - Introduction to SQLite
6. http://developer.android.com/intl/ko/training/basics/data-storage/databases.html - Tutorial on
working with SQLite on Android
7. http://developer.android.com/intl/ko/reference/android/database/sqlite/SQLiteOpenHelper.html -
The SQLiteOpenHelper class.
8. https://en.wikipedia.org/wiki/Fast_Fourier_transform - Radix 2 FFT Algorithm on Wikipedia
9. http://www.physik.uni-wuerzburg.de/~praktiku/Anleitung/Fremde/ANO14.pdf - Understanding
FFT Windows
10. http://wikijava.org/wiki/The_Fast_Fourier_Transform_in_Java_%28part_1%29 – FFTBase.java
class in WikiJava
11. http://www.android-graphview.org/ - GraphView graphics library for Android
12. http://audacityteam.org/ - Audacity recording software
13. SSSSH! – Using a Home Theatre System and Other Devices to Provide a Low-cost, Noise
Cancelling Solution for Noise Pollution Issues in the Urban Home – Smith, Heisie, Wolfram,
Aebischer, Marasco in Spring Noise Conference, 2011, Banff, Canada.