▲87The Journal of The South African Institute of Mining and Metallurgy MARCH 2003
Introduction
The East Rand Goldfield
Gold on the East Rand was discovered in1888, only two years after the commencementof mining on the Central Rand. The East Randgoldfield extends from the towns of Benoniand Brakpan south-east towards Nigel andHeidelberg. Since most of the mineral rights inthe east Rand were State owned, minedevelopment proceeded in accordance with alease arrangement in which private enterpriseprovided capital, technical expertise andmanagement, while the government retainedthe right to mine. The East Rand goldfield hasbeen the most productive entity to date withinthe Witwatersrand Basin, having producedover 9500 t of gold metal; it was also animportant uranium producer. At present, thegoldfield is largely worked out with theexception of E.R.P.M. Ltd which was liquidatedand closed in the mid-nineties and re-openedby new management at the end of 1999.
Location
ERPM is located within and near the northernmargin of the Witwatersrand Basin in the town
of Boksburg, 25 km east of Johannesburg,South Africa. The lease area totals some 95km2.
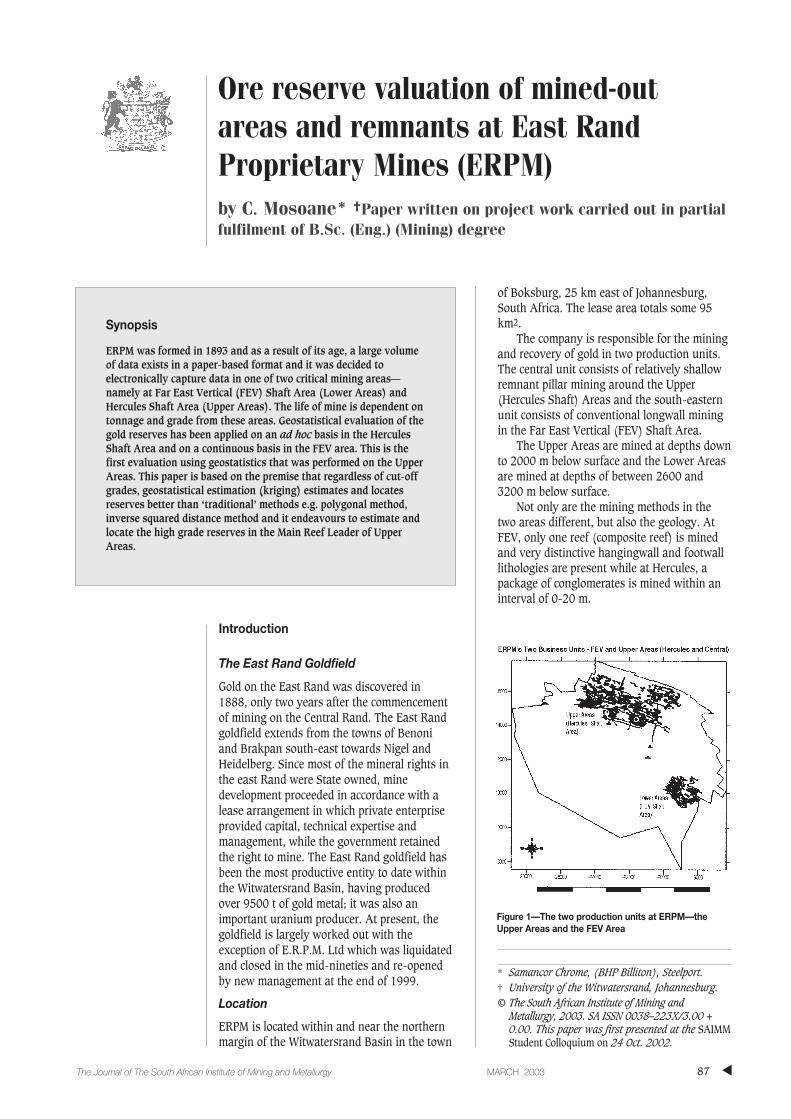
The company is responsible for the miningand recovery of gold in two production units.The central unit consists of relatively shallowremnant pillar mining around the Upper(Hercules Shaft) Areas and the south-easternunit consists of conventional longwall miningin the Far East Vertical (FEV) Shaft Area.
The Upper Areas are mined at depths downto 2000 m below surface and the Lower Areasare mined at depths of between 2600 and3200 m below surface.
Not only are the mining methods in thetwo areas different, but also the geology. AtFEV, only one reef (composite reef) is minedand very distinctive hangingwall and footwalllithologies are present while at Hercules, apackage of conglomerates is mined within aninterval of 0-20 m.
Ore reserve valuation of mined-outareas and remnants at East RandProprietary Mines (ERPM)by C. Mosoane* †Paper written on project work carried out in partialfulfilment of B.Sc. (Eng.) (Mining) degree
Synopsis
ERPM was formed in 1893 and as a result of its age, a large volumeof data exists in a paper-based format and it was decided toelectronically capture data in one of two critical mining areas—namely at Far East Vertical (FEV) Shaft Area (Lower Areas) andHercules Shaft Area (Upper Areas). The life of mine is dependent ontonnage and grade from these areas. Geostatistical evaluation of thegold reserves has been applied on an ad hoc basis in the HerculesShaft Area and on a continuous basis in the FEV area. This is thefirst evaluation using geostatistics that was performed on the UpperAreas. This paper is based on the premise that regardless of cut-offgrades, geostatistical estimation (kriging) estimates and locatesreserves better than ‘traditional’ methods e.g. polygonal method,inverse squared distance method and it endeavours to estimate andlocate the high grade reserves in the Main Reef Leader of UpperAreas.
Metallurgy, 2003. SA ISSN 0038–223X/3.00 +0.00. This paper was first presented at the SAIMMStudent Colloquium on 24 Oct. 2002.
Figure 1—The two production units at ERPM—theUpper Areas and the FEV Area
Ore reserve valuation of mined-out areas and remnants at ERPM
Regional geology
ERPM’s mining focus is on conglomeratic reefs (South Reef,Main Reef Leader and Main Reef) in the Upper Areas and onthe Composite Reef in the FEV Area. Future tonnage contri-bution will be sourced from the Main Reef Leader (55%) andthe sedimentologically complex Main Reef (45%) in theUpper Areas. The more laterally persistent South Reef/Composite Reef in the south-eastern section of the mine willbe the sole contributor of tonnage in the Far East VerticalShaft Area.
Geologically, the East Rand goldfield is an extension ofthe Central Rand and contains all the same units. The CentralRand goldfield is located around Johannesburg and extendsfor a distance of 40 km from Roodepoort in the west toBoksburg in the east.
The principal auriferous conglomerates of the CentralRand are well developed in the west, where they are charac-terised by partings of about 1 m between the Main Reef andMain Reef Leader, and 30 m between the Main Reef Leaderand the South Reef.
Towards the east, the reefs merge progressively and atE.R.P.M, the lower two reefs are completely cut out by theSouth Reef.
The lowermost Main Reef is generally a poorly sortedconglomerate with pebbles of up to 5 cm in diameter. TheMain Reef is the most prolific gold producer in the CentralRand. It is better sorted and graded but thinner than theMain Reef Leader. Pebbles are, on average, coarser being upto 8 mm in diameter. The reef is often dark in colour, mainlydue to chlorite in the footwall. The South Reef is the mostpersistent of the conglomerate layers but is of slightly lowergrade than the Main Reef Leader. It is less well sorted thanthe other two reefs and generally occurs as a number ofindividual pebble bands with arenaceous partings. Althoughmany dykes and faults have been identified in the lease area,geologists have been able to compile reef contour plansdefining future mining blocks with confidence.
The regional distribution of high-grade areas at ERPM isrestricted to two broad zones, the Central Payshoot and theNorthern Payshoot—the latter has been extensively minedout. The Central Payshoot is projected to extend south-eastwards as far as and beyond the Van Dyk/Salliesboundary (neighbouring mines).
Over the next eight years the Composite Reef will be themajor tonnage contributor and thereafter the Main Reef,Main Reef Leader and to a much lesser extent the KimberlyReef ore will predominate.
Analysis method
History of evaluation practice at ERPM
The Hercules Shaft Area is structurally complex and care wastaken not to combine reefs duplicated by thrusting during thecapturing of the data. The Main Reef and Main Reef Leaderare separated by an interval of 0–20 m and when they merge,they are called the Composite Reef.
The different reef types were captured separately. Miningblocks defined by remnants were upgraded from resources toreserves not only based on confidence of grade but also ondistances between the reefs. At ERPM, the standard is toallocate grades in the remnant areas by allocating arithmeticaverage grades of perimeter sampling. Commonly employedestimation techniques, such as inverse-squared distancetechniques, use a weighted average of sample values toestimate the mining blocks of a deposit. The simplestapproach, the polygonal method, which assigns a centralsample value to the block, has sometimes been replaced byprocedures that also take account of the neighbouringsamples outside the block, such as weighting by the inverseof the sample distance from the block. Because of thiscorrelation, samples external to the block boundaries mayreveal information about the block.
However, even with such methods, which show adecrease in correlation with distance, it has never been clearwhy weighting by inverse distance or some other factor suchas inverse distance squared, should be used—or to whatdistance from the block the weighting system should beapplied. Furthermore, there was no way of telling how goodthe estimates were. Frequently, the results from these ratherarbitrary estimation techniques were only resolved by‘experience factors’ derived after a period of mining when thetrue block grades did not correspond with expectations.
The application of kriging methods and computertechnology to mineral deposit valuation is gainingmomentum because of the increased accuracy and speed ofvaluation that these techniques afford. This paper isrestricted to an analysis on the Hercules Shaft Area since anappropriate method of geostatistical analysis has not yetbeen devised for this area.
Collection, verification and preparation of data
Data capturing (digitizing)
Digitizing is the process of transforming paper graphics(maps, graphs, pictures), graphic files and data into a digitalformat usable by other computer applications.
A program called ‘Didger 2’ was used to capture datafrom 1:1000 mine plans and assay tracings which containeddetails of Channel Value (cmg/t) and Channel Width (cm).‘Didger 2’ is a highly accurate digitizing program and canprecisely transform points, lines or areas from paper maps,graphs, aerial photos, scanned images, graphic files andother plotted information into a digital format than can easilybe exported and used in other software.
▲
88 MARCH 2003 The Journal of The South African Institute of Mining and Metallurgy
Figure 2—A cross-section of the South Reef, Main Reef and Main ReefLeader coalescing to form the Composite Reef
The data was digitized with a tablet and puck. Tabletcalibration establishes the correspondence between thetablet’s co-ordinate system and the map’s co-ordinatesystem. When the tablet calibration is completed, ‘Didger 2’can translate the puck tablet co-ordinates into map co-ordinates and incorporate those digitized co-ordinates intothe project.
Data preparation
The digitized information was exported to Microsoft Exceland printed out in order to check for:
➤ duplicates➤ outliers (in terms of co-ordinates and values)➤ obvious mistakes➤ zero values—if not part of population, remove.
Once the data was checked, it was sorted into a formatthat would be recognized by Clark’s ‘Geostokos Toolkit’which was used to statistically analyse the data.
Postplot
Postplots of the data were generated and then printed tofacilitate easier visual analysis. The purpose of the postplot isto:
➤ look for trends➤ identify low- and high-grade areas➤ get a co-ordinated map➤ explain the geology.
The results of the postplots are shown in Figures 3–5:
Observations
Channel value (see Figure 3).
➤ High channel values are present in the far east andsouth-west; these are associated with the high channelgrades in the same area.
➤ Lower values are present in the north-west.
Channel grade (see Figure 4)
➤ There are evenly distributed high-grade areas,especially in the north-east to the north-west andsouth-west.
Channel width (see Figure 5)
➤ High channel widths exist in the west but widths aregenerally low in the east.
Statistical analysis of population
The statistical analysis is the process by which a populationis allocated a distribution category—normal, lognormal orthree-parameter lognormal.
At first, a histogram was generated in order observe thesymmetry of the distribution. Most frequency distributionsare either symmetrically spread around the mean or skewedin a certain direction. The ‘skew’ of a distribution is theextent to which it departs from symmetry throughout therange of scale values. A distribution without any skew issymmetrical. Gold, silver, uranium and other precious metals’distributions are frequently positively skewed and this wastrue for Channel Grade, Channel Value and Channel Width.
After that, a probability plot was generated. When samplevalues come from a highly skewed distribution, the
Ore reserve valuation of mined-out areas and remnants at ERPM
▲89The Journal of The South African Institute of Mining and Metallurgy MARCH 2003
Figure 3—A postplot of the Channel Value showing the distribution ofcmg/t
Figure 4—A postplot of the Channel Grade showing the distribution ofg/t
Figure 5—A postplot of the Channel Width showing the distribution ofthickness
Ore reserve valuation of mined-out areas and remnants at ERPM
probability plot results in a curved line rather than the idealstraight line which is diagnostic of a normal distribution. Thedefinition of a lognormal distribution is that the logarithms ofthe data follow a normal distribution. This may be extendedby adding a constant before taking the logarithms (threeparameter lognormal), but the principle remains. If thelogarithms (with or without an additive constant) are normal,the mean and standard deviation of the logarithms can beestimated as with any normal distribution.
The Channel Grade and Channel Width were lognormal(i.e. the probability plot yielded a straight line), ChannelValue needed an additive constant before the probability plotgenerated a straight line (i.e. three parameter lognormal).
Geostatistical analysis of population
Experimental and model semi-variogramsThe geostatistical analysis is the process by which a semi-variogram is allocated a model and this model is cross-validated for ‘closeness of fit.’ Firstly, experimental semi-variograms were generated, in different directions, in order tocheck that the ranges of each were almost equal. The chosendirections were 0, 45, 90 and 135 degrees and since all theranges were approximately equal, this meant that eachpopulation was isotropic. These populations could then beallocated omni-directional models which consider all possibledirections. This process is time-consuming and is open tointerpretation and hence, can lead to inaccuracies. Theexponential and spherical models were chosen since theyboth have sills—in the end, the spherical model was chosenfor the Channel Value and Channel Width while theexponential model was chosen for the Channel Grade.
The plots of the model semi-variograms are shown inFigures 6–8.
Cross-validation
The main difficulty with any estimation technique is that it isalmost impossible to see if the estimated value and the actualvalue are close to one another or not. The model semi-variogram provides a graphical and numerical measure of thecontinuity of the mineralization in the deposit. Differentsemi-variogram models could be fitted but it is important toknow which is appropriate.
Cross-validation is a method of justifying the choice of amodel. With this approach, a partial data set is used toestimate values at actual sampled locations. ‘Real’ and‘estimated’ values are then compared in such a way that themodel can be accepted or rejected. For the cross-validation ofa model to confirm the ‘goodness of fit’—the average errorstatistic must be approximately equal to zero and thestandard deviation error statistic must be approximatelyequal to one.
The cross-validation results are shown in the followingTable.
This cross-validation exercise yielded average errorstatistics close to zero and standard deviation error statisticsapproximately equal to one (see above). The models werehence accepted as being true.
▲
90 MARCH 2003 The Journal of The South African Institute of Mining and Metallurgy
Figure 6—The spherical model semi-variogram on the Channel Valuedata
Figure 7—The exponential model semi-variogram on the Channel Gradedata
Figure 8—The spherical model semi-variogram on the Channel Widthdata
Average error Standard deviationstatistic error statistic
Channel Value 0.00093398 0.8976Channel Grade -0.0115 0.9305Channel Width -0.0017 0.9433
Kriging
Geostatistical estimation techniques, based on a study of thespatial variability of the orebody as reflected in the semi-variogram, are superior because they allow calculation of ameasure of the error associated with the estimates, namelythe variance of the error distribution. It is also possible tofind the set of weighting coefficients for a given block anddata configuration that minimizes this estimation variance.This procedure, which yields the best linear unbiasedestimator, is known as ‘kriging’. In other words, kriging is anestimation technique that employs the semi-variogram togive the smallest standard error.
The advantages of kriging:
➤ The estimation technique is tailored by our interpre-tation of the geological environment as quantified inthe semi-variogram model.
➤ The standard error provides an estimation of how goodor bad the estimator is.
➤ It combines the variance-distance relationship betweenor amongst the samples.
➤ It accommodates clustering and poor distribution ofsamples.
➤ Kriging automatically compensates for distribution andoptimizes the weights that various samples get as wellas ensuring that the weights add up to one.
➤ It allows for size and shape of the samples.➤ It honours the data points because the locations of all
points are known.
The disadvantages of kriging:
➤ The estimation method is tailored by our interpretationof the geological environment and as quantified in thesemi-variogram model. There is no way of determiningwhether the semi-variogram is right or not.
➤ You can only use it if there is no trend.➤ The regression effect is present so long as you use a
weighted average—the high grades are over-estimatedand the low grades are under-estimated.
➤ Highly skewed data causes problems.➤ Smoothes the data.
The kriging results are shown in Figures 9–11.
Discussion of results
There is good correlation between the postplots and thekriging results.
Channel Value (see Figure 3 and Figure 9)➤ High channel values are present in the far east and
south-west, lower values are present in the north-west.
Channel Grade (see Figure 4and Figure 10)
➤ There are evenly distributed high grade areas,especially in the north-east to the north-west andsouth-west.
Channel Width (see Figure 5 and Figure 11)
➤ High channel widths exist in the west but widths aregenerally low in the east, there are some high channelwidths scattered towards the east.
Conclusions and recommendations
This analysis is by no means complete! To ensure that atheoretically correct method such as kriging is accepted bythe mine, it is important to prove that the results are at least
Ore reserve valuation of mined-out areas and remnants at ERPM
▲91The Journal of The South African Institute of Mining and Metallurgy MARCH 2003
Figure 9—Kriging results for Channel Value
Figure 10—Kriging results for Channel Grade
Figure 11—Kriging results for Channel Width
Ore reserve valuation of mined-out areas and remnants at ERPM
as good as those obtained by a more traditional method. Thegeostatistical method described is used to predict the orevalues in situ. The only other reliable independent estimateof the ore values is obtained from the surface plant, wherethe tonnage and grade of the mill feed are known withconsiderable precision. After some consultation with theSurvey, Geology and Planning Departments at the mine, thecut-off grades must be established so that grade-tonnagecurves can be plotted. These will enable important decisionsto be made about which remnant blocks can be extractedeconomically and which should still be left underground. It isimportant that the data are analysed separately in terms ofreef types, therefore a similar study must be done for theMain Reef and South Reef (where it occurs). This will enablebetter analysis of each remnant block since it is composed ofseveral reefs in the Hercules Shaft Area. The block sizes foreach block were not known and the kriging sizes wereselected by default—once these are known, the krigingresults will be closer to the truth. The kriging results confirmthe position of the high channel grade, value and widthareas, therefore, the geostatistical analysis is successful—enough can be deduced to locate and extract the reef.
Also, other kriging methods like universal kriging orrandom kriging can be assessed for better results. Themining method in the Hercules area is ‘undefined’ and thechannel widths vary considerably because of the change inreef composition. Presently, remnants are being extractedrandomly as they are being discovered, so once a standardmethod or width has been allocated, a better geostatisticalanalysis can be performed since panel lengths/block sizeswill be known. With more time, better models can be chosenwhose cross-validation results are closer to the ‘fit.’ The
methods of sampling in the Hercules area can also beimproved upon. Each reef must be sampled separately andcontinuously to facilitate more effective analysis—ERPM is inthe process of setting up a dedicated Mineral ResourcesManagement Department which will aid in the continuousmonitoring and valuation of the Hercules area.
References
1. STORRAR, C.D. South African Mine Valuation, Chamber of Mines SouthAfrica, 1987.
2. CAMDEN-SMITH, P.M. Geostatistical Estimation of Ore Reserve Grades in theBlue Sky – Cason – Comet Shaft Areas Above 22 Level, ERPM Report,1990.
3. The Mineral Resources of South Africa, Council for Geoscience, SixthEdition 1998.
4. RENDU, J.-M. A Case Study: Kriging for Ore Valuation and Mine Planning.Engineering and Mining Journal, 1980.
5. KRIGE, D.G. The Use of Geostatistics in Defining and Reducing theUncertainty of Grade Estimates, Transactions of the Geological Society ofSouth Africa. 1985.
6. Personal Consultation with Dr F.T. Cawood (University of theWitwatersrand).
7. Personal Consultation with Peter Camden-Smith (Chief Geologist andGeostatistician – ERPM).
8. Papers for the Presentation in the Session ‘Ore Reserves: Classification,Calculation and Report – A Corporate Viewpoint’ at the Society of MiningEngineers of the AIME, 112th Annual Meeting, Atlanta, Georgia, March1983.
9. CLARK, I. The Art of Cross Validation in Geostatistical Applications,APCOM, 1986.
10. MACFARLANE A.S. A Code for the Valuation of Mineral Properties andProjects in South Africa, Colloquium: Valuation of Mineral Projects andPerspectives—An African Perspective. Jnl S. Afr. Min. Metall.Mar. 2002. ◆
▲
92 MARCH 2003 The Journal of The South African Institute of Mining and Metallurgy
For many years the Chamber of Mines awarded a GoldMedal and a scholarship for graduate studies in mining ormetallurgy or Engineering at Witwatersrand and PretoriaUniversities. At each university the top student in mining ormetallurgy and the top engineering student were awardedthe scholarship and presented with a medal. During 2000the Chamber of Mines discontinued its support for thesescholarships and the Minerals Education Trust Fund brieflystepped into the gap. However, the Trust’s function is notone of providing scholarships hence the South AfricanInstitute of Mining and Metallurgy sought the support of themajor mining companies so as to continue with thesesignificant awards.
In 2001 and in 2002 these awards to the top students inthe fields of mining or metallurgy and engineering wereoffered through the SAIMM and with the generous supportof the following ten companies:
➤ Anglo American plc
➤ Anglogold
➤ Anglo Platinum Corporation➤ Avmin➤ BHP-Billiton SA➤ De Beers➤ Goldfields of SA➤ Impala Platinum➤ Kumba Resources➤ Sasol Mining
The SA Institute of Mining and Metallurgy as represen-tative of the industry’s professionals is sincerelyappreciative of the support from these companies. Throughthese awards the mining industry is making a meaningfulcontribution to the development of excellence in the industrythough the further development of deserving students atboth Pretoria and Witwatersrand Universities. Thesegraduates will have specialized skills that can lead the wayfor technical developments in the future industry; suchdevelopments will have meaningful impact upon the safetyand cost effectiveness of mining in South Africa. ◆