+ All Categories
Home > Documents > Ore shoot targeting in the Gosowong Vein Zone, Halmahera, Indonesia_2001... · 2014-11-18 · Ore...

Ore shoot targeting in the Gosowong Vein Zone, Halmahera, Indonesia_2001... · 2014-11-18 · Ore...

Date post: 16-Mar-2020
Category:
Upload: others
View: 2 times
Download: 0 times
Share this document with a friend
140
Ore Shoot Targeting i11 the Gosowong Vein Zone, Halmahera, Indonesia. by Daniel J. Olberg, B.Sc. Submitted in fulfillment of the requirements for the degree of MEconGeol. University of Tasmania August 2001 1
Transcript

Ore Shoot Targeting i11 the Gosowong

Vein Zone, Halmahera, Indonesia.

by Daniel J. Olberg, B.Sc.

Submitted in fulfillment of the requirements for the degree of MEconGeol.

University of Tasmania August 2001

1

-~ \ .

DECLARATION

This Thesis contains no material which has been accepted for a degree or diploma

by the University or any other institution, except by way of background information and

duly ac~owledged in the Thesis, ·and to the best of The Candidates knowledge and

belief, no material has been previously published or written by another person except

where· due acknowledgement is made in the text of the Thesis.

Signed:~JJ;~

A-UTHORITY OF ACCESS

This thesis may be made available for loan. Copying of any part of this thesis is

prohibited for two years from the date this statement was signed; after that time limited

copying is permitted in accordance with the Copyright Act 1968.

Signed: fJJJJ&Ly

2

ABSTRACT

Gosowong is located in the Maluku province of eastern Indonesia, on the north arm of the

island of 5f~ahera. It is a classic example of a volcanic-hosted, low-sulfidation, epithermal

T quartz vein deposit. Due to the relatively short mine life, there is a very limited time frame for

increasing ore reserves bef{)re mining ceases. Therefore a great emphasis has been placed on

exploring the strike extent of the structure that hosts the Gosowong deposit. This mineralized

structure is known as the Gosowong Vein Zone (GVZ) and has been traced along strike for 2 km,

though the Gosowong deposit encompasses only a 400 m section of the total strike length. The

primary aim of this study is to identifY additional high-grade ore-shoots along the GVZ. To this

end, a multi-faceted approach has been implemented incorpo!ating structure, stratigraphy, vein Oc~

textures, alteration zoning, fluid inclusions, and metal zoniflt, with the ultimate aim being to Y

construct a system model that will allow predictive targeting of high-grade ore-shoots along the

GVZ. Most data are presented on a longitudinal section of the GVZ.

High-grade mineralization at the Gosowong deposit occurs within two gently south­

plunging ore shoots: the Quartz-Adularia zone (QA) and the Quartz-Chlorite zone (QC). The

interplay between structure and stratigraphy is thought to be one of the main controls on the

emplacement and distribution of high-grade mineralization at Gosowong. A distinct mappable

volcanic stratigraphy has been recognized within generally intermediate to mafic coherent

volcanic and volcaniclastic rocks of Miocene age. The preferential host rocks to faulting and

subsequent quartz veining are the Gosowong Volcaniclastics, a package of resedimented

volcaniclastic rocks with interbedded ignimbrite and andesitic lava. This unit dips moderately to

the south, striking roughly perpendicular to the strike of the GVZ. The intersection between the c; v 2

volcaniclastic stratigraphy and the~~~ is thought to be the key factor in the 1::::i+<FJ deposition of high-grade mineralization.

A study of quartz vein textures along the GVZ has shown that high-grade mineralization

is generally developed in discrete shoots within lower grade or barren mineralization. The vein

texture most commonly associated with high-grade mineralization is poly-compositional

crustiform/colloform/cockade banding. The presence of bladed calcite pseudomorphs at various

levels in the system is a positive indication of boiling, though they do not always carry significant

Au· grades. Banded chalced~ny and phreatic breccia deep in the system perhaps indicates further

f)JJiJn~MI {i potential at depth.

Alteration zoning ,was mapped out with the use of a PIMA mineral analyzer. The

alteration in the GVZ is typical of low-sulfidation, epithermal deposits: Illite-group minerals are

3

dominant in the ore horizons while propylitic assemblages are usually associated with weakly

mineralized veining. lllite-group minerals and chlorite display a distinct zoning along the fluid

flow pathway, from illite-chlorite ~ illite ~ illite-smectite ~ smectite-illite with decreasing

depth. Alteration zoning mimics stratigraphy, as indicated by gently south plunging paleo­

isotherms. Mineralizing fluids are postulated to have ascended the Gosowong fault and then

spread out laterally along the permeable volcaniclastic horizon.

Fluid inclusion analyses indicate that mineralizing fluids have a typical epithermal

signa~e: dilute (generally <1.0 eq. wt. % NaCl) and low temperature (generally 175-265°C).

Coexisting vapor-rich and liquid-rich primary fluid inclusions indicate that boiling processes have

taken place in the GVZ. Trapping temperatures in the QA zone suggest that quartz deposition

took place 100-350 m below the paleo-water table. The variation in trapping temperatures

between the QA (21 0°C) and the QC (236°C) may indicate multiple mineralizing events. Paleo­

isotherms mimic the stratigraphy, plunging gently to the south, indicating a component of . horizontal fluid flow through the permeable volcaniclastic units.

The GVZ appears to display most of the typical vertical metal zoning common in low­

sulfidation epithermal systems: base metals dominant deep in the system, precious metals

dominant at shallow levels. Base metal values are generally* low, averaging 125 ppm Cu, 53 'XI

ppm Pb, and 83 ppm Zn. Lead is the base metal most closely associated with Au mineralization.

The distribution of high Au and Ag values indicates a gentle southerly plunge to the precious

metal-rich horizon. Increasing Cu/Zn, Zn/Pb, and precious-metal/base-metal ratios may indicate

vectors to ore-grade mineralization.

It appears that the southerly plunge of the strata, ore-shoots, paleo-isotherms, alteration

zoning, and metal zoning may be in part due to the post-mineral tilting of the GVZ. It is believed

that pre-mineralization deformation has rotated the strata approximately 25-30° to the south,

while post-mineralization deformation has added an additional 10-15° to the overall rotation of

the strata. Thus, deeper levels of the system are exposed closer to the surface on the north end of

theGVZ.

A Gosowong specific "prospectivity matrix" has been constructed based on the sum total

of the relative prospectivlties of each of the components analyzed in this study. This matrix

indicates that the most prospective area of the GVZ (outside of the Gosowong deposit area) is the

area deep and to the south of the deposit. Additional, slightly less prospective areas have been . ;

delineated and a total of 5 drill holes have been targeted on these zones of interest.

4

ACKNOWLEDGEMENTS

I would like to thank Newcrest Mining Limited for all the support, financial and

otherwise, during the course of this study and to acknowledge the contributions of the large

number of geologic staff, consultants, and field assistants who have worked on the Gosowong

exploration program over the past 8 years. In particular, I would like to thank Dan Wood, Ray

McLeod, Dave Pearson, and Grant Davey for their support of my educational endeavors. In

addition, I would like to thank Bruce Gemmell for his guidance and useful draft reviews and to

Handono for his assistance in drafting a number of the figures in this report.

5

TABLE OF CONTENTS

1. INTRODUCTION .....................................•........•...........•.................•. 13

1.1 BACKGROUND ........••••.•.•.....•.•.•.•.•.....•..•••••••••........•.••.........••••••........•••.•••.....•• 13

1.2 LOCATION •••.•.••.........••••..•.......•...•••.•.•••.....•.•..•..••....•••••..•......•.•...•........•••.......•. 14

1.3. PREVIOUS WORK ............•••.............•...........................•............•••..........•••...... 14

1.4 AIM OF THE IN'VESTIGATION •...•.......•.•.•.........••.•••.•.......•••.•......••.•.•••..•...•. 15

1.5 SCOPE OF THESIS ..•.........•••.••••.......•.•••.........••••••••......•..•.•.•......••••••.•.......•.•••. 16

2. DEPOSIT GEOLOGY .......•........................•...................•...•.......•...•. 21

2.1 TECTONICS ....................................................................................................... 21

2.2 DISTRICT GEOLOGY ..................................................................................... 23

2.3 DEPOSIT GEOLOGY ••..•..........•.•............•••••......•....•............•••............•.........•• 24 2.3.1 Lithology ....••...............•.........................................................••.............•....... 24 2.3.2 Structure .............•..•.•............•.••••.........•••........••.•••••.......•••.•........•..•.••.......... 26 2.3.3 Alteration ...........•.•...........••............•••••.........•••...........••••.•..........•...........•.••.. 29 2.3.4 Mineralization .....•.........•..•.••.••.........•.•..........•.•.•.........•••............••.............••. 30

2.4 DEPOSIT IDSTORY ......•••..........................................••..........•••.•..........••••...... 33

3. RESULTS OF THE INVESTIGATION .......................................... 37

3.1 STRATIGRAPHY & STRUCTURE ..•.•..•........•••••••........•••.............•...........•... 39 3.1.1 Introduction ••••.........••..•.•........•••••••......•••.•...........••••............•.......••...•........•. 39 3.1.2 Methodology ..................•............•.............•..............•...........•..•.........•••••...... 39 3 .1.3 Stratigraphy •...........•.••......•....•.•............•....•.......................................•.•....... 40

3.1.3.1 3.1.3.2 3.1.3.3 3.1.3.4 3.1.3.5 3.1.3.6

Ruwait Volcanics •••••....•.•••••••••••••••••••••••••..•.••••••••••••.•.•••••••••••.••.•..••••••••••..•...•••• 40 Tobobo Sandstone ••••••••••••••.•...••••••••••••••.•••••••.••.••...•••••••••••.•..•......•••••••••..••••.••• 41 Gosowong Volcaniclastics .............................................................................. 42 Ridge Volcanics ..•..•••••••••••..•••••••••••••...•.••••••••••...•••••••••••....••••••••••.••••.••••••••.•.•.•• 44 Environ-:9tent of Deposition •..•••••••••••••••••••....•..•••••••••••..••..•••••••••..•.•••••••••••.•••.. 45 VolcanolOgical Model .••••••••••••......•••.•••••..•••••.••.•..•.••••••••••••••••••••••....••••••••••••.•.• 45

3.1.4 Structure ••• 1 •••••••••••••••••••••••••••••••••••••••••••••••••••••••••••••••••••••••••••••••••••••••••••••••••• 4 7 3.1.4.1 Faulting ...•..••••••••••.•.....••••.....•.•.•.•••••••....•..•.••••.•....••••••.••.•.••••••...••.•.•••••••••.••.•.••• 47 3.1.4.2 Bedding, .•..•••••••••.•.••••••••••••••...••••••••••••...••••••••.......•.•••••••••••.•.••••••..••••...••••..•••••.• 51

3.1.5 Discussion ...... : ••...........••.•...........••..........•••.••......••.•••.•.......•.••••....••..•.......•.••• 52 3.1.6 Conclusions .••.....•...••••.•.•.......•••••••••.......•.•••..•..••••..••...•.........••...••.••••..••••...... 54

6

3.2 QUARTZ VEIN TEXTURES •••..••...•.•........••..•.•.•.•••.•.......•.•.••••.•••..........•.•......• 56 3.2.1 Introduction •.•.•.•................•.•.•..•.••.•........•...••••••••...........•••••••.•.•........•••........ 56 3.2.2 Methodology •.....•••••...•..........•.........•..••••.•...........••••••...............•.....•.•••....•••.. 56 3.2.3 Results ••••...•••.....•...•••••••.••...........•...•.•..••..••...........•.•••••...•...•.........••..•.•••.•...•. 57

3.2.3.1 Crnstiform/Colloform Banded Quartz ......................................................... 57 3.2.3.2 Bladed Calcite Pseudomorphs ....................................................................... 60 3.2.3.3 Crystalline Quartz .......................................................................................... 62 3.2.3.4 Chalcedony ••.•.•.•••.•...............••..•••••.................•...•...........•.....••..••.......••..••........ 63 3.2.3.5 Vuggy Quartz •........••.•...•.........•...........•.•.•..••............••••••..••.........••..••••••.•.•...... 65

3.2.4 Textural Zoning Model •.•..••...•...........•..•.•....•...•...•..••.•.•.•••.•...•..••.••.•.•.•.....•• 66 3 .2.5 Conclusions •••.•....•.....••.•••....•.•.•.•.•••••..••.......••••.•.•.........•.•..••••.••.••...•............• 70

3.3 ALTERATION ZONING ...........•..••.•.•.•.•.•...........••..••.••..•..••...••.........•••...••.•••.. 72 3.3.1 Introduction .••••.....•.............•.•.•.•••.........•..•••.•••............••••••••...........•.••••...•..•• 72 3.3.2 Methodology .•.....••....•.•.•.•••••.........••••.••....•............•.•.•...•.........•.•.•......•...•••••. 73 3.3.3 Results ......•..••...•.•..............•...•.•...••..•.......•..•...•.•.•.•.•......••...•.•.•.•.••...•......••.... 73

3.3.3.1 Kaolinite-Dickite±Alunite ..........•.••..••.............•.•.••••••............•...•••••••.......•....•• 76 3.3.3.2 Smectite> Illite •.•.•.•.•.••..•...•••••.••••.•••••.•.•...•.••••••••••..•.•••••••••••••••••..•••..•••••••••••••.•.• 77 3.3.3.3 Illite>Smectite±<;arbonate •.•.....••........••••..••.•...........•••.•••••••...•.........••...•••.•.•.. 77 3.3.3.4 Chlorite-Smectite±lllite .•••••••..•..........•......•••••................•.•.••••................•••••.•.. 78 3.3.3.5 Illite±<;hlorite±<;arbonate •••.................••.•••.........•...•..•.••..•...•....••••••..•••.......... 79 3.3.3.6 Chlorite-Epidote±<::arbonate ......................................................................... 80

3.3.4 Alteration: Conditions of Formation ......................................................... 81 3.3.5 Alteration Zoning Model .•.•...........•...•.•...••..••.............•••.•..••...•.........•••••••••. 83

Hypogene Alteration •..••••••••••••••..•.....•...••.••.•••................•.•.........•...•••....••..••..•. 84 Steam-Heated Alteration ..••..•...............•..•...............•..•.............•....••..••.•....•.... 87

3.3.5.1 3.3.5.2

3.3.6 Conclusions ..•.•...•.•....•••...........•.••••....••..••...•...•.••....•.•....•............••..••••••.•...... 89

3.4 FLIDD INCLUSIONS •.•.•.•.•••........••••.•••••.•...........•••••...••.......•.•...••.............•.•.•.• 91 3.4.1 Introduction .••.••..•...........•.•.•.•.•••••........•....•••.•••.........•.•.•..•..•••.......•..•••..•..••.. 91 3.4.2 . Methodology ••.•..••.•.•...•.....•.•..••••••...•.•...•.••....••.•...•...•.......•.......•.•.•.•.......•..... 91 3 .4.3 Results ..........••.•••.•.................•••.•.•............•.•.•.•..........•.•••••.•..........•.•••••.•.•..... 92

3.4.3.1 Heating Studies .......•••••...•................••••••................•...•.•.•.••...............•..•••••...... 93 3.4.3.2 Freezing Studies .••..••.•••••.••...............••..••••........•........••..•........•..••...•.............•.• 96

3.4.4 Discussion ...•.•••••.•................•.•.•.•............•...•...•.•...•.•..........•.••••.•••...•..........••• 98 3.4.5 Conclusions •.•••...•.•.•............•..•.•.•.•.........•.•.••..••.....••.••...........•.•.••••.•........... 1 00

3.5 METAL ZONING •......•...•...•••.••.•..•.......••••.•••.•.•...•.......•...•.••••.•...•.......•.••.•••••.•. 1 02 3.5.1 Introduction •••••••............••.•.•••..............•.•••.••.............•.•...•.•.•...•.•..........•...•. ! 02 3.5.2 Methodology ...•.••••.•••.•...........•.••••••••...........••••...••.•.••••••.....•....••.•..•••.•........ 103 3.5.3 Results •..•.. -~~ ........•.•.•.•.•••...........•..••.•.•.•...........••••••.•.•.........•.•.•.•••......•.....•.••• 104

3.5.3.1 Single El_ement .••........••....••....••..........•......••..•..................•..•...•.....•............•... 1 05 3.5.3.2 Metal Ratios .................................................................................................... I 09 3.5.3.3 Vein Domain Scatter Plots ........................................................................... 115

3.5.4 DiScussion .• ! ....................................•...•................•.•...............•.........•..•....... 117 3.5.5 Conclusions .•..........•••••.•.•.•..........••.••••.•...........•.•.•••.••••.••..............•.•.•.•.•.•... 121

7

4. DISCUSSION •.•...........•.•.•• -. ..•..•••......••.•.•••••.•.....•.•..•..•••.•.•.•...•.....•..•• 124

4.1 INTRODUCTION ....•••••••••..........••••..•••.•...........••••.•.••..........•.•••.•••••.......•.•.•.•••. 124

4.2 INTEGRATED GOSOWONG MODEL .••..••............••...•...........•...•.•.•.•.•.•.... 124

4.3 PROSPECTIVITY ..........•..••..••.•.••.••........•......•.••.••.••.......•...•....••..••...•••........••. 128

5. CONCLUSIONS .......•••.•..•...............•.•....•...........•.•.•..•............•.••....• 131

6. 'RECOMMENDATIONS •........•.•....•.•.......••.•.•.•••........•...••••.•.........•. 135

REFERENCE 8 •.....•..........•..••...........•...............•.•............•.•.••..............••••.. 141

INDEX •.•.........••••.... "" ...•.•.••..•...•.••••.......•.•••.•.....•.•.•.....•...••. 145

APPENDIX I: Drill Hole Locations ••••••••••••••••••••••••••••••••••••••••••••• 147

APPENDIX II: GVZ Database ••••••••••••••••••••••••••••••••••••••••••••••••••• 150

APPENDIX Ill: Cross-Section Geology ••••••••••••••••••••••••••••••••••••••••• 159

APPENDIX IV: PIMA Results ••••••••••••••••••••••••••••••••••••••••••••••••••• 165

APPENDIX V: Fluid Inclusion/Petrology Results •••••••••••••••••••••••••••••• 187

APPENDIX VI: Pr~spectivity Matrix ••••••••••••••••••••••••••••••••••••••••••• 221

8

LIST OF FIGURES

Figure 1.1. Halmahera and Gosowong location map .................................................................................... l4

Figure 1.2. The Gosowong district pre-mining ............................................................................................ 18

Figure 1.3. Active Mt. Gamkonora, looking south down the Halmahera Arc .............................................. 18

Figure 1.4. The Qosowong mill and village ................................................................................................. 18

Figure 1.5. The Gosowong North exploration camp, I km north of the Gosowong pit ............................... 19

Figure 1.6. Grade control rigs on the floor of the pit.. .................................................................................. l9

Figure' 1.7. View of the Gosowong pit from the top ofthe south wall ........................................................ 19

Figure 1.8. Gold pour, Gosowong mill. ........................................................................................................ 20

Figure 2.1. Southeast Asia tectonics ............................................................................................................. 21

Figure 2.2. Halmahera regional geology ...................................................................................................... 22

Figure 2.3. Gosowong District Geology, based on airphoto interpretation .................................................. 24 . Figure 2.4. Gosowong deposit stratigraphy .................................................................................................. 26

Figure 2.5. Gosowong vein cross-section geology: section 1 0,200N ........................................................... 27

Figure 2.6. Gosowong vein longitudinal section .......................................................................................... 28

Figure 2. 7. Gosowong vein geology and mineralization .............................................................................. 31

Figure 2.8. Gosowong district genesis .......................................................................................................... 34

Figure 2.9. Gosowong vein paragenesis ....................................................................................................... 36

Figure 3.1. The Gosowong longitudinal section .......................................................................................... 38

Figure 3.1.1. Generalized stratigraphy of the Gosowong Formation volcanics and volcaniclastics .......... ..40

Figure 3.1.2. GVZ stratigraphy illustrating stratigraphical correlation along the strike of the GVZ ........... .41

Figure 3.1.3. Volcaniclastic sandstone and conglomerate of the Tobobo Sandstone formation ................. .42

Figure 3.1.4. Hematitic volcaniclastic of the Gosowong Volcaniclastics formation ................................... .44

Figure 3.1.5. Strongly welded, eutaxitic, dacitic ignimbrite of the Gosowong Volcaniclastics ................... 44

Figure 3.1.6. Dacitic pumice breccia of the Gosowong Volcaniclastics formation ...................................... 44

Figure 3.1.7. Plagioclase-phyric andesite flow from the Ridge Volcanics formation ................................. .45

Figure 3.1.8. Volcanological model of the GVZ ......................................................................................... .46

Figure 3.1.9. Gosowong Vei~ Zone geology .............................................................................................. ..48

Figure 3.1.10. A. Vein zone thickness B. Total structural dilation ............................................................. .49

Figure 3.1.11. Section 9700"ti geology ........................................................ , ............................................... 50

Figure 3.1.12. Gosowong vein zone dip isogons .......................................................................................... 51 I

Figure 3.1.13. The trace ofbedding on the Gosowong fault plane ............................................................... 52

Figure 3.2.1. Crustifonn/colloform banded quartz vein ............................................................................... 58

9

Figure 3.2.2. Crustiforrn/colloform banded quartz vein, photomicrographs ................................................ 59

Figure 3.2.3. Average Au grade versus dominant vein texture .................................................................... 60

Figure 3.2.4. Bladed calcite pseudomorphs .................................................................................................. 61

Figure 3.2.5. Crystalline quartz vein ............................................................................................................ 63

Figure 3.2.6. Banded chalcedony ................................................................................................................. 64

Figure 3.2.7. Vuggy quartz ........................................................................................................................... 66

Figure 3.2.8. Zones oftlie dominant quartz vein textures along the GVZ .................................................... 67

Figure 3.2.9. Schematic model for zoning of quartz vein textures ............................................................... 68

Figure.3.2.10. Banded chalcedony and phreatic breccia from DFD-009 .................................................... 69

Figure 3.3.1. Alteration zoning within the Gosowong Vein Zone ................................................................ 74

Figure 3.3.2. Interpreted cross-sectional alteration zoning patterns along the GVZ .................................... 75

Figure 3.3.3. Kaolinite-dickite±alunite altered volcanic rocks ..................................................................... 76

Figure 3.3.4. A. Smectite-illite-pyrite altered ignimbrite B. Smectite-illite-pyrite altered volcaniclastic. 77

Figure 3.3.5. Chlorite-smectite altered and quartz veined volcaniclastic rock. ........................................... 79

Figure 3.3.6. Altered wallrock showing two end-member examples of the illite±chlorite zone .................. 80

Figure 3.3.7. Propylitic (albite-chlorite-epidote-calcite) altered andesitic volcaniclastic mass flow units .. 81

Figure 3.3.8. Alteration zoning along the Gosowong Vein Zone ................................................................. 83

Figure 3.3.9. Schematic section showing typical zoning patterns in low-sulfidation epithermal veins ....... 85

Figure 3.3.10. The Buchanan model of the epithermal system .................................................................... 85

Figure 3.3.11. Alteration zoning along the Gosowong Vein Zone ............................................................... 86

Figure 3.3.12. Shallow manifestation of an epithermal system .................................................................... 88

Figure 3.4.1. Fluid inclusion photomicrographs ........................................................................................... 94

Figure 3.4.2. Fluid inclusion temperature ofhomogenization results .......................................................... 95

/~ ( \

Figure 3.4.3. Fluid inclusion temperature of homogenization versus relative level within the system ........ 95

Figure 3.4.4. Distribution of average fluid inclusion temperatures along the GVZ ..................................... 96

Figure 3.4.5. Fluid inclusion freezing point depression results .................................................................... 97

Figure 3.4.6. Fluid inclusion salinity versus relative level within the GVZ ................................................. 97

Figure 3.4.7. Distribution of average fluid inclusion salinities along the GVZ ............................................ 98

Figure 3.4.8. Boiling point for depth curve showing the ranges of fluid inclusion temperatures ................. 99

Figure 3.4.9. Fluid inclusion 'temperature versus salinity plot.. .................................................................. l 00

Figure 3.4.10. Fluid inclusion'temperature versus salinity plot.. ................................................................ lOO ,·

Figure 3.5.1. Low sulfidation !epithermal Au-Ag system ........................................................................... } 02

Figure 3.5.2. Au, average grage contours (ppm) ........................................................................................ 105

Figure 3.5.3. Ag, average grade contours (ppm) ........................................................................................ 106

10

Figure 3.5.4. Cu, average grade contours (ppm) ........................................................................................ 1 07

Figure 3.5.5. Pb, average grade contours (ppm) ......................................................................................... 107

Figure 3.5.6. Zn, average grade contours (ppm) ......................................................................................... 108

Figure 3.5. 7. As, average grade contours (ppm) ......................................................................................... l 09

Figure 3.5.8. Sb, average grade contours (ppm) ......................................................................................... 1 09

Figure 3.5.9. Au/ Ag contours with postulated fluid flow vectors ............................................................. 111

Figure 3.5.10. Au/Cu contours with postulated fluid flow vectors ............................................................. Ill (\

Figure 3.5.11. Au/Ph contours with postulated fluid flow vectors ............................................................. 112

Figure,3.5.12. Au/(Cu+Pb+Zn) contours with postulated fluid flow vectors ............................................. 112

Figure 3.5.13. Ag/Cu contours with postulated fluid flow vectors ............................................................. 113

Figure 3.5.14. Ag/Pb contours with postulated fluid flow vectors ............................................................. 113

Figure 3.5.15. Cu/(Cu+Pb) contours with postulated fluid flow vectors .................................................... ll4

Figure 3.5.16. Cu/(Cu+Zn) contours with postulated fluid flow vectors .................................................... 114

Figure 3.5.17. Zn/(Zn+Pb) contours with postulated fluid flow vectors .................................................... 114

Figure 3.5.18. Sb/(Sb+As) contours with postulated fluid flow vectors .................................................... 115

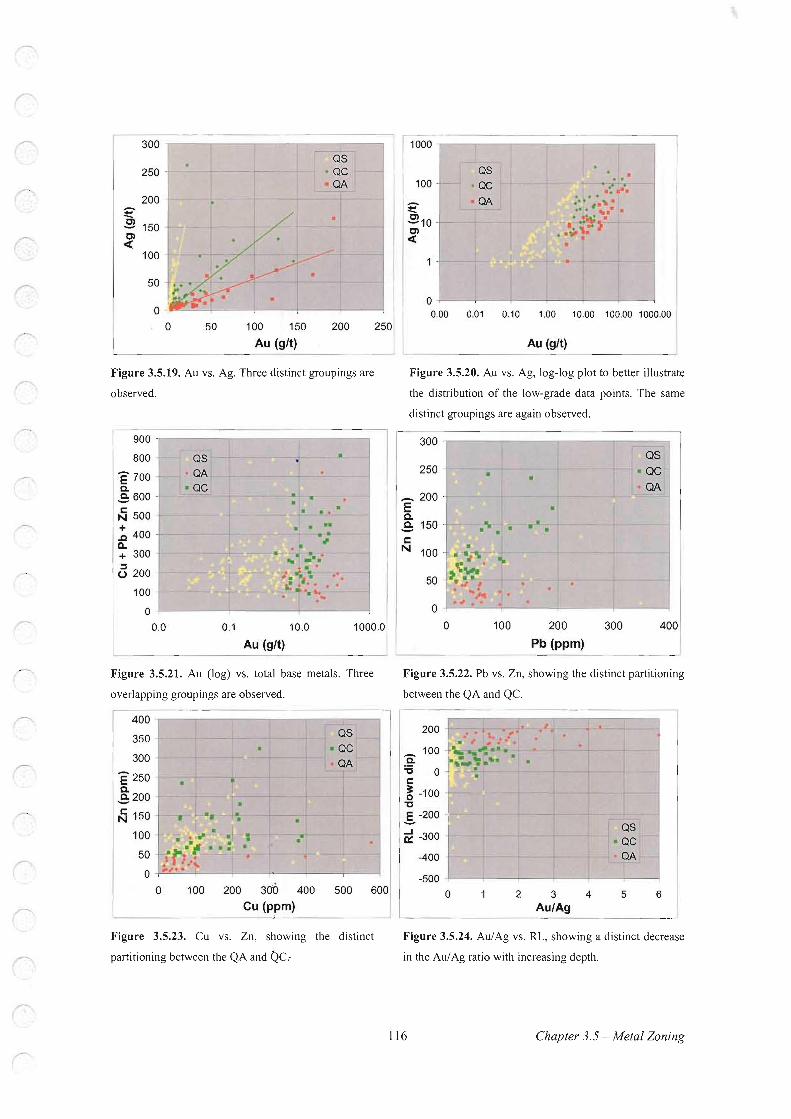
Figure 3.5.19. Au vs. Ag scatterplot. .......................................................................................................... l16

Figure 3.5.20. Au vs. Ag, log-log plot scatterplot ...................................................................................... 116

Figure 3.5.21. Au (log) vs. total base metals scatterplot ............................................................................ 116

Figure 3.5.22. Pb vs. Zn scatterplot ............................................................................................................ ll6

Figure 3.5.23. Cu vs. Zn scatterplot ....... · .................................................................................................... 116

Figure 3.5.24. Au/ Ag vs. RL scatterplot. .................................................................................................... 116

Figure 3.5.25. Schematic section showing typical variation of indicator elements as function of depth .. 117

Figure 3.5.26. Common trends in Au/ Ag ratios within the porphyry/ epithermal environment ................. ll8

Figure 3.5.27. Mechanisms for metal zonations in low-sulfidation hydrothermal systems ........................ l19

Figure 4.1. Schematic section that generalizes patterns of alteration in low-sulfidation systems .............. 125

Figure 4.2. Schematic interpretation of ore-shoot genesis, subsequent southward rotation and erosion .... l26

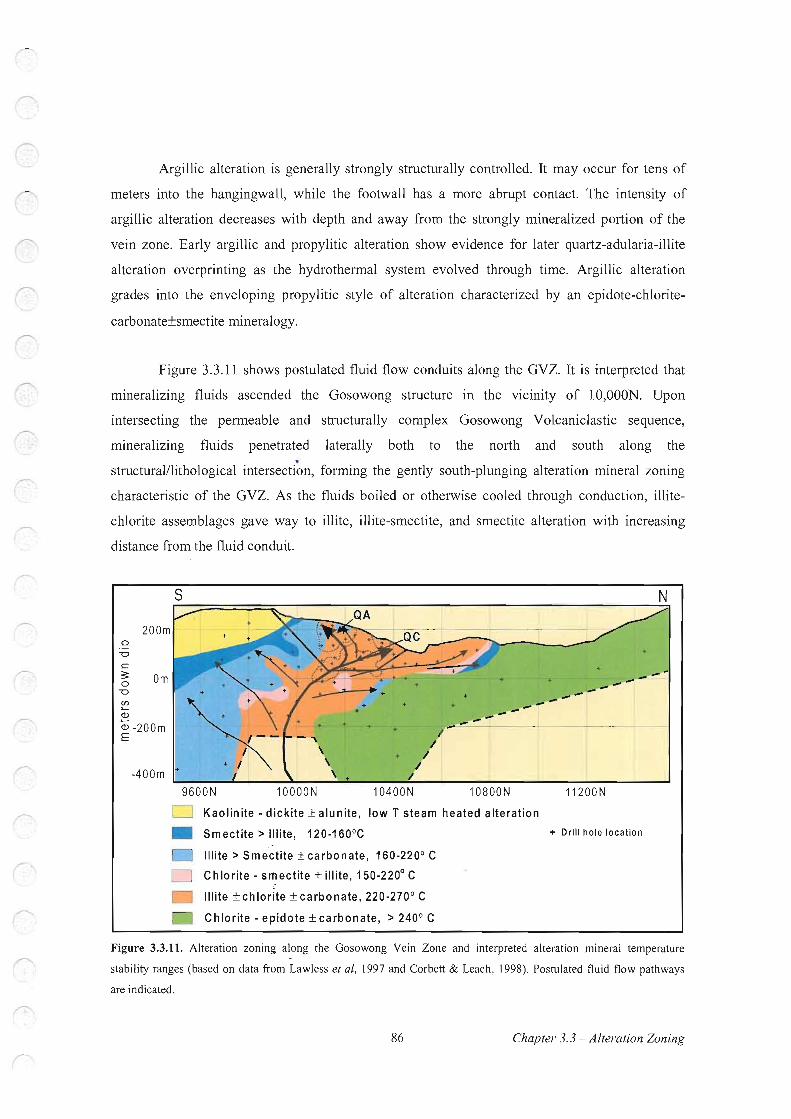
Figure 4.3. Alteration zoning along the Gosowong Vein Zone .................................................................. 127

Figure 4.4. Postulated fluid flow vectors of the Gosowong Vein Zone ...................................................... l28

Figure 4.5. Contoured results of the GVZ prospectivity matrix ................................................................. 130

Figure 6.1. Gosowong Vein Zone prospectivity matrix with proposed drill hole locations ....................... 136

Figure 6.2. Section 9400N, proposed drill hole location (Hole A) ............................................................. 137 <'

Figure 6.3. Section 9200N, proposed drill hole location (Hole B) ............................................................. l37

Figure 6.4. Section 1 0,200N, proposed drill hole location (Hole C) .......................................................... 138

Figure 6.5. Section 11,900N, proposed drill hole location (Hole D) .......................................................... 139

Figure 6.6. Section 1 0,900N, proposed drill hole location (Hole E) .......................................................... 140

11

LIST OF TABLES

Table 2.1. Ore domain characteristics and average metal values ................................................................. 33

Table 3.3.1. Alteration mineral interpreted temperature and pH stability ranges ......................................... 83

Table 3.4.1. Summary ofGosowong fluid inclusion results ......................................................................... 93

Table 3.5.1. Assay methods and detection limits for Gosowong drill-core ................................................ 103

Table 3.5.2. Average metal values for the GVZ, categorized into the individual vein zones ..................... lOS

.f'..

12

1. INTRODUCTION

1.1 BACKGROUND

Gosowong is a classic example of a low-sulfidation epithermal quartz vein deposit.

Economic mineralization 'is limited. to a strike length of approximately 400 m and is

predominantly hosted in two gently south-plunging ore shoots along an east-dipping normal fault.

The in4icated resource at the commencement of mining was estimated at 0.99 Mt at 27 g/t Au and

38 g/t Ag for a total of870 000 ounces Au, using a cut-off grade of2 g/t Au (Olberg et al, 1999).

The Gosowong gold mineralization was discovered by Newcrest Mining Limited in May

of 1994 as a result of a rigorous ground reconnaissance program in northern Halmahera, targeting

epithermal gold-silver and porphyry style gold-copper mineralization. The deposit was . discovered and tested using basic exploration techniques commonly applied in the rugged tropical

terrains of Indonesia. (Davey et al, 1997 & Carlile et al, 1998). Construction of the mine

infrastructure began in 1998, and production commenced in July of 1999. As of January 31, 2001,

more than 400 000 oz of gold had been produced at a reconciled grade of 33 g/t.

The mine is projected to have a relatively short life, with the cessation of mining

activities due sometime in early 2002. Milling of both high-grade and low-grade stockpiles will

continue into mid 2003. This being the case, there is a very limited time frame for increasing ore

reserves before mining finishes. Thus, the principal focus of the current exploration work in

Halmahera is to find additional mill feed for the Gosowong mill. All exploration efforts are

concentrated in an area of 5 km radius around the mine. The most prospective areas are thought to

be both to the north and south along the strike of the Gosowong Vein Zone, as well as other small

satellite epithermal style veins in the immediate vicinity of the mine.

Because milling facilities and mining infrastructure are already in place, there would be

very little additional capital cost requirement associated with the mining of a satellite deposit.

Thus it is feasible that a sa.J;ellite deposit could be mined at a much smaller size and grade than

would otherwise be required for a stand-alone deposit. As a general guide to the economics of ;

mining a satellite deposit, a recent satellite target study has indicated that only mineralization

with potential to contain greater than 150 000 oz, with grades of over about 20 glt Au, should be

subject to more detailed evaluation (Whincup, 1999).

13 Chapter 1 Introduction


Recommended