The U.S. Department of Agriculture (USDA) prohibits discrimination in all its programs and activities on the basis of race, color, national origin, age, disability, and where applicable, sex, marital status, familial status, parental status, religion, sexual orientation, genetic information, political beliefs, reprisal, or because all or a part of an individual's income is derived from any public assistance program. (Not all prohibited bases apply to all programs.) Persons with disabilities who require alternative means for communication of program information (Braille, large print, audiotape, etc.) should contact USDA's TARGET Center at (202) 720- 2600 (voice and TDD). To file a complaint of discrimination write to USDA, Director, Office of Civil Rights, 1400 Independence Avenue, S.W., Washington, D.C. 20250-9410 or call (800) 795-3272 (voice) or (202) 720-6382 (TDD). USDA is an equal opportunity provider and employer. Oregon Basin Outlook Report May 1, 2010 Spring Snow at Broken Top Mountain (photo courtesy of Bill Overman) United States Department of Agriculture Natural Resources Conservation Service
Transcript
The U.S. Department of Agriculture (USDA) prohibits discrimination in all its programs and activities on the basis of race, color, national origin, age, disability, and where applicable, sex, marital status, familial status, parental status, religion, sexual orientation, genetic information, political beliefs, reprisal, or because all or a part of an individual's income is derived from any public assistance program. (Not all prohibited bases apply to all programs.) Persons with disabilities who require alternative means for communication of program information (Braille, large print, audiotape, etc.) should contact USDA's TARGET Center at (202) 720-2600 (voice and TDD). To file a complaint of discrimination write to USDA, Director, Office of Civil Rights, 1400 Independence Avenue, S.W., Washington, D.C. 20250-9410 or call (800) 795-3272 (voice) or (202) 720-6382 (TDD). USDA is an equal opportunity provider and employer.
Oregon Basin Outlook Report May 1, 2010
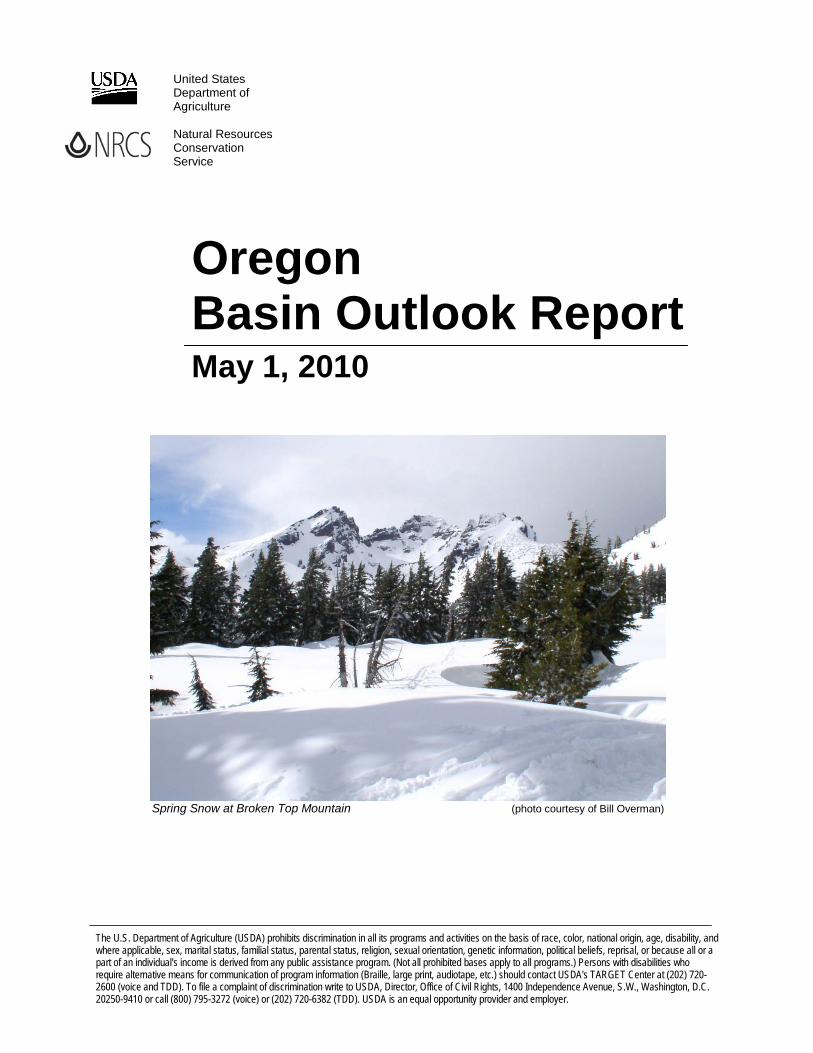
Spring Snow at Broken Top Mountain (photo courtesy of Bill Overman)
United States Department of Agriculture Natural Resources Conservation Service
The U.S. Department of Agriculture (USDA) prohibits discrimination in all its programs and activities on the basis of race, color, national origin, age, disability, and where applicable, sex, marital status, familial status, parental status, religion, sexual orientation, genetic information, political beliefs, reprisal, or because all or a part of an individual's income is derived from any public assistance program. (Not all prohibited bases apply to all programs.) Persons with disabilities who require alternative means for communication of program information (Braille, large print, audiotape, etc.) should contact USDA's TARGET Center at (202) 720-2600 (voice and TDD). To file a complaint of discrimination write to USDA, Director, Office of Civil Rights, 1400 Independence Avenue, S.W., Washington, D.C. 20250-9410 or call (800) 795-3272 (voice) or (202) 720-6382 (TDD). USDA is an equal opportunity provider and employer.
Contents
General Outlook ............................................................................................................................. 1 Owyhee and Malheur Basins .......................................................................................... 3 Burnt, Powder, Grand Ronde, and Imnaha Basins ......................................................... 5 Umatilla, Walla Walla, Willow Rock, and Lower John Day Basins ................................... 8 Upper John Day Basin ...................................................................................................10 Upper Deschutes and Crooked Basins ..........................................................................12 Hood, Mile Creeks, and Lower Deschutes Basins .........................................................15 Lower Columbia Basin ...................................................................................................17 Willamette Basin ............................................................................................................19 Rogue and Umpqua Basins ...........................................................................................23 Klamath Basin ...............................................................................................................26 Lake County and Goose Lake .......................................................................................28 Harney Basin .................................................................................................................30
Recession Forecasts for Oregon ...........................................................................................32 Summary of Snow Course Data .............................................................................................34 Basin Outlook Reports; How Forecasts Are Made ...............................................................36 Interpreting Water Supply Forecasts .....................................................................................37
-1-
General Outlook May 1, 2010
SUMMARY April 2010 brought cool, wet weather to the Pacific Northwest which improved many water supply forecasts in the region. the rapid snowmelt that had begun in March was delayed and new snow was added to the high mountains. Additionally, April showers filled many reservoirs that had been struggling through a mostly dry winter. The timing and form of precipitation greatly influences spring and summer runoff conditions. Many streamflow forecasts summarized in this report have improved over last month due to the favorable April climate conditions. SNOWPACK Up until April, the winter snowpack had failed to accumulate to normal levels within many basins. A warm early season melt out began in early March. Later in March, the warm and dry El Nino pattern shifted, bringing cooler temperatures along with additional precipitation to the region. The shift in the weather pattern resulted in a much needed slowing of the melt out. While April temperatures and precipitation did not completely mitigate the low snow year, it certainly helped in filling reservoirs and refreshing streamflows. As of May 1, basin snowpack conditions in Oregon range from a low of 59 percent of average in the Upper John Day Basin to a high of 101 percent of average in the Lake County and Goose Lake Basin. Snow measurements for May 1 were recorded at 77 SNOTEL sites and 18 snow courses across the state. As May 1, most manual snow measurements of snow courses and aerial markers have been completed for the season. SNOTEL sites continue to report hourly. PRECIPITATION In most Oregon basins, April is only the second month this water year to post above average precipitation. The timing of this cool precipitation could not have been better for areas that depend on spring rains to refresh their stream systems. As of May 1, every basin in the state continues to post a precipitation deficit for water year 2010, but that has been ameliorated somewhat by the cool and moist conditions this past month. Since the beginning of the water year on October 1, precipitation in Oregon has ranged from 75 percent of average in the Klamath basin to 90 percent of average in the Harney basin. April precipitation totals ranged from a low of 104 percent of average in the Umatilla, Walla Walla, Willow, Rock and Lower John Day basin to a high of 171 percent of average in the Rogue and Umpqua basin.
-2-
RESERVOIRS Reservoirs throughout the state began to fill as April showers and snow melt contributed to increased streamflows. Many reservoirs improved their storage significantly in the last month, which will assist in meeting summer water demands. May 1 storage at 26 major Oregon irrigation reservoirs analyzed in this publication was 71 percent of average. A total of 1,850,800 acre feet of water was stored as of May 1, representing 57 percent of useable capacity. Last year at this time, these same reservoirs stored 2,053,400 acre feet of water. STREAMFLOW Above normal April precipitation significantly improved the summer water supply outlook at many points throughout the state, particularly those areas that are fed by spring rains more than mountain snowmelt. For streamflow points where seasonal snow melt is the major contributor to summer flows, forecasts have not improved measurably. In general, water users throughout Oregon should expect streamflows that are below to well below normal this coming summer. Water conservation will be key to managing water supplies in Oregon this summer. A summary of streamflow forecasts for Oregon follows:
STREAM
PERIOD PERCENT OF
AVERAGE Owyhee Reservoir Inflow
May-September 65
Grande Ronde R at La Grande
May-September 71
Umatilla R at Pendleton
May-September 64
Deschutes R at Benham Falls
May-September 80
MF Willamette R bl NF
May-September 89
Rogue R at Raygold
May-September 78
Upper Klamath Lake Inflow
May-September 60
Silvies R nr Burns
May-September 81
Some of these forecasts assume that normal weather conditions will occur from now to the end of the forecast period. The forecasts in this bulletin are a result of coordinated activity between the Natural Resources Conservation Service and the National Weather Service as an effort to provide the best possible service to water users. This report contains data furnished by the Oregon Department of Water Resources, U.S. Geological Survey, NOAA National Weather Service and other cooperators. This report will be updated monthly, January through June.
For more information contact your local Natural Resources Conservation Service Office: Ontario - (541) 889-7637
Or visit: http://www.wcc.nrcs.usda.gov/cgibin/bor.pl
-3-
Owyhee and Malheur Basins May 1, 2010
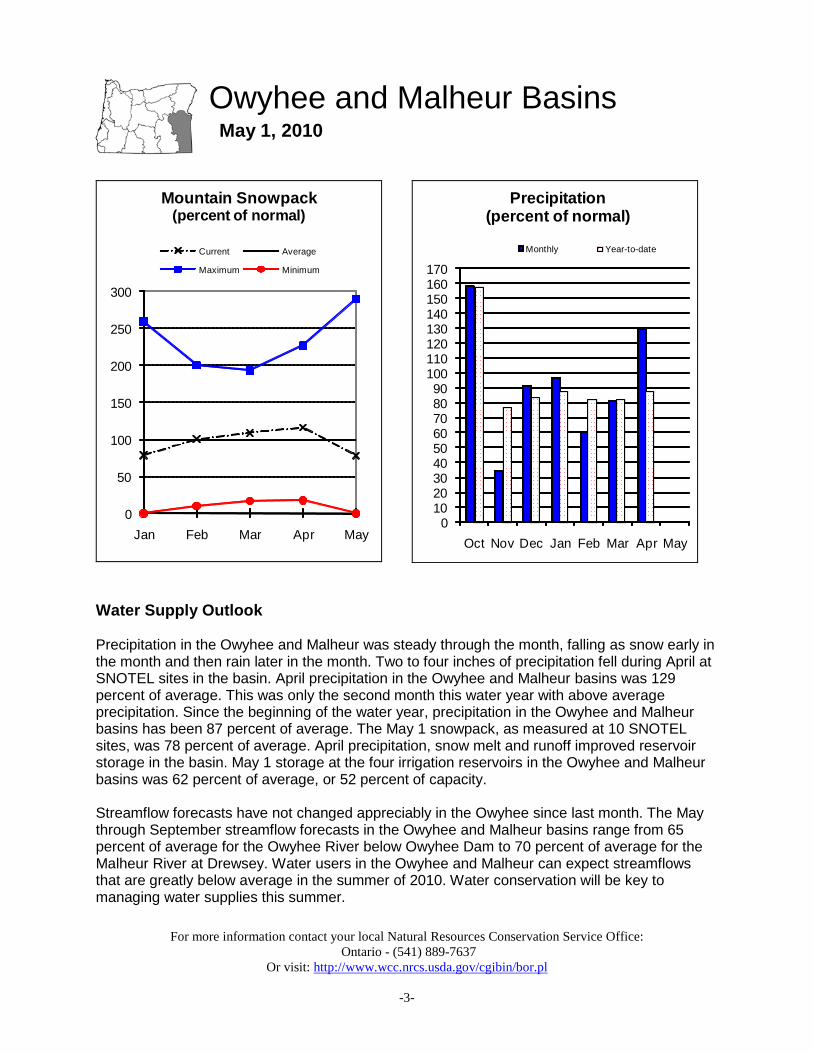
Water Supply Outlook Precipitation in the Owyhee and Malheur was steady through the month, falling as snow early in the month and then rain later in the month. Two to four inches of precipitation fell during April at SNOTEL sites in the basin. April precipitation in the Owyhee and Malheur basins was 129 percent of average. This was only the second month this water year with above average precipitation. Since the beginning of the water year, precipitation in the Owyhee and Malheur basins has been 87 percent of average. The May 1 snowpack, as measured at 10 SNOTEL sites, was 78 percent of average. April precipitation, snow melt and runoff improved reservoir storage in the basin. May 1 storage at the four irrigation reservoirs in the Owyhee and Malheur basins was 62 percent of average, or 52 percent of capacity. Streamflow forecasts have not changed appreciably in the Owyhee since last month. The May through September streamflow forecasts in the Owyhee and Malheur basins range from 65 percent of average for the Owyhee River below Owyhee Dam to 70 percent of average for the Malheur River at Drewsey. Water users in the Owyhee and Malheur can expect streamflows that are greatly below average in the summer of 2010. Water conservation will be key to managing water supplies this summer.
For more information contact your local Natural Resources Conservation Service Office: Ontario - (541) 889-7637
Or visit: http://www.wcc.nrcs.usda.gov/cgibin/bor.pl
================================================================================================================================== OWYHEE AND MALHEUR BASINS Streamflow Forecasts - May 1, 2010 ================================================================================================================================== | <<====== Drier ====== Future Conditions ======= Wetter =====>> | | | Forecast Point Forecast | ==================== Chance Of Exceeding * ====================== | Period | 90% 70% | 50% | 30% 10% | 30-Yr Avg. | (1000AF) (1000AF) | (1000AF) (% AVG.) | (1000AF) (1000AF) | (1000AF) ====================================================================|=======================|===================================== Malheur R nr Drewsey MAY-JUL 11.0 18.2 | 24 69 | 31 42 35 MAY-SEP 12.4 19.9 | 26 70 | 33 45 37 | | NF Malheur R at Beulah MAY-JUL 17.1 22 | 26 70 | 30 37 37 MAY-SEP 18.7 25 | 29 67 | 34 42 43 | | Owyhee R blw Owyhee Dam (2) MAY-JUL 7.0 38 | 140 62 | 240 390 225 MAY-SEP 8.0 57 | 165 65 | 275 430 255 | | Owyhee R nr Rome MAY-JUL 49 93 | 130 62 | 174 250 210 MAY-SEP 64 111 | 150 65 | 195 275 230 | | ================================================================================================================================== OWYHEE AND MALHEUR BASINS | OWYHEE AND MALHEUR BASINS Reservoir Storage (1000 AF) - End of April | Watershed Snowpack Analysis - May 1, 2010 ================================================================================================================================== Usable | *** Usable Storage *** | Number This Year as % of Reservoir Capacity| This Last | Watershed of ================= | Year Year Avg | Data Sites Last Yr Average ========================================================================|========================================================= BEULAH RES 60.0 48.9 35.4 51.2 | Owyhee 7 131 83 | BULLY CREEK 30.0 23.8 17.0 25.6 | Upper Malheur 3 73 51 | OWYHEE 715.0 371.2 412.3 613.6 | Jordan Creek 2 208 88 | WARMSPRINGS 191.0 78.8 46.8 149.9 | Bully Creek 0 0 0 | | Willow Creek 0 0 0 | ================================================================================================================================== * 90%, 70%, 50%, 30%, and 10% chances of exceeding are the probabilities that the actual volume will exceed the volumes in the table. The average is computed for the 1971-2000 base period. (1) - The values listed under the 10% and 90% Chance of Exceeding are actually 5% and 95% exceedance levels. (2) - The value is natural volume - actual volume may be affected by upstream water management.
For more information contact your local Natural Resources Conservation Service Office: Enterprise- (541) 426-4588; Baker City - (541) 523-7121; LaGrande - (541) 963-4178
Or visit: http://www.wcc.nrcs.usda.gov/cgibin/bor.pl
-5-
Burnt, Powder, Grand Ronde, and Imnaha Basins
May 1, 2010
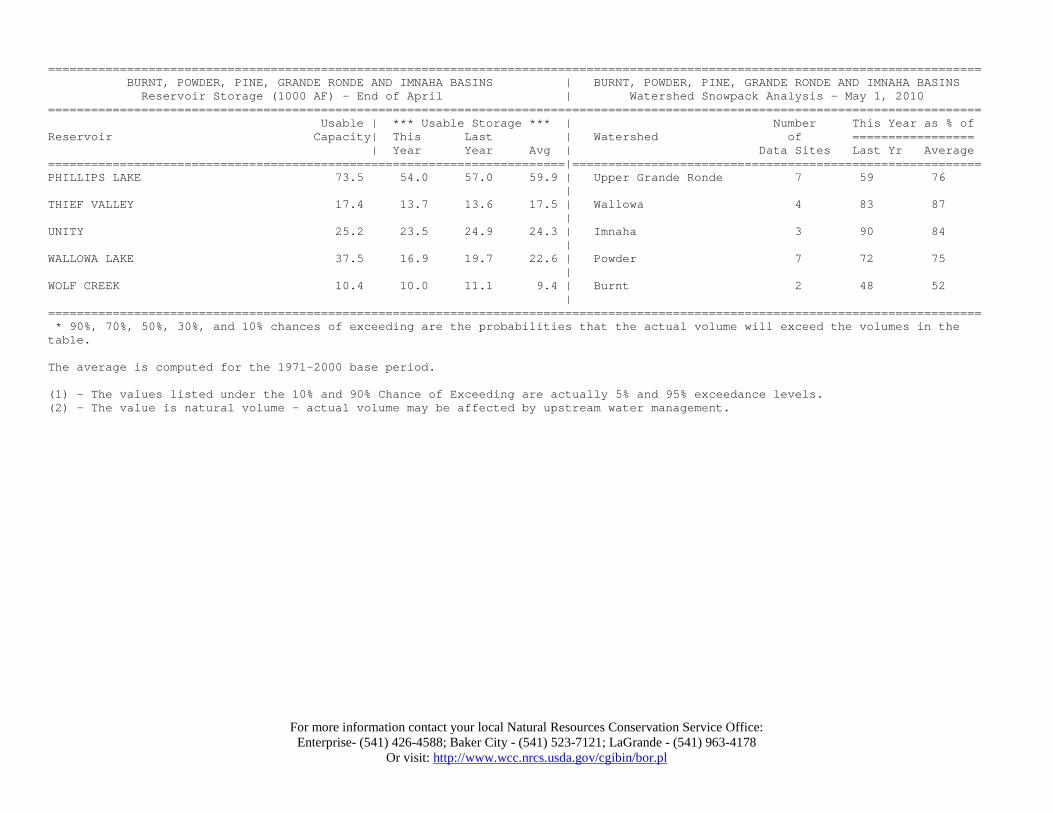
Water Supply Outlook April precipitation in the Burnt, Powder, Pine, Grande Ronde, and Imnaha basins was 137 percent of average. This was only the second month this water year with above average precipitation. Since the beginning of water year 2010, basin wide precipitation has been 86 percent of average. The May 1 snowpack, which was measured at 15 SNOTEL sites, was 74 percent of average. Unity reservoir storage improved significantly since the last Water Supply Outlook Report on April 1. Other reservoirs in the basin showed modest improvement in storage following April precipitation, snow melt and runoff. May 1 storage at Phillips Lake, Thief Valley and Unity reservoirs was 90 percent of average or 79 percent of capacity. April precipitation has led to a slight improvement in streamflow forecasts in the basin since last month. The May through September streamflow forecasts range from 69 percent of average for the Burnt River near Hereford to 82 percent of average for Pine Creek near Oxbow. Elsewhere in the basin, the Grande Ronde River at LaGrande is forecast to be 71 percent of average for the May through September period. Water users in the basin can expect streamflows that are well below normal in the summer of 2010. Water conservation measures will be key to managing limited water supplies.
For more information contact your local Natural Resources Conservation Service Office: Enterprise- (541) 426-4588; Baker City - (541) 523-7121; LaGrande - (541) 963-4178
Or visit: http://www.wcc.nrcs.usda.gov/cgibin/bor.pl
================================================================================================================================== BURNT, POWDER, PINE, GRANDE RONDE AND IMNAHA BASINS Streamflow Forecasts - May 1, 2010 ================================================================================================================================== | <<====== Drier ====== Future Conditions ======= Wetter =====>> | | | Forecast Point Forecast | ==================== Chance Of Exceeding * ====================== | Period | 90% 70% | 50% | 30% 10% | 30-Yr Avg. | (1000AF) (1000AF) | (1000AF) (% AVG.) | (1000AF) (1000AF) | (1000AF) ====================================================================|=======================|===================================== Bear Ck nr Wallowa MAY-SEP 29 38 | 44 79 | 50 59 56 | | Burnt R nr Hereford MAY-JUL 5.8 9.2 | 12.0 69 | 15.1 20 17.3 MAY-SEP 6.7 10.3 | 13.2 69 | 16.5 22 19.1 | | Catherine Ck nr Union MAY-JUL 29 34 | 38 78 | 42 48 49 MAY-SEP 32 37 | 41 77 | 45 51 53 | | Deer Ck nr Sumpter MAY-JUL 4.1 5.7 | 7.0 67 | 8.4 10.7 10.5 | | Grande Ronde R at La Grande MAY-JUL 38 57 | 72 68 | 89 118 106 MAY-SEP 41 62 | 79 71 | 98 129 112 | | Grande Ronde R at Troy MAY-JUL 440 610 | 685 75 | 760 930 910 MAY-SEP 505 690 | 775 77 | 860 1050 1010 | | Imnaha R at Imnaha MAY-JUL 96 131 | 155 72 | 179 215 215 MAY-SEP 116 153 | 178 74 | 205 240 240 | | Lostine R nr Lostine MAY-JUL 65 76 | 83 81 | 91 103 103 MAY-SEP 67 79 | 87 78 | 96 110 112 | | Pine Ck nr Oxbow MAY-JUL 60 77 | 88 82 | 99 116 108 MAY-SEP 65 82 | 93 82 | 104 121 114 | | Powder R nr Sumpter MAY-JUL 20 26 | 31 76 | 36 44 41 MAY-SEP 19.7 26 | 31 74 | 36 45 42 | | Wolf Ck Reservoir Inflow (2) MAY-JUN 2.4 4.9 | 6.6 64 | 8.3 10.8 10.3 | | ==================================================================================================================================
For more information contact your local Natural Resources Conservation Service Office: Enterprise- (541) 426-4588; Baker City - (541) 523-7121; LaGrande - (541) 963-4178
Or visit: http://www.wcc.nrcs.usda.gov/cgibin/bor.pl
================================================================================================================================== BURNT, POWDER, PINE, GRANDE RONDE AND IMNAHA BASINS | BURNT, POWDER, PINE, GRANDE RONDE AND IMNAHA BASINS Reservoir Storage (1000 AF) - End of April | Watershed Snowpack Analysis - May 1, 2010 ================================================================================================================================== Usable | *** Usable Storage *** | Number This Year as % of Reservoir Capacity| This Last | Watershed of ================= | Year Year Avg | Data Sites Last Yr Average ========================================================================|========================================================= PHILLIPS LAKE 73.5 54.0 57.0 59.9 | Upper Grande Ronde 7 59 76 | THIEF VALLEY 17.4 13.7 13.6 17.5 | Wallowa 4 83 87 | UNITY 25.2 23.5 24.9 24.3 | Imnaha 3 90 84 | WALLOWA LAKE 37.5 16.9 19.7 22.6 | Powder 7 72 75 | WOLF CREEK 10.4 10.0 11.1 9.4 | Burnt 2 48 52 | ================================================================================================================================== * 90%, 70%, 50%, 30%, and 10% chances of exceeding are the probabilities that the actual volume will exceed the volumes in the table. The average is computed for the 1971-2000 base period. (1) - The values listed under the 10% and 90% Chance of Exceeding are actually 5% and 95% exceedance levels. (2) - The value is natural volume - actual volume may be affected by upstream water management.
For more information contact your local Natural Resources Conservation Service Office: Pendleton - (541) 278-8049; Heppner - (541) 676-5021; Condon - (541) 384-2671
Or visit: http://www.wcc.nrcs.usda.gov/cgibin/bor.pl
-8-
Umatilla, Walla Walla, Willow Rock, and Lower John Day Basins
May 1, 2010
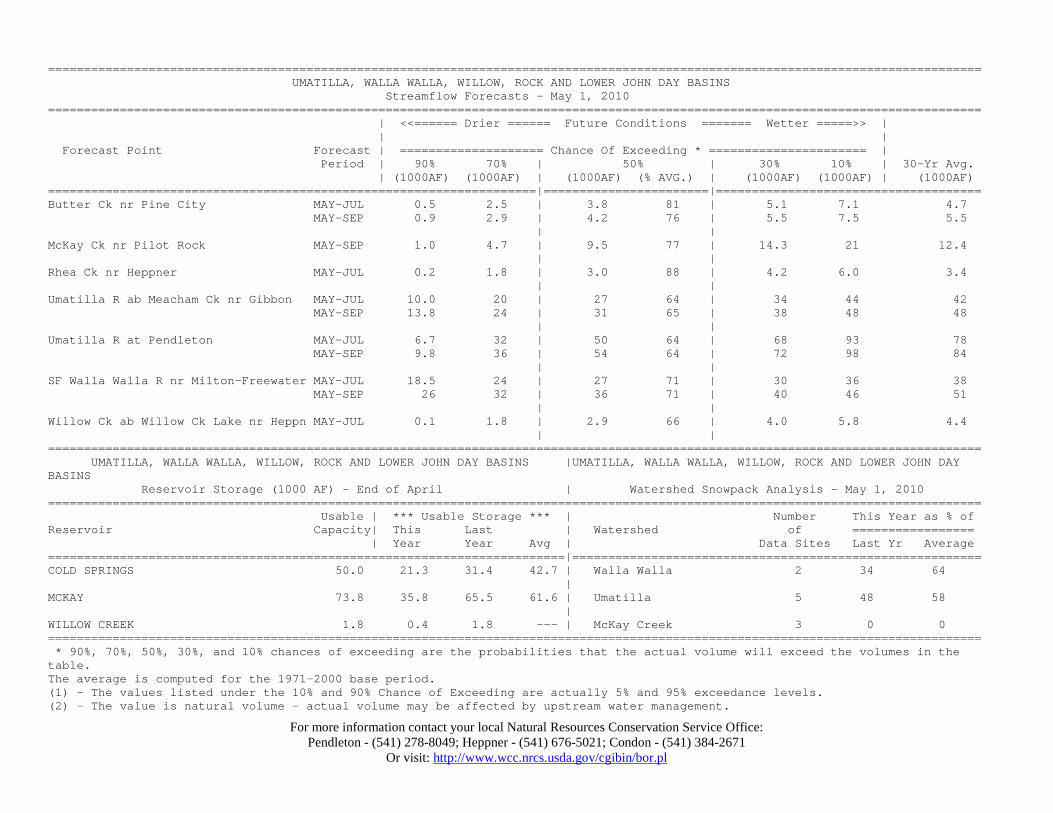
Water Supply Outlook April precipitation in the Umatilla, Walla Walla, Willow, Rock and Lower John Day basin was steady throughout the month with a few dry days mid month. April precipitation in the basin was 104 percent of average, the lowest in the state. Between 2 and 5 inches of precitation fell at SNOTEL sites in the basin, some of which was in the form of snow. This was only the second month this water year with above average precipitation. As of May 1, total precipitation for water year 2010 has been 78 percent of average. The May 1 snowpack, as measured at 7 SNOTEL sites, was 62 percent of average. Storage increased measurably at McKay reservoir over the last month, following April precipitation, snow melt and runoff. While these conditions delivered some additional water to irrigation reservoirs in the basin, storage remains well below normal for this time of year. May 1 storage at Cold Springs and MacKay reservoirs was 55 percent of average or 46 percent of capacity. With the exception of Butter Creek near Pine City, streamflow forecasts have not changed appreciably in the basin since the April Water Supply Outlook report. May through September streamflow forecasts range from 64 percent of average for the Umatilla River at Pendleton, to 81 percent of average for Butter Creek near Pine City. Elsewhere in the basin, the South Fork Walla Walla River near Milton-Freewater is forecast to be 71 percent of average for the same period. Most water users in the Umatilla, Walla Walla, Willow, Rock and Lower John Day basins can expect well below normal streamflow conditions for the summer of 2010. Water conservation measures will be key to managing limited water supplies.
For more information contact your local Natural Resources Conservation Service Office: Pendleton - (541) 278-8049; Heppner - (541) 676-5021; Condon - (541) 384-2671
Or visit: http://www.wcc.nrcs.usda.gov/cgibin/bor.pl
================================================================================================================================== UMATILLA, WALLA WALLA, WILLOW, ROCK AND LOWER JOHN DAY BASINS Streamflow Forecasts - May 1, 2010 ================================================================================================================================== | <<====== Drier ====== Future Conditions ======= Wetter =====>> | | | Forecast Point Forecast | ==================== Chance Of Exceeding * ====================== | Period | 90% 70% | 50% | 30% 10% | 30-Yr Avg. | (1000AF) (1000AF) | (1000AF) (% AVG.) | (1000AF) (1000AF) | (1000AF) ====================================================================|=======================|===================================== Butter Ck nr Pine City MAY-JUL 0.5 2.5 | 3.8 81 | 5.1 7.1 4.7 MAY-SEP 0.9 2.9 | 4.2 76 | 5.5 7.5 5.5 | | McKay Ck nr Pilot Rock MAY-SEP 1.0 4.7 | 9.5 77 | 14.3 21 12.4 | | Rhea Ck nr Heppner MAY-JUL 0.2 1.8 | 3.0 88 | 4.2 6.0 3.4 | | Umatilla R ab Meacham Ck nr Gibbon MAY-JUL 10.0 20 | 27 64 | 34 44 42 MAY-SEP 13.8 24 | 31 65 | 38 48 48 | | Umatilla R at Pendleton MAY-JUL 6.7 32 | 50 64 | 68 93 78 MAY-SEP 9.8 36 | 54 64 | 72 98 84 | | SF Walla Walla R nr Milton-Freewater MAY-JUL 18.5 24 | 27 71 | 30 36 38 MAY-SEP 26 32 | 36 71 | 40 46 51 | | Willow Ck ab Willow Ck Lake nr Heppn MAY-JUL 0.1 1.8 | 2.9 66 | 4.0 5.8 4.4 | | ================================================================================================================================== UMATILLA, WALLA WALLA, WILLOW, ROCK AND LOWER JOHN DAY BASINS |UMATILLA, WALLA WALLA, WILLOW, ROCK AND LOWER JOHN DAY BASINS Reservoir Storage (1000 AF) - End of April | Watershed Snowpack Analysis - May 1, 2010 ================================================================================================================================== Usable | *** Usable Storage *** | Number This Year as % of Reservoir Capacity| This Last | Watershed of ================= | Year Year Avg | Data Sites Last Yr Average ========================================================================|========================================================= COLD SPRINGS 50.0 21.3 31.4 42.7 | Walla Walla 2 34 64 | MCKAY 73.8 35.8 65.5 61.6 | Umatilla 5 48 58 | WILLOW CREEK 1.8 0.4 1.8 --- | McKay Creek 3 0 0 ================================================================================================================================== * 90%, 70%, 50%, 30%, and 10% chances of exceeding are the probabilities that the actual volume will exceed the volumes in the table. The average is computed for the 1971-2000 base period. (1) - The values listed under the 10% and 90% Chance of Exceeding are actually 5% and 95% exceedance levels. (2) - The value is natural volume - actual volume may be affected by upstream water management.
For more information contact your local Natural Resources Conservation Service Office: John Day - (541) 575-0135
Or visit: http://www.wcc.nrcs.usda.gov/cgibin/bor.pl
-10-
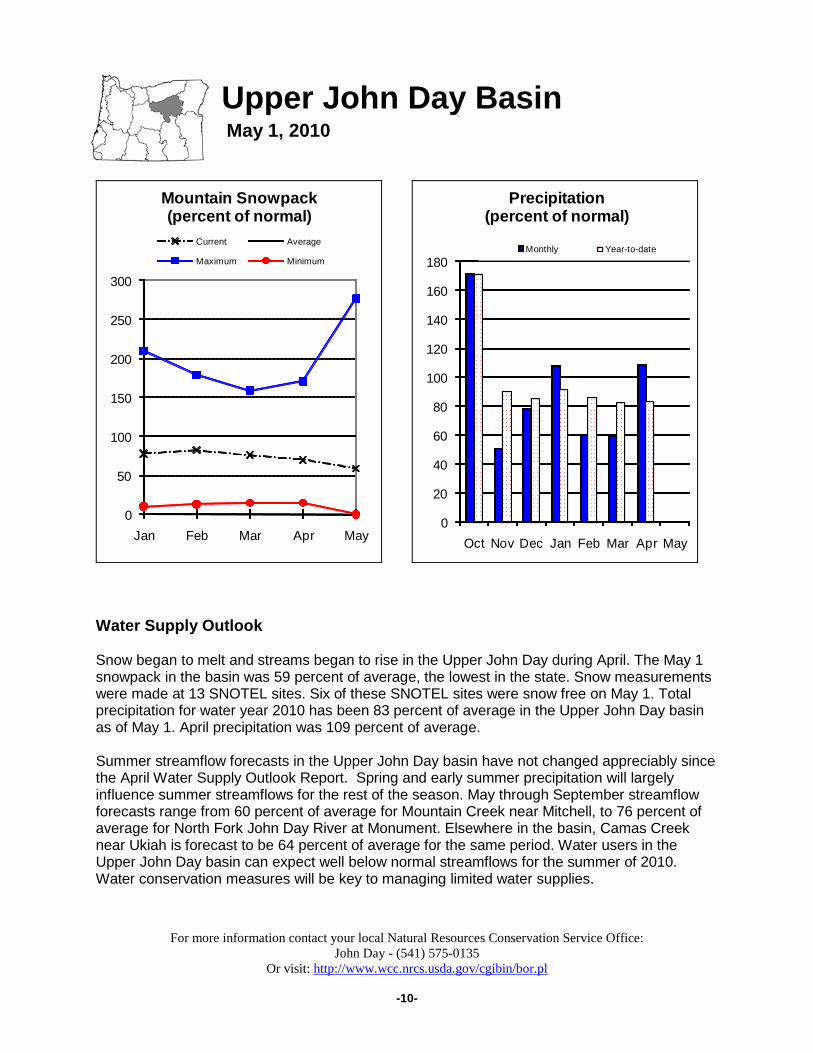
Upper John Day Basin May 1, 2010
Water Supply Outlook Snow began to melt and streams began to rise in the Upper John Day during April. The May 1 snowpack in the basin was 59 percent of average, the lowest in the state. Snow measurements were made at 13 SNOTEL sites. Six of these SNOTEL sites were snow free on May 1. Total precipitation for water year 2010 has been 83 percent of average in the Upper John Day basin as of May 1. April precipitation was 109 percent of average. Summer streamflow forecasts in the Upper John Day basin have not changed appreciably since the April Water Supply Outlook Report. Spring and early summer precipitation will largely influence summer streamflows for the rest of the season. May through September streamflow forecasts range from 60 percent of average for Mountain Creek near Mitchell, to 76 percent of average for North Fork John Day River at Monument. Elsewhere in the basin, Camas Creek near Ukiah is forecast to be 64 percent of average for the same period. Water users in the Upper John Day basin can expect well below normal streamflows for the summer of 2010. Water conservation measures will be key to managing limited water supplies.
For more information contact your local Natural Resources Conservation Service Office: John Day - (541) 575-0135
Or visit: http://www.wcc.nrcs.usda.gov/cgibin/bor.pl
================================================================================================================================== UPPER JOHN DAY BASIN Streamflow Forecasts - May 1, 2010 ================================================================================================================================== | <<====== Drier ====== Future Conditions ======= Wetter =====>> | | | Forecast Point Forecast | ==================== Chance Of Exceeding * ====================== | Period | 90% 70% | 50% | 30% 10% | 30-Yr Avg. | (1000AF) (1000AF) | (1000AF) (% AVG.) | (1000AF) (1000AF) | (1000AF) ====================================================================|=======================|===================================== Camas Ck nr Ukiah MAY-JUL 2.4 8.0 | 11.8 64 | 15.6 21 18.4 MAY-SEP 2.8 8.4 | 12.3 64 | 16.2 22 19.2 | | MF John Day R at Ritter MAY-JUL 24 43 | 55 71 | 67 86 78 MAY-SEP 27 46 | 59 71 | 72 91 83 | | NF John Day R at Monument MAY-JUL 142 225 | 285 76 | 345 430 375 MAY-SEP 149 235 | 295 76 | 355 440 390 | | Mountain Ck nr Mitchell MAY-JUL 0.3 1.1 | 1.6 60 | 2.2 3.0 2.7 MAY-SEP 0.3 1.1 | 1.6 57 | 2.2 3.0 2.8 | | Strawberry Ck nr Prairie City MAY-JUL 2.9 4.1 | 4.9 74 | 5.7 6.9 6.6 MAY-SEP 3.3 4.6 | 5.4 74 | 6.2 7.5 7.3 | | ================================================================================================================================== UPPER JOHN DAY BASIN | UPPER JOHN DAY BASIN Reservoir Storage (1000 AF) - End of April | Watershed Snowpack Analysis - May 1, 2010 ================================================================================================================================== Usable | *** Usable Storage *** | Number This Year as % of Reservoir Capacity| This Last | Watershed of ================= | Year Year Avg | Data Sites Last Yr Average ========================================================================|========================================================= | North Fork John Day 7 68 55 | | John Day above Kimberly 5 95 66 | ================================================================================================================================== * 90%, 70%, 50%, 30%, and 10% chances of exceeding are the probabilities that the actual volume will exceed the volumes in the table. The average is computed for the 1971-2000 base period. (1) - The values listed under the 10% and 90% Chance of Exceeding are actually 5% and 95% exceedance levels. (2) - The value is natural volume - actual volume may be affected by upstream water management.
For more information contact your local Natural Resources Conservation Service Office: Redmond (541) 923-4358
Or visit: http://www.wcc.nrcs.usda.gov/cgibin/bor.pl
-12-
Upper Deschutes and Crooked Basins May 1, 2010
Water Supply Outlook Precipitation for the month of April in the Upper Deschutes and Crooked basins was 125 percent of average. This was only the second month this water year with above average precipitation. As of May 1, total precipitation for water year 2010 has been 80 percent of average. The cool April temperatures allowed snow to accumulate at some sites in the basin, aiding the deficient snowpack. On May 1, the snowpack in the Upper Deschutes and Crooked River basins was 79 percent of average. Measurements were taken at 3 snow courses and 14 SNOTEL sites. April runoff improved storage at Ochoco reservoir while conditions stayed near to normal at the remaining reservoirs in the basin. May 1 storage at five irrigation reservoirs in the Upper Deschutes and Crooked River basins was 105 percent of average, or 91 percent of capacity. With one exception, there has been minor improvement in basin streamflow forecasts since the April Water Supply Outlook Report. A large improvement in the forecast for Ochoco Reservoir inflow was realized as April precipitation allowed the reservoir to fill. May through September streamflow forecasts range from 51 percent of average for Crescent Creek near Crescent to 80 percent of average for the Ochoco Reservoir inflow. Elsewhere in the basin, the Deschutes River at Benham Falls near Bend is forecast to be 80 percent of average for the May through September period. Water users in the Upper Deschutes and Crooked River basin can expect streamflows that are below average during the summer of 2010. Water conservation measures will be key to managing limited water supplies.
For more information contact your local Natural Resources Conservation Service Office: Redmond (541) 923-4358
Or visit: http://www.wcc.nrcs.usda.gov/cgibin/bor.pl
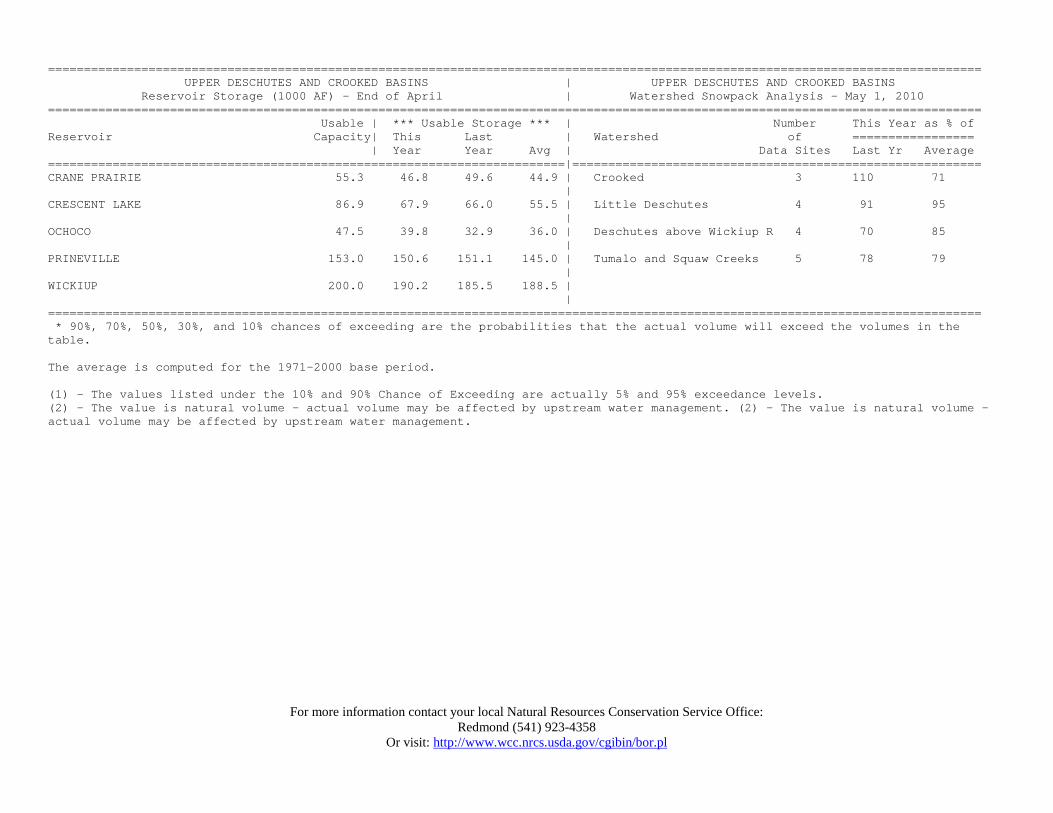
================================================================================================================================== UPPER DESCHUTES AND CROOKED BASINS | UPPER DESCHUTES AND CROOKED BASINS Reservoir Storage (1000 AF) - End of April | Watershed Snowpack Analysis - May 1, 2010 ================================================================================================================================== Usable | *** Usable Storage *** | Number This Year as % of Reservoir Capacity| This Last | Watershed of ================= | Year Year Avg | Data Sites Last Yr Average ========================================================================|========================================================= CRANE PRAIRIE 55.3 46.8 49.6 44.9 | Crooked 3 110 71 | CRESCENT LAKE 86.9 67.9 66.0 55.5 | Little Deschutes 4 91 95 | OCHOCO 47.5 39.8 32.9 36.0 | Deschutes above Wickiup R 4 70 85 | PRINEVILLE 153.0 150.6 151.1 145.0 | Tumalo and Squaw Creeks 5 78 79 | WICKIUP 200.0 190.2 185.5 188.5 | | ================================================================================================================================== * 90%, 70%, 50%, 30%, and 10% chances of exceeding are the probabilities that the actual volume will exceed the volumes in the table. The average is computed for the 1971-2000 base period. (1) - The values listed under the 10% and 90% Chance of Exceeding are actually 5% and 95% exceedance levels. (2) - The value is natural volume - actual volume may be affected by upstream water management. (2) - The value is natural volume - actual volume may be affected by upstream water management.
For more information contact your local Natural Resources Conservation Service Office: The Dalles (541) 296-6178
Or visit: http://www.wcc.nrcs.usda.gov/cgibin/bor.pl
-15-
Hood, Mile Creeks, and Lower Deschutes Basins
May 1, 2010
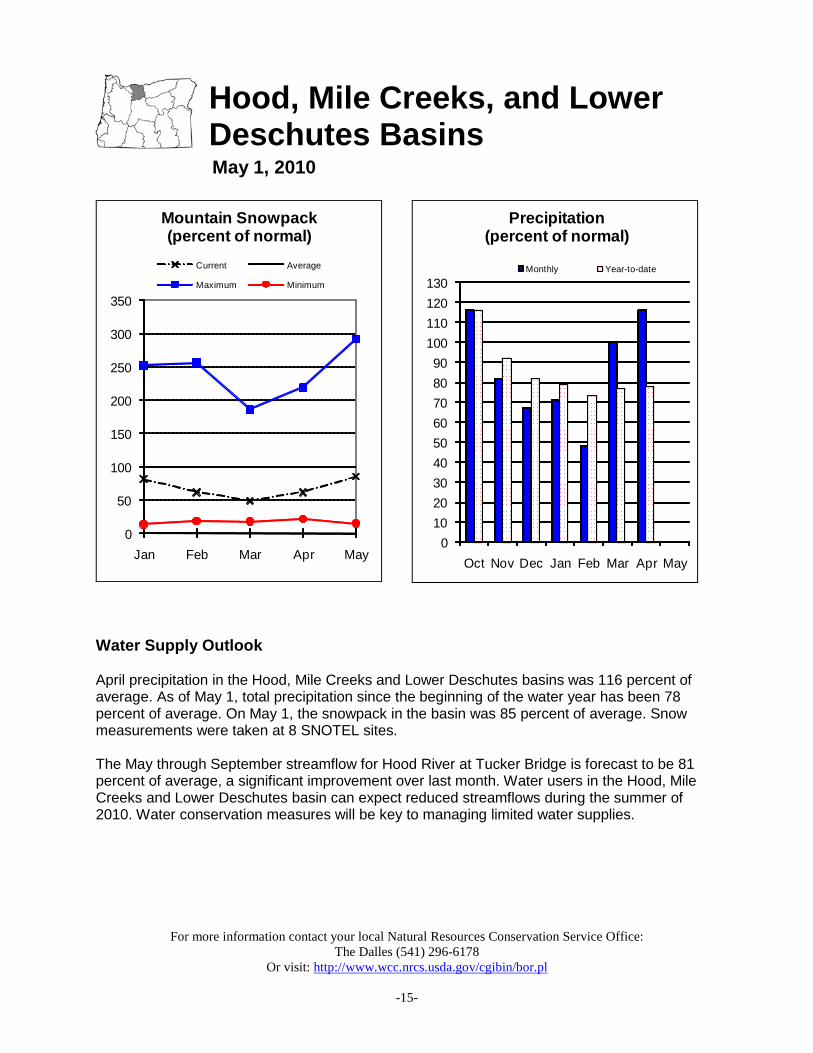
Water Supply Outlook April precipitation in the Hood, Mile Creeks and Lower Deschutes basins was 116 percent of average. As of May 1, total precipitation since the beginning of the water year has been 78 percent of average. On May 1, the snowpack in the basin was 85 percent of average. Snow measurements were taken at 8 SNOTEL sites. The May through September streamflow for Hood River at Tucker Bridge is forecast to be 81 percent of average, a significant improvement over last month. Water users in the Hood, Mile Creeks and Lower Deschutes basin can expect reduced streamflows during the summer of 2010. Water conservation measures will be key to managing limited water supplies.
For more information contact your local Natural Resources Conservation Service Office: The Dalles (541) 296-6178
Or visit: http://www.wcc.nrcs.usda.gov/cgibin/bor.pl
-16-
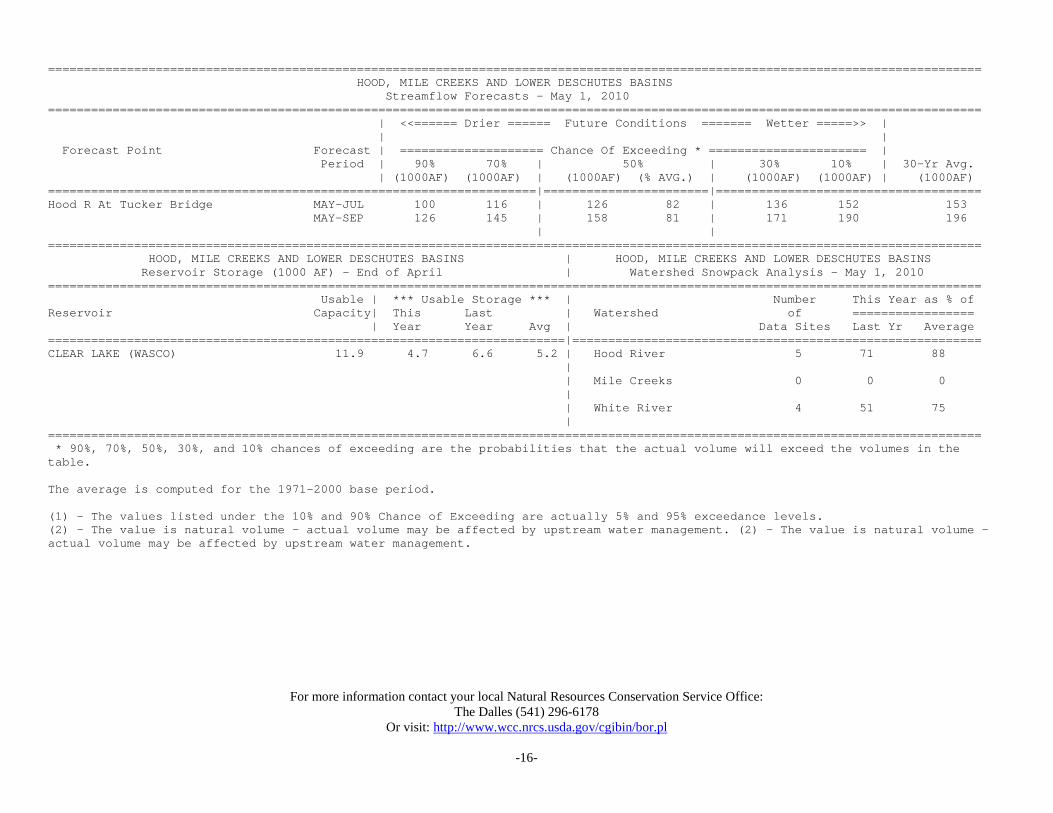
================================================================================================================================== HOOD, MILE CREEKS AND LOWER DESCHUTES BASINS Streamflow Forecasts - May 1, 2010 ================================================================================================================================== | <<====== Drier ====== Future Conditions ======= Wetter =====>> | | | Forecast Point Forecast | ==================== Chance Of Exceeding * ====================== | Period | 90% 70% | 50% | 30% 10% | 30-Yr Avg. | (1000AF) (1000AF) | (1000AF) (% AVG.) | (1000AF) (1000AF) | (1000AF) ====================================================================|=======================|===================================== Hood R At Tucker Bridge MAY-JUL 100 116 | 126 82 | 136 152 153 MAY-SEP 126 145 | 158 81 | 171 190 196 | | ================================================================================================================================== HOOD, MILE CREEKS AND LOWER DESCHUTES BASINS | HOOD, MILE CREEKS AND LOWER DESCHUTES BASINS Reservoir Storage (1000 AF) - End of April | Watershed Snowpack Analysis - May 1, 2010 ================================================================================================================================== Usable | *** Usable Storage *** | Number This Year as % of Reservoir Capacity| This Last | Watershed of ================= | Year Year Avg | Data Sites Last Yr Average ========================================================================|========================================================= CLEAR LAKE (WASCO) 11.9 4.7 6.6 5.2 | Hood River 5 71 88 | | Mile Creeks 0 0 0 | | White River 4 51 75 | ================================================================================================================================== * 90%, 70%, 50%, 30%, and 10% chances of exceeding are the probabilities that the actual volume will exceed the volumes in the table. The average is computed for the 1971-2000 base period. (1) - The values listed under the 10% and 90% Chance of Exceeding are actually 5% and 95% exceedance levels. (2) - The value is natural volume - actual volume may be affected by upstream water management. (2) - The value is natural volume - actual volume may be affected by upstream water management.
For more information contact your local Natural Resources Conservation Service Office: Oregon City - (503) 656-3499
Or visit: http://www.wcc.nrcs.usda.gov/cgibin/bor.pl
-17-
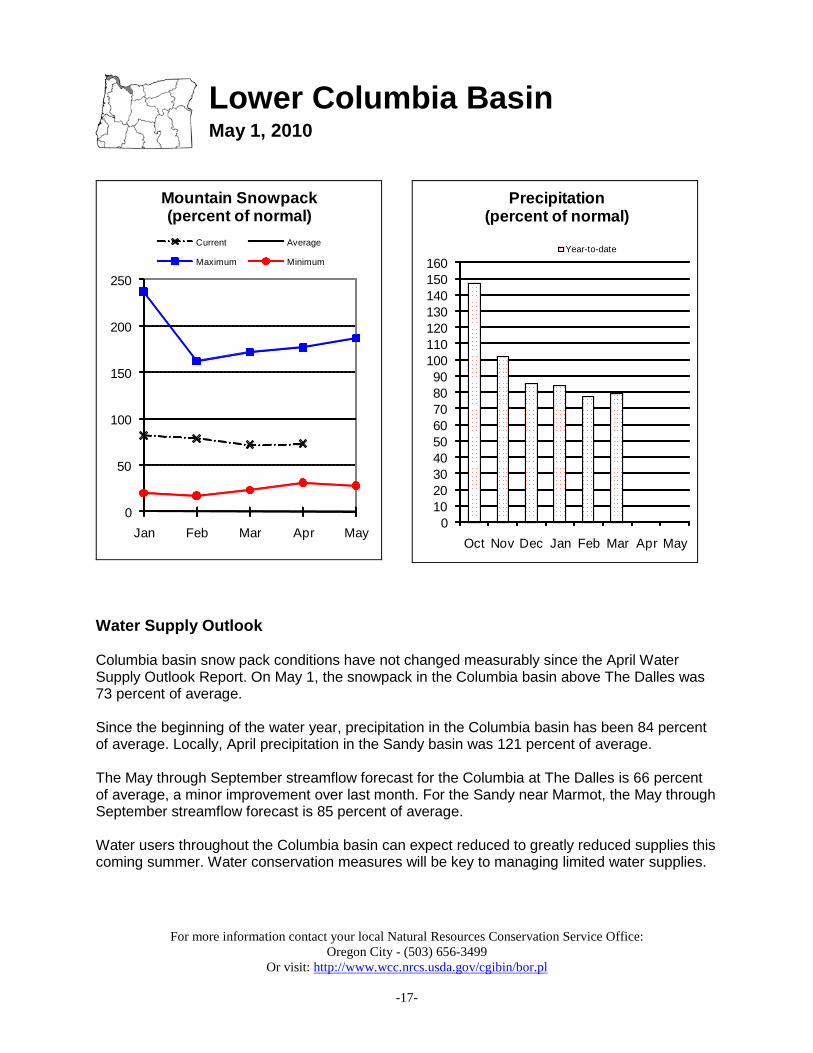
Lower Columbia Basin May 1, 2010
Water Supply Outlook Columbia basin snow pack conditions have not changed measurably since the April Water Supply Outlook Report. On May 1, the snowpack in the Columbia basin above The Dalles was 73 percent of average. Since the beginning of the water year, precipitation in the Columbia basin has been 84 percent of average. Locally, April precipitation in the Sandy basin was 121 percent of average. The May through September streamflow forecast for the Columbia at The Dalles is 66 percent of average, a minor improvement over last month. For the Sandy near Marmot, the May through September streamflow forecast is 85 percent of average. Water users throughout the Columbia basin can expect reduced to greatly reduced supplies this coming summer. Water conservation measures will be key to managing limited water supplies.
For more information contact your local Natural Resources Conservation Service Office: Oregon City - (503) 656-3499
Or visit: http://www.wcc.nrcs.usda.gov/cgibin/bor.pl
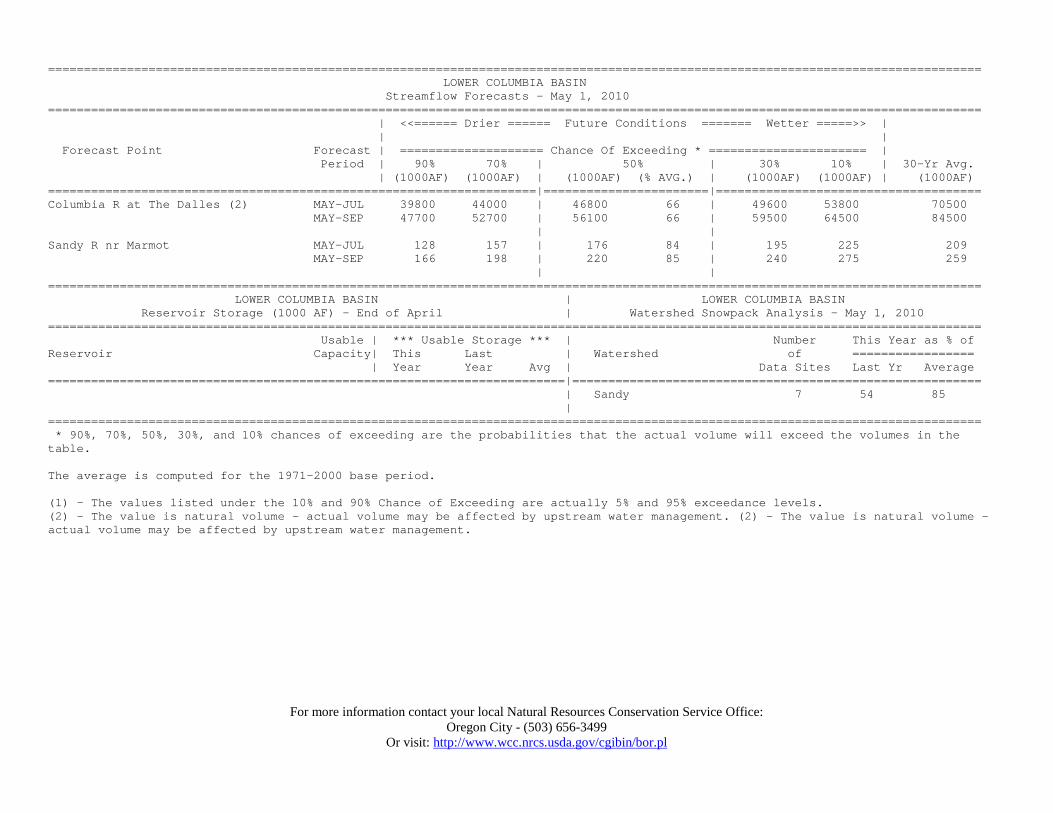
================================================================================================================================== LOWER COLUMBIA BASIN Streamflow Forecasts - May 1, 2010 ================================================================================================================================== | <<====== Drier ====== Future Conditions ======= Wetter =====>> | | | Forecast Point Forecast | ==================== Chance Of Exceeding * ====================== | Period | 90% 70% | 50% | 30% 10% | 30-Yr Avg. | (1000AF) (1000AF) | (1000AF) (% AVG.) | (1000AF) (1000AF) | (1000AF) ====================================================================|=======================|===================================== Columbia R at The Dalles (2) MAY-JUL 39800 44000 | 46800 66 | 49600 53800 70500 MAY-SEP 47700 52700 | 56100 66 | 59500 64500 84500 | | Sandy R nr Marmot MAY-JUL 128 157 | 176 84 | 195 225 209 MAY-SEP 166 198 | 220 85 | 240 275 259 | | ================================================================================================================================== LOWER COLUMBIA BASIN | LOWER COLUMBIA BASIN Reservoir Storage (1000 AF) - End of April | Watershed Snowpack Analysis - May 1, 2010 ================================================================================================================================== Usable | *** Usable Storage *** | Number This Year as % of Reservoir Capacity| This Last | Watershed of ================= | Year Year Avg | Data Sites Last Yr Average ========================================================================|========================================================= | Sandy 7 54 85 | ================================================================================================================================== * 90%, 70%, 50%, 30%, and 10% chances of exceeding are the probabilities that the actual volume will exceed the volumes in the table. The average is computed for the 1971-2000 base period. (1) - The values listed under the 10% and 90% Chance of Exceeding are actually 5% and 95% exceedance levels. (2) - The value is natural volume - actual volume may be affected by upstream water management. (2) - The value is natural volume - actual volume may be affected by upstream water management.
For more information contact your local Natural Resources Conservation Service Office: Eugene - (541) 465-6436; Portland - (503) 231-2270; Tangent - (541) 967-5925; Oregon City - (503) 656-3499;
Or visit: http://www.wcc.nrcs.usda.gov/cgibin/bor.pl
-19-
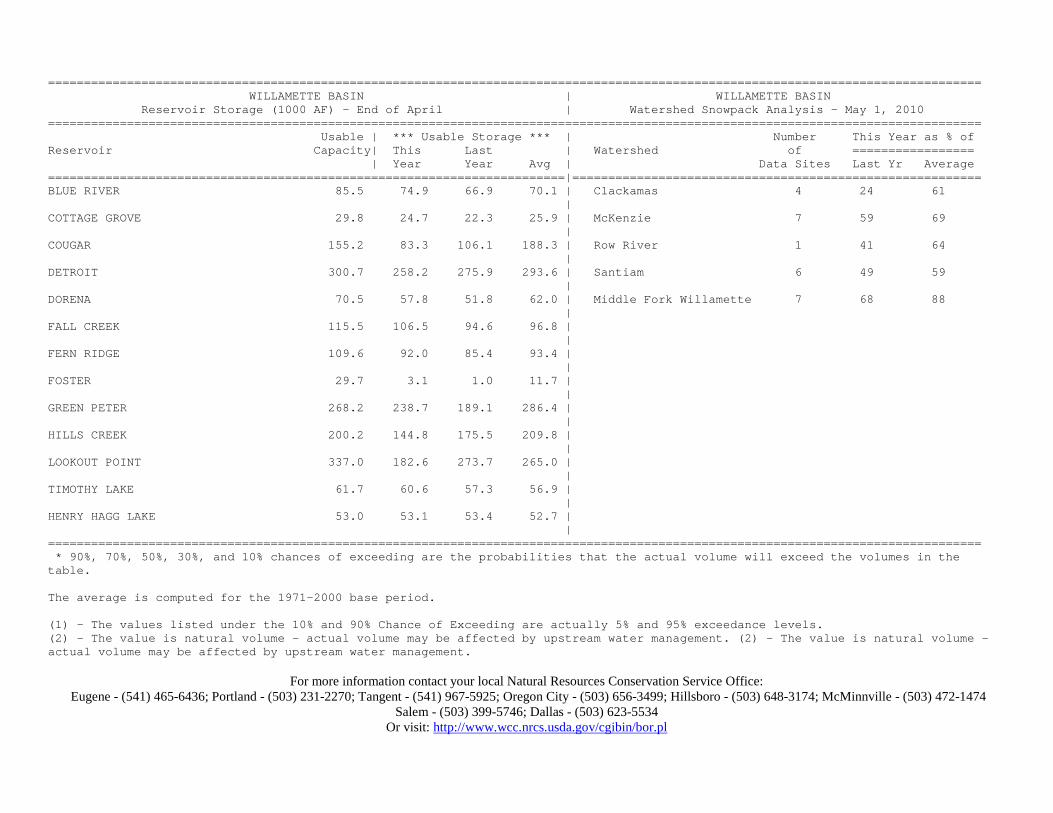
Willamette Basin May 1, 2010
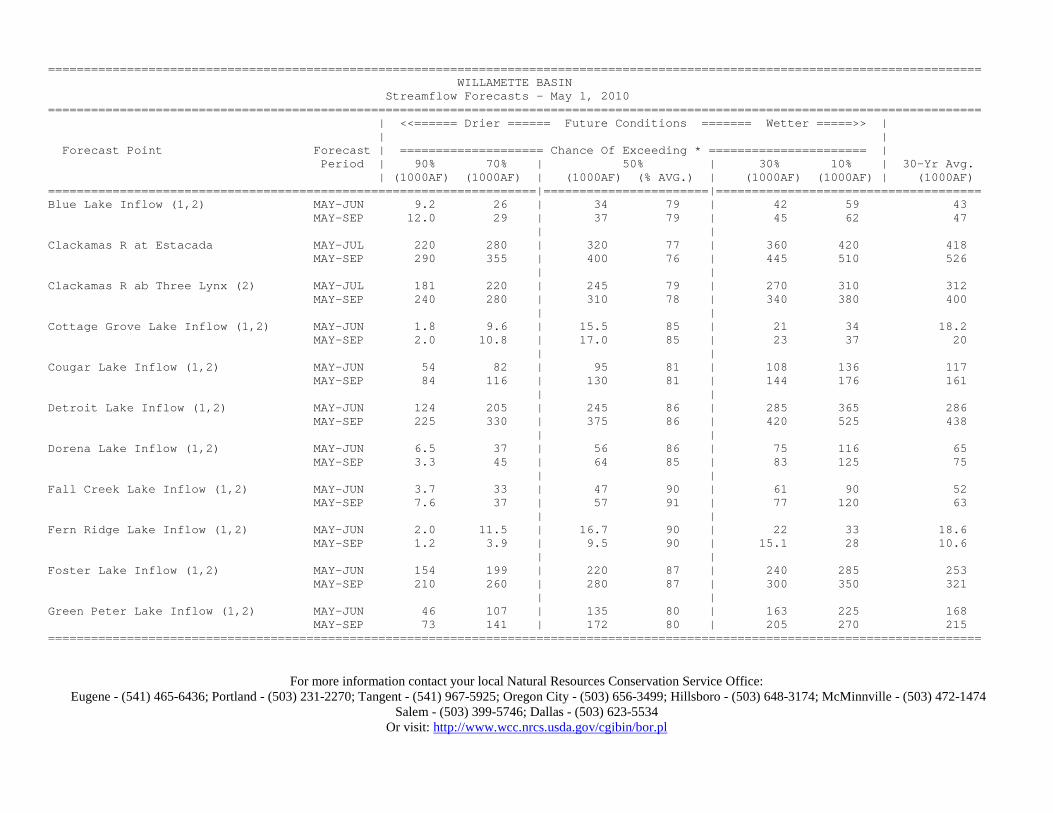
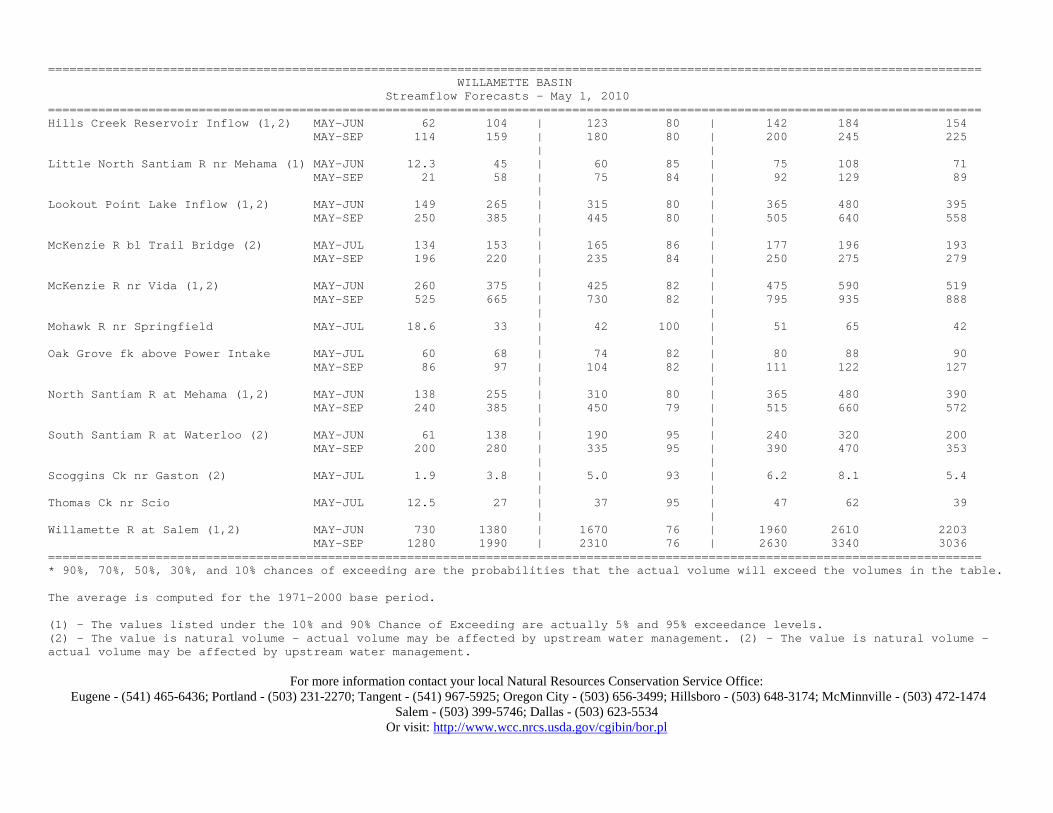
Water Supply Outlook March and April precipitation in the Willamette basin were above normal, helping to offset an unusually dry winter. April precipitation in the Willamette basin was 123 percent of average. As of May 1, total precipitation for water year 2010 has been 83 percent of average. Cool April temperatures allowed snow to accumulate at some sites in the basin and slowed the melt at others. These conditions aided the deficient winter snowpack. On May 1, the snowpack in the Willamette basin was 76 percent of average. Snow measurements were taken at 20 SNOTEL sites. April runoff greatly improved storage at many Willamette Valley flood control reservoirs. The May 1 storage did not change appreciably at Henry Hagg and Timothy lake reservoirs. May 1 storage at these 2 Willamette basin reservoirs was 104 percent of average, or 99 percent of capacity. Stream systems within the Willamette basin that rely more on spring rainfall than mountain snowmelt saw great improvements to their forecasts since the April Water Supply Outlook Report. The May through September streamflow forecasts for the Willamette basin range from 76 percent of average for both the Clackamas River at Estacada and the Willamette River at Salem to 95 percent of average for the South Santiam at Waterloo. Elsewhere in the basin, the McKenzie near Vida is forecast to be 82 percent of average for the May through September period. Most forecast points in the basin range from 79 to 89 percent of average. Water users in the basin can expect below normal water supplies this coming summer. Water conservation measures will be key to managing limited water supplies.
For more information contact your local Natural Resources Conservation Service Office: Eugene - (541) 465-6436; Portland - (503) 231-2270; Tangent - (541) 967-5925; Oregon City - (503) 656-3499; Hillsboro - (503) 648-3174; McMinnville - (503) 472-1474
Salem - (503) 399-5746; Dallas - (503) 623-5534 Or visit: http://www.wcc.nrcs.usda.gov/cgibin/bor.pl
================================================================================================================================== WILLAMETTE BASIN | WILLAMETTE BASIN Reservoir Storage (1000 AF) - End of April | Watershed Snowpack Analysis - May 1, 2010 ================================================================================================================================== Usable | *** Usable Storage *** | Number This Year as % of Reservoir Capacity| This Last | Watershed of ================= | Year Year Avg | Data Sites Last Yr Average ========================================================================|========================================================= BLUE RIVER 85.5 74.9 66.9 70.1 | Clackamas 4 24 61 | COTTAGE GROVE 29.8 24.7 22.3 25.9 | McKenzie 7 59 69 | COUGAR 155.2 83.3 106.1 188.3 | Row River 1 41 64 | DETROIT 300.7 258.2 275.9 293.6 | Santiam 6 49 59 | DORENA 70.5 57.8 51.8 62.0 | Middle Fork Willamette 7 68 88 | FALL CREEK 115.5 106.5 94.6 96.8 | | FERN RIDGE 109.6 92.0 85.4 93.4 | | FOSTER 29.7 3.1 1.0 11.7 | | GREEN PETER 268.2 238.7 189.1 286.4 | | HILLS CREEK 200.2 144.8 175.5 209.8 | | LOOKOUT POINT 337.0 182.6 273.7 265.0 | | TIMOTHY LAKE 61.7 60.6 57.3 56.9 | | HENRY HAGG LAKE 53.0 53.1 53.4 52.7 | | ================================================================================================================================== * 90%, 70%, 50%, 30%, and 10% chances of exceeding are the probabilities that the actual volume will exceed the volumes in the table. The average is computed for the 1971-2000 base period. (1) - The values listed under the 10% and 90% Chance of Exceeding are actually 5% and 95% exceedance levels. (2) - The value is natural volume - actual volume may be affected by upstream water management. (2) - The value is natural volume - actual volume may be affected by upstream water management.
For more information contact your local Natural Resources Conservation Service Office: Roseburg - (541) 673-8316; Medford - (541) 776-4267 Or visit: http://www.wcc.nrcs.usda.gov/cgibin/bor.pl
-23-
Rogue and Umpqua Basins May 1, 2010
Water Supply Outlook April precipitation was 171 percent of average in the Rogue and Umpqua basins, the highest in the state. April was only the second month this water year to post above average precipitation in the basin. On May 1, total accumulated precipitation for water year 2010 was 88 percent of average, a significant improvement from last month. Cool April temperatures allowed snow to accumulate at several sites in the basin and slowed the melt at others. The May 1 snowpack in the Rogue and Umpqua basins was 98 percent of average. Combined, these conditions helped to improve the water supply outlook in the basin. Snow measurements were collected at 15 snow courses and 12 SNOTEL sites. April runoff improved the storage at many basin reservoirs. The May 1 storage at 5 irrigation reservoirs in the Rogue and Umpqua basin was 91 percent of average, or 75 percent of capacity. The Rogue and Umpqua basin saw a great improvement in streamflow forecasts since the April Water Supply Outlook Report. The May through September streamflow forecasts for the Rogue and Umpqua basin range from 78 percent of average for the Rogue at Raygold to average flows at a number of sites in the basin. Specifically, the South Umpqua at Tiller, the Illinois River at Kerby and the Applegate Lake Inflow are now forecast to be 100 percent of average for the May through September period. Due to the favorable effect of generous April precipitation, many water users in the Rogue and Umpqua basins can now expect near normal water supplies this coming summer.
For more information contact your local Natural Resources Conservation Service Office: Roseburg - (541) 673-8316; Medford - (541) 776-4267 Or visit: http://www.wcc.nrcs.usda.gov/cgibin/bor.pl
================================================================================================================================== ROGUE AND UMPQUA BASINS Streamflow Forecasts - May 1, 2010 ================================================================================================================================== | <<====== Drier ====== Future Conditions ======= Wetter =====>> | | | Forecast Point Forecast | ==================== Chance Of Exceeding * ====================== | Period | 90% 70% | 50% | 30% 10% | 30-Yr Avg. | (1000AF) (1000AF) | (1000AF) (% AVG.) | (1000AF) (1000AF) | (1000AF) ====================================================================|=======================|===================================== Applegate Lake Inflow (2) MAY-JUL 51 63 | 72 100 | 81 93 72 MAY-SEP 56 69 | 78 100 | 87 100 78 | | SF Big Butte Ck nr Butte Falls MAY-JUL 12.9 17.1 | 20 91 | 23 27 22 MAY-SEP 19.5 25 | 28 90 | 31 37 31 | | Cow Ck nr Azalea (2) MAY-JUL 2.4 5.7 | 7.9 100 | 10.1 13.4 7.9 MAY-SEP 3.2 6.7 | 9.1 100 | 11.5 15.0 9.1 | | Hyatt Prairie Reservoir Inflow (2) MAY-JUL 0.4 1.4 | 2.1 88 | 2.8 3.8 2.4 | | Illinois R at Kerby MAY-JUL 39 65 | 83 100 | 101 127 83 MAY-SEP 45 72 | 90 100 | 108 135 90 | | NF Little Butte Ck nr Lakecreek (2) MAY-JUL 17.4 21 | 24 96 | 27 31 25 MAY-SEP 29 34 | 38 96 | 42 47 40 | | Lost Creek Lake Inflow (2) MAY-JUL 280 320 | 345 91 | 370 410 380 MAY-SEP 385 435 | 465 90 | 495 545 515 | | Rogue R at Raygold (2) MAY-JUL 235 320 | 375 78 | 430 515 480 MAY-SEP 350 440 | 500 78 | 560 650 645 Rogue R at Grants Pass (2) MAY-JUL 260 350 | 410 87 | 470 560 470 MAY-SEP 370 470 | 535 87 | 600 700 615 Sucker Ck bl Ltl Grayback Ck nr Holl MAY-JUL 21 27 | 31 100 | 35 41 31 MAY-SEP 25 31 | 35 100 | 39 45 35 North Umpqua R at Winchester MAY-JUL 310 405 | 470 96 | 535 630 490 MAY-SEP 430 525 | 590 96 | 655 750 615 South Umpqua R nr Brockway MAY-JUL 74 143 | 191 100 | 240 310 191 MAY-SEP 88 160 | 210 100 | 260 330 210 South Umpqua R at Tiller MAY-JUL 52 84 | 106 100 | 128 160 106 MAY-SEP 61 94 | 116 100 | 138 171 116 ================================================================================================================================== * 90%, 70%, 50%, 30%, and 10% chances of exceeding are the probabilities that the actual volume will exceed the volumes in the table.
For more information contact your local Natural Resources Conservation Service Office: Roseburg - (541) 673-8316; Medford - (541) 776-4267 Or visit: http://www.wcc.nrcs.usda.gov/cgibin/bor.pl
================================================================================================================================== ROGUE AND UMPQUA BASINS | ROGUE AND UMPQUA BASINS Reservoir Storage (1000 AF) - End of April | Watershed Snowpack Analysis - May 1, 2010 ================================================================================================================================== Usable | *** Usable Storage *** | Number This Year as % of Reservoir Capacity| This Last | Watershed of ================= | Year Year Avg | Data Sites Last Yr Average ========================================================================|========================================================= APPLEGATE 75.2 61.5 47.7 64.5 | Applegate 5 195 107 | EMIGRANT LAKE 39.0 35.3 38.8 35.9 | Bear Creek 4 185 107 | FISH LAKE 8.0 5.1 6.6 6.2 | Little Butte Creek 6 91 102 | FOURMILE LAKE 16.1 9.7 13.2 11.0 | Illinois 1 0 102 | HOWARD PRAIRIE 60.0 42.1 56.7 48.8 | North Umpqua 7 70 85 | HYATT PRAIRIE 16.1 12.8 16.0 13.3 | Rogue River above Grants 20 121 98 | LOST CREEK 315.0 139.1 175.9 283.2 | | ================================================================================================================================== * 90%, 70%, 50%, 30%, and 10% chances of exceeding are the probabilities that the actual volume will exceed the volumes in the table. The average is computed for the 1971-2000 base period. (1) - The values listed under the 10% and 90% Chance of Exceeding are actually 5% and 95% exceedance levels. (2) - The value is natural volume - actual volume may be affected by upstream water management.
For more information contact your local Natural Resources Conservation Service Office: Klamath Falls - (541) 883-6932
Or visit: http://www.wcc.nrcs.usda.gov/cgibin/bor.pl
-26-
Klamath Basin May 1, 2010
Water Supply Outlook April 2010 precipitation in the Klamath basin was 138 percent of average. This is the only month since the water year began in October to bring above average precipitation to the Klamath basin. SNOTEL sites in the Klamath basin measured from 3 to 7 inches of precipitation for the month. As of May 1, total accumulated precipitation for water year 2010 in the Klamath basin has been only 75 percent of average, the lowest in the state. The snowpack showed gains during the early part of April but began to melt by mid month at most sites. As of May 1, the snowpack in the Klamath basin was 98 percent of average. While this number is near average, the snow pack failed to reach its normal peak this winter. The May 1 percent of average reflects a late melt out of a below normal winter snowpack. Snow measurements for May 2010 were collected at 4 snow courses and 15 SNOTEL sites. April precipitation, snowmelt, and streamflow runoff offered little improvement to Klamath Basin reservoirs. The May 1 storage at Upper Klamath Lake, Clear Lake (CA) and Gerber reservoirs was 54 percent of average or 39 percent of capacity. Clear Lake reservoir is especially low this year at only 30 percent of average. There has been little change in the summer streamflow forecasts since the last report in April. The May through September forecasts range from 32 percent of average for Gerber Reservoir Inflow, to 66 percent of average for the Williamson River below Sprague River near Chiloquin. Elsewhere in the basin, the Upper Klamath Lake Inflow forecast for the May through September period is 60 percent of average. Water users in the Klamath basin can expect water supplies to be greatly below average this coming season. Water conservation measures will be key to managing limited water supplies.
For more information contact your local Natural Resources Conservation Service Office: Lakeview - (541) 947-2202
Or visit: http://www.wcc.nrcs.usda.gov/cgibin/bor.pl
-28-
Lake County and Goose Lake May 1, 2010
Water Supply Outlook April precipitation in the Lake County and Goose Lake basins was 127 percent of average. This is the first time since the beginning of the water year that monthly precipitation has been above normal in Lake County and Goose Lake basin. Since the beginning of the water year, total precipitation in the basin has been 81 percent of average. Cool temperatures and steady precipitation attenuated the snowmelt in the basin, partially mitigating the winter snowpack deficit. On May 1, the snowpack in the Lake County and Goose Lake basins was near average. Five SNOTEL sites in the basin were snow free on May 1. Snow measurements were collected at 9 SNOTEL sites. Spring runoff greatly improved storage conditions at Drews reservoir, although storage in the basin remains low. The May 1 storage at Cottonwood and Drews reservoirs was 42 percent of average or 34 percent of capacity. April showers recharged streams and reservoirs in Lake County and Goose Lake basins. The May through September streamflow forecasts range from 44 percent of average for Honey Creek near Plush to 68 of average for the Chewaucan near Paisley. Elsewhere in the basin, Twenty Mile Creek near Adel is forecast to be 66 percent of average for the May through September period. Water users in the Lake County and Goose Lake basins can expect reduced streamflows during the summer of 2010. Water conservation measures will be key to managing limited water supplies.
For more information contact your local Natural Resources Conservation Service Office: Lakeview - (541) 947-2202
Or visit: http://www.wcc.nrcs.usda.gov/cgibin/bor.pl
================================================================================================================================== LAKE COUNTY AND GOOSE LAKE BASINS Streamflow Forecasts - May 1, 2010 ================================================================================================================================== | <<====== Drier ====== Future Conditions ======= Wetter =====>> | | | Forecast Point Forecast | ==================== Chance Of Exceeding * ====================== | Period | 90% 70% | 50% | 30% 10% | 30-Yr Avg. | (1000AF) (1000AF) | (1000AF) (% AVG.) | (1000AF) (1000AF) | (1000AF) ====================================================================|=======================|===================================== Chewacan R nr Paisley MAY-JUL 18.7 29 | 36 69 | 43 53 52 MAY-SEP 20 31 | 38 68 | 45 56 56 Deep Ck ab Adel MAY-JUL 7.6 18.6 | 26 58 | 33 44 45 MAY-SEP 8.4 19.5 | 27 57 | 35 46 47 Honey Ck nr Plush MAY-JUL 4.4 4.5 | 4.6 43 | 4.8 4.9 10.8 MAY-SEP 4.6 4.7 | 4.8 44 | 4.9 5.0 11.0 Silver Ck nr Silver Lake (2) MAY-JUL 0.1 1.5 | 3.2 59 | 4.9 7.4 5.4 MAY-SEP 0.1 1.6 | 3.5 59 | 5.4 8.1 6.0 Twentymile Ck nr Adel MAY-JUL 0.2 4.0 | 7.0 66 | 10.0 14.3 10.6 MAY-SEP 0.3 4.3 | 7.3 66 | 10.3 14.7 11.1 ================================================================================================================================== LAKE COUNTY AND GOOSE LAKE BASINS | LAKE COUNTY AND GOOSE LAKE BASINS Reservoir Storage (1000 AF) - End of April | Watershed Snowpack Analysis - May 1, 2010 ================================================================================================================================== Usable | *** Usable Storage *** | Number This Year as % of Reservoir Capacity| This Last | Watershed of ================= | Year Year Avg | Data Sites Last Yr Average ========================================================================|========================================================= COTTONWOOD 8.7 6.3 9.3 6.7 | Chewaucan River 3 207 119 | DREWS 63.0 18.1 22.0 51.0 | Deep Creek 0 0 0 | | Drew Creek 2 0 0 | | Honey Creek 0 0 0 | | Silver Creek (Lake Co.) 4 207 110 | | Twentymile Creek 0 0 0 ================================================================================================================================== * 90%, 70%, 50%, 30%, and 10% chances of exceeding are the probabilities that the actual volume will exceed the volumes in the table. The average is computed for the 1971-2000 base period. (1) - The values listed under the 10% and 90% Chance of Exceeding are actually 5% and 95% exceedance levels. (2) - The value is natural volume - actual volume may be affected by upstream water management. (2) - The value is natural volume - actual volume may be affected by upstream water management.
For more information contact your local Natural Resources Conservation Service Office: Hines - (541) 573-6446
Or visit: http://www.wcc.nrcs.usda.gov/cgibin/bor.pl
-30-
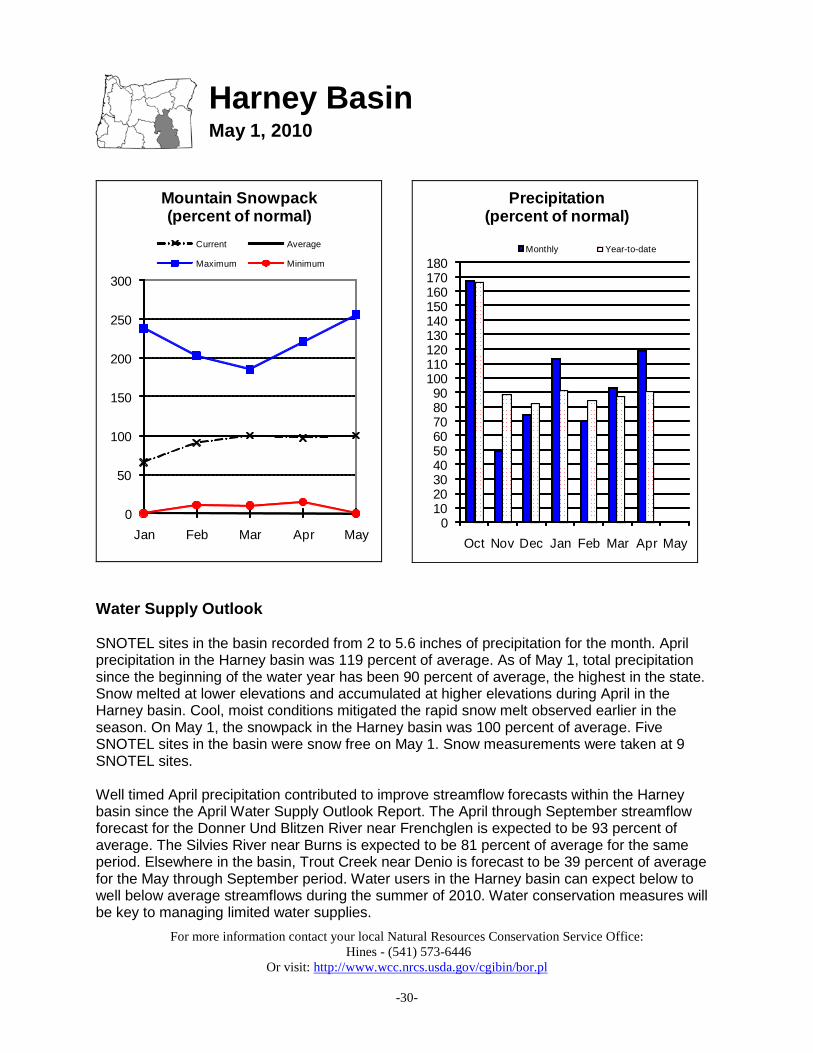
Harney Basin May 1, 2010
Water Supply Outlook SNOTEL sites in the basin recorded from 2 to 5.6 inches of precipitation for the month. April precipitation in the Harney basin was 119 percent of average. As of May 1, total precipitation since the beginning of the water year has been 90 percent of average, the highest in the state. Snow melted at lower elevations and accumulated at higher elevations during April in the Harney basin. Cool, moist conditions mitigated the rapid snow melt observed earlier in the season. On May 1, the snowpack in the Harney basin was 100 percent of average. Five SNOTEL sites in the basin were snow free on May 1. Snow measurements were taken at 9 SNOTEL sites. Well timed April precipitation contributed to improve streamflow forecasts within the Harney basin since the April Water Supply Outlook Report. The April through September streamflow forecast for the Donner Und Blitzen River near Frenchglen is expected to be 93 percent of average. The Silvies River near Burns is expected to be 81 percent of average for the same period. Elsewhere in the basin, Trout Creek near Denio is forecast to be 39 percent of average for the May through September period. Water users in the Harney basin can expect below to well below average streamflows during the summer of 2010. Water conservation measures will be key to managing limited water supplies.
For more information contact your local Natural Resources Conservation Service Office: Hines - (541) 573-6446
Or visit: http://www.wcc.nrcs.usda.gov/cgibin/bor.pl
================================================================================================================================== HARNEY BASIN Streamflow Forecasts - May 1, 2010 ================================================================================================================================== | <<====== Drier ====== Future Conditions ======= Wetter =====>> | | | Forecast Point Forecast | ==================== Chance Of Exceeding * ====================== | Period | 90% 70% | 50% | 30% 10% | 30-Yr Avg. | (1000AF) (1000AF) | (1000AF) (% AVG.) | (1000AF) (1000AF) | (1000AF) ====================================================================|=======================|===================================== Donner Und Blitzen R nr Frenchglen MAY-JUL 24 37 | 45 90 | 53 66 50 MAY-SEP 30 43 | 52 93 | 61 74 56 | | Silvies R nr Burns MAY-JUL 4.7 26 | 40 82 | 54 75 49 MAY-SEP 5.4 27 | 42 81 | 57 79 52 | | Trout Ck nr Denio MAY-JUL 0.2 1.3 | 2.5 35 | 3.8 5.6 7.2 MAY-SEP 0.2 1.6 | 3.0 39 | 4.4 6.3 7.8 | | ================================================================================================================================== HARNEY BASIN | HARNEY BASIN Reservoir Storage (1000 AF) - End of April | Watershed Snowpack Analysis - May 1, 2010 ================================================================================================================================== Usable | *** Usable Storage *** | Number This Year as % of Reservoir Capacity| This Last | Watershed of ================= | Year Year Avg | Data Sites Last Yr Average ========================================================================|========================================================= | Donner und Blitzen River 2 137 116 | | Silver Creek (Harney Co.) 2 273 111 | | Silvies River 5 135 77 | | Trout Creek 2 140 103 | ================================================================================================================================== * 90%, 70%, 50%, 30%, and 10% chances of exceeding are the probabilities that the actual volume will exceed the volumes in the table. The average is computed for the 1971-2000 base period. (1) - The values listed under the 10% and 90% Chance of Exceeding are actually 5% and 95% exceedance levels. (2) - The value is natural volume - actual volume may be affected by upstream water management.
Recession Forecasts for Oregon Recession flow forecasts are presented below for key streamflow sites where reliable daily streamflow data are available. The recession flow forecasts use exceedance probabilities in a format similar to the standard water supply forecasts presented in this document. Each forecast provides a range of possible outcomes representing the uncertainty of forecasting models. The types of forecasts in the table below are: 1) Threshold flow -- Date that the daily streamflow rate falls below the given threshold flow 2) Peak flow -- Maximum daily flow 3) Date of peak flow -- Date of occurrence of maximum daily flow 4) Average daily flow on a given date
OWYHEE AND MALHEUR BASINS
FORECAST POINT
FORECAST THRESHOLD
FORECAST VALUE ------------- CHANCE OF EXCEEDING -----
------
LONG-TERM AVERAGE VALUE
90% 50% 10%
Owyhee R nr Rome 2000 cfs observed Apr 28 May 6 Owyhee R nr Rome 1000 cfs observed May 6 May 18 Owyhee R nr Rome 500 cfs Apr 24 May 19 Jun 13 Jun 2
UPPER JOHN DAY BASIN
FORECAST POINT
FORECAST THRESHOLD
FORECAST VALUE ------------- CHANCE OF EXCEEDING -----
------
LONG-TERM AVERAGE VALUE
90% 50% 10%
John Day R at Service Creek
Average Daily Flow on Aug.
1st
55 240 425 271
UPPER DESCHUTES AND CROOKED BASINS
FORECAST POINT
FORECAST THRESHOLD
FORECAST VALUE ------------- CHANCE OF EXCEEDING -----
------
LONG-TERM AVERAGE VALUE
90% 50% 10%
Crane Prairie Inflow * Date of Peak May 13 May 27 Jun 10 May 25 Crane Prairie Inflow Peak Flow 115 235 355 403 Crane Prairie Inflow Average Daily
Flow on Oct. 1st
134 167 200 269
Prineville Reservoir Inflow 113 cfs May 19 May 29 Jun 15 June 3 Prineville Reservoir Inflow 75 cfs May 27 Jun 7 Jun 21 June 11 Prineville Reservoir Inflow 50 cfs May 31 Jun 15 Jun 30 June 19 Whychus Creek nr Sisters 100 cfs Jul 6 Jul 29 Aug 22 August 16 *No prediction possible until April 1. Historic values are shown for reference prior to the April 1 report.
-33-
ROGUE AND UMPQUA BASINS
FORECAST POINT
FORECAST THRESHOLD
FORECAST VALUE ------------- CHANCE OF EXCEEDING -----
------
LONG-TERM AVERAGE VALUE
90% 50% 10%
South Umpqua R nr Brockway *
90 cfs Jul 23 Aug 7 Aug 23 August 8
South Umpqua R at Tiller 140 cfs Jun 29 Jul 17 Aug 4 July 11 South Umpqua R at Tiller 90 cfs Jul 20 Aug 7 Aug 25 August 1 South Umpqua R at Tiller 60 cfs Aug 5 Aug 29 Sep 22 August 28 *Dates are based on streamflow data adjusted for releases from Galesville Reservoir to reflect natural flow conditions and do not match observed gage data. There is an approximately 20% chance in any given year that the flow will not recede below 90 cfs; the dates given here are for the event that the flow does recede below 90 cfs.
LAKE COUNTY AND GOOSE LAKE BASINS
FORECAST POINT
FORECAST THRESHOLD
FORECAST VALUE ------------- CHANCE OF EXCEEDING -----
------
LONG-TERM AVERAGE VALUE
90% 50% 10%
Deep Ck ab Adel 100 cfs May 23 Jun 7 Jun 22 June 17 Honey Ck nr Plush 100 cfs Apr 19 May 14 Jun 8 May 16 Honey Ck nr Plush 50 cfs May 9 Jun 1 Jun 24 June 4 Twentymile Ck nr Adel 50 cfs May 14 May 19 Jun 8 May 30 Twentymile Ck nr Adel 10 cfs Jun 9 Jun 28 Jul 17 July 7
HARNEY BASIN
FORECAST POINT
FORECAST THRESHOLD
FORECAST VALUE ------------- CHANCE OF EXCEEDING -----
------
LONG-TERM AVERAGE VALUE
90% 50% 10%
Silvies R nr Burns 400 cfs observed May 5 May 21 200 cfs May 5 May 26 Jun 16 June 2 100 cfs May 17 Jun 8 Jun 30 June 13 50 cfs Jun 8 Jul 1 Jul 24 July 3 Donner Und Blitzen R nr Frenchglen
And Federal – State – Private Cooperative Snow Surveys
For more water supply and resource management information, contact:
USDA, Natural Resources Conservation Service Snow Survey Office 1201 NE Lloyd; Suite 900 Portland, OR 97232 Phone: (503) 414-3270 Web site: http://www.or.nrcs.usda.gov/snow/index.html
Most of the annual streamflow in the western United States originates as snowfall that has accumulated in the mountains during the winter and early spring. As the snowpack accumulates, hydrologists estimate the runoff that will occur when it melts. Measurements of snow water equivalent at selected manual snowcourses and automated SNOTEL sites, along with precipitation, antecedent streamflow, and indices of the El Niño / Southern Oscillation are used in computerized statistical and simulation models to prepare runoff forecasts. These forecasts are coordinated between hydrologists in the Natural Resources Conservation Service and the National Weather Service. Unless otherwise specified, all forecasts are for flows that would occur naturally without any upstream influences Forecasts of any kind, of course, are not perfect. Streamflow forecast uncertainty arises from three primary sources: (1) uncertain knowledge of future weather conditions, (2) uncertainty in the forecasting procedure, and (3) errors in the data. The forecast, therefore, must be interpreted not as a single value but rather as a range of values with specific probabilities of occurrence. The middle of the range is expressed by the 50% exceedance probability forecast, for which there is a 50% chance that the actual flow will be above, and a 50% chance that the actual flow will be below, this value. To describe the expected range around this 50% value, four other forecasts are provided, two smaller values (90% and 70% exceedance probability) and two larger values (30%, and 10% exceedance probability). For example, there is a 90% chance that the actual flow will be more than the 90% exceedance probability forecast. The others can be interpreted similarly. The wider the spread among these values, the more uncertain the forecast. As the season progresses, forecasts become more accurate, primarily because a greater portion of the future weather conditions become known; this is reflected by a narrowing of the range around the 50% exceedance probability forecast. Users should take this uncertainty into consideration when making operational decisions by selecting forecasts corresponding to the level of risk they are willing to assume about the amount of water to be expected. If users anticipate receiving a lesser supply of water, or if they wish to increase their chances of having an adequate supply of water for their operations, they may want to base their decisions on the 90% or 70% exceedance probability forecasts, or something in between. On the other hand, if users are concerned about receiving too much water (for example, threat of flooding), they may want to base their decisions on the 30% or 10% exceedance probability forecasts, or something in between. Regardless of the forecast value users choose for operations, they should be prepared to deal with either more or less water. (Users should remember that even if the 90% exceedance probability forecast is used, there is still a 10% chance of receiving less than this amount.) By using the exceedance probability information, users can easily determine the chances of receiving more or less water.
Interpreting Water Supply Forecasts Each month, five forecasts are issued for each forecast point and each forecast period. Unless otherwise specified, all streamflow forecasts are for streamflow volumes that would occur naturally without any upstream influences. Water users need to know what the different forecasts represent if they are to use the information correctly when making operational decisions. The following is an explanation of each of the forecasts.
90 Percent Chance of Exceedance Forecast. There is a 90 percent chance that the actual streamflow volume will exceed this forecast value, and there is a 10 percent chance that the actual streamflow volume will be less than this forecast value.
70 Percent Chance of Exceedance Forecast. There is a 70 percent chance that the actual streamflow volume will exceed this forecast value, and there is a 30 percent chance that the actual streamflow volume will be less than this forecast value.
50 Percent Chance of Exceedance Forecast. There is a 50 percent chance that the actual streamflow volume will exceed this forecast value, and there is a 50 percent chance that the actual streamflow volume will be less than this forecast value. Generally, this forecast is the middle of the range of possible streamflow volumes that can be produced given current conditions.
30 Percent Chance of Exceedance Forecast. There is a 30 percent chance that the actual streamflow volume will exceed this forecast value, and there is a 70 percent chance that the actual streamflow volume will be less than this forecast value.
10 Percent Chance of Exceedance Forecast. There is a 10 percent chance that the actual streamflow volume will exceed this forecast value, and there is a 90 percent chance that the actual streamflow volume will be less than this forecast value.
*Note: There is still a 20 percent chance that actual streamflow volumes will fall either below the 90 percent exceedance forecast or above the 10 percent exceedance forecast.
These forecasts represent the uncertainty inherent in making streamflow predictions. This uncertainty may include sources such as: unknown future weather conditions, uncertainties associated with the various prediction methodologies, and the spatial coverage of the data network in a given basin.
30-Year Average. The 30-year average streamflow for each forecast period is provided for comparison. The average is based on data from 1971-2000. The % AVG. column compares the 50% chance of exceedance forecast to the 30-year average streamflow; values above 100% denote when the 50% chance of exceedance forecast would be greater than the 30-year average streamflow.
AF - Acre-feet, forecasted volume of water are typically in thousands of acre-feet.
These forecasts are given to users to help make risk-based decisions. Users can select the forecast corresponding to the level of risk they are willing to accept in order to minimize the negative impacts of having more or less water than planned for.
To Decrease the Chance of Having Less Water than Planned for: A user might determine that making decisions based on a 50 percent chance of exceedance forecast is too much risk to take (there is still a 50% chance that the user will receive less than this amount). To reduce the risk of having less water than planned for, users can base their operational decisions on one of the forecasts with a greater chance of being exceeded such as the 90 or 70 percent exceedance forecasts.
To Decrease the Chance of Having More Water than Planned for: A user might determine that making decisions based on a 50 percent chance of exceedance forecast is too much risk to take (there is still a 50% chance that the user will receive more than this amount). To reduce the risk of having more water than planned for, users can base their operational decisions on one of the forecasts with a lesser chance of being exceeded such as the 30 or 10 percent exceedance forecasts.
Using the forecasts - an Example Using the 50 Percent Exceedance Forecast. Using the example forecasts shown below, there is a 50% chance that actual streamflow volume at the Boise River near Twin Springs will be less than 685 KAF between April 1 and July 31. There is also a 50% chance that actual streamflow volume will be greater than 685 KAF.
Using the 90 and 70 Percent Exceedance Forecasts. If an unexpected shortage of water could cause problems (such as irrigated agriculture), users might want to plan on receiving 610 KAF (from the 70 percent exceedance forecast). There is a 30% chance of receiving less than 610 KAF.
Alternatively, if users determine the risk of using the 70 percent exceedance forecast is too great, then they might plan on receiving 443 KAF (from the 90
percent exceedance forecast). There is 10% chance of receiving less than 443 KAF.
Using the 30 or 10 Percent Exceedance Forecasts. If an unexpected excess of water could cause problems (such as operating a flood control reservoir), users might plan on receiving 760 KAF (from the 30 percent exceedance forecast). There is a 30% chance of receiving more than 760 KAF.
Alternatively, if users determine the risk of using the 30 percent exceedance forecast is too great, then they might plan on receiving 927 KAF (from the 10 percent exceedance forecast). There is a 10% chance of receiving more than 927 KAF.
Users could also choose a volume in between any of these values to reflect their desired risk level.
* 90%, 70%, 30%, and 10% chances of exceeding are the probabilities that the actual flow will exceed the volumes in the table.
USDA Natural Resources Conservation Service 1201 NE Lloyd Suite 900 Portland, OR 97232-1274 Official Business
Issued by Dave White, Chief Natural Resources Conservation Service U.S. Department of Agriculture Released by Ron Alvarado, State Conservationist Natural Resources Conservation Service Portland, Oregon This publication may be found online at: http://www.or.nrcs.usda.gov/snow/watersupply/
Oregon
Basin Outlook Report Natural Resources Conservation Service
Portland, OR
http://www.or.nrcs.usda.gov/snow/
Please notify us if you no longer wish to receive a paper copy of this document.