42
United States Department of Agriculture Natural Resources Conservation Service Oregon Basin Outlook Report May 1, 2007

United States Department of Agriculture Natural Resources Conservation Service
Oregon Basin Outlook Report May 1, 2007
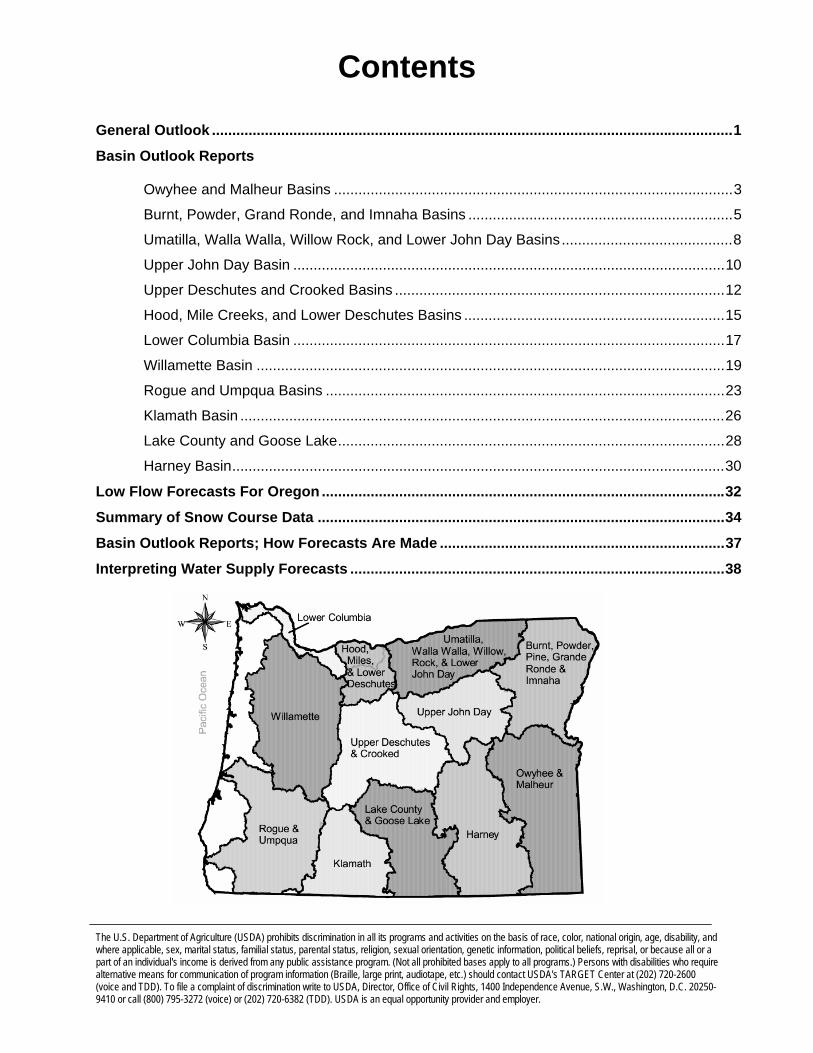
Contents
General Outlook ................................................................................................................................1 Basin Outlook Reports
Owyhee and Malheur Basins ..................................................................................................3 Burnt, Powder, Grand Ronde, and Imnaha Basins .................................................................5 Umatilla, Walla Walla, Willow Rock, and Lower John Day Basins..........................................8 Upper John Day Basin ..........................................................................................................10 Upper Deschutes and Crooked Basins .................................................................................12 Hood, Mile Creeks, and Lower Deschutes Basins ................................................................15 Lower Columbia Basin ..........................................................................................................17 Willamette Basin ...................................................................................................................19 Rogue and Umpqua Basins ..................................................................................................23 Klamath Basin .......................................................................................................................26 Lake County and Goose Lake...............................................................................................28 Harney Basin.........................................................................................................................30
Low Flow Forecasts For Oregon ...................................................................................................32 Summary of Snow Course Data ....................................................................................................34 Basin Outlook Reports; How Forecasts Are Made ......................................................................37 Interpreting Water Supply Forecasts ............................................................................................38
The U.S. Department of Agriculture (USDA) prohibits discrimination in all its programs and activities on the basis of race, color, national origin, age, disability, and where applicable, sex, marital status, familial status, parental status, religion, sexual orientation, genetic information, political beliefs, reprisal, or because all or a part of an individual's income is derived from any public assistance program. (Not all prohibited bases apply to all programs.) Persons with disabilities who require alternative means for communication of program information (Braille, large print, audiotape, etc.) should contact USDA's TARGET Center at (202) 720-2600 (voice and TDD). To file a complaint of discrimination write to USDA, Director, Office of Civil Rights, 1400 Independence Avenue, S.W., Washington, D.C. 20250-9410 or call (800) 795-3272 (voice) or (202) 720-6382 (TDD). USDA is an equal opportunity provider and employer.

-1-
General Outlook March 1, 2007
SUMMARY The May 1 snow pack was below normal throughout Oregon. Eastern Oregon basins fell short of a normal snowpack this winter. Those basins with below normal winter snowpacks then saw rapid melt in March and April. Only the Willamette and Deschutes basins approached a normal snowpack this past winter. In many areas of Eastern Oregon, the melt out is 2-3 weeks ahead of schedule. With the below normal winter snowfall and early melt off, many water users, particularly in Eastern Oregon, will see well below normal spring runoff and summer stream flows this year. The water supply and reservoir inflow forecasts summarized in this report illustrate more details on these conditions. Water users in some Eastern Oregon basins should begin to enact water conservation measures. SNOWPACK The snow had melted at all but 47 out of 112 SNOTEL sites in Oregon as of May 1. Normally, 101 of these sites are snow covered on May 1. Statewide, May 1 snowpack as measured at 112 SNOTEL sites and snow courses was 61 percent of average. Many basins in the state have lost snow at all but the highest elevations. PRECIPITATION April precipitation totals varied throughout the state. In general, April was drier than normal in most regions of Oregon. Southeastern Oregon had near normal April precipitation. Precipitation for the month of April for the rest of Oregon varied from 63 to 88 percent of average. Since the beginning of the water year, statewide precipitation totals are slightly below to near normal. Large storms in November, December and February brought most of the precipitation Oregon had this winter. RESERVOIRS Oregon irrigation reservoirs were boosted last month from snow melt. The May 1 storage at 27 major Oregon reservoirs analyzed in this publication was 94 percent of average. A total of 2,486,300 acre feet of water were stored on May 1, representing 76 percent of capacity. May through September inflow forecasts to many of the irrigation reservoirs east of the Deschutes are significantly below average. While current conditions appear close to average, much of the annual runoff has already occurred. Without significant conservation, many reservoirs may be well below average one month from now.

-2-
STREAMFLOW Summer streamflow forecasts for the southeastern corner of Oregon reflect the poor water year and light winter snowpack. Many streams in southeastern Oregon are expected to have half of their normal streamflow this coming summer. As a result of the rapid snow melt in March and April, Willamette basin summer streamflow forecasts have dropped considerably since last month. Next month, final forecasts will be issued here for summer 2007 Oregon streamflows.
STREAM
PERIOD PERCENT OF
AVERAGE Owyhee Net Inflow
May - July 39
Grande Ronde at La Grande
May - September 62
Umatilla at Pendleton
May - September 70
Deschutes at Benham Falls
May - September 96
Willamette MF near Oakridge
May - September 90
Rogue at Raygold
May - September 81
Upper Klamath L. Net Inflow
May - September 72
Silvies near Burns
May - September 42
Some of these forecasts assume that normal weather conditions will occur from now to the end of the forecast period. The forecasts in this bulletin are a result of coordinated activity between the Natural Resources Conservation Service and the National Weather Service as an effort to provide the best possible service to water users. This report contains data furnished by the Oregon Department of Water Resources, U.S. Geological Survey, NOAA National Weather Service and other cooperators.

on Service Office: For more information contact your local Natural Resources Conservati Ontario - (541) 889-7637
Or visit: http://www.wcc.nrcs.usda.gov/cgibin/bor.pl
-3-
Mountain Snowpack(percent of normal)
0
50
100
150
200
250
300
Jan Feb Mar Apr May
Current Average
Maximum Minimum
Owyhee and Malheur Basins May 1, 2007
Water Supply Outlook The Owyhee and Malheur basin had average precipitation in April. April precipitation failed to offset the winter deficit in the basin however. Since the beginning of the water year, total precipitation in the basin has been 83 percent of average. The May 1 snowpack in the Owyhee and Malheur was only 34 percent of normal. At the beginning of the month, 5 out of 17 SNOTEL sites in the basin had snow remaining. Normally, 16 of these sites have at least some snow on May 1. Basin wide, the melt out is 5 weeks ahead of the normal schedule. As of May 1, storage at Beulah, Bully Creek, Owyhee and Warmsprings reservoirs was 89 percent of average. Reservoir inputs are expected to fall off significantly in the coming months. May through September streamflow forecasts in the Owyhee and Malheur range from 37 percent of average for the inflow to Owyhee reservoir to 54 percent of average for the North Fork Malheur near Buelah. Water users can expect significantly reduced supplies this coming season.
Precipitation(percent of normal)
0102030405060708090
100110120130
Oct Nov Dec Jan Feb Mar Apr May
Monthly Year-to-date

================================================================================================================================== OWYHEE AND MALHEUR BASINS Streamflow Forecasts - May 1, 2007 ================================================================================================================================== | <<====== Drier ====== Future Conditions ======= Wetter =====>> | | | Forecast Point Forecast | ==================== Chance Of Exceeding * ====================== | Period | 90% 70% | 50% (Most Probable) | 30% 10% | 30-Yr Avg. | (1000AF) (1000AF) | (1000AF) (% AVG.) | (1000AF) (1000AF) | (1000AF) ====================================================================|=======================|===================================== MALHEUR near Drewsey MAY-JUL 5.8 10.4 | 14.4 41 | 19.0 27 35 MAY-SEP 6.0 11.0 | 15.1 41 | 19.9 28 37 | | NF MALHEUR at Beulah MAY-JUL 9.5 15.2 | 19.8 54 | 25 34 37 MAY-SEP 10.3 17.2 | 23 54 | 30 41 43 | | OWYHEE RESV INFLOW (2) MAY-JUL 39 67 | 87 39 | 107 135 225 MAY-SEP 33 54 | 93 37 | 140 230 255 | | OWYHEE near Rome MAY-JUL 15.0 49 | 84 40 | 128 210 210 | | SUCCOR CK nr Jordan Valley MAY-JUL 1.4 2.3 | 3.1 44 | 4.0 5.5 7.1 | | ================================================================================================================================== OWYHEE AND MALHEUR BASINS | OWYHEE AND MALHEUR BASINS Reservoir Storage (1000 AF) - End of April | Watershed Snowpack Analysis - May 1, 2007 ================================================================================================================================== Usable | *** Usable Storage *** | Number This Year as % of Reservoir Capacity| This Last | Watershed of ================= | Year Year Avg | Data Sites Last Yr Average ========================================================================|========================================================= BEULAH RES 60.0 47.5 58.3 51.2 | Owyhee River 7 5 5 | BULLY CREEK 30.0 24.0 30.0 25.6 | Malheur 3 0 0 | OWYHEE 715.0 553.9 690.9 613.6 | Jordan Creek 1 0 0 | WARMSPRINGS 191.0 123.6 176.0 149.9 | Bully Creek 0 0 0 | ================================================================================================================================== * 90%, 70%, 30%, and 10% chances of exceeding are the probabilities that the actual flow will exceed the volumes in the table. (1) - The values listed under the 10% and 90% Chance of Exceeding are actually 5% and 95% exceedance levels. (2) - The value is natural flow - actual flow may be affected by upstream water management.
For m ce Office: Ent
ore information contact your local Natural Resources Conservation Servierprise- (541) 426-4588; Baker City - (541) 523-7121; LaGrande - (541) 963-4178
Or visit: http://www.wcc.nrcs.usda.gov/cgibin/bor.pl
-5-
Mountain Snowpack(percent of normal)
0
50
100
150
200
250
Jan Feb Mar Apr May
Current Average
Maximum Minimum
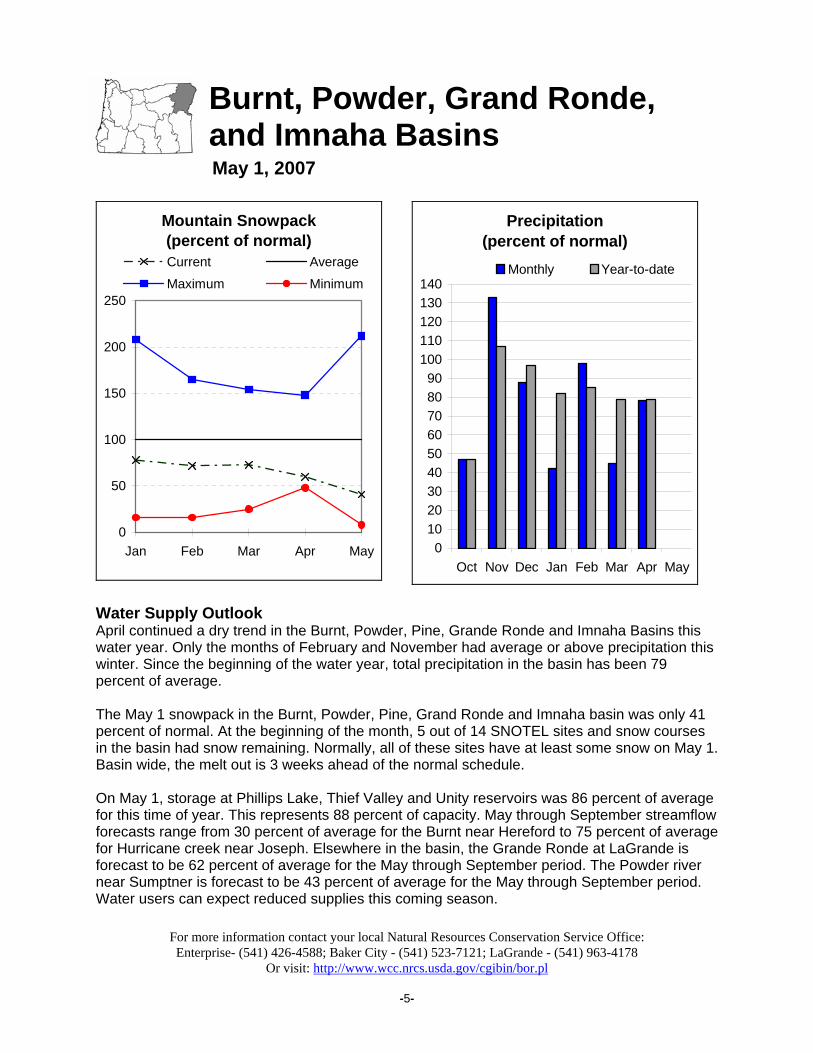
Burnt, Powder, Grand Ronde, and Imnaha Basins
May 1, 2007
Water Supply Outlook April continued a dry trend in the Burnt, Powder, Pine, Grande Ronde and Imnaha Basins this water year. Only the months of February and November had average or above precipitation this winter. Since the beginning of the water year, total precipitation in the basin has been 79 percent of average. The May 1 snowpack in the Burnt, Powder, Pine, Grand Ronde and Imnaha basin was only 41 percent of normal. At the beginning of the month, 5 out of 14 SNOTEL sites and snow courses in the basin had snow remaining. Normally, all of these sites have at least some snow on May 1. Basin wide, the melt out is 3 weeks ahead of the normal schedule. On May 1, storage at Phillips Lake, Thief Valley and Unity reservoirs was 86 percent of average for this time of year. This represents 88 percent of capacity. May through September streamflow forecasts range from 30 percent of average for the Burnt near Hereford to 75 percent of average for Hurricane creek near Joseph. Elsewhere in the basin, the Grande Ronde at LaGrande is forecast to be 62 percent of average for the May through September period. The Powder river near Sumptner is forecast to be 43 percent of average for the May through September period. Water users can expect reduced supplies this coming season.
Precipitation(percent of normal)
0102030405060708090
100110120130140
Oct Nov Dec Jan Feb Mar Apr May
Monthly Year-to-date
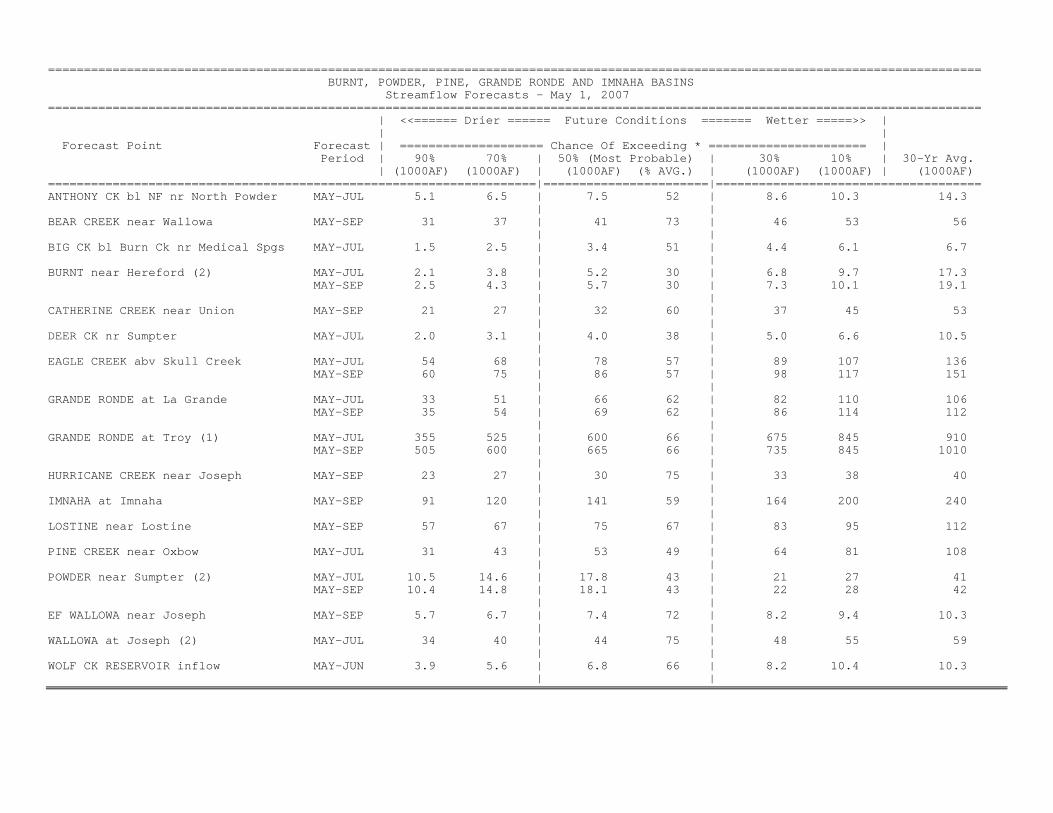
================================================================================================================================== BURNT, POWDER, PINE, GRANDE RONDE AND IMNAHA BASINS Streamflow Forecasts - May 1, 2007 ================================================================================================================================== | <<====== Drier ====== Future Conditions ======= Wetter =====>> | | | Forecast Point Forecast | ==================== Chance Of Exceeding * ====================== | Period | 90% 70% | 50% (Most Probable) | 30% 10% | 30-Yr Avg. | (1000AF) (1000AF) | (1000AF) (% AVG.) | (1000AF) (1000AF) | (1000AF) ====================================================================|=======================|===================================== ANTHONY CK bl NF nr North Powder MAY-JUL 5.1 6.5 | 7.5 52 | 8.6 10.3 14.3 | | BEAR CREEK near Wallowa MAY-SEP 31 37 | 41 73 | 46 53 56 | | BIG CK bl Burn Ck nr Medical Spgs MAY-JUL 1.5 2.5 | 3.4 51 | 4.4 6.1 6.7 | | BURNT near Hereford (2) MAY-JUL 2.1 3.8 | 5.2 30 | 6.8 9.7 17.3 MAY-SEP 2.5 4.3 | 5.7 30 | 7.3 10.1 19.1 | | CATHERINE CREEK near Union MAY-SEP 21 27 | 32 60 | 37 45 53 | | DEER CK nr Sumpter MAY-JUL 2.0 3.1 | 4.0 38 | 5.0 6.6 10.5 | | EAGLE CREEK abv Skull Creek MAY-JUL 54 68 | 78 57 | 89 107 136 MAY-SEP 60 75 | 86 57 | 98 117 151 | | GRANDE RONDE at La Grande MAY-JUL 33 51 | 66 62 | 82 110 106 MAY-SEP 35 54 | 69 62 | 86 114 112 | | GRANDE RONDE at Troy (1) MAY-JUL 355 525 | 600 66 | 675 845 910 MAY-SEP 505 600 | 665 66 | 735 845 1010 | | HURRICANE CREEK near Joseph MAY-SEP 23 27 | 30 75 | 33 38 40 | | IMNAHA at Imnaha MAY-SEP 91 120 | 141 59 | 164 200 240 | | LOSTINE near Lostine MAY-SEP 57 67 | 75 67 | 83 95 112 | | PINE CREEK near Oxbow MAY-JUL 31 43 | 53 49 | 64 81 108 | | POWDER near Sumpter (2) MAY-JUL 10.5 14.6 | 17.8 43 | 21 27 41 MAY-SEP 10.4 14.8 | 18.1 43 | 22 28 42 | | EF WALLOWA near Joseph MAY-SEP 5.7 6.7 | 7.4 72 | 8.2 9.4 10.3 | | WALLOWA at Joseph (2) MAY-JUL 34 40 | 44 75 | 48 55 59 | | WOLF CK RESERVOIR inflow MAY-JUN 3.9 5.6 | 6.8 66 | 8.2 10.4 10.3 | |
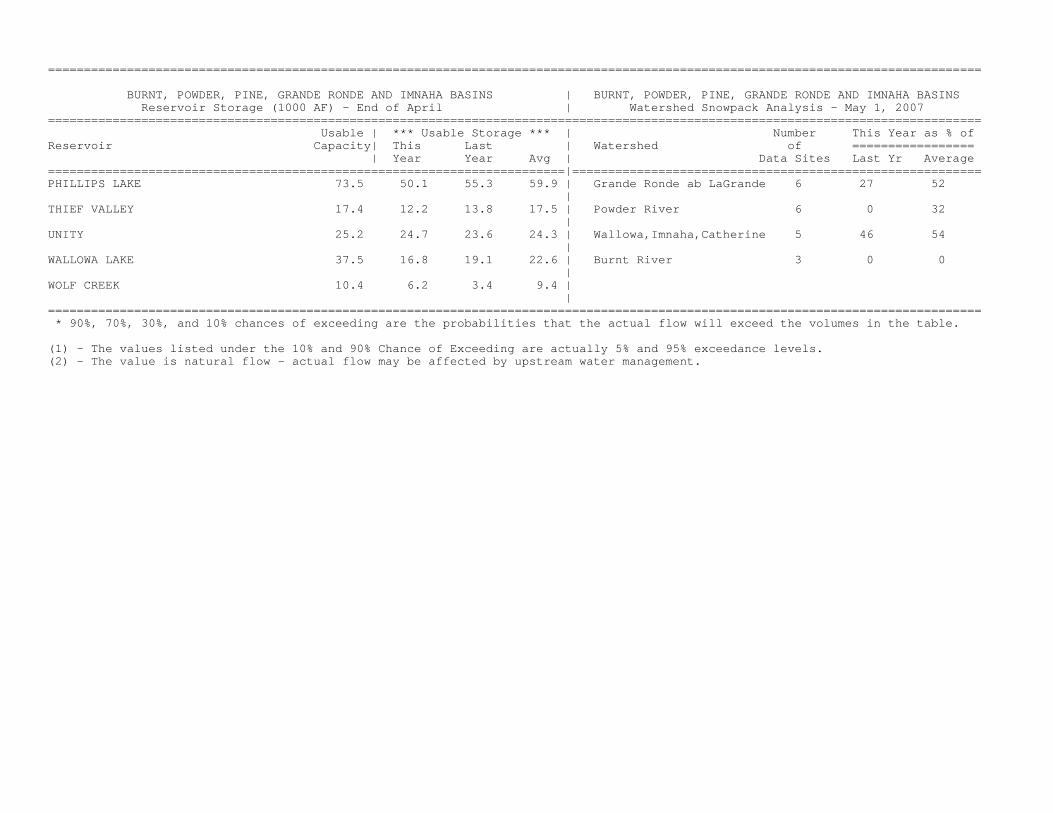
================================================================================================================================== BURNT, POWDER, PINE, GRANDE RONDE AND IMNAHA BASINS | BURNT, POWDER, PINE, GRANDE RONDE AND IMNAHA BASINS Reservoir Storage (1000 AF) - End of April | Watershed Snowpack Analysis - May 1, 2007 ================================================================================================================================== Usable | *** Usable Storage *** | Number This Year as % of Reservoir Capacity| This Last | Watershed of ================= | Year Year Avg | Data Sites Last Yr Average ========================================================================|========================================================= PHILLIPS LAKE 73.5 50.1 55.3 59.9 | Grande Ronde ab LaGrande 6 27 52 | THIEF VALLEY 17.4 12.2 13.8 17.5 | Powder River 6 0 32 | UNITY 25.2 24.7 23.6 24.3 | Wallowa,Imnaha,Catherine 5 46 54 | WALLOWA LAKE 37.5 16.8 19.1 22.6 | Burnt River 3 0 0 | WOLF CREEK 10.4 6.2 3.4 9.4 | | ================================================================================================================================== * 90%, 70%, 30%, and 10% chances of exceeding are the probabilities that the actual flow will exceed the volumes in the table. (1) - The values listed under the 10% and 90% Chance of Exceeding are actually 5% and 95% exceedance levels. (2) - The value is natural flow - actual flow may be affected by upstream water management.
For more in ce: Pendlet
formation contact your local Natural Resources Conservation Service Offion - (541) 278-8049; Heppner - (541) 676-5021; Condon - (541) 384-2671
Or visit: http://www.wcc.nrcs.usda.gov/cgibin/bor.pl
-8-
Mountain Snowpack(percent of normal)
0
50
100
150
200
250
300
Jan Feb Mar Apr May
Current AverageMaximum Minimum
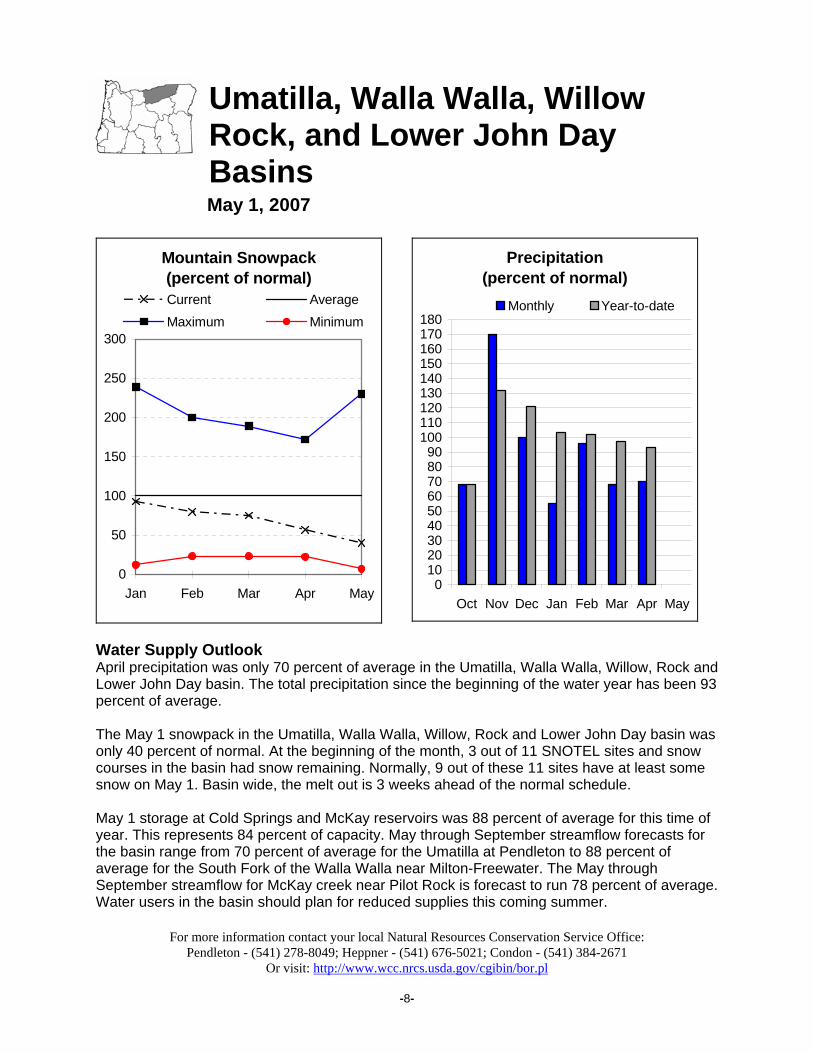
Umatilla, Walla Walla, Willow Rock, and Lower John Day Basins
May 1, 2007
Water Supply Outlook April precipitation was only 70 percent of average in the Umatilla, Walla Walla, Willow, Rock and Lower John Day basin. The total precipitation since the beginning of the water year has been 93 percent of average. The May 1 snowpack in the Umatilla, Walla Walla, Willow, Rock and Lower John Day basin was only 40 percent of normal. At the beginning of the month, 3 out of 11 SNOTEL sites and snow courses in the basin had snow remaining. Normally, 9 out of these 11 sites have at least some snow on May 1. Basin wide, the melt out is 3 weeks ahead of the normal schedule. May 1 storage at Cold Springs and McKay reservoirs was 88 percent of average for this time of year. This represents 84 percent of capacity. May through September streamflow forecasts for the basin range from 70 percent of average for the Umatilla at Pendleton to 88 percent of average for the South Fork of the Walla Walla near Milton-Freewater. The May through September streamflow for McKay creek near Pilot Rock is forecast to run 78 percent of average. Water users in the basin should plan for reduced supplies this coming summer.
Precipitation(percent of normal)
0102030405060708090
100110120130140150160170180
Oct Nov Dec Jan Feb Mar Apr May
Monthly Year-to-date
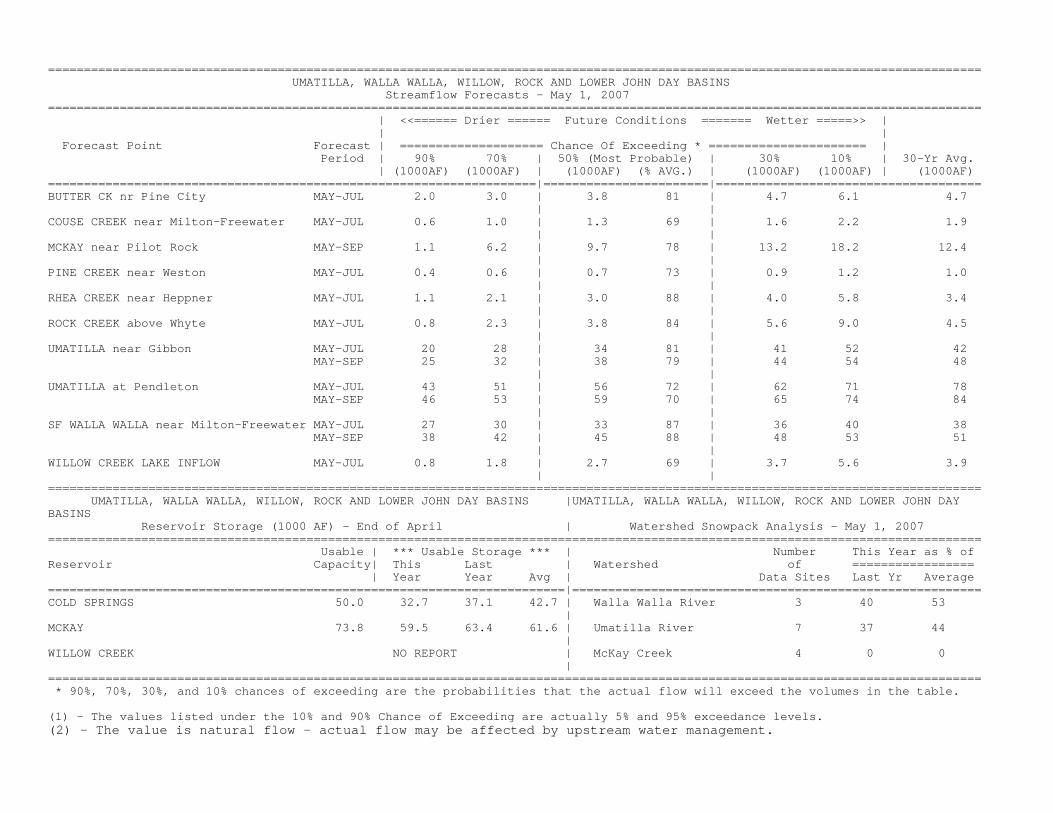
================================================================================================================================== UMATILLA, WALLA WALLA, WILLOW, ROCK AND LOWER JOHN DAY BASINS Streamflow Forecasts - May 1, 2007 ================================================================================================================================== | <<====== Drier ====== Future Conditions ======= Wetter =====>> | | | Forecast Point Forecast | ==================== Chance Of Exceeding * ====================== | Period | 90% 70% | 50% (Most Probable) | 30% 10% | 30-Yr Avg. | (1000AF) (1000AF) | (1000AF) (% AVG.) | (1000AF) (1000AF) | (1000AF) ====================================================================|=======================|===================================== BUTTER CK nr Pine City MAY-JUL 2.0 3.0 | 3.8 81 | 4.7 6.1 4.7 | | COUSE CREEK near Milton-Freewater MAY-JUL 0.6 1.0 | 1.3 69 | 1.6 2.2 1.9 | | MCKAY near Pilot Rock MAY-SEP 1.1 6.2 | 9.7 78 | 13.2 18.2 12.4 | | PINE CREEK near Weston MAY-JUL 0.4 0.6 | 0.7 73 | 0.9 1.2 1.0 | | RHEA CREEK near Heppner MAY-JUL 1.1 2.1 | 3.0 88 | 4.0 5.8 3.4 | | ROCK CREEK above Whyte MAY-JUL 0.8 2.3 | 3.8 84 | 5.6 9.0 4.5 | | UMATILLA near Gibbon MAY-JUL 20 28 | 34 81 | 41 52 42 MAY-SEP 25 32 | 38 79 | 44 54 48 | | UMATILLA at Pendleton MAY-JUL 43 51 | 56 72 | 62 71 78 MAY-SEP 46 53 | 59 70 | 65 74 84 | | SF WALLA WALLA near Milton-Freewater MAY-JUL 27 30 | 33 87 | 36 40 38 MAY-SEP 38 42 | 45 88 | 48 53 51 | | WILLOW CREEK LAKE INFLOW MAY-JUL 0.8 1.8 | 2.7 69 | 3.7 5.6 3.9 | | ================================================================================================================================== UMATILLA, WALLA WALLA, WILLOW, ROCK AND LOWER JOHN DAY BASINS |UMATILLA, WALLA WALLA, WILLOW, ROCK AND LOWER JOHN DAY BASINS Reservoir Storage (1000 AF) - End of April | Watershed Snowpack Analysis - May 1, 2007 ================================================================================================================================== Usable | *** Usable Storage *** | Number This Year as % of Reservoir Capacity| This Last | Watershed of ================= | Year Year Avg | Data Sites Last Yr Average ========================================================================|========================================================= COLD SPRINGS 50.0 32.7 37.1 42.7 | Walla Walla River 3 40 53 | MCKAY 73.8 59.5 63.4 61.6 | Umatilla River 7 37 44 | WILLOW CREEK NO REPORT | McKay Creek 4 0 0 | ================================================================================================================================== * 90%, 70%, 30%, and 10% chances of exceeding are the probabilities that the actual flow will exceed the volumes in the table. (1) - The values listed under the 10% and 90% Chance of Exceeding are actually 5% and 95% exceedance levels. (2) - The value is natural flow - actual flow may be affected by upstream water management.
on Service Office: For more information contact your local Natural Resources ConservatiJohn Day - (541) 575-0135
Or visit: http://www.wcc.nrcs.usda.gov/cgibin/bor.pl
-10-
Mountain Snowpack(percent of normal)
0
50
100
150
200
250
300
Jan Feb Mar Apr May
Current Average
Maximum Minimum
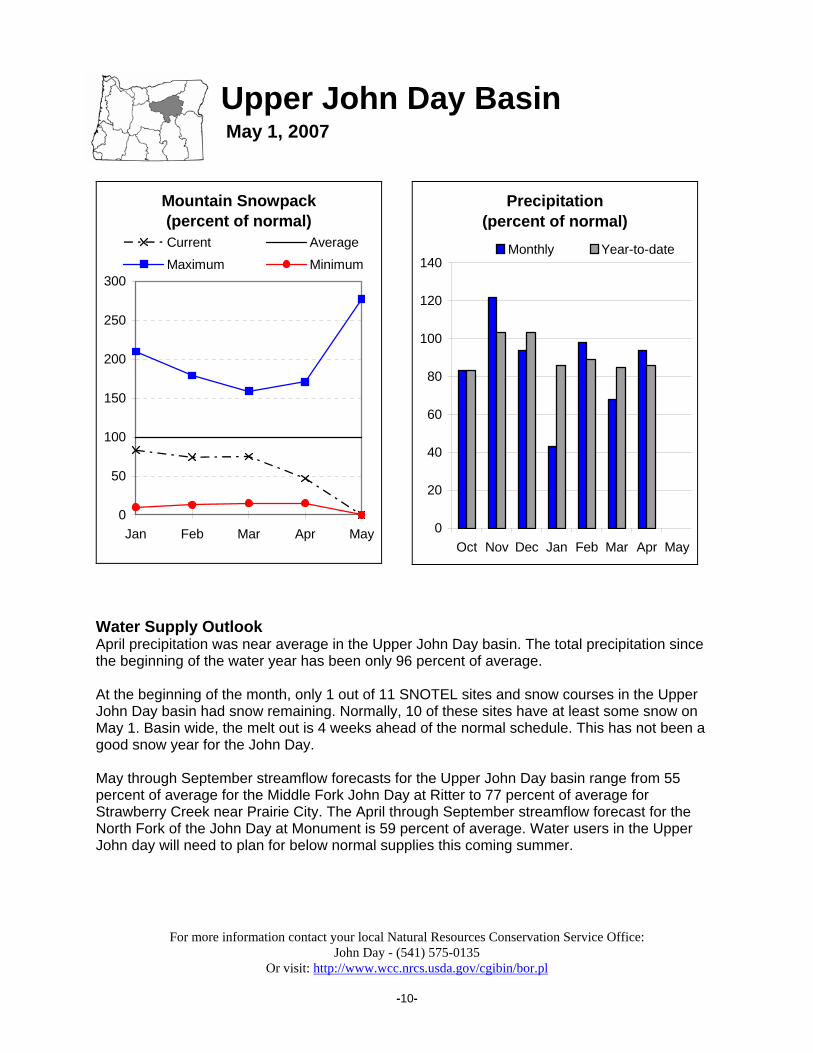
Upper John Day Basin May 1, 2007
Water Supply Outlook April precipitation was near average in the Upper John Day basin. The total precipitation since the beginning of the water year has been only 96 percent of average. At the beginning of the month, only 1 out of 11 SNOTEL sites and snow courses in the Upper John Day basin had snow remaining. Normally, 10 of these sites have at least some snow on May 1. Basin wide, the melt out is 4 weeks ahead of the normal schedule. This has not been a good snow year for the John Day. May through September streamflow forecasts for the Upper John Day basin range from 55 percent of average for the Middle Fork John Day at Ritter to 77 percent of average for Strawberry Creek near Prairie City. The April through September streamflow forecast for the North Fork of the John Day at Monument is 59 percent of average. Water users in the Upper John day will need to plan for below normal supplies this coming summer.
Precipitation(percent of normal)
0
20
40
60
80
100
120
140
Oct Nov Dec Jan Feb Mar Apr May
Monthly Year-to-date
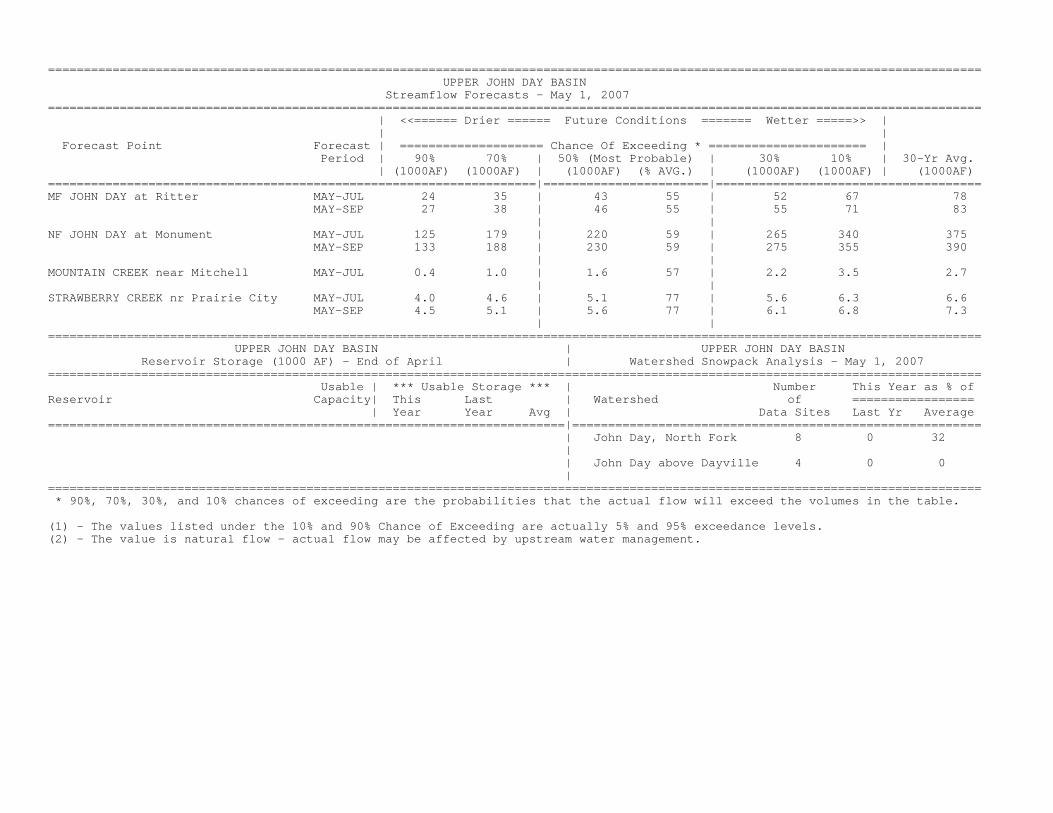
================================================================================================================================== UPPER JOHN DAY BASIN Streamflow Forecasts - May 1, 2007 ================================================================================================================================== | <<====== Drier ====== Future Conditions ======= Wetter =====>> | | | Forecast Point Forecast | ==================== Chance Of Exceeding * ====================== | Period | 90% 70% | 50% (Most Probable) | 30% 10% | 30-Yr Avg. | (1000AF) (1000AF) | (1000AF) (% AVG.) | (1000AF) (1000AF) | (1000AF) ====================================================================|=======================|===================================== MF JOHN DAY at Ritter MAY-JUL 24 35 | 43 55 | 52 67 78 MAY-SEP 27 38 | 46 55 | 55 71 83 | | NF JOHN DAY at Monument MAY-JUL 125 179 | 220 59 | 265 340 375 MAY-SEP 133 188 | 230 59 | 275 355 390 | | MOUNTAIN CREEK near Mitchell MAY-JUL 0.4 1.0 | 1.6 57 | 2.2 3.5 2.7 | | STRAWBERRY CREEK nr Prairie City MAY-JUL 4.0 4.6 | 5.1 77 | 5.6 6.3 6.6 MAY-SEP 4.5 5.1 | 5.6 77 | 6.1 6.8 7.3 | | ================================================================================================================================== UPPER JOHN DAY BASIN | UPPER JOHN DAY BASIN Reservoir Storage (1000 AF) - End of April | Watershed Snowpack Analysis - May 1, 2007 ================================================================================================================================== Usable | *** Usable Storage *** | Number This Year as % of Reservoir Capacity| This Last | Watershed of ================= | Year Year Avg | Data Sites Last Yr Average ========================================================================|========================================================= | John Day, North Fork 8 0 32 | | John Day above Dayville 4 0 0 | ================================================================================================================================== * 90%, 70%, 30%, and 10% chances of exceeding are the probabilities that the actual flow will exceed the volumes in the table. (1) - The values listed under the 10% and 90% Chance of Exceeding are actually 5% and 95% exceedance levels. (2) - The value is natural flow - actual flow may be affected by upstream water management.
ce Office: For more information contact your local Natural Resources Conservation ServiRedmond (541) 923-4358
Or visit: http://www.wcc.nrcs.usda.gov/cgibin/bor.pl
-12-
Mountain Snowpack(percent of normal)
0
50
100
150
200
250
Jan Feb Mar Apr May
Current Average
Maximum Minimum
Upper Deschutes and Crooked Basins May 1, 2007
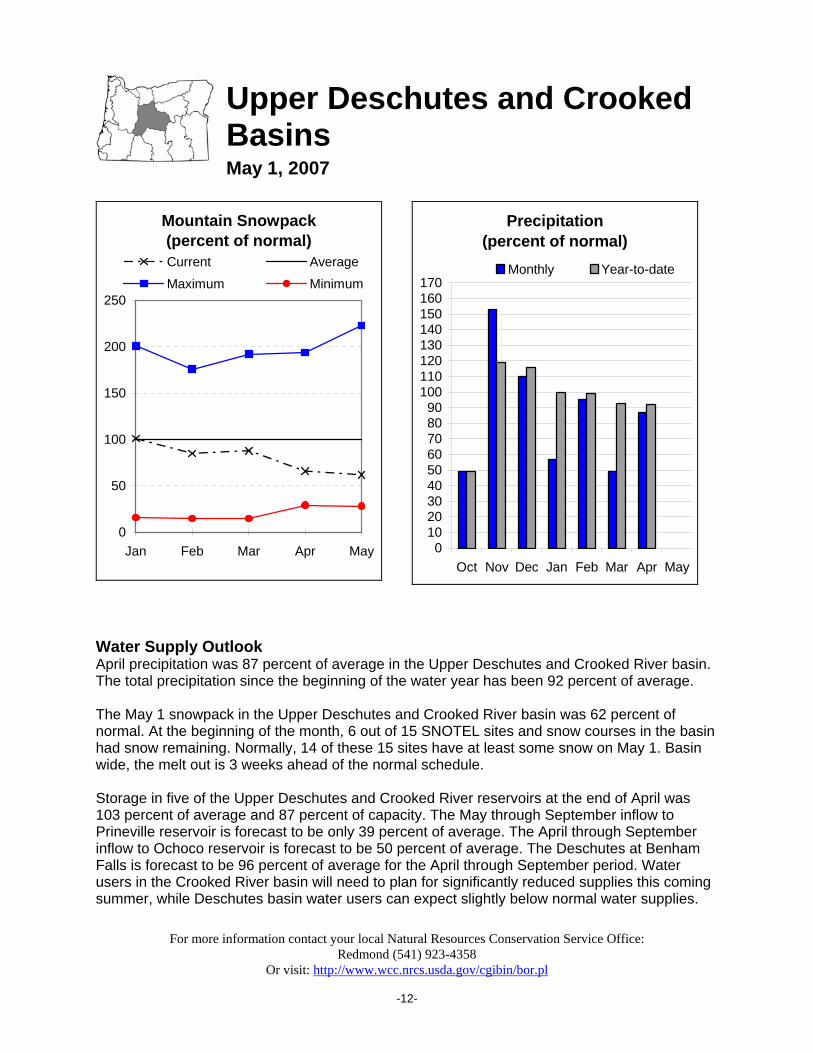
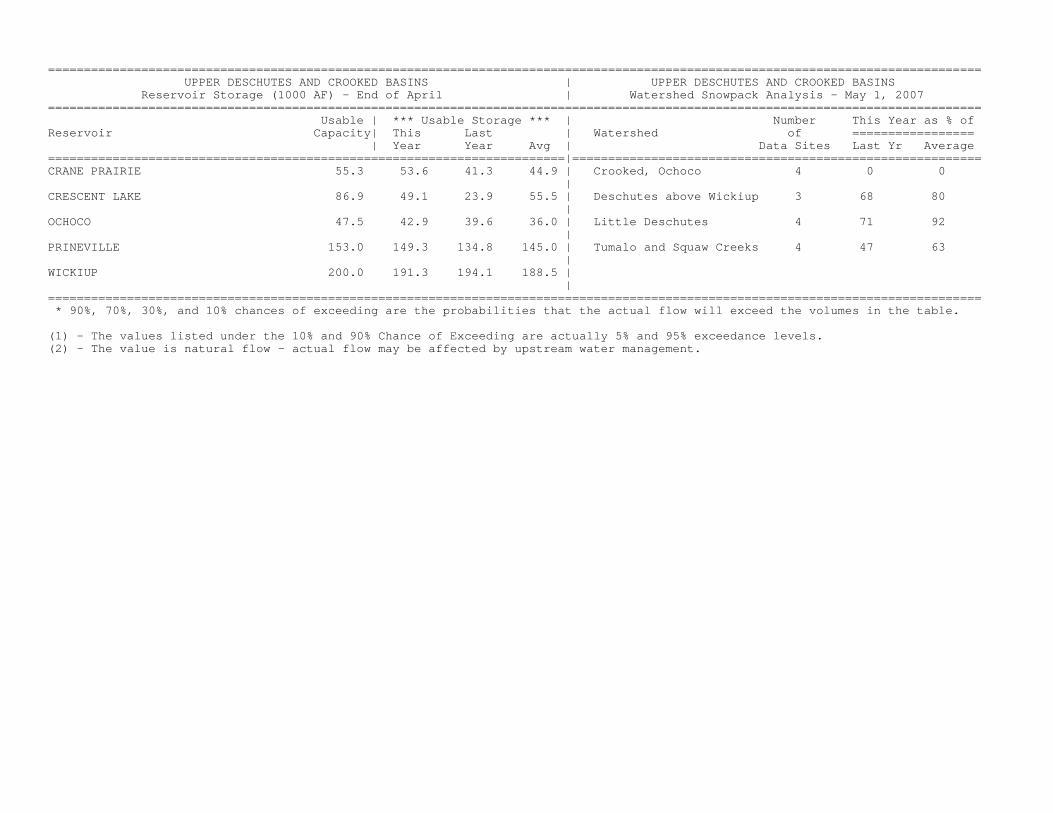
Water Supply Outlook April precipitation was 87 percent of average in the Upper Deschutes and Crooked River basin. The total precipitation since the beginning of the water year has been 92 percent of average. The May 1 snowpack in the Upper Deschutes and Crooked River basin was 62 percent of normal. At the beginning of the month, 6 out of 15 SNOTEL sites and snow courses in the basin had snow remaining. Normally, 14 of these 15 sites have at least some snow on May 1. Basin wide, the melt out is 3 weeks ahead of the normal schedule. Storage in five of the Upper Deschutes and Crooked River reservoirs at the end of April was 103 percent of average and 87 percent of capacity. The May through September inflow to Prineville reservoir is forecast to be only 39 percent of average. The April through September inflow to Ochoco reservoir is forecast to be 50 percent of average. The Deschutes at Benham Falls is forecast to be 96 percent of average for the April through September period. Water users in the Crooked River basin will need to plan for significantly reduced supplies this coming summer, while Deschutes basin water users can expect slightly below normal water supplies.
Precipitation(percent of normal)
0102030405060708090
100110120130140150160170
Oct Nov Dec Jan Feb Mar Apr May
Monthly Year-to-date
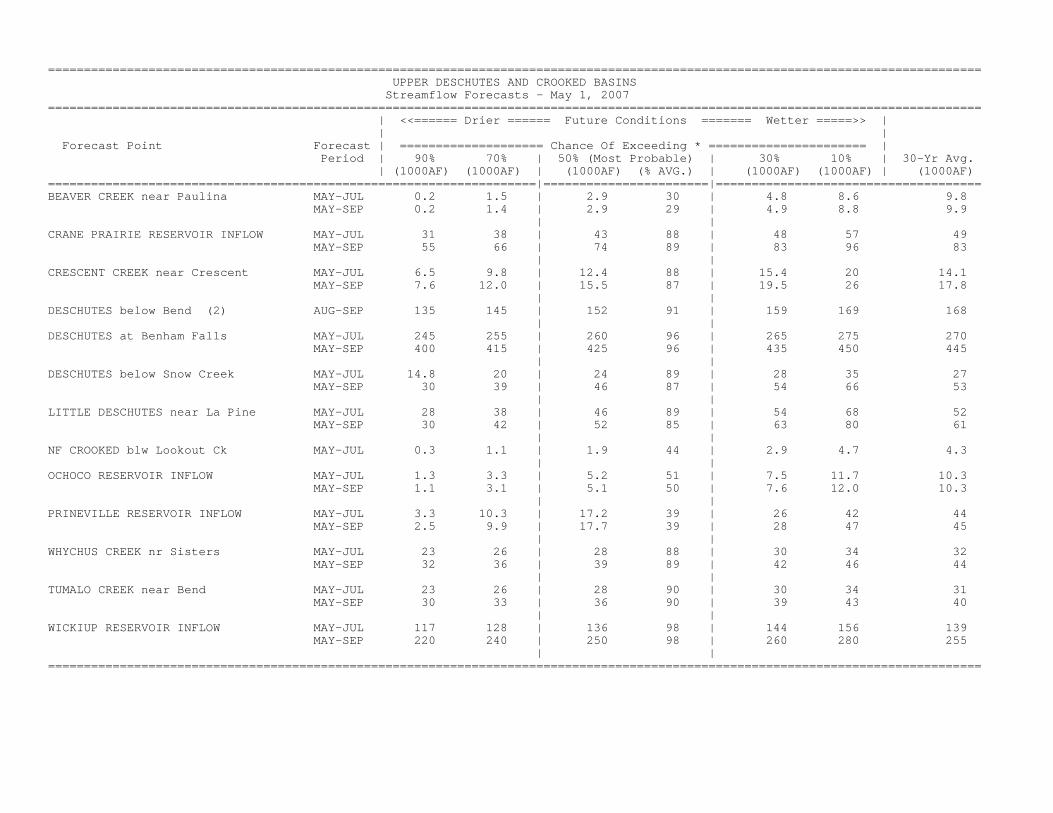
================================================================================================================================== UPPER DESCHUTES AND CROOKED BASINS Streamflow Forecasts - May 1, 2007 ================================================================================================================================== | <<====== Drier ====== Future Conditions ======= Wetter =====>> | | | Forecast Point Forecast | ==================== Chance Of Exceeding * ====================== | Period | 90% 70% | 50% (Most Probable) | 30% 10% | 30-Yr Avg. | (1000AF) (1000AF) | (1000AF) (% AVG.) | (1000AF) (1000AF) | (1000AF) ====================================================================|=======================|===================================== BEAVER CREEK near Paulina MAY-JUL 0.2 1.5 | 2.9 30 | 4.8 8.6 9.8 MAY-SEP 0.2 1.4 | 2.9 29 | 4.9 8.8 9.9 | | CRANE PRAIRIE RESERVOIR INFLOW MAY-JUL 31 38 | 43 88 | 48 57 49 MAY-SEP 55 66 | 74 89 | 83 96 83 | | CRESCENT CREEK near Crescent MAY-JUL 6.5 9.8 | 12.4 88 | 15.4 20 14.1 MAY-SEP 7.6 12.0 | 15.5 87 | 19.5 26 17.8 | | DESCHUTES below Bend (2) AUG-SEP 135 145 | 152 91 | 159 169 168 | | DESCHUTES at Benham Falls MAY-JUL 245 255 | 260 96 | 265 275 270 MAY-SEP 400 415 | 425 96 | 435 450 445 | | DESCHUTES below Snow Creek MAY-JUL 14.8 20 | 24 89 | 28 35 27 MAY-SEP 30 39 | 46 87 | 54 66 53 | | LITTLE DESCHUTES near La Pine MAY-JUL 28 38 | 46 89 | 54 68 52 MAY-SEP 30 42 | 52 85 | 63 80 61 | | NF CROOKED blw Lookout Ck MAY-JUL 0.3 1.1 | 1.9 44 | 2.9 4.7 4.3 | | OCHOCO RESERVOIR INFLOW MAY-JUL 1.3 3.3 | 5.2 51 | 7.5 11.7 10.3 MAY-SEP 1.1 3.1 | 5.1 50 | 7.6 12.0 10.3 | | PRINEVILLE RESERVOIR INFLOW MAY-JUL 3.3 10.3 | 17.2 39 | 26 42 44 MAY-SEP 2.5 9.9 | 17.7 39 | 28 47 45 | | WHYCHUS CREEK nr Sisters MAY-JUL 23 26 | 28 88 | 30 34 32 MAY-SEP 32 36 | 39 89 | 42 46 44 | | TUMALO CREEK near Bend MAY-JUL 23 26 | 28 90 | 30 34 31 MAY-SEP 30 33 | 36 90 | 39 43 40 | | WICKIUP RESERVOIR INFLOW MAY-JUL 117 128 | 136 98 | 144 156 139 MAY-SEP 220 240 | 250 98 | 260 280 255 | | ==================================================================================================================================
================================================================================================================================== UPPER DESCHUTES AND CROOKED BASINS | UPPER DESCHUTES AND CROOKED BASINS Reservoir Storage (1000 AF) - End of April | Watershed Snowpack Analysis - May 1, 2007 ================================================================================================================================== Usable | *** Usable Storage *** | Number This Year as % of Reservoir Capacity| This Last | Watershed of ================= | Year Year Avg | Data Sites Last Yr Average ========================================================================|========================================================= CRANE PRAIRIE 55.3 53.6 41.3 44.9 | Crooked, Ochoco 4 0 0 | CRESCENT LAKE 86.9 49.1 23.9 55.5 | Deschutes above Wickiup 3 68 80 | OCHOCO 47.5 42.9 39.6 36.0 | Little Deschutes 4 71 92 | PRINEVILLE 153.0 149.3 134.8 145.0 | Tumalo and Squaw Creeks 4 47 63 | WICKIUP 200.0 191.3 194.1 188.5 | | ================================================================================================================================== * 90%, 70%, 30%, and 10% chances of exceeding are the probabilities that the actual flow will exceed the volumes in the table. (1) - The values listed under the 10% and 90% Chance of Exceeding are actually 5% and 95% exceedance levels. (2) - The value is natural flow - actual flow may be affected by upstream water management.
For m ce Office: ore information contact your local Natural Resources Conservation ServiThe Dalles (541) 296-6178
Or visit: http://www.wcc.nrcs.usda.gov/cgibin/bor.pl
-15-
Mountain Snowpack(percent of normal)
0
50
100
150
200
250
300
Jan Feb Mar Apr May
Current AverageMaximum Minimum
Hood, Mile Creeks, and Lower Deschutes Basins
May 1, 2007
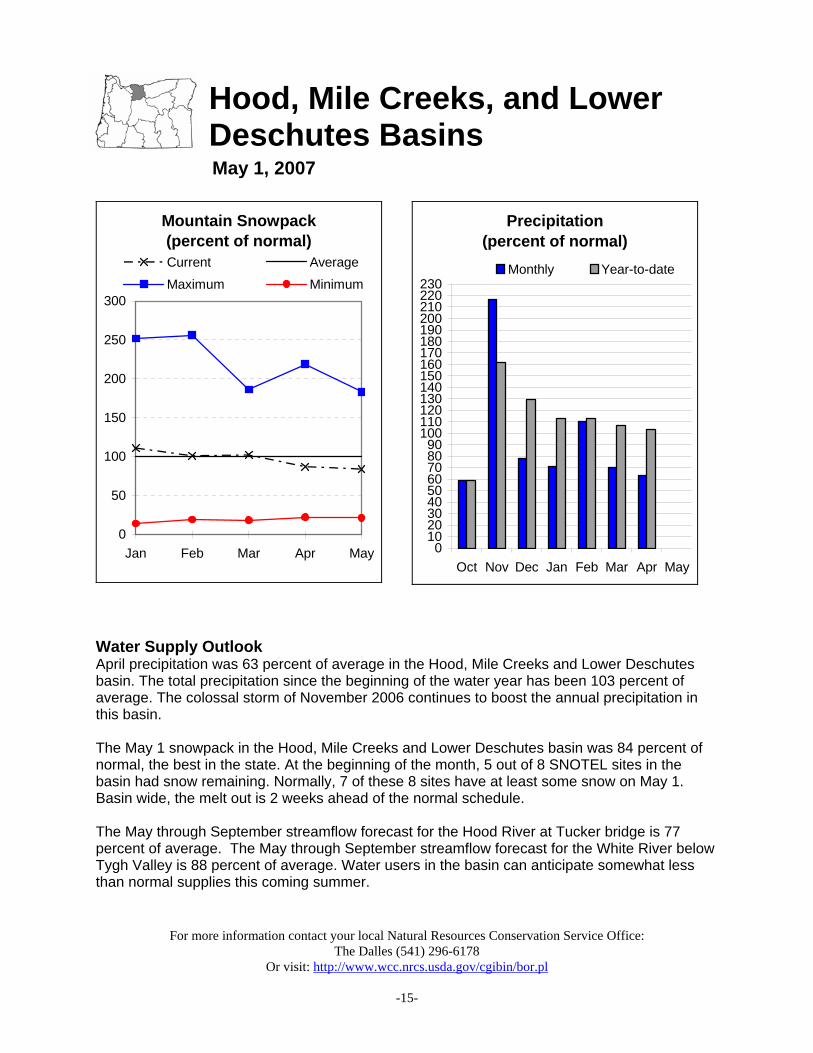
Water Supply Outlook April precipitation was 63 percent of average in the Hood, Mile Creeks and Lower Deschutes basin. The total precipitation since the beginning of the water year has been 103 percent of average. The colossal storm of November 2006 continues to boost the annual precipitation in this basin. The May 1 snowpack in the Hood, Mile Creeks and Lower Deschutes basin was 84 percent of normal, the best in the state. At the beginning of the month, 5 out of 8 SNOTEL sites in the basin had snow remaining. Normally, 7 of these 8 sites have at least some snow on May 1. Basin wide, the melt out is 2 weeks ahead of the normal schedule. The May through September streamflow forecast for the Hood River at Tucker bridge is 77 percent of average. The May through September streamflow forecast for the White River below Tygh Valley is 88 percent of average. Water users in the basin can anticipate somewhat less than normal supplies this coming summer.
Precipitation(percent of normal)
0102030405060708090
100110120130140150160170180190200210220230
Oct Nov Dec Jan Feb Mar Apr May
Monthly Year-to-date

================================================================================================================================== HOOD, MILE CREEKS AND LOWER DESCHUTES BASINS Streamflow Forecasts - May 1, 2007 ================================================================================================================================== | <<====== Drier ====== Future Conditions ======= Wetter =====>> | | | Forecast Point Forecast | ==================== Chance Of Exceeding * ====================== | Period | 90% 70% | 50% (Most Probable) | 30% 10% | 30-Yr Avg. | (1000AF) (1000AF) | (1000AF) (% AVG.) | (1000AF) (1000AF) | (1000AF) ====================================================================|=======================|===================================== HOOD at Tucker Bridge MAY-JUL 91 105 | 115 75 | 125 139 153 MAY-SEP 121 138 | 150 77 | 162 179 196 | | WF HOOD near Dee MAY-JUL 49 58 | 64 81 | 70 79 79 MAY-SEP 64 75 | 82 83 | 89 100 99 | | WHITE below Tygh Valley MAY-JUL 50 58 | 63 88 | 69 78 72 MAY-SEP 62 70 | 76 88 | 82 91 86 | | ================================================================================================================================== HOOD, MILE CREEKS AND LOWER DESCHUTES BASINS | HOOD, MILE CREEKS AND LOWER DESCHUTES BASINS Reservoir Storage (1000 AF) - End of April | Watershed Snowpack Analysis - May 1, 2007 ================================================================================================================================== Usable | *** Usable Storage *** | Number This Year as % of Reservoir Capacity| This Last | Watershed of ================= | Year Year Avg | Data Sites Last Yr Average ========================================================================|========================================================= CLEAR LAKE (WASCO) 11.9 5.9 3.6 5.2 | Hood River 6 72 80 | | Mile Creeks 0 0 0 | | White River 3 68 73 | ================================================================================================================================== * 90%, 70%, 30%, and 10% chances of exceeding are the probabilities that the actual flow will exceed the volumes in the table. (1) - The values listed under the 10% and 90% Chance of Exceeding are actually 5% and 95% exceedance levels. (2) - The value is natural flow - actual flow may be affected by upstream water management.
on Service Office: For more information contact your local Natural Resources ConservatiOregon City - (503) 656-3499
Or visit: http://www.wcc.nrcs.usda.gov/cgibin/bor.pl
-17-
Mountain Snowpack(percent of normal)
0
50
100
150
200
250
Jan Feb Mar Apr May
Current Average
Maximum Minimum
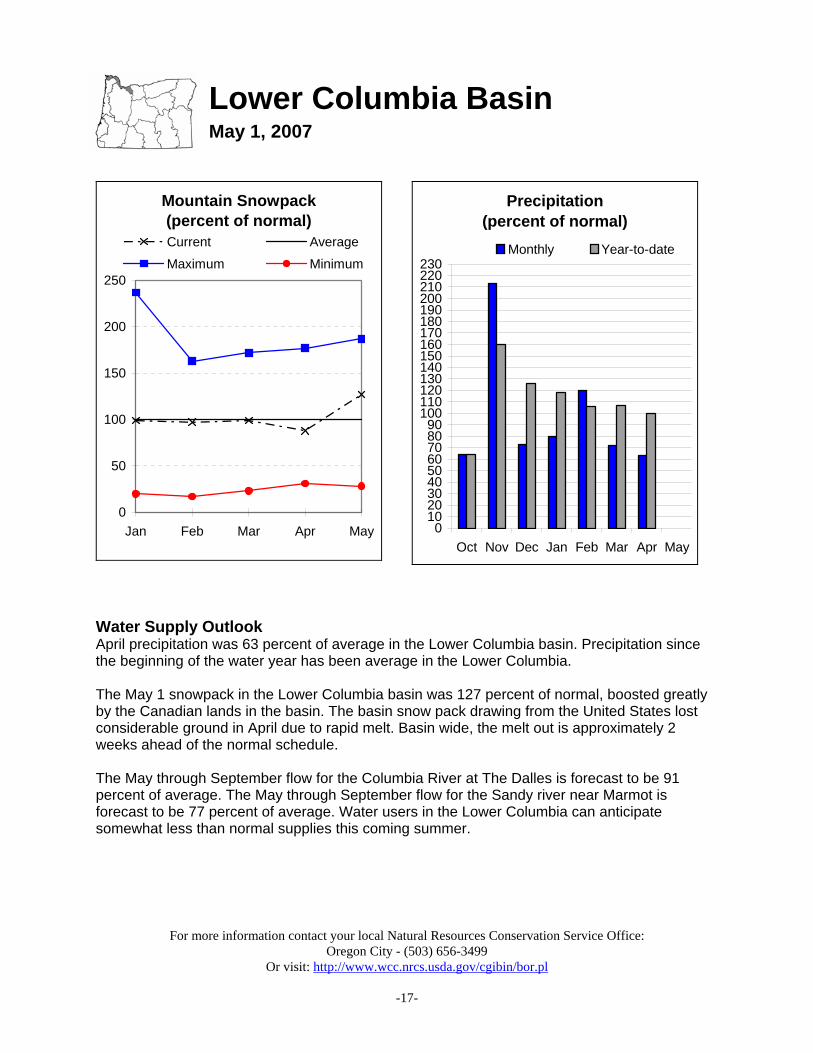
Lower Columbia Basin May 1, 2007
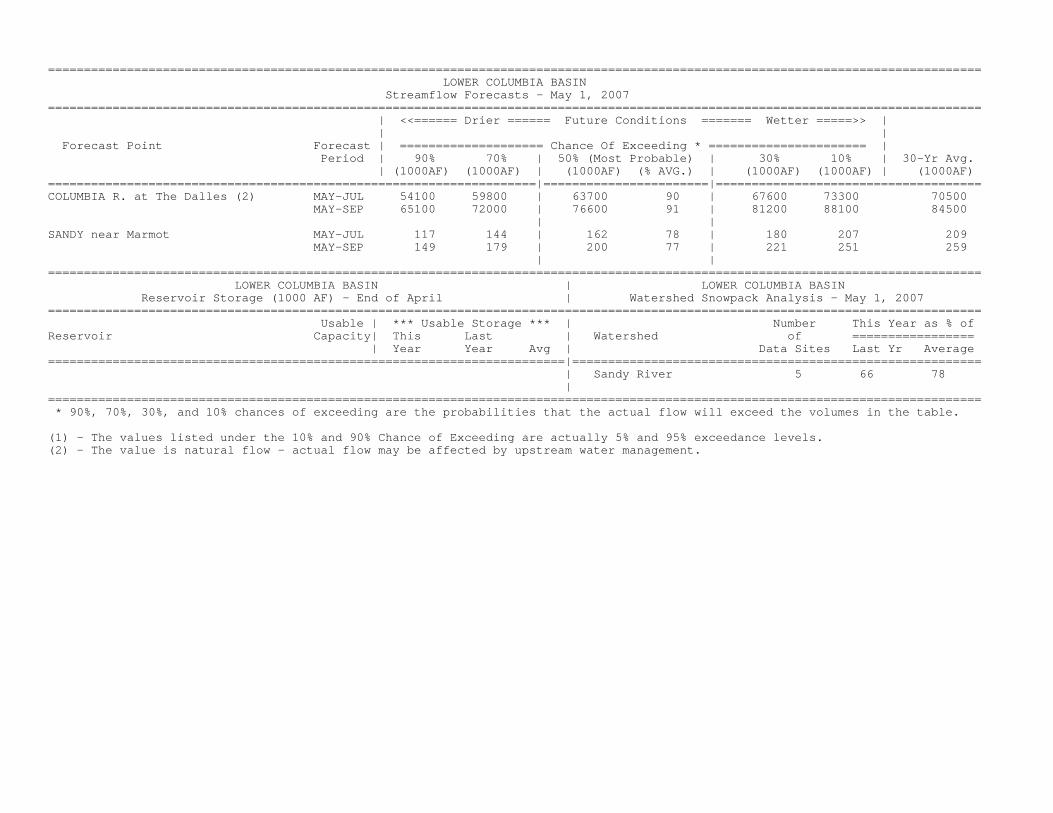
Water Supply Outlook April precipitation was 63 percent of average in the Lower Columbia basin. Precipitation since the beginning of the water year has been average in the Lower Columbia. The May 1 snowpack in the Lower Columbia basin was 127 percent of normal, boosted greatly by the Canadian lands in the basin. The basin snow pack drawing from the United States lost considerable ground in April due to rapid melt. Basin wide, the melt out is approximately 2 weeks ahead of the normal schedule. The May through September flow for the Columbia River at The Dalles is forecast to be 91 percent of average. The May through September flow for the Sandy river near Marmot is forecast to be 77 percent of average. Water users in the Lower Columbia can anticipate somewhat less than normal supplies this coming summer.
Precipitation(percent of normal)
0102030405060708090
100110120130140150160170180190200210220230
Oct Nov Dec Jan Feb Mar Apr May
Monthly Year-to-date
================================================================================================================================== LOWER COLUMBIA BASIN Streamflow Forecasts - May 1, 2007 ================================================================================================================================== | <<====== Drier ====== Future Conditions ======= Wetter =====>> | | | Forecast Point Forecast | ==================== Chance Of Exceeding * ====================== | Period | 90% 70% | 50% (Most Probable) | 30% 10% | 30-Yr Avg. | (1000AF) (1000AF) | (1000AF) (% AVG.) | (1000AF) (1000AF) | (1000AF) ====================================================================|=======================|===================================== COLUMBIA R. at The Dalles (2) MAY-JUL 54100 59800 | 63700 90 | 67600 73300 70500 MAY-SEP 65100 72000 | 76600 91 | 81200 88100 84500 | | SANDY near Marmot MAY-JUL 117 144 | 162 78 | 180 207 209 MAY-SEP 149 179 | 200 77 | 221 251 259 | | ================================================================================================================================== LOWER COLUMBIA BASIN | LOWER COLUMBIA BASIN Reservoir Storage (1000 AF) - End of April | Watershed Snowpack Analysis - May 1, 2007 ================================================================================================================================== Usable | *** Usable Storage *** | Number This Year as % of Reservoir Capacity| This Last | Watershed of ================= | Year Year Avg | Data Sites Last Yr Average ========================================================================|========================================================= | Sandy River 5 66 78 | ================================================================================================================================== * 90%, 70%, 30%, and 10% chances of exceeding are the probabilities that the actual flow will exceed the volumes in the table. (1) - The values listed under the 10% and 90% Chance of Exceeding are actually 5% and 95% exceedance levels. (2) - The value is natural flow - actual flow may be affected by upstream water management.
on Service Office: Portland - (503) 231-2270; Tangent - (541) 967-5925; Oregon City - (503) 656-3499; Hillsboro - (503) 648-3174; McMinnville - (503) 472-1474
Salem - (503) 399-5746; Dallas - (503) 623-5534 Or visit: http://www.wcc.nrcs.usda.gov/cgibin/bor.pl
For more information contact your local Natural Resources Conservati Eugene - (541) 465-6436;
-19-
Mountain Snowpack(percent of normal)
0
50
100
150
200
250
Jan Feb Mar Apr May
Current AverageMaximum Minimum
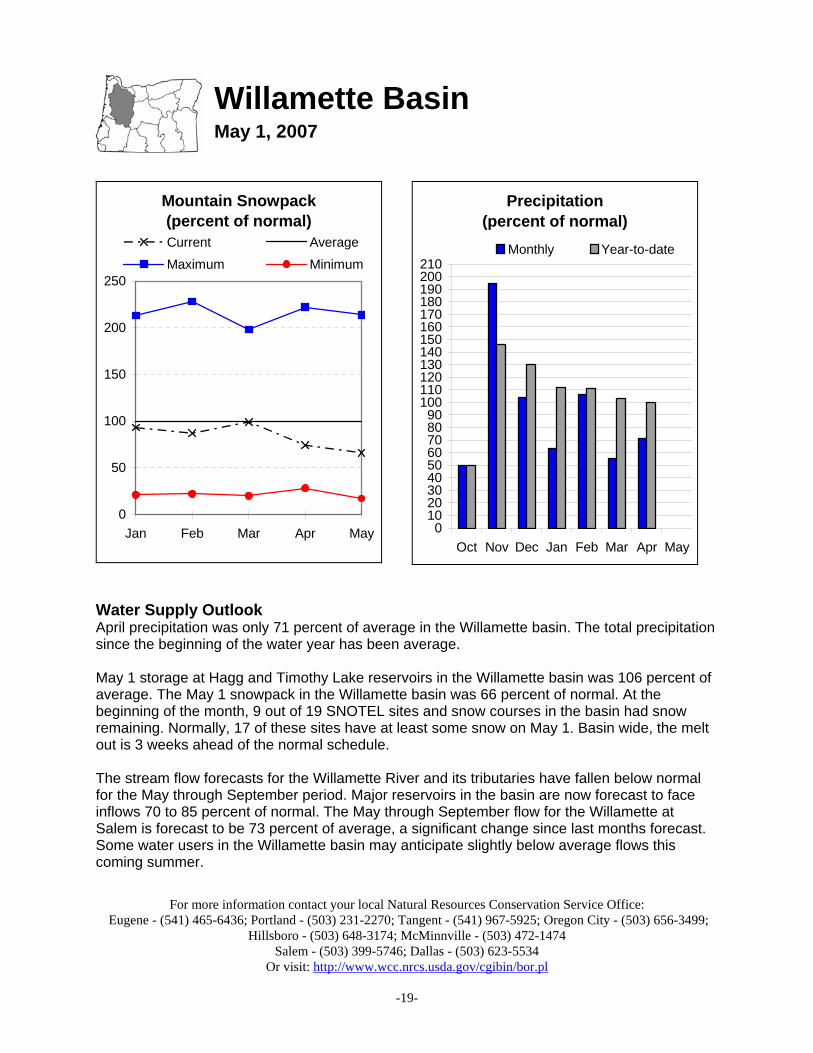
Willamette Basin May 1, 2007
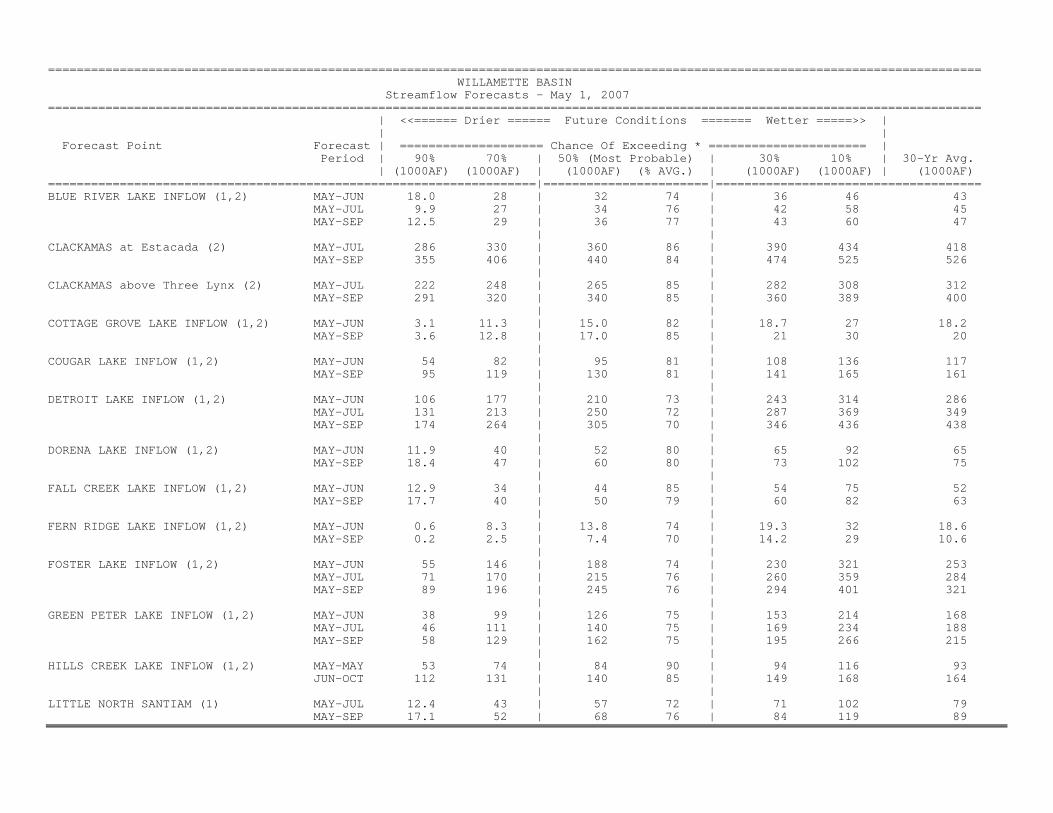
Water Supply Outlook April precipitation was only 71 percent of average in the Willamette basin. The total precipitation since the beginning of the water year has been average. May 1 storage at Hagg and Timothy Lake reservoirs in the Willamette basin was 106 percent of average. The May 1 snowpack in the Willamette basin was 66 percent of normal. At the beginning of the month, 9 out of 19 SNOTEL sites and snow courses in the basin had snow remaining. Normally, 17 of these sites have at least some snow on May 1. Basin wide, the melt out is 3 weeks ahead of the normal schedule. The stream flow forecasts for the Willamette River and its tributaries have fallen below normal for the May through September period. Major reservoirs in the basin are now forecast to face inflows 70 to 85 percent of normal. The May through September flow for the Willamette at Salem is forecast to be 73 percent of average, a significant change since last months forecast. Some water users in the Willamette basin may anticipate slightly below average flows this coming summer.
Precipitation(percent of normal)
0102030405060708090
100110120130140150160170180190200210
Oct Nov Dec Jan Feb Mar Apr May
Monthly Year-to-date
================================================================================================================================== WILLAMETTE BASIN Streamflow Forecasts - May 1, 2007 ================================================================================================================================== | <<====== Drier ====== Future Conditions ======= Wetter =====>> | | | Forecast Point Forecast | ==================== Chance Of Exceeding * ====================== | Period | 90% 70% | 50% (Most Probable) | 30% 10% | 30-Yr Avg. | (1000AF) (1000AF) | (1000AF) (% AVG.) | (1000AF) (1000AF) | (1000AF) ====================================================================|=======================|===================================== BLUE RIVER LAKE INFLOW (1,2) MAY-JUN 18.0 28 | 32 74 | 36 46 43 MAY-JUL 9.9 27 | 34 76 | 42 58 45 MAY-SEP 12.5 29 | 36 77 | 43 60 47 | | CLACKAMAS at Estacada (2) MAY-JUL 286 330 | 360 86 | 390 434 418 MAY-SEP 355 406 | 440 84 | 474 525 526 | | CLACKAMAS above Three Lynx (2) MAY-JUL 222 248 | 265 85 | 282 308 312 MAY-SEP 291 320 | 340 85 | 360 389 400 | | COTTAGE GROVE LAKE INFLOW (1,2) MAY-JUN 3.1 11.3 | 15.0 82 | 18.7 27 18.2 MAY-SEP 3.6 12.8 | 17.0 85 | 21 30 20 | | COUGAR LAKE INFLOW (1,2) MAY-JUN 54 82 | 95 81 | 108 136 117 MAY-SEP 95 119 | 130 81 | 141 165 161 | | DETROIT LAKE INFLOW (1,2) MAY-JUN 106 177 | 210 73 | 243 314 286 MAY-JUL 131 213 | 250 72 | 287 369 349 MAY-SEP 174 264 | 305 70 | 346 436 438 | | DORENA LAKE INFLOW (1,2) MAY-JUN 11.9 40 | 52 80 | 65 92 65 MAY-SEP 18.4 47 | 60 80 | 73 102 75 | | FALL CREEK LAKE INFLOW (1,2) MAY-JUN 12.9 34 | 44 85 | 54 75 52 MAY-SEP 17.7 40 | 50 79 | 60 82 63 | | FERN RIDGE LAKE INFLOW (1,2) MAY-JUN 0.6 8.3 | 13.8 74 | 19.3 32 18.6 MAY-SEP 0.2 2.5 | 7.4 70 | 14.2 29 10.6 | | FOSTER LAKE INFLOW (1,2) MAY-JUN 55 146 | 188 74 | 230 321 253 MAY-JUL 71 170 | 215 76 | 260 359 284 MAY-SEP 89 196 | 245 76 | 294 401 321 | | GREEN PETER LAKE INFLOW (1,2) MAY-JUN 38 99 | 126 75 | 153 214 168 MAY-JUL 46 111 | 140 75 | 169 234 188 MAY-SEP 58 129 | 162 75 | 195 266 215 | | HILLS CREEK LAKE INFLOW (1,2) MAY-MAY 53 74 | 84 90 | 94 116 93 JUN-OCT 112 131 | 140 85 | 149 168 164 | | LITTLE NORTH SANTIAM (1) MAY-JUL 12.4 43 | 57 72 | 71 102 79 MAY-SEP 17.1 52 | 68 76 | 84 119 89

================================================================================================================================== WILLAMETTE BASIN Streamflow Forecasts - May 1, 2007 ================================================================================================================================== | <<====== Drier ====== Future Conditions ======= Wetter =====>> | | | Forecast Point Forecast | ==================== Chance Of Exceeding * ====================== | Period | 90% 70% | 50% (Most Probable) | 30% 10% | 30-Yr Avg. | (1000AF) (1000AF) | (1000AF) (% AVG.) | (1000AF) (1000AF) | (1000AF) ====================================================================|=======================|===================================== LOOKOUT POINT LAKE INFLOW (1,2) MAY-MAY 135 194 | 220 89 | 246 305 246 JUN-OCT 261 329 | 360 90 | 391 459 402 | | McKENZIE below Trail Bridge (2) MAY-JUL 129 141 | 150 78 | 159 171 193 MAY-SEP 198 214 | 225 81 | 236 252 279 | | McKENZIE near Vida (1,2) MAY-JUL 359 456 | 500 75 | 544 641 663 MAY-SEP 546 652 | 700 79 | 748 854 888 | | MOHAWK near Springfield MAY-JUL 7.5 22 | 31 74 | 41 55 42 | | OAK GROVE FORK above Power Intake MAY-JUL 63 71 | 76 84 | 81 89 90 MAY-SEP 93 103 | 110 87 | 117 127 127 | | NORTH SANTIAM at Mehama (1,2) MAY-JUL 152 281 | 340 72 | 399 528 470 MAY-SEP 223 365 | 430 75 | 495 637 572 | | SOUTH SANTIAM at Waterloo (2) MAY-JUL 110 185 | 235 75 | 285 360 314 MAY-SEP 127 206 | 260 74 | 314 393 353 | | SCOGGINS CREEK near Gaston (2) MAY-JUL 1.1 2.7 | 3.8 70 | 4.9 6.5 5.4 | | THOMAS CREEK near Scio MAY-JUL 7.3 19.6 | 28 72 | 36 49 39 | | MF WILLAMETTE below NF (1,2) JUN-OCT 280 328 | 350 90 | 372 420 391 MAY-MAY 143 189 | 210 90 | 231 277 234 | | WILLAMETTE at Salem (1,2) MAY-JUL 951 1590 | 1880 73 | 2170 2809 2578 MAY-SEP 1193 1899 | 2220 73 | 2541 3247 3036 | | ================================================================================================================================== * 90%, 70%, 30%, and 10% chances of exceeding are the probabilities that the actual flow will exceed the volumes in the table. (1) - The values listed under the 10% and 90% Chance of Exceeding are actually 5% and 95% exceedance levels. (2) - The value is natural flow - actual flow may be affected by upstream water management.
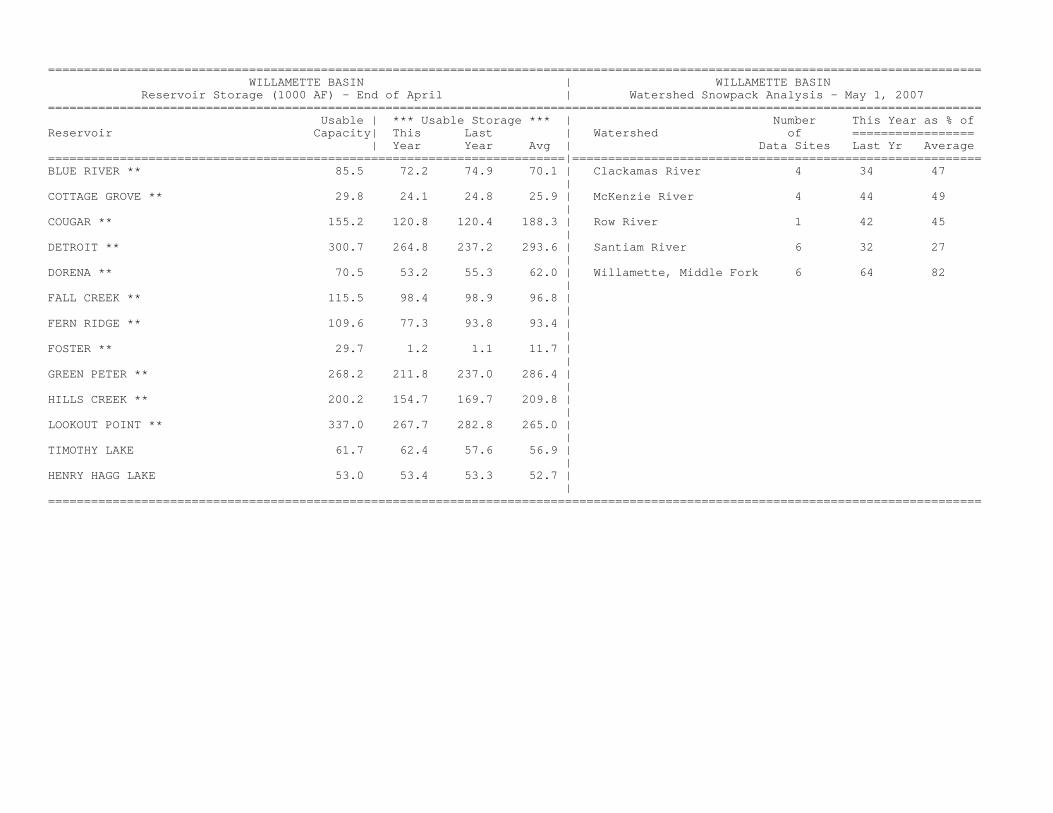
================================================================================================================================== WILLAMETTE BASIN | WILLAMETTE BASIN Reservoir Storage (1000 AF) - End of April | Watershed Snowpack Analysis - May 1, 2007 ================================================================================================================================== Usable | *** Usable Storage *** | Number This Year as % of Reservoir Capacity| This Last | Watershed of ================= | Year Year Avg | Data Sites Last Yr Average ========================================================================|========================================================= BLUE RIVER ** 85.5 72.2 74.9 70.1 | Clackamas River 4 34 47 | COTTAGE GROVE ** 29.8 24.1 24.8 25.9 | McKenzie River 4 44 49 | COUGAR ** 155.2 120.8 120.4 188.3 | Row River 1 42 45 | DETROIT ** 300.7 264.8 237.2 293.6 | Santiam River 6 32 27 | DORENA ** 70.5 53.2 55.3 62.0 | Willamette, Middle Fork 6 64 82 | FALL CREEK ** 115.5 98.4 98.9 96.8 | | FERN RIDGE ** 109.6 77.3 93.8 93.4 | | FOSTER ** 29.7 1.2 1.1 11.7 | | GREEN PETER ** 268.2 211.8 237.0 286.4 | | HILLS CREEK ** 200.2 154.7 169.7 209.8 | | LOOKOUT POINT ** 337.0 267.7 282.8 265.0 | | TIMOTHY LAKE 61.7 62.4 57.6 56.9 | | HENRY HAGG LAKE 53.0 53.4 53.3 52.7 | | ==================================================================================================================================
on Service Office: For more information contact your local Natural Resources ConservatiRoseburg - (541) 673-8316; Medford - (541) 776-4267 Or visit: http://www.wcc.nrcs.usda.gov/cgibin/bor.pl
-23-
Mountain Snowpack(percent of normal)
0
50
100
150
200
250
Jan Feb Mar Apr May
Current AverageMaximum Minimum
Rogue and Umpqua Basins May 1, 2007
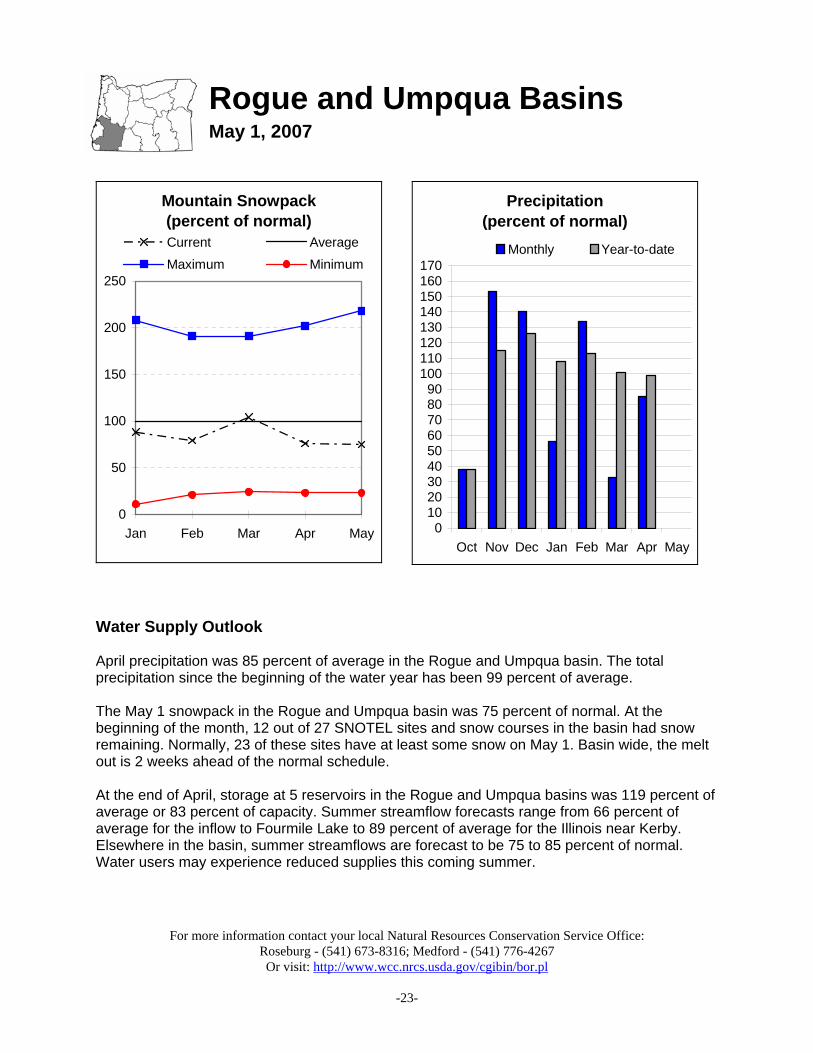
Water Supply Outlook April precipitation was 85 percent of average in the Rogue and Umpqua basin. The total precipitation since the beginning of the water year has been 99 percent of average. The May 1 snowpack in the Rogue and Umpqua basin was 75 percent of normal. At the beginning of the month, 12 out of 27 SNOTEL sites and snow courses in the basin had snow remaining. Normally, 23 of these sites have at least some snow on May 1. Basin wide, the melt out is 2 weeks ahead of the normal schedule. At the end of April, storage at 5 reservoirs in the Rogue and Umpqua basins was 119 percent of average or 83 percent of capacity. Summer streamflow forecasts range from 66 percent of average for the inflow to Fourmile Lake to 89 percent of average for the Illinois near Kerby. Elsewhere in the basin, summer streamflows are forecast to be 75 to 85 percent of normal. Water users may experience reduced supplies this coming summer.
Precipitation(percent of normal)
0102030405060708090
100110120130140150160170
Oct Nov Dec Jan Feb Mar Apr May
Monthly Year-to-date

================================================================================================================================== ROGUE AND UMPQUA BASINS Streamflow Forecasts - May 1, 2007 ================================================================================================================================== | <<====== Drier ====== Future Conditions ======= Wetter =====>> | | | Forecast Point Forecast | ==================== Chance Of Exceeding * ====================== | Period | 90% 70% | 50% (Most Probable) | 30% 10% | 30-Yr Avg. | (1000AF) (1000AF) | (1000AF) (% AVG.) | (1000AF) (1000AF) | (1000AF) ====================================================================|=======================|===================================== APPLEGATE LAKE Net Inflow (2) MAY-JUL 35 50 | 60 83 | 70 85 72 MAY-SEP 40 56 | 66 85 | 76 92 78 SF BIG BUTTE CK nr Butte Falls MAY-JUL 11.1 14.6 | 17.0 77 | 19.4 23 22 CLEARWATER above Trap Creek (2) MAY-SEP 37 39 | 41 73 | 43 46 56 COW CREEK near Azalea MAY-JUL 2.0 3.9 | 5.1 65 | 6.3 8.2 7.9 MAY-SEP 3.2 5.0 | 6.3 69 | 7.6 9.4 9.1 FOURMILE LAKE net Inflow (2) APR-JUL 1.4 2.8 | 3.8 66 | 4.8 6.2 5.8 MAY-SEP 2.1 3.4 | 4.2 66 | 5.0 6.3 6.4 GRAVE CREEK at Pease Bridge MAY-JUL 1.5 2.1 | 2.6 84 | 3.1 3.8 3.1 HYATT PRAIRIE RES net Inflow (2) MAY-JUL 0.5 1.1 | 1.6 67 | 2.0 2.7 2.4 ILLINOIS R near Kerby MAY-JUL 30 57 | 75 90 | 93 121 83 MAY-SEP 33 61 | 80 89 | 99 127 90 NF LITTLE BUTTE CK nr Lakecreek (2) MAY-JUL 0.8 3.3 | 5.0 73 | 6.7 9.2 6.9 MAY-SEP 1.5 5.5 | 8.2 75 | 10.9 14.9 10.9 SF LITTLE BUTTE CK nr Lakecreek (2) MAY-JUL 6.9 9.9 | 12.0 74 | 14.1 17.1 16.2 LOST CREEK LAKE INFLOW (2) MAY-JUL 234 261 | 280 74 | 299 326 380 MAY-SEP 332 366 | 390 77 | 414 448 510 RED BLANKET CK nr Prospect MAY-JUL 12.3 16.9 | 20 77 | 23 28 26 ROGUE above Prospect MAY-JUL 102 121 | 134 77 | 147 166 174 MAY-SEP 143 165 | 180 78 | 195 217 230 SF ROGUE near Prospect (2) MAY-JUL 20 27 | 31 74 | 35 42 42 MAY-SEP 29 37 | 42 78 | 47 55 54 ROGUE R at Raygold (2) MAY-JUL 335 374 | 400 83 | 426 465 480 MAY-SEP 447 490 | 520 81 | 550 593 645 ROGUE R at Grants Pass (2) MAY-JUL 307 356 | 390 83 | 424 473 470 MAY-SEP 422 477 | 515 84 | 553 608 615 SUCKER CK blw Little Grayback MAY-JUL 14.2 21 | 26 84 | 31 38 31 MAY-SEP 17.5 25 | 30 86 | 35 43 35 NORTH UMPQUA nr Toketee Falls (2) MAY-SEP 85 94 | 101 75 | 108 117 135 NORTH UMPQUA at Winchester MAY-JUL 285 347 | 390 80 | 433 495 490 SOUTH UMPQUA near Brockway MAY-JUL 50 104 | 140 73 | 176 230 191 SOUTH UMPQUA at Tiller MAY-JUL 40 63 | 78 74 | 93 116 106 MAY-SEP 47 71 | 87 75 | 103 127 116 ================================================================================================================================== * 90%, 70%, 30%, and 10% chances of exceeding are the probabilities that the actual flow will exceed the volumes in the table. (1) - The values listed under the 10% and 90% Chance of Exceeding are actually 5% and 95% exceedance levels. (2) - The value is natural flow - actual flow may be affected by upstream water management.
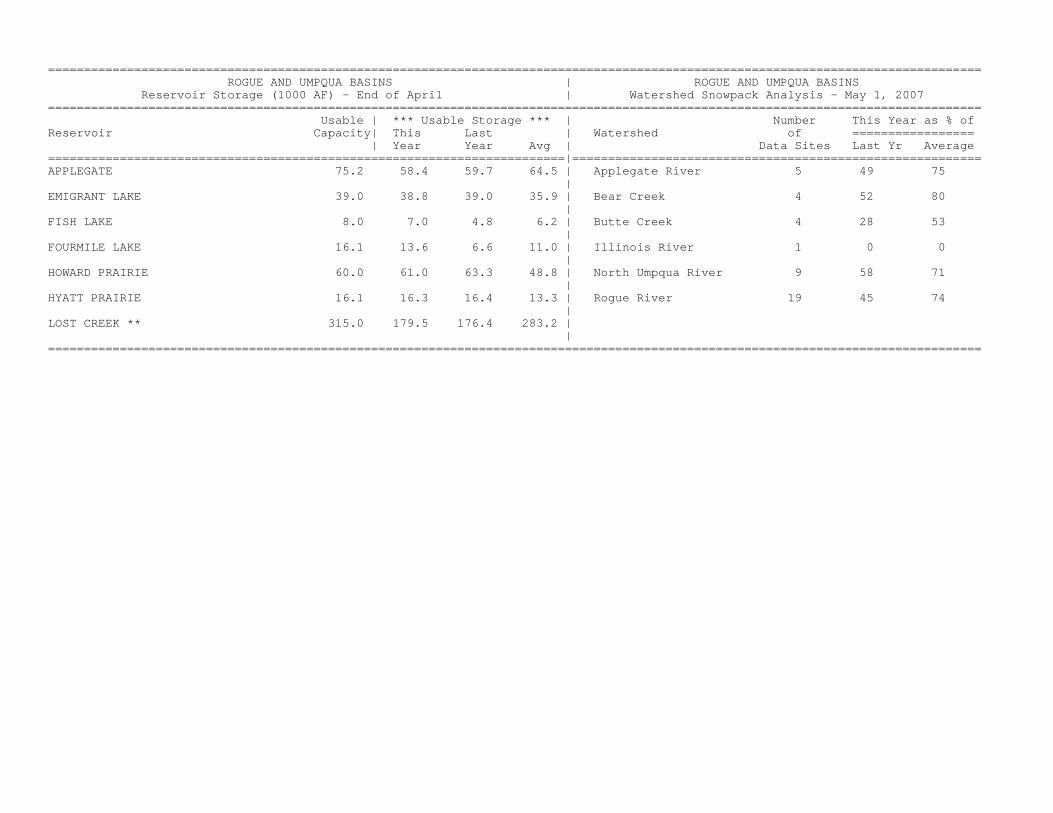
================================================================================================================================== ROGUE AND UMPQUA BASINS | ROGUE AND UMPQUA BASINS Reservoir Storage (1000 AF) - End of April | Watershed Snowpack Analysis - May 1, 2007 ================================================================================================================================== Usable | *** Usable Storage *** | Number This Year as % of Reservoir Capacity| This Last | Watershed of ================= | Year Year Avg | Data Sites Last Yr Average ========================================================================|========================================================= APPLEGATE 75.2 58.4 59.7 64.5 | Applegate River 5 49 75 | EMIGRANT LAKE 39.0 38.8 39.0 35.9 | Bear Creek 4 52 80 | FISH LAKE 8.0 7.0 4.8 6.2 | Butte Creek 4 28 53 | FOURMILE LAKE 16.1 13.6 6.6 11.0 | Illinois River 1 0 0 | HOWARD PRAIRIE 60.0 61.0 63.3 48.8 | North Umpqua River 9 58 71 | HYATT PRAIRIE 16.1 16.3 16.4 13.3 | Rogue River 19 45 74 | LOST CREEK ** 315.0 179.5 176.4 283.2 | | ==================================================================================================================================

on Service Office: For more information contact your local Natural Resources Conservati Klamath Falls - (541) 883-6932
Or visit: http://www.wcc.nrcs.usda.gov/cgibin/bor.pl
-26-
Mountain Snowpack(percent of normal)
0
50
100
150
200
250
Jan Feb Mar Apr May
Current Average
Maximum Minimum
Klamath Basin May 1, 2007
Water Supply Outlook April precipitation was 80 percent of average in the Klamath basin. The total precipitation since the beginning of the water year has been 86 percent of average. The May 1 snowpack in the Klamath basin was 74 percent of normal. At the beginning of the month, 8 out of 17 SNOTEL sites and snow courses in the basin had snow remaining. Normally, 14 of these sites have at least some snow on May 1. Basin wide, the melt out is 2 weeks ahead of the normal schedule. At the end of April, the combined storage at Clear Lake (CA), Gerber Lake and Upper Klamath Lake was 90 percent of average and 65 percent of capacity. May through September streamflow forecasts range from 44 percent of average for Gerber reservoir net inflow to 72 percent of average net inflow to Upper Klamath Lake. The May through September streamflow forecast for the Sprague near Chiloquin is forecast to be 65 percent of average. Water users in the Klamath basin should plan for reduced supplies this coming irrigation season.
Precipitation(percent of normal)
0102030405060708090
100110120130140150160
Oct Nov Dec Jan Feb Mar Apr May
Monthly Year-to-date

================================================================================================================================== KLAMATH BASIN Streamflow Forecasts - May 1, 2007 ================================================================================================================================== | <<====== Drier ====== Future Conditions ======= Wetter =====>> | | | Forecast Point Forecast | ==================== Chance Of Exceeding * ====================== | Period | 90% 70% | 50% (Most Probable) | 30% 10% | 30-Yr Avg. | (1000AF) (1000AF) | (1000AF) (% AVG.) | (1000AF) (1000AF) | (1000AF) ====================================================================|=======================|===================================== CLEAR LAKE NET INFLOW (2) APR-SEP | 18.0 38 | 48 MAY-JUL 0.6 1.4 | 4.2 22 | 7.0 11.2 19.3 MAY-SEP 1.7 6.0 | 9.0 34 | 12.0 16.3 26 | | GERBER RESERVOIR Net Inflow (2) APR-SEP 0.2 0.3 | 3.0 17 | 5.7 9.6 17.8 MAY-JUL 0.1 0.2 | 2.0 31 | 3.8 6.4 6.4 MAY-SEP | 2.9 44 | 6.6 | | Sprague River near Chiloquin APR-SEP 118 149 | 170 74 | 191 222 230 MAY-JUL 49 76 | 95 74 | 114 141 128 MAY-SEP 53 81 | 100 65 | 119 147 155 | | UPPER KLAMATH LAKE NET INFLOW (1) APR-SEP 280 335 | 360 70 | 385 440 515 MAY-SEP 163 218 | 243 72 | 268 323 340 MAY-JUL 101 155 | 180 71 | 205 259 253 | | WILLIAMSON R near Chiloquin APR-SEP 227 253 | 270 70 | 287 313 385 MAY-JUL 98 123 | 140 69 | 157 182 203 MAY-SEP 144 169 | 186 70 | 203 228 267 | | ================================================================================================================================== KLAMATH BASIN | KLAMATH BASIN Reservoir Storage (1000 AF) - End of April | Watershed Snowpack Analysis - May 1, 2007 ================================================================================================================================== Usable | *** Usable Storage *** | Number This Year as % of Reservoir Capacity| This Last | Watershed of ================= | Year Year Avg | Data Sites Last Yr Average ========================================================================|========================================================= CLEAR LAKE (CALIF) 513.3 173.2 246.7 264.3 | Lost River 2 0 0 | GERBER 94.3 83.6 94.3 72.9 | Sprague River 5 14 29 | UPPER KLAMATH LAKE 523.7 483.7 480.0 483.4 | Upper Klamath Lake 12 42 71 | | Williamson River 5 53 82 | ================================================================================================================================== * 90%, 70%, 30%, and 10% chances of exceeding are the probabilities that the actual flow will exceed the volumes in the table. (1) - The values listed under the 10% and 90% Chance of Exceeding are actually 5% and 95% exceedance levels. (2) - The value is natural flow - actual flow may be affected by upstream water management.
on Service Office: For more information contact your local Natural Resources ConservatiLakeview - (541) 947-2202
Or visit: http://www.wcc.nrcs.usda.gov/cgibin/bor.pl
-28-
Mountain Snowpack(percent of normal)
0
50
100
150
200
250
300
350
Jan Feb Mar Apr May
Current AverageMaximum Minimum
Lake County and Goose Lake May 1, 2007
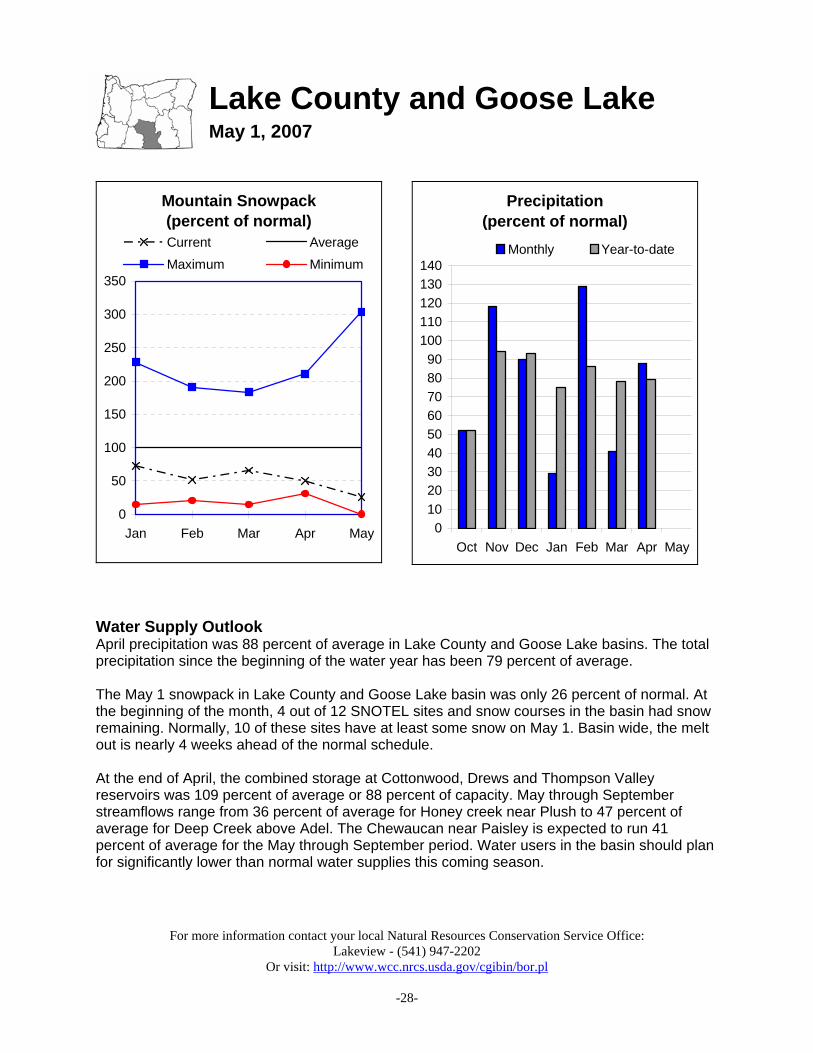
Water Supply Outlook April precipitation was 88 percent of average in Lake County and Goose Lake basins. The total precipitation since the beginning of the water year has been 79 percent of average. The May 1 snowpack in Lake County and Goose Lake basin was only 26 percent of normal. At the beginning of the month, 4 out of 12 SNOTEL sites and snow courses in the basin had snow remaining. Normally, 10 of these sites have at least some snow on May 1. Basin wide, the melt out is nearly 4 weeks ahead of the normal schedule. At the end of April, the combined storage at Cottonwood, Drews and Thompson Valley reservoirs was 109 percent of average or 88 percent of capacity. May through September streamflows range from 36 percent of average for Honey creek near Plush to 47 percent of average for Deep Creek above Adel. The Chewaucan near Paisley is expected to run 41 percent of average for the May through September period. Water users in the basin should plan for significantly lower than normal water supplies this coming season.
Precipitation(percent of normal)
0102030405060708090
100110120130140
Oct Nov Dec Jan Feb Mar Apr May
Monthly Year-to-date
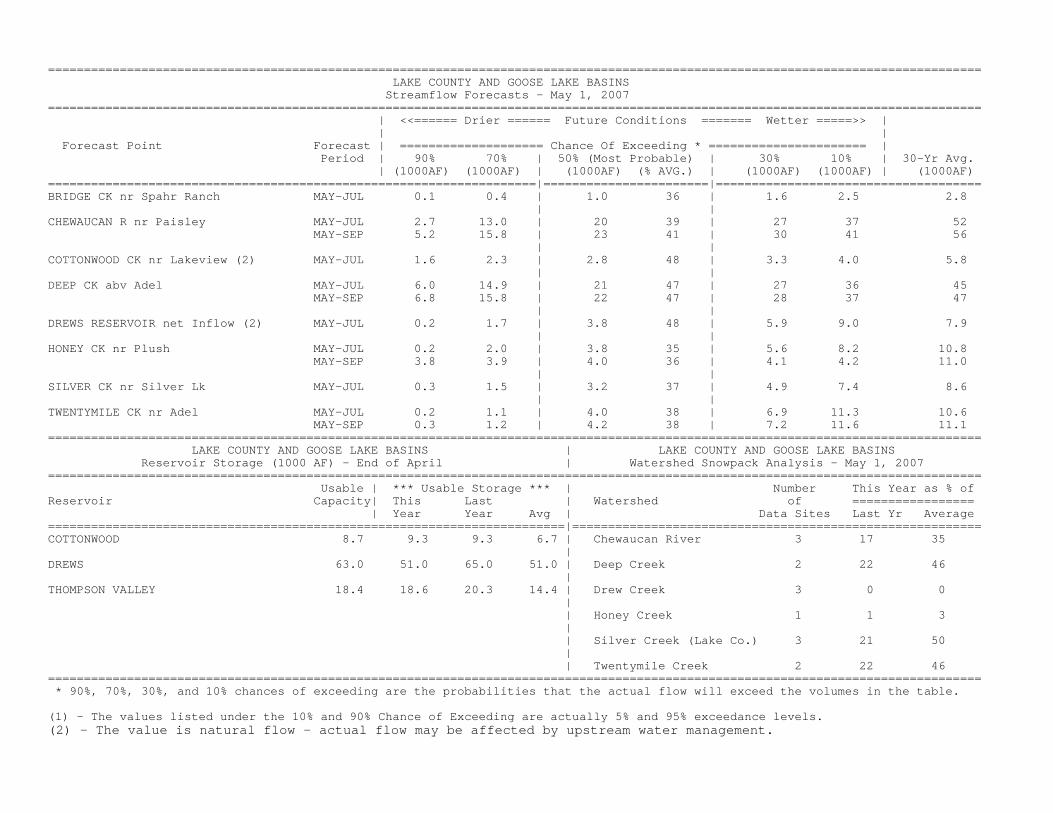
================================================================================================================================== LAKE COUNTY AND GOOSE LAKE BASINS Streamflow Forecasts - May 1, 2007 ================================================================================================================================== | <<====== Drier ====== Future Conditions ======= Wetter =====>> | | | Forecast Point Forecast | ==================== Chance Of Exceeding * ====================== | Period | 90% 70% | 50% (Most Probable) | 30% 10% | 30-Yr Avg. | (1000AF) (1000AF) | (1000AF) (% AVG.) | (1000AF) (1000AF) | (1000AF) ====================================================================|=======================|===================================== BRIDGE CK nr Spahr Ranch MAY-JUL 0.1 0.4 | 1.0 36 | 1.6 2.5 2.8 | | CHEWAUCAN R nr Paisley MAY-JUL 2.7 13.0 | 20 39 | 27 37 52 MAY-SEP 5.2 15.8 | 23 41 | 30 41 56 | | COTTONWOOD CK nr Lakeview (2) MAY-JUL 1.6 2.3 | 2.8 48 | 3.3 4.0 5.8 | | DEEP CK abv Adel MAY-JUL 6.0 14.9 | 21 47 | 27 36 45 MAY-SEP 6.8 15.8 | 22 47 | 28 37 47 | | DREWS RESERVOIR net Inflow (2) MAY-JUL 0.2 1.7 | 3.8 48 | 5.9 9.0 7.9 | | HONEY CK nr Plush MAY-JUL 0.2 2.0 | 3.8 35 | 5.6 8.2 10.8 MAY-SEP 3.8 3.9 | 4.0 36 | 4.1 4.2 11.0 | | SILVER CK nr Silver Lk MAY-JUL 0.3 1.5 | 3.2 37 | 4.9 7.4 8.6 | | TWENTYMILE CK nr Adel MAY-JUL 0.2 1.1 | 4.0 38 | 6.9 11.3 10.6 MAY-SEP 0.3 1.2 | 4.2 38 | 7.2 11.6 11.1 ================================================================================================================================== LAKE COUNTY AND GOOSE LAKE BASINS | LAKE COUNTY AND GOOSE LAKE BASINS Reservoir Storage (1000 AF) - End of April | Watershed Snowpack Analysis - May 1, 2007 ================================================================================================================================== Usable | *** Usable Storage *** | Number This Year as % of Reservoir Capacity| This Last | Watershed of ================= | Year Year Avg | Data Sites Last Yr Average ========================================================================|========================================================= COTTONWOOD 8.7 9.3 9.3 6.7 | Chewaucan River 3 17 35 | DREWS 63.0 51.0 65.0 51.0 | Deep Creek 2 22 46 | THOMPSON VALLEY 18.4 18.6 20.3 14.4 | Drew Creek 3 0 0 | | Honey Creek 1 1 3 | | Silver Creek (Lake Co.) 3 21 50 | | Twentymile Creek 2 22 46 ================================================================================================================================== * 90%, 70%, 30%, and 10% chances of exceeding are the probabilities that the actual flow will exceed the volumes in the table. (1) - The values listed under the 10% and 90% Chance of Exceeding are actually 5% and 95% exceedance levels. (2) - The value is natural flow - actual flow may be affected by upstream water management.

on Service Office: For more information contact your local Natural Resources Conservati Hines - (541) 573-6446
Or visit: http://www.wcc.nrcs.usda.gov/cgibin/bor.pl
-30-
Mountain Snowpack(percent of normal)
0
50
100
150
200
250
300
Jan Feb Mar Apr May
Current AverageMaximum Minimum
Harney Basin May 1, 2007
Water Supply Outlook April precipitation was slightly above average in the Harney basin at 117 percent of normal. This was the only area of the state that had above normal precipitation for the month. Since the beginning of the water year, total precipitation in the Harney basin has been 80 percent of average. The May 1 snowpack in the Harney basin was 51 percent of normal. At the beginning of the month, 2 out of 8 SNOTEL sites and snow courses in the basin had snow remaining. Normally, 7 of these sites have at least some snow on May 1. Basin wide, the melt out is nearly 3 weeks ahead of the normal schedule. The May through September streamflow for the Silvies river near Burns is forecast to be 42 percent of average. Trout Creek near Denio is forecast to be near 50 percent of average for the same period. The May through September flow for the Donner und Blitzen is forecast to be 57 percent of average. Water users in the Harney Basin should expect significantly reduced supplies this coming season.
Precipitation(percent of normal)
0102030405060708090
100110120130
Oct Nov Dec Jan Feb Mar Apr May
Monthly Year-to-date

================================================================================================================================== HARNEY BASIN Streamflow Forecasts - May 1, 2007 ================================================================================================================================== | <<====== Drier ====== Future Conditions ======= Wetter =====>> | | | Forecast Point Forecast | ==================== Chance Of Exceeding * ====================== | Period | 90% 70% | 50% (Most Probable) | 30% 10% | 30-Yr Avg. | (1000AF) (1000AF) | (1000AF) (% AVG.) | (1000AF) (1000AF) | (1000AF) ====================================================================|=======================|===================================== DONNER und BLITZEN R nr Frenchglen MAY-JUL 14.4 23 | 28 56 | 34 42 50 MAY-SEP 18.8 27 | 32 57 | 37 45 56 | | SILVER CK nr Riley MAY-JUL 0.2 1.9 | 3.0 44 | 4.1 5.8 6.8 | | SILVIES R nr Burns MAY-JUL 1.0 5.7 | 20 41 | 34 55 49 MAY-SEP 1.0 7.2 | 22 42 | 37 59 52 | | TROUT CK nr Denio MAY-JUL 0.3 2.1 | 3.4 47 | 4.7 6.5 7.2 MAY-SEP 0.6 2.5 | 3.9 50 | 5.3 7.2 7.8 | | ================================================================================================================================== HARNEY BASIN | HARNEY BASIN Reservoir Storage (1000 AF) - End of April | Watershed Snowpack Analysis - May 1, 2007 ================================================================================================================================== Usable | *** Usable Storage *** | Number This Year as % of Reservoir Capacity| This Last | Watershed of ================= | Year Year Avg | Data Sites Last Yr Average ========================================================================|========================================================= | Donner und Blitzen River 2 57 75 | | Silver Creek (Harney Co) 2 0 0 | | Silvies River 5 0 0 | | Trout Creek 1 0 0 | ================================================================================================================================== * 90%, 70%, 30%, and 10% chances of exceeding are the probabilities that the actual flow will exceed the volumes in the table. (1) - The values listed under the 10% and 90% Chance of Exceeding are actually 5% and 95% exceedance levels. (2) - The value is natural flow - actual flow may be affected by upstream water management.
-32-
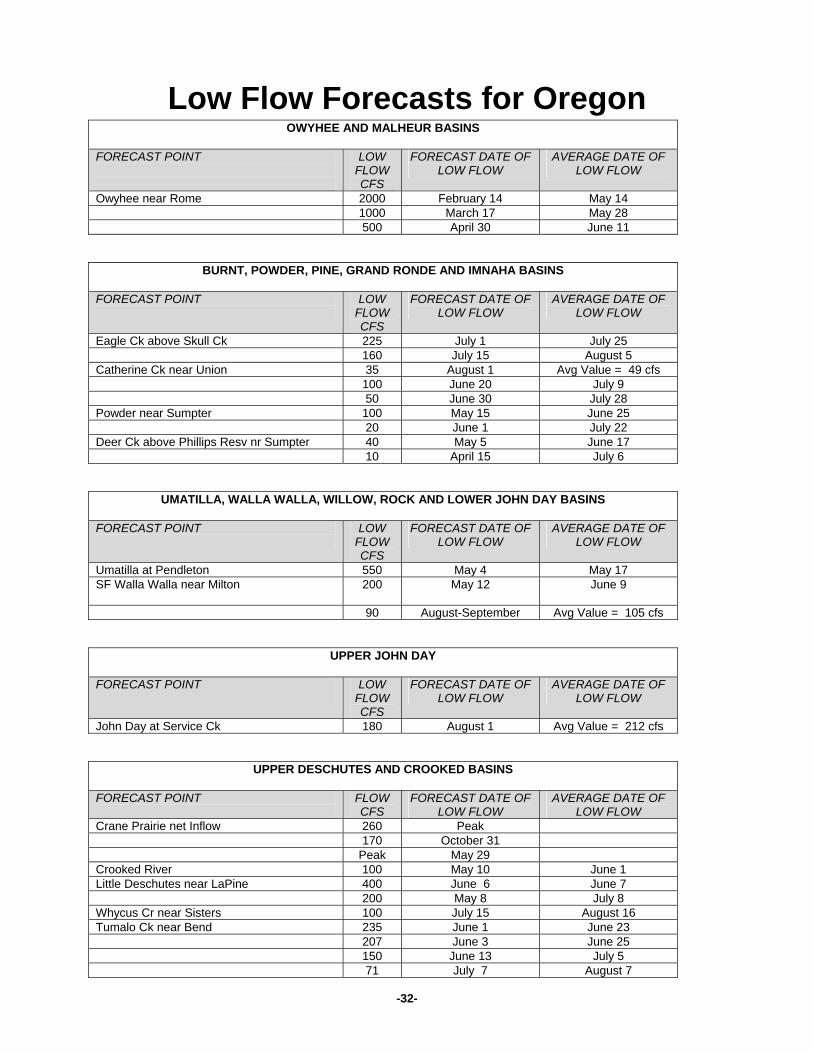
Low Flow Forecasts for Oregon OWYHEE AND MALHEUR BASINS
FORECAST POINT
LOW FLOW CFS
FORECAST DATE OF LOW FLOW
AVERAGE DATE OF LOW FLOW
Owyhee near Rome 2000 February 14 May 14 1000 March 17 May 28 500 April 30 June 11
BURNT, POWDER, PINE, GRAND RONDE AND IMNAHA BASINS
FORECAST POINT
LOW FLOW CFS
FORECAST DATE OF LOW FLOW
AVERAGE DATE OF LOW FLOW
Eagle Ck above Skull Ck 225 July 1 July 25 160 July 15 August 5 Catherine Ck near Union 35 August 1 Avg Value = 49 cfs 100 June 20 July 9 50 June 30 July 28 Powder near Sumpter 100 May 15 June 25 20 June 1 July 22 Deer Ck above Phillips Resv nr Sumpter 40 May 5 June 17 10 April 15 July 6
UMATILLA, WALLA WALLA, WILLOW, ROCK AND LOWER JOHN DAY BASINS
FORECAST POINT
LOW FLOW CFS
FORECAST DATE OF LOW FLOW
AVERAGE DATE OF LOW FLOW
Umatilla at Pendleton 550 May 4 May 17 SF Walla Walla near Milton 200 May 12 June 9
90 August-September Avg Value = 105 cfs
UPPER JOHN DAY
FORECAST POINT
LOW FLOW CFS
FORECAST DATE OF LOW FLOW
AVERAGE DATE OF LOW FLOW
John Day at Service Ck 180 August 1 Avg Value = 212 cfs
UPPER DESCHUTES AND CROOKED BASINS
FORECAST POINT
FLOW CFS
FORECAST DATE OF LOW FLOW
AVERAGE DATE OF LOW FLOW
Crane Prairie net Inflow 260 Peak 170 October 31 Peak May 29 Crooked River 100 May 10 June 1 Little Deschutes near LaPine 400 June 6 June 7 200 May 8 July 8 Whycus Cr near Sisters 100 July 15 August 16 Tumalo Ck near Bend 235 June 1 June 23 207 June 3 June 25 150 June 13 July 5 71 July 7 August 7

-33-
HOOD, MILE CREEKS, AND LOWER DESCHUTES BASINS
FORECAST POINT
FLOW CFS
FORECAST DATE OF LOW FLOW
AVERAGE DATE OF LOW FLOW
Clear Branch Inflow *Average cfs forecast to flow for this two-week period. ** Average cfs for period of record
38* July 15-31 39**
White below Tygh Valley 200 June 30 July 3 130 August 1 Avg Value = 145
ROGUE AND UMPQUA BASINS
FORECAST POINT
FLOW CFS
FORECAST DATE OF LOW FLOW
AVERAGE DATE OF LOW FLOW
Cow Ck near Azalea 20 June 28 July 4 10 August 10 August 19 Little Butte Cr SF 100 May 12 May 15 South Umpqua near Brockway 90 August 15 August 28 South Umpqua at Tiller 140 July 5 July 12 90 July 20 July 28 60 August 8 August 24
LAKE COUNTY AND GOOSE LAKE BASINS
FORECAST POINT
FLOW CFS
FORECAST DATE OF LOW FLOW
AVERAGE DATE OF LOW FLOW
Deep Ck above Adel 100 May 1 June 21 Honey Ck near Plush 100 March 20 May 15 50 April 15 May 30 Twentymile near Adel 50 April 15 June 2 10 May 5 July 3
HARNEY BASIN
FORECAST POINT
FLOW CFS
FORECAST DATE OF LOW FLOW
AVERAGE DATE OF LOW FLOW
Silvies near Burns 400 March 28 May 5 200 April 28 May 21 100 May 13 June 9 50 June 1 June 23 Donner und Blitzen 200 May 20 June 15 100 June 10 July 5
-34-
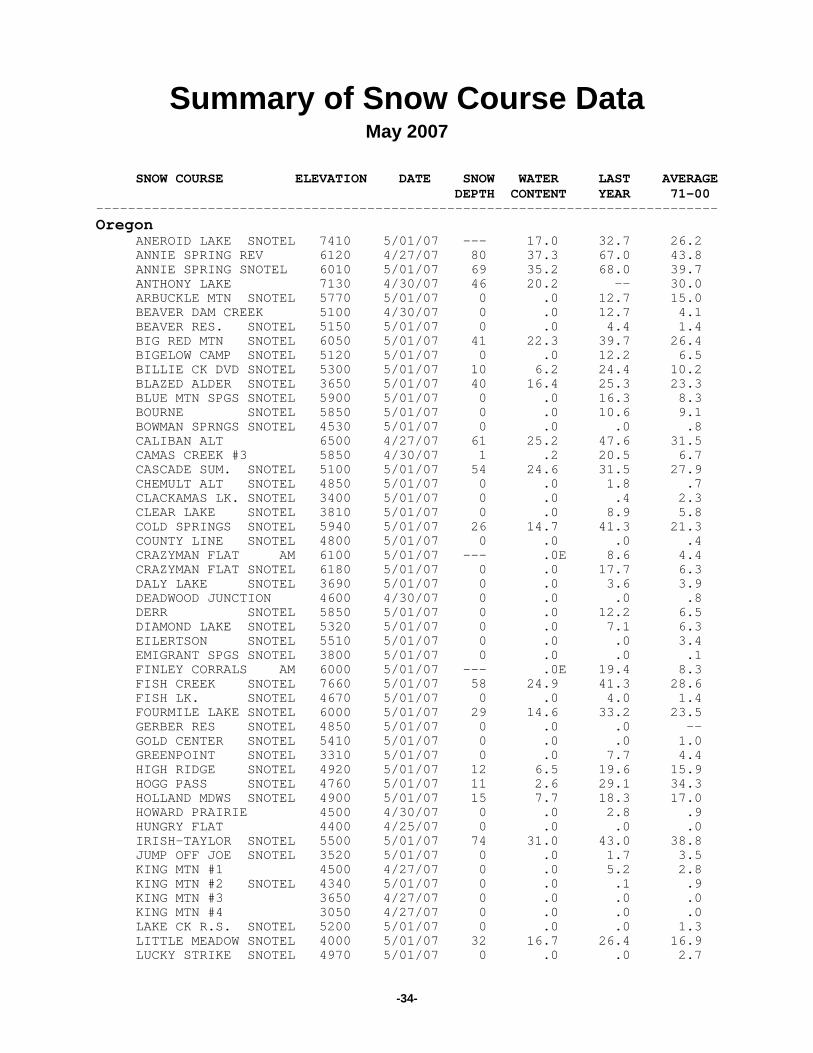
Summary of Snow Course Data May 2007
SNOW COURSE ELEVATION DATE SNOW WATER LAST AVERAGE DEPTH CONTENT YEAR 71-00 ------------------------------------------------------------------------------ Oregon ANEROID LAKE SNOTEL 7410 5/01/07 --- 17.0 32.7 26.2 ANNIE SPRING REV 6120 4/27/07 80 37.3 67.0 43.8 ANNIE SPRING SNOTEL 6010 5/01/07 69 35.2 68.0 39.7 ANTHONY LAKE 7130 4/30/07 46 20.2 -- 30.0 ARBUCKLE MTN SNOTEL 5770 5/01/07 0 .0 12.7 15.0 BEAVER DAM CREEK 5100 4/30/07 0 .0 12.7 4.1 BEAVER RES. SNOTEL 5150 5/01/07 0 .0 4.4 1.4 BIG RED MTN SNOTEL 6050 5/01/07 41 22.3 39.7 26.4 BIGELOW CAMP SNOTEL 5120 5/01/07 0 .0 12.2 6.5 BILLIE CK DVD SNOTEL 5300 5/01/07 10 6.2 24.4 10.2 BLAZED ALDER SNOTEL 3650 5/01/07 40 16.4 25.3 23.3 BLUE MTN SPGS SNOTEL 5900 5/01/07 0 .0 16.3 8.3 BOURNE SNOTEL 5850 5/01/07 0 .0 10.6 9.1 BOWMAN SPRNGS SNOTEL 4530 5/01/07 0 .0 .0 .8 CALIBAN ALT 6500 4/27/07 61 25.2 47.6 31.5 CAMAS CREEK #3 5850 4/30/07 1 .2 20.5 6.7 CASCADE SUM. SNOTEL 5100 5/01/07 54 24.6 31.5 27.9 CHEMULT ALT SNOTEL 4850 5/01/07 0 .0 1.8 .7 CLACKAMAS LK. SNOTEL 3400 5/01/07 0 .0 .4 2.3 CLEAR LAKE SNOTEL 3810 5/01/07 0 .0 8.9 5.8 COLD SPRINGS SNOTEL 5940 5/01/07 26 14.7 41.3 21.3 COUNTY LINE SNOTEL 4800 5/01/07 0 .0 .0 .4 CRAZYMAN FLAT AM 6100 5/01/07 --- .0E 8.6 4.4 CRAZYMAN FLAT SNOTEL 6180 5/01/07 0 .0 17.7 6.3 DALY LAKE SNOTEL 3690 5/01/07 0 .0 3.6 3.9 DEADWOOD JUNCTION 4600 4/30/07 0 .0 .0 .8 DERR SNOTEL 5850 5/01/07 0 .0 12.2 6.5 DIAMOND LAKE SNOTEL 5320 5/01/07 0 .0 7.1 6.3 EILERTSON SNOTEL 5510 5/01/07 0 .0 .0 3.4 EMIGRANT SPGS SNOTEL 3800 5/01/07 0 .0 .0 .1 FINLEY CORRALS AM 6000 5/01/07 --- .0E 19.4 8.3 FISH CREEK SNOTEL 7660 5/01/07 58 24.9 41.3 28.6 FISH LK. SNOTEL 4670 5/01/07 0 .0 4.0 1.4 FOURMILE LAKE SNOTEL 6000 5/01/07 29 14.6 33.2 23.5 GERBER RES SNOTEL 4850 5/01/07 0 .0 .0 -- GOLD CENTER SNOTEL 5410 5/01/07 0 .0 .0 1.0 GREENPOINT SNOTEL 3310 5/01/07 0 .0 7.7 4.4 HIGH RIDGE SNOTEL 4920 5/01/07 12 6.5 19.6 15.9 HOGG PASS SNOTEL 4760 5/01/07 11 2.6 29.1 34.3 HOLLAND MDWS SNOTEL 4900 5/01/07 15 7.7 18.3 17.0 HOWARD PRAIRIE 4500 4/30/07 0 .0 2.8 .9 HUNGRY FLAT 4400 4/25/07 0 .0 .0 .0 IRISH-TAYLOR SNOTEL 5500 5/01/07 74 31.0 43.0 38.8 JUMP OFF JOE SNOTEL 3520 5/01/07 0 .0 1.7 3.5 KING MTN #1 4500 4/27/07 0 .0 5.2 2.8 KING MTN #2 SNOTEL 4340 5/01/07 0 .0 .1 .9 KING MTN #3 3650 4/27/07 0 .0 .0 .0 KING MTN #4 3050 4/27/07 0 .0 .0 .0 LAKE CK R.S. SNOTEL 5200 5/01/07 0 .0 .0 1.3 LITTLE MEADOW SNOTEL 4000 5/01/07 32 16.7 26.4 16.9 LUCKY STRIKE SNOTEL 4970 5/01/07 0 .0 .0 2.7

SNOW COURSE ELEVATION DATE SNOW WATER LAST AVERAGE
-35-
DEPTH CONTENT YEAR 71-00 --------Oregon (continued)
----------------------------------------------------------------------
MADISON BUTTE SNOTEL 5150 5/01/07 0 .0 .0 .4 MARION FORKS SNOTEL 2600 5/01/07 0 .0 .0 3.6 MARKS CREEK 4540 4/30/07 0 .0 .0 .1 MCKENZIE SNOTEL 4800 5/01/07 57 34.0 48.0 40.0 MEACHAM 4300 4/30/07 0 .0 .0 1.6 MOSS SPRINGS SNOTEL 5760 5/01/07 30 13.3 20.0 22.3 MT ASHLAND SWBK. 6400 4/27/07 58 24.2 48.3 33.0 MT HOOD TEST SNOTEL 5400 5/01/07 105 50.5 60.8 63.9 MT HOWARD SNOTEL 7910 5/01/07 29 12.7 18.3 16.9 MUD RIDGE SNOTEL 4070 5/01/07 31 14.1 24.7 18.2 NEW CRESCENT SNOTEL 4910 5/01/07 0 .0 6.7 3.0 NEW DUTCHMAN #3 6400 4/25/07 88 41.8 62.0 55.4 NORTH FK RES SNOTEL 3060 5/01/07 --- 11.6 21.1 6.9 NORTH UMPQUA 4220 5/04/07 0 .0 2.6 3.5 OCHOCO MEADOW SNOTEL 5430 5/01/07 0 .0 5.1 1.8 PARK H.Q. REV 6550 4/27/07 108 56.0 98.6 63.1 PATTON MEADOWS AM 6800 5/01/07 --- .0E 26.6 13.7 PEAVINE RIDGE SNOTEL 3420 5/01/07 0 .0 7.3 3.7 QUARTZ MTN SNOTEL 5720 5/01/07 0 .0 .0 .0 R.R. OVERPASS SNOTEL 2680 5/01/07 0 .0 .0 .0 RED BUTTE #1 4560 4/25/07 20 7.5 14.0 6.7 RED BUTTE #2 4000 4/25/07 0 .0 .2 2.1 RED BUTTE #3 3500 4/25/07 0 .0 .0 .2 RED BUTTE #4 3000 4/25/07 0 .0 .0 .0 RED HILL SNOTEL 4400 5/01/07 70 45.9 48.1 42.5 ROARING RIVER SNOTEL 4950 5/01/07 23 13.5 35.9 24.0 ROCK SPRINGS SNOTEL 5290 5/01/07 0 .0 .0 .1 SADDLE MTN SNOTEL 3110 5/01/07 0 .0 .0 2.1 SALT CK FALLS SNOTEL 4220 5/01/07 20 11.0 15.2 10.5 SANTIAM JCT. SNOTEL 3750 5/01/07 0 .0 .0 8.0 SCHNEIDER MDW SNOTEL 5400 5/01/07 19 9.2 27.1 20.2 SEINE CREEK SNOTEL 2060 5/01/07 0 .0 .2 .0 SEVENMILE MARSH SNTL 5700 5/01/07 38 18.5 39.3 22.6 SILVER BURN 3720 4/26/07 0 .0 6.5 .9 SILVER CREEK SNOTEL 5740 5/01/07 0 .0 10.1 1.6 SILVIES SNOTEL 6990 5/01/07 11 6.4 13.6 13.3 SKI BOWL ROAD 6000 4/27/07 45 19.2 38.2 23.1 SNOW MTN SNOTEL 6220 5/01/07 0 .0 12.3 7.4 SF BULL RUN SNOTEL 2690 5/01/07 0 .0 .0 -- SOUTH FORK CANAL 3500 4/27/07 0 .0 .0 .0 STARR RIDGE SNOTEL 5250 5/01/07 0 .0 .0 .0 STRAWBERRY SNOTEL 5760 5/01/07 0 .0 .1 .8 SUMMER RIM SNOTEL 7100 5/01/07 27 7.4 23.2 13.0 SUMMIT LAKE SNOTEL 5600 5/01/07 82 40.5 52.1 39.4 TANGENT 5400 4/25/07 0 .0 22.7 11.3 TAYLOR BUTTE SNOTEL 5030 5/01/07 0 .0 2.0 .1 TAYLOR GREEN SNOTEL 5740 5/01/07 0 .0 14.8 10.3 THREE CK MEAD SNOTEL 5650 5/01/07 23 9.9 25.1 15.3 TIPTON SNOTEL 5150 5/01/07 0 .0 5.8 4.8 TOLLGATE 5070 4/30/07 37 17.8 33.4 19.3 TRAP CREEK 3800 5/04/07 0 .0 1.0 3.1 WOLF CREEK SNOTEL 5630 5/01/07 0 .0 10.8 9.8

-36-
SNOW COURSE ELEVATION DATE SNOW WATER LAST AVERAGE DEPTH CONTENT YEAR 71-00 ------------------------------------------------------------------------------ California ADIN MOUNTAIN 6350 4/26/07 0 .0 14.8 6.5 ADIN MTN SNOTEL 6350 5/01/07 0 .0 10.4 6.8 CEDAR PASS SNOTEL 7100 5/01/07 6 3.4 17.0 14.3 CROWDER FLAT SNOTEL 5200 5/01/07 0 .0 .0 -- DISMAL SWAMP SNOTEL 7000 5/01/07 39 14.3 44.5 24.9 Idaho MUD FLAT SNOTEL 5730 5/01/07 0 .0 .0 .0 SOUTH MTN SNOTEL 6500 5/01/07 0 .0 8.6 9.4 Nevada BEAR CREEK SNOTEL 7800 5/01/07 --- 11.8 26.1 19.0 BIG BEND SNOTEL 6700 5/01/07 0 .0 1.0 2.3 BUCKSKIN,L SNOTEL 6700 5/01/07 0 .0 6.8 3.7 DISASTER PEAK SNOTEL 6500 5/01/07 0 .0 .0 2.9 FAWN CREEK SNOTEL 7050 5/01/07 0 .0 13.3 14.5 GRANITE PEAK SNOTEL 7800 5/01/07 16 6.0 33.4 24.2 JACK CREEK, U SNOTEL 7280 5/01/07 13 2.2 21.1 17.0 LAMANCE CREEK SNOTEL 6000 5/01/07 0 .0 .8 3.9 LAUREL DRAW SNOTEL 6700 5/01/07 0 .0 .6 1.6 SEVENTYSIX CK SNOTEL 7100 5/01/07 0 .0 7.6 3.9 TAYLOR CANYON SNOTEL 6200 5/01/07 0 .0 .0 .3 (d) denotes discontinued site.

-37-
Basin Outlook Reports; How Forecasts Are Made
And Federal – State – Private Cooperative Snow Surveys
For more water supply and resource management information, contact:
USDA, Natural Resources Conservation Service Snow Survey Office 1201 NE Lloyd; Suite 900 Portland, OR 97232 Phone: (503) 414-3270 Web site: http://www.or.nrcs.usda.gov/snow/index.html
Most of the annual streamflow in the western United States originates as snowfall that has accumulated in the mountains during the winter and early spring. As the snowpack accumulates, hydrologists estimate the runoff that will occur when it melts. Measurements of snow water equivalent at selected manual snowcourses and automated SNOTEL sites, along with precipitation, antecedent streamflow, and indices of the El Niño / Southern Oscillation are used in computerized statistical and simulation models to prepare runoff forecasts. These forecasts are coordinated between hydrologists in the Natural Resources Conservation Service and the National Weather Service. Unless otherwise specified, all forecasts are for flows that would occur naturally without any upstream influences Forecasts of any kind, of course, are not perfect. Streamflow forecast uncertainty arises from three primary sources: (1) uncertain knowledge of future weather conditions, (2) uncertainty in the forecasting procedure, and (3) errors in the data. The forecast, therefore, must be interpreted not as a single value but rather as a range of values with specific probabilities of occurrence. The middle of the range is expressed by the 50% exceedance probability forecast, for which there is a 50% chance that the actual flow will be above, and a 50% chance that the actual flow will be below, this value. To describe the expected range around this 50% value, four other forecasts are provided, two smaller values (90% and 70% exceedance probability) and two larger values (30%, and 10% exceedance probability). For example, there is a 90% chance that the actual flow will be more than the 90% exceedance probability forecast. The others can be interpreted similarly. The wider the spread among these values, the more uncertain the forecast. As the season progresses, forecasts become more accurate, primarily because a greater portion of the future weather conditions become known; this is reflected by a narrowing of the range around the 50% exceedance probability forecast. Users should take this uncertainty into consideration when making operational decisions by selecting forecasts corresponding to the level of risk they are willing to assume about the amount of water to be expected. If users anticipate receiving a lesser supply of water, or if they wish to increase their chances of having an adequate supply of water for their operations, they may want to base their decisions on the 90% or 70% exceedance probability forecasts, or something in between. On the other hand, if users are concerned about receiving too much water (for example, threat of flooding), they may want to base their decisions on the 30% or 10% exceedance probability forecasts, or something in between. Regardless of the forecast value users choose for operations, they should be prepared to deal with either more or less water. (Users should remember that even if the 90% exceedance probability forecast is used, there is still a 10% chance of receiving less than this amount.) By using the exceedance probability information, users can easily determine the chances of receiving more or less water.
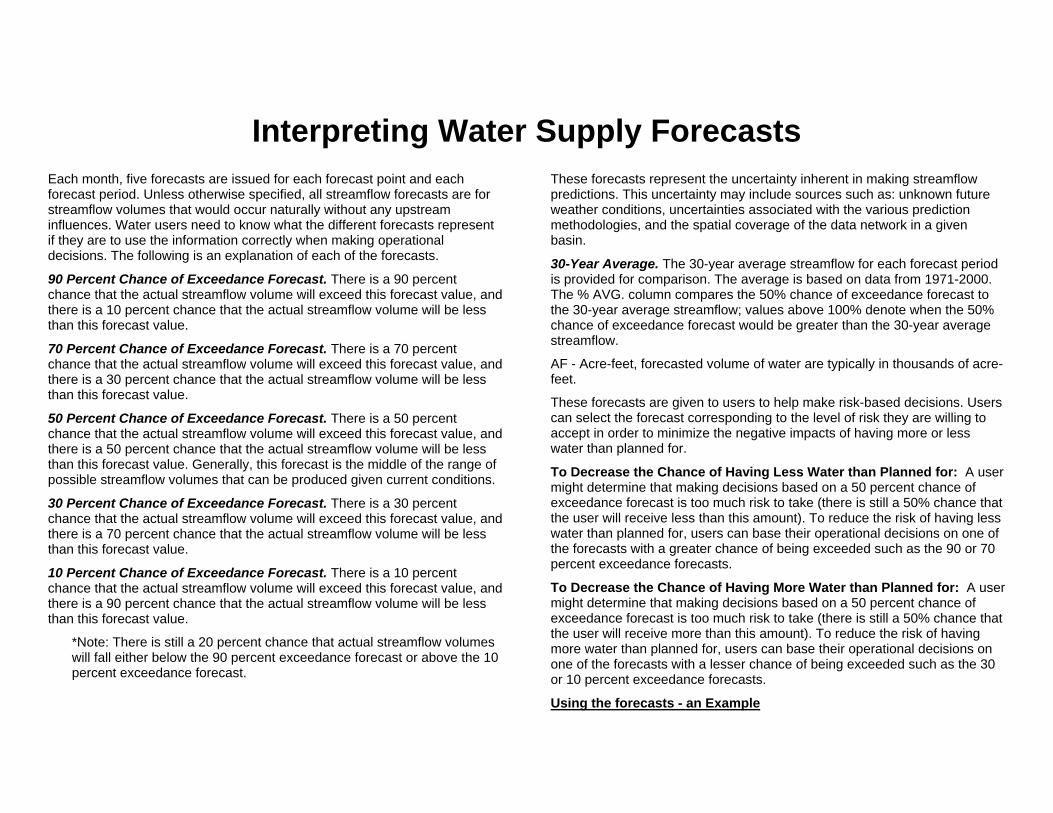
Interpreting Water Supply Forecasts Each month, five forecasts are issued for each forecast point and each forecast period. Unless otherwise specified, all streamflow forecasts are for streamflow volumes that would occur naturally without any upstream influences. Water users need to know what the different forecasts represent if they are to use the information correctly when making operational decisions. The following is an explanation of each of the forecasts.
90 Percent Chance of Exceedance Forecast. There is a 90 percent chance that the actual streamflow volume will exceed this forecast value, and there is a 10 percent chance that the actual streamflow volume will be less than this forecast value.
70 Percent Chance of Exceedance Forecast. There is a 70 percent chance that the actual streamflow volume will exceed this forecast value, and there is a 30 percent chance that the actual streamflow volume will be less than this forecast value.
50 Percent Chance of Exceedance Forecast. There is a 50 percent chance that the actual streamflow volume will exceed this forecast value, and there is a 50 percent chance that the actual streamflow volume will be less than this forecast value. Generally, this forecast is the middle of the range of possible streamflow volumes that can be produced given current conditions.
30 Percent Chance of Exceedance Forecast. There is a 30 percent chance that the actual streamflow volume will exceed this forecast value, and there is a 70 percent chance that the actual streamflow volume will be less than this forecast value.
10 Percent Chance of Exceedance Forecast. There is a 10 percent chance that the actual streamflow volume will exceed this forecast value, and there is a 90 percent chance that the actual streamflow volume will be less than this forecast value.
*Note: There is still a 20 percent chance that actual streamflow volumes will fall either below the 90 percent exceedance forecast or above the 10 percent exceedance forecast.
These forecasts represent the uncertainty inherent in making streamflow predictions. This uncertainty may include sources such as: unknown future weather conditions, uncertainties associated with the various prediction methodologies, and the spatial coverage of the data network in a given basin.
30-Year Average. The 30-year average streamflow for each forecast period is provided for comparison. The average is based on data from 1971-2000. The % AVG. column compares the 50% chance of exceedance forecast to the 30-year average streamflow; values above 100% denote when the 50% chance of exceedance forecast would be greater than the 30-year average streamflow.
AF - Acre-feet, forecasted volume of water are typically in thousands of acre-feet.
These forecasts are given to users to help make risk-based decisions. Users can select the forecast corresponding to the level of risk they are willing to accept in order to minimize the negative impacts of having more or less water than planned for.
To Decrease the Chance of Having Less Water than Planned for: A user might determine that making decisions based on a 50 percent chance of exceedance forecast is too much risk to take (there is still a 50% chance that the user will receive less than this amount). To reduce the risk of having less water than planned for, users can base their operational decisions on one of the forecasts with a greater chance of being exceeded such as the 90 or 70 percent exceedance forecasts.
To Decrease the Chance of Having More Water than Planned for: A user might determine that making decisions based on a 50 percent chance of exceedance forecast is too much risk to take (there is still a 50% chance that the user will receive more than this amount). To reduce the risk of having more water than planned for, users can base their operational decisions on one of the forecasts with a lesser chance of being exceeded such as the 30 or 10 percent exceedance forecasts.
Using the forecasts - an Example
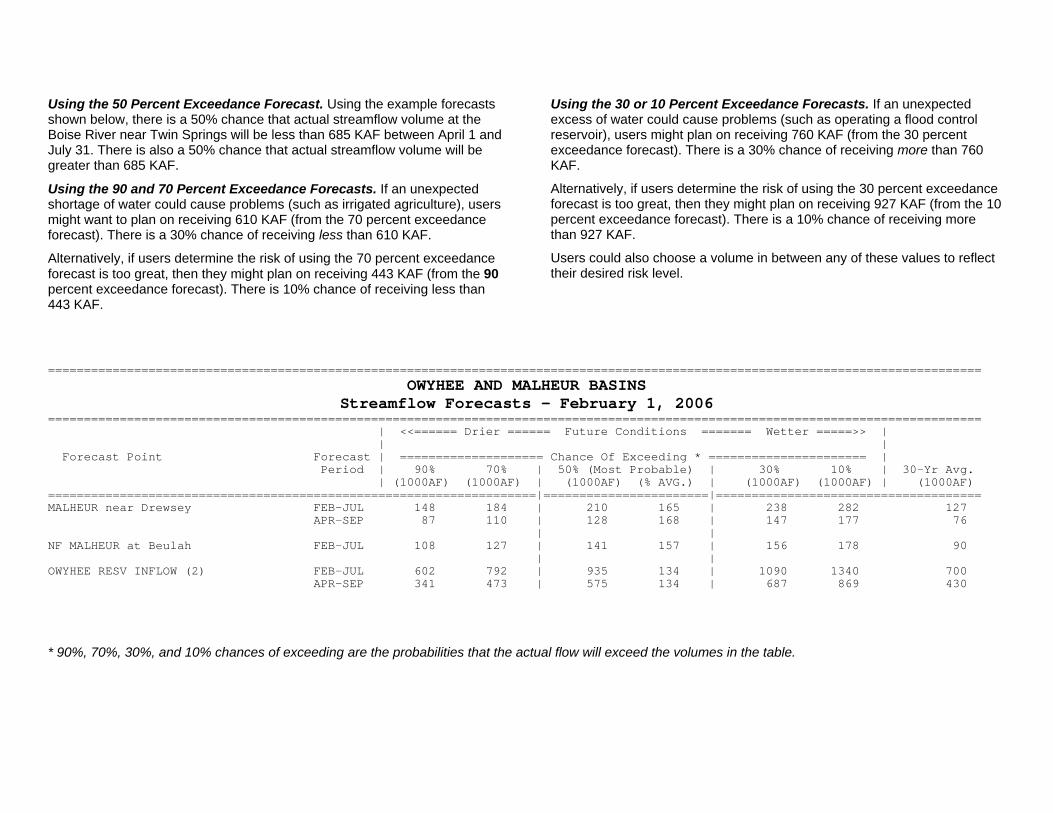
Using the 50 Percent Exceedance Forecast. Using the example forecasts shown below, there is a 50% chance that actual streamflow volume at the Boise River near Twin Springs will be less than 685 KAF between April 1 and July 31. There is also a 50% chance that actual streamflow volume will be greater than 685 KAF.
Using the 30 or 10 Percent Exceedance Forecasts. If an unexpected excess of water could cause problems (such as operating a flood control reservoir), users might plan on receiving 760 KAF (from the 30 percent exceedance forecast). There is a 30% chance of receiving more than 760 KAF.
Alternatively, if users determine the risk of using the 30 percent exceedance forecast is too great, then they might plan on receiving 927 KAF (from the 10 percent exceedance forecast). There is a 10% chance of receiving more than 927 KAF.
Using the 90 and 70 Percent Exceedance Forecasts. If an unexpected shortage of water could cause problems (such as irrigated agriculture), users might want to plan on receiving 610 KAF (from the 70 percent exceedance forecast). There is a 30% chance of receiving less than 610 KAF.
Users could also choose a volume in between any of these values to reflect their desired risk level.
Alternatively, if users determine the risk of using the 70 percent exceedance forecast is too great, then they might plan on receiving 443 KAF (from the 90 percent exceedance forecast). There is 10% chance of receiving less than 443 KAF.
==================================================================================================================================
OWYHEE AND MALHEUR BASINS Streamflow Forecasts - February 1, 2006
================================================================================================================================== | <<====== Drier ====== Future Conditions ======= Wetter =====>> | | | Forecast Point Forecast | ==================== Chance Of Exceeding * ====================== | Period | 90% 70% | 50% (Most Probable) | 30% 10% | 30-Yr Avg. | (1000AF) (1000AF) | (1000AF) (% AVG.) | (1000AF) (1000AF) | (1000AF) ====================================================================|=======================|===================================== MALHEUR near Drewsey FEB-JUL 148 184 | 210 165 | 238 282 127 APR-SEP 87 110 | 128 168 | 147 177 76 | | NF MALHEUR at Beulah FEB-JUL 108 127 | 141 157 | 156 178 90 | | OWYHEE RESV INFLOW (2) FEB-JUL 602 792 | 935 134 | 1090 1340 700 APR-SEP 341 473 | 575 134 | 687 869 430 * 90%, 70%, 30%, and 10% chances of exceeding are the probabilities that the actual flow will exceed the volumes in the table.
USDA Natural Resources Conservation Service 1201 NE Lloyd Suite 900 Portland, OR 97232-1274 Official Business
The Oregon Snow Survey office has moved. Please note our new address. Issued by Arlen Lancaster, Chief Natural Resources Conservation Service U.S. Department of Agriculture Released by Robert J. Graham, State Conservationist Natural Resources Conservation Service Portland, Oregon This publication may be found online at: http://www.or.nrcs.usda.gov/snow/watersupply/
Oregon
Basin Outlook Report Natural Resources Conservation Service
Portland, OR
http://www.or.nrcs.usda.gov/snow/


